Scotch-Irish vs Latvian Disability Age Over 75
COMPARE
Scotch-Irish
Latvian
Disability Age Over 75
Disability Age Over 75 Comparison
Scotch-Irish
Latvians
47.3%
DISABILITY AGE OVER 75
52.5/ 100
METRIC RATING
172nd/ 347
METRIC RANK
45.1%
DISABILITY AGE OVER 75
100.0/ 100
METRIC RATING
13th/ 347
METRIC RANK
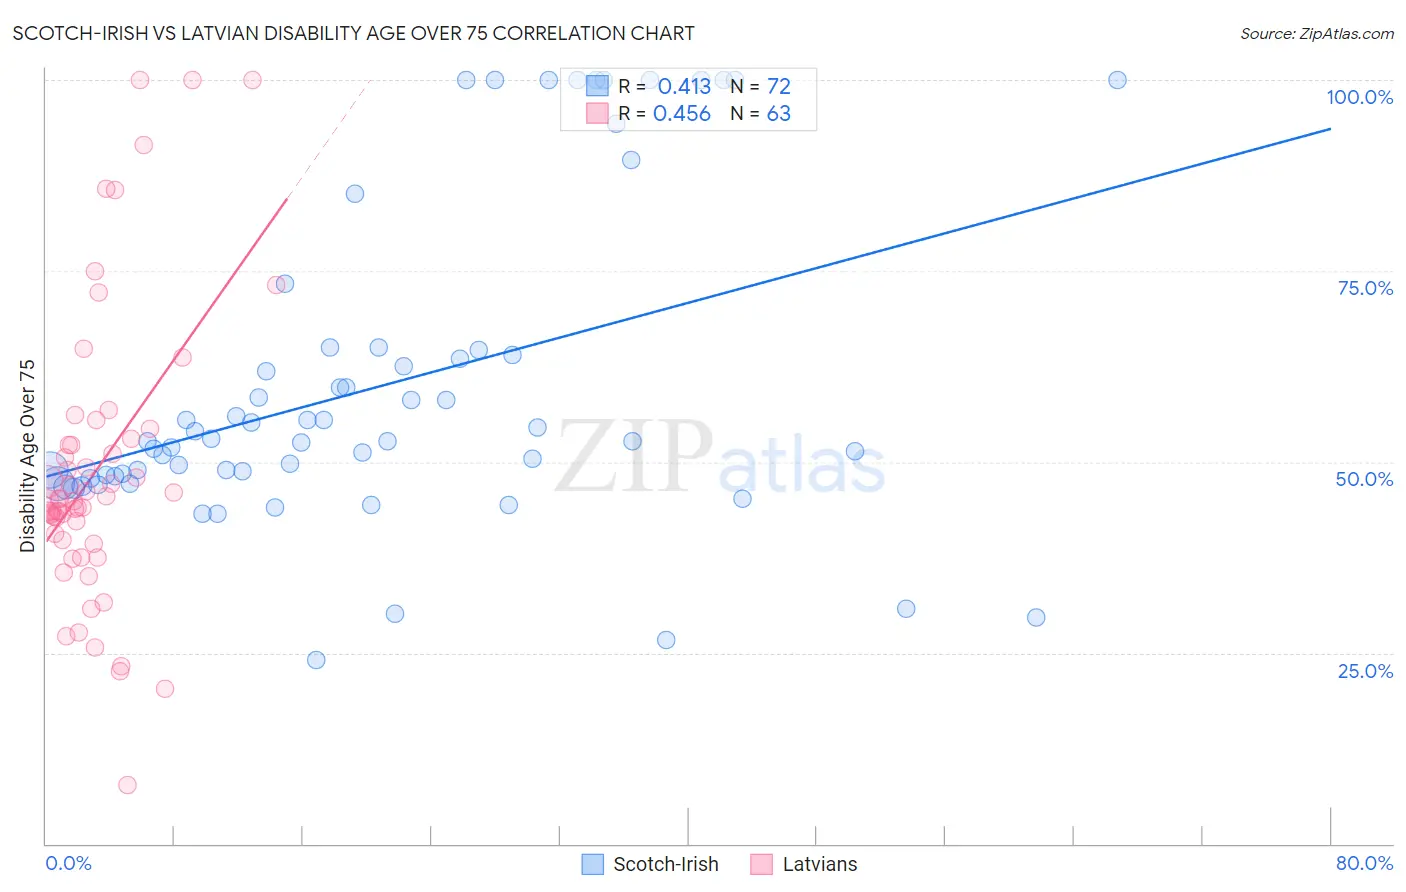
Scotch-Irish vs Latvian Disability Age Over 75 Correlation Chart
The statistical analysis conducted on geographies consisting of 547,171,445 people shows a moderate positive correlation between the proportion of Scotch-Irish and percentage of population with a disability over the age of 75 in the United States with a correlation coefficient (R) of 0.413 and weighted average of 47.3%. Similarly, the statistical analysis conducted on geographies consisting of 220,463,619 people shows a moderate positive correlation between the proportion of Latvians and percentage of population with a disability over the age of 75 in the United States with a correlation coefficient (R) of 0.456 and weighted average of 45.1%, a difference of 4.9%.
Disability Age Over 75 Correlation Summary
| Measurement | Scotch-Irish | Latvian |
| Minimum | 24.0% | 7.7% |
| Maximum | 100.0% | 100.0% |
| Range | 76.0% | 92.3% |
| Mean | 59.9% | 48.9% |
| Median | 52.7% | 44.9% |
| Interquartile 25% (IQ1) | 47.9% | 39.7% |
| Interquartile 75% (IQ3) | 64.4% | 53.1% |
| Interquartile Range (IQR) | 16.4% | 13.3% |
| Standard Deviation (Sample) | 20.7% | 19.0% |
| Standard Deviation (Population) | 20.5% | 18.8% |
Similar Demographics by Disability Age Over 75
Demographics Similar to Scotch-Irish by Disability Age Over 75
In terms of disability age over 75, the demographic groups most similar to Scotch-Irish are Alsatian (47.3%, a difference of 0.010%), Immigrants from Africa (47.3%, a difference of 0.030%), White/Caucasian (47.3%, a difference of 0.060%), Immigrants from Haiti (47.3%, a difference of 0.060%), and German Russian (47.3%, a difference of 0.080%).
| Demographics | Rating | Rank | Disability Age Over 75 |
| Immigrants | Zimbabwe | 64.4 /100 | #165 | Good 47.2% |
| Immigrants | Sierra Leone | 64.4 /100 | #166 | Good 47.2% |
| Moroccans | 62.9 /100 | #167 | Good 47.2% |
| Kenyans | 58.8 /100 | #168 | Average 47.2% |
| Celtics | 58.7 /100 | #169 | Average 47.2% |
| German Russians | 56.2 /100 | #170 | Average 47.3% |
| Immigrants | Africa | 53.6 /100 | #171 | Average 47.3% |
| Scotch-Irish | 52.5 /100 | #172 | Average 47.3% |
| Alsatians | 51.9 /100 | #173 | Average 47.3% |
| Whites/Caucasians | 50.0 /100 | #174 | Average 47.3% |
| Immigrants | Haiti | 49.7 /100 | #175 | Average 47.3% |
| Ecuadorians | 46.7 /100 | #176 | Average 47.4% |
| Haitians | 44.6 /100 | #177 | Average 47.4% |
| Cubans | 42.1 /100 | #178 | Average 47.4% |
| Sierra Leoneans | 41.7 /100 | #179 | Average 47.4% |
Demographics Similar to Latvians by Disability Age Over 75
In terms of disability age over 75, the demographic groups most similar to Latvians are Immigrants from Czechoslovakia (45.1%, a difference of 0.010%), Immigrants from Scotland (45.1%, a difference of 0.010%), Immigrants from Sweden (45.1%, a difference of 0.050%), Lithuanian (45.1%, a difference of 0.10%), and Bulgarian (45.1%, a difference of 0.15%).
| Demographics | Rating | Rank | Disability Age Over 75 |
| Immigrants | Lithuania | 100.0 /100 | #6 | Exceptional 44.9% |
| Okinawans | 100.0 /100 | #7 | Exceptional 44.9% |
| Immigrants | Austria | 100.0 /100 | #8 | Exceptional 44.9% |
| Paraguayans | 100.0 /100 | #9 | Exceptional 45.0% |
| Bulgarians | 100.0 /100 | #10 | Exceptional 45.1% |
| Lithuanians | 100.0 /100 | #11 | Exceptional 45.1% |
| Immigrants | Czechoslovakia | 100.0 /100 | #12 | Exceptional 45.1% |
| Latvians | 100.0 /100 | #13 | Exceptional 45.1% |
| Immigrants | Scotland | 100.0 /100 | #14 | Exceptional 45.1% |
| Immigrants | Sweden | 100.0 /100 | #15 | Exceptional 45.1% |
| Immigrants | Northern Europe | 100.0 /100 | #16 | Exceptional 45.2% |
| Immigrants | India | 100.0 /100 | #17 | Exceptional 45.2% |
| Bolivians | 100.0 /100 | #18 | Exceptional 45.2% |
| Immigrants | Greece | 100.0 /100 | #19 | Exceptional 45.2% |
| Immigrants | Serbia | 100.0 /100 | #20 | Exceptional 45.3% |