Scotch-Irish vs Ukrainian Disability Age Over 75
COMPARE
Scotch-Irish
Ukrainian
Disability Age Over 75
Disability Age Over 75 Comparison
Scotch-Irish
Ukrainians
47.3%
DISABILITY AGE OVER 75
52.5/ 100
METRIC RATING
172nd/ 347
METRIC RANK
46.4%
DISABILITY AGE OVER 75
97.1/ 100
METRIC RATING
103rd/ 347
METRIC RANK
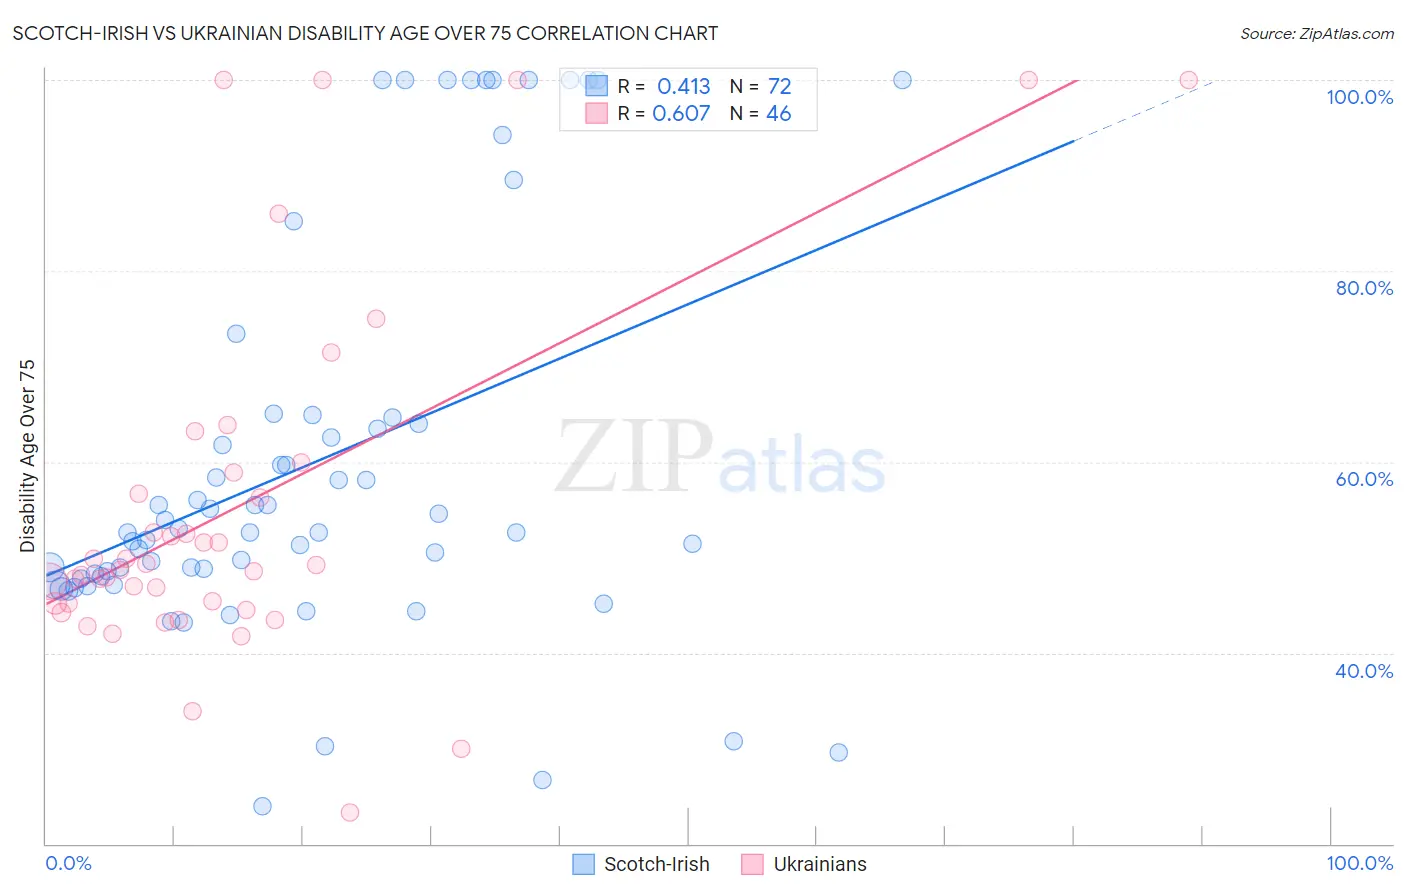
Scotch-Irish vs Ukrainian Disability Age Over 75 Correlation Chart
The statistical analysis conducted on geographies consisting of 547,171,445 people shows a moderate positive correlation between the proportion of Scotch-Irish and percentage of population with a disability over the age of 75 in the United States with a correlation coefficient (R) of 0.413 and weighted average of 47.3%. Similarly, the statistical analysis conducted on geographies consisting of 447,710,922 people shows a significant positive correlation between the proportion of Ukrainians and percentage of population with a disability over the age of 75 in the United States with a correlation coefficient (R) of 0.607 and weighted average of 46.4%, a difference of 1.9%.
Disability Age Over 75 Correlation Summary
| Measurement | Scotch-Irish | Ukrainian |
| Minimum | 24.0% | 23.2% |
| Maximum | 100.0% | 100.0% |
| Range | 76.0% | 76.8% |
| Mean | 59.9% | 55.4% |
| Median | 52.7% | 48.9% |
| Interquartile 25% (IQ1) | 47.9% | 45.2% |
| Interquartile 75% (IQ3) | 64.4% | 58.8% |
| Interquartile Range (IQR) | 16.4% | 13.7% |
| Standard Deviation (Sample) | 20.7% | 18.9% |
| Standard Deviation (Population) | 20.5% | 18.7% |
Similar Demographics by Disability Age Over 75
Demographics Similar to Scotch-Irish by Disability Age Over 75
In terms of disability age over 75, the demographic groups most similar to Scotch-Irish are Alsatian (47.3%, a difference of 0.010%), Immigrants from Africa (47.3%, a difference of 0.030%), White/Caucasian (47.3%, a difference of 0.060%), Immigrants from Haiti (47.3%, a difference of 0.060%), and German Russian (47.3%, a difference of 0.080%).
| Demographics | Rating | Rank | Disability Age Over 75 |
| Immigrants | Zimbabwe | 64.4 /100 | #165 | Good 47.2% |
| Immigrants | Sierra Leone | 64.4 /100 | #166 | Good 47.2% |
| Moroccans | 62.9 /100 | #167 | Good 47.2% |
| Kenyans | 58.8 /100 | #168 | Average 47.2% |
| Celtics | 58.7 /100 | #169 | Average 47.2% |
| German Russians | 56.2 /100 | #170 | Average 47.3% |
| Immigrants | Africa | 53.6 /100 | #171 | Average 47.3% |
| Scotch-Irish | 52.5 /100 | #172 | Average 47.3% |
| Alsatians | 51.9 /100 | #173 | Average 47.3% |
| Whites/Caucasians | 50.0 /100 | #174 | Average 47.3% |
| Immigrants | Haiti | 49.7 /100 | #175 | Average 47.3% |
| Ecuadorians | 46.7 /100 | #176 | Average 47.4% |
| Haitians | 44.6 /100 | #177 | Average 47.4% |
| Cubans | 42.1 /100 | #178 | Average 47.4% |
| Sierra Leoneans | 41.7 /100 | #179 | Average 47.4% |
Demographics Similar to Ukrainians by Disability Age Over 75
In terms of disability age over 75, the demographic groups most similar to Ukrainians are Immigrants from Malaysia (46.4%, a difference of 0.010%), Israeli (46.4%, a difference of 0.020%), Immigrants from Cameroon (46.4%, a difference of 0.040%), Immigrants from Kuwait (46.4%, a difference of 0.050%), and Immigrants from Uruguay (46.4%, a difference of 0.090%).
| Demographics | Rating | Rank | Disability Age Over 75 |
| Immigrants | China | 98.0 /100 | #96 | Exceptional 46.3% |
| Finns | 97.9 /100 | #97 | Exceptional 46.3% |
| Immigrants | Japan | 97.8 /100 | #98 | Exceptional 46.3% |
| Palestinians | 97.7 /100 | #99 | Exceptional 46.3% |
| Immigrants | Eastern Europe | 97.7 /100 | #100 | Exceptional 46.3% |
| Mongolians | 97.7 /100 | #101 | Exceptional 46.3% |
| Immigrants | Malaysia | 97.1 /100 | #102 | Exceptional 46.4% |
| Ukrainians | 97.1 /100 | #103 | Exceptional 46.4% |
| Israelis | 97.0 /100 | #104 | Exceptional 46.4% |
| Immigrants | Cameroon | 96.9 /100 | #105 | Exceptional 46.4% |
| Immigrants | Kuwait | 96.8 /100 | #106 | Exceptional 46.4% |
| Immigrants | Uruguay | 96.7 /100 | #107 | Exceptional 46.4% |
| Brazilians | 96.6 /100 | #108 | Exceptional 46.5% |
| Chileans | 96.4 /100 | #109 | Exceptional 46.5% |
| Immigrants | Hong Kong | 96.4 /100 | #110 | Exceptional 46.5% |