Scotch-Irish vs Chickasaw Disability Age Over 75
COMPARE
Scotch-Irish
Chickasaw
Disability Age Over 75
Disability Age Over 75 Comparison
Scotch-Irish
Chickasaw
47.3%
DISABILITY AGE OVER 75
52.5/ 100
METRIC RATING
172nd/ 347
METRIC RANK
51.2%
DISABILITY AGE OVER 75
0.0/ 100
METRIC RATING
316th/ 347
METRIC RANK
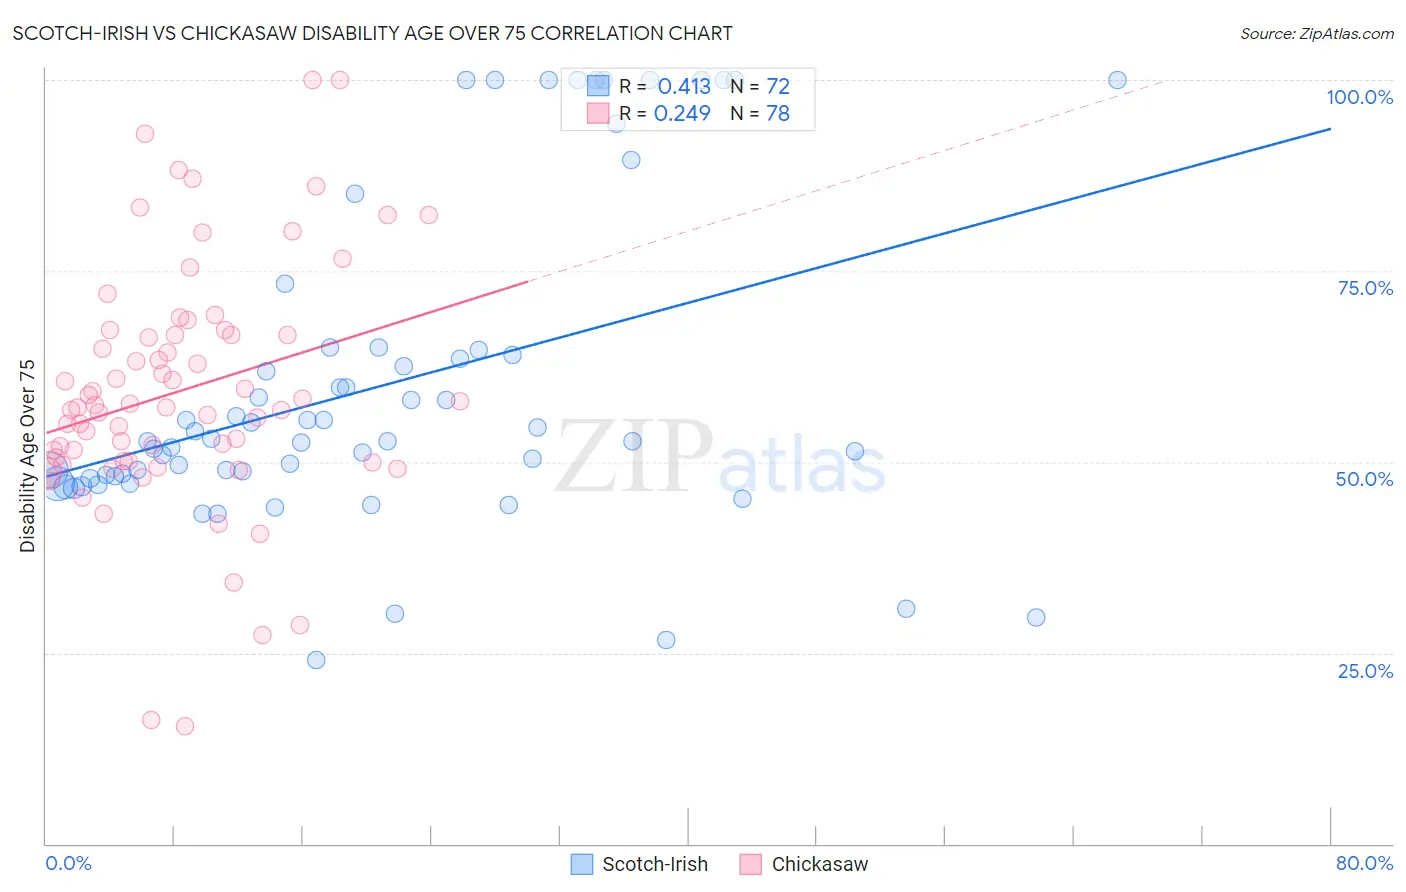
Scotch-Irish vs Chickasaw Disability Age Over 75 Correlation Chart
The statistical analysis conducted on geographies consisting of 547,171,445 people shows a moderate positive correlation between the proportion of Scotch-Irish and percentage of population with a disability over the age of 75 in the United States with a correlation coefficient (R) of 0.413 and weighted average of 47.3%. Similarly, the statistical analysis conducted on geographies consisting of 147,558,416 people shows a weak positive correlation between the proportion of Chickasaw and percentage of population with a disability over the age of 75 in the United States with a correlation coefficient (R) of 0.249 and weighted average of 51.2%, a difference of 8.2%.
Disability Age Over 75 Correlation Summary
| Measurement | Scotch-Irish | Chickasaw |
| Minimum | 24.0% | 15.4% |
| Maximum | 100.0% | 100.0% |
| Range | 76.0% | 84.6% |
| Mean | 59.9% | 59.3% |
| Median | 52.7% | 57.3% |
| Interquartile 25% (IQ1) | 47.9% | 50.1% |
| Interquartile 75% (IQ3) | 64.4% | 66.7% |
| Interquartile Range (IQR) | 16.4% | 16.6% |
| Standard Deviation (Sample) | 20.7% | 16.1% |
| Standard Deviation (Population) | 20.5% | 16.0% |
Similar Demographics by Disability Age Over 75
Demographics Similar to Scotch-Irish by Disability Age Over 75
In terms of disability age over 75, the demographic groups most similar to Scotch-Irish are Alsatian (47.3%, a difference of 0.010%), Immigrants from Africa (47.3%, a difference of 0.030%), White/Caucasian (47.3%, a difference of 0.060%), Immigrants from Haiti (47.3%, a difference of 0.060%), and German Russian (47.3%, a difference of 0.080%).
| Demographics | Rating | Rank | Disability Age Over 75 |
| Immigrants | Zimbabwe | 64.4 /100 | #165 | Good 47.2% |
| Immigrants | Sierra Leone | 64.4 /100 | #166 | Good 47.2% |
| Moroccans | 62.9 /100 | #167 | Good 47.2% |
| Kenyans | 58.8 /100 | #168 | Average 47.2% |
| Celtics | 58.7 /100 | #169 | Average 47.2% |
| German Russians | 56.2 /100 | #170 | Average 47.3% |
| Immigrants | Africa | 53.6 /100 | #171 | Average 47.3% |
| Scotch-Irish | 52.5 /100 | #172 | Average 47.3% |
| Alsatians | 51.9 /100 | #173 | Average 47.3% |
| Whites/Caucasians | 50.0 /100 | #174 | Average 47.3% |
| Immigrants | Haiti | 49.7 /100 | #175 | Average 47.3% |
| Ecuadorians | 46.7 /100 | #176 | Average 47.4% |
| Haitians | 44.6 /100 | #177 | Average 47.4% |
| Cubans | 42.1 /100 | #178 | Average 47.4% |
| Sierra Leoneans | 41.7 /100 | #179 | Average 47.4% |
Demographics Similar to Chickasaw by Disability Age Over 75
In terms of disability age over 75, the demographic groups most similar to Chickasaw are Mexican (51.1%, a difference of 0.14%), Yakama (51.3%, a difference of 0.18%), Immigrants from Mexico (51.1%, a difference of 0.19%), Seminole (51.5%, a difference of 0.51%), and Creek (51.5%, a difference of 0.51%).
| Demographics | Rating | Rank | Disability Age Over 75 |
| Aleuts | 0.0 /100 | #309 | Tragic 50.6% |
| Tlingit-Haida | 0.0 /100 | #310 | Tragic 50.6% |
| Cajuns | 0.0 /100 | #311 | Tragic 50.7% |
| Cheyenne | 0.0 /100 | #312 | Tragic 50.9% |
| Immigrants | Azores | 0.0 /100 | #313 | Tragic 50.9% |
| Immigrants | Mexico | 0.0 /100 | #314 | Tragic 51.1% |
| Mexicans | 0.0 /100 | #315 | Tragic 51.1% |
| Chickasaw | 0.0 /100 | #316 | Tragic 51.2% |
| Yakama | 0.0 /100 | #317 | Tragic 51.3% |
| Seminole | 0.0 /100 | #318 | Tragic 51.5% |
| Creek | 0.0 /100 | #319 | Tragic 51.5% |
| Paiute | 0.0 /100 | #320 | Tragic 51.5% |
| Dutch West Indians | 0.0 /100 | #321 | Tragic 51.5% |
| Comanche | 0.0 /100 | #322 | Tragic 51.7% |
| Immigrants | Yemen | 0.0 /100 | #323 | Tragic 52.0% |