Scotch-Irish vs Immigrants from Oceania Disability Age Over 75
COMPARE
Scotch-Irish
Immigrants from Oceania
Disability Age Over 75
Disability Age Over 75 Comparison
Scotch-Irish
Immigrants from Oceania
47.3%
DISABILITY AGE OVER 75
52.5/ 100
METRIC RATING
172nd/ 347
METRIC RANK
48.0%
DISABILITY AGE OVER 75
7.3/ 100
METRIC RATING
221st/ 347
METRIC RANK
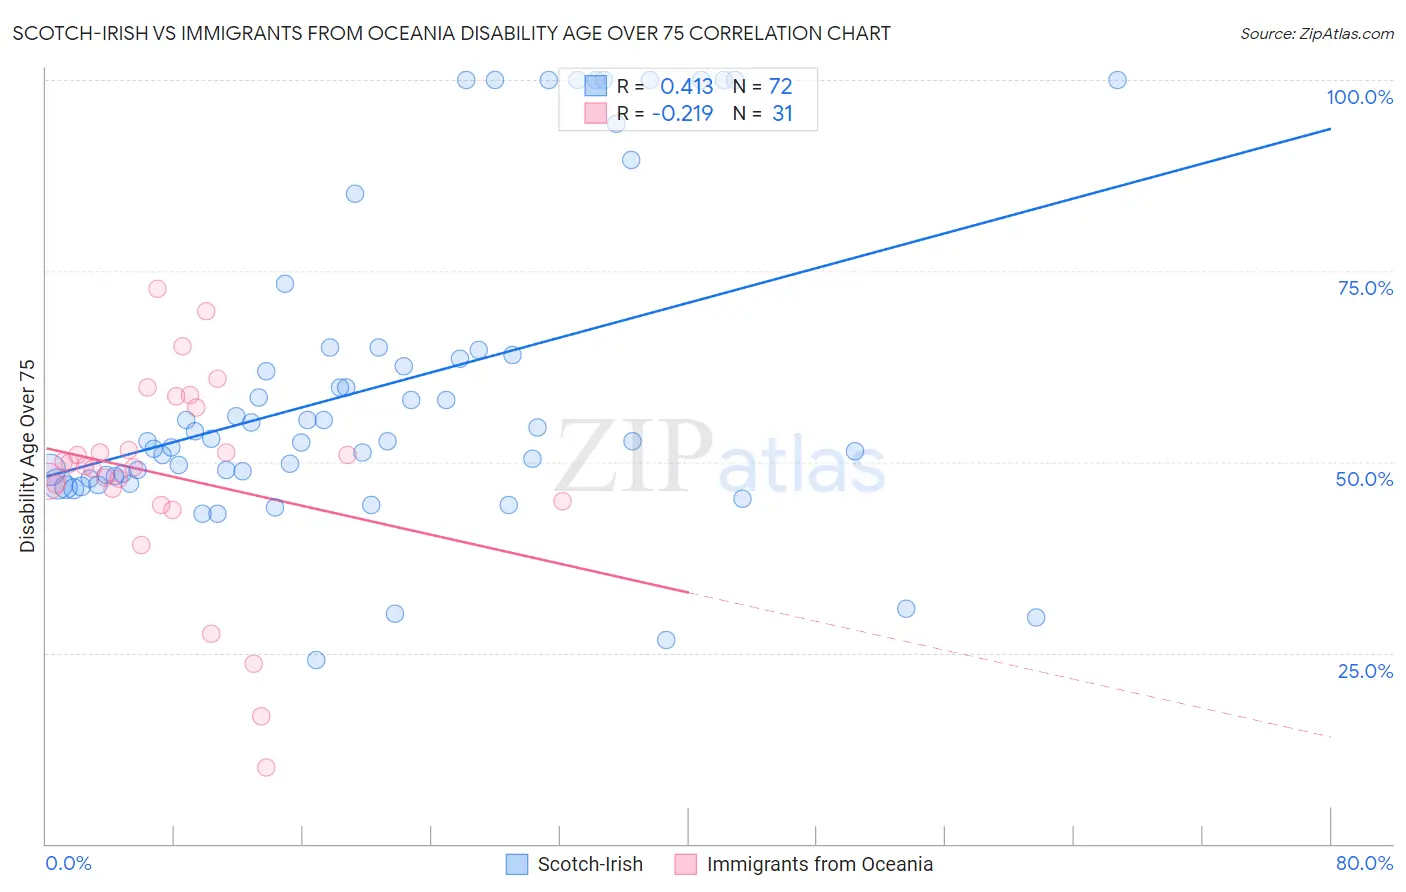
Scotch-Irish vs Immigrants from Oceania Disability Age Over 75 Correlation Chart
The statistical analysis conducted on geographies consisting of 547,171,445 people shows a moderate positive correlation between the proportion of Scotch-Irish and percentage of population with a disability over the age of 75 in the United States with a correlation coefficient (R) of 0.413 and weighted average of 47.3%. Similarly, the statistical analysis conducted on geographies consisting of 304,867,305 people shows a weak negative correlation between the proportion of Immigrants from Oceania and percentage of population with a disability over the age of 75 in the United States with a correlation coefficient (R) of -0.219 and weighted average of 48.0%, a difference of 1.5%.
Disability Age Over 75 Correlation Summary
| Measurement | Scotch-Irish | Immigrants from Oceania |
| Minimum | 24.0% | 10.0% |
| Maximum | 100.0% | 72.7% |
| Range | 76.0% | 62.7% |
| Mean | 59.9% | 48.2% |
| Median | 52.7% | 49.5% |
| Interquartile 25% (IQ1) | 47.9% | 44.8% |
| Interquartile 75% (IQ3) | 64.4% | 57.1% |
| Interquartile Range (IQR) | 16.4% | 12.3% |
| Standard Deviation (Sample) | 20.7% | 13.7% |
| Standard Deviation (Population) | 20.5% | 13.5% |
Similar Demographics by Disability Age Over 75
Demographics Similar to Scotch-Irish by Disability Age Over 75
In terms of disability age over 75, the demographic groups most similar to Scotch-Irish are Alsatian (47.3%, a difference of 0.010%), Immigrants from Africa (47.3%, a difference of 0.030%), White/Caucasian (47.3%, a difference of 0.060%), Immigrants from Haiti (47.3%, a difference of 0.060%), and German Russian (47.3%, a difference of 0.080%).
| Demographics | Rating | Rank | Disability Age Over 75 |
| Immigrants | Zimbabwe | 64.4 /100 | #165 | Good 47.2% |
| Immigrants | Sierra Leone | 64.4 /100 | #166 | Good 47.2% |
| Moroccans | 62.9 /100 | #167 | Good 47.2% |
| Kenyans | 58.8 /100 | #168 | Average 47.2% |
| Celtics | 58.7 /100 | #169 | Average 47.2% |
| German Russians | 56.2 /100 | #170 | Average 47.3% |
| Immigrants | Africa | 53.6 /100 | #171 | Average 47.3% |
| Scotch-Irish | 52.5 /100 | #172 | Average 47.3% |
| Alsatians | 51.9 /100 | #173 | Average 47.3% |
| Whites/Caucasians | 50.0 /100 | #174 | Average 47.3% |
| Immigrants | Haiti | 49.7 /100 | #175 | Average 47.3% |
| Ecuadorians | 46.7 /100 | #176 | Average 47.4% |
| Haitians | 44.6 /100 | #177 | Average 47.4% |
| Cubans | 42.1 /100 | #178 | Average 47.4% |
| Sierra Leoneans | 41.7 /100 | #179 | Average 47.4% |
Demographics Similar to Immigrants from Oceania by Disability Age Over 75
In terms of disability age over 75, the demographic groups most similar to Immigrants from Oceania are Immigrants from Western Asia (48.0%, a difference of 0.010%), Bahamian (48.0%, a difference of 0.010%), Barbadian (48.0%, a difference of 0.040%), Immigrants from Bangladesh (48.0%, a difference of 0.050%), and Liberian (48.0%, a difference of 0.060%).
| Demographics | Rating | Rank | Disability Age Over 75 |
| Immigrants | Barbados | 10.7 /100 | #214 | Poor 47.9% |
| Senegalese | 10.7 /100 | #215 | Poor 47.9% |
| Immigrants | Panama | 10.2 /100 | #216 | Poor 47.9% |
| Immigrants | Grenada | 9.4 /100 | #217 | Tragic 47.9% |
| Immigrants | Western Africa | 8.3 /100 | #218 | Tragic 48.0% |
| Immigrants | Western Asia | 7.5 /100 | #219 | Tragic 48.0% |
| Bahamians | 7.4 /100 | #220 | Tragic 48.0% |
| Immigrants | Oceania | 7.3 /100 | #221 | Tragic 48.0% |
| Barbadians | 6.8 /100 | #222 | Tragic 48.0% |
| Immigrants | Bangladesh | 6.8 /100 | #223 | Tragic 48.0% |
| Liberians | 6.7 /100 | #224 | Tragic 48.0% |
| Spanish | 6.5 /100 | #225 | Tragic 48.0% |
| Immigrants | Nonimmigrants | 6.5 /100 | #226 | Tragic 48.0% |
| Zimbabweans | 6.4 /100 | #227 | Tragic 48.1% |
| Immigrants | Liberia | 5.9 /100 | #228 | Tragic 48.1% |