Immigrants from Ecuador vs Lebanese Disability
COMPARE
Immigrants from Ecuador
Lebanese
Disability
Disability Comparison
Immigrants from Ecuador
Lebanese
11.2%
DISABILITY
98.0/ 100
METRIC RATING
93rd/ 347
METRIC RANK
11.8%
DISABILITY
27.9/ 100
METRIC RATING
187th/ 347
METRIC RANK
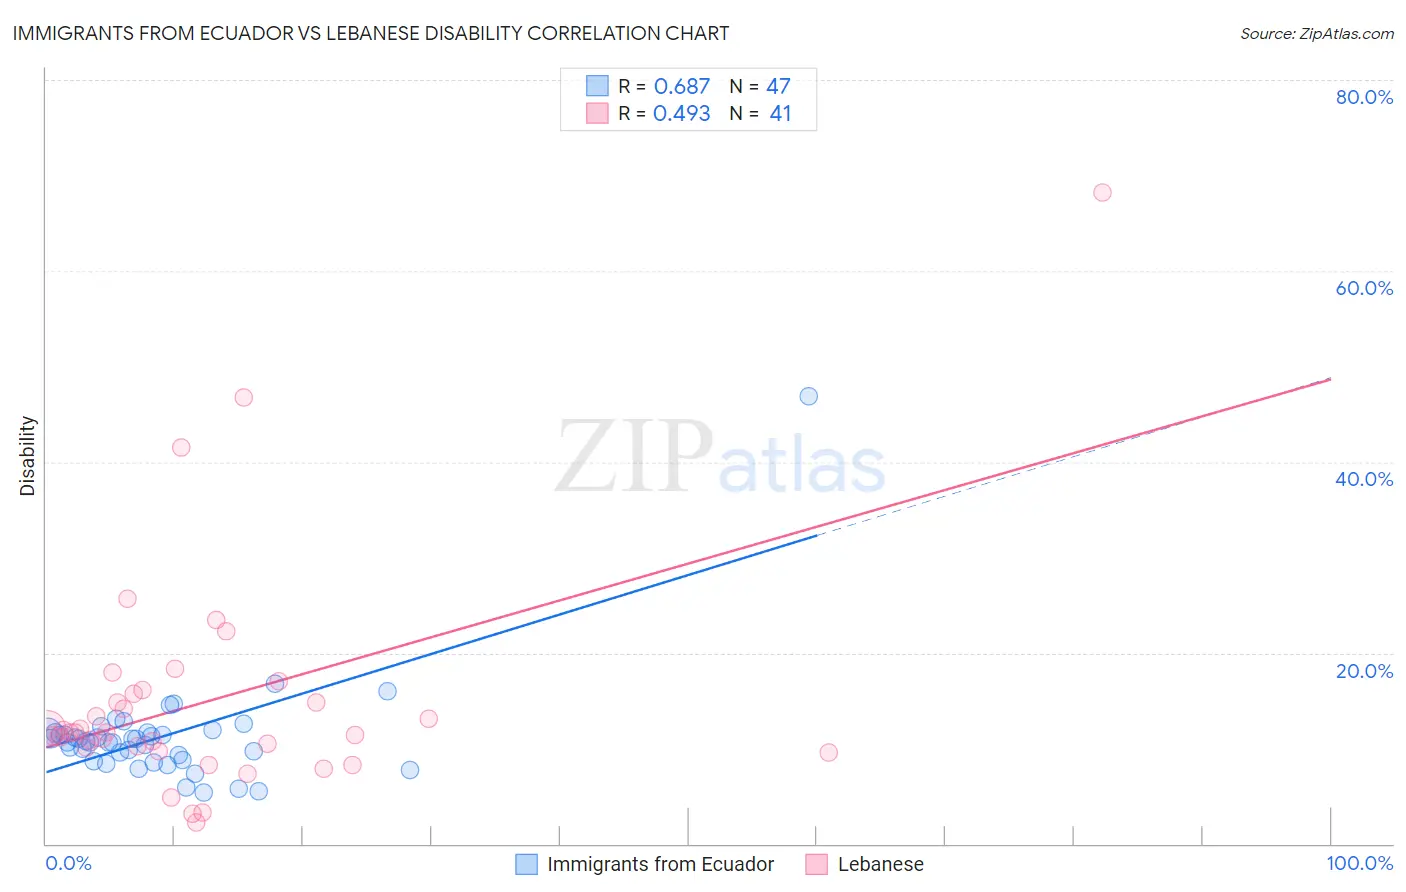
Immigrants from Ecuador vs Lebanese Disability Correlation Chart
The statistical analysis conducted on geographies consisting of 270,984,648 people shows a significant positive correlation between the proportion of Immigrants from Ecuador and percentage of population with a disability in the United States with a correlation coefficient (R) of 0.687 and weighted average of 11.2%. Similarly, the statistical analysis conducted on geographies consisting of 401,592,225 people shows a moderate positive correlation between the proportion of Lebanese and percentage of population with a disability in the United States with a correlation coefficient (R) of 0.493 and weighted average of 11.8%, a difference of 5.6%.
Disability Correlation Summary
| Measurement | Immigrants from Ecuador | Lebanese |
| Minimum | 5.4% | 2.2% |
| Maximum | 46.9% | 68.2% |
| Range | 41.5% | 66.0% |
| Mean | 11.2% | 15.0% |
| Median | 10.8% | 11.6% |
| Interquartile 25% (IQ1) | 8.7% | 9.9% |
| Interquartile 75% (IQ3) | 11.7% | 16.0% |
| Interquartile Range (IQR) | 2.9% | 6.0% |
| Standard Deviation (Sample) | 5.8% | 12.1% |
| Standard Deviation (Population) | 5.8% | 11.9% |
Similar Demographics by Disability
Demographics Similar to Immigrants from Ecuador by Disability
In terms of disability, the demographic groups most similar to Immigrants from Ecuador are Ecuadorian (11.2%, a difference of 0.0%), Immigrants from Western Asia (11.2%, a difference of 0.040%), Immigrants from Brazil (11.2%, a difference of 0.060%), Immigrants from South Africa (11.2%, a difference of 0.11%), and Immigrants from Morocco (11.2%, a difference of 0.12%).
| Demographics | Rating | Rank | Disability |
| Immigrants | Russia | 98.9 /100 | #86 | Exceptional 11.1% |
| Palestinians | 98.9 /100 | #87 | Exceptional 11.1% |
| Immigrants | Romania | 98.5 /100 | #88 | Exceptional 11.2% |
| Immigrants | South Africa | 98.2 /100 | #89 | Exceptional 11.2% |
| Immigrants | Brazil | 98.1 /100 | #90 | Exceptional 11.2% |
| Immigrants | Western Asia | 98.1 /100 | #91 | Exceptional 11.2% |
| Ecuadorians | 98.0 /100 | #92 | Exceptional 11.2% |
| Immigrants | Ecuador | 98.0 /100 | #93 | Exceptional 11.2% |
| Immigrants | Morocco | 97.8 /100 | #94 | Exceptional 11.2% |
| Eastern Europeans | 97.8 /100 | #95 | Exceptional 11.2% |
| Immigrants | Zimbabwe | 97.7 /100 | #96 | Exceptional 11.2% |
| Bhutanese | 97.4 /100 | #97 | Exceptional 11.2% |
| Uruguayans | 97.4 /100 | #98 | Exceptional 11.2% |
| Immigrants | Czechoslovakia | 97.4 /100 | #99 | Exceptional 11.2% |
| Immigrants | Greece | 96.9 /100 | #100 | Exceptional 11.3% |
Demographics Similar to Lebanese by Disability
In terms of disability, the demographic groups most similar to Lebanese are Immigrants from Scotland (11.8%, a difference of 0.020%), Immigrants from Burma/Myanmar (11.8%, a difference of 0.030%), Iraqi (11.8%, a difference of 0.11%), Honduran (11.8%, a difference of 0.18%), and Immigrants from Mexico (11.9%, a difference of 0.24%).
| Demographics | Rating | Rank | Disability |
| Immigrants | Honduras | 37.8 /100 | #180 | Fair 11.8% |
| Immigrants | Oceania | 34.3 /100 | #181 | Fair 11.8% |
| Icelanders | 34.0 /100 | #182 | Fair 11.8% |
| Hondurans | 31.2 /100 | #183 | Fair 11.8% |
| Iraqis | 30.0 /100 | #184 | Fair 11.8% |
| Immigrants | Burma/Myanmar | 28.5 /100 | #185 | Fair 11.8% |
| Immigrants | Scotland | 28.2 /100 | #186 | Fair 11.8% |
| Lebanese | 27.9 /100 | #187 | Fair 11.8% |
| Immigrants | Mexico | 23.8 /100 | #188 | Fair 11.9% |
| Immigrants | Zaire | 21.8 /100 | #189 | Fair 11.9% |
| Immigrants | West Indies | 21.1 /100 | #190 | Fair 11.9% |
| Ute | 19.5 /100 | #191 | Poor 11.9% |
| Lithuanians | 18.8 /100 | #192 | Poor 11.9% |
| Immigrants | Bosnia and Herzegovina | 18.0 /100 | #193 | Poor 11.9% |
| Somalis | 17.3 /100 | #194 | Poor 11.9% |