Immigrants from Ecuador vs Immigrants from Bulgaria Disability
COMPARE
Immigrants from Ecuador
Immigrants from Bulgaria
Disability
Disability Comparison
Immigrants from Ecuador
Immigrants from Bulgaria
11.2%
DISABILITY
98.0/ 100
METRIC RATING
93rd/ 347
METRIC RANK
10.9%
DISABILITY
99.7/ 100
METRIC RATING
61st/ 347
METRIC RANK
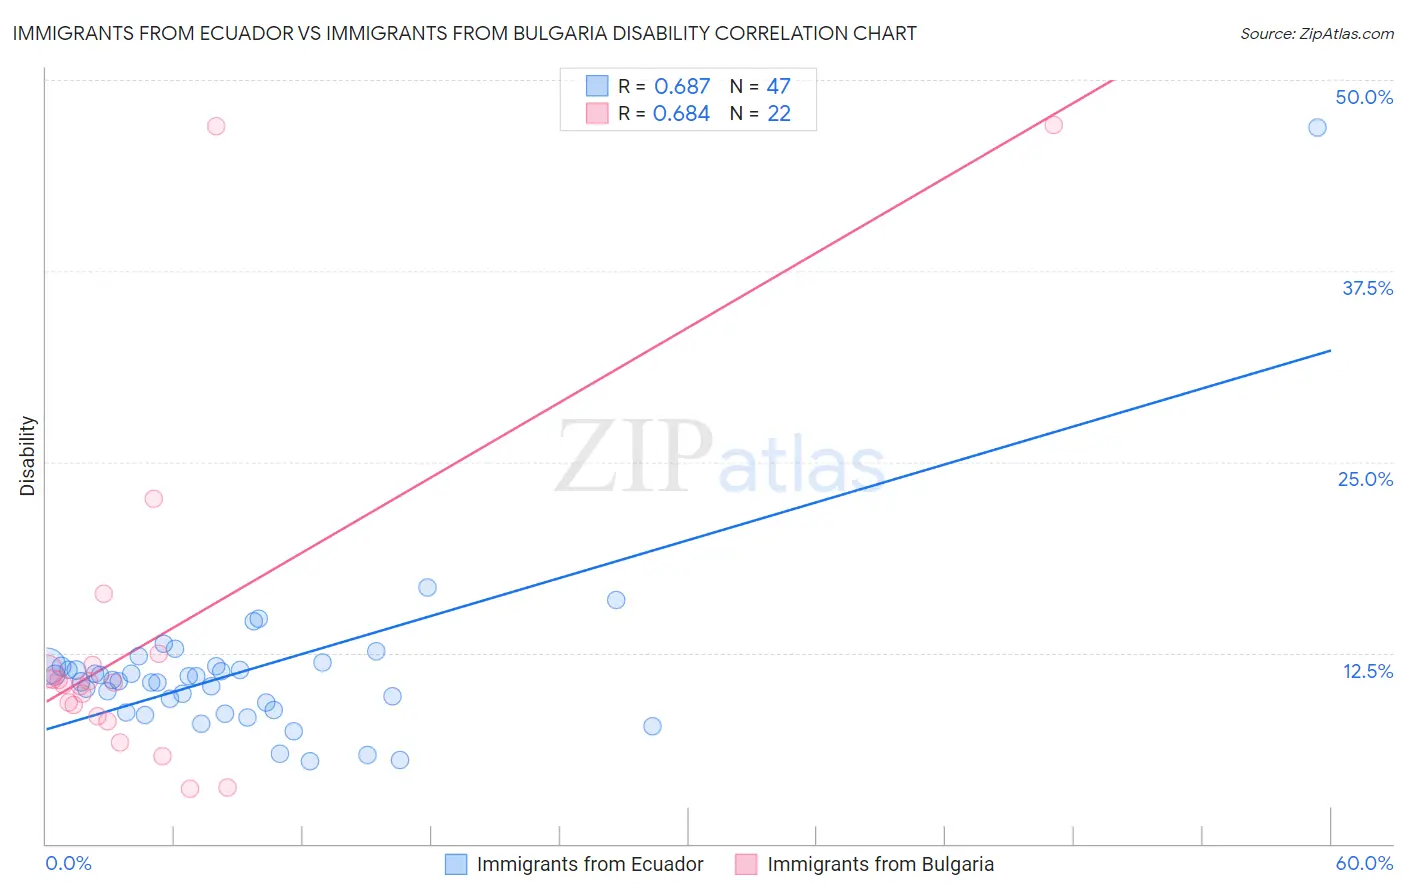
Immigrants from Ecuador vs Immigrants from Bulgaria Disability Correlation Chart
The statistical analysis conducted on geographies consisting of 270,984,648 people shows a significant positive correlation between the proportion of Immigrants from Ecuador and percentage of population with a disability in the United States with a correlation coefficient (R) of 0.687 and weighted average of 11.2%. Similarly, the statistical analysis conducted on geographies consisting of 172,550,622 people shows a significant positive correlation between the proportion of Immigrants from Bulgaria and percentage of population with a disability in the United States with a correlation coefficient (R) of 0.684 and weighted average of 10.9%, a difference of 2.3%.
Disability Correlation Summary
| Measurement | Immigrants from Ecuador | Immigrants from Bulgaria |
| Minimum | 5.4% | 3.6% |
| Maximum | 46.9% | 47.1% |
| Range | 41.5% | 43.5% |
| Mean | 11.2% | 13.5% |
| Median | 10.8% | 10.5% |
| Interquartile 25% (IQ1) | 8.7% | 8.3% |
| Interquartile 75% (IQ3) | 11.7% | 11.7% |
| Interquartile Range (IQR) | 2.9% | 3.4% |
| Standard Deviation (Sample) | 5.8% | 11.6% |
| Standard Deviation (Population) | 5.8% | 11.3% |
Similar Demographics by Disability
Demographics Similar to Immigrants from Ecuador by Disability
In terms of disability, the demographic groups most similar to Immigrants from Ecuador are Ecuadorian (11.2%, a difference of 0.0%), Immigrants from Western Asia (11.2%, a difference of 0.040%), Immigrants from Brazil (11.2%, a difference of 0.060%), Immigrants from South Africa (11.2%, a difference of 0.11%), and Immigrants from Morocco (11.2%, a difference of 0.12%).
| Demographics | Rating | Rank | Disability |
| Immigrants | Russia | 98.9 /100 | #86 | Exceptional 11.1% |
| Palestinians | 98.9 /100 | #87 | Exceptional 11.1% |
| Immigrants | Romania | 98.5 /100 | #88 | Exceptional 11.2% |
| Immigrants | South Africa | 98.2 /100 | #89 | Exceptional 11.2% |
| Immigrants | Brazil | 98.1 /100 | #90 | Exceptional 11.2% |
| Immigrants | Western Asia | 98.1 /100 | #91 | Exceptional 11.2% |
| Ecuadorians | 98.0 /100 | #92 | Exceptional 11.2% |
| Immigrants | Ecuador | 98.0 /100 | #93 | Exceptional 11.2% |
| Immigrants | Morocco | 97.8 /100 | #94 | Exceptional 11.2% |
| Eastern Europeans | 97.8 /100 | #95 | Exceptional 11.2% |
| Immigrants | Zimbabwe | 97.7 /100 | #96 | Exceptional 11.2% |
| Bhutanese | 97.4 /100 | #97 | Exceptional 11.2% |
| Uruguayans | 97.4 /100 | #98 | Exceptional 11.2% |
| Immigrants | Czechoslovakia | 97.4 /100 | #99 | Exceptional 11.2% |
| Immigrants | Greece | 96.9 /100 | #100 | Exceptional 11.3% |
Demographics Similar to Immigrants from Bulgaria by Disability
In terms of disability, the demographic groups most similar to Immigrants from Bulgaria are Immigrants from Northern Africa (10.9%, a difference of 0.040%), Zimbabwean (10.9%, a difference of 0.060%), Immigrants from Eritrea (11.0%, a difference of 0.060%), Immigrants from Colombia (10.9%, a difference of 0.15%), and Immigrants from South America (10.9%, a difference of 0.24%).
| Demographics | Rating | Rank | Disability |
| Jordanians | 99.8 /100 | #54 | Exceptional 10.9% |
| Immigrants | El Salvador | 99.8 /100 | #55 | Exceptional 10.9% |
| Immigrants | Lithuania | 99.8 /100 | #56 | Exceptional 10.9% |
| Salvadorans | 99.8 /100 | #57 | Exceptional 10.9% |
| Immigrants | South America | 99.8 /100 | #58 | Exceptional 10.9% |
| Immigrants | Colombia | 99.7 /100 | #59 | Exceptional 10.9% |
| Zimbabweans | 99.7 /100 | #60 | Exceptional 10.9% |
| Immigrants | Bulgaria | 99.7 /100 | #61 | Exceptional 10.9% |
| Immigrants | Northern Africa | 99.7 /100 | #62 | Exceptional 10.9% |
| Immigrants | Eritrea | 99.7 /100 | #63 | Exceptional 11.0% |
| Immigrants | Sweden | 99.6 /100 | #64 | Exceptional 11.0% |
| Bulgarians | 99.6 /100 | #65 | Exceptional 11.0% |
| Laotians | 99.6 /100 | #66 | Exceptional 11.0% |
| Colombians | 99.6 /100 | #67 | Exceptional 11.0% |
| Immigrants | Afghanistan | 99.6 /100 | #68 | Exceptional 11.0% |