Immigrants from Asia vs Palestinian Disability
COMPARE
Immigrants from Asia
Palestinian
Disability
Disability Comparison
Immigrants from Asia
Palestinians
10.5%
DISABILITY
100.0/ 100
METRIC RATING
23rd/ 347
METRIC RANK
11.1%
DISABILITY
98.9/ 100
METRIC RATING
87th/ 347
METRIC RANK
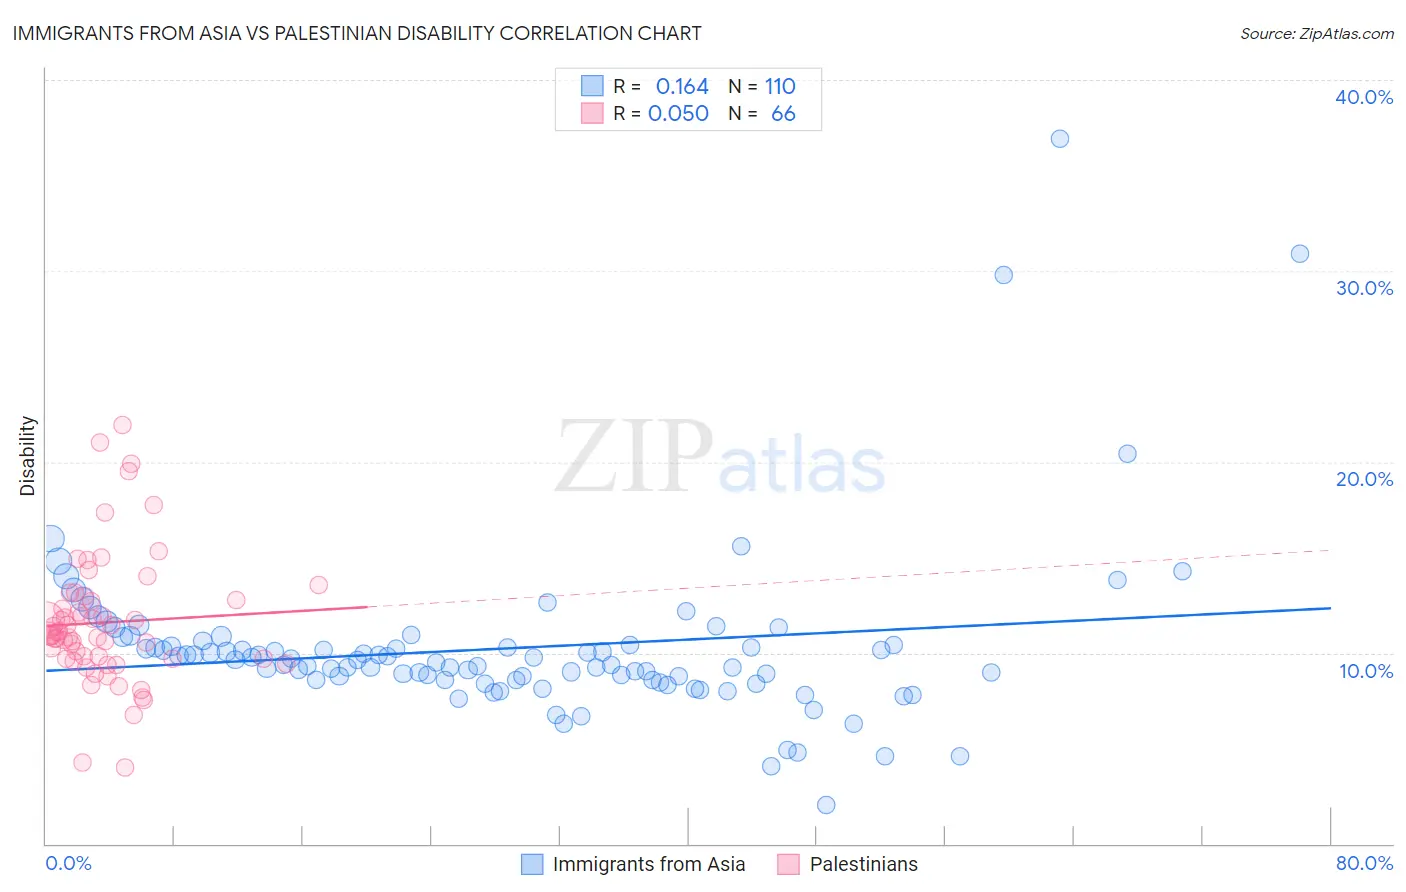
Immigrants from Asia vs Palestinian Disability Correlation Chart
The statistical analysis conducted on geographies consisting of 549,063,947 people shows a poor positive correlation between the proportion of Immigrants from Asia and percentage of population with a disability in the United States with a correlation coefficient (R) of 0.164 and weighted average of 10.5%. Similarly, the statistical analysis conducted on geographies consisting of 216,463,663 people shows no correlation between the proportion of Palestinians and percentage of population with a disability in the United States with a correlation coefficient (R) of 0.050 and weighted average of 11.1%, a difference of 5.7%.
Disability Correlation Summary
| Measurement | Immigrants from Asia | Palestinian |
| Minimum | 2.0% | 4.0% |
| Maximum | 36.9% | 21.9% |
| Range | 34.9% | 18.0% |
| Mean | 10.2% | 11.6% |
| Median | 9.6% | 11.0% |
| Interquartile 25% (IQ1) | 8.6% | 9.7% |
| Interquartile 75% (IQ3) | 10.4% | 12.7% |
| Interquartile Range (IQR) | 1.8% | 3.1% |
| Standard Deviation (Sample) | 4.5% | 3.4% |
| Standard Deviation (Population) | 4.5% | 3.4% |
Similar Demographics by Disability
Demographics Similar to Immigrants from Asia by Disability
In terms of disability, the demographic groups most similar to Immigrants from Asia are Venezuelan (10.5%, a difference of 0.14%), Immigrants from Malaysia (10.6%, a difference of 0.52%), Argentinean (10.6%, a difference of 0.57%), Cypriot (10.6%, a difference of 0.58%), and Immigrants from Sri Lanka (10.5%, a difference of 0.69%).
| Demographics | Rating | Rank | Disability |
| Indians (Asian) | 100.0 /100 | #16 | Exceptional 10.3% |
| Immigrants | Iran | 100.0 /100 | #17 | Exceptional 10.3% |
| Burmese | 100.0 /100 | #18 | Exceptional 10.4% |
| Immigrants | Pakistan | 100.0 /100 | #19 | Exceptional 10.4% |
| Immigrants | Venezuela | 100.0 /100 | #20 | Exceptional 10.4% |
| Asians | 100.0 /100 | #21 | Exceptional 10.4% |
| Immigrants | Sri Lanka | 100.0 /100 | #22 | Exceptional 10.5% |
| Immigrants | Asia | 100.0 /100 | #23 | Exceptional 10.5% |
| Venezuelans | 100.0 /100 | #24 | Exceptional 10.5% |
| Immigrants | Malaysia | 100.0 /100 | #25 | Exceptional 10.6% |
| Argentineans | 100.0 /100 | #26 | Exceptional 10.6% |
| Cypriots | 100.0 /100 | #27 | Exceptional 10.6% |
| Egyptians | 100.0 /100 | #28 | Exceptional 10.6% |
| Immigrants | Argentina | 100.0 /100 | #29 | Exceptional 10.6% |
| Immigrants | Turkey | 100.0 /100 | #30 | Exceptional 10.6% |
Demographics Similar to Palestinians by Disability
In terms of disability, the demographic groups most similar to Palestinians are Immigrants from Belarus (11.1%, a difference of 0.040%), Immigrants from Russia (11.1%, a difference of 0.040%), Immigrants from Sierra Leone (11.1%, a difference of 0.19%), Immigrants from Switzerland (11.1%, a difference of 0.20%), and Chilean (11.1%, a difference of 0.23%).
| Demographics | Rating | Rank | Disability |
| Immigrants | Ireland | 99.3 /100 | #80 | Exceptional 11.1% |
| Immigrants | Poland | 99.1 /100 | #81 | Exceptional 11.1% |
| Chileans | 99.1 /100 | #82 | Exceptional 11.1% |
| Immigrants | Switzerland | 99.0 /100 | #83 | Exceptional 11.1% |
| Immigrants | Sierra Leone | 99.0 /100 | #84 | Exceptional 11.1% |
| Immigrants | Belarus | 98.9 /100 | #85 | Exceptional 11.1% |
| Immigrants | Russia | 98.9 /100 | #86 | Exceptional 11.1% |
| Palestinians | 98.9 /100 | #87 | Exceptional 11.1% |
| Immigrants | Romania | 98.5 /100 | #88 | Exceptional 11.2% |
| Immigrants | South Africa | 98.2 /100 | #89 | Exceptional 11.2% |
| Immigrants | Brazil | 98.1 /100 | #90 | Exceptional 11.2% |
| Immigrants | Western Asia | 98.1 /100 | #91 | Exceptional 11.2% |
| Ecuadorians | 98.0 /100 | #92 | Exceptional 11.2% |
| Immigrants | Ecuador | 98.0 /100 | #93 | Exceptional 11.2% |
| Immigrants | Morocco | 97.8 /100 | #94 | Exceptional 11.2% |