Zip Codes with the Highest Percentage of Population Employed in Architecture & Engineering in Avondale, AZ
RELATED REPORTS & OPTIONS
Architecture & Engineering
Avondale
Compare Zip Codes
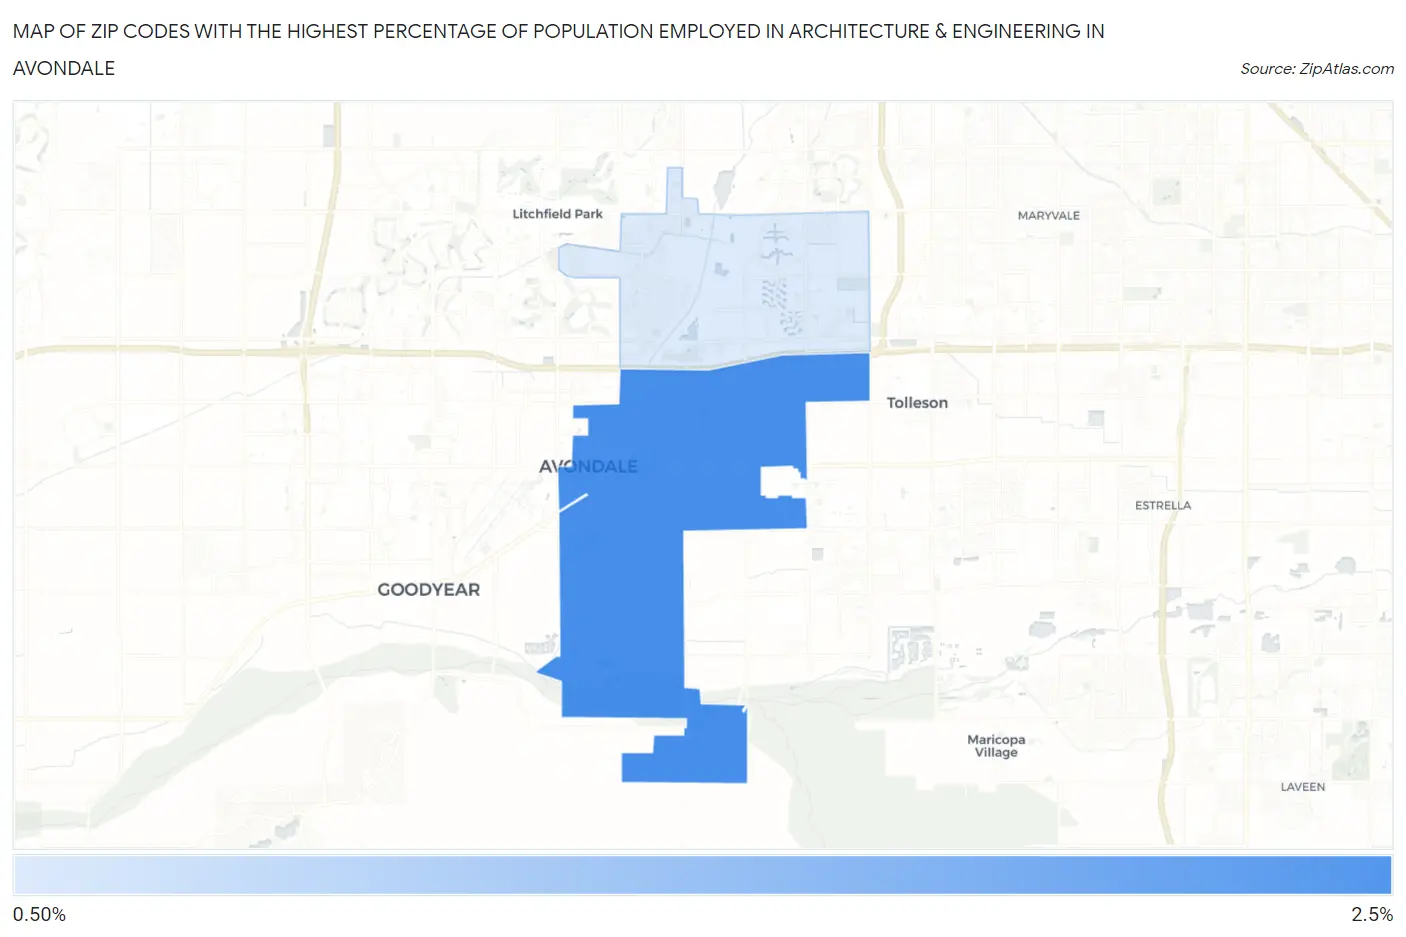
Map of Zip Codes with the Highest Percentage of Population Employed in Architecture & Engineering in Avondale
1.2%
2.3%
Zip Codes with the Highest Percentage of Population Employed in Architecture & Engineering in Avondale, AZ
| Zip Code | % Employed | vs State | vs National | |
| 1. | 85323 | 2.3% | 2.4%(-0.086)#118 | 2.1%(+0.156)#7,911 |
| 2. | 85392 | 1.2% | 2.4%(-1.22)#217 | 2.1%(-0.982)#15,344 |
1
Common Questions
What are the Top Zip Codes with the Highest Percentage of Population Employed in Architecture & Engineering in Avondale, AZ?
Top Zip Codes with the Highest Percentage of Population Employed in Architecture & Engineering in Avondale, AZ are:
What zip code has the Highest Percentage of Population Employed in Architecture & Engineering in Avondale, AZ?
85323 has the Highest Percentage of Population Employed in Architecture & Engineering in Avondale, AZ with 2.3%.
What is the Percentage of Population Employed in Architecture & Engineering in Avondale, AZ?
Percentage of Population Employed in Architecture & Engineering in Avondale is 1.7%.
What is the Percentage of Population Employed in Architecture & Engineering in Arizona?
Percentage of Population Employed in Architecture & Engineering in Arizona is 2.4%.
What is the Percentage of Population Employed in Architecture & Engineering in the United States?
Percentage of Population Employed in Architecture & Engineering in the United States is 2.1%.