Eastover, SC Map & Demographics
Eastover Map
Eastover Overview
$16,329
PER CAPITA INCOME
$31,250
AVG FAMILY INCOME
$21,620
AVG HOUSEHOLD INCOME
0.47
INEQUALITY / GINI INDEX
616
TOTAL POPULATION
203
MALE POPULATION
413
FEMALE POPULATION
49.15
MALES / 100 FEMALES
203.45
FEMALES / 100 MALES
39.3
MEDIAN AGE
2.7
AVG FAMILY SIZE
1.9
AVG HOUSEHOLD SIZE
239
LABOR FORCE [ PEOPLE ]
52.3%
PERCENT IN LABOR FORCE
12.6%
UNEMPLOYMENT RATE
Eastover Zip Codes
Eastover Area Codes
Income in Eastover
Income Overview in Eastover
Per Capita Income in Eastover is $16,329, while median incomes of families and households are $31,250 and $21,620 respectively.
| Characteristic | Number | Measure |
| Per Capita Income | 616 | $16,329 |
| Median Family Income | 148 | $31,250 |
| Mean Family Income | 148 | $32,684 |
| Median Household Income | 307 | $21,620 |
| Mean Household Income | 307 | $29,802 |
| Income Deficit | 148 | $0 |
| Wage / Income Gap (%) | 616 | 0.00% |
| Wage / Income Gap ($) | 616 | 100.00¢ per $1 |
| Gini / Inequality Index | 616 | 0.47 |
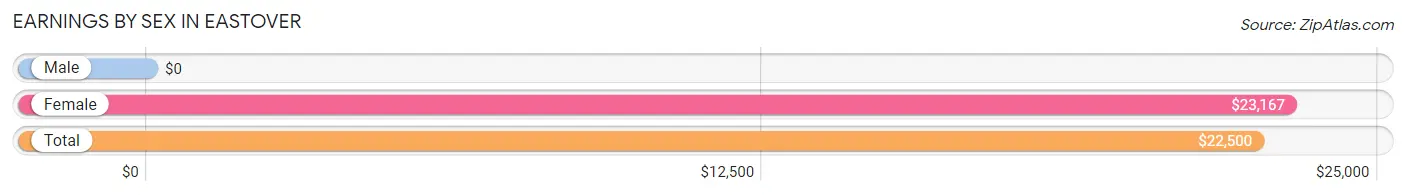
Earnings by Sex in Eastover
| Sex | Number | Average Earnings |
| Male | 98 (44.1%) | $0 |
| Female | 124 (55.9%) | $23,167 |
| Total | 222 (100.0%) | $22,500 |
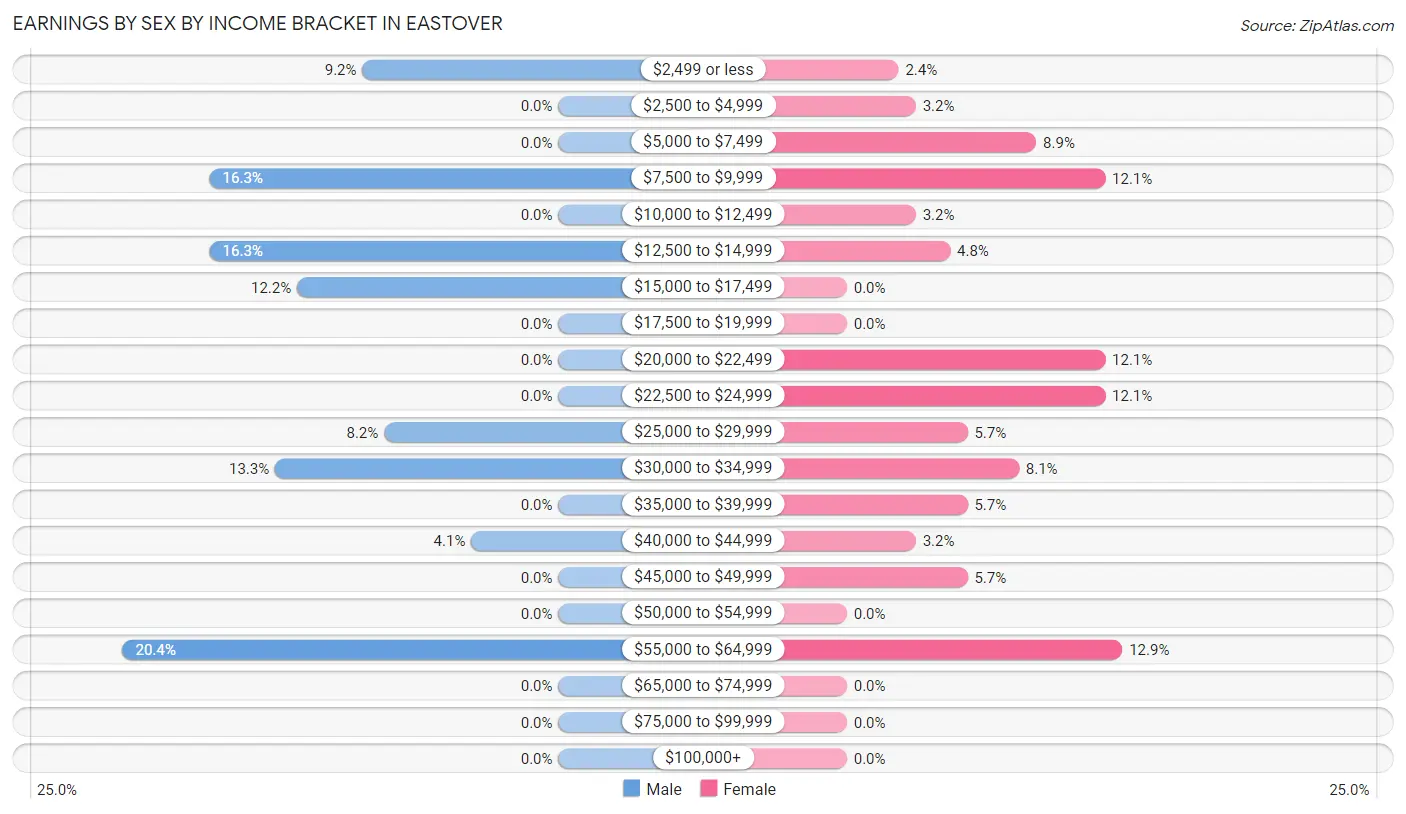
Earnings by Sex by Income Bracket in Eastover
The most common earnings brackets in Eastover are $55,000 to $64,999 for men (20 | 20.4%) and $55,000 to $64,999 for women (16 | 12.9%).
| Income | Male | Female |
| $2,499 or less | 9 (9.2%) | 3 (2.4%) |
| $2,500 to $4,999 | 0 (0.0%) | 4 (3.2%) |
| $5,000 to $7,499 | 0 (0.0%) | 11 (8.9%) |
| $7,500 to $9,999 | 16 (16.3%) | 15 (12.1%) |
| $10,000 to $12,499 | 0 (0.0%) | 4 (3.2%) |
| $12,500 to $14,999 | 16 (16.3%) | 6 (4.8%) |
| $15,000 to $17,499 | 12 (12.2%) | 0 (0.0%) |
| $17,500 to $19,999 | 0 (0.0%) | 0 (0.0%) |
| $20,000 to $22,499 | 0 (0.0%) | 15 (12.1%) |
| $22,500 to $24,999 | 0 (0.0%) | 15 (12.1%) |
| $25,000 to $29,999 | 8 (8.2%) | 7 (5.7%) |
| $30,000 to $34,999 | 13 (13.3%) | 10 (8.1%) |
| $35,000 to $39,999 | 0 (0.0%) | 7 (5.7%) |
| $40,000 to $44,999 | 4 (4.1%) | 4 (3.2%) |
| $45,000 to $49,999 | 0 (0.0%) | 7 (5.7%) |
| $50,000 to $54,999 | 0 (0.0%) | 0 (0.0%) |
| $55,000 to $64,999 | 20 (20.4%) | 16 (12.9%) |
| $65,000 to $74,999 | 0 (0.0%) | 0 (0.0%) |
| $75,000 to $99,999 | 0 (0.0%) | 0 (0.0%) |
| $100,000+ | 0 (0.0%) | 0 (0.0%) |
| Total | 98 (100.0%) | 124 (100.0%) |
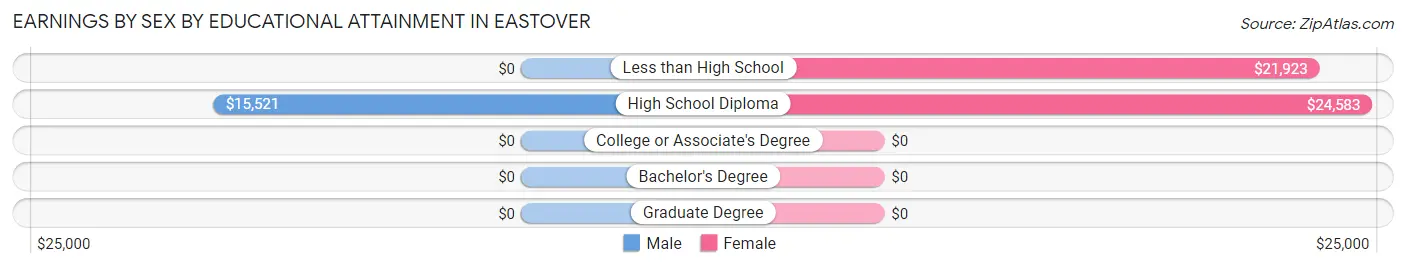
Earnings by Sex by Educational Attainment in Eastover
Average earnings in Eastover are $25,938 for men and $24,333 for women, a difference of 6.2%. Men with an educational attainment of high school diploma enjoy the highest average annual earnings of $15,521, while those with high school diploma education earn the least with $15,521. Women with an educational attainment of high school diploma earn the most with the average annual earnings of $24,583, while those with less than high school education have the smallest earnings of $21,923.
| Educational Attainment | Male Income | Female Income |
| Less than High School | - | - |
| High School Diploma | $15,521 | $24,583 |
| College or Associate's Degree | - | - |
| Bachelor's Degree | - | - |
| Graduate Degree | - | - |
| Total | $25,938 | $24,333 |
Family Income in Eastover
Family Income Brackets in Eastover
According to the Eastover family income data, there are 37 families falling into the $25,000 to $34,999 income range, which is the most common income bracket and makes up 25.0% of all families.
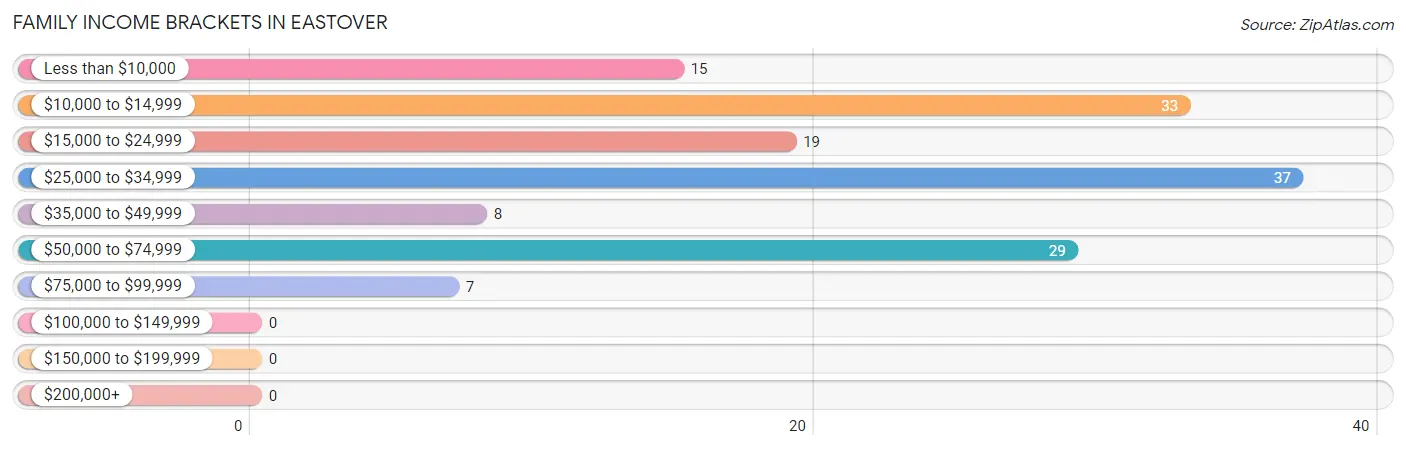
| Income Bracket | # Families | % Families |
| Less than $10,000 | 15 | 10.1% |
| $10,000 to $14,999 | 33 | 22.3% |
| $15,000 to $24,999 | 19 | 12.8% |
| $25,000 to $34,999 | 37 | 25.0% |
| $35,000 to $49,999 | 8 | 5.4% |
| $50,000 to $74,999 | 29 | 19.6% |
| $75,000 to $99,999 | 7 | 4.7% |
| $100,000 to $149,999 | 0 | 0.0% |
| $150,000 to $199,999 | 0 | 0.0% |
| $200,000+ | 0 | 0.0% |
Family Income by Famaliy Size in Eastover
2-person families (93 | 62.8%) account for the highest median family income in Eastover with $33,292 per family, while 2-person families (93 | 62.8%) have the highest median income of $16,646 per family member.
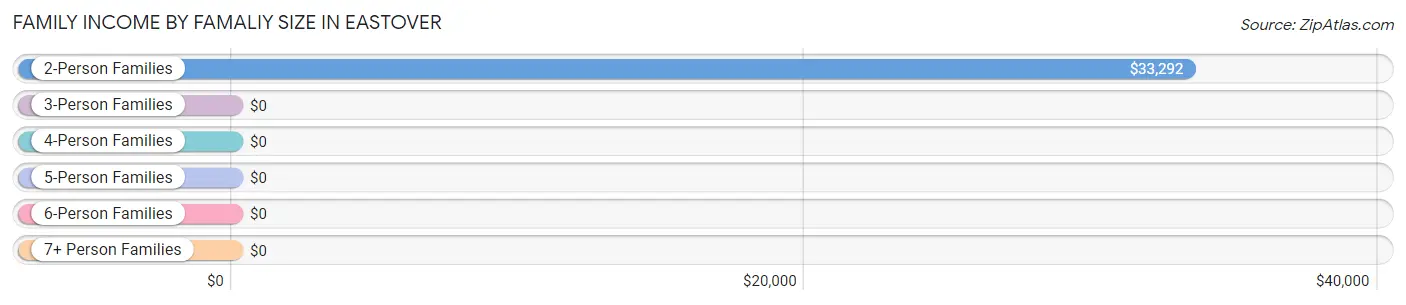
| Income Bracket | # Families | Median Income |
| 2-Person Families | 93 (62.8%) | $33,292 |
| 3-Person Families | 30 (20.3%) | $0 |
| 4-Person Families | 18 (12.2%) | $0 |
| 5-Person Families | 7 (4.7%) | $0 |
| 6-Person Families | 0 (0.0%) | $0 |
| 7+ Person Families | 0 (0.0%) | $0 |
| Total | 148 (100.0%) | $31,250 |
Family Income by Number of Earners in Eastover
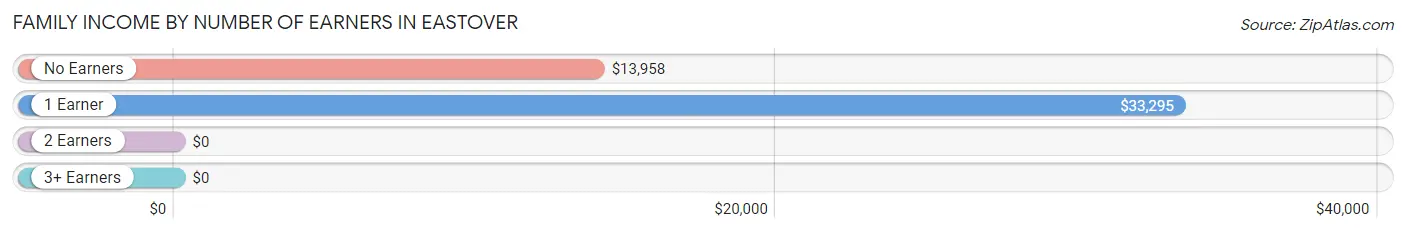
| Number of Earners | # Families | Median Income |
| No Earners | 41 (27.7%) | $13,958 |
| 1 Earner | 84 (56.8%) | $33,295 |
| 2 Earners | 16 (10.8%) | $0 |
| 3+ Earners | 7 (4.7%) | $0 |
| Total | 148 (100.0%) | $31,250 |
Household Income in Eastover
Household Income Brackets in Eastover
With 75 households falling in the category, the $25,000 to $34,999 income range is the most frequent in Eastover, accounting for 24.4% of all households.
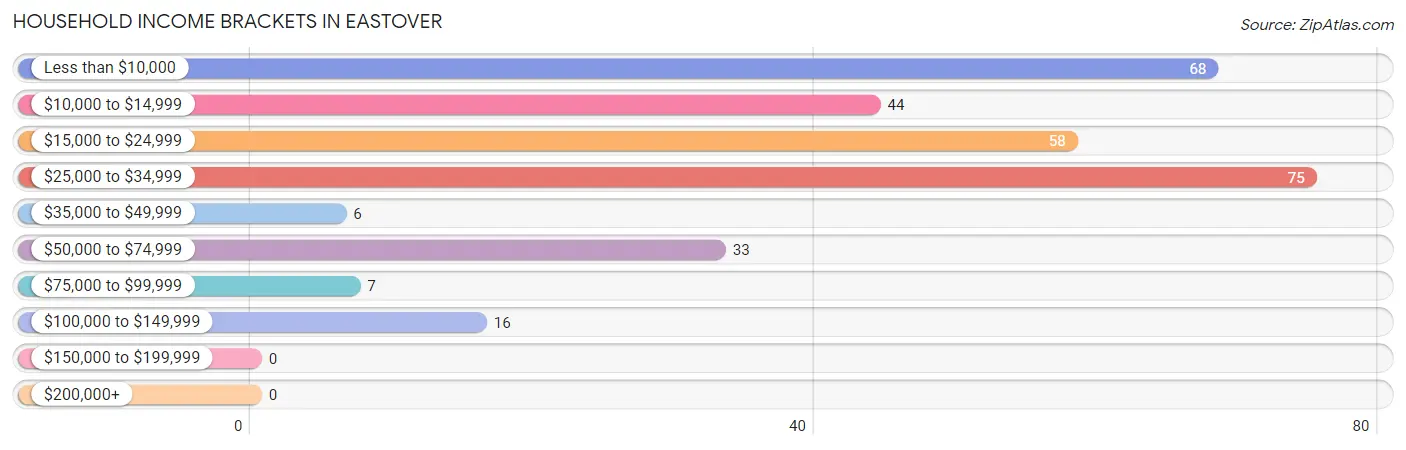
| Income Bracket | # Households | % Households |
| Less than $10,000 | 68 | 22.1% |
| $10,000 to $14,999 | 44 | 14.3% |
| $15,000 to $24,999 | 58 | 18.9% |
| $25,000 to $34,999 | 75 | 24.4% |
| $35,000 to $49,999 | 6 | 2.0% |
| $50,000 to $74,999 | 33 | 10.7% |
| $75,000 to $99,999 | 7 | 2.3% |
| $100,000 to $149,999 | 16 | 5.2% |
| $150,000 to $199,999 | 0 | 0.0% |
| $200,000+ | 0 | 0.0% |
Household Income by Householder Age in Eastover
The median household income in Eastover is $21,620, with the highest median household income of $33,290 found in the 65+ years age bracket for the primary householder. A total of 121 households (39.4%) fall into this category. Meanwhile, the 15 to 24 years age bracket for the primary householder has the lowest median household income of $0, with 2 households (0.6%) in this group.
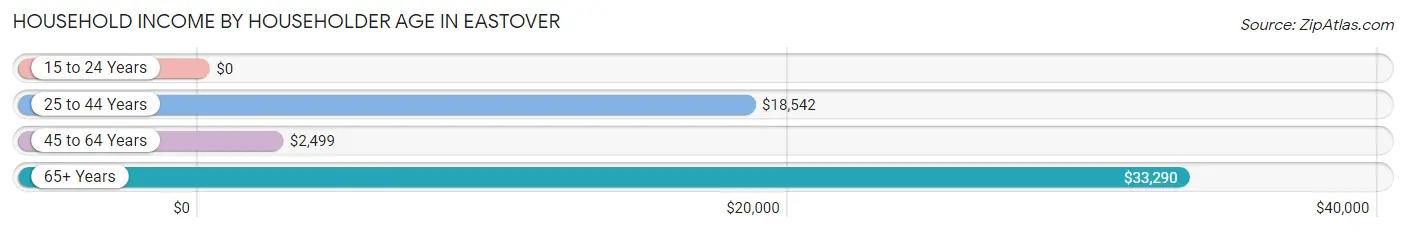
| Income Bracket | # Households | Median Income |
| 15 to 24 Years | 2 (0.6%) | $0 |
| 25 to 44 Years | 143 (46.6%) | $18,542 |
| 45 to 64 Years | 41 (13.4%) | $2,499 |
| 65+ Years | 121 (39.4%) | $33,290 |
| Total | 307 (100.0%) | $21,620 |
Poverty in Eastover
Income Below Poverty by Sex and Age in Eastover
With 19.1% poverty level for males and 46.0% for females among the residents of Eastover, 55 to 64 year old males and 55 to 64 year old females are the most vulnerable to poverty, with 11 males (84.6%) and 25 females (100.0%) in their respective age groups living below the poverty level.
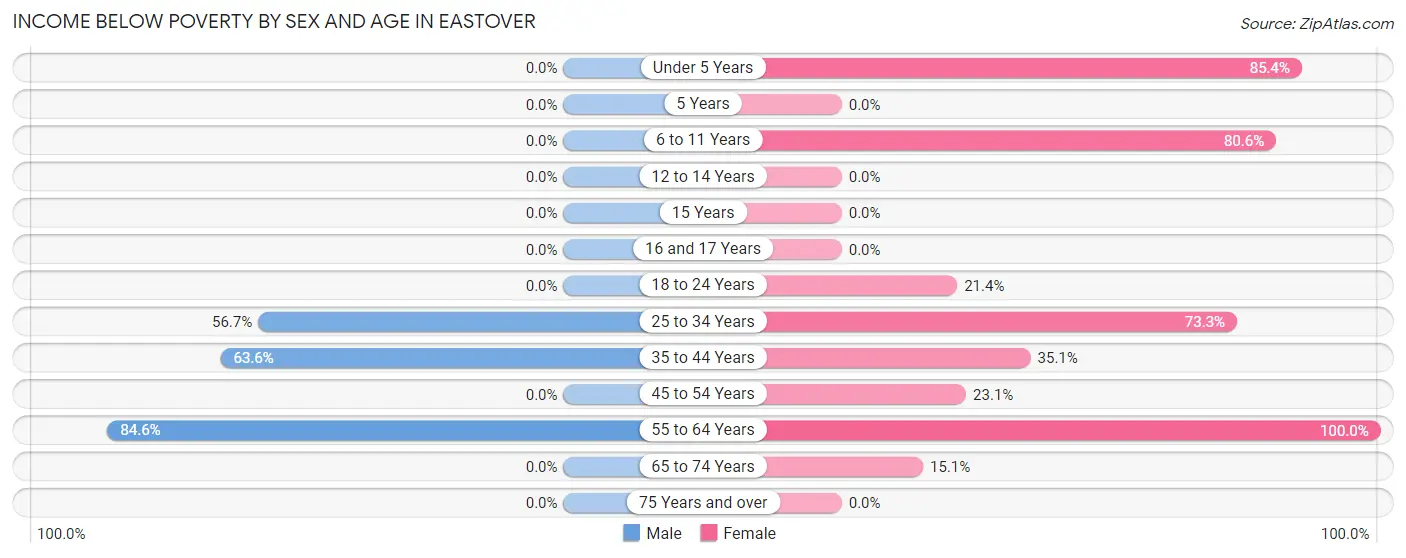
| Age Bracket | Male | Female |
| Under 5 Years | 0 (0.0%) | 35 (85.4%) |
| 5 Years | 0 (0.0%) | 0 (0.0%) |
| 6 to 11 Years | 0 (0.0%) | 54 (80.6%) |
| 12 to 14 Years | 0 (0.0%) | 0 (0.0%) |
| 15 Years | 0 (0.0%) | 0 (0.0%) |
| 16 and 17 Years | 0 (0.0%) | 0 (0.0%) |
| 18 to 24 Years | 0 (0.0%) | 3 (21.4%) |
| 25 to 34 Years | 17 (56.7%) | 22 (73.3%) |
| 35 to 44 Years | 7 (63.6%) | 34 (35.0%) |
| 45 to 54 Years | 0 (0.0%) | 3 (23.1%) |
| 55 to 64 Years | 11 (84.6%) | 25 (100.0%) |
| 65 to 74 Years | 0 (0.0%) | 8 (15.1%) |
| 75 Years and over | 0 (0.0%) | 0 (0.0%) |
| Total | 35 (19.1%) | 184 (46.0%) |
Income Above Poverty by Sex and Age in Eastover
According to the poverty statistics in Eastover, males aged 5 years and females aged 12 to 14 years are the age groups that are most secure financially, with 100.0% of males and 100.0% of females in these age groups living above the poverty line.
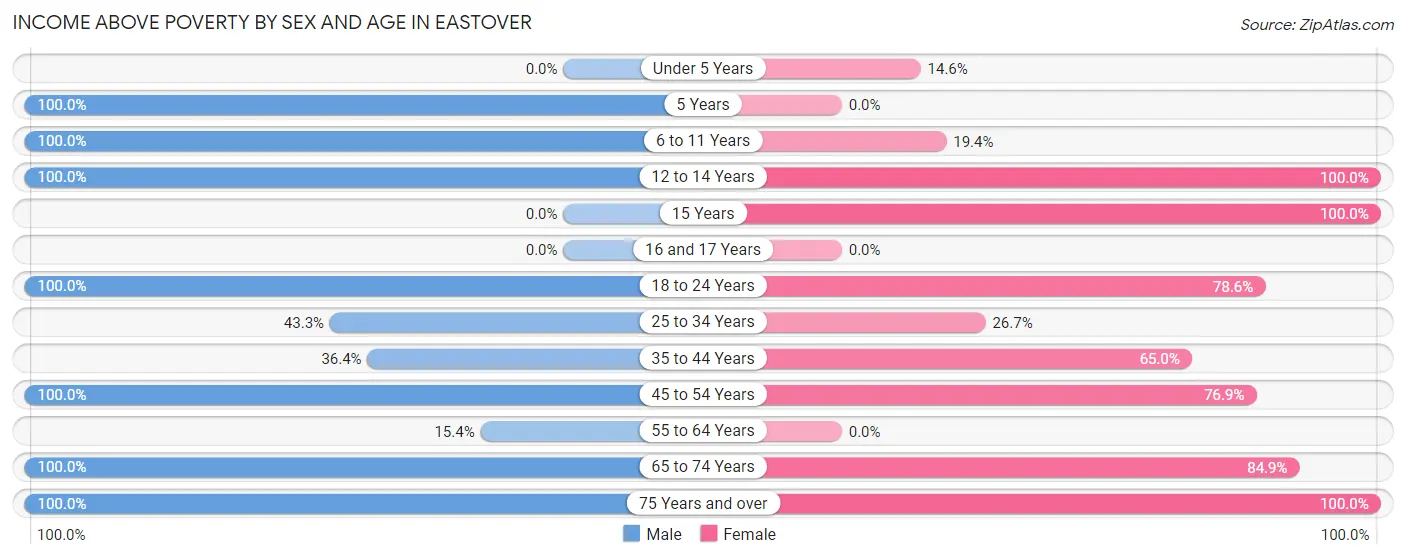
| Age Bracket | Male | Female |
| Under 5 Years | 0 (0.0%) | 6 (14.6%) |
| 5 Years | 4 (100.0%) | 0 (0.0%) |
| 6 to 11 Years | 13 (100.0%) | 13 (19.4%) |
| 12 to 14 Years | 5 (100.0%) | 4 (100.0%) |
| 15 Years | 0 (0.0%) | 25 (100.0%) |
| 16 and 17 Years | 0 (0.0%) | 0 (0.0%) |
| 18 to 24 Years | 14 (100.0%) | 11 (78.6%) |
| 25 to 34 Years | 13 (43.3%) | 8 (26.7%) |
| 35 to 44 Years | 4 (36.4%) | 63 (64.9%) |
| 45 to 54 Years | 28 (100.0%) | 10 (76.9%) |
| 55 to 64 Years | 2 (15.4%) | 0 (0.0%) |
| 65 to 74 Years | 50 (100.0%) | 45 (84.9%) |
| 75 Years and over | 15 (100.0%) | 31 (100.0%) |
| Total | 148 (80.9%) | 216 (54.0%) |
Income Below Poverty Among Married-Couple Families in Eastover
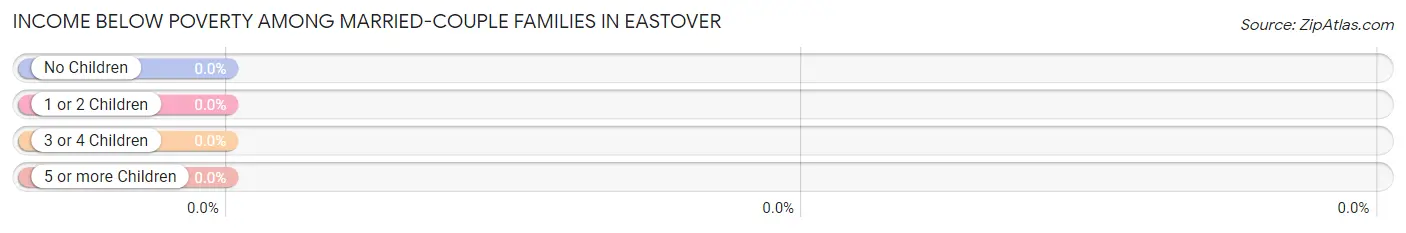
| Children | Above Poverty | Below Poverty |
| No Children | 28 (100.0%) | 0 (0.0%) |
| 1 or 2 Children | 0 (0.0%) | 0 (0.0%) |
| 3 or 4 Children | 0 (0.0%) | 0 (0.0%) |
| 5 or more Children | 0 (0.0%) | 0 (0.0%) |
| Total | 28 (100.0%) | 0 (0.0%) |
Income Below Poverty Among Single-Parent Households in Eastover
According to the poverty data in Eastover, 42.9% or 3 single-father households and 46.0% or 52 single-mother households are living below the poverty line. Among single-father households, those with no children have the highest poverty rate, with 3 households (100.0%) experiencing poverty. Likewise, among single-mother households, those with 1 or 2 children have the highest poverty rate, with 45 households (65.2%) falling below the poverty line.
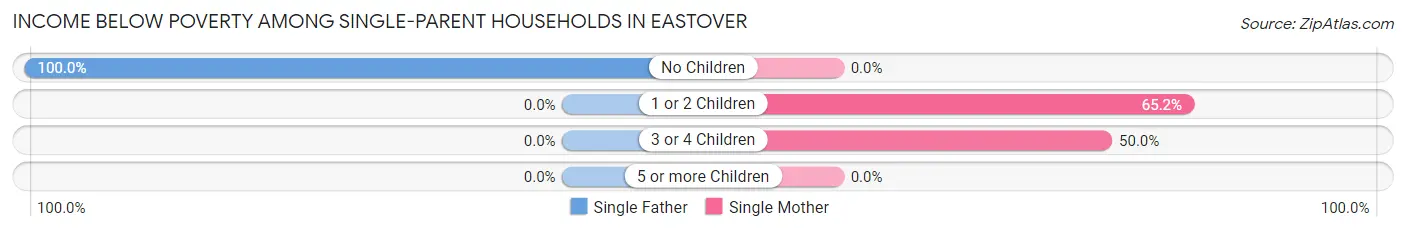
| Children | Single Father | Single Mother |
| No Children | 3 (100.0%) | 0 (0.0%) |
| 1 or 2 Children | 0 (0.0%) | 45 (65.2%) |
| 3 or 4 Children | 0 (0.0%) | 7 (50.0%) |
| 5 or more Children | 0 (0.0%) | 0 (0.0%) |
| Total | 3 (42.9%) | 52 (46.0%) |
Income Below Poverty Among Married-Couple vs Single-Parent Households in Eastover
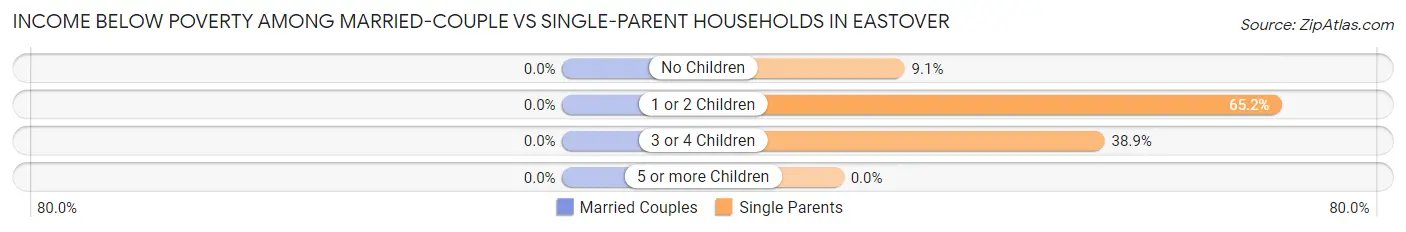
| Children | Married-Couple Families | Single-Parent Households |
| No Children | 0 (0.0%) | 3 (9.1%) |
| 1 or 2 Children | 0 (0.0%) | 45 (65.2%) |
| 3 or 4 Children | 0 (0.0%) | 7 (38.9%) |
| 5 or more Children | 0 (0.0%) | 0 (0.0%) |
| Total | 0 (0.0%) | 55 (45.8%) |
Race in Eastover
The most populous races in Eastover are Black / African American (573 | 93.0%), White / Caucasian (28 | 4.5%), and Two or more Races (9 | 1.5%).
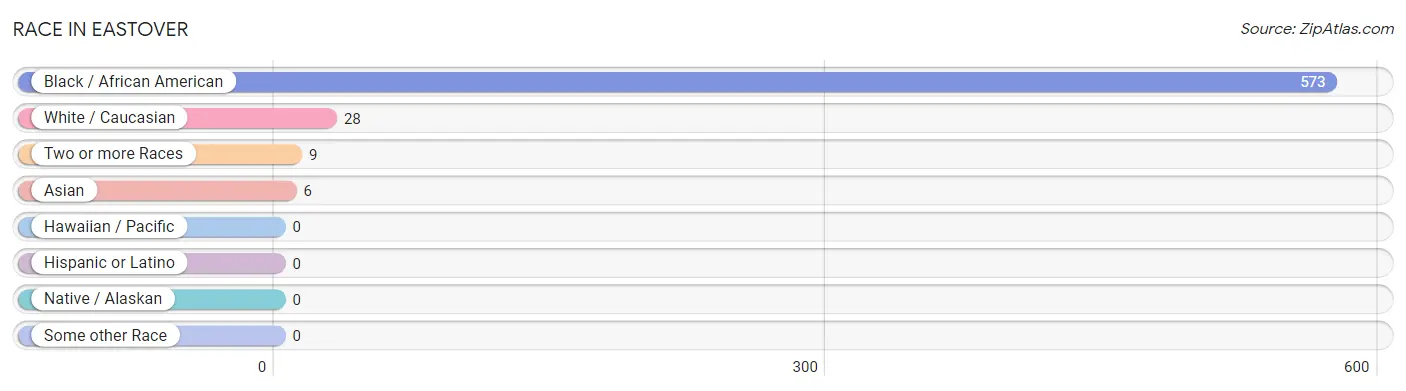
| Race | # Population | % Population |
| Asian | 6 | 1.0% |
| Black / African American | 573 | 93.0% |
| Hawaiian / Pacific | 0 | 0.0% |
| Hispanic or Latino | 0 | 0.0% |
| Native / Alaskan | 0 | 0.0% |
| White / Caucasian | 28 | 4.5% |
| Two or more Races | 9 | 1.5% |
| Some other Race | 0 | 0.0% |
| Total | 616 | 100.0% |
Ancestry in Eastover
The most populous ancestries reported in Eastover are African (28 | 4.5%), Subsaharan African (28 | 4.5%), Italian (15 | 2.4%), Scotch-Irish (15 | 2.4%), and Polish (9 | 1.5%), together accounting for 15.4% of all Eastover residents.
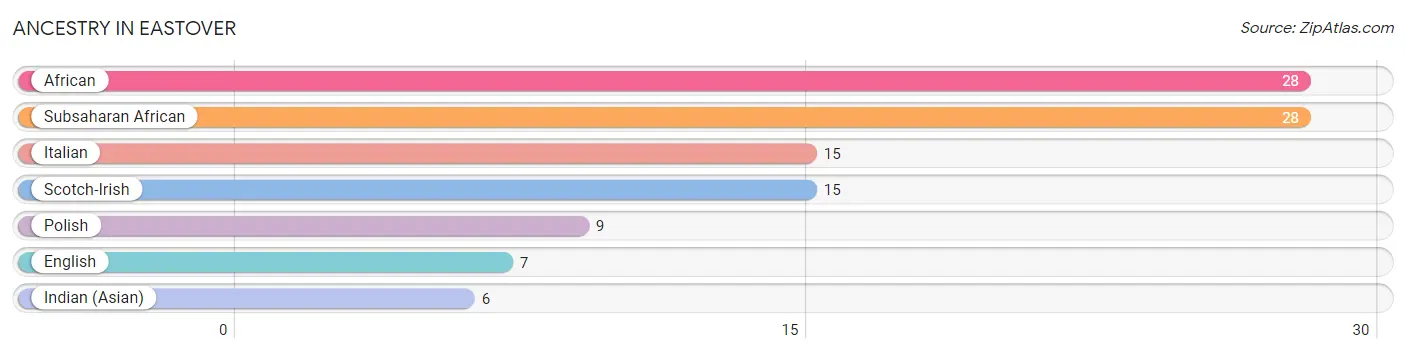
| Ancestry | # Population | % Population |
| African | 28 | 4.5% |
| English | 7 | 1.1% |
| Indian (Asian) | 6 | 1.0% |
| Italian | 15 | 2.4% |
| Polish | 9 | 1.5% |
| Scotch-Irish | 15 | 2.4% |
| Subsaharan African | 28 | 4.5% | View All 7 Rows |
Immigrants in Eastover
The most numerous immigrant groups reported in Eastover came from Asia (6 | 1.0%), China (6 | 1.0%), and Eastern Asia (6 | 1.0%), together accounting for 2.9% of all Eastover residents.
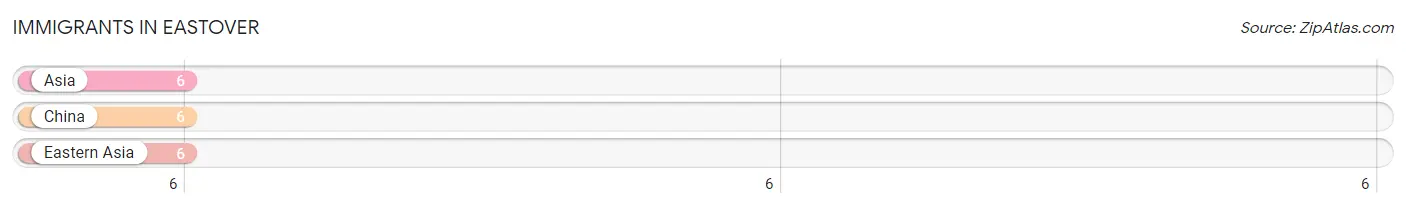
| Immigration Origin | # Population | % Population |
| Asia | 6 | 1.0% |
| China | 6 | 1.0% |
| Eastern Asia | 6 | 1.0% | View All 3 Rows |
Sex and Age in Eastover
Sex and Age in Eastover
The most populous age groups in Eastover are 70 to 74 Years (48 | 23.6%) for men and 35 to 39 Years (67 | 16.2%) for women.
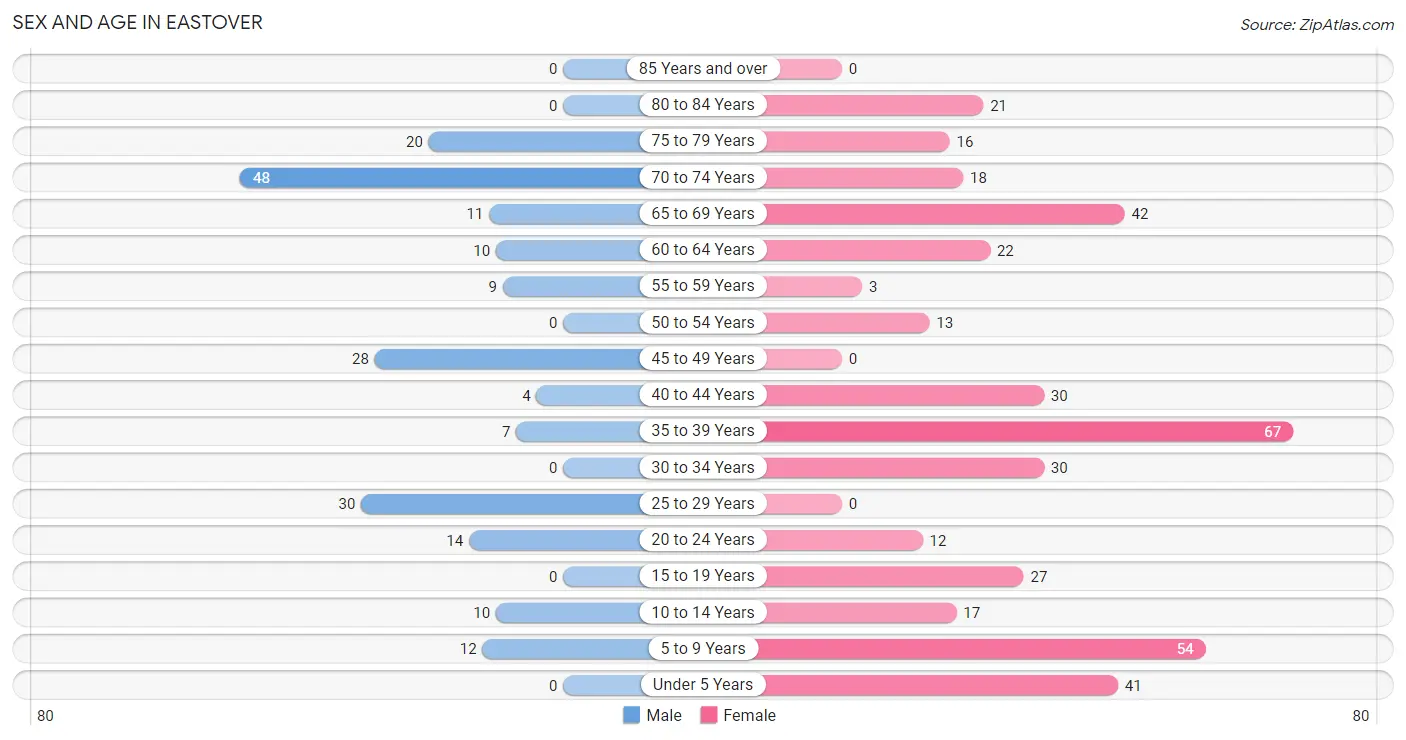
| Age Bracket | Male | Female |
| Under 5 Years | 0 (0.0%) | 41 (9.9%) |
| 5 to 9 Years | 12 (5.9%) | 54 (13.1%) |
| 10 to 14 Years | 10 (4.9%) | 17 (4.1%) |
| 15 to 19 Years | 0 (0.0%) | 27 (6.5%) |
| 20 to 24 Years | 14 (6.9%) | 12 (2.9%) |
| 25 to 29 Years | 30 (14.8%) | 0 (0.0%) |
| 30 to 34 Years | 0 (0.0%) | 30 (7.3%) |
| 35 to 39 Years | 7 (3.5%) | 67 (16.2%) |
| 40 to 44 Years | 4 (2.0%) | 30 (7.3%) |
| 45 to 49 Years | 28 (13.8%) | 0 (0.0%) |
| 50 to 54 Years | 0 (0.0%) | 13 (3.2%) |
| 55 to 59 Years | 9 (4.4%) | 3 (0.7%) |
| 60 to 64 Years | 10 (4.9%) | 22 (5.3%) |
| 65 to 69 Years | 11 (5.4%) | 42 (10.2%) |
| 70 to 74 Years | 48 (23.6%) | 18 (4.4%) |
| 75 to 79 Years | 20 (9.9%) | 16 (3.9%) |
| 80 to 84 Years | 0 (0.0%) | 21 (5.1%) |
| 85 Years and over | 0 (0.0%) | 0 (0.0%) |
| Total | 203 (100.0%) | 413 (100.0%) |
Families and Households in Eastover
Median Family Size in Eastover
The median family size in Eastover is 2.68 persons per family, with single male/father families (7 | 4.7%) accounting for the largest median family size of 3.43 persons per family. On the other hand, married-couple families (28 | 18.9%) represent the smallest median family size with 1.96 persons per family.
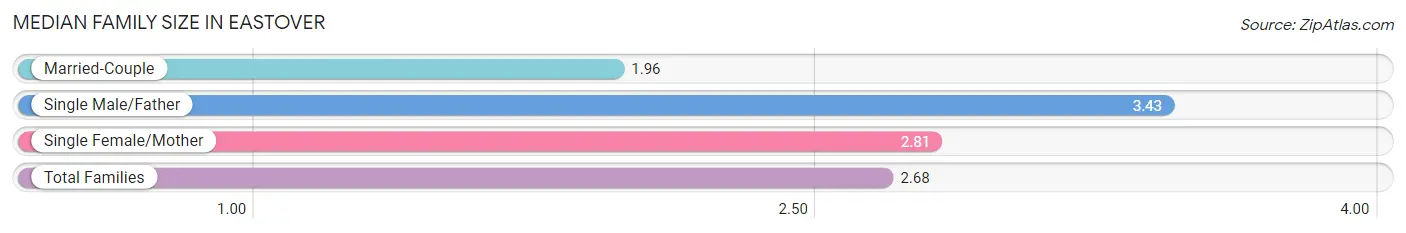
| Family Type | # Families | Family Size |
| Married-Couple | 28 (18.9%) | 1.96 |
| Single Male/Father | 7 (4.7%) | 3.43 |
| Single Female/Mother | 113 (76.3%) | 2.81 |
| Total Families | 148 (100.0%) | 2.68 |
Median Household Size in Eastover
The median household size in Eastover is 1.90 persons per household, with single male/father households (7 | 2.3%) accounting for the largest median household size of 4 persons per household. non-family households (159 | 51.8%) represent the smallest median household size with 1.15 persons per household.
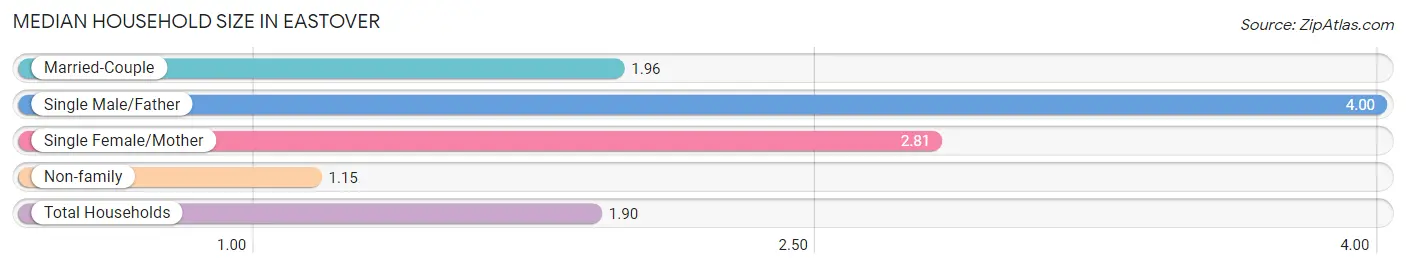
| Household Type | # Households | Household Size |
| Married-Couple | 28 (9.1%) | 1.96 |
| Single Male/Father | 7 (2.3%) | 4.00 |
| Single Female/Mother | 113 (36.8%) | 2.81 |
| Non-family | 159 (51.8%) | 1.15 |
| Total Households | 307 (100.0%) | 1.90 |
Household Size by Marriage Status in Eastover
Out of a total of 307 households in Eastover, 148 (48.2%) are family households, while 159 (51.8%) are nonfamily households. The most numerous type of family households are 2-person households, comprising 93, and the most common type of nonfamily households are 1-person households, comprising 138.
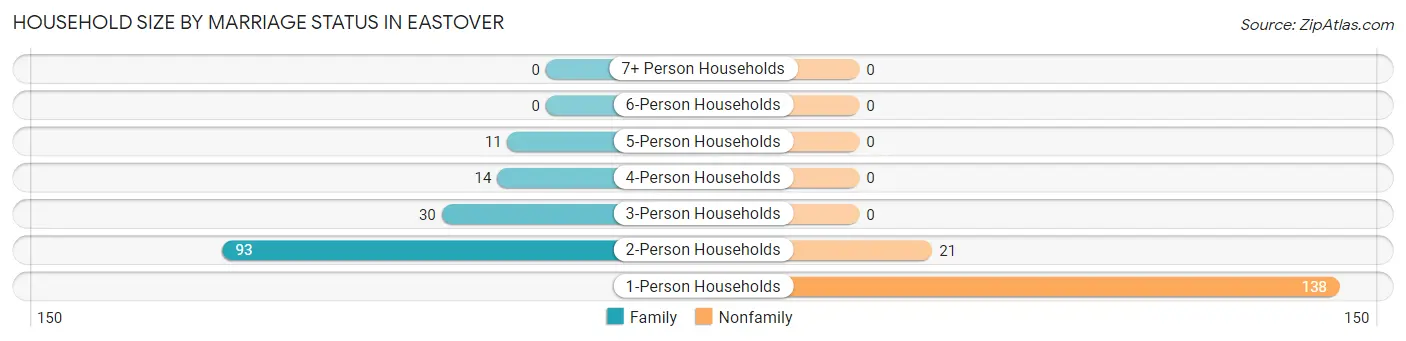
| Household Size | Family Households | Nonfamily Households |
| 1-Person Households | - | 138 (45.0%) |
| 2-Person Households | 93 (30.3%) | 21 (6.8%) |
| 3-Person Households | 30 (9.8%) | 0 (0.0%) |
| 4-Person Households | 14 (4.6%) | 0 (0.0%) |
| 5-Person Households | 11 (3.6%) | 0 (0.0%) |
| 6-Person Households | 0 (0.0%) | 0 (0.0%) |
| 7+ Person Households | 0 (0.0%) | 0 (0.0%) |
| Total | 148 (48.2%) | 159 (51.8%) |
Female Fertility in Eastover
Fertility by Age in Eastover
| Age Bracket | Women with Births | Births / 1,000 Women |
| 15 to 19 years | 0 (0.0%) | 0.0 |
| 20 to 34 years | 0 (0.0%) | 0.0 |
| 35 to 50 years | 0 (0.0%) | 0.0 |
| Total | 0 (0.0%) | 0.0 |
Fertility by Age by Marriage Status in Eastover
| Age Bracket | Married | Unmarried |
| 15 to 19 years | 0 (0.0%) | 0 (0.0%) |
| 20 to 34 years | 0 (0.0%) | 0 (0.0%) |
| 35 to 50 years | 0 (0.0%) | 0 (0.0%) |
| Total | 0 (0.0%) | 0 (0.0%) |
Fertility by Education in Eastover
| Educational Attainment | Women with Births | Births / 1,000 Women |
| Less than High School | 0 (0.0%) | 0.0 |
| High School Diploma | 0 (0.0%) | 0.0 |
| College or Associate's Degree | 0 (0.0%) | 0.0 |
| Bachelor's Degree | 0 (0.0%) | 0.0 |
| Graduate Degree | 0 (0.0%) | 0.0 |
| Total | 0 (0.0%) | 0.0 |
Fertility by Education by Marriage Status in Eastover
| Educational Attainment | Married | Unmarried |
| Less than High School | 0 (0.0%) | 0 (0.0%) |
| High School Diploma | 0 (0.0%) | 0 (0.0%) |
| College or Associate's Degree | 0 (0.0%) | 0 (0.0%) |
| Bachelor's Degree | 0 (0.0%) | 0 (0.0%) |
| Graduate Degree | 0 (0.0%) | 0 (0.0%) |
| Total | 0 (0.0%) | 0 (0.0%) |
Employment Characteristics in Eastover
Employment by Class of Employer in Eastover
Among the 209 employed individuals in Eastover, private company employees (165 | 78.9%), state government employees (16 | 7.7%), and federal government employees (16 | 7.7%) make up the most common classes of employment.
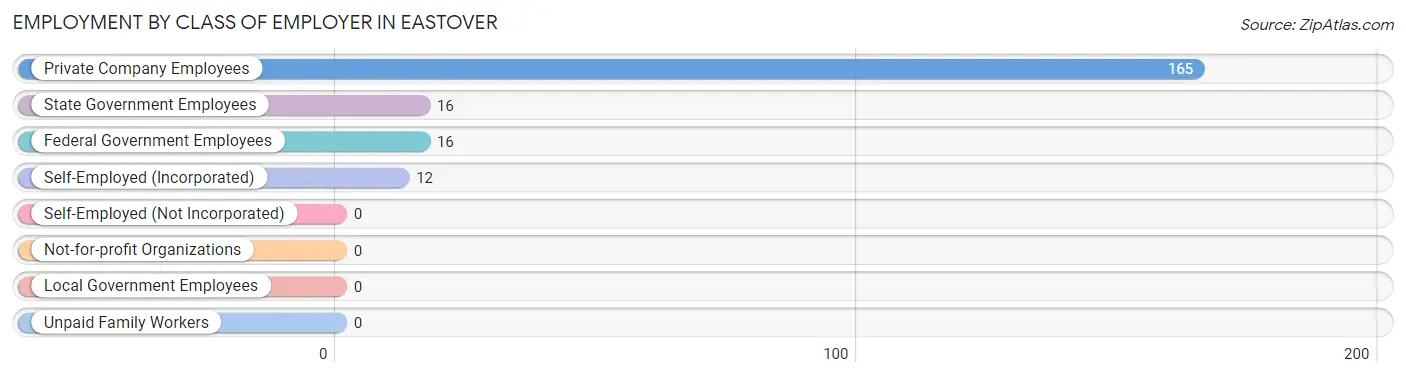
| Employer Class | # Employees | % Employees |
| Private Company Employees | 165 | 78.9% |
| Self-Employed (Incorporated) | 12 | 5.7% |
| Self-Employed (Not Incorporated) | 0 | 0.0% |
| Not-for-profit Organizations | 0 | 0.0% |
| Local Government Employees | 0 | 0.0% |
| State Government Employees | 16 | 7.7% |
| Federal Government Employees | 16 | 7.7% |
| Unpaid Family Workers | 0 | 0.0% |
| Total | 209 | 100.0% |
Employment Status by Age in Eastover
According to the labor force statistics for Eastover, out of the total population over 16 years of age (457), 52.3% or 239 individuals are in the labor force, with 12.6% or 30 of them unemployed. The age group with the highest labor force participation rate is 16 to 19 years, with 100.0% or 2 individuals in the labor force. Within the labor force, the 35 to 44 years age range has the highest percentage of unemployed individuals, with 29.7% or 30 of them being unemployed.
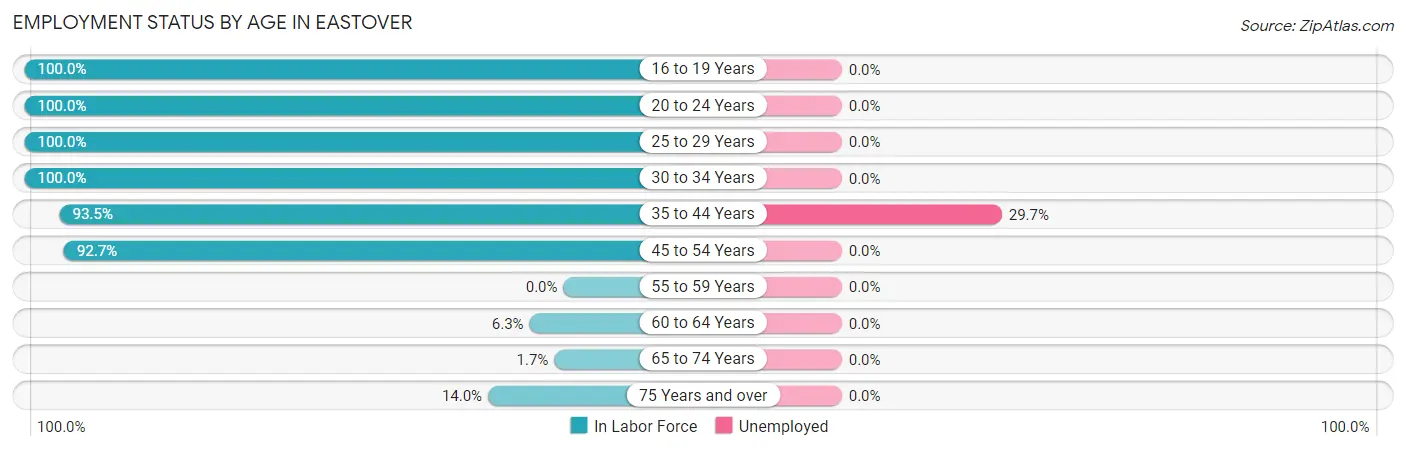
| Age Bracket | In Labor Force | Unemployed |
| 16 to 19 Years | 2 (100.0%) | 0 (0.0%) |
| 20 to 24 Years | 26 (100.0%) | 0 (0.0%) |
| 25 to 29 Years | 30 (100.0%) | 0 (0.0%) |
| 30 to 34 Years | 30 (100.0%) | 0 (0.0%) |
| 35 to 44 Years | 101 (93.5%) | 30 (29.7%) |
| 45 to 54 Years | 38 (92.7%) | 0 (0.0%) |
| 55 to 59 Years | 0 (0.0%) | 0 (0.0%) |
| 60 to 64 Years | 2 (6.3%) | 0 (0.0%) |
| 65 to 74 Years | 2 (1.7%) | 0 (0.0%) |
| 75 Years and over | 8 (14.0%) | 0 (0.0%) |
| Total | 239 (52.3%) | 30 (12.6%) |
Employment Status by Educational Attainment in Eastover
According to labor force statistics for Eastover, 79.4% of individuals (201) out of the total population between 25 and 64 years of age (253) are in the labor force, with 14.9% or 30 of them being unemployed. The group with the highest labor force participation rate are those with the educational attainment of college / associate degree, with 90.8% or 59 individuals in the labor force. Within the labor force, individuals with less than high school education have the highest percentage of unemployment, with 46.9% or 30 of them being unemployed.
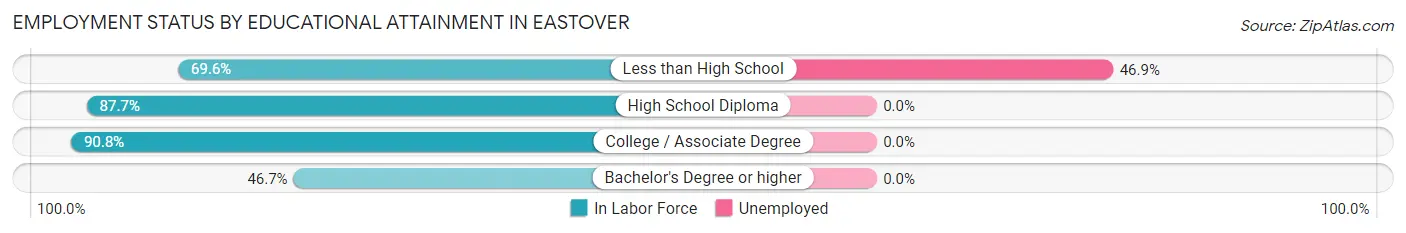
| Educational Attainment | In Labor Force | Unemployed |
| Less than High School | 64 (69.6%) | 43 (46.9%) |
| High School Diploma | 71 (87.7%) | 0 (0.0%) |
| College / Associate Degree | 59 (90.8%) | 0 (0.0%) |
| Bachelor's Degree or higher | 7 (46.7%) | 0 (0.0%) |
| Total | 201 (79.4%) | 38 (14.9%) |
Employment Occupations by Sex in Eastover
Management, Business, Science and Arts Occupations
The most common Management, Business, Science and Arts occupations in Eastover are Health Diagnosing & Treating (12 | 5.7%), Computers, Engineering & Science (7 | 3.4%), and Computers & Mathematics (7 | 3.4%).
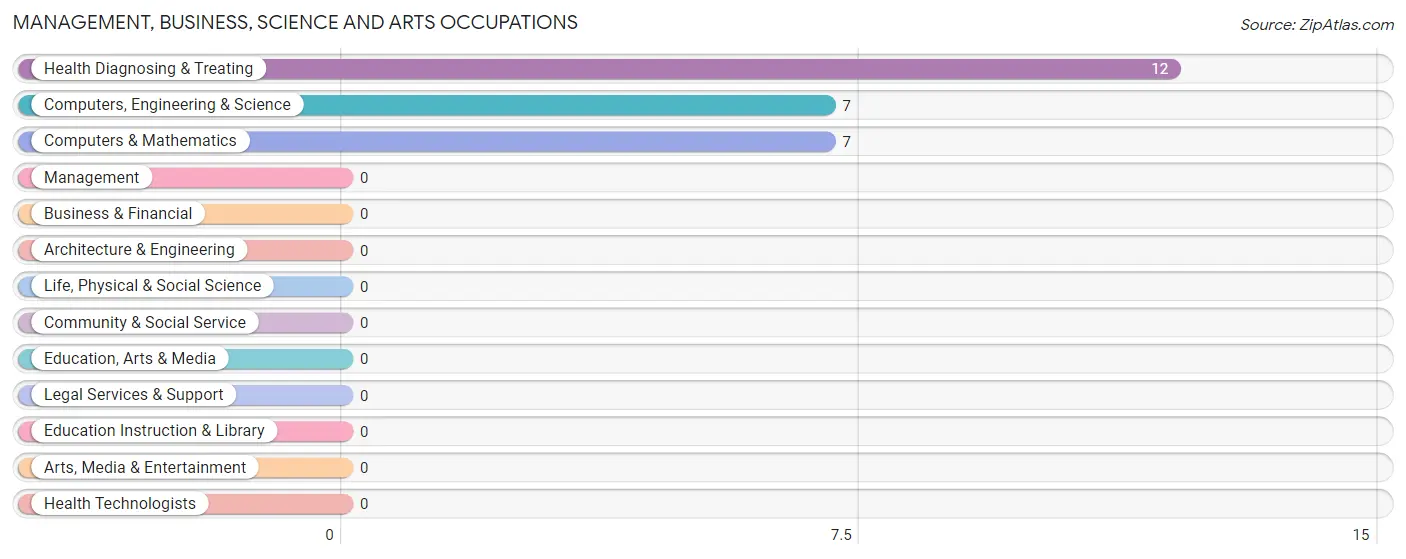
Management, Business, Science and Arts Occupations by Sex
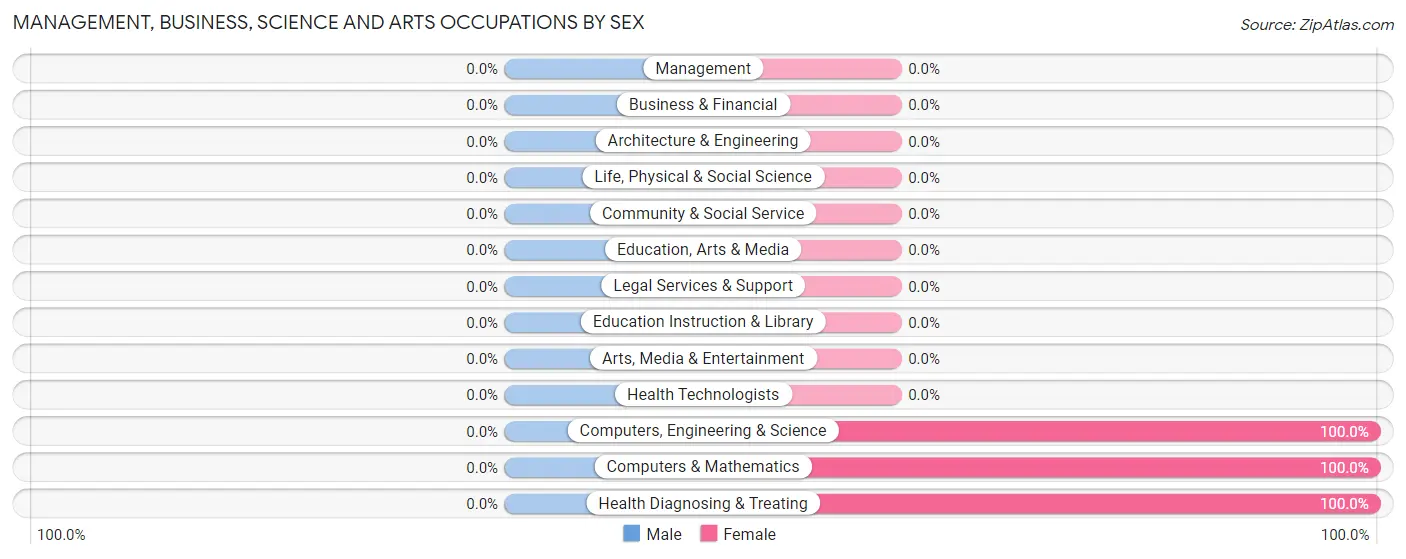
| Occupation | Male | Female |
| Management | 0 (0.0%) | 0 (0.0%) |
| Business & Financial | 0 (0.0%) | 0 (0.0%) |
| Computers, Engineering & Science | 0 (0.0%) | 7 (100.0%) |
| Computers & Mathematics | 0 (0.0%) | 7 (100.0%) |
| Architecture & Engineering | 0 (0.0%) | 0 (0.0%) |
| Life, Physical & Social Science | 0 (0.0%) | 0 (0.0%) |
| Community & Social Service | 0 (0.0%) | 0 (0.0%) |
| Education, Arts & Media | 0 (0.0%) | 0 (0.0%) |
| Legal Services & Support | 0 (0.0%) | 0 (0.0%) |
| Education Instruction & Library | 0 (0.0%) | 0 (0.0%) |
| Arts, Media & Entertainment | 0 (0.0%) | 0 (0.0%) |
| Health Diagnosing & Treating | 0 (0.0%) | 12 (100.0%) |
| Health Technologists | 0 (0.0%) | 0 (0.0%) |
| Total (Category) | 0 (0.0%) | 19 (100.0%) |
| Total (Overall) | 86 (41.1%) | 123 (58.9%) |
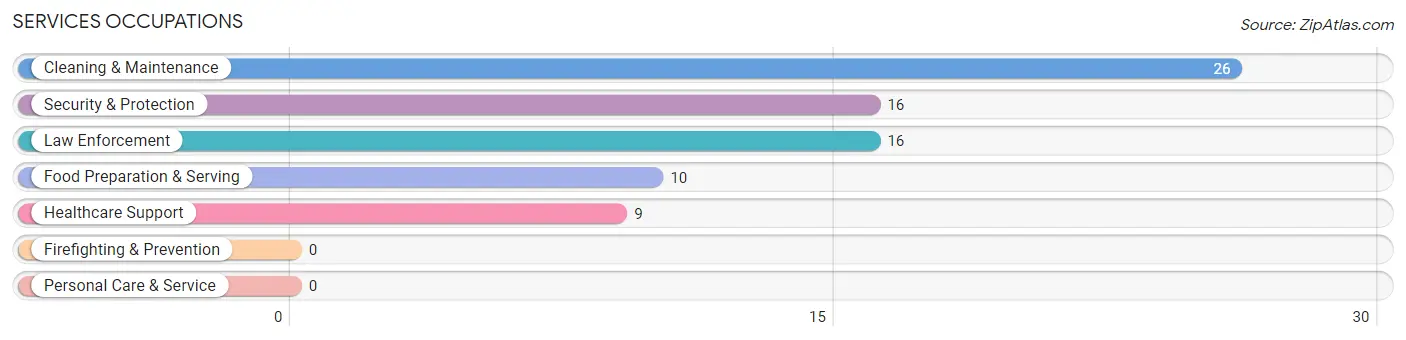
Services Occupations
The most common Services occupations in Eastover are Cleaning & Maintenance (26 | 12.4%), Security & Protection (16 | 7.7%), Law Enforcement (16 | 7.7%), Food Preparation & Serving (10 | 4.8%), and Healthcare Support (9 | 4.3%).
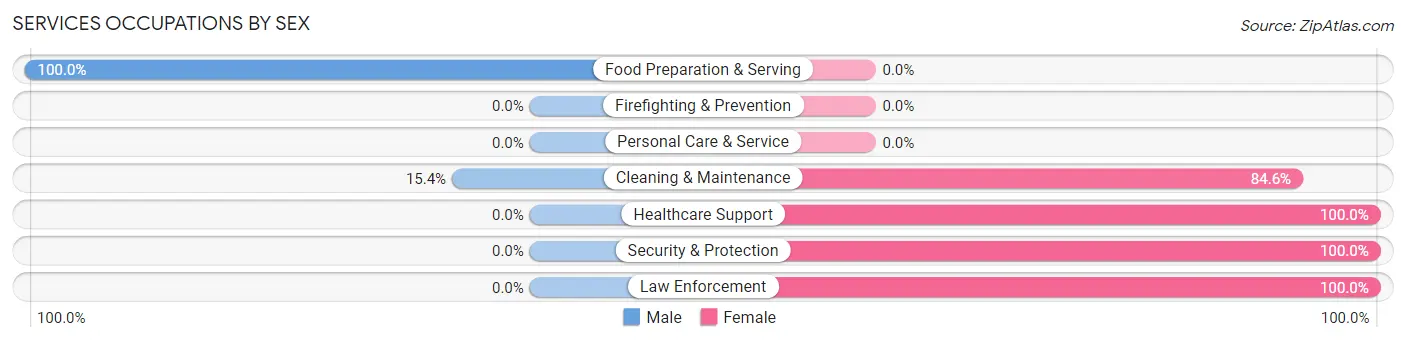
Services Occupations by Sex
Within the Services occupations in Eastover, the most male-oriented occupations are Food Preparation & Serving (100.0%), and Cleaning & Maintenance (15.4%), while the most female-oriented occupations are Healthcare Support (100.0%), Security & Protection (100.0%), and Law Enforcement (100.0%).
| Occupation | Male | Female |
| Healthcare Support | 0 (0.0%) | 9 (100.0%) |
| Security & Protection | 0 (0.0%) | 16 (100.0%) |
| Firefighting & Prevention | 0 (0.0%) | 0 (0.0%) |
| Law Enforcement | 0 (0.0%) | 16 (100.0%) |
| Food Preparation & Serving | 10 (100.0%) | 0 (0.0%) |
| Cleaning & Maintenance | 4 (15.4%) | 22 (84.6%) |
| Personal Care & Service | 0 (0.0%) | 0 (0.0%) |
| Total (Category) | 14 (23.0%) | 47 (77.0%) |
| Total (Overall) | 86 (41.1%) | 123 (58.9%) |
Sales and Office Occupations
The most common Sales and Office occupations in Eastover are Office & Administration (27 | 12.9%), and Sales & Related (9 | 4.3%).
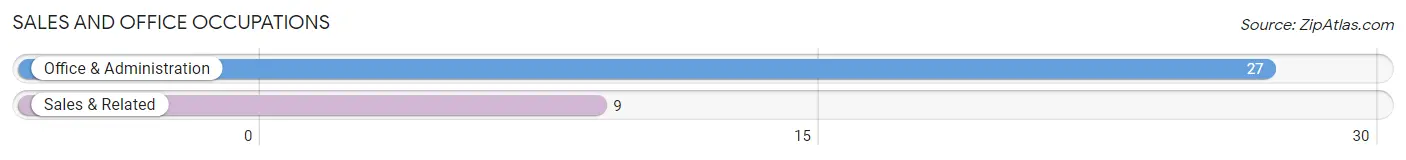
Sales and Office Occupations by Sex
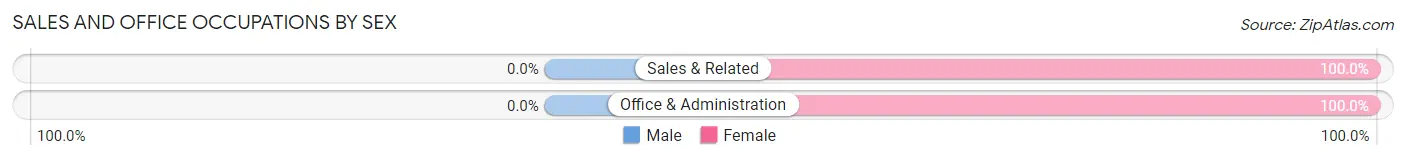
| Occupation | Male | Female |
| Sales & Related | 0 (0.0%) | 9 (100.0%) |
| Office & Administration | 0 (0.0%) | 27 (100.0%) |
| Total (Category) | 0 (0.0%) | 36 (100.0%) |
| Total (Overall) | 86 (41.1%) | 123 (58.9%) |
Natural Resources, Construction and Maintenance Occupations
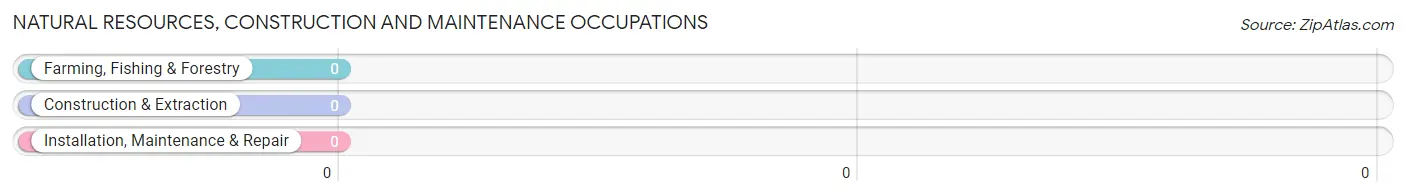
Natural Resources, Construction and Maintenance Occupations by Sex
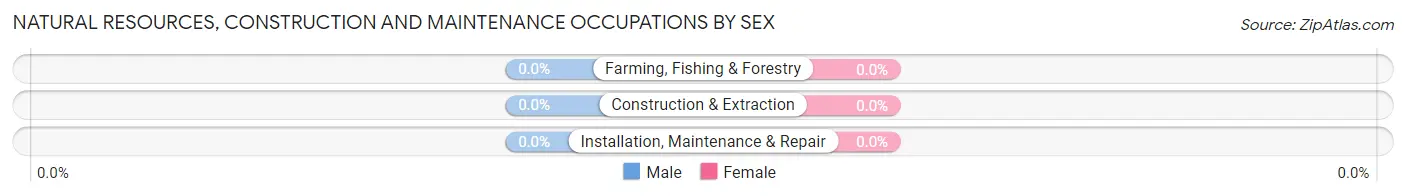
| Occupation | Male | Female |
| Farming, Fishing & Forestry | 0 (0.0%) | 0 (0.0%) |
| Construction & Extraction | 0 (0.0%) | 0 (0.0%) |
| Installation, Maintenance & Repair | 0 (0.0%) | 0 (0.0%) |
| Total (Category) | 0 (0.0%) | 0 (0.0%) |
| Total (Overall) | 86 (41.1%) | 123 (58.9%) |
Production, Transportation and Moving Occupations
The most common Production, Transportation and Moving occupations in Eastover are Transportation (36 | 17.2%), Material Moving (31 | 14.8%), and Production (26 | 12.4%).
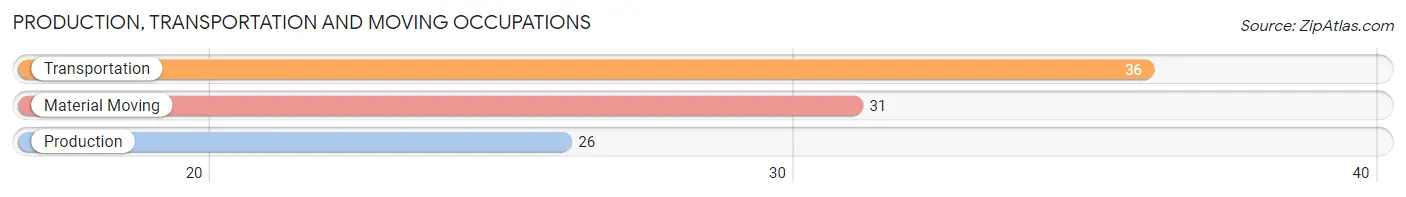
Production, Transportation and Moving Occupations by Sex
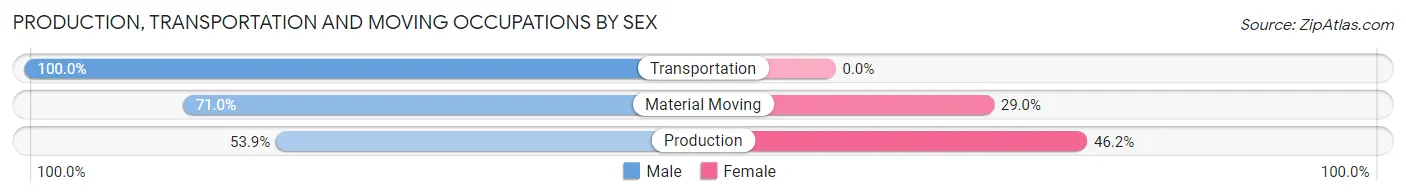
| Occupation | Male | Female |
| Production | 14 (53.8%) | 12 (46.2%) |
| Transportation | 36 (100.0%) | 0 (0.0%) |
| Material Moving | 22 (71.0%) | 9 (29.0%) |
| Total (Category) | 72 (77.4%) | 21 (22.6%) |
| Total (Overall) | 86 (41.1%) | 123 (58.9%) |
Employment Industries by Sex in Eastover
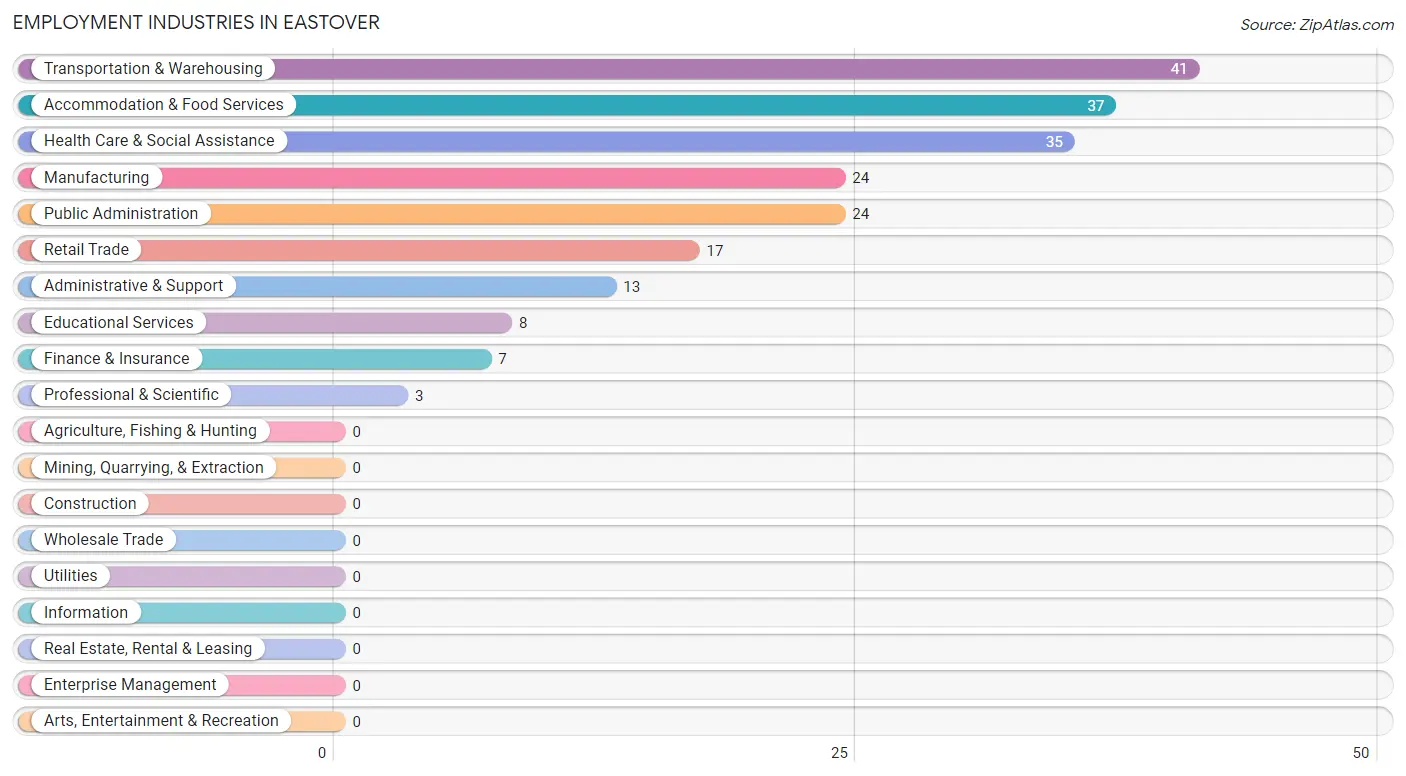
Employment Industries in Eastover
The major employment industries in Eastover include Transportation & Warehousing (41 | 19.6%), Accommodation & Food Services (37 | 17.7%), Health Care & Social Assistance (35 | 16.8%), Manufacturing (24 | 11.5%), and Public Administration (24 | 11.5%).
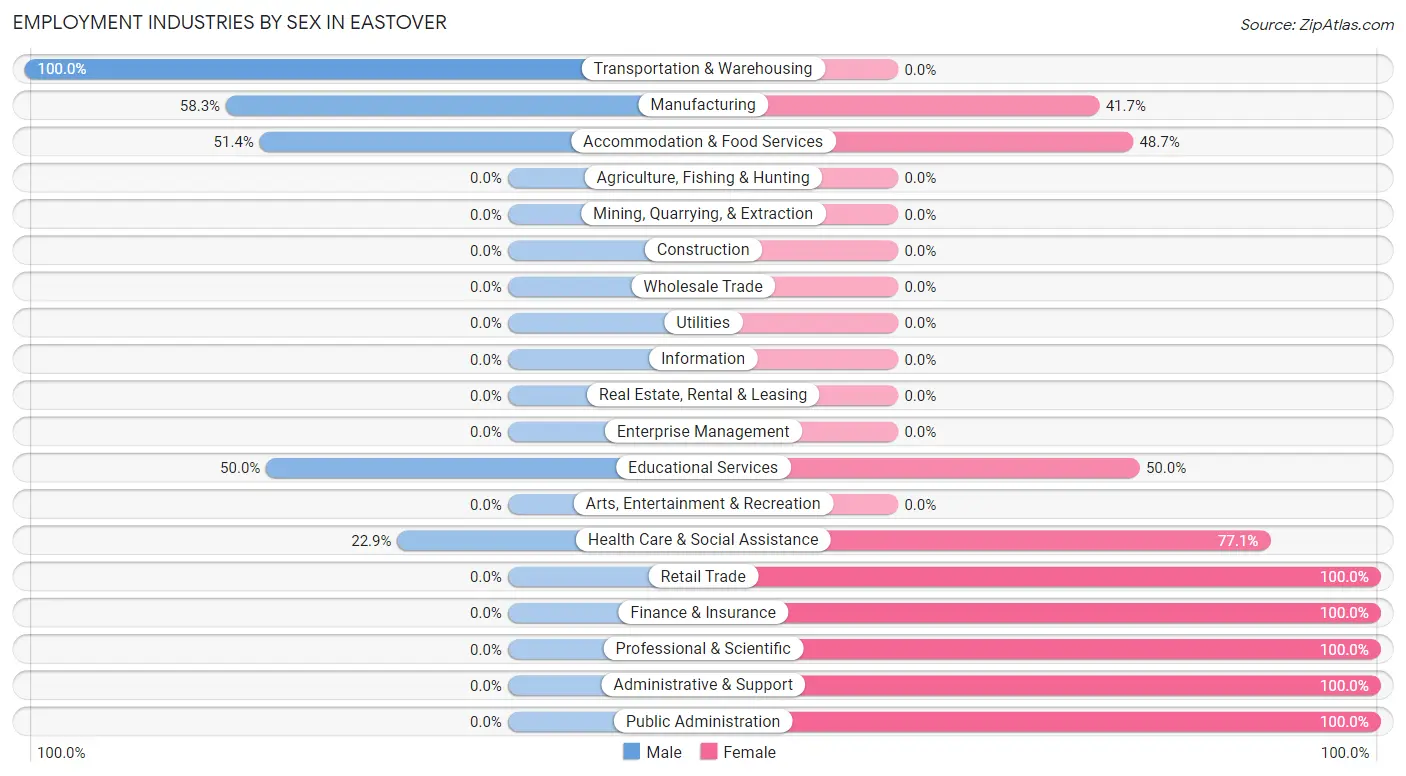
Employment Industries by Sex in Eastover
The Eastover industries that see more men than women are Transportation & Warehousing (100.0%), Manufacturing (58.3%), and Accommodation & Food Services (51.3%), whereas the industries that tend to have a higher number of women are Retail Trade (100.0%), Finance & Insurance (100.0%), and Professional & Scientific (100.0%).
| Industry | Male | Female |
| Agriculture, Fishing & Hunting | 0 (0.0%) | 0 (0.0%) |
| Mining, Quarrying, & Extraction | 0 (0.0%) | 0 (0.0%) |
| Construction | 0 (0.0%) | 0 (0.0%) |
| Manufacturing | 14 (58.3%) | 10 (41.7%) |
| Wholesale Trade | 0 (0.0%) | 0 (0.0%) |
| Retail Trade | 0 (0.0%) | 17 (100.0%) |
| Transportation & Warehousing | 41 (100.0%) | 0 (0.0%) |
| Utilities | 0 (0.0%) | 0 (0.0%) |
| Information | 0 (0.0%) | 0 (0.0%) |
| Finance & Insurance | 0 (0.0%) | 7 (100.0%) |
| Real Estate, Rental & Leasing | 0 (0.0%) | 0 (0.0%) |
| Professional & Scientific | 0 (0.0%) | 3 (100.0%) |
| Enterprise Management | 0 (0.0%) | 0 (0.0%) |
| Administrative & Support | 0 (0.0%) | 13 (100.0%) |
| Educational Services | 4 (50.0%) | 4 (50.0%) |
| Health Care & Social Assistance | 8 (22.9%) | 27 (77.1%) |
| Arts, Entertainment & Recreation | 0 (0.0%) | 0 (0.0%) |
| Accommodation & Food Services | 19 (51.3%) | 18 (48.6%) |
| Public Administration | 0 (0.0%) | 24 (100.0%) |
| Total | 86 (41.1%) | 123 (58.9%) |
Education in Eastover
School Enrollment in Eastover
The most common levels of schooling among the 164 students in Eastover are elementary school (70 | 42.7%), nursery / preschool (41 | 25.0%), and high school (32 | 19.5%).
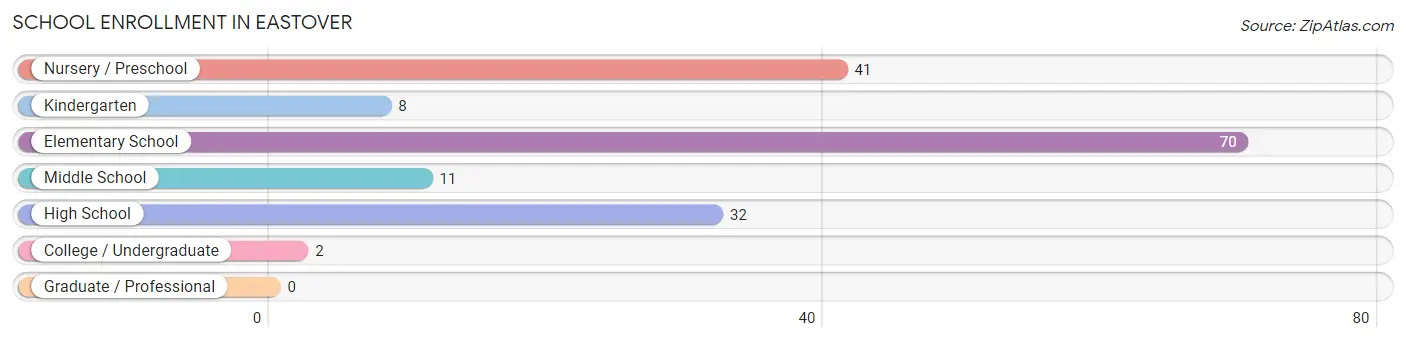
| School Level | # Students | % Students |
| Nursery / Preschool | 41 | 25.0% |
| Kindergarten | 8 | 4.9% |
| Elementary School | 70 | 42.7% |
| Middle School | 11 | 6.7% |
| High School | 32 | 19.5% |
| College / Undergraduate | 2 | 1.2% |
| Graduate / Professional | 0 | 0.0% |
| Total | 164 | 100.0% |
School Enrollment by Age by Funding Source in Eastover
Out of a total of 164 students who are enrolled in schools in Eastover, 14 (8.5%) attend a private institution, while the remaining 150 (91.5%) are enrolled in public schools. The age group of 3 to 4 year olds has the highest likelihood of being enrolled in private schools, with 6 (14.6% in the age bracket) enrolled. Conversely, the age group of 10 to 14 year olds has the lowest likelihood of being enrolled in a private school, with 27 (100.0% in the age bracket) attending a public institution.
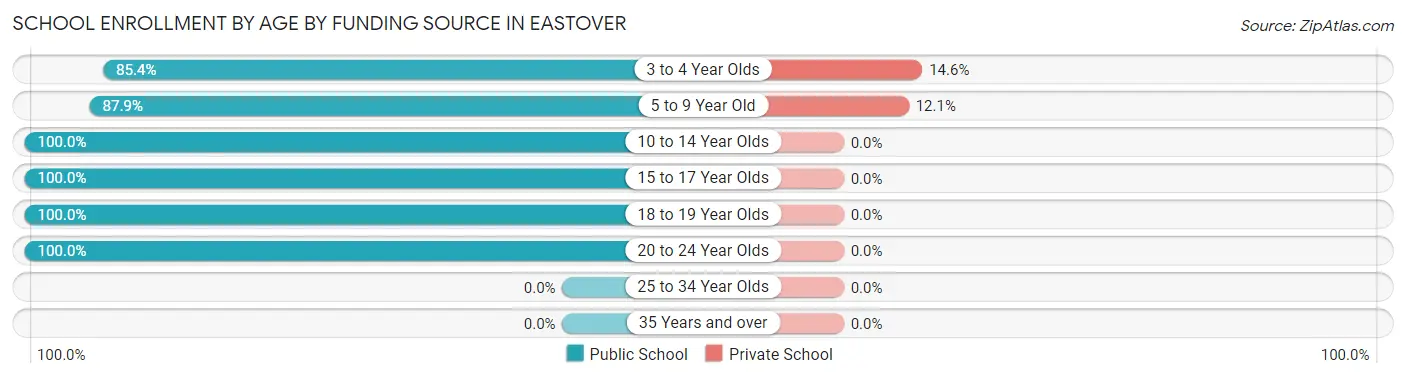
| Age Bracket | Public School | Private School |
| 3 to 4 Year Olds | 35 (85.4%) | 6 (14.6%) |
| 5 to 9 Year Old | 58 (87.9%) | 8 (12.1%) |
| 10 to 14 Year Olds | 27 (100.0%) | 0 (0.0%) |
| 15 to 17 Year Olds | 25 (100.0%) | 0 (0.0%) |
| 18 to 19 Year Olds | 2 (100.0%) | 0 (0.0%) |
| 20 to 24 Year Olds | 3 (100.0%) | 0 (0.0%) |
| 25 to 34 Year Olds | 0 (0.0%) | 0 (0.0%) |
| 35 Years and over | 0 (0.0%) | 0 (0.0%) |
| Total | 150 (91.5%) | 14 (8.5%) |
Educational Attainment by Field of Study in Eastover
Business (7 | 46.7%), computers & mathematics (6 | 40.0%), and education (2 | 13.3%) are the most common fields of study among 15 individuals in Eastover who have obtained a bachelor's degree or higher.
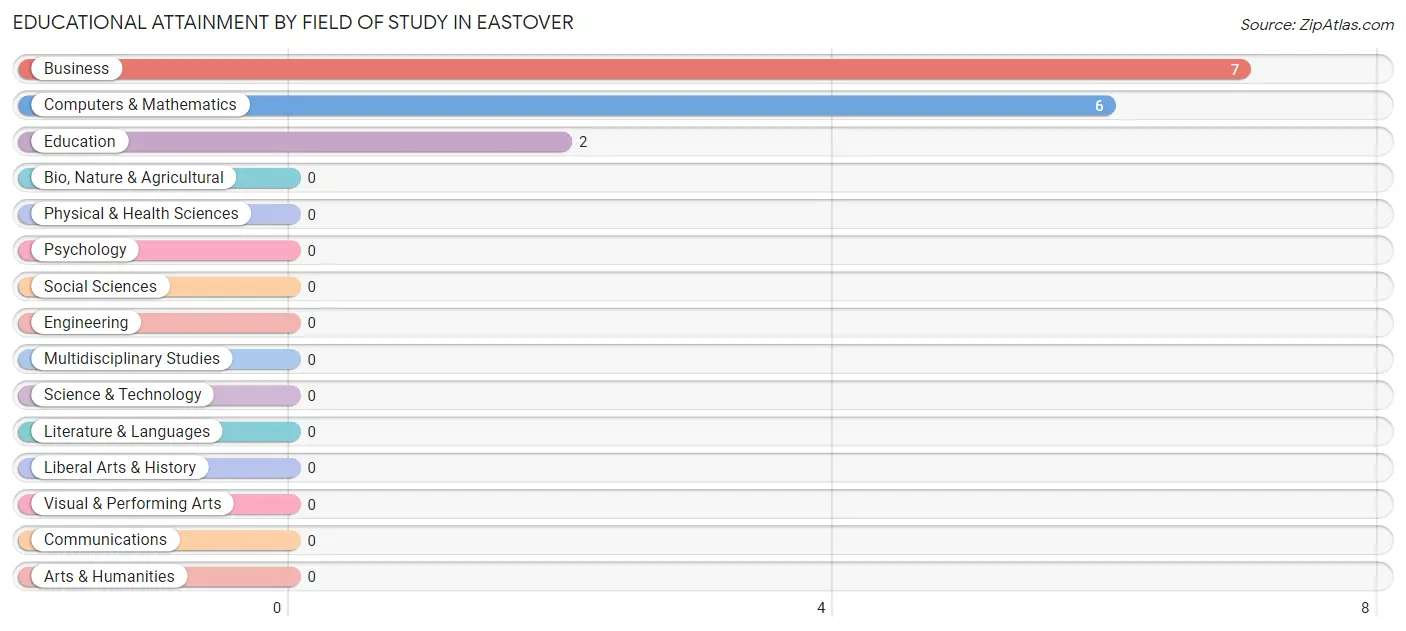
| Field of Study | # Graduates | % Graduates |
| Computers & Mathematics | 6 | 40.0% |
| Bio, Nature & Agricultural | 0 | 0.0% |
| Physical & Health Sciences | 0 | 0.0% |
| Psychology | 0 | 0.0% |
| Social Sciences | 0 | 0.0% |
| Engineering | 0 | 0.0% |
| Multidisciplinary Studies | 0 | 0.0% |
| Science & Technology | 0 | 0.0% |
| Business | 7 | 46.7% |
| Education | 2 | 13.3% |
| Literature & Languages | 0 | 0.0% |
| Liberal Arts & History | 0 | 0.0% |
| Visual & Performing Arts | 0 | 0.0% |
| Communications | 0 | 0.0% |
| Arts & Humanities | 0 | 0.0% |
| Total | 15 | 100.0% |
Transportation & Commute in Eastover
Vehicle Availability by Sex in Eastover
The most prevalent vehicle ownership categories in Eastover are males with 2 vehicles (40, accounting for 46.5%) and females with 2 vehicles (20, making up 32.5%).
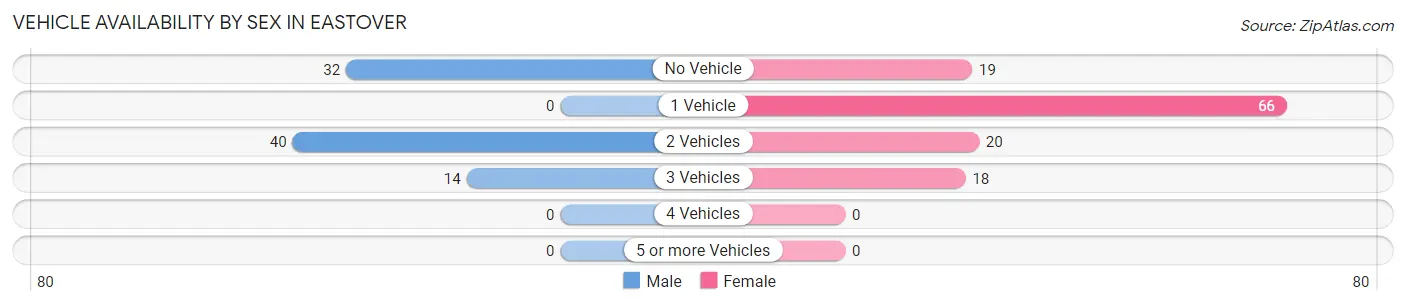
| Vehicles Available | Male | Female |
| No Vehicle | 32 (37.2%) | 19 (15.4%) |
| 1 Vehicle | 0 (0.0%) | 66 (53.7%) |
| 2 Vehicles | 40 (46.5%) | 20 (16.3%) |
| 3 Vehicles | 14 (16.3%) | 18 (14.6%) |
| 4 Vehicles | 0 (0.0%) | 0 (0.0%) |
| 5 or more Vehicles | 0 (0.0%) | 0 (0.0%) |
| Total | 86 (100.0%) | 123 (100.0%) |
Commute Time in Eastover
The most frequently occuring commute durations in Eastover are 45 to 59 minutes (43 commuters, 21.9%), 30 to 34 minutes (38 commuters, 19.4%), and 20 to 24 minutes (32 commuters, 16.3%).
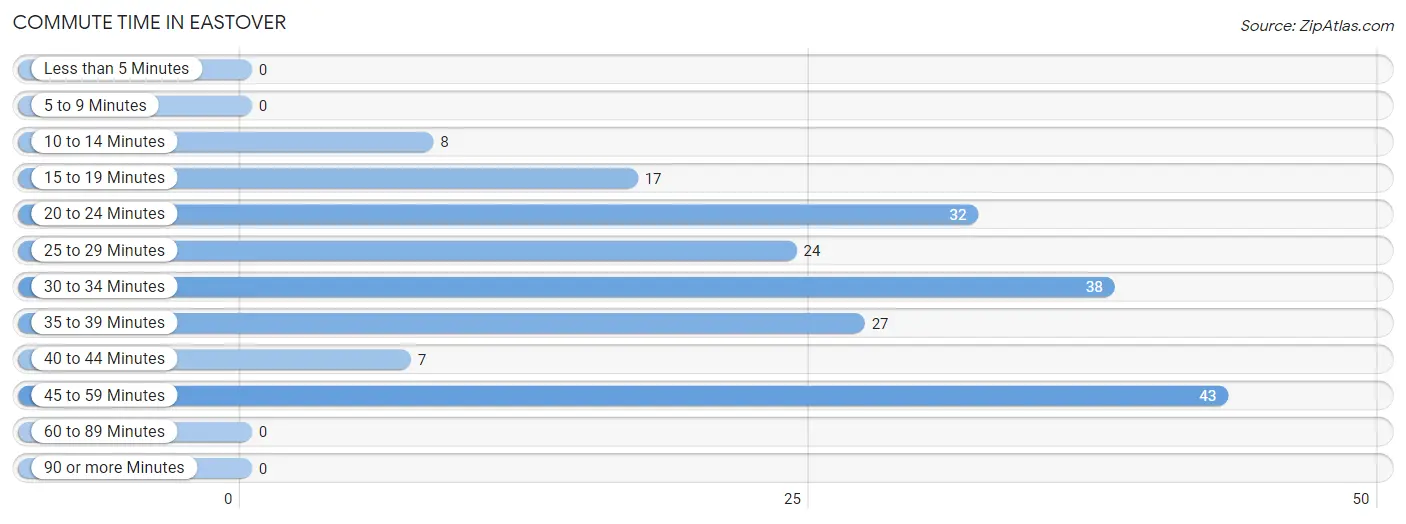
| Commute Time | # Commuters | % Commuters |
| Less than 5 Minutes | 0 | 0.0% |
| 5 to 9 Minutes | 0 | 0.0% |
| 10 to 14 Minutes | 8 | 4.1% |
| 15 to 19 Minutes | 17 | 8.7% |
| 20 to 24 Minutes | 32 | 16.3% |
| 25 to 29 Minutes | 24 | 12.2% |
| 30 to 34 Minutes | 38 | 19.4% |
| 35 to 39 Minutes | 27 | 13.8% |
| 40 to 44 Minutes | 7 | 3.6% |
| 45 to 59 Minutes | 43 | 21.9% |
| 60 to 89 Minutes | 0 | 0.0% |
| 90 or more Minutes | 0 | 0.0% |
Commute Time by Sex in Eastover
The most common commute times in Eastover are 45 to 59 minutes (30 commuters, 34.9%) for males and 20 to 24 minutes (32 commuters, 29.1%) for females.
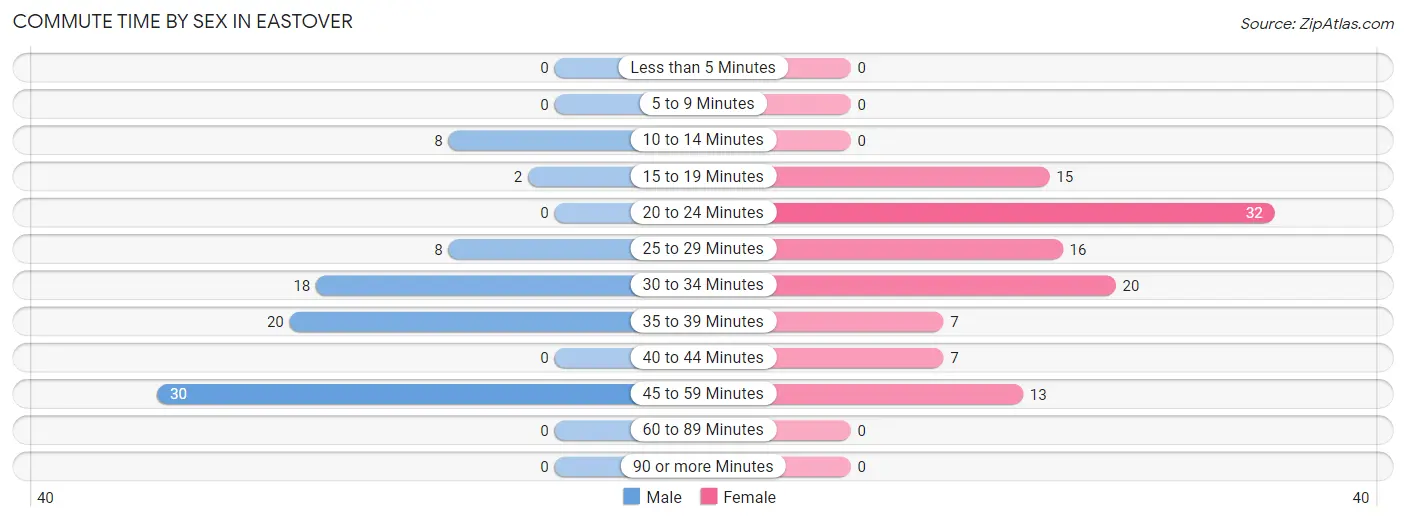
| Commute Time | Male | Female |
| Less than 5 Minutes | 0 (0.0%) | 0 (0.0%) |
| 5 to 9 Minutes | 0 (0.0%) | 0 (0.0%) |
| 10 to 14 Minutes | 8 (9.3%) | 0 (0.0%) |
| 15 to 19 Minutes | 2 (2.3%) | 15 (13.6%) |
| 20 to 24 Minutes | 0 (0.0%) | 32 (29.1%) |
| 25 to 29 Minutes | 8 (9.3%) | 16 (14.5%) |
| 30 to 34 Minutes | 18 (20.9%) | 20 (18.2%) |
| 35 to 39 Minutes | 20 (23.3%) | 7 (6.4%) |
| 40 to 44 Minutes | 0 (0.0%) | 7 (6.4%) |
| 45 to 59 Minutes | 30 (34.9%) | 13 (11.8%) |
| 60 to 89 Minutes | 0 (0.0%) | 0 (0.0%) |
| 90 or more Minutes | 0 (0.0%) | 0 (0.0%) |
Time of Departure to Work by Sex in Eastover
The most frequent times of departure to work in Eastover are 6:30 AM to 6:59 AM (34, 39.5%) for males and 12:00 PM to 3:59 PM (26, 23.6%) for females.
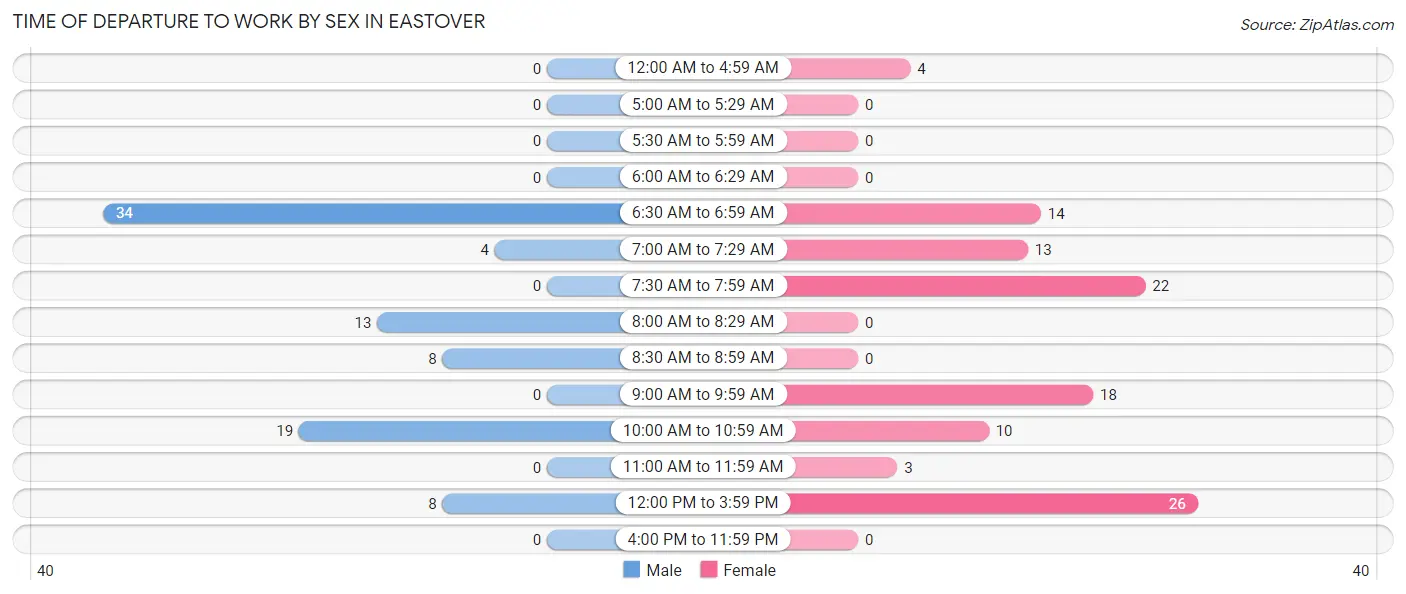
| Time of Departure | Male | Female |
| 12:00 AM to 4:59 AM | 0 (0.0%) | 4 (3.6%) |
| 5:00 AM to 5:29 AM | 0 (0.0%) | 0 (0.0%) |
| 5:30 AM to 5:59 AM | 0 (0.0%) | 0 (0.0%) |
| 6:00 AM to 6:29 AM | 0 (0.0%) | 0 (0.0%) |
| 6:30 AM to 6:59 AM | 34 (39.5%) | 14 (12.7%) |
| 7:00 AM to 7:29 AM | 4 (4.6%) | 13 (11.8%) |
| 7:30 AM to 7:59 AM | 0 (0.0%) | 22 (20.0%) |
| 8:00 AM to 8:29 AM | 13 (15.1%) | 0 (0.0%) |
| 8:30 AM to 8:59 AM | 8 (9.3%) | 0 (0.0%) |
| 9:00 AM to 9:59 AM | 0 (0.0%) | 18 (16.4%) |
| 10:00 AM to 10:59 AM | 19 (22.1%) | 10 (9.1%) |
| 11:00 AM to 11:59 AM | 0 (0.0%) | 3 (2.7%) |
| 12:00 PM to 3:59 PM | 8 (9.3%) | 26 (23.6%) |
| 4:00 PM to 11:59 PM | 0 (0.0%) | 0 (0.0%) |
| Total | 86 (100.0%) | 110 (100.0%) |
Housing Occupancy in Eastover
Occupancy by Ownership in Eastover
Of the total 307 dwellings in Eastover, owner-occupied units account for 165 (53.7%), while renter-occupied units make up 142 (46.3%).
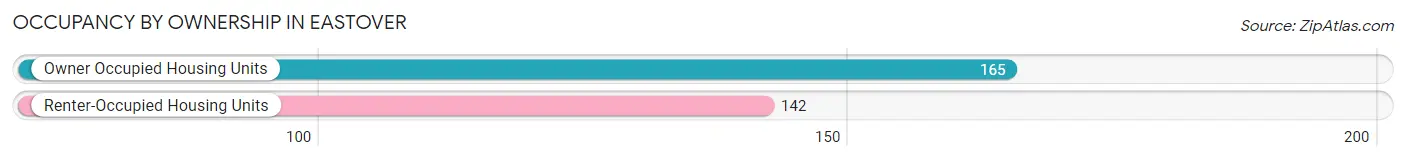
| Occupancy | # Housing Units | % Housing Units |
| Owner Occupied Housing Units | 165 | 53.7% |
| Renter-Occupied Housing Units | 142 | 46.3% |
| Total Occupied Housing Units | 307 | 100.0% |
Occupancy by Household Size in Eastover
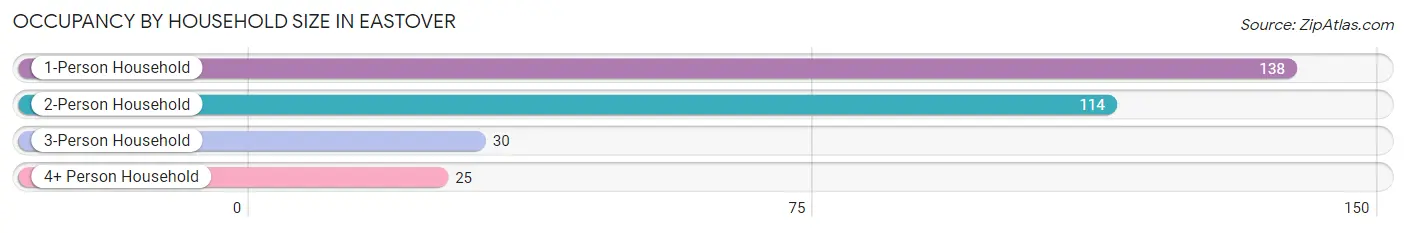
| Household Size | # Housing Units | % Housing Units |
| 1-Person Household | 138 | 45.0% |
| 2-Person Household | 114 | 37.1% |
| 3-Person Household | 30 | 9.8% |
| 4+ Person Household | 25 | 8.1% |
| Total Housing Units | 307 | 100.0% |
Occupancy by Ownership by Household Size in Eastover
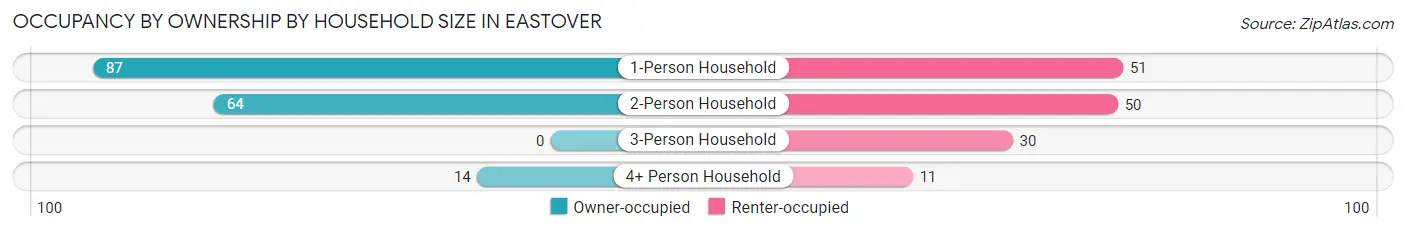
| Household Size | Owner-occupied | Renter-occupied |
| 1-Person Household | 87 (63.0%) | 51 (37.0%) |
| 2-Person Household | 64 (56.1%) | 50 (43.9%) |
| 3-Person Household | 0 (0.0%) | 30 (100.0%) |
| 4+ Person Household | 14 (56.0%) | 11 (44.0%) |
| Total Housing Units | 165 (53.7%) | 142 (46.3%) |
Occupancy by Educational Attainment in Eastover
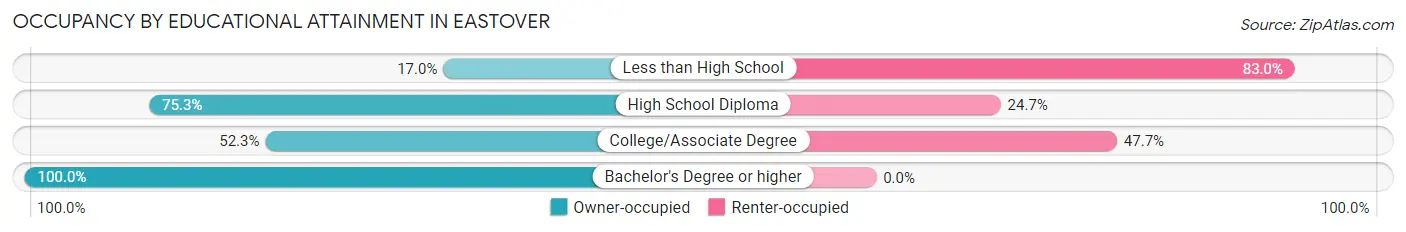
| Household Size | Owner-occupied | Renter-occupied |
| Less than High School | 17 (17.0%) | 83 (83.0%) |
| High School Diploma | 116 (75.3%) | 38 (24.7%) |
| College/Associate Degree | 23 (52.3%) | 21 (47.7%) |
| Bachelor's Degree or higher | 9 (100.0%) | 0 (0.0%) |
Occupancy by Age of Householder in Eastover
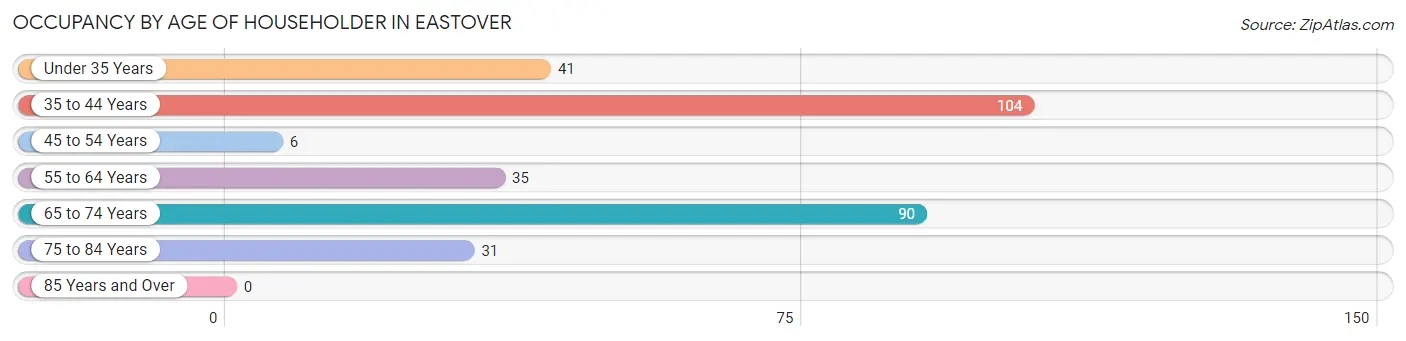
| Age Bracket | # Households | % Households |
| Under 35 Years | 41 | 13.4% |
| 35 to 44 Years | 104 | 33.9% |
| 45 to 54 Years | 6 | 1.9% |
| 55 to 64 Years | 35 | 11.4% |
| 65 to 74 Years | 90 | 29.3% |
| 75 to 84 Years | 31 | 10.1% |
| 85 Years and Over | 0 | 0.0% |
| Total | 307 | 100.0% |
Housing Finances in Eastover
Median Income by Occupancy in Eastover
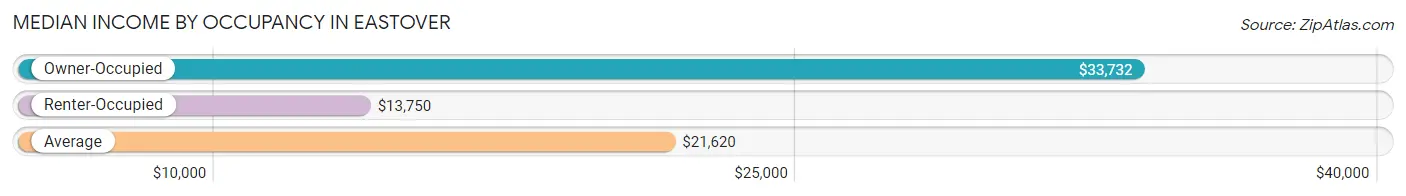
| Occupancy Type | # Households | Median Income |
| Owner-Occupied | 165 (53.7%) | $33,732 |
| Renter-Occupied | 142 (46.3%) | $13,750 |
| Average | 307 (100.0%) | $21,620 |
Occupancy by Householder Income Bracket in Eastover
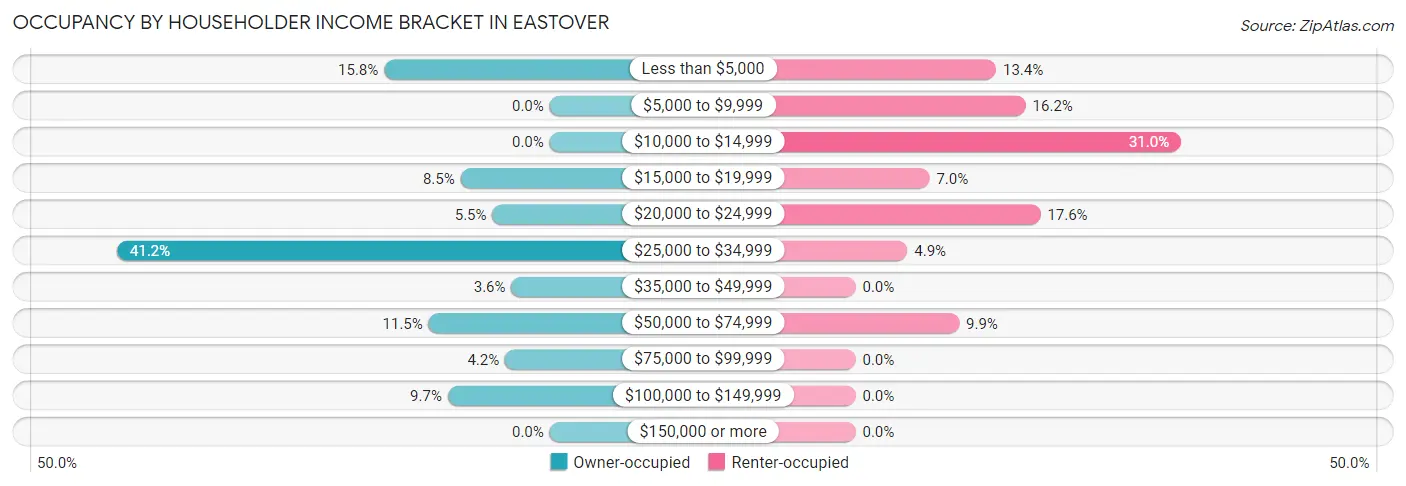
| Income Bracket | Owner-occupied | Renter-occupied |
| Less than $5,000 | 26 (15.8%) | 19 (13.4%) |
| $5,000 to $9,999 | 0 (0.0%) | 23 (16.2%) |
| $10,000 to $14,999 | 0 (0.0%) | 44 (31.0%) |
| $15,000 to $19,999 | 14 (8.5%) | 10 (7.0%) |
| $20,000 to $24,999 | 9 (5.4%) | 25 (17.6%) |
| $25,000 to $34,999 | 68 (41.2%) | 7 (4.9%) |
| $35,000 to $49,999 | 6 (3.6%) | 0 (0.0%) |
| $50,000 to $74,999 | 19 (11.5%) | 14 (9.9%) |
| $75,000 to $99,999 | 7 (4.2%) | 0 (0.0%) |
| $100,000 to $149,999 | 16 (9.7%) | 0 (0.0%) |
| $150,000 or more | 0 (0.0%) | 0 (0.0%) |
| Total | 165 (100.0%) | 142 (100.0%) |
Monthly Housing Cost Tiers in Eastover
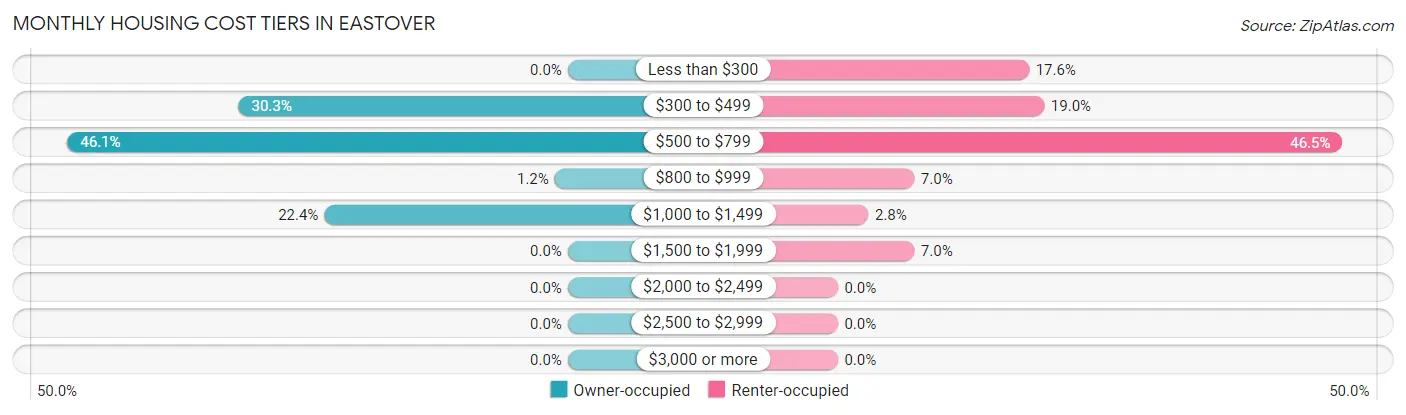
| Monthly Cost | Owner-occupied | Renter-occupied |
| Less than $300 | 0 (0.0%) | 25 (17.6%) |
| $300 to $499 | 50 (30.3%) | 27 (19.0%) |
| $500 to $799 | 76 (46.1%) | 66 (46.5%) |
| $800 to $999 | 2 (1.2%) | 10 (7.0%) |
| $1,000 to $1,499 | 37 (22.4%) | 4 (2.8%) |
| $1,500 to $1,999 | 0 (0.0%) | 10 (7.0%) |
| $2,000 to $2,499 | 0 (0.0%) | 0 (0.0%) |
| $2,500 to $2,999 | 0 (0.0%) | 0 (0.0%) |
| $3,000 or more | 0 (0.0%) | 0 (0.0%) |
| Total | 165 (100.0%) | 142 (100.0%) |
Physical Housing Characteristics in Eastover
Housing Structures in Eastover
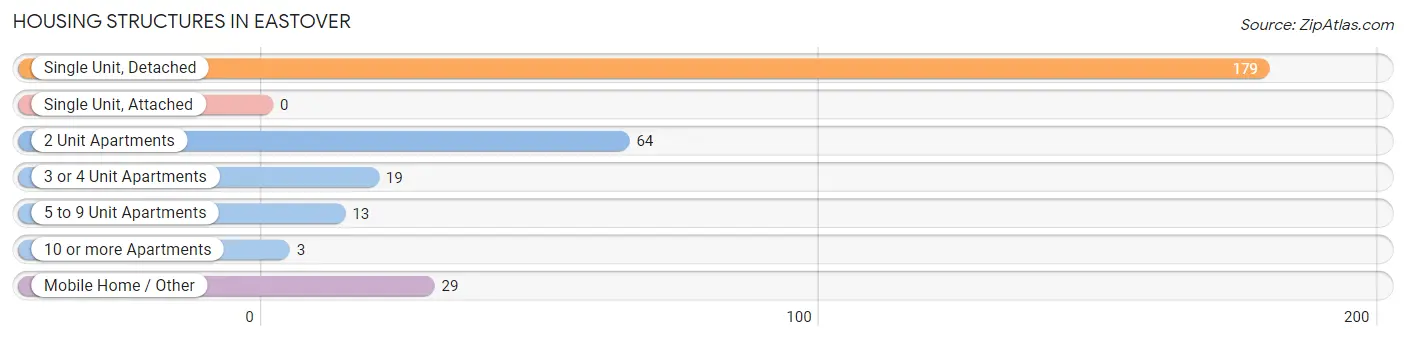
| Structure Type | # Housing Units | % Housing Units |
| Single Unit, Detached | 179 | 58.3% |
| Single Unit, Attached | 0 | 0.0% |
| 2 Unit Apartments | 64 | 20.8% |
| 3 or 4 Unit Apartments | 19 | 6.2% |
| 5 to 9 Unit Apartments | 13 | 4.2% |
| 10 or more Apartments | 3 | 1.0% |
| Mobile Home / Other | 29 | 9.5% |
| Total | 307 | 100.0% |
Housing Structures by Occupancy in Eastover
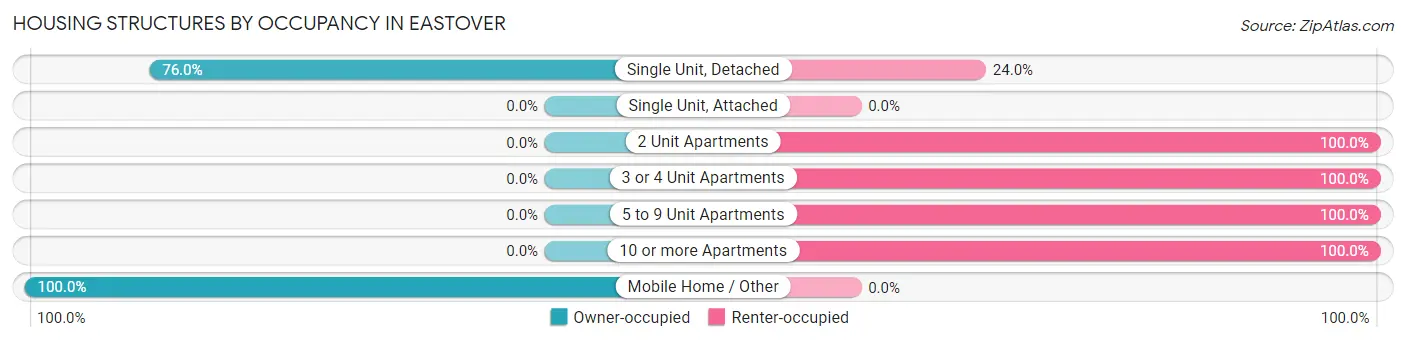
| Structure Type | Owner-occupied | Renter-occupied |
| Single Unit, Detached | 136 (76.0%) | 43 (24.0%) |
| Single Unit, Attached | 0 (0.0%) | 0 (0.0%) |
| 2 Unit Apartments | 0 (0.0%) | 64 (100.0%) |
| 3 or 4 Unit Apartments | 0 (0.0%) | 19 (100.0%) |
| 5 to 9 Unit Apartments | 0 (0.0%) | 13 (100.0%) |
| 10 or more Apartments | 0 (0.0%) | 3 (100.0%) |
| Mobile Home / Other | 29 (100.0%) | 0 (0.0%) |
| Total | 165 (53.7%) | 142 (46.3%) |
Housing Structures by Number of Rooms in Eastover
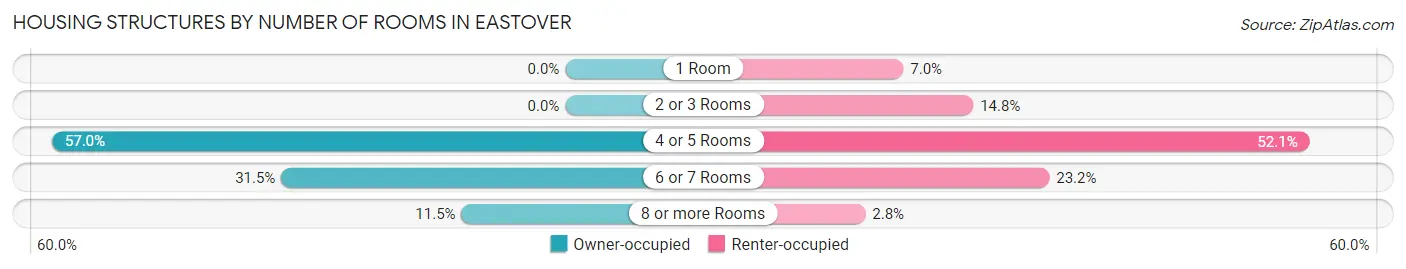
| Number of Rooms | Owner-occupied | Renter-occupied |
| 1 Room | 0 (0.0%) | 10 (7.0%) |
| 2 or 3 Rooms | 0 (0.0%) | 21 (14.8%) |
| 4 or 5 Rooms | 94 (57.0%) | 74 (52.1%) |
| 6 or 7 Rooms | 52 (31.5%) | 33 (23.2%) |
| 8 or more Rooms | 19 (11.5%) | 4 (2.8%) |
| Total | 165 (100.0%) | 142 (100.0%) |
Housing Structure by Heating Type in Eastover
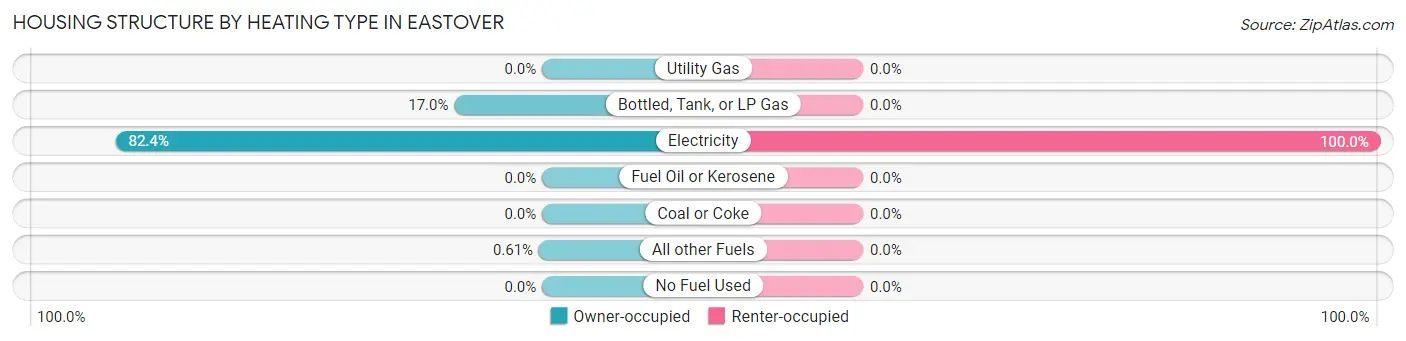
| Heating Type | Owner-occupied | Renter-occupied |
| Utility Gas | 0 (0.0%) | 0 (0.0%) |
| Bottled, Tank, or LP Gas | 28 (17.0%) | 0 (0.0%) |
| Electricity | 136 (82.4%) | 142 (100.0%) |
| Fuel Oil or Kerosene | 0 (0.0%) | 0 (0.0%) |
| Coal or Coke | 0 (0.0%) | 0 (0.0%) |
| All other Fuels | 1 (0.6%) | 0 (0.0%) |
| No Fuel Used | 0 (0.0%) | 0 (0.0%) |
| Total | 165 (100.0%) | 142 (100.0%) |
Household Vehicle Usage in Eastover
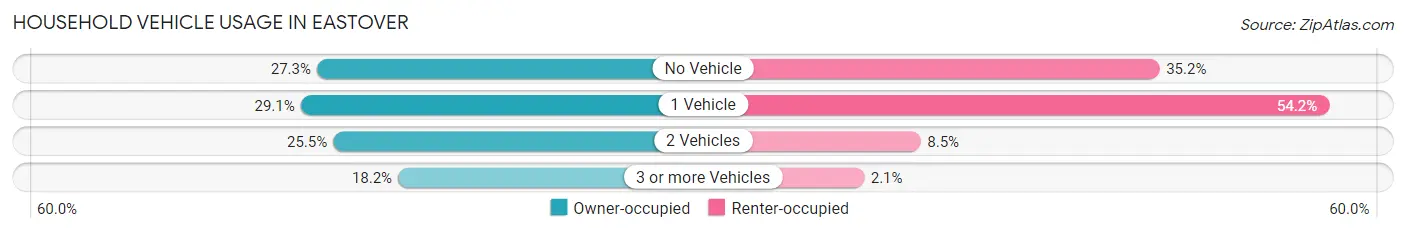
| Vehicles per Household | Owner-occupied | Renter-occupied |
| No Vehicle | 45 (27.3%) | 50 (35.2%) |
| 1 Vehicle | 48 (29.1%) | 77 (54.2%) |
| 2 Vehicles | 42 (25.5%) | 12 (8.5%) |
| 3 or more Vehicles | 30 (18.2%) | 3 (2.1%) |
| Total | 165 (100.0%) | 142 (100.0%) |
Real Estate & Mortgages in Eastover
Real Estate and Mortgage Overview in Eastover
| Characteristic | Without Mortgage | With Mortgage |
| Housing Units | 129 | 36 |
| Median Property Value | $119,300 | $56,300 |
| Median Household Income | $33,438 | $0 |
| Monthly Housing Costs | $528 | $0 |
| Real Estate Taxes | $678 | $8 |
Property Value by Mortgage Status in Eastover
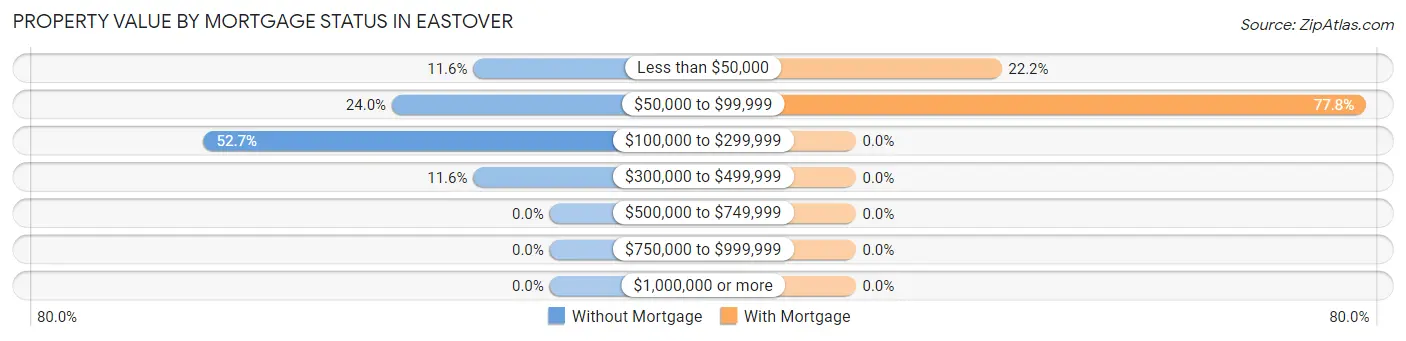
| Property Value | Without Mortgage | With Mortgage |
| Less than $50,000 | 15 (11.6%) | 8 (22.2%) |
| $50,000 to $99,999 | 31 (24.0%) | 28 (77.8%) |
| $100,000 to $299,999 | 68 (52.7%) | 0 (0.0%) |
| $300,000 to $499,999 | 15 (11.6%) | 0 (0.0%) |
| $500,000 to $749,999 | 0 (0.0%) | 0 (0.0%) |
| $750,000 to $999,999 | 0 (0.0%) | 0 (0.0%) |
| $1,000,000 or more | 0 (0.0%) | 0 (0.0%) |
| Total | 129 (100.0%) | 36 (100.0%) |
Household Income by Mortgage Status in Eastover
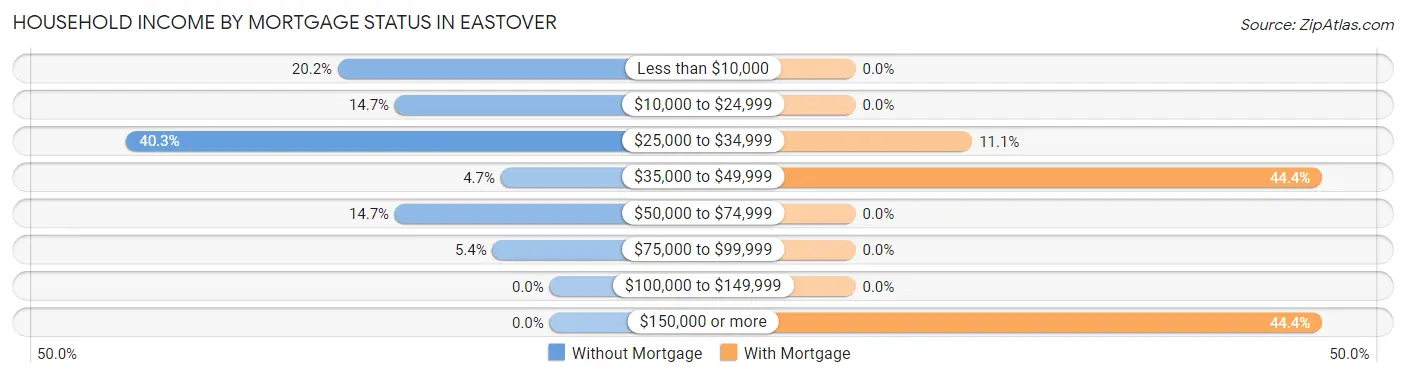
| Household Income | Without Mortgage | With Mortgage |
| Less than $10,000 | 26 (20.2%) | 0 (0.0%) |
| $10,000 to $24,999 | 19 (14.7%) | 0 (0.0%) |
| $25,000 to $34,999 | 52 (40.3%) | 4 (11.1%) |
| $35,000 to $49,999 | 6 (4.6%) | 16 (44.4%) |
| $50,000 to $74,999 | 19 (14.7%) | 0 (0.0%) |
| $75,000 to $99,999 | 7 (5.4%) | 0 (0.0%) |
| $100,000 to $149,999 | 0 (0.0%) | 0 (0.0%) |
| $150,000 or more | 0 (0.0%) | 16 (44.4%) |
| Total | 129 (100.0%) | 36 (100.0%) |
Property Value to Household Income Ratio in Eastover
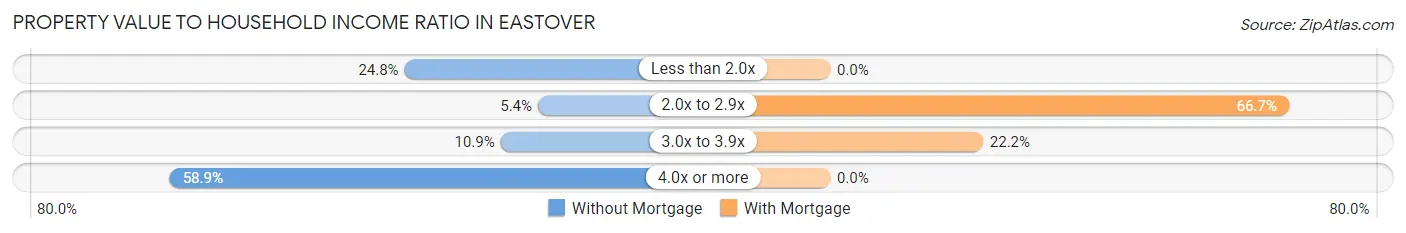
| Value-to-Income Ratio | Without Mortgage | With Mortgage |
| Less than 2.0x | 32 (24.8%) | 0 (0.0%) |
| 2.0x to 2.9x | 7 (5.4%) | 24 (66.7%) |
| 3.0x to 3.9x | 14 (10.8%) | 8 (22.2%) |
| 4.0x or more | 76 (58.9%) | 0 (0.0%) |
| Total | 129 (100.0%) | 36 (100.0%) |
Real Estate Taxes by Mortgage Status in Eastover
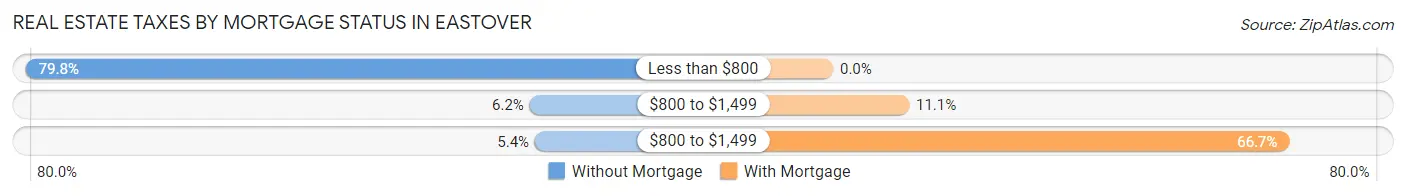
| Property Taxes | Without Mortgage | With Mortgage |
| Less than $800 | 103 (79.8%) | 0 (0.0%) |
| $800 to $1,499 | 8 (6.2%) | 4 (11.1%) |
| $800 to $1,499 | 7 (5.4%) | 24 (66.7%) |
| Total | 129 (100.0%) | 36 (100.0%) |
Health & Disability in Eastover
Health Insurance Coverage by Age in Eastover
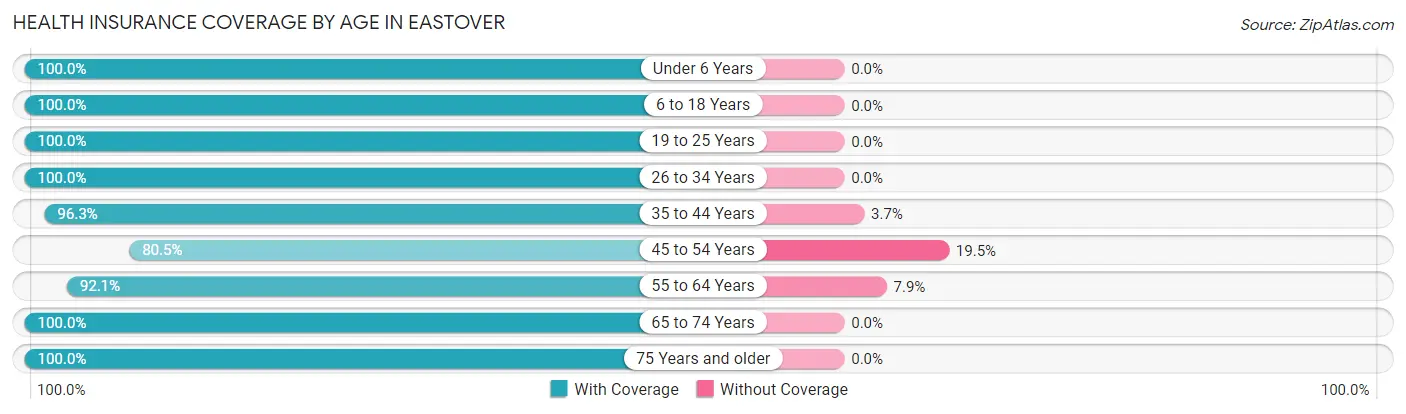
| Age Bracket | With Coverage | Without Coverage |
| Under 6 Years | 45 (100.0%) | 0 (0.0%) |
| 6 to 18 Years | 114 (100.0%) | 0 (0.0%) |
| 19 to 25 Years | 28 (100.0%) | 0 (0.0%) |
| 26 to 34 Years | 60 (100.0%) | 0 (0.0%) |
| 35 to 44 Years | 104 (96.3%) | 4 (3.7%) |
| 45 to 54 Years | 33 (80.5%) | 8 (19.5%) |
| 55 to 64 Years | 35 (92.1%) | 3 (7.9%) |
| 65 to 74 Years | 103 (100.0%) | 0 (0.0%) |
| 75 Years and older | 46 (100.0%) | 0 (0.0%) |
| Total | 568 (97.4%) | 15 (2.6%) |
Health Insurance Coverage by Citizenship Status in Eastover
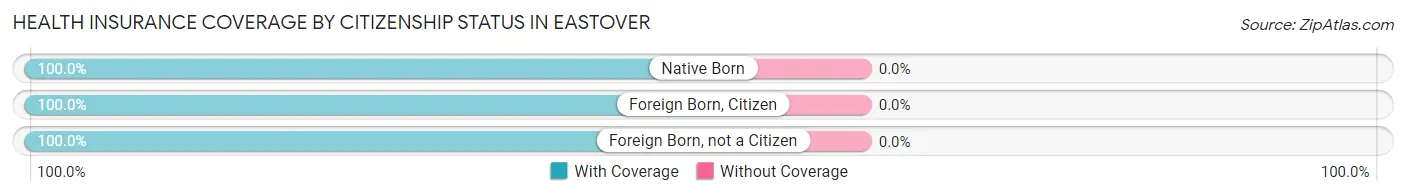
| Citizenship Status | With Coverage | Without Coverage |
| Native Born | 45 (100.0%) | 0 (0.0%) |
| Foreign Born, Citizen | 114 (100.0%) | 0 (0.0%) |
| Foreign Born, not a Citizen | 28 (100.0%) | 0 (0.0%) |
Health Insurance Coverage by Household Income in Eastover
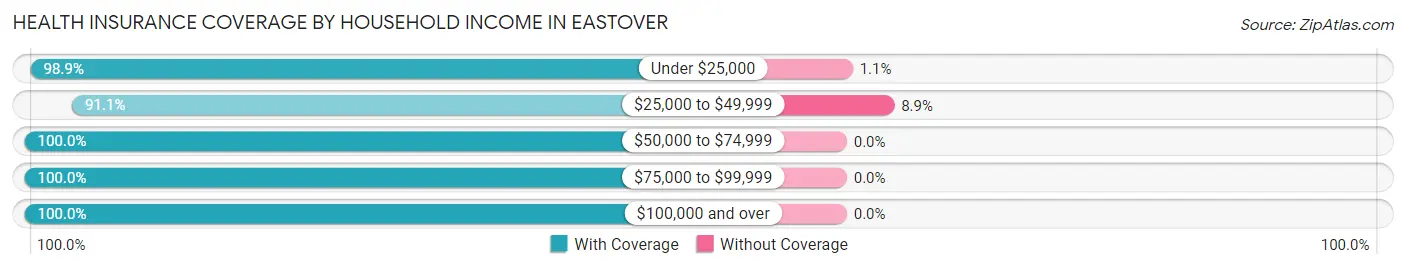
| Household Income | With Coverage | Without Coverage |
| Under $25,000 | 268 (98.9%) | 3 (1.1%) |
| $25,000 to $49,999 | 123 (91.1%) | 12 (8.9%) |
| $50,000 to $74,999 | 105 (100.0%) | 0 (0.0%) |
| $75,000 to $99,999 | 36 (100.0%) | 0 (0.0%) |
| $100,000 and over | 36 (100.0%) | 0 (0.0%) |
Public vs Private Health Insurance Coverage by Age in Eastover
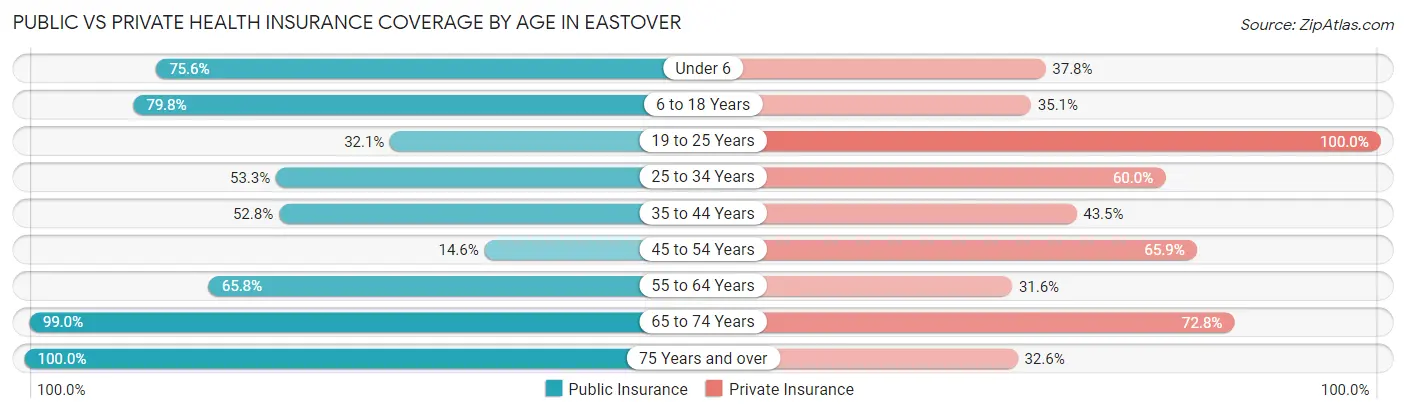
| Age Bracket | Public Insurance | Private Insurance |
| Under 6 | 34 (75.6%) | 17 (37.8%) |
| 6 to 18 Years | 91 (79.8%) | 40 (35.1%) |
| 19 to 25 Years | 9 (32.1%) | 28 (100.0%) |
| 25 to 34 Years | 32 (53.3%) | 36 (60.0%) |
| 35 to 44 Years | 57 (52.8%) | 47 (43.5%) |
| 45 to 54 Years | 6 (14.6%) | 27 (65.8%) |
| 55 to 64 Years | 25 (65.8%) | 12 (31.6%) |
| 65 to 74 Years | 102 (99.0%) | 75 (72.8%) |
| 75 Years and over | 46 (100.0%) | 15 (32.6%) |
| Total | 402 (69.0%) | 297 (50.9%) |
Disability Status by Sex by Age in Eastover
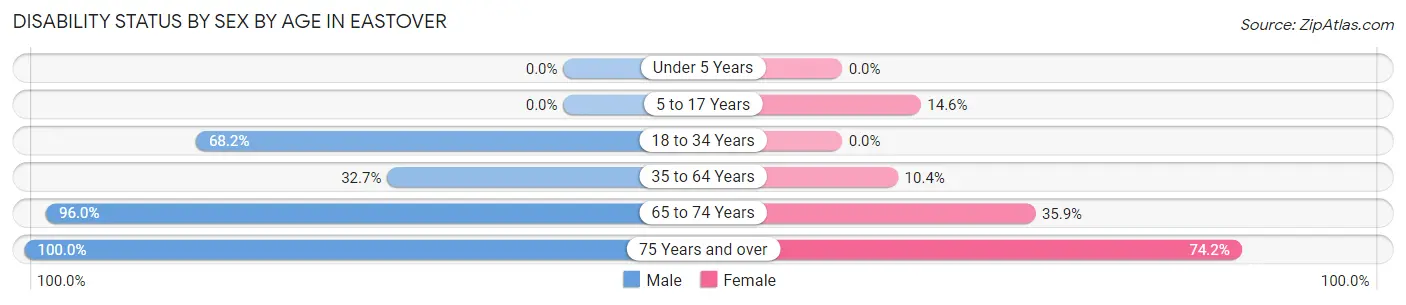
| Age Bracket | Male | Female |
| Under 5 Years | 0 (0.0%) | 0 (0.0%) |
| 5 to 17 Years | 0 (0.0%) | 14 (14.6%) |
| 18 to 34 Years | 30 (68.2%) | 0 (0.0%) |
| 35 to 64 Years | 17 (32.7%) | 14 (10.4%) |
| 65 to 74 Years | 48 (96.0%) | 19 (35.8%) |
| 75 Years and over | 15 (100.0%) | 23 (74.2%) |
Disability Class by Sex by Age in Eastover
Disability Class: Hearing Difficulty
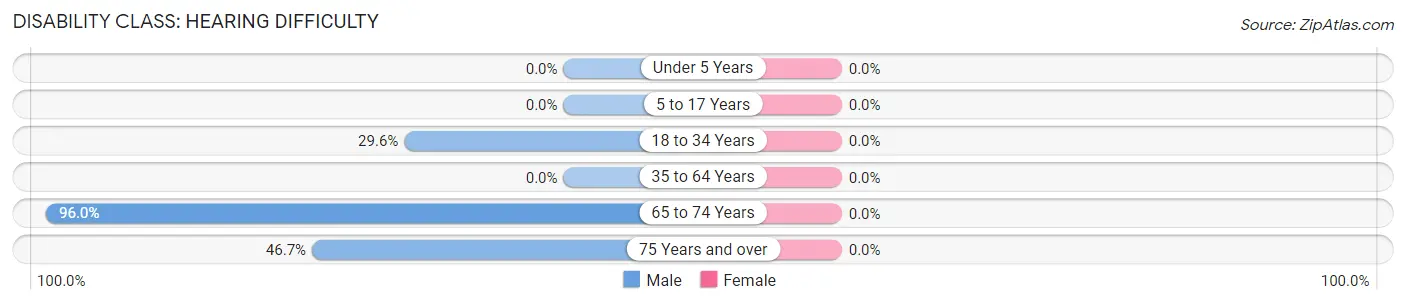
| Age Bracket | Male | Female |
| Under 5 Years | 0 (0.0%) | 0 (0.0%) |
| 5 to 17 Years | 0 (0.0%) | 0 (0.0%) |
| 18 to 34 Years | 13 (29.5%) | 0 (0.0%) |
| 35 to 64 Years | 0 (0.0%) | 0 (0.0%) |
| 65 to 74 Years | 48 (96.0%) | 0 (0.0%) |
| 75 Years and over | 7 (46.7%) | 0 (0.0%) |
Disability Class: Vision Difficulty
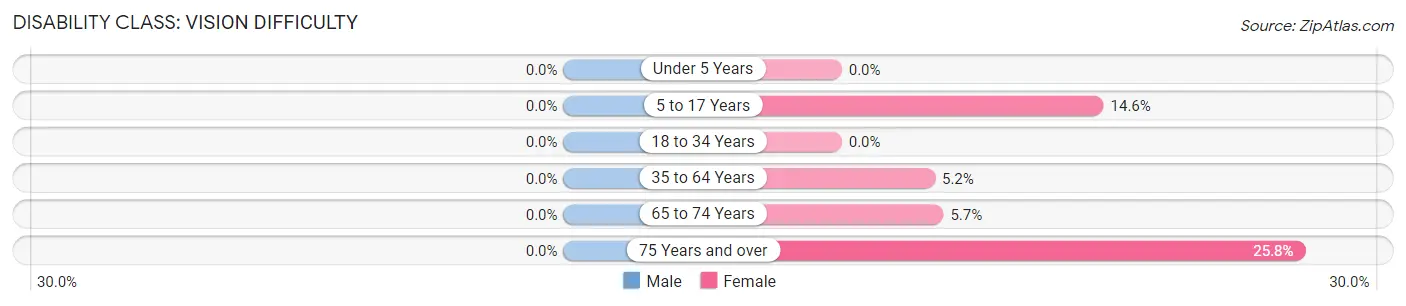
| Age Bracket | Male | Female |
| Under 5 Years | 0 (0.0%) | 0 (0.0%) |
| 5 to 17 Years | 0 (0.0%) | 14 (14.6%) |
| 18 to 34 Years | 0 (0.0%) | 0 (0.0%) |
| 35 to 64 Years | 0 (0.0%) | 7 (5.2%) |
| 65 to 74 Years | 0 (0.0%) | 3 (5.7%) |
| 75 Years and over | 0 (0.0%) | 8 (25.8%) |
Disability Class: Cognitive Difficulty
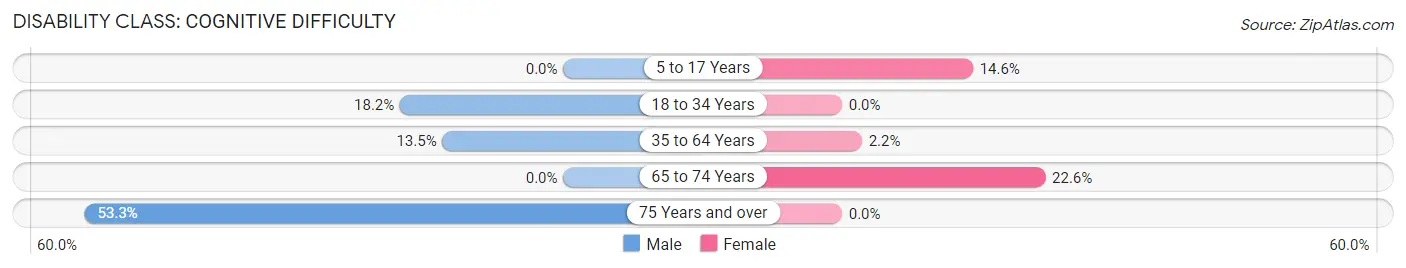
| Age Bracket | Male | Female |
| 5 to 17 Years | 0 (0.0%) | 14 (14.6%) |
| 18 to 34 Years | 8 (18.2%) | 0 (0.0%) |
| 35 to 64 Years | 7 (13.5%) | 3 (2.2%) |
| 65 to 74 Years | 0 (0.0%) | 12 (22.6%) |
| 75 Years and over | 8 (53.3%) | 0 (0.0%) |
Disability Class: Ambulatory Difficulty
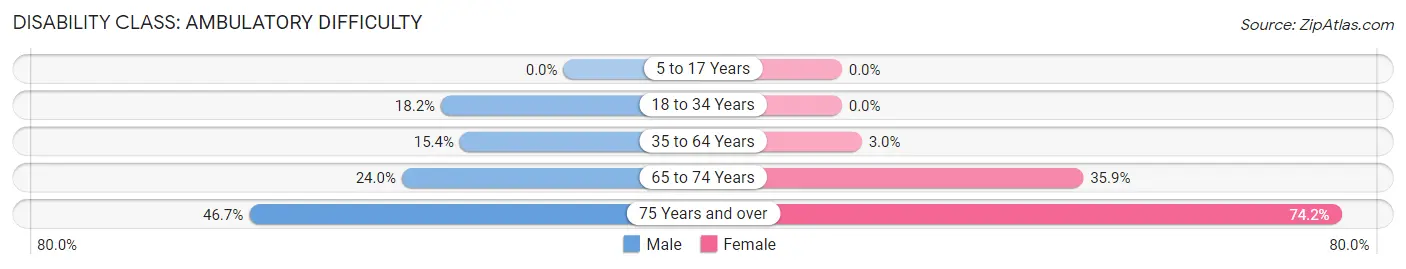
| Age Bracket | Male | Female |
| 5 to 17 Years | 0 (0.0%) | 0 (0.0%) |
| 18 to 34 Years | 8 (18.2%) | 0 (0.0%) |
| 35 to 64 Years | 8 (15.4%) | 4 (3.0%) |
| 65 to 74 Years | 12 (24.0%) | 19 (35.8%) |
| 75 Years and over | 7 (46.7%) | 23 (74.2%) |
Disability Class: Self-Care Difficulty
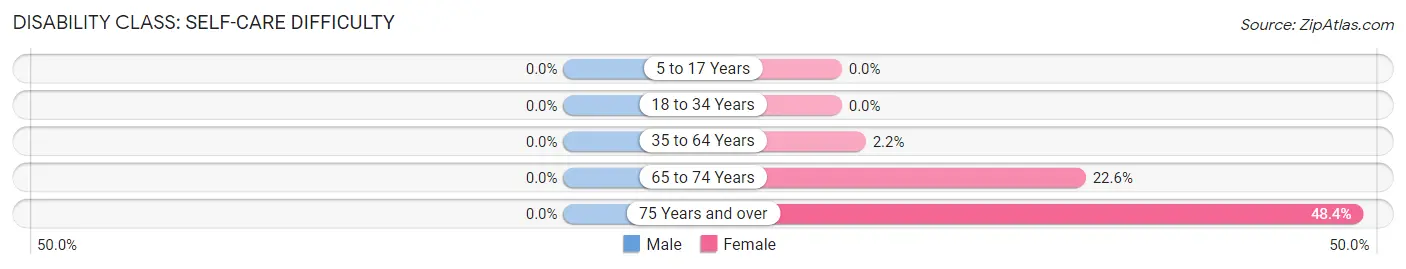
| Age Bracket | Male | Female |
| 5 to 17 Years | 0 (0.0%) | 0 (0.0%) |
| 18 to 34 Years | 0 (0.0%) | 0 (0.0%) |
| 35 to 64 Years | 0 (0.0%) | 3 (2.2%) |
| 65 to 74 Years | 0 (0.0%) | 12 (22.6%) |
| 75 Years and over | 0 (0.0%) | 15 (48.4%) |
Technology Access in Eastover
Computing Device Access in Eastover
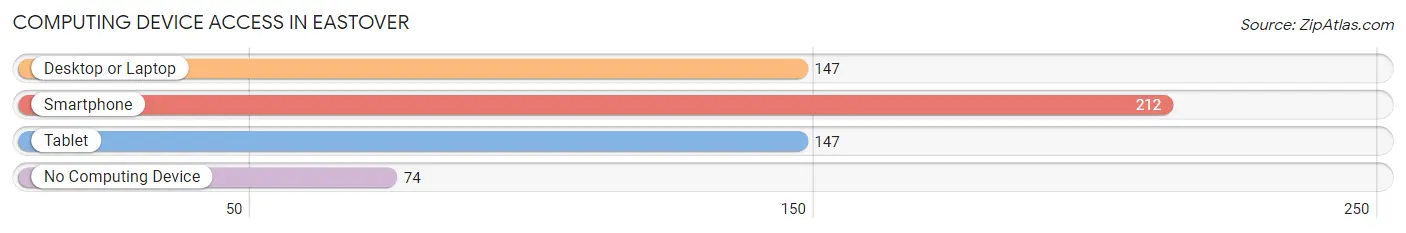
| Device Type | # Households | % Households |
| Desktop or Laptop | 147 | 47.9% |
| Smartphone | 212 | 69.1% |
| Tablet | 147 | 47.9% |
| No Computing Device | 74 | 24.1% |
| Total | 307 | 100.0% |
Internet Access in Eastover
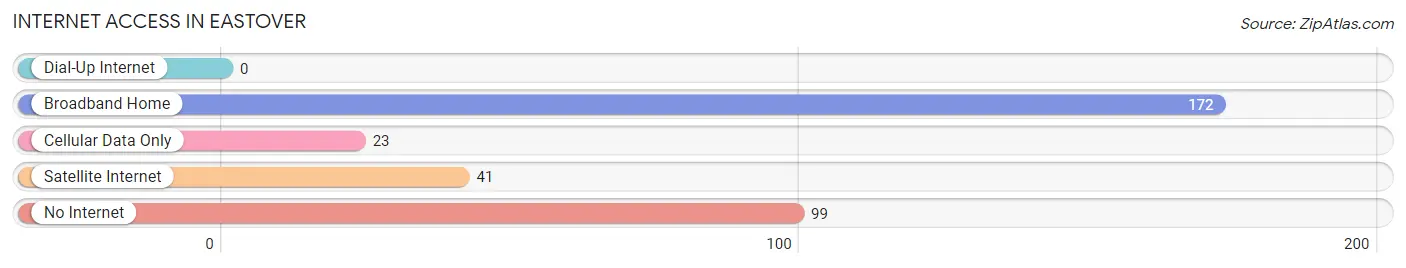
| Internet Type | # Households | % Households |
| Dial-Up Internet | 0 | 0.0% |
| Broadband Home | 172 | 56.0% |
| Cellular Data Only | 23 | 7.5% |
| Satellite Internet | 41 | 13.4% |
| No Internet | 99 | 32.3% |
| Total | 307 | 100.0% |
Eastover Summary
Eastover is a small town located in Richland County, South Carolina. It is situated about 15 miles southeast of the state capital, Columbia. The town has a population of approximately 1,500 people and is part of the Columbia Metropolitan Statistical Area.
History
Eastover was founded in 1891 by the Eastover Land and Improvement Company. The company was formed by a group of investors from Columbia who wanted to create a new town in the area. The town was named after the nearby Eastover Plantation, which was owned by the family of William Henry Gist, the first governor of South Carolina.
The town grew slowly but steadily over the years, and by the early 20th century, it had become a thriving community. The town was home to several businesses, including a cotton mill, a sawmill, a grist mill, and a general store.
In the 1950s, Eastover began to experience a period of decline. The cotton mill closed, and the town's population began to decline. In the late 1970s, the town was revitalized when the Eastover Industrial Park was built. The park brought new businesses and jobs to the area, and the town's population began to grow again.
Geography
Eastover is located in the Midlands region of South Carolina. The town is situated on the banks of the Congaree River, which flows through the area. The town is surrounded by forests and wetlands, and is home to several parks and nature preserves.
The town is located about 15 miles southeast of Columbia, the state capital. It is also located about 25 miles northwest of Sumter, the county seat of Richland County.
Economy
The economy of Eastover is largely based on manufacturing and agriculture. The town is home to several manufacturing companies, including Eastover Industries, which produces automotive parts, and Eastover Textiles, which produces textiles.
Agriculture is also an important part of the local economy. The town is home to several farms, which produce a variety of crops, including corn, soybeans, cotton, and peanuts.
Demographics
As of the 2010 census, the population of Eastover was 1,521. The racial makeup of the town was 79.3% White, 17.2% African American, 0.7% Native American, 0.3% Asian, 0.1% Pacific Islander, and 2.4% from other races. Hispanic or Latino of any race were 2.2% of the population.
The median household income in Eastover was $37,917, and the median family income was $45,938. The per capita income was $19,945. About 16.2% of the population was below the poverty line.
Eastover is a small town with a rich history and a diverse population. The town has experienced a period of revitalization in recent years, and is now home to several businesses and industries. The town is also home to several parks and nature preserves, making it a great place to live and visit.
Common Questions
What is Per Capita Income in Eastover?
Per Capita income in Eastover is $16,329.
What is the Median Family Income in Eastover?
Median Family Income in Eastover is $31,250.
What is the Median Household income in Eastover?
Median Household Income in Eastover is $21,620.
What is Inequality or Gini Index in Eastover?
Inequality or Gini Index in Eastover is 0.47.
What is the Total Population of Eastover?
Total Population of Eastover is 616.
What is the Total Male Population of Eastover?
Total Male Population of Eastover is 203.
What is the Total Female Population of Eastover?
Total Female Population of Eastover is 413.
What is the Ratio of Males per 100 Females in Eastover?
There are 49.15 Males per 100 Females in Eastover.
What is the Ratio of Females per 100 Males in Eastover?
There are 203.45 Females per 100 Males in Eastover.
What is the Median Population Age in Eastover?
Median Population Age in Eastover is 39.3 Years.
What is the Average Family Size in Eastover
Average Family Size in Eastover is 2.7 People.
What is the Average Household Size in Eastover
Average Household Size in Eastover is 1.9 People.
How Large is the Labor Force in Eastover?
There are 239 People in the Labor Forcein in Eastover.
What is the Percentage of People in the Labor Force in Eastover?
52.3% of People are in the Labor Force in Eastover.
What is the Unemployment Rate in Eastover?
Unemployment Rate in Eastover is 12.6%.