Olanta, SC Map & Demographics
Olanta Map
Olanta Overview
$21,231
PER CAPITA INCOME
$67,500
AVG FAMILY INCOME
$53,438
AVG HOUSEHOLD INCOME
68.1%
WAGE / INCOME GAP [ % ]
31.9¢/ $1
WAGE / INCOME GAP [ $ ]
$10,517
FAMILY INCOME DEFICIT
0.45
INEQUALITY / GINI INDEX
588
TOTAL POPULATION
199
MALE POPULATION
389
FEMALE POPULATION
51.16
MALES / 100 FEMALES
195.48
FEMALES / 100 MALES
40.4
MEDIAN AGE
3.5
AVG FAMILY SIZE
3.0
AVG HOUSEHOLD SIZE
255
LABOR FORCE [ PEOPLE ]
52.5%
PERCENT IN LABOR FORCE
9.4%
UNEMPLOYMENT RATE
Olanta Zip Codes
Olanta Area Codes
Income in Olanta
Income Overview in Olanta
Per Capita Income in Olanta is $21,231, while median incomes of families and households are $67,500 and $53,438 respectively.
| Characteristic | Number | Measure |
| Per Capita Income | 588 | $21,231 |
| Median Family Income | 138 | $67,500 |
| Mean Family Income | 138 | $62,256 |
| Median Household Income | 197 | $53,438 |
| Mean Household Income | 197 | $56,198 |
| Income Deficit | 138 | $10,517 |
| Wage / Income Gap (%) | 588 | 68.07% |
| Wage / Income Gap ($) | 588 | 31.93¢ per $1 |
| Gini / Inequality Index | 588 | 0.45 |
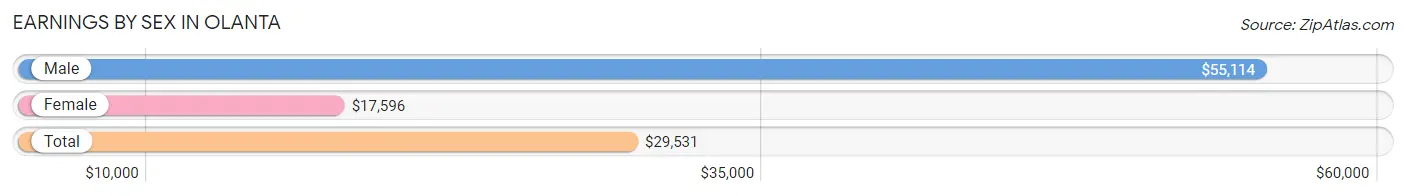
Earnings by Sex in Olanta
Average Earnings in Olanta are $29,531, $55,114 for men and $17,596 for women, a difference of 68.1%.
| Sex | Number | Average Earnings |
| Male | 100 (37.4%) | $55,114 |
| Female | 167 (62.5%) | $17,596 |
| Total | 267 (100.0%) | $29,531 |
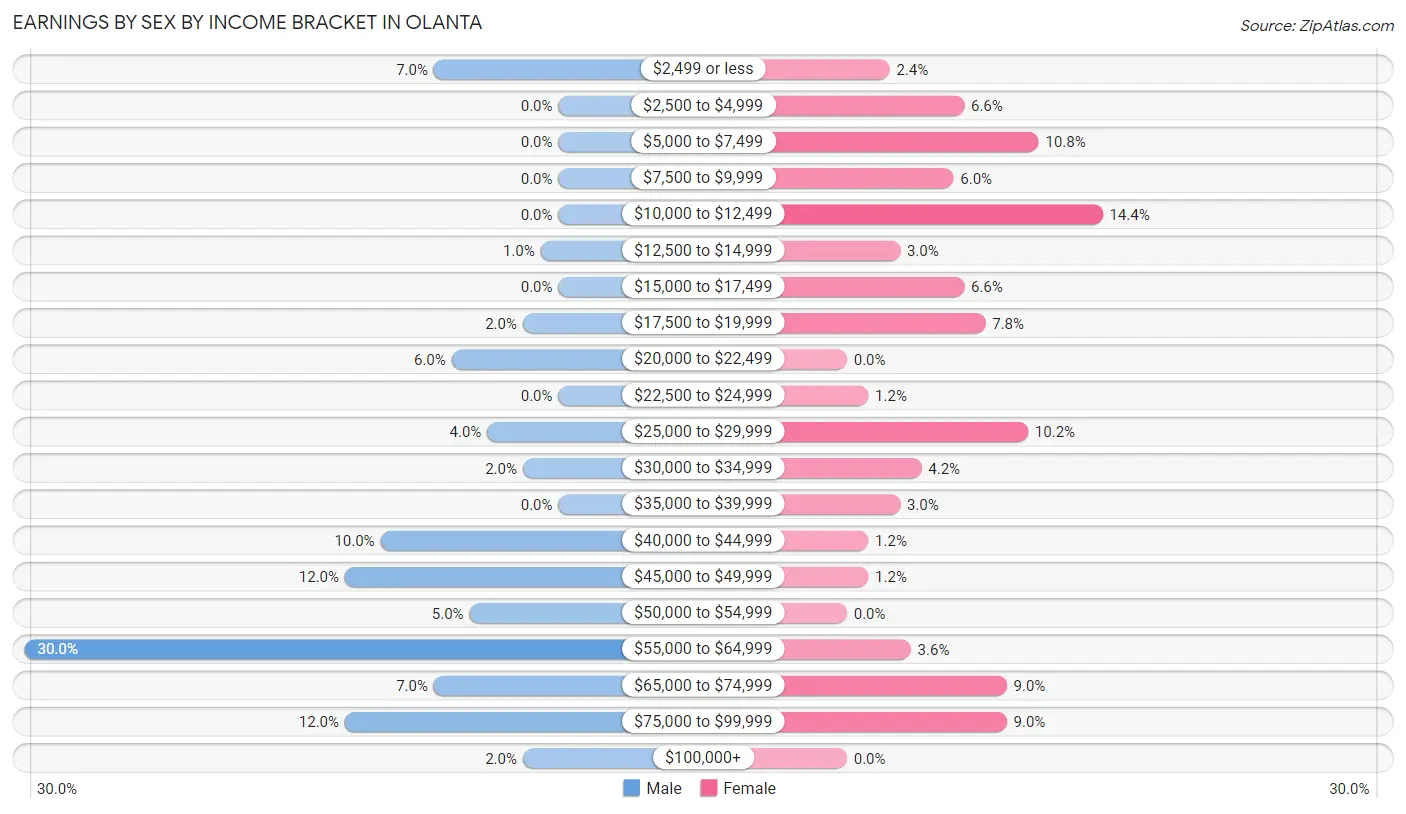
Earnings by Sex by Income Bracket in Olanta
The most common earnings brackets in Olanta are $55,000 to $64,999 for men (30 | 30.0%) and $10,000 to $12,499 for women (24 | 14.4%).
| Income | Male | Female |
| $2,499 or less | 7 (7.0%) | 4 (2.4%) |
| $2,500 to $4,999 | 0 (0.0%) | 11 (6.6%) |
| $5,000 to $7,499 | 0 (0.0%) | 18 (10.8%) |
| $7,500 to $9,999 | 0 (0.0%) | 10 (6.0%) |
| $10,000 to $12,499 | 0 (0.0%) | 24 (14.4%) |
| $12,500 to $14,999 | 1 (1.0%) | 5 (3.0%) |
| $15,000 to $17,499 | 0 (0.0%) | 11 (6.6%) |
| $17,500 to $19,999 | 2 (2.0%) | 13 (7.8%) |
| $20,000 to $22,499 | 6 (6.0%) | 0 (0.0%) |
| $22,500 to $24,999 | 0 (0.0%) | 2 (1.2%) |
| $25,000 to $29,999 | 4 (4.0%) | 17 (10.2%) |
| $30,000 to $34,999 | 2 (2.0%) | 7 (4.2%) |
| $35,000 to $39,999 | 0 (0.0%) | 5 (3.0%) |
| $40,000 to $44,999 | 10 (10.0%) | 2 (1.2%) |
| $45,000 to $49,999 | 12 (12.0%) | 2 (1.2%) |
| $50,000 to $54,999 | 5 (5.0%) | 0 (0.0%) |
| $55,000 to $64,999 | 30 (30.0%) | 6 (3.6%) |
| $65,000 to $74,999 | 7 (7.0%) | 15 (9.0%) |
| $75,000 to $99,999 | 12 (12.0%) | 15 (9.0%) |
| $100,000+ | 2 (2.0%) | 0 (0.0%) |
| Total | 100 (100.0%) | 167 (100.0%) |
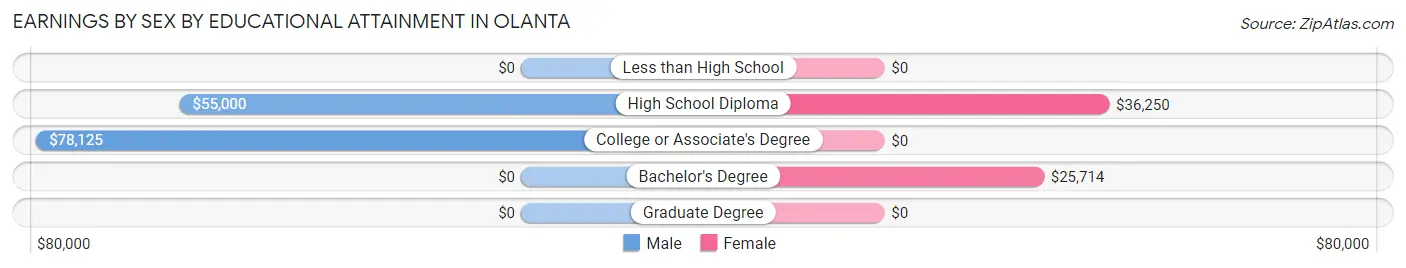
Earnings by Sex by Educational Attainment in Olanta
Average earnings in Olanta are $55,341 for men and $27,361 for women, a difference of 50.6%. Men with an educational attainment of college or associate's degree enjoy the highest average annual earnings of $78,125, while those with high school diploma education earn the least with $55,000. Women with an educational attainment of high school diploma earn the most with the average annual earnings of $36,250, while those with bachelor's degree education have the smallest earnings of $25,714.
| Educational Attainment | Male Income | Female Income |
| Less than High School | - | - |
| High School Diploma | $55,000 | $36,250 |
| College or Associate's Degree | $78,125 | $0 |
| Bachelor's Degree | - | - |
| Graduate Degree | - | - |
| Total | $55,341 | $27,361 |
Family Income in Olanta
Family Income Brackets in Olanta
According to the Olanta family income data, there are 37 families falling into the $50,000 to $74,999 income range, which is the most common income bracket and makes up 26.8% of all families.
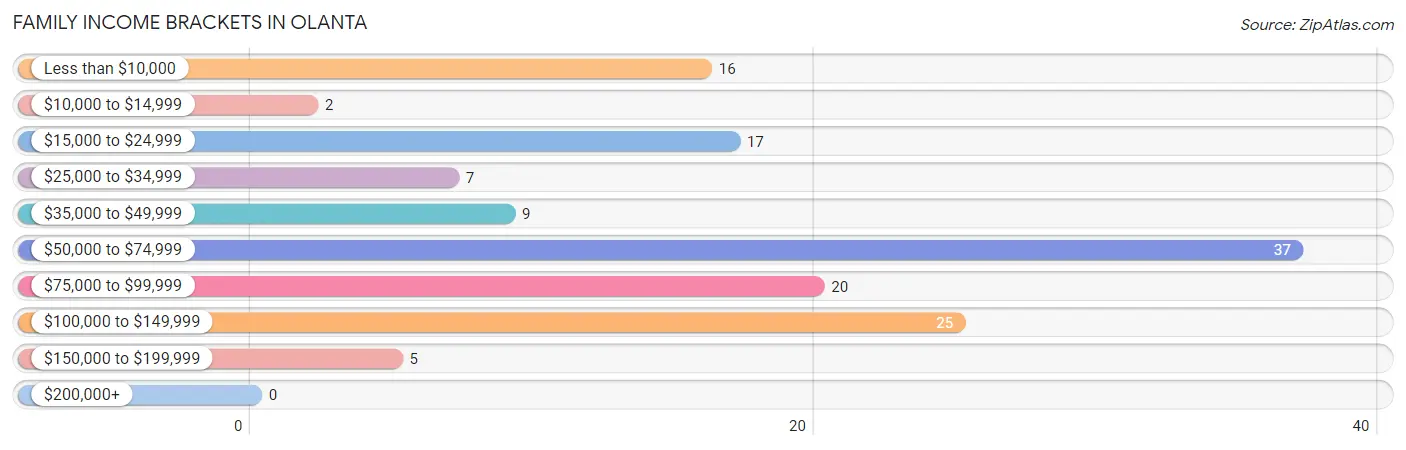
| Income Bracket | # Families | % Families |
| Less than $10,000 | 16 | 11.6% |
| $10,000 to $14,999 | 2 | 1.4% |
| $15,000 to $24,999 | 17 | 12.3% |
| $25,000 to $34,999 | 7 | 5.1% |
| $35,000 to $49,999 | 9 | 6.5% |
| $50,000 to $74,999 | 37 | 26.8% |
| $75,000 to $99,999 | 20 | 14.5% |
| $100,000 to $149,999 | 25 | 18.1% |
| $150,000 to $199,999 | 5 | 3.6% |
| $200,000+ | 0 | 0.0% |
Family Income by Famaliy Size in Olanta
4-person families (14 | 10.1%) account for the highest median family income in Olanta with $78,750 per family, while 2-person families (71 | 51.4%) have the highest median income of $22,410 per family member.
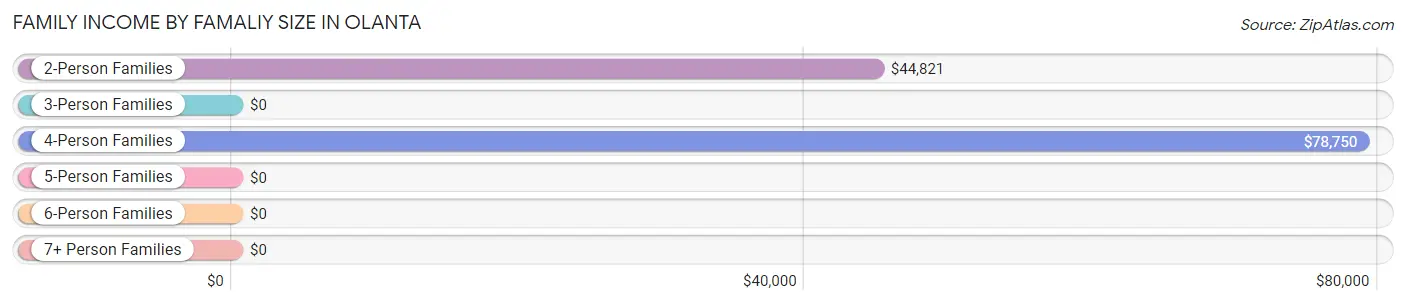
| Income Bracket | # Families | Median Income |
| 2-Person Families | 71 (51.4%) | $44,821 |
| 3-Person Families | 28 (20.3%) | $0 |
| 4-Person Families | 14 (10.1%) | $78,750 |
| 5-Person Families | 8 (5.8%) | $0 |
| 6-Person Families | 13 (9.4%) | $0 |
| 7+ Person Families | 4 (2.9%) | $0 |
| Total | 138 (100.0%) | $67,500 |
Family Income by Number of Earners in Olanta
The median family income in Olanta is $67,500, with families comprising 3+ earners (24) having the highest median family income of $101,346, while families with no earners (40) have the lowest median family income of $19,286, accounting for 17.4% and 29.0% of families, respectively.
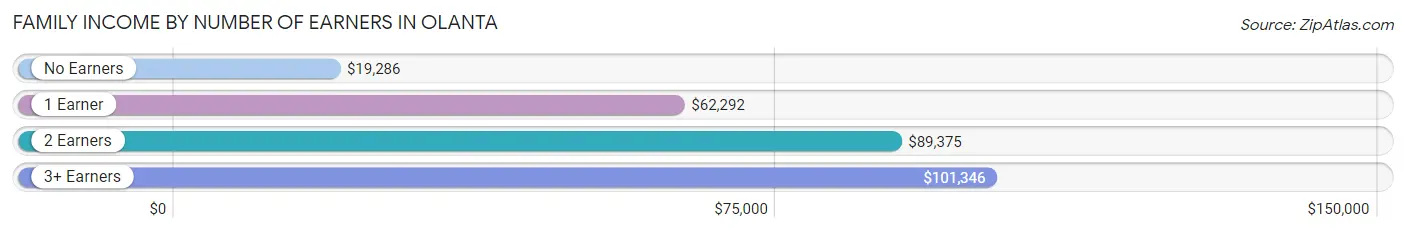
| Number of Earners | # Families | Median Income |
| No Earners | 40 (29.0%) | $19,286 |
| 1 Earner | 49 (35.5%) | $62,292 |
| 2 Earners | 25 (18.1%) | $89,375 |
| 3+ Earners | 24 (17.4%) | $101,346 |
| Total | 138 (100.0%) | $67,500 |
Household Income in Olanta
Household Income Brackets in Olanta
With 50 households falling in the category, the $50,000 to $74,999 income range is the most frequent in Olanta, accounting for 25.4% of all households.
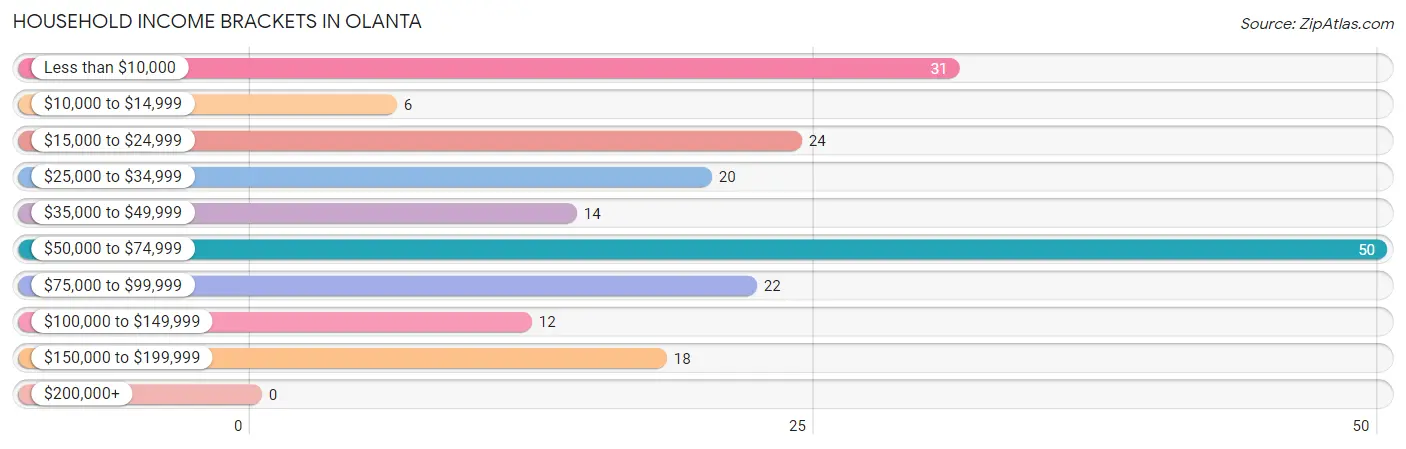
| Income Bracket | # Households | % Households |
| Less than $10,000 | 31 | 15.7% |
| $10,000 to $14,999 | 6 | 3.0% |
| $15,000 to $24,999 | 24 | 12.2% |
| $25,000 to $34,999 | 20 | 10.2% |
| $35,000 to $49,999 | 14 | 7.1% |
| $50,000 to $74,999 | 50 | 25.4% |
| $75,000 to $99,999 | 22 | 11.2% |
| $100,000 to $149,999 | 12 | 6.1% |
| $150,000 to $199,999 | 18 | 9.1% |
| $200,000+ | 0 | 0.0% |
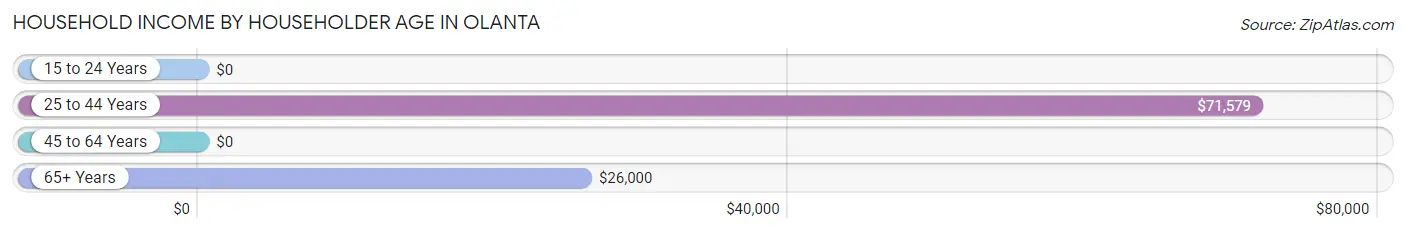
Household Income by Householder Age in Olanta
The median household income in Olanta is $53,438, with the highest median household income of $71,579 found in the 25 to 44 years age bracket for the primary householder. A total of 52 households (26.4%) fall into this category. Meanwhile, the 15 to 24 years age bracket for the primary householder has the lowest median household income of $0, with 2 households (1.0%) in this group.
| Income Bracket | # Households | Median Income |
| 15 to 24 Years | 2 (1.0%) | $0 |
| 25 to 44 Years | 52 (26.4%) | $71,579 |
| 45 to 64 Years | 85 (43.1%) | $0 |
| 65+ Years | 58 (29.4%) | $26,000 |
| Total | 197 (100.0%) | $53,438 |
Poverty in Olanta
Income Below Poverty by Sex and Age in Olanta
With 20.6% poverty level for males and 22.6% for females among the residents of Olanta, 65 to 74 year old males and 5 year old females are the most vulnerable to poverty, with 5 males (50.0%) and 3 females (100.0%) in their respective age groups living below the poverty level.
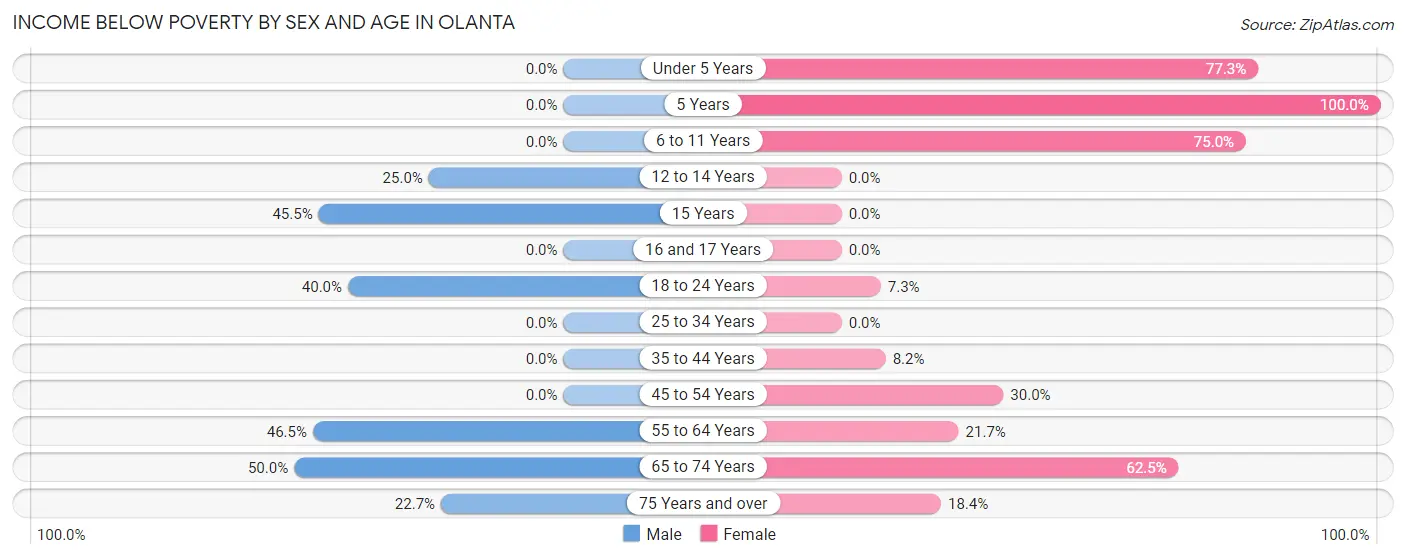
| Age Bracket | Male | Female |
| Under 5 Years | 0 (0.0%) | 17 (77.3%) |
| 5 Years | 0 (0.0%) | 3 (100.0%) |
| 6 to 11 Years | 0 (0.0%) | 15 (75.0%) |
| 12 to 14 Years | 4 (25.0%) | 0 (0.0%) |
| 15 Years | 5 (45.5%) | 0 (0.0%) |
| 16 and 17 Years | 0 (0.0%) | 0 (0.0%) |
| 18 to 24 Years | 2 (40.0%) | 5 (7.2%) |
| 25 to 34 Years | 0 (0.0%) | 0 (0.0%) |
| 35 to 44 Years | 0 (0.0%) | 4 (8.2%) |
| 45 to 54 Years | 0 (0.0%) | 9 (30.0%) |
| 55 to 64 Years | 20 (46.5%) | 18 (21.7%) |
| 65 to 74 Years | 5 (50.0%) | 10 (62.5%) |
| 75 Years and over | 5 (22.7%) | 7 (18.4%) |
| Total | 41 (20.6%) | 88 (22.6%) |
Income Above Poverty by Sex and Age in Olanta
According to the poverty statistics in Olanta, males aged under 5 years and females aged 12 to 14 years are the age groups that are most secure financially, with 100.0% of males and 100.0% of females in these age groups living above the poverty line.
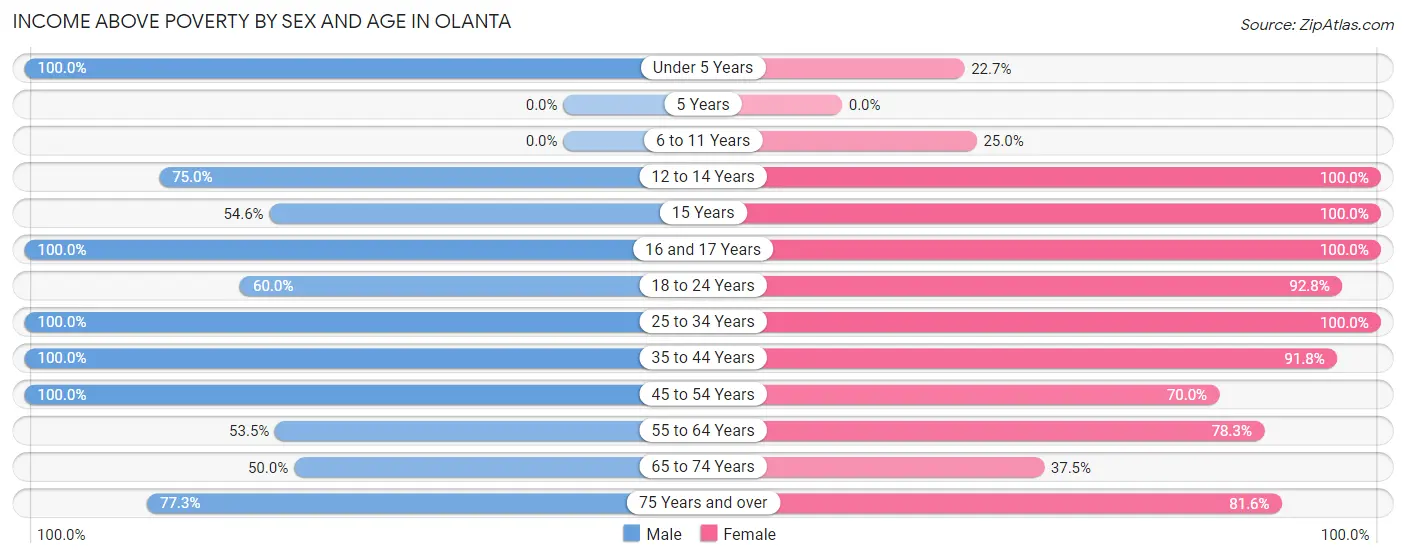
| Age Bracket | Male | Female |
| Under 5 Years | 10 (100.0%) | 5 (22.7%) |
| 5 Years | 0 (0.0%) | 0 (0.0%) |
| 6 to 11 Years | 0 (0.0%) | 5 (25.0%) |
| 12 to 14 Years | 12 (75.0%) | 8 (100.0%) |
| 15 Years | 6 (54.5%) | 12 (100.0%) |
| 16 and 17 Years | 6 (100.0%) | 31 (100.0%) |
| 18 to 24 Years | 3 (60.0%) | 64 (92.7%) |
| 25 to 34 Years | 15 (100.0%) | 8 (100.0%) |
| 35 to 44 Years | 44 (100.0%) | 45 (91.8%) |
| 45 to 54 Years | 17 (100.0%) | 21 (70.0%) |
| 55 to 64 Years | 23 (53.5%) | 65 (78.3%) |
| 65 to 74 Years | 5 (50.0%) | 6 (37.5%) |
| 75 Years and over | 17 (77.3%) | 31 (81.6%) |
| Total | 158 (79.4%) | 301 (77.4%) |
Income Below Poverty Among Married-Couple Families in Olanta
The poverty statistics for married-couple families in Olanta show that 17.5% or 17 of the total 97 families live below the poverty line. Families with no children have the highest poverty rate of 26.6%, comprising of 17 families. On the other hand, families with 1 or 2 children have the lowest poverty rate of 0.0%, which includes 0 families.
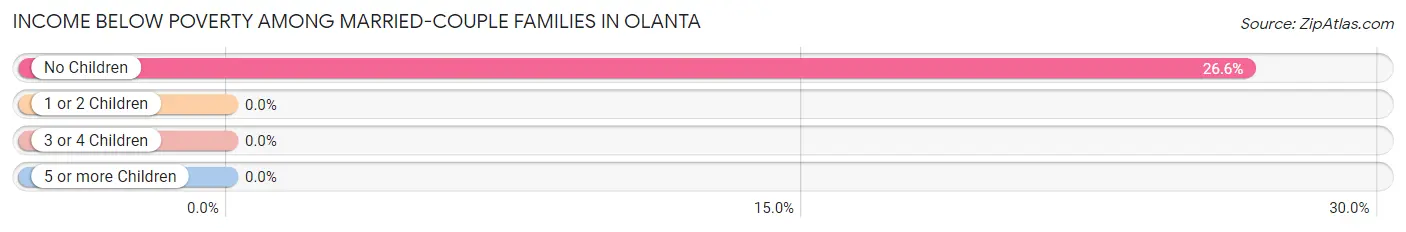
| Children | Above Poverty | Below Poverty |
| No Children | 47 (73.4%) | 17 (26.6%) |
| 1 or 2 Children | 29 (100.0%) | 0 (0.0%) |
| 3 or 4 Children | 4 (100.0%) | 0 (0.0%) |
| 5 or more Children | 0 (0.0%) | 0 (0.0%) |
| Total | 80 (82.5%) | 17 (17.5%) |
Income Below Poverty Among Single-Parent Households in Olanta
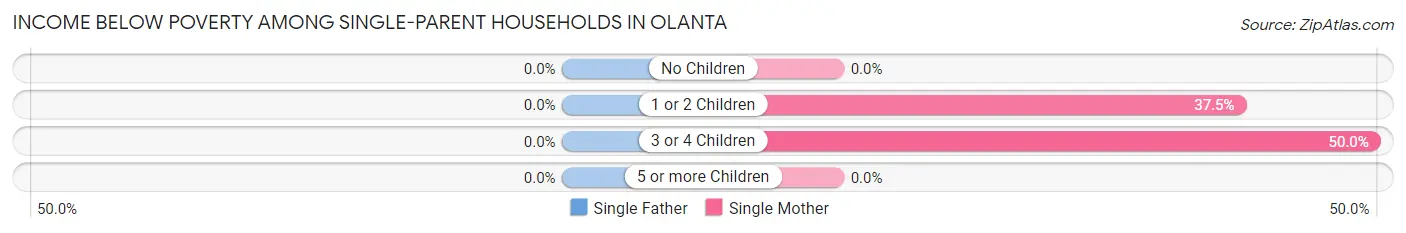
| Children | Single Father | Single Mother |
| No Children | 0 (0.0%) | 0 (0.0%) |
| 1 or 2 Children | 0 (0.0%) | 9 (37.5%) |
| 3 or 4 Children | 0 (0.0%) | 4 (50.0%) |
| 5 or more Children | 0 (0.0%) | 0 (0.0%) |
| Total | 0 (0.0%) | 13 (37.1%) |
Income Below Poverty Among Married-Couple vs Single-Parent Households in Olanta
The poverty data for Olanta shows that 17 of the married-couple family households (17.5%) and 13 of the single-parent households (31.7%) are living below the poverty level. Within the married-couple family households, those with no children have the highest poverty rate, with 17 households (26.6%) falling below the poverty line. Among the single-parent households, those with 3 or 4 children have the highest poverty rate, with 4 household (50.0%) living below poverty.
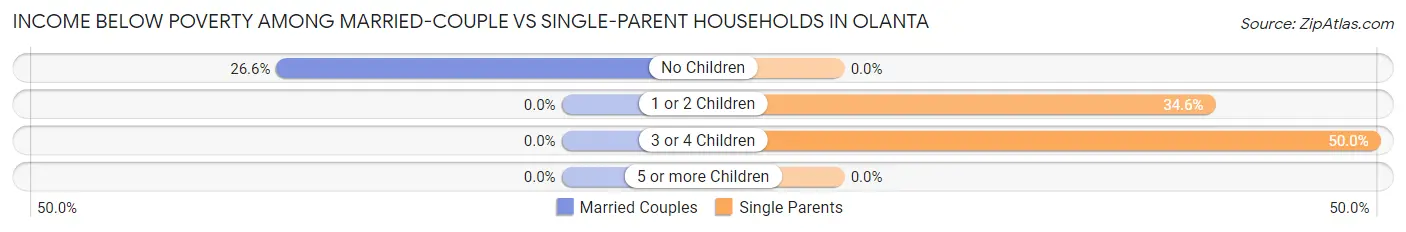
| Children | Married-Couple Families | Single-Parent Households |
| No Children | 17 (26.6%) | 0 (0.0%) |
| 1 or 2 Children | 0 (0.0%) | 9 (34.6%) |
| 3 or 4 Children | 0 (0.0%) | 4 (50.0%) |
| 5 or more Children | 0 (0.0%) | 0 (0.0%) |
| Total | 17 (17.5%) | 13 (31.7%) |
Race in Olanta
The most populous races in Olanta are White / Caucasian (342 | 58.2%), Black / African American (227 | 38.6%), and Two or more Races (19 | 3.2%).
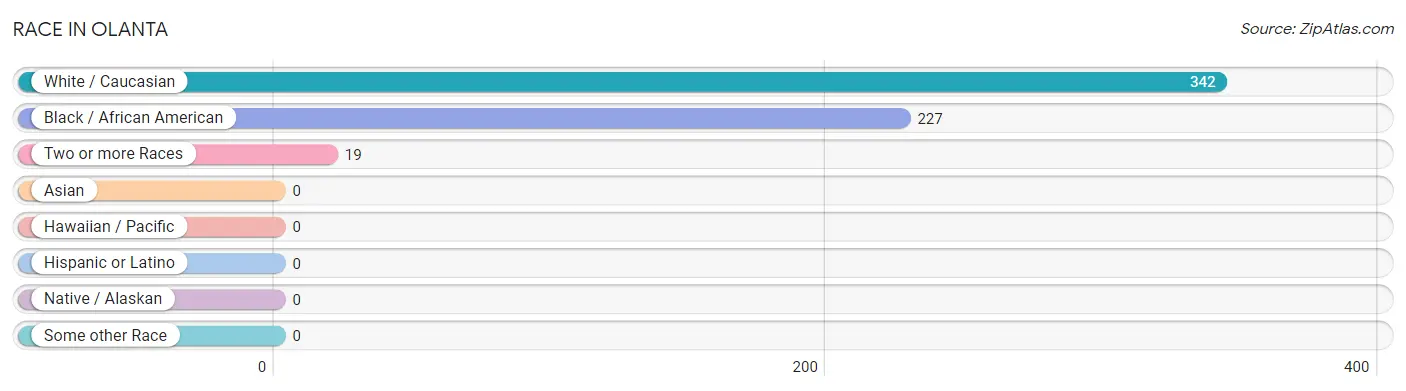
| Race | # Population | % Population |
| Asian | 0 | 0.0% |
| Black / African American | 227 | 38.6% |
| Hawaiian / Pacific | 0 | 0.0% |
| Hispanic or Latino | 0 | 0.0% |
| Native / Alaskan | 0 | 0.0% |
| White / Caucasian | 342 | 58.2% |
| Two or more Races | 19 | 3.2% |
| Some other Race | 0 | 0.0% |
| Total | 588 | 100.0% |
Ancestry in Olanta
The most populous ancestries reported in Olanta are American (63 | 10.7%), Irish (37 | 6.3%), German (12 | 2.0%), English (5 | 0.9%), and Scottish (4 | 0.7%), together accounting for 20.6% of all Olanta residents.
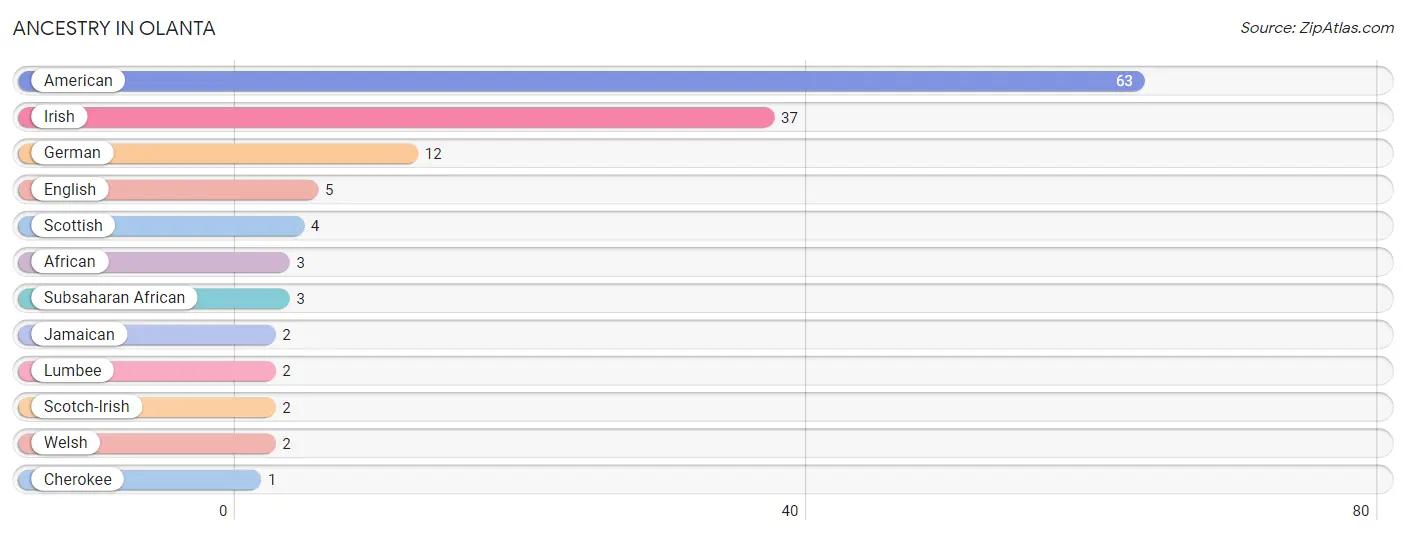
| Ancestry | # Population | % Population |
| African | 3 | 0.5% |
| American | 63 | 10.7% |
| Cherokee | 1 | 0.2% |
| English | 5 | 0.9% |
| German | 12 | 2.0% |
| Irish | 37 | 6.3% |
| Jamaican | 2 | 0.3% |
| Lumbee | 2 | 0.3% |
| Scotch-Irish | 2 | 0.3% |
| Scottish | 4 | 0.7% |
| Subsaharan African | 3 | 0.5% |
| Welsh | 2 | 0.3% | View All 12 Rows |
Immigrants in Olanta

| Immigration Origin | # Population | % Population | View All 0 Rows |
Sex and Age in Olanta
Sex and Age in Olanta
The most populous age groups in Olanta are 35 to 39 Years (27 | 13.6%) for men and 60 to 64 Years (67 | 17.2%) for women.
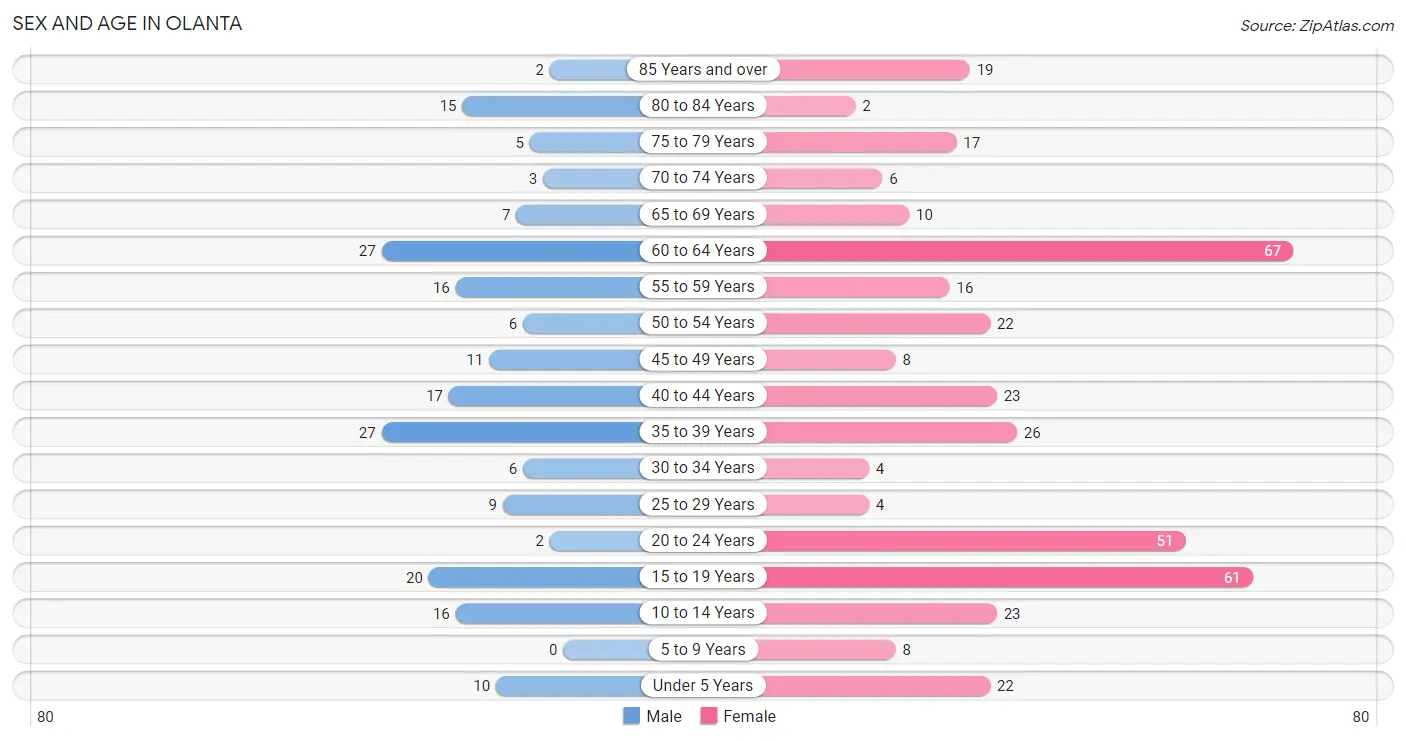
| Age Bracket | Male | Female |
| Under 5 Years | 10 (5.0%) | 22 (5.7%) |
| 5 to 9 Years | 0 (0.0%) | 8 (2.1%) |
| 10 to 14 Years | 16 (8.0%) | 23 (5.9%) |
| 15 to 19 Years | 20 (10.1%) | 61 (15.7%) |
| 20 to 24 Years | 2 (1.0%) | 51 (13.1%) |
| 25 to 29 Years | 9 (4.5%) | 4 (1.0%) |
| 30 to 34 Years | 6 (3.0%) | 4 (1.0%) |
| 35 to 39 Years | 27 (13.6%) | 26 (6.7%) |
| 40 to 44 Years | 17 (8.5%) | 23 (5.9%) |
| 45 to 49 Years | 11 (5.5%) | 8 (2.1%) |
| 50 to 54 Years | 6 (3.0%) | 22 (5.7%) |
| 55 to 59 Years | 16 (8.0%) | 16 (4.1%) |
| 60 to 64 Years | 27 (13.6%) | 67 (17.2%) |
| 65 to 69 Years | 7 (3.5%) | 10 (2.6%) |
| 70 to 74 Years | 3 (1.5%) | 6 (1.5%) |
| 75 to 79 Years | 5 (2.5%) | 17 (4.4%) |
| 80 to 84 Years | 15 (7.5%) | 2 (0.5%) |
| 85 Years and over | 2 (1.0%) | 19 (4.9%) |
| Total | 199 (100.0%) | 389 (100.0%) |
Families and Households in Olanta
Median Family Size in Olanta
The median family size in Olanta is 3.50 persons per family, with single female/mother families (35 | 25.4%) accounting for the largest median family size of 4.29 persons per family. On the other hand, single male/father families (6 | 4.3%) represent the smallest median family size with 2.17 persons per family.
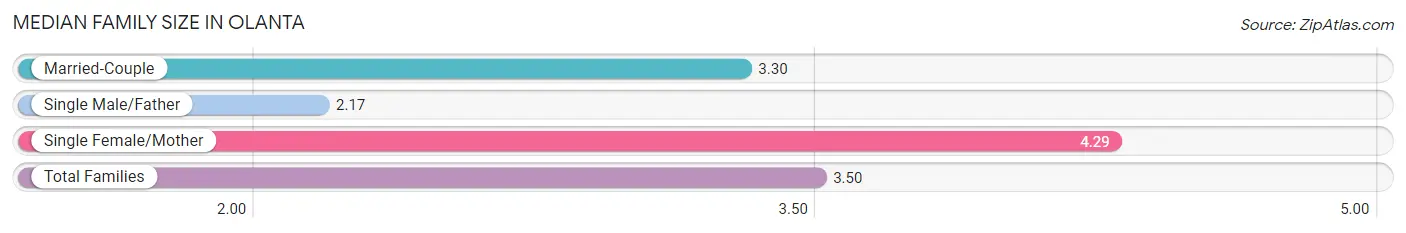
| Family Type | # Families | Family Size |
| Married-Couple | 97 (70.3%) | 3.30 |
| Single Male/Father | 6 (4.3%) | 2.17 |
| Single Female/Mother | 35 (25.4%) | 4.29 |
| Total Families | 138 (100.0%) | 3.50 |
Median Household Size in Olanta
The median household size in Olanta is 2.97 persons per household, with single female/mother households (35 | 17.8%) accounting for the largest median household size of 4.94 persons per household. non-family households (59 | 29.9%) represent the smallest median household size with 1.31 persons per household.
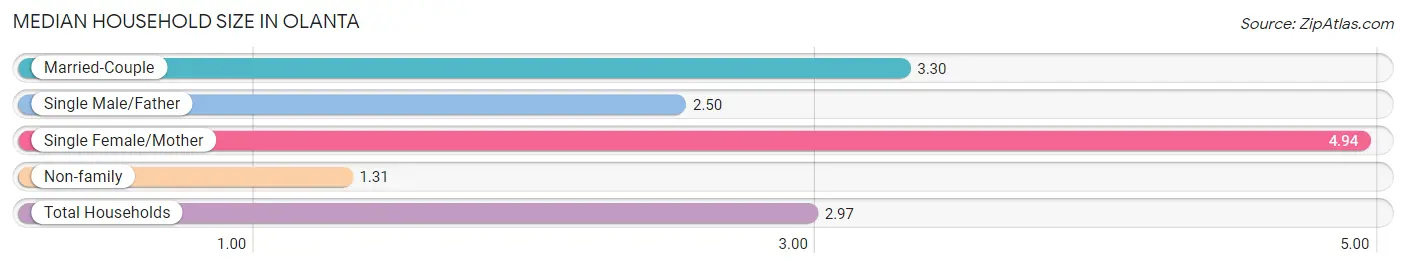
| Household Type | # Households | Household Size |
| Married-Couple | 97 (49.2%) | 3.30 |
| Single Male/Father | 6 (3.0%) | 2.50 |
| Single Female/Mother | 35 (17.8%) | 4.94 |
| Non-family | 59 (29.9%) | 1.31 |
| Total Households | 197 (100.0%) | 2.97 |
Household Size by Marriage Status in Olanta
Out of a total of 197 households in Olanta, 138 (70.1%) are family households, while 59 (29.9%) are nonfamily households. The most numerous type of family households are 2-person households, comprising 69, and the most common type of nonfamily households are 1-person households, comprising 47.
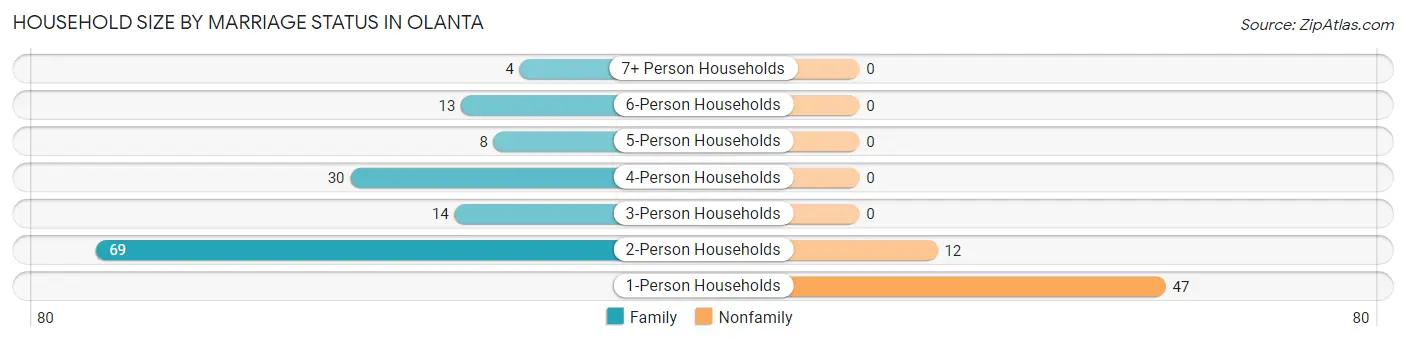
| Household Size | Family Households | Nonfamily Households |
| 1-Person Households | - | 47 (23.9%) |
| 2-Person Households | 69 (35.0%) | 12 (6.1%) |
| 3-Person Households | 14 (7.1%) | 0 (0.0%) |
| 4-Person Households | 30 (15.2%) | 0 (0.0%) |
| 5-Person Households | 8 (4.1%) | 0 (0.0%) |
| 6-Person Households | 13 (6.6%) | 0 (0.0%) |
| 7+ Person Households | 4 (2.0%) | 0 (0.0%) |
| Total | 138 (70.1%) | 59 (29.9%) |
Female Fertility in Olanta
Fertility by Age in Olanta
Average fertility rate in Olanta is 44.0 births per 1,000 women. Women in the age bracket of 35 to 50 years have the highest fertility rate with 100.0 births per 1,000 women. Women in the age bracket of 35 to 50 years acount for 75.0% of all women with births.
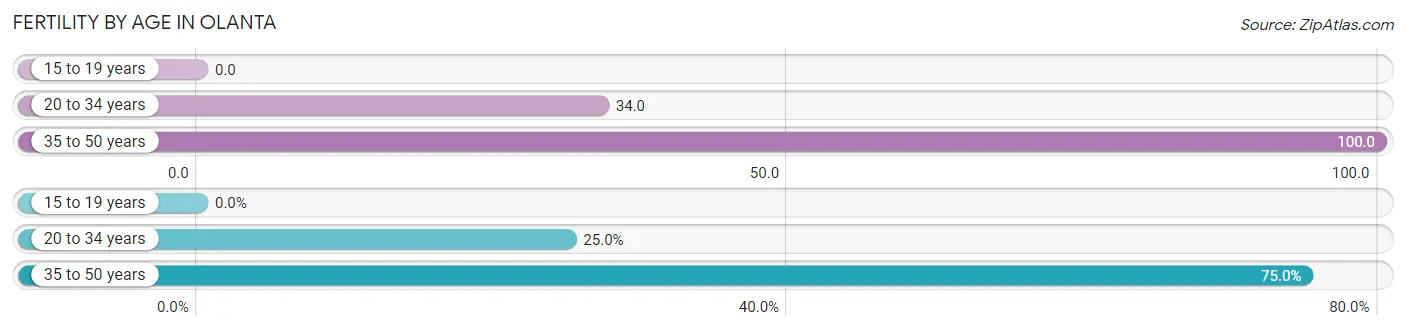
| Age Bracket | Women with Births | Births / 1,000 Women |
| 15 to 19 years | 0 (0.0%) | 0.0 |
| 20 to 34 years | 2 (25.0%) | 34.0 |
| 35 to 50 years | 6 (75.0%) | 100.0 |
| Total | 8 (100.0%) | 44.0 |
Fertility by Age by Marriage Status in Olanta
25.0% of women with births (8) in Olanta are married. The highest percentage of unmarried women with births falls into 35 to 50 years age bracket with 100.0% of them unmarried at the time of birth, while the lowest percentage of unmarried women with births belong to 20 to 34 years age bracket with 0.0% of them unmarried.
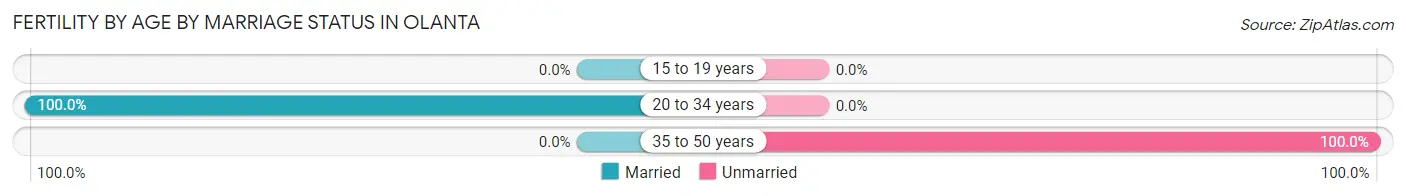
| Age Bracket | Married | Unmarried |
| 15 to 19 years | 0 (0.0%) | 0 (0.0%) |
| 20 to 34 years | 2 (100.0%) | 0 (0.0%) |
| 35 to 50 years | 0 (0.0%) | 6 (100.0%) |
| Total | 2 (25.0%) | 6 (75.0%) |
Fertility by Education in Olanta
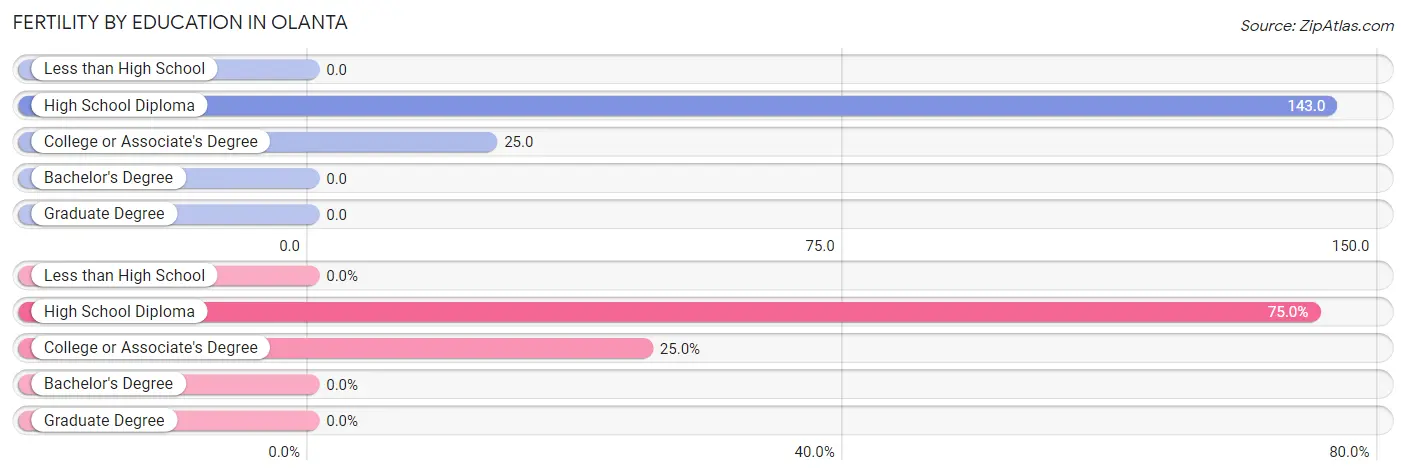
| Educational Attainment | Women with Births | Births / 1,000 Women |
| Less than High School | 0 (0.0%) | 0.0 |
| High School Diploma | 6 (75.0%) | 143.0 |
| College or Associate's Degree | 2 (25.0%) | 25.0 |
| Bachelor's Degree | 0 (0.0%) | 0.0 |
| Graduate Degree | 0 (0.0%) | 0.0 |
| Total | 8 (100.0%) | 44.0 |
Fertility by Education by Marriage Status in Olanta
75.0% of women with births in Olanta are unmarried. Women with the educational attainment of college or associate's degree are most likely to be married with 100.0% of them married at childbirth, while women with the educational attainment of high school diploma are least likely to be married with 100.0% of them unmarried at childbirth.
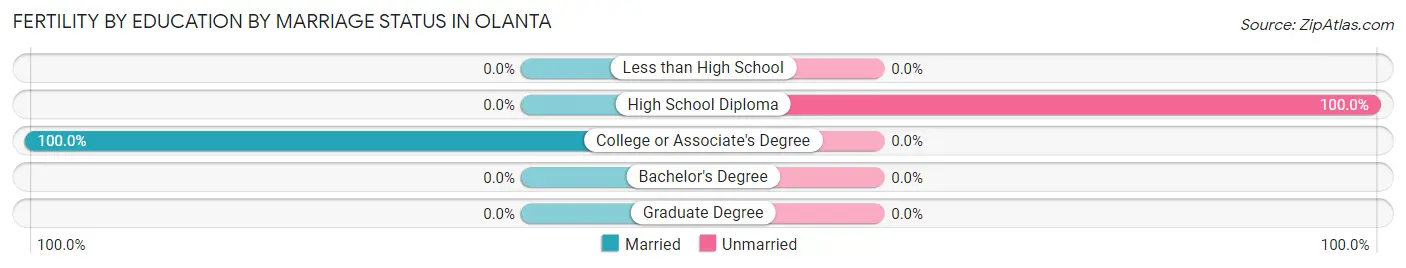
| Educational Attainment | Married | Unmarried |
| Less than High School | 0 (0.0%) | 0 (0.0%) |
| High School Diploma | 0 (0.0%) | 6 (100.0%) |
| College or Associate's Degree | 2 (100.0%) | 0 (0.0%) |
| Bachelor's Degree | 0 (0.0%) | 0 (0.0%) |
| Graduate Degree | 0 (0.0%) | 0 (0.0%) |
| Total | 2 (25.0%) | 6 (75.0%) |
Employment Characteristics in Olanta
Employment by Class of Employer in Olanta
Among the 219 employed individuals in Olanta, private company employees (150 | 68.5%), not-for-profit organizations (28 | 12.8%), and local government employees (28 | 12.8%) make up the most common classes of employment.
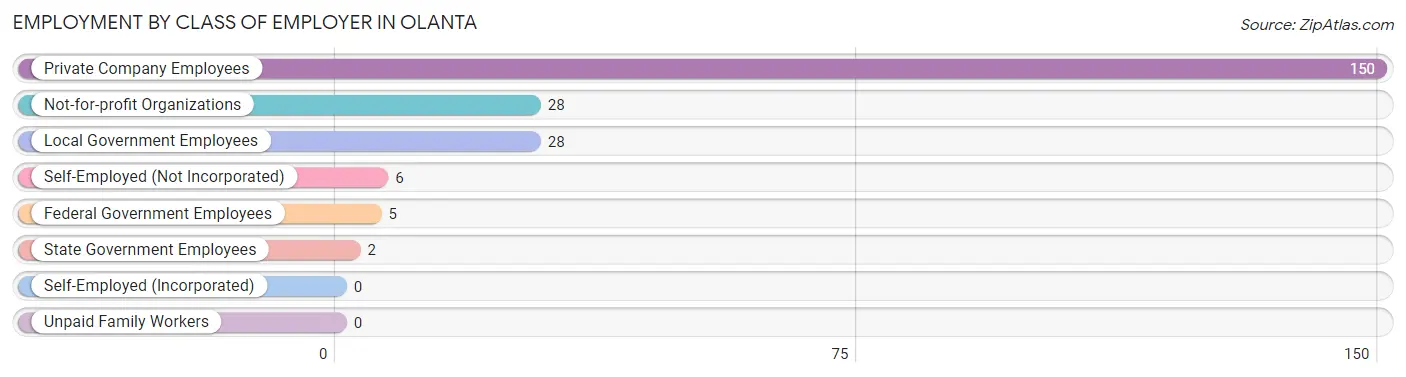
| Employer Class | # Employees | % Employees |
| Private Company Employees | 150 | 68.5% |
| Self-Employed (Incorporated) | 0 | 0.0% |
| Self-Employed (Not Incorporated) | 6 | 2.7% |
| Not-for-profit Organizations | 28 | 12.8% |
| Local Government Employees | 28 | 12.8% |
| State Government Employees | 2 | 0.9% |
| Federal Government Employees | 5 | 2.3% |
| Unpaid Family Workers | 0 | 0.0% |
| Total | 219 | 100.0% |
Employment Status by Age in Olanta
According to the labor force statistics for Olanta, out of the total population over 16 years of age (486), 52.5% or 255 individuals are in the labor force, with 9.4% or 24 of them unemployed. The age group with the highest labor force participation rate is 20 to 24 years, with 94.3% or 50 individuals in the labor force. Within the labor force, the 16 to 19 years age range has the highest percentage of unemployed individuals, with 32.4% or 11 of them being unemployed.
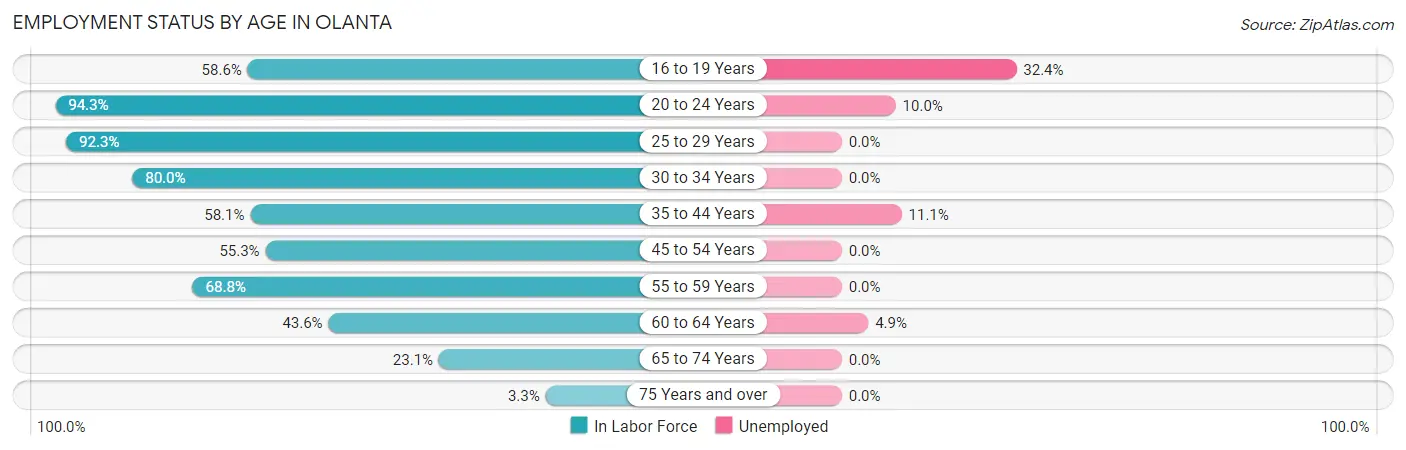
| Age Bracket | In Labor Force | Unemployed |
| 16 to 19 Years | 34 (58.6%) | 11 (32.4%) |
| 20 to 24 Years | 50 (94.3%) | 5 (10.0%) |
| 25 to 29 Years | 12 (92.3%) | 0 (0.0%) |
| 30 to 34 Years | 8 (80.0%) | 0 (0.0%) |
| 35 to 44 Years | 54 (58.1%) | 6 (11.1%) |
| 45 to 54 Years | 26 (55.3%) | 0 (0.0%) |
| 55 to 59 Years | 22 (68.8%) | 0 (0.0%) |
| 60 to 64 Years | 41 (43.6%) | 2 (4.9%) |
| 65 to 74 Years | 6 (23.1%) | 0 (0.0%) |
| 75 Years and over | 2 (3.3%) | 0 (0.0%) |
| Total | 255 (52.5%) | 24 (9.4%) |
Employment Status by Educational Attainment in Olanta
According to labor force statistics for Olanta, 56.4% of individuals (163) out of the total population between 25 and 64 years of age (289) are in the labor force, with 4.9% or 8 of them being unemployed. The group with the highest labor force participation rate are those with the educational attainment of bachelor's degree or higher, with 72.7% or 32 individuals in the labor force. Within the labor force, individuals with high school diploma education have the highest percentage of unemployment, with 7.6% or 6 of them being unemployed.
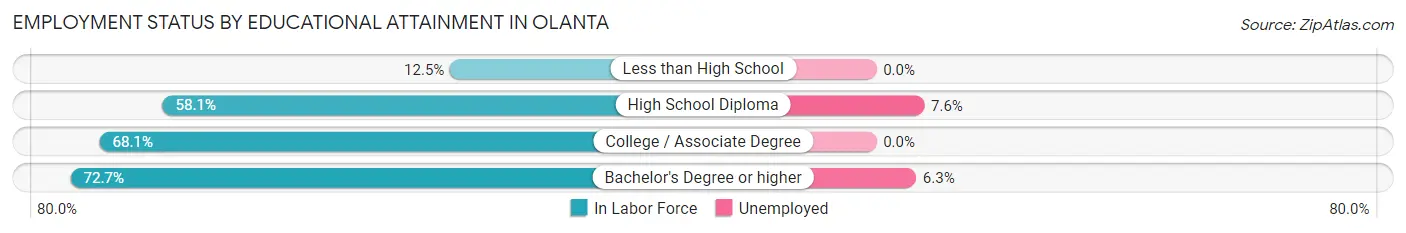
| Educational Attainment | In Labor Force | Unemployed |
| Less than High School | 5 (12.5%) | 0 (0.0%) |
| High School Diploma | 79 (58.1%) | 10 (7.6%) |
| College / Associate Degree | 47 (68.1%) | 0 (0.0%) |
| Bachelor's Degree or higher | 32 (72.7%) | 3 (6.3%) |
| Total | 163 (56.4%) | 14 (4.9%) |
Employment Occupations by Sex in Olanta
Management, Business, Science and Arts Occupations
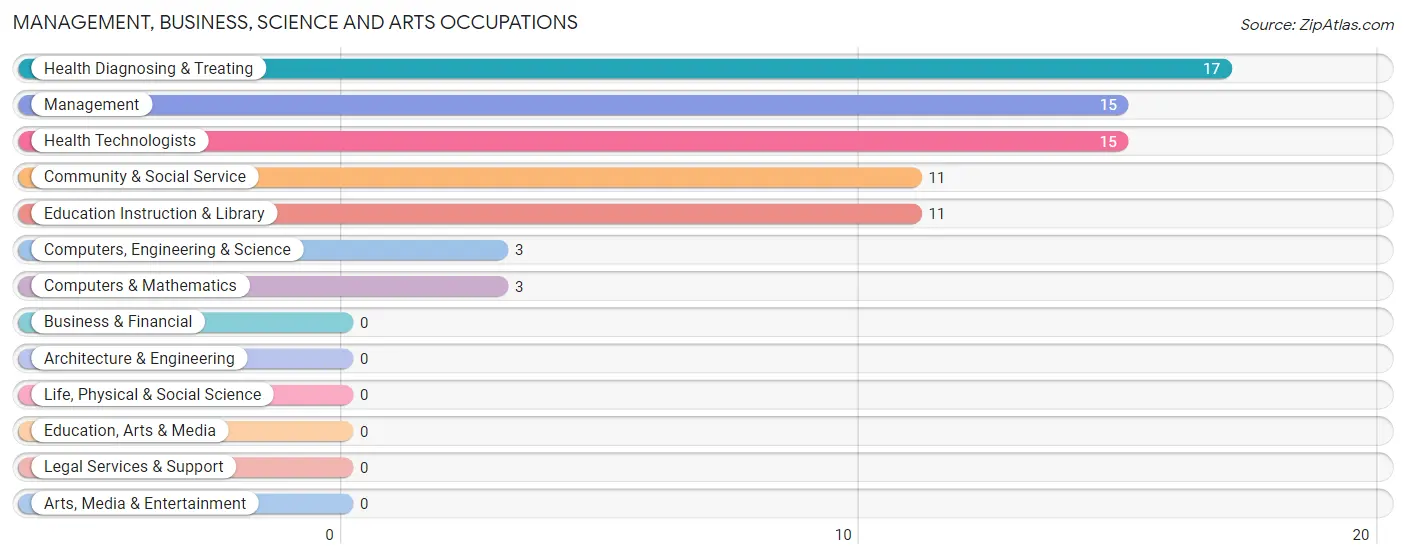
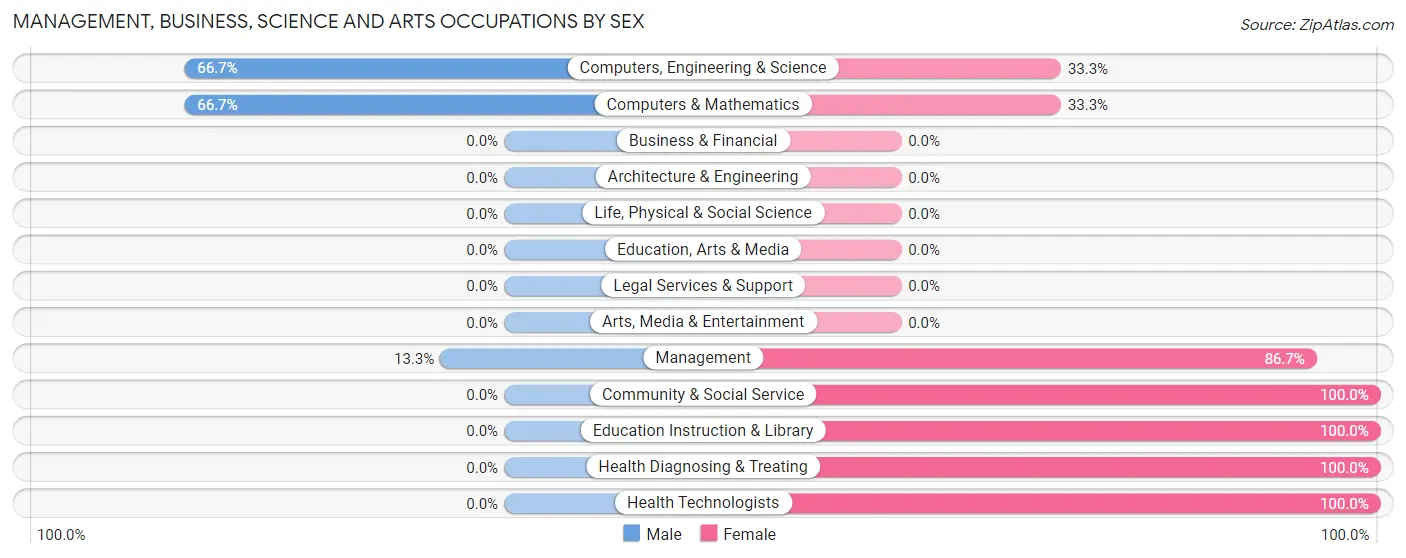
The most common Management, Business, Science and Arts occupations in Olanta are Health Diagnosing & Treating (17 | 7.4%), Management (15 | 6.5%), Health Technologists (15 | 6.5%), Community & Social Service (11 | 4.8%), and Education Instruction & Library (11 | 4.8%).
Management, Business, Science and Arts Occupations by Sex
Within the Management, Business, Science and Arts occupations in Olanta, the most male-oriented occupations are Computers, Engineering & Science (66.7%), Computers & Mathematics (66.7%), and Management (13.3%), while the most female-oriented occupations are Community & Social Service (100.0%), Education Instruction & Library (100.0%), and Health Diagnosing & Treating (100.0%).
| Occupation | Male | Female |
| Management | 2 (13.3%) | 13 (86.7%) |
| Business & Financial | 0 (0.0%) | 0 (0.0%) |
| Computers, Engineering & Science | 2 (66.7%) | 1 (33.3%) |
| Computers & Mathematics | 2 (66.7%) | 1 (33.3%) |
| Architecture & Engineering | 0 (0.0%) | 0 (0.0%) |
| Life, Physical & Social Science | 0 (0.0%) | 0 (0.0%) |
| Community & Social Service | 0 (0.0%) | 11 (100.0%) |
| Education, Arts & Media | 0 (0.0%) | 0 (0.0%) |
| Legal Services & Support | 0 (0.0%) | 0 (0.0%) |
| Education Instruction & Library | 0 (0.0%) | 11 (100.0%) |
| Arts, Media & Entertainment | 0 (0.0%) | 0 (0.0%) |
| Health Diagnosing & Treating | 0 (0.0%) | 17 (100.0%) |
| Health Technologists | 0 (0.0%) | 15 (100.0%) |
| Total (Category) | 4 (8.7%) | 42 (91.3%) |
| Total (Overall) | 74 (32.0%) | 157 (68.0%) |
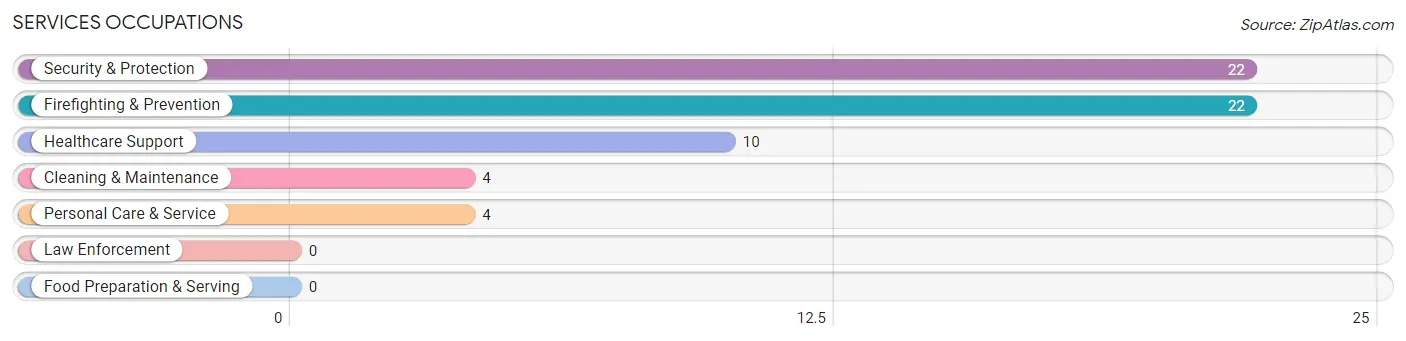
Services Occupations
The most common Services occupations in Olanta are Security & Protection (22 | 9.5%), Firefighting & Prevention (22 | 9.5%), Healthcare Support (10 | 4.3%), Cleaning & Maintenance (4 | 1.7%), and Personal Care & Service (4 | 1.7%).
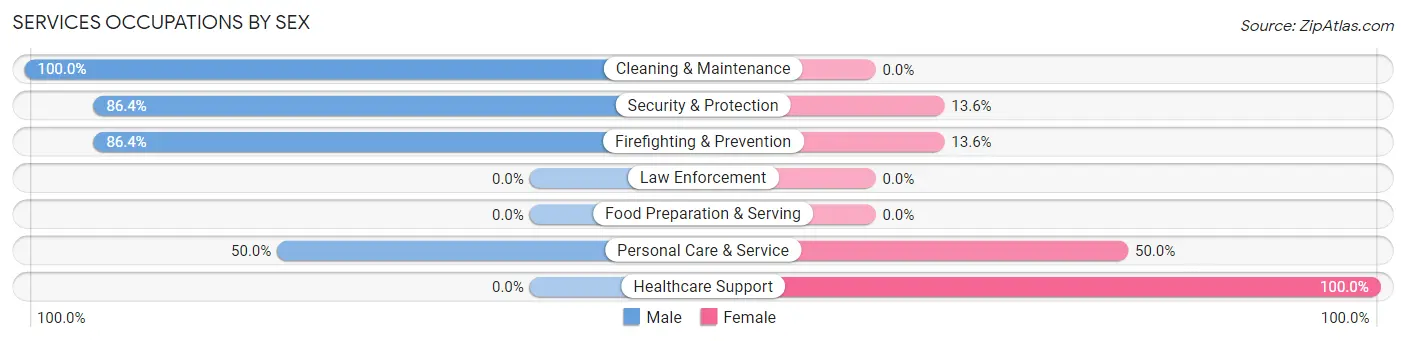
Services Occupations by Sex
Within the Services occupations in Olanta, the most male-oriented occupations are Cleaning & Maintenance (100.0%), Security & Protection (86.4%), and Firefighting & Prevention (86.4%), while the most female-oriented occupations are Healthcare Support (100.0%), Personal Care & Service (50.0%), and Security & Protection (13.6%).
| Occupation | Male | Female |
| Healthcare Support | 0 (0.0%) | 10 (100.0%) |
| Security & Protection | 19 (86.4%) | 3 (13.6%) |
| Firefighting & Prevention | 19 (86.4%) | 3 (13.6%) |
| Law Enforcement | 0 (0.0%) | 0 (0.0%) |
| Food Preparation & Serving | 0 (0.0%) | 0 (0.0%) |
| Cleaning & Maintenance | 4 (100.0%) | 0 (0.0%) |
| Personal Care & Service | 2 (50.0%) | 2 (50.0%) |
| Total (Category) | 25 (62.5%) | 15 (37.5%) |
| Total (Overall) | 74 (32.0%) | 157 (68.0%) |
Sales and Office Occupations
The most common Sales and Office occupations in Olanta are Sales & Related (58 | 25.1%), and Office & Administration (32 | 13.9%).

Sales and Office Occupations by Sex

| Occupation | Male | Female |
| Sales & Related | 4 (6.9%) | 54 (93.1%) |
| Office & Administration | 2 (6.2%) | 30 (93.8%) |
| Total (Category) | 6 (6.7%) | 84 (93.3%) |
| Total (Overall) | 74 (32.0%) | 157 (68.0%) |
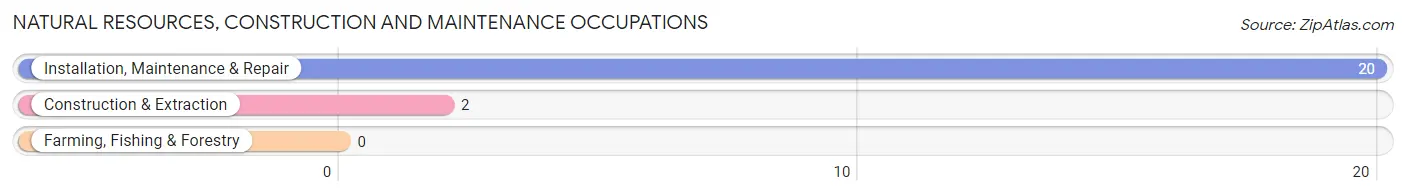
Natural Resources, Construction and Maintenance Occupations
The most common Natural Resources, Construction and Maintenance occupations in Olanta are Installation, Maintenance & Repair (20 | 8.7%), and Construction & Extraction (2 | 0.9%).
Natural Resources, Construction and Maintenance Occupations by Sex
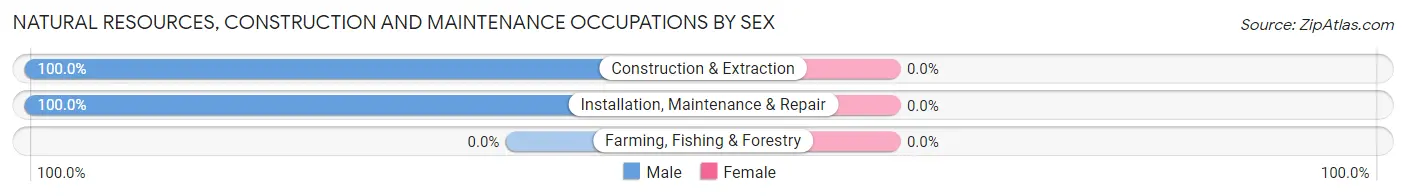
| Occupation | Male | Female |
| Farming, Fishing & Forestry | 0 (0.0%) | 0 (0.0%) |
| Construction & Extraction | 2 (100.0%) | 0 (0.0%) |
| Installation, Maintenance & Repair | 20 (100.0%) | 0 (0.0%) |
| Total (Category) | 22 (100.0%) | 0 (0.0%) |
| Total (Overall) | 74 (32.0%) | 157 (68.0%) |
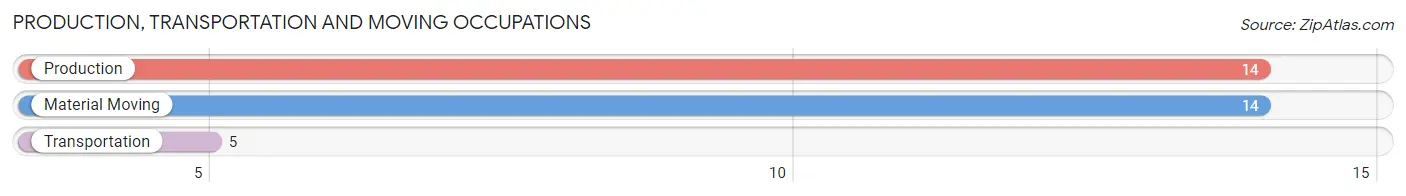
Production, Transportation and Moving Occupations
The most common Production, Transportation and Moving occupations in Olanta are Production (14 | 6.1%), Material Moving (14 | 6.1%), and Transportation (5 | 2.2%).
Production, Transportation and Moving Occupations by Sex
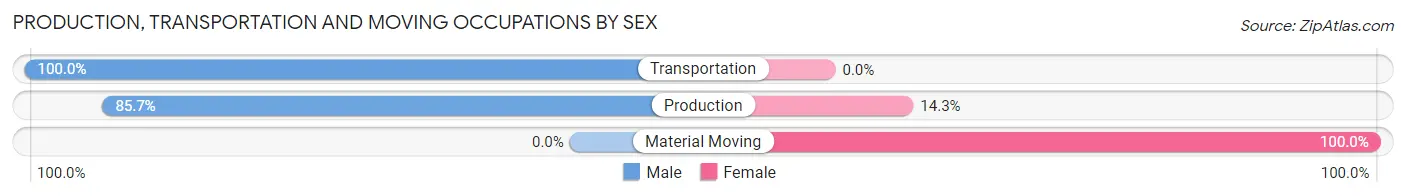
| Occupation | Male | Female |
| Production | 12 (85.7%) | 2 (14.3%) |
| Transportation | 5 (100.0%) | 0 (0.0%) |
| Material Moving | 0 (0.0%) | 14 (100.0%) |
| Total (Category) | 17 (51.5%) | 16 (48.5%) |
| Total (Overall) | 74 (32.0%) | 157 (68.0%) |
Employment Industries by Sex in Olanta
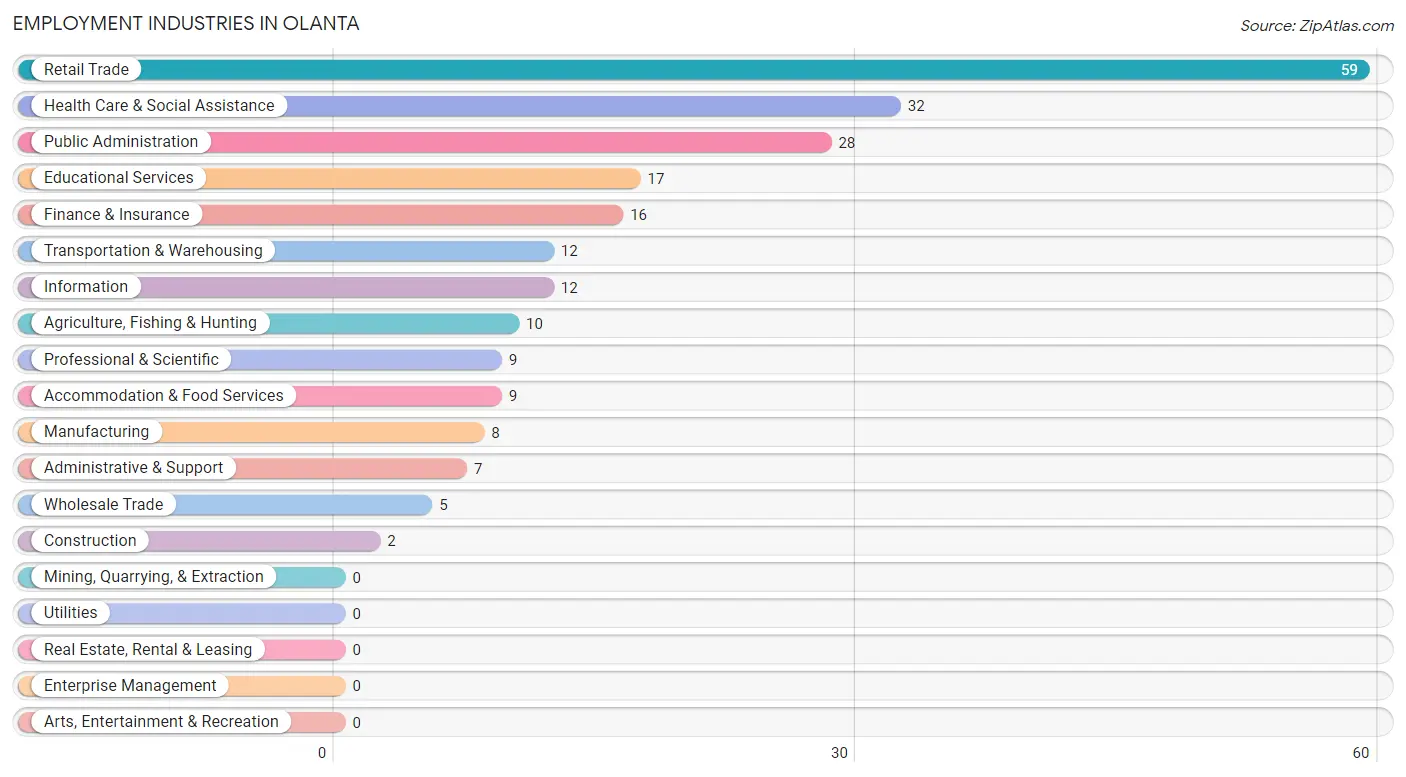
Employment Industries in Olanta
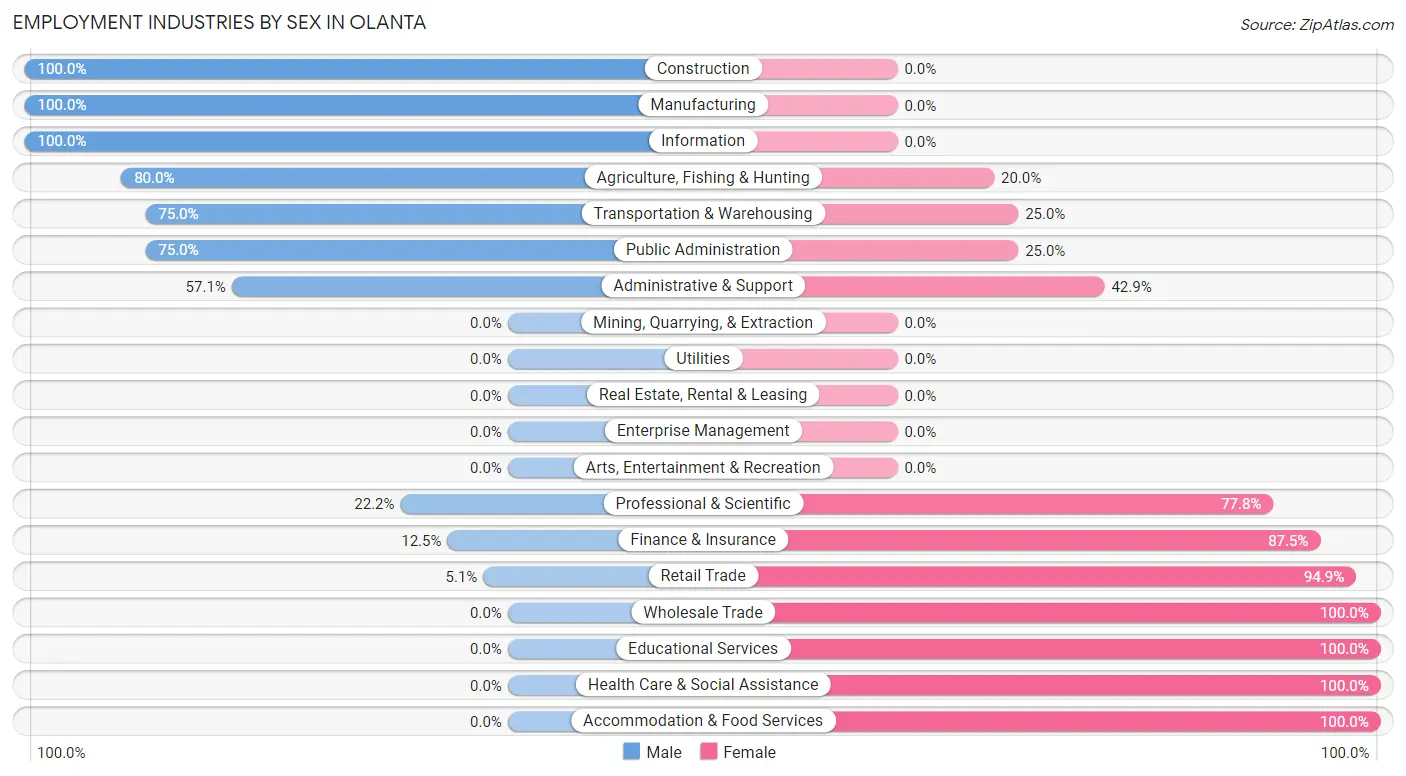
The major employment industries in Olanta include Retail Trade (59 | 25.5%), Health Care & Social Assistance (32 | 13.9%), Public Administration (28 | 12.1%), Educational Services (17 | 7.4%), and Finance & Insurance (16 | 6.9%).
Employment Industries by Sex in Olanta
The Olanta industries that see more men than women are Construction (100.0%), Manufacturing (100.0%), and Information (100.0%), whereas the industries that tend to have a higher number of women are Wholesale Trade (100.0%), Educational Services (100.0%), and Health Care & Social Assistance (100.0%).
| Industry | Male | Female |
| Agriculture, Fishing & Hunting | 8 (80.0%) | 2 (20.0%) |
| Mining, Quarrying, & Extraction | 0 (0.0%) | 0 (0.0%) |
| Construction | 2 (100.0%) | 0 (0.0%) |
| Manufacturing | 8 (100.0%) | 0 (0.0%) |
| Wholesale Trade | 0 (0.0%) | 5 (100.0%) |
| Retail Trade | 3 (5.1%) | 56 (94.9%) |
| Transportation & Warehousing | 9 (75.0%) | 3 (25.0%) |
| Utilities | 0 (0.0%) | 0 (0.0%) |
| Information | 12 (100.0%) | 0 (0.0%) |
| Finance & Insurance | 2 (12.5%) | 14 (87.5%) |
| Real Estate, Rental & Leasing | 0 (0.0%) | 0 (0.0%) |
| Professional & Scientific | 2 (22.2%) | 7 (77.8%) |
| Enterprise Management | 0 (0.0%) | 0 (0.0%) |
| Administrative & Support | 4 (57.1%) | 3 (42.9%) |
| Educational Services | 0 (0.0%) | 17 (100.0%) |
| Health Care & Social Assistance | 0 (0.0%) | 32 (100.0%) |
| Arts, Entertainment & Recreation | 0 (0.0%) | 0 (0.0%) |
| Accommodation & Food Services | 0 (0.0%) | 9 (100.0%) |
| Public Administration | 21 (75.0%) | 7 (25.0%) |
| Total | 74 (32.0%) | 157 (68.0%) |
Education in Olanta
School Enrollment in Olanta
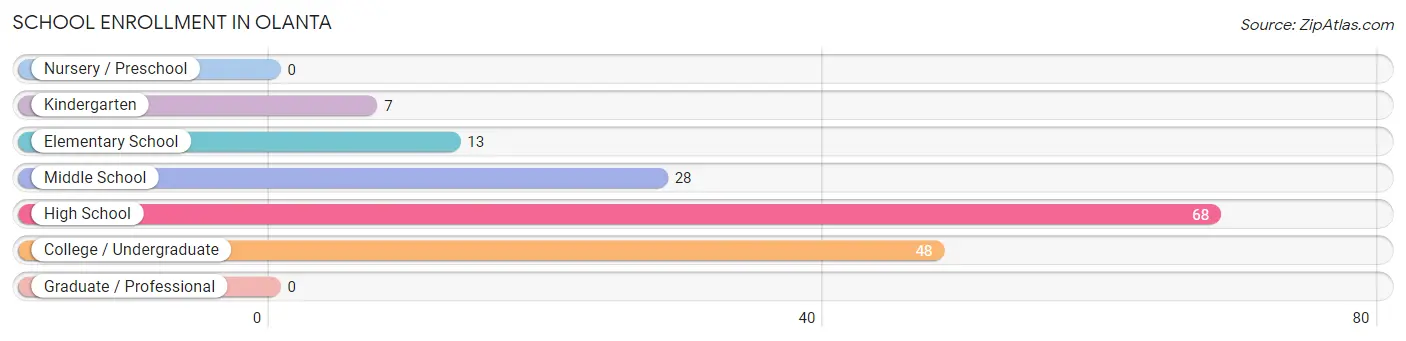
The most common levels of schooling among the 164 students in Olanta are high school (68 | 41.5%), college / undergraduate (48 | 29.3%), and middle school (28 | 17.1%).
| School Level | # Students | % Students |
| Nursery / Preschool | 0 | 0.0% |
| Kindergarten | 7 | 4.3% |
| Elementary School | 13 | 7.9% |
| Middle School | 28 | 17.1% |
| High School | 68 | 41.5% |
| College / Undergraduate | 48 | 29.3% |
| Graduate / Professional | 0 | 0.0% |
| Total | 164 | 100.0% |
School Enrollment by Age by Funding Source in Olanta
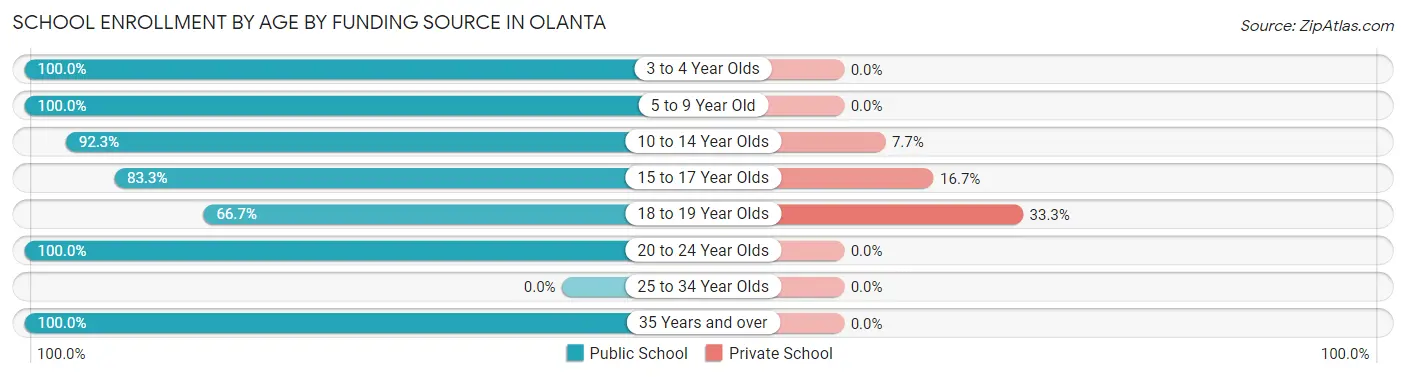
Out of a total of 164 students who are enrolled in schools in Olanta, 14 (8.5%) attend a private institution, while the remaining 150 (91.5%) are enrolled in public schools. The age group of 18 to 19 year olds has the highest likelihood of being enrolled in private schools, with 1 (33.3% in the age bracket) enrolled. Conversely, the age group of 3 to 4 year olds has the lowest likelihood of being enrolled in a private school, with 4 (100.0% in the age bracket) attending a public institution.
| Age Bracket | Public School | Private School |
| 3 to 4 Year Olds | 4 (100.0%) | 0 (0.0%) |
| 5 to 9 Year Old | 8 (100.0%) | 0 (0.0%) |
| 10 to 14 Year Olds | 36 (92.3%) | 3 (7.7%) |
| 15 to 17 Year Olds | 50 (83.3%) | 10 (16.7%) |
| 18 to 19 Year Olds | 2 (66.7%) | 1 (33.3%) |
| 20 to 24 Year Olds | 31 (100.0%) | 0 (0.0%) |
| 25 to 34 Year Olds | 0 (0.0%) | 0 (0.0%) |
| 35 Years and over | 19 (100.0%) | 0 (0.0%) |
| Total | 150 (91.5%) | 14 (8.5%) |
Educational Attainment by Field of Study in Olanta
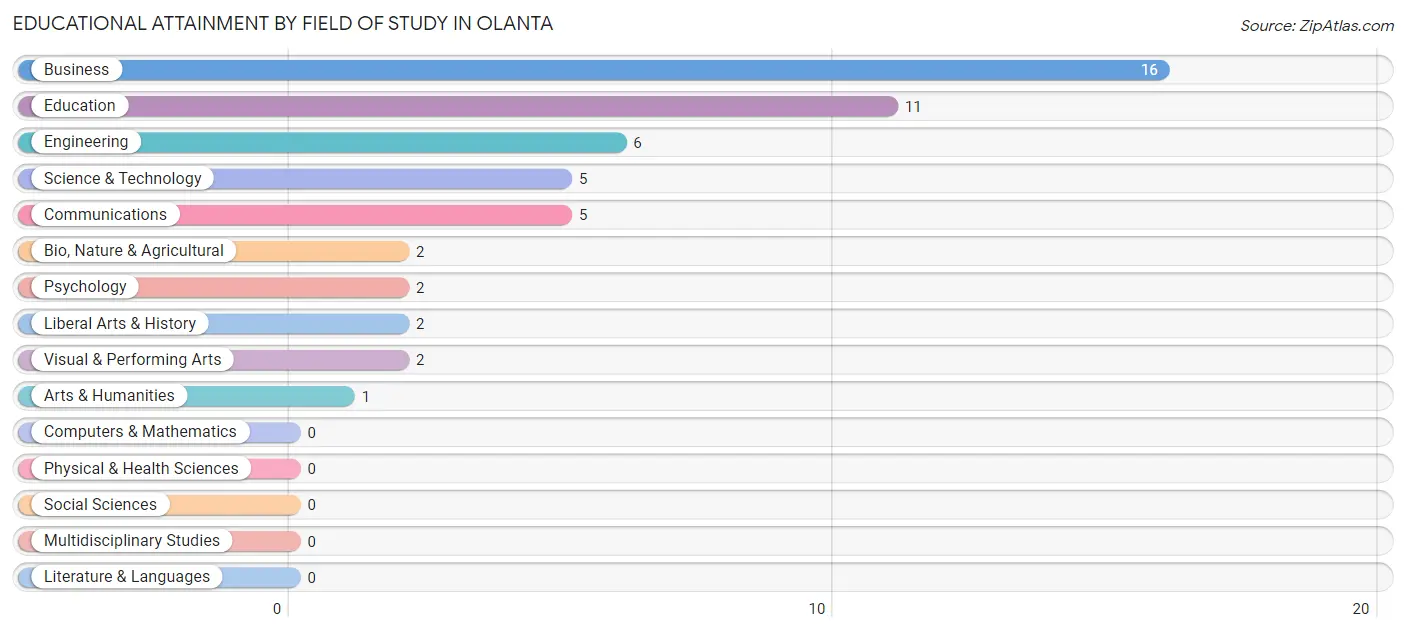
Business (16 | 30.8%), education (11 | 21.1%), engineering (6 | 11.5%), science & technology (5 | 9.6%), and communications (5 | 9.6%) are the most common fields of study among 52 individuals in Olanta who have obtained a bachelor's degree or higher.
| Field of Study | # Graduates | % Graduates |
| Computers & Mathematics | 0 | 0.0% |
| Bio, Nature & Agricultural | 2 | 3.8% |
| Physical & Health Sciences | 0 | 0.0% |
| Psychology | 2 | 3.8% |
| Social Sciences | 0 | 0.0% |
| Engineering | 6 | 11.5% |
| Multidisciplinary Studies | 0 | 0.0% |
| Science & Technology | 5 | 9.6% |
| Business | 16 | 30.8% |
| Education | 11 | 21.1% |
| Literature & Languages | 0 | 0.0% |
| Liberal Arts & History | 2 | 3.8% |
| Visual & Performing Arts | 2 | 3.8% |
| Communications | 5 | 9.6% |
| Arts & Humanities | 1 | 1.9% |
| Total | 52 | 100.0% |
Transportation & Commute in Olanta
Vehicle Availability by Sex in Olanta
The most prevalent vehicle ownership categories in Olanta are males with 2 vehicles (36, accounting for 50.0%) and females with 2 vehicles (46, making up 24.5%).
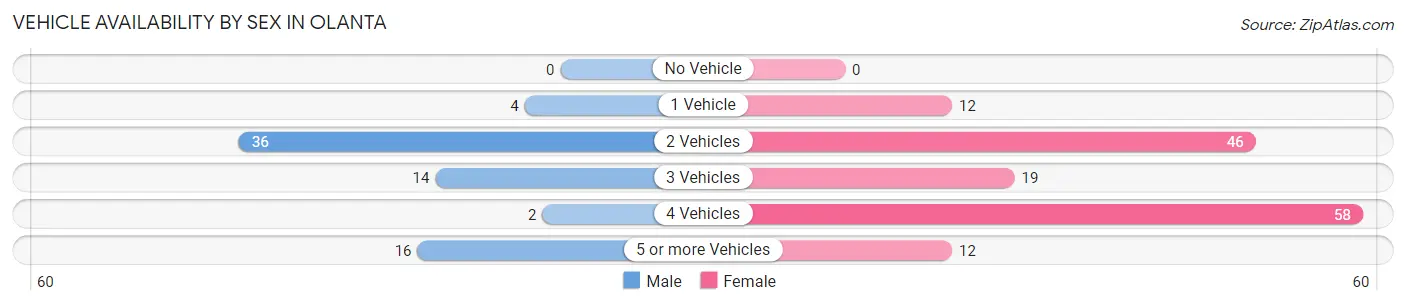
| Vehicles Available | Male | Female |
| No Vehicle | 0 (0.0%) | 0 (0.0%) |
| 1 Vehicle | 4 (5.6%) | 12 (8.2%) |
| 2 Vehicles | 36 (50.0%) | 46 (31.3%) |
| 3 Vehicles | 14 (19.4%) | 19 (12.9%) |
| 4 Vehicles | 2 (2.8%) | 58 (39.5%) |
| 5 or more Vehicles | 16 (22.2%) | 12 (8.2%) |
| Total | 72 (100.0%) | 147 (100.0%) |
Commute Time in Olanta
The most frequently occuring commute durations in Olanta are 10 to 14 minutes (40 commuters, 19.0%), 15 to 19 minutes (37 commuters, 17.5%), and 30 to 34 minutes (22 commuters, 10.4%).
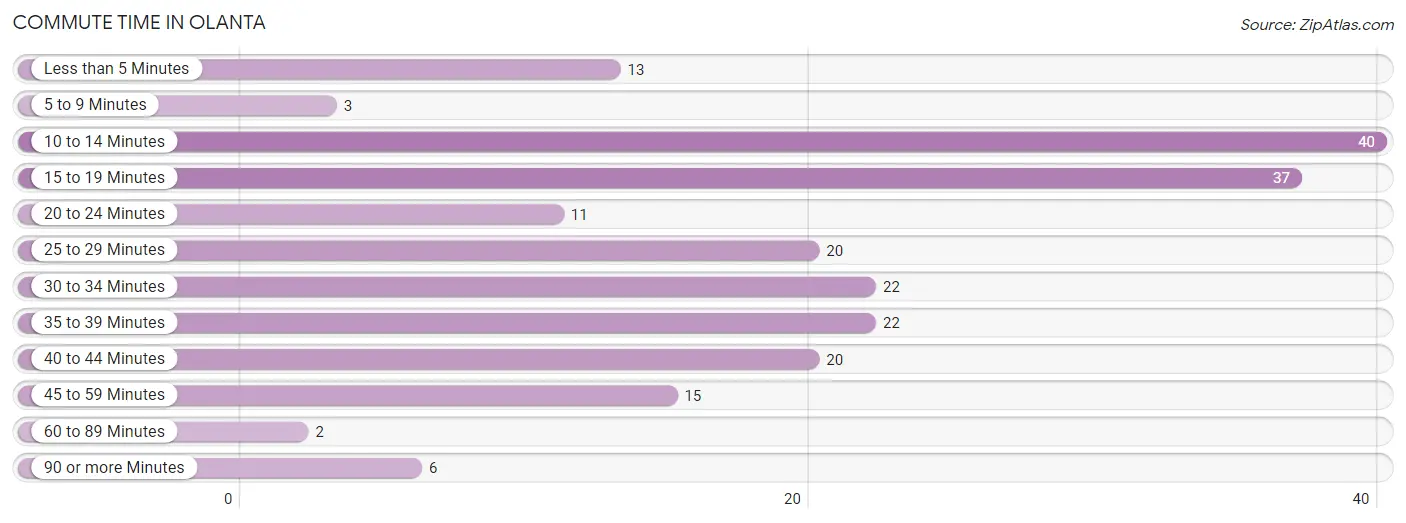
| Commute Time | # Commuters | % Commuters |
| Less than 5 Minutes | 13 | 6.2% |
| 5 to 9 Minutes | 3 | 1.4% |
| 10 to 14 Minutes | 40 | 19.0% |
| 15 to 19 Minutes | 37 | 17.5% |
| 20 to 24 Minutes | 11 | 5.2% |
| 25 to 29 Minutes | 20 | 9.5% |
| 30 to 34 Minutes | 22 | 10.4% |
| 35 to 39 Minutes | 22 | 10.4% |
| 40 to 44 Minutes | 20 | 9.5% |
| 45 to 59 Minutes | 15 | 7.1% |
| 60 to 89 Minutes | 2 | 0.9% |
| 90 or more Minutes | 6 | 2.8% |
Commute Time by Sex in Olanta
The most common commute times in Olanta are 25 to 29 minutes (18 commuters, 25.0%) for males and 10 to 14 minutes (24 commuters, 17.3%) for females.
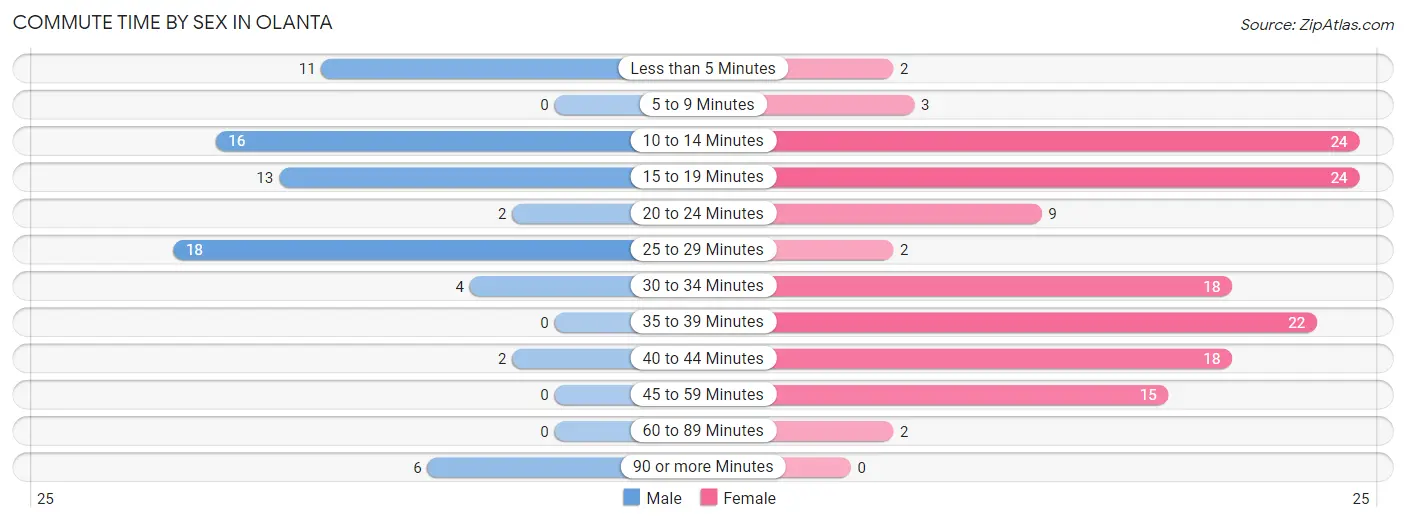
| Commute Time | Male | Female |
| Less than 5 Minutes | 11 (15.3%) | 2 (1.4%) |
| 5 to 9 Minutes | 0 (0.0%) | 3 (2.2%) |
| 10 to 14 Minutes | 16 (22.2%) | 24 (17.3%) |
| 15 to 19 Minutes | 13 (18.1%) | 24 (17.3%) |
| 20 to 24 Minutes | 2 (2.8%) | 9 (6.5%) |
| 25 to 29 Minutes | 18 (25.0%) | 2 (1.4%) |
| 30 to 34 Minutes | 4 (5.6%) | 18 (13.0%) |
| 35 to 39 Minutes | 0 (0.0%) | 22 (15.8%) |
| 40 to 44 Minutes | 2 (2.8%) | 18 (13.0%) |
| 45 to 59 Minutes | 0 (0.0%) | 15 (10.8%) |
| 60 to 89 Minutes | 0 (0.0%) | 2 (1.4%) |
| 90 or more Minutes | 6 (8.3%) | 0 (0.0%) |
Time of Departure to Work by Sex in Olanta
The most frequent times of departure to work in Olanta are 7:30 AM to 7:59 AM (16, 22.2%) for males and 7:00 AM to 7:29 AM (27, 19.4%) for females.
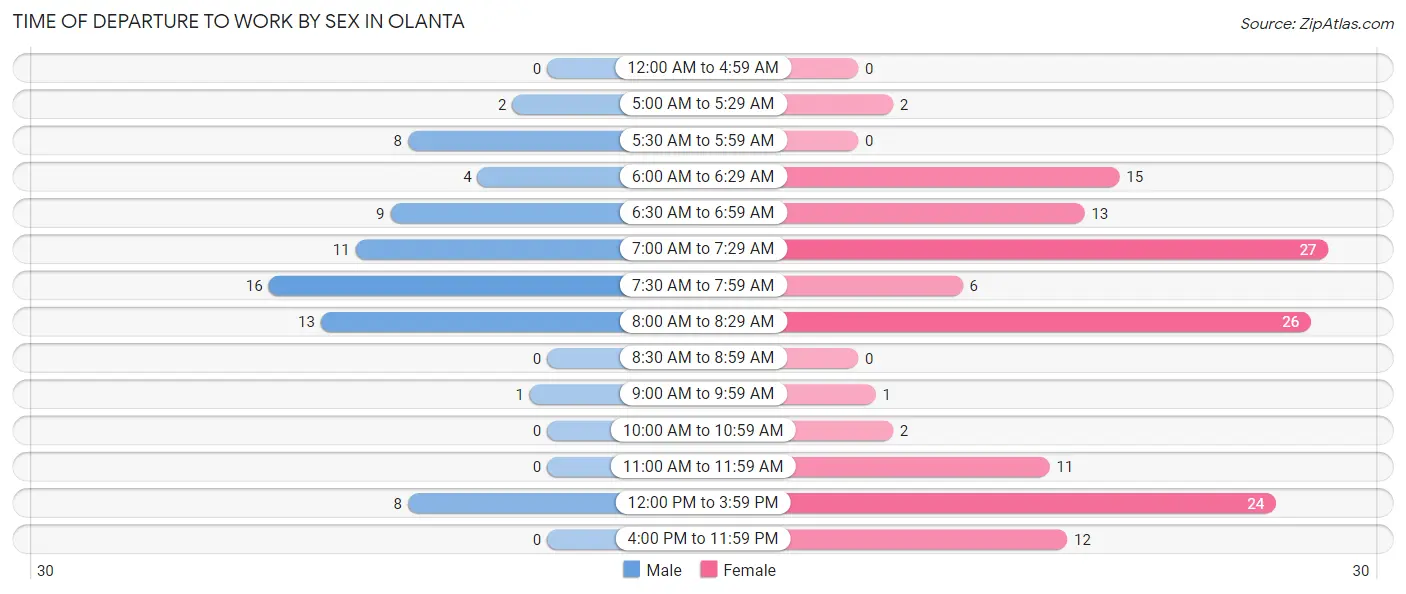
| Time of Departure | Male | Female |
| 12:00 AM to 4:59 AM | 0 (0.0%) | 0 (0.0%) |
| 5:00 AM to 5:29 AM | 2 (2.8%) | 2 (1.4%) |
| 5:30 AM to 5:59 AM | 8 (11.1%) | 0 (0.0%) |
| 6:00 AM to 6:29 AM | 4 (5.6%) | 15 (10.8%) |
| 6:30 AM to 6:59 AM | 9 (12.5%) | 13 (9.3%) |
| 7:00 AM to 7:29 AM | 11 (15.3%) | 27 (19.4%) |
| 7:30 AM to 7:59 AM | 16 (22.2%) | 6 (4.3%) |
| 8:00 AM to 8:29 AM | 13 (18.1%) | 26 (18.7%) |
| 8:30 AM to 8:59 AM | 0 (0.0%) | 0 (0.0%) |
| 9:00 AM to 9:59 AM | 1 (1.4%) | 1 (0.7%) |
| 10:00 AM to 10:59 AM | 0 (0.0%) | 2 (1.4%) |
| 11:00 AM to 11:59 AM | 0 (0.0%) | 11 (7.9%) |
| 12:00 PM to 3:59 PM | 8 (11.1%) | 24 (17.3%) |
| 4:00 PM to 11:59 PM | 0 (0.0%) | 12 (8.6%) |
| Total | 72 (100.0%) | 139 (100.0%) |
Housing Occupancy in Olanta
Occupancy by Ownership in Olanta
Of the total 197 dwellings in Olanta, owner-occupied units account for 140 (71.1%), while renter-occupied units make up 57 (28.9%).
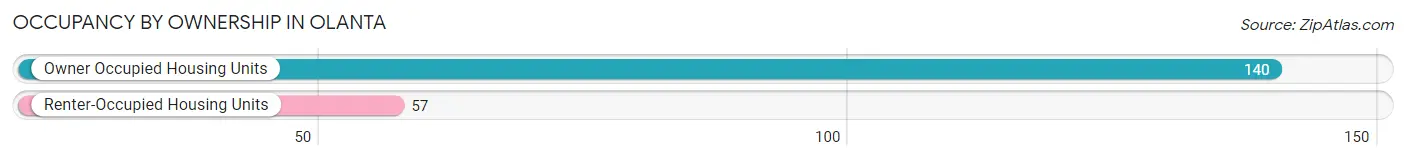
| Occupancy | # Housing Units | % Housing Units |
| Owner Occupied Housing Units | 140 | 71.1% |
| Renter-Occupied Housing Units | 57 | 28.9% |
| Total Occupied Housing Units | 197 | 100.0% |
Occupancy by Household Size in Olanta
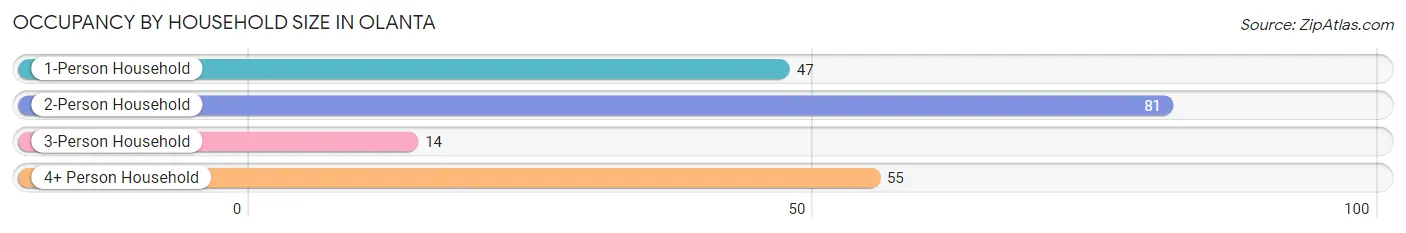
| Household Size | # Housing Units | % Housing Units |
| 1-Person Household | 47 | 23.9% |
| 2-Person Household | 81 | 41.1% |
| 3-Person Household | 14 | 7.1% |
| 4+ Person Household | 55 | 27.9% |
| Total Housing Units | 197 | 100.0% |
Occupancy by Ownership by Household Size in Olanta
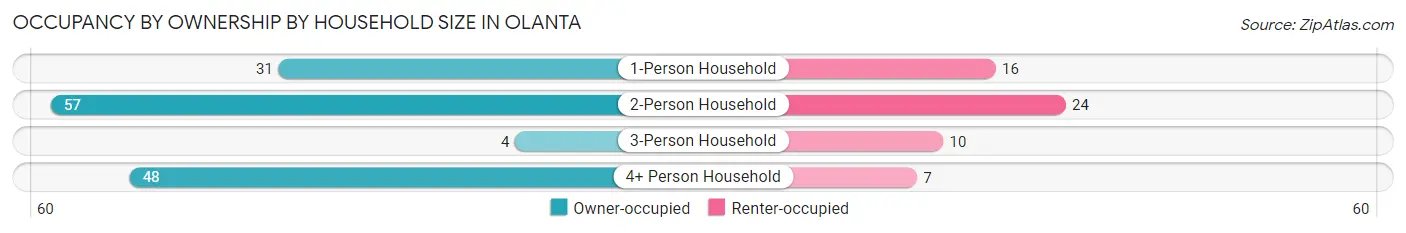
| Household Size | Owner-occupied | Renter-occupied |
| 1-Person Household | 31 (66.0%) | 16 (34.0%) |
| 2-Person Household | 57 (70.4%) | 24 (29.6%) |
| 3-Person Household | 4 (28.6%) | 10 (71.4%) |
| 4+ Person Household | 48 (87.3%) | 7 (12.7%) |
| Total Housing Units | 140 (71.1%) | 57 (28.9%) |
Occupancy by Educational Attainment in Olanta
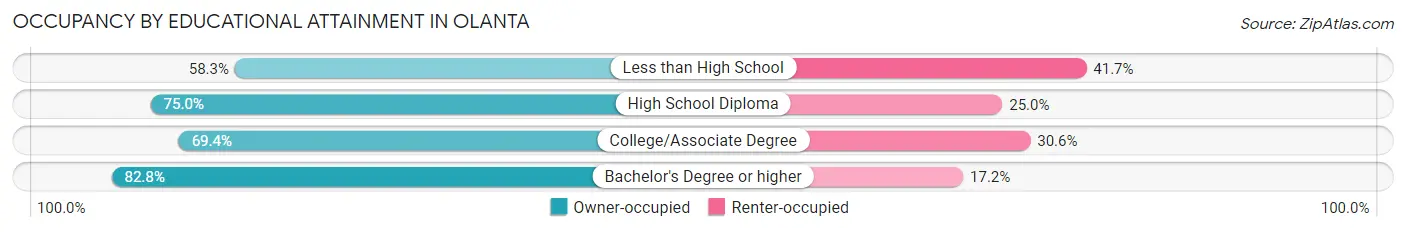
| Household Size | Owner-occupied | Renter-occupied |
| Less than High School | 21 (58.3%) | 15 (41.7%) |
| High School Diploma | 45 (75.0%) | 15 (25.0%) |
| College/Associate Degree | 50 (69.4%) | 22 (30.6%) |
| Bachelor's Degree or higher | 24 (82.8%) | 5 (17.2%) |
Occupancy by Age of Householder in Olanta
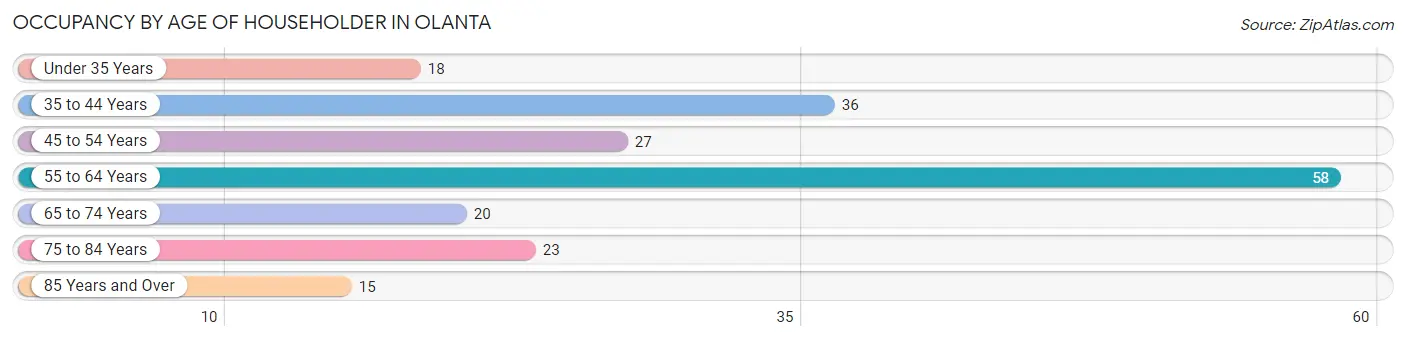
| Age Bracket | # Households | % Households |
| Under 35 Years | 18 | 9.1% |
| 35 to 44 Years | 36 | 18.3% |
| 45 to 54 Years | 27 | 13.7% |
| 55 to 64 Years | 58 | 29.4% |
| 65 to 74 Years | 20 | 10.2% |
| 75 to 84 Years | 23 | 11.7% |
| 85 Years and Over | 15 | 7.6% |
| Total | 197 | 100.0% |
Housing Finances in Olanta
Median Income by Occupancy in Olanta
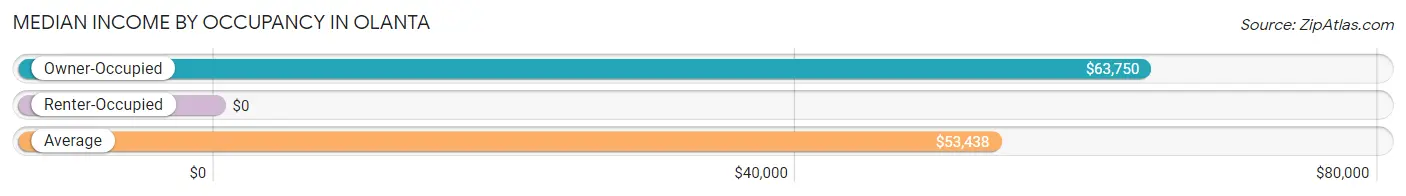
| Occupancy Type | # Households | Median Income |
| Owner-Occupied | 140 (71.1%) | $63,750 |
| Renter-Occupied | 57 (28.9%) | $0 |
| Average | 197 (100.0%) | $53,438 |
Occupancy by Householder Income Bracket in Olanta
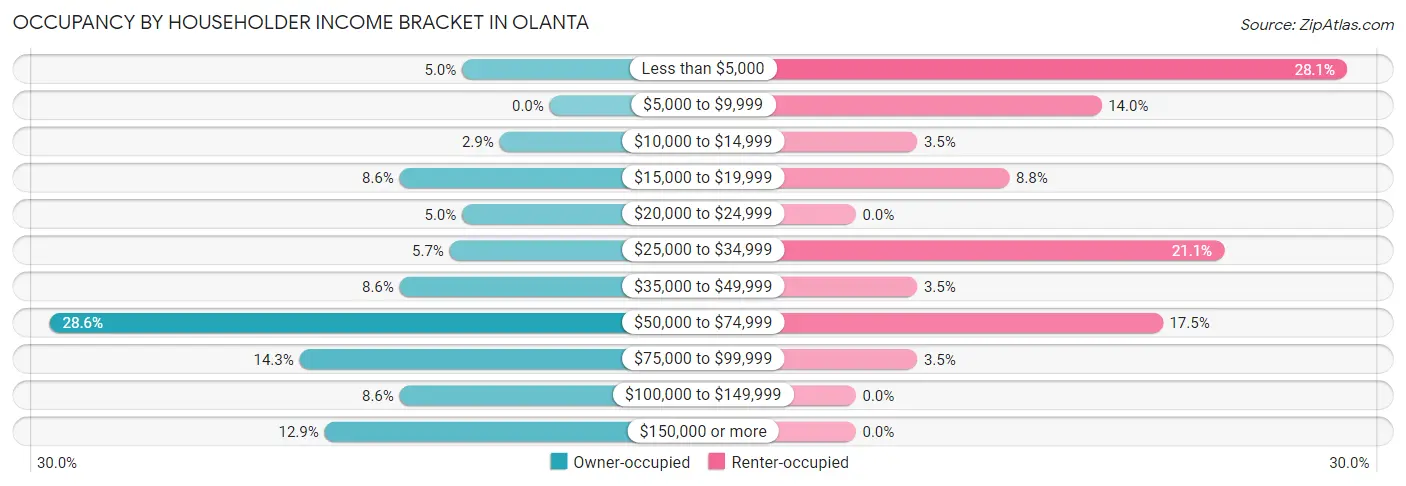
| Income Bracket | Owner-occupied | Renter-occupied |
| Less than $5,000 | 7 (5.0%) | 16 (28.1%) |
| $5,000 to $9,999 | 0 (0.0%) | 8 (14.0%) |
| $10,000 to $14,999 | 4 (2.9%) | 2 (3.5%) |
| $15,000 to $19,999 | 12 (8.6%) | 5 (8.8%) |
| $20,000 to $24,999 | 7 (5.0%) | 0 (0.0%) |
| $25,000 to $34,999 | 8 (5.7%) | 12 (21.0%) |
| $35,000 to $49,999 | 12 (8.6%) | 2 (3.5%) |
| $50,000 to $74,999 | 40 (28.6%) | 10 (17.5%) |
| $75,000 to $99,999 | 20 (14.3%) | 2 (3.5%) |
| $100,000 to $149,999 | 12 (8.6%) | 0 (0.0%) |
| $150,000 or more | 18 (12.9%) | 0 (0.0%) |
| Total | 140 (100.0%) | 57 (100.0%) |
Monthly Housing Cost Tiers in Olanta
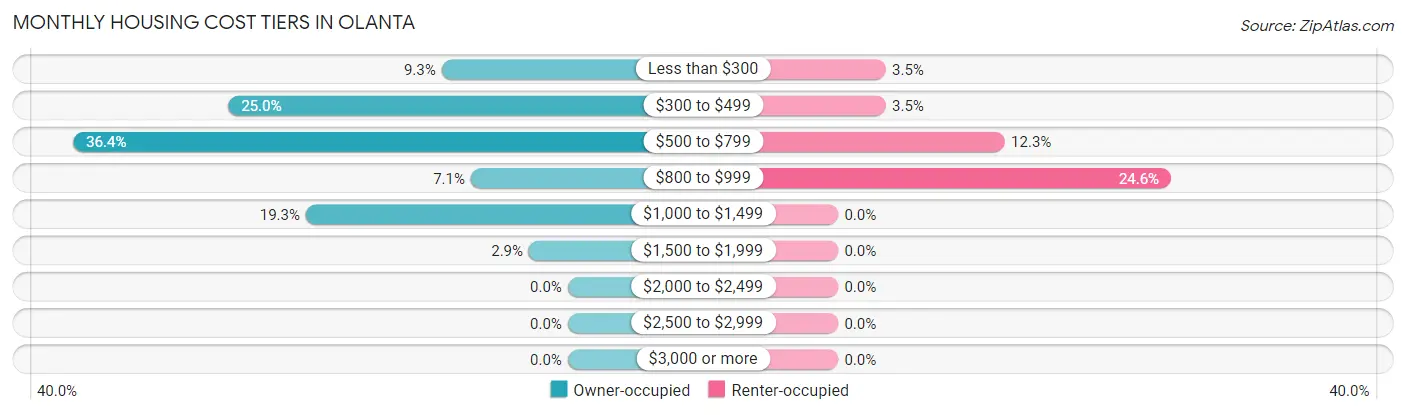
| Monthly Cost | Owner-occupied | Renter-occupied |
| Less than $300 | 13 (9.3%) | 2 (3.5%) |
| $300 to $499 | 35 (25.0%) | 2 (3.5%) |
| $500 to $799 | 51 (36.4%) | 7 (12.3%) |
| $800 to $999 | 10 (7.1%) | 14 (24.6%) |
| $1,000 to $1,499 | 27 (19.3%) | 0 (0.0%) |
| $1,500 to $1,999 | 4 (2.9%) | 0 (0.0%) |
| $2,000 to $2,499 | 0 (0.0%) | 0 (0.0%) |
| $2,500 to $2,999 | 0 (0.0%) | 0 (0.0%) |
| $3,000 or more | 0 (0.0%) | 0 (0.0%) |
| Total | 140 (100.0%) | 57 (100.0%) |
Physical Housing Characteristics in Olanta
Housing Structures in Olanta
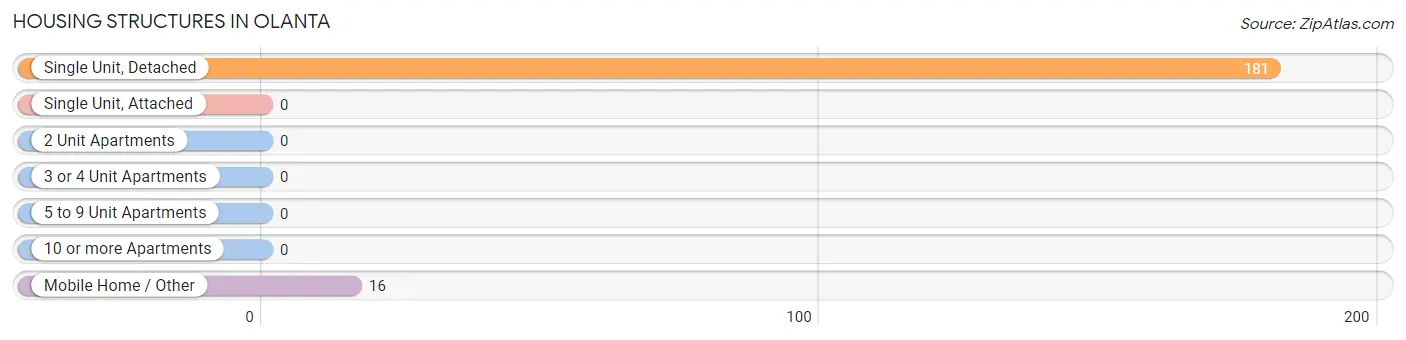
| Structure Type | # Housing Units | % Housing Units |
| Single Unit, Detached | 181 | 91.9% |
| Single Unit, Attached | 0 | 0.0% |
| 2 Unit Apartments | 0 | 0.0% |
| 3 or 4 Unit Apartments | 0 | 0.0% |
| 5 to 9 Unit Apartments | 0 | 0.0% |
| 10 or more Apartments | 0 | 0.0% |
| Mobile Home / Other | 16 | 8.1% |
| Total | 197 | 100.0% |
Housing Structures by Occupancy in Olanta
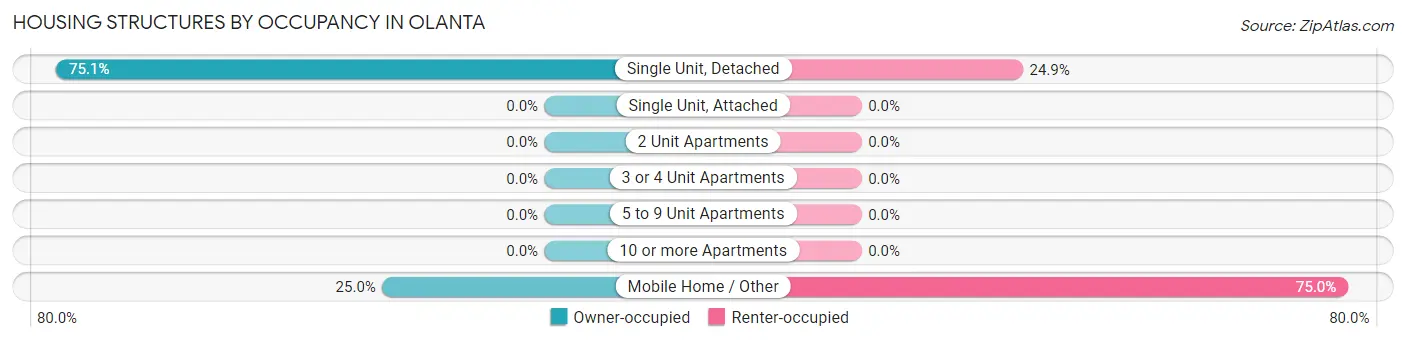
| Structure Type | Owner-occupied | Renter-occupied |
| Single Unit, Detached | 136 (75.1%) | 45 (24.9%) |
| Single Unit, Attached | 0 (0.0%) | 0 (0.0%) |
| 2 Unit Apartments | 0 (0.0%) | 0 (0.0%) |
| 3 or 4 Unit Apartments | 0 (0.0%) | 0 (0.0%) |
| 5 to 9 Unit Apartments | 0 (0.0%) | 0 (0.0%) |
| 10 or more Apartments | 0 (0.0%) | 0 (0.0%) |
| Mobile Home / Other | 4 (25.0%) | 12 (75.0%) |
| Total | 140 (71.1%) | 57 (28.9%) |
Housing Structures by Number of Rooms in Olanta
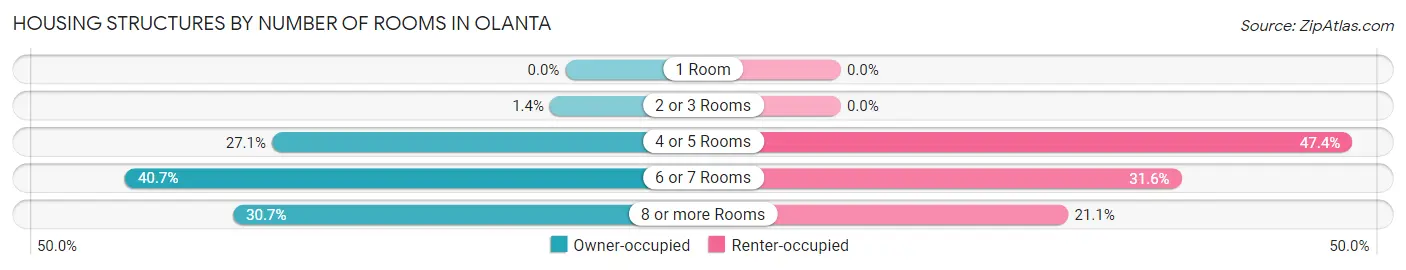
| Number of Rooms | Owner-occupied | Renter-occupied |
| 1 Room | 0 (0.0%) | 0 (0.0%) |
| 2 or 3 Rooms | 2 (1.4%) | 0 (0.0%) |
| 4 or 5 Rooms | 38 (27.1%) | 27 (47.4%) |
| 6 or 7 Rooms | 57 (40.7%) | 18 (31.6%) |
| 8 or more Rooms | 43 (30.7%) | 12 (21.0%) |
| Total | 140 (100.0%) | 57 (100.0%) |
Housing Structure by Heating Type in Olanta
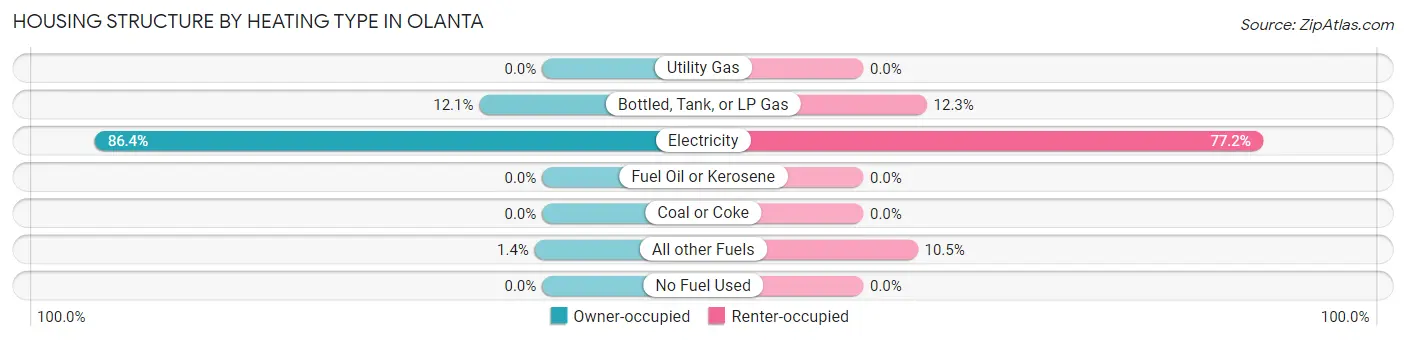
| Heating Type | Owner-occupied | Renter-occupied |
| Utility Gas | 0 (0.0%) | 0 (0.0%) |
| Bottled, Tank, or LP Gas | 17 (12.1%) | 7 (12.3%) |
| Electricity | 121 (86.4%) | 44 (77.2%) |
| Fuel Oil or Kerosene | 0 (0.0%) | 0 (0.0%) |
| Coal or Coke | 0 (0.0%) | 0 (0.0%) |
| All other Fuels | 2 (1.4%) | 6 (10.5%) |
| No Fuel Used | 0 (0.0%) | 0 (0.0%) |
| Total | 140 (100.0%) | 57 (100.0%) |
Household Vehicle Usage in Olanta
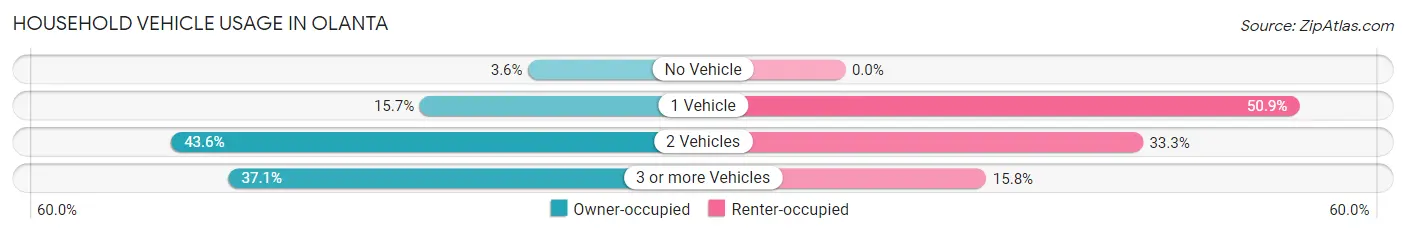
| Vehicles per Household | Owner-occupied | Renter-occupied |
| No Vehicle | 5 (3.6%) | 0 (0.0%) |
| 1 Vehicle | 22 (15.7%) | 29 (50.9%) |
| 2 Vehicles | 61 (43.6%) | 19 (33.3%) |
| 3 or more Vehicles | 52 (37.1%) | 9 (15.8%) |
| Total | 140 (100.0%) | 57 (100.0%) |
Real Estate & Mortgages in Olanta
Real Estate and Mortgage Overview in Olanta
| Characteristic | Without Mortgage | With Mortgage |
| Housing Units | 90 | 50 |
| Median Property Value | $97,700 | $162,500 |
| Median Household Income | $67,500 | $0 |
| Monthly Housing Costs | $500 | $0 |
| Real Estate Taxes | $319 | $1 |
Property Value by Mortgage Status in Olanta
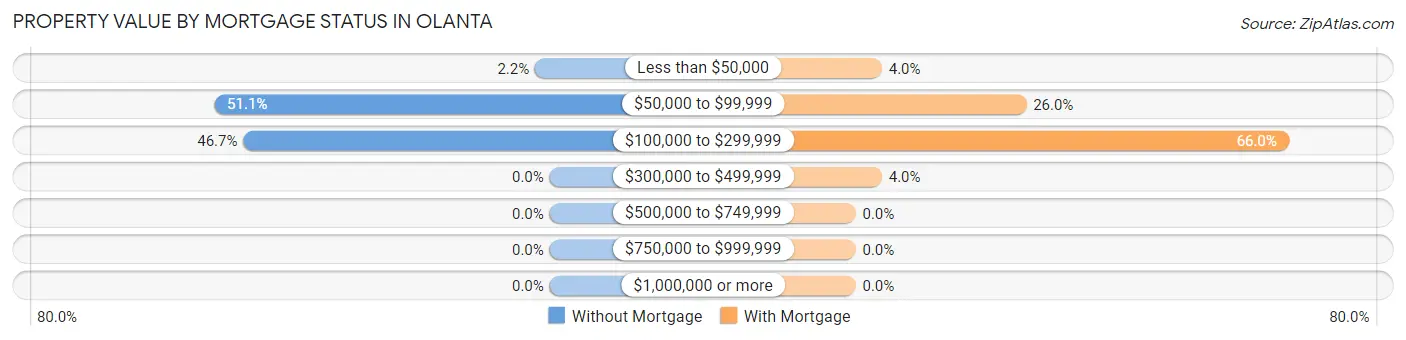
| Property Value | Without Mortgage | With Mortgage |
| Less than $50,000 | 2 (2.2%) | 2 (4.0%) |
| $50,000 to $99,999 | 46 (51.1%) | 13 (26.0%) |
| $100,000 to $299,999 | 42 (46.7%) | 33 (66.0%) |
| $300,000 to $499,999 | 0 (0.0%) | 2 (4.0%) |
| $500,000 to $749,999 | 0 (0.0%) | 0 (0.0%) |
| $750,000 to $999,999 | 0 (0.0%) | 0 (0.0%) |
| $1,000,000 or more | 0 (0.0%) | 0 (0.0%) |
| Total | 90 (100.0%) | 50 (100.0%) |
Household Income by Mortgage Status in Olanta
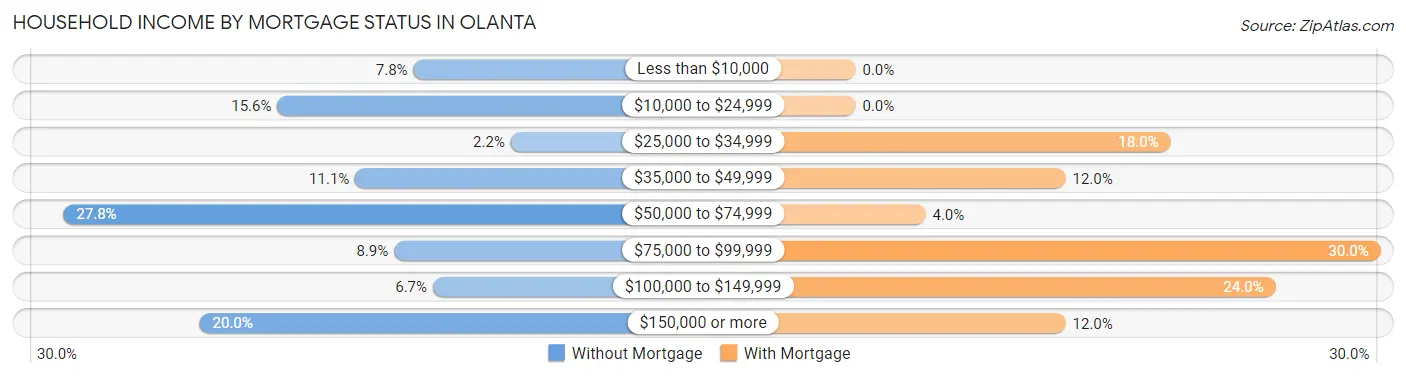
| Household Income | Without Mortgage | With Mortgage |
| Less than $10,000 | 7 (7.8%) | 0 (0.0%) |
| $10,000 to $24,999 | 14 (15.6%) | 0 (0.0%) |
| $25,000 to $34,999 | 2 (2.2%) | 9 (18.0%) |
| $35,000 to $49,999 | 10 (11.1%) | 6 (12.0%) |
| $50,000 to $74,999 | 25 (27.8%) | 2 (4.0%) |
| $75,000 to $99,999 | 8 (8.9%) | 15 (30.0%) |
| $100,000 to $149,999 | 6 (6.7%) | 12 (24.0%) |
| $150,000 or more | 18 (20.0%) | 6 (12.0%) |
| Total | 90 (100.0%) | 50 (100.0%) |
Property Value to Household Income Ratio in Olanta
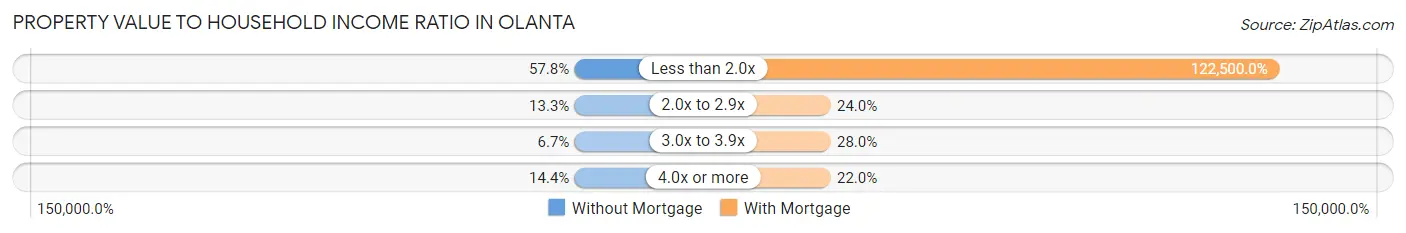
| Value-to-Income Ratio | Without Mortgage | With Mortgage |
| Less than 2.0x | 52 (57.8%) | 61,250 (122,500.0%) |
| 2.0x to 2.9x | 12 (13.3%) | 12 (24.0%) |
| 3.0x to 3.9x | 6 (6.7%) | 14 (28.0%) |
| 4.0x or more | 13 (14.4%) | 11 (22.0%) |
| Total | 90 (100.0%) | 50 (100.0%) |
Real Estate Taxes by Mortgage Status in Olanta

| Property Taxes | Without Mortgage | With Mortgage |
| Less than $800 | 80 (88.9%) | 0 (0.0%) |
| $800 to $1,499 | 5 (5.6%) | 39 (78.0%) |
| $800 to $1,499 | 0 (0.0%) | 8 (16.0%) |
| Total | 90 (100.0%) | 50 (100.0%) |
Health & Disability in Olanta
Health Insurance Coverage by Age in Olanta
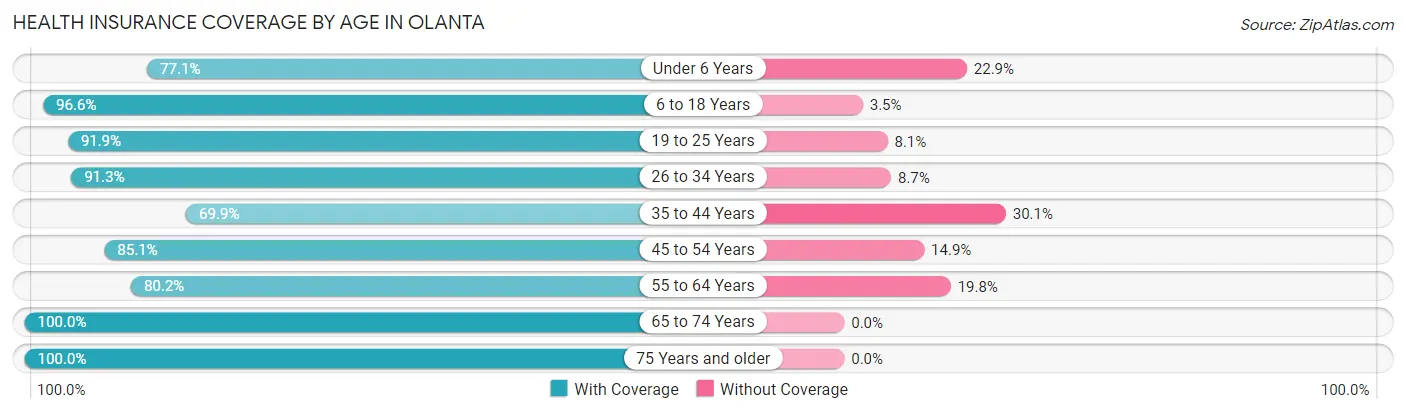
| Age Bracket | With Coverage | Without Coverage |
| Under 6 Years | 27 (77.1%) | 8 (22.9%) |
| 6 to 18 Years | 112 (96.6%) | 4 (3.5%) |
| 19 to 25 Years | 57 (91.9%) | 5 (8.1%) |
| 26 to 34 Years | 21 (91.3%) | 2 (8.7%) |
| 35 to 44 Years | 65 (69.9%) | 28 (30.1%) |
| 45 to 54 Years | 40 (85.1%) | 7 (14.9%) |
| 55 to 64 Years | 101 (80.2%) | 25 (19.8%) |
| 65 to 74 Years | 26 (100.0%) | 0 (0.0%) |
| 75 Years and older | 60 (100.0%) | 0 (0.0%) |
| Total | 509 (86.6%) | 79 (13.4%) |
Health Insurance Coverage by Citizenship Status in Olanta
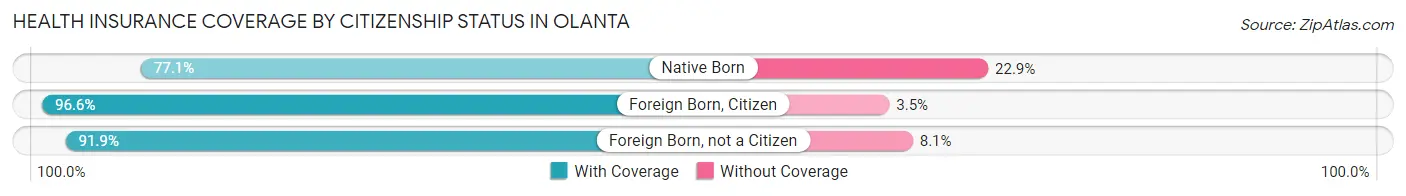
| Citizenship Status | With Coverage | Without Coverage |
| Native Born | 27 (77.1%) | 8 (22.9%) |
| Foreign Born, Citizen | 112 (96.6%) | 4 (3.5%) |
| Foreign Born, not a Citizen | 57 (91.9%) | 5 (8.1%) |
Health Insurance Coverage by Household Income in Olanta
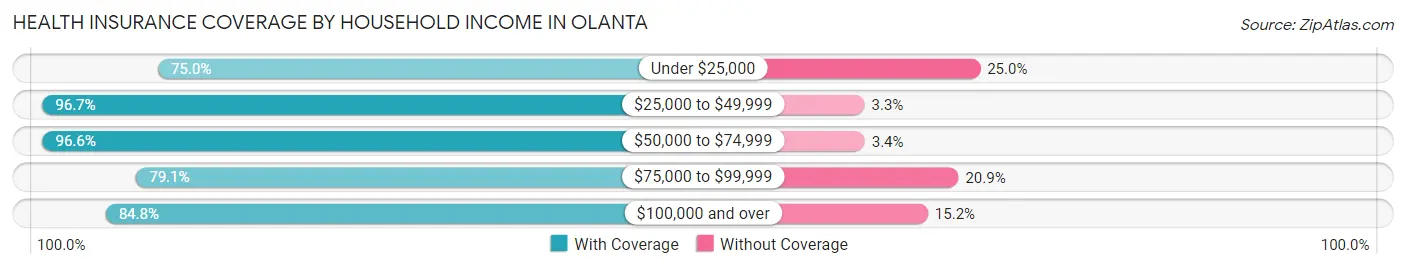
| Household Income | With Coverage | Without Coverage |
| Under $25,000 | 102 (75.0%) | 34 (25.0%) |
| $25,000 to $49,999 | 58 (96.7%) | 2 (3.3%) |
| $50,000 to $74,999 | 172 (96.6%) | 6 (3.4%) |
| $75,000 to $99,999 | 68 (79.1%) | 18 (20.9%) |
| $100,000 and over | 106 (84.8%) | 19 (15.2%) |
Public vs Private Health Insurance Coverage by Age in Olanta
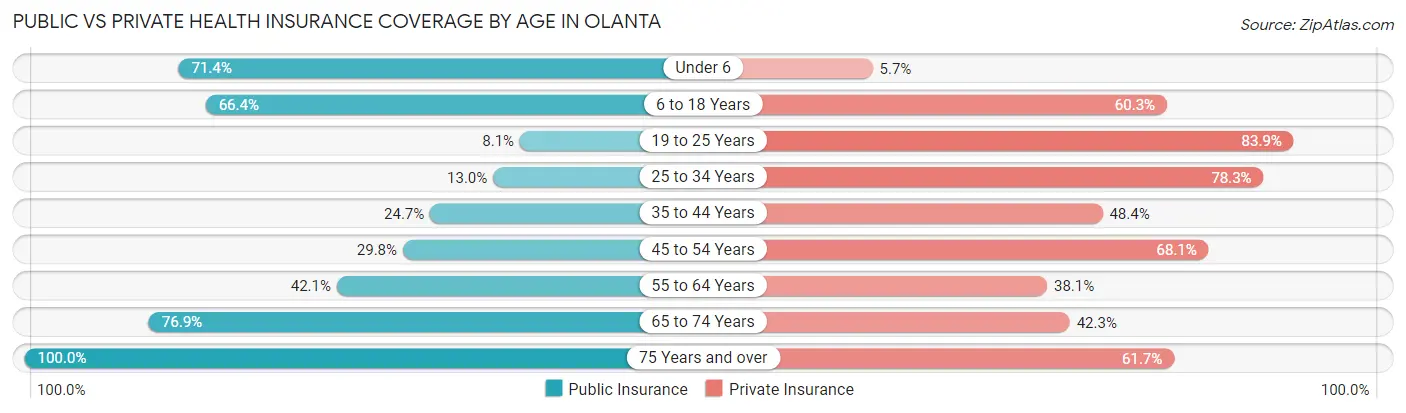
| Age Bracket | Public Insurance | Private Insurance |
| Under 6 | 25 (71.4%) | 2 (5.7%) |
| 6 to 18 Years | 77 (66.4%) | 70 (60.3%) |
| 19 to 25 Years | 5 (8.1%) | 52 (83.9%) |
| 25 to 34 Years | 3 (13.0%) | 18 (78.3%) |
| 35 to 44 Years | 23 (24.7%) | 45 (48.4%) |
| 45 to 54 Years | 14 (29.8%) | 32 (68.1%) |
| 55 to 64 Years | 53 (42.1%) | 48 (38.1%) |
| 65 to 74 Years | 20 (76.9%) | 11 (42.3%) |
| 75 Years and over | 60 (100.0%) | 37 (61.7%) |
| Total | 280 (47.6%) | 315 (53.6%) |
Disability Status by Sex by Age in Olanta
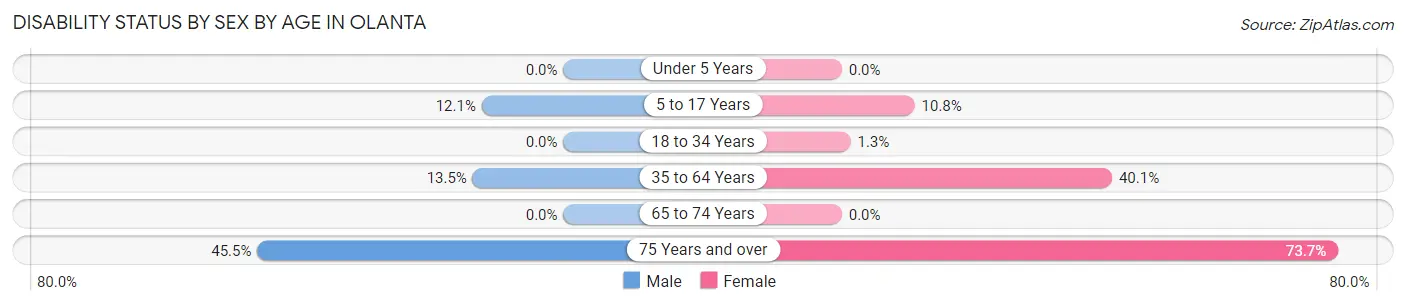
| Age Bracket | Male | Female |
| Under 5 Years | 0 (0.0%) | 0 (0.0%) |
| 5 to 17 Years | 4 (12.1%) | 8 (10.8%) |
| 18 to 34 Years | 0 (0.0%) | 1 (1.3%) |
| 35 to 64 Years | 14 (13.5%) | 65 (40.1%) |
| 65 to 74 Years | 0 (0.0%) | 0 (0.0%) |
| 75 Years and over | 10 (45.5%) | 28 (73.7%) |
Disability Class by Sex by Age in Olanta
Disability Class: Hearing Difficulty
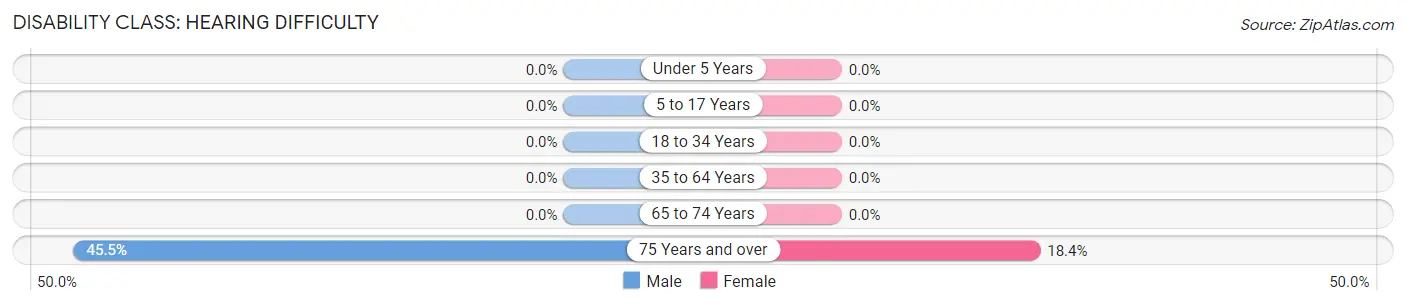
| Age Bracket | Male | Female |
| Under 5 Years | 0 (0.0%) | 0 (0.0%) |
| 5 to 17 Years | 0 (0.0%) | 0 (0.0%) |
| 18 to 34 Years | 0 (0.0%) | 0 (0.0%) |
| 35 to 64 Years | 0 (0.0%) | 0 (0.0%) |
| 65 to 74 Years | 0 (0.0%) | 0 (0.0%) |
| 75 Years and over | 10 (45.5%) | 7 (18.4%) |
Disability Class: Vision Difficulty
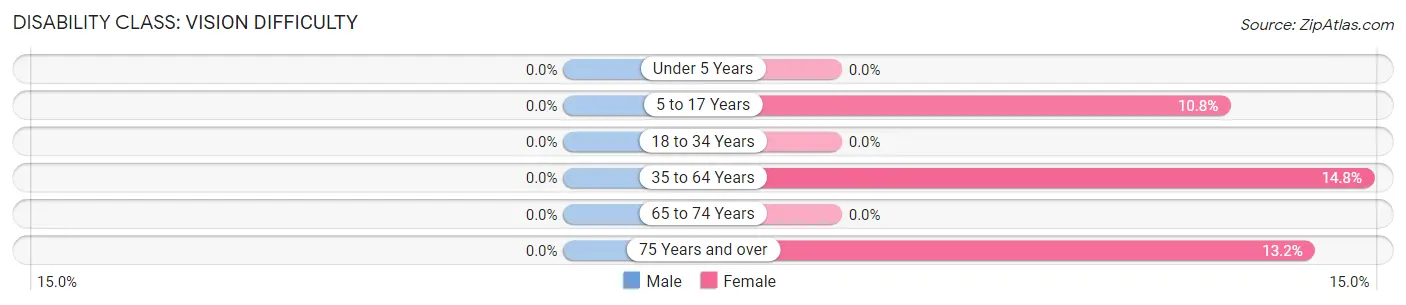
| Age Bracket | Male | Female |
| Under 5 Years | 0 (0.0%) | 0 (0.0%) |
| 5 to 17 Years | 0 (0.0%) | 8 (10.8%) |
| 18 to 34 Years | 0 (0.0%) | 0 (0.0%) |
| 35 to 64 Years | 0 (0.0%) | 24 (14.8%) |
| 65 to 74 Years | 0 (0.0%) | 0 (0.0%) |
| 75 Years and over | 0 (0.0%) | 5 (13.2%) |
Disability Class: Cognitive Difficulty
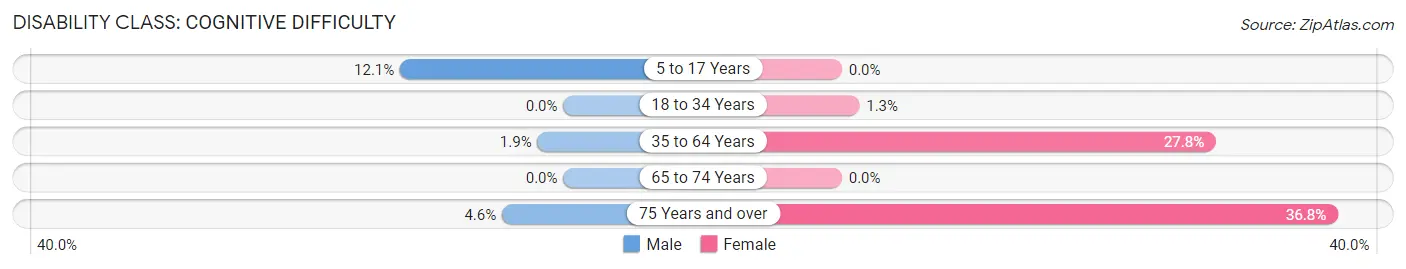
| Age Bracket | Male | Female |
| 5 to 17 Years | 4 (12.1%) | 0 (0.0%) |
| 18 to 34 Years | 0 (0.0%) | 1 (1.3%) |
| 35 to 64 Years | 2 (1.9%) | 45 (27.8%) |
| 65 to 74 Years | 0 (0.0%) | 0 (0.0%) |
| 75 Years and over | 1 (4.5%) | 14 (36.8%) |
Disability Class: Ambulatory Difficulty
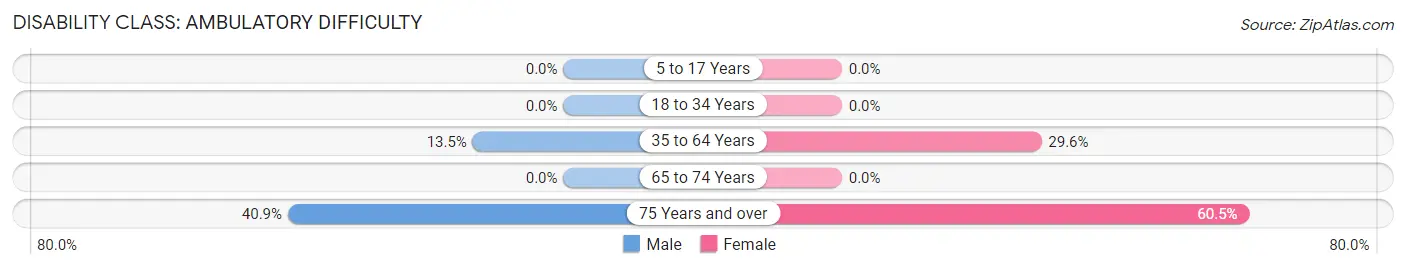
| Age Bracket | Male | Female |
| 5 to 17 Years | 0 (0.0%) | 0 (0.0%) |
| 18 to 34 Years | 0 (0.0%) | 0 (0.0%) |
| 35 to 64 Years | 14 (13.5%) | 48 (29.6%) |
| 65 to 74 Years | 0 (0.0%) | 0 (0.0%) |
| 75 Years and over | 9 (40.9%) | 23 (60.5%) |
Disability Class: Self-Care Difficulty
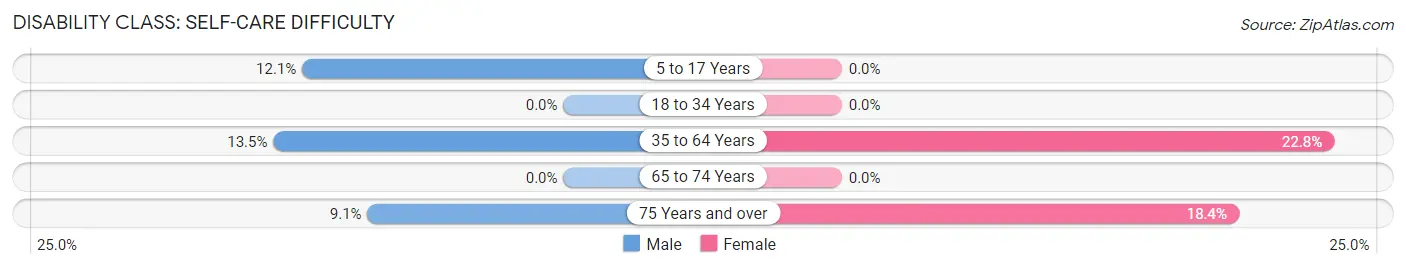
| Age Bracket | Male | Female |
| 5 to 17 Years | 4 (12.1%) | 0 (0.0%) |
| 18 to 34 Years | 0 (0.0%) | 0 (0.0%) |
| 35 to 64 Years | 14 (13.5%) | 37 (22.8%) |
| 65 to 74 Years | 0 (0.0%) | 0 (0.0%) |
| 75 Years and over | 2 (9.1%) | 7 (18.4%) |
Technology Access in Olanta
Computing Device Access in Olanta
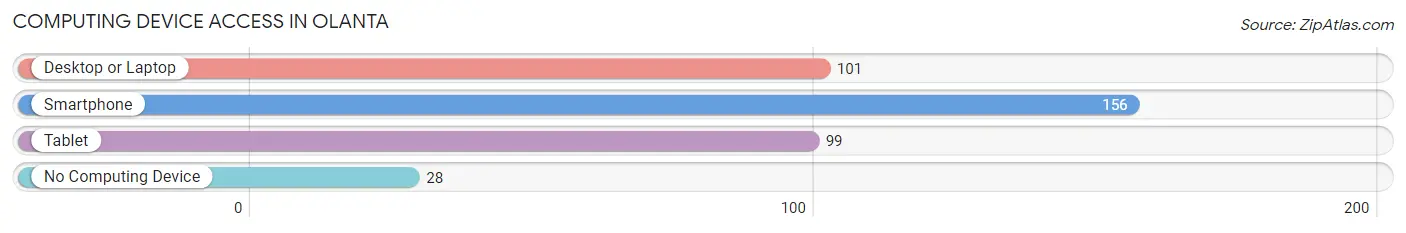
| Device Type | # Households | % Households |
| Desktop or Laptop | 101 | 51.3% |
| Smartphone | 156 | 79.2% |
| Tablet | 99 | 50.2% |
| No Computing Device | 28 | 14.2% |
| Total | 197 | 100.0% |
Internet Access in Olanta
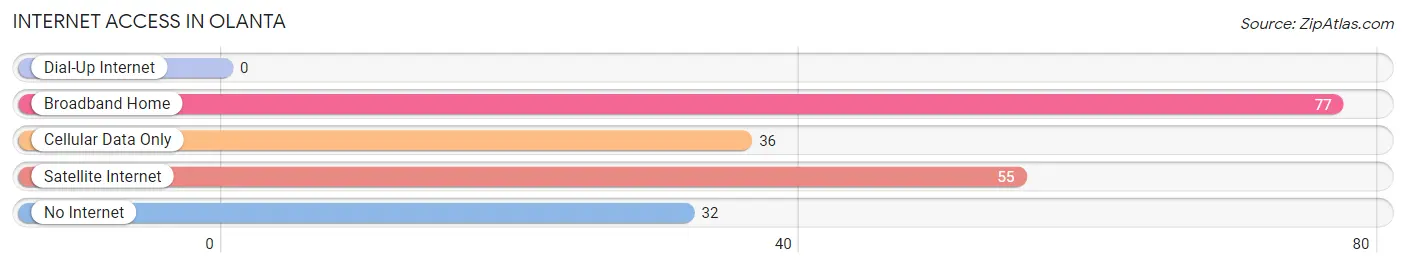
| Internet Type | # Households | % Households |
| Dial-Up Internet | 0 | 0.0% |
| Broadband Home | 77 | 39.1% |
| Cellular Data Only | 36 | 18.3% |
| Satellite Internet | 55 | 27.9% |
| No Internet | 32 | 16.2% |
| Total | 197 | 100.0% |
Olanta Summary
Olanata, South Carolina is a small town located in Florence County, South Carolina. It is situated on the banks of the Lynches River, about 20 miles east of Florence. The town was founded in 1820 and has a population of approximately 1,000 people.
Geography
Olanata is located in the Pee Dee region of South Carolina, which is known for its flat terrain and sandy soil. The town is situated on the banks of the Lynches River, which is a tributary of the Great Pee Dee River. The town is surrounded by forests and wetlands, and is home to a variety of wildlife, including deer, wild turkeys, and bald eagles. The town is also home to several small lakes, including Lake Olanta, which is a popular spot for fishing and boating.
Economy
The economy of Olanta is largely based on agriculture. The town is home to several farms, which produce a variety of crops, including corn, soybeans, cotton, and peanuts. The town is also home to several small businesses, including a grocery store, a hardware store, and a few restaurants.
Demographics
As of the 2010 census, Olanta had a population of 1,000 people. The racial makeup of the town was 79.2% White, 17.2% African American, 0.7% Native American, 0.3% Asian, and 2.6% from other races. The median household income was $30,000, and the median age was 39.
History
Olanata was founded in 1820 by a group of settlers from North Carolina. The town was named after a local Native American chief, Olanta. The town was originally a farming community, and the main crops were cotton and corn. In the late 19th century, the town began to grow and develop, and several businesses were established. In the early 20th century, the town was home to several sawmills and lumber companies.
In the late 20th century, the town began to decline, and many of the businesses closed. In the early 21st century, the town began to experience a resurgence, and several new businesses have opened in the area.
Today, Olanta is a small, rural town with a population of approximately 1,000 people. The town is home to several small businesses, and the economy is largely based on agriculture. The town is also home to several parks and recreational areas, and is a popular spot for fishing and boating.
Common Questions
What is Per Capita Income in Olanta?
Per Capita income in Olanta is $21,231.
What is the Median Family Income in Olanta?
Median Family Income in Olanta is $67,500.
What is the Median Household income in Olanta?
Median Household Income in Olanta is $53,438.
What is Income or Wage Gap in Olanta?
Income or Wage Gap in Olanta is 68.1%.
Women in Olanta earn 31.9 cents for every dollar earned by a man.
What is Family Income Deficit in Olanta?
Family Income Deficit in Olanta is $10,517.
Families that are below poverty line in Olanta earn $10,517 less on average than the poverty threshold level.
What is Inequality or Gini Index in Olanta?
Inequality or Gini Index in Olanta is 0.45.
What is the Total Population of Olanta?
Total Population of Olanta is 588.
What is the Total Male Population of Olanta?
Total Male Population of Olanta is 199.
What is the Total Female Population of Olanta?
Total Female Population of Olanta is 389.
What is the Ratio of Males per 100 Females in Olanta?
There are 51.16 Males per 100 Females in Olanta.
What is the Ratio of Females per 100 Males in Olanta?
There are 195.48 Females per 100 Males in Olanta.
What is the Median Population Age in Olanta?
Median Population Age in Olanta is 40.4 Years.
What is the Average Family Size in Olanta
Average Family Size in Olanta is 3.5 People.
What is the Average Household Size in Olanta
Average Household Size in Olanta is 3.0 People.
How Large is the Labor Force in Olanta?
There are 255 People in the Labor Forcein in Olanta.
What is the Percentage of People in the Labor Force in Olanta?
52.5% of People are in the Labor Force in Olanta.
What is the Unemployment Rate in Olanta?
Unemployment Rate in Olanta is 9.4%.