Lakewood, SC Map & Demographics
Lakewood Map
Lakewood Overview
$35,745
PER CAPITA INCOME
$69,514
AVG FAMILY INCOME
$47,290
AVG HOUSEHOLD INCOME
7.7%
WAGE / INCOME GAP [ % ]
92.3¢/ $1
WAGE / INCOME GAP [ $ ]
0.50
INEQUALITY / GINI INDEX
3,135
TOTAL POPULATION
1,394
MALE POPULATION
1,741
FEMALE POPULATION
80.07
MALES / 100 FEMALES
124.89
FEMALES / 100 MALES
46.7
MEDIAN AGE
2.7
AVG FAMILY SIZE
2.1
AVG HOUSEHOLD SIZE
1,825
LABOR FORCE [ PEOPLE ]
64.8%
PERCENT IN LABOR FORCE
8.6%
UNEMPLOYMENT RATE
Income in Lakewood
Income Overview in Lakewood
Per Capita Income in Lakewood is $35,745, while median incomes of families and households are $69,514 and $47,290 respectively.
| Characteristic | Number | Measure |
| Per Capita Income | 3,135 | $35,745 |
| Median Family Income | 931 | $69,514 |
| Mean Family Income | 931 | $97,611 |
| Median Household Income | 1,500 | $47,290 |
| Mean Household Income | 1,500 | $72,547 |
| Income Deficit | 931 | $0 |
| Wage / Income Gap (%) | 3,135 | 7.68% |
| Wage / Income Gap ($) | 3,135 | 92.32¢ per $1 |
| Gini / Inequality Index | 3,135 | 0.50 |
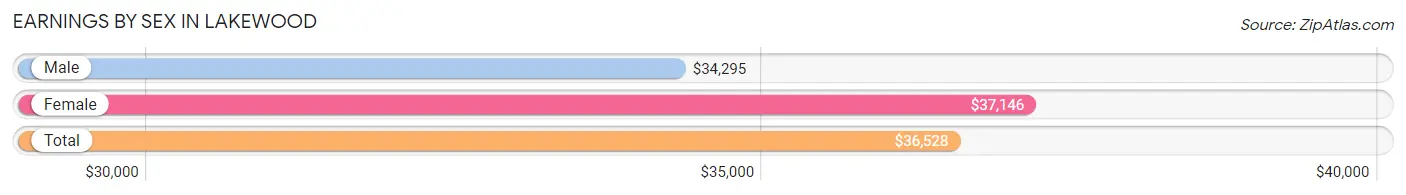
Earnings by Sex in Lakewood
Average Earnings in Lakewood are $36,528, $34,295 for men and $37,146 for women, a difference of 7.7%.
| Sex | Number | Average Earnings |
| Male | 981 (53.8%) | $34,295 |
| Female | 841 (46.2%) | $37,146 |
| Total | 1,822 (100.0%) | $36,528 |
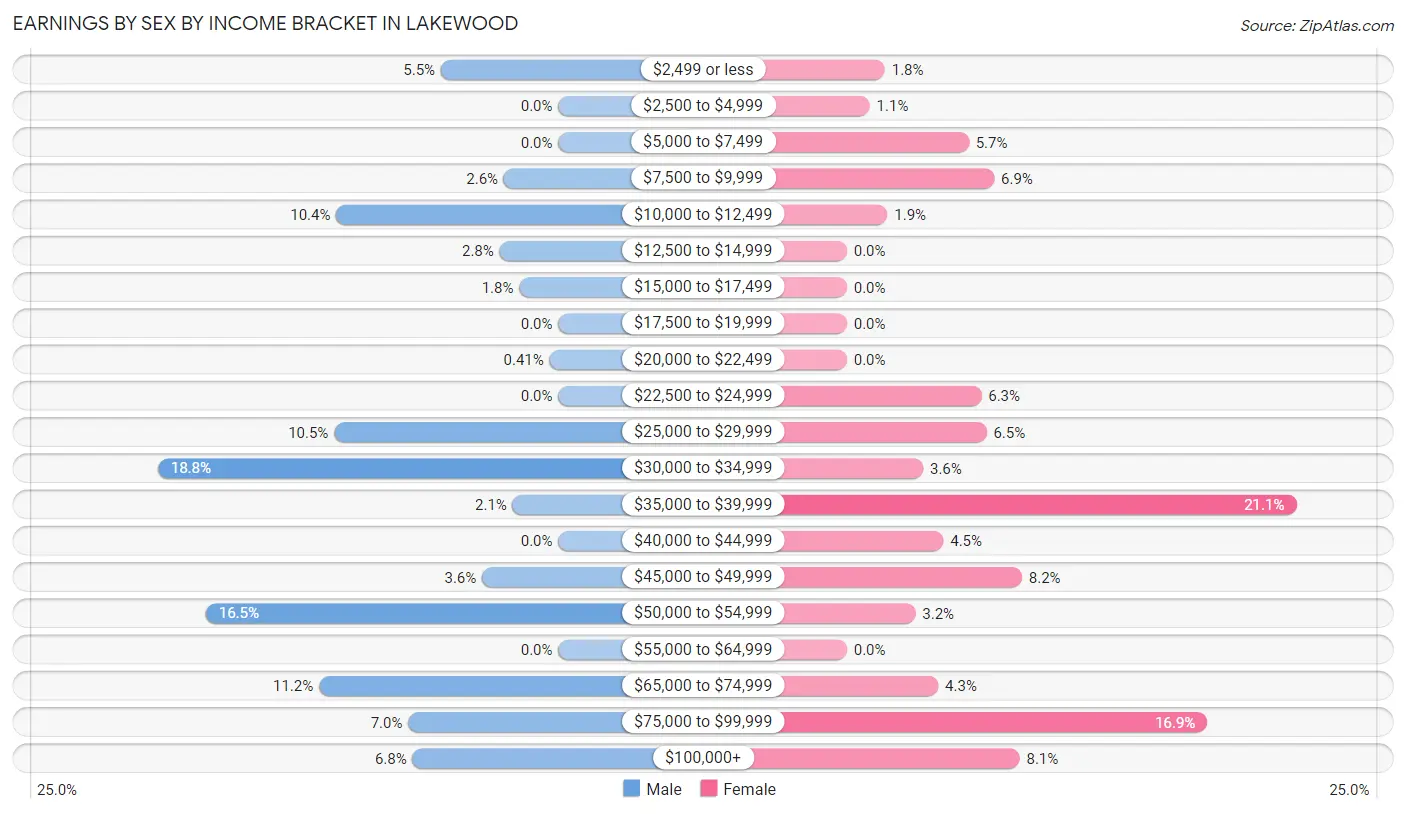
Earnings by Sex by Income Bracket in Lakewood
The most common earnings brackets in Lakewood are $30,000 to $34,999 for men (184 | 18.8%) and $35,000 to $39,999 for women (177 | 21.0%).
| Income | Male | Female |
| $2,499 or less | 54 (5.5%) | 15 (1.8%) |
| $2,500 to $4,999 | 0 (0.0%) | 9 (1.1%) |
| $5,000 to $7,499 | 0 (0.0%) | 48 (5.7%) |
| $7,500 to $9,999 | 25 (2.5%) | 58 (6.9%) |
| $10,000 to $12,499 | 102 (10.4%) | 16 (1.9%) |
| $12,500 to $14,999 | 27 (2.8%) | 0 (0.0%) |
| $15,000 to $17,499 | 18 (1.8%) | 0 (0.0%) |
| $17,500 to $19,999 | 0 (0.0%) | 0 (0.0%) |
| $20,000 to $22,499 | 4 (0.4%) | 0 (0.0%) |
| $22,500 to $24,999 | 0 (0.0%) | 53 (6.3%) |
| $25,000 to $29,999 | 103 (10.5%) | 55 (6.5%) |
| $30,000 to $34,999 | 184 (18.8%) | 30 (3.6%) |
| $35,000 to $39,999 | 21 (2.1%) | 177 (21.0%) |
| $40,000 to $44,999 | 0 (0.0%) | 38 (4.5%) |
| $45,000 to $49,999 | 35 (3.6%) | 69 (8.2%) |
| $50,000 to $54,999 | 162 (16.5%) | 27 (3.2%) |
| $55,000 to $64,999 | 0 (0.0%) | 0 (0.0%) |
| $65,000 to $74,999 | 110 (11.2%) | 36 (4.3%) |
| $75,000 to $99,999 | 69 (7.0%) | 142 (16.9%) |
| $100,000+ | 67 (6.8%) | 68 (8.1%) |
| Total | 981 (100.0%) | 841 (100.0%) |
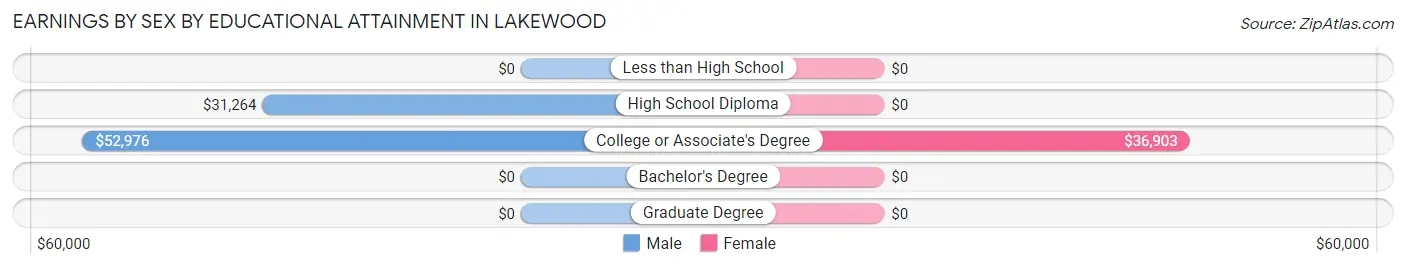
Earnings by Sex by Educational Attainment in Lakewood
Average earnings in Lakewood are $34,548 for men and $37,146 for women, a difference of 7.0%. Men with an educational attainment of college or associate's degree enjoy the highest average annual earnings of $52,976, while those with high school diploma education earn the least with $31,264. Women with an educational attainment of college or associate's degree earn the most with the average annual earnings of $36,903, while those with college or associate's degree education have the smallest earnings of $36,903.
| Educational Attainment | Male Income | Female Income |
| Less than High School | - | - |
| High School Diploma | $31,264 | $0 |
| College or Associate's Degree | $52,976 | $36,903 |
| Bachelor's Degree | - | - |
| Graduate Degree | - | - |
| Total | $34,548 | $37,146 |
Family Income in Lakewood
Family Income Brackets in Lakewood
According to the Lakewood family income data, there are 238 families falling into the $100,000 to $149,999 income range, which is the most common income bracket and makes up 25.6% of all families.
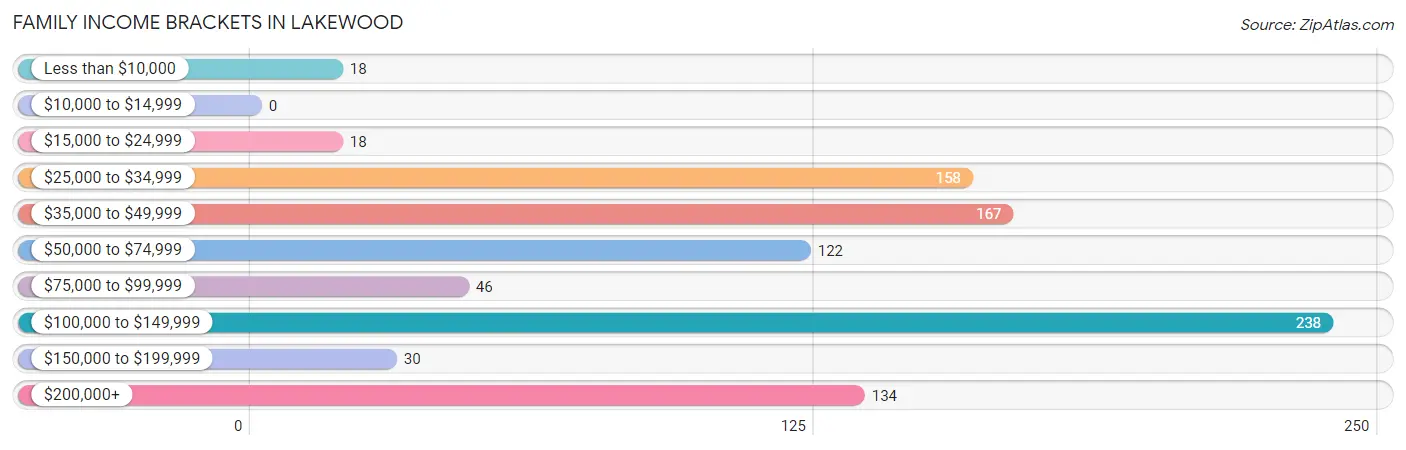
| Income Bracket | # Families | % Families |
| Less than $10,000 | 18 | 1.9% |
| $10,000 to $14,999 | 0 | 0.0% |
| $15,000 to $24,999 | 18 | 1.9% |
| $25,000 to $34,999 | 158 | 17.0% |
| $35,000 to $49,999 | 167 | 17.9% |
| $50,000 to $74,999 | 122 | 13.1% |
| $75,000 to $99,999 | 46 | 4.9% |
| $100,000 to $149,999 | 238 | 25.6% |
| $150,000 to $199,999 | 30 | 3.2% |
| $200,000+ | 134 | 14.4% |
Family Income by Famaliy Size in Lakewood
3-person families (222 | 23.8%) account for the highest median family income in Lakewood with $104,853 per family, while 3-person families (222 | 23.8%) have the highest median income of $34,951 per family member.
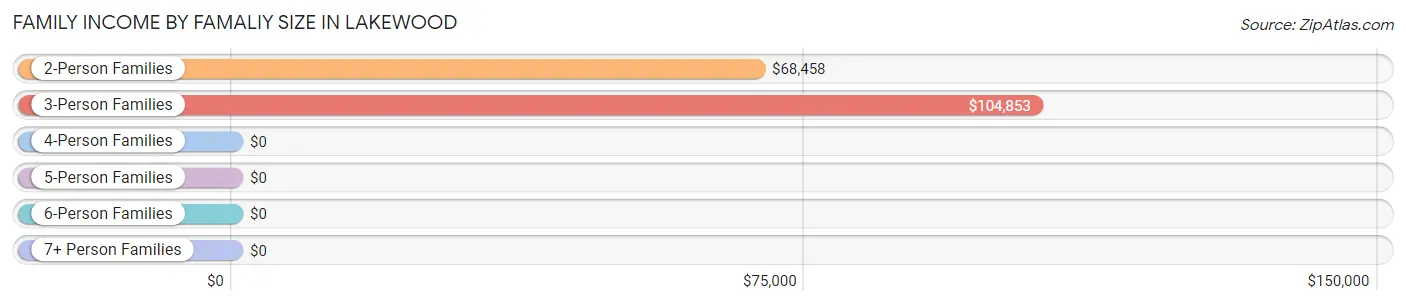
| Income Bracket | # Families | Median Income |
| 2-Person Families | 609 (65.4%) | $68,458 |
| 3-Person Families | 222 (23.8%) | $104,853 |
| 4-Person Families | 68 (7.3%) | $0 |
| 5-Person Families | 32 (3.4%) | $0 |
| 6-Person Families | 0 (0.0%) | $0 |
| 7+ Person Families | 0 (0.0%) | $0 |
| Total | 931 (100.0%) | $69,514 |
Family Income by Number of Earners in Lakewood
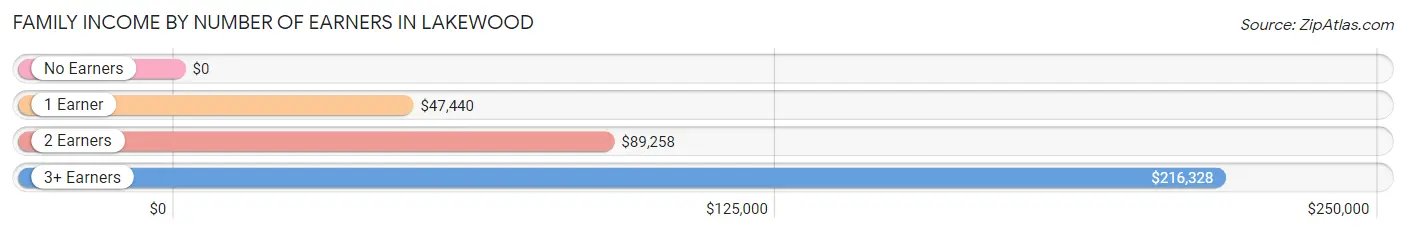
| Number of Earners | # Families | Median Income |
| No Earners | 134 (14.4%) | $0 |
| 1 Earner | 249 (26.8%) | $47,440 |
| 2 Earners | 497 (53.4%) | $89,258 |
| 3+ Earners | 51 (5.5%) | $216,328 |
| Total | 931 (100.0%) | $69,514 |
Household Income in Lakewood
Household Income Brackets in Lakewood
With 251 households falling in the category, the $35,000 to $49,999 income range is the most frequent in Lakewood, accounting for 16.7% of all households. In contrast, only 30 households (2.0%) fall into the $150,000 to $199,999 income bracket, making it the least populous group.
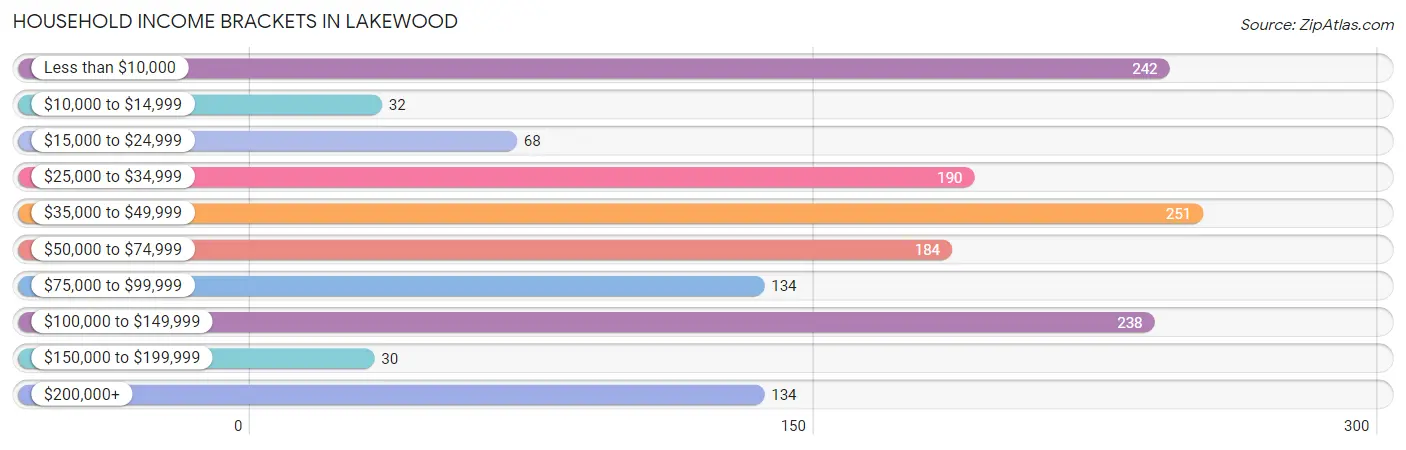
| Income Bracket | # Households | % Households |
| Less than $10,000 | 242 | 16.1% |
| $10,000 to $14,999 | 32 | 2.1% |
| $15,000 to $24,999 | 68 | 4.5% |
| $25,000 to $34,999 | 190 | 12.7% |
| $35,000 to $49,999 | 251 | 16.7% |
| $50,000 to $74,999 | 184 | 12.3% |
| $75,000 to $99,999 | 134 | 8.9% |
| $100,000 to $149,999 | 238 | 15.9% |
| $150,000 to $199,999 | 30 | 2.0% |
| $200,000+ | 134 | 8.9% |
Household Income by Householder Age in Lakewood
The median household income in Lakewood is $47,290, with the highest median household income of $53,790 found in the 25 to 44 years age bracket for the primary householder. A total of 359 households (23.9%) fall into this category.
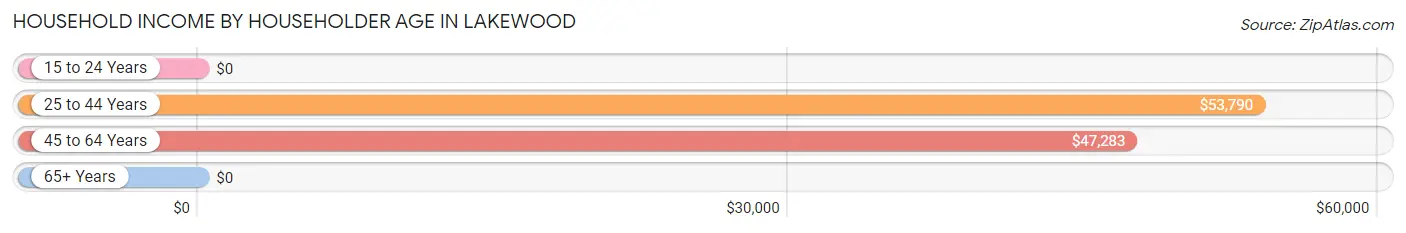
| Income Bracket | # Households | Median Income |
| 15 to 24 Years | 0 (0.0%) | $0 |
| 25 to 44 Years | 359 (23.9%) | $53,790 |
| 45 to 64 Years | 632 (42.1%) | $47,283 |
| 65+ Years | 509 (33.9%) | $0 |
| Total | 1,500 (100.0%) | $47,290 |
Poverty in Lakewood
Income Below Poverty by Sex and Age in Lakewood
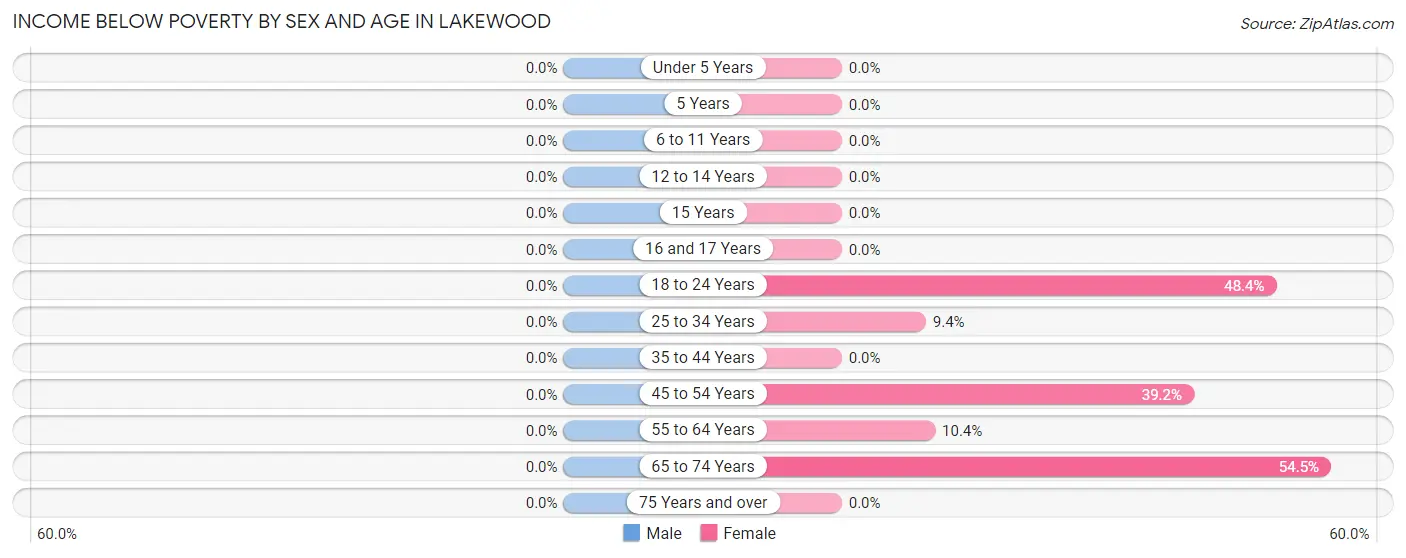
| Age Bracket | Male | Female |
| Under 5 Years | 0 (0.0%) | 0 (0.0%) |
| 5 Years | 0 (0.0%) | 0 (0.0%) |
| 6 to 11 Years | 0 (0.0%) | 0 (0.0%) |
| 12 to 14 Years | 0 (0.0%) | 0 (0.0%) |
| 15 Years | 0 (0.0%) | 0 (0.0%) |
| 16 and 17 Years | 0 (0.0%) | 0 (0.0%) |
| 18 to 24 Years | 0 (0.0%) | 15 (48.4%) |
| 25 to 34 Years | 0 (0.0%) | 19 (9.4%) |
| 35 to 44 Years | 0 (0.0%) | 0 (0.0%) |
| 45 to 54 Years | 0 (0.0%) | 69 (39.2%) |
| 55 to 64 Years | 0 (0.0%) | 35 (10.4%) |
| 65 to 74 Years | 0 (0.0%) | 189 (54.5%) |
| 75 Years and over | 0 (0.0%) | 0 (0.0%) |
| Total | 0 (0.0%) | 327 (18.8%) |
Income Above Poverty by Sex and Age in Lakewood
According to the poverty statistics in Lakewood, males aged under 5 years and females aged 6 to 11 years are the age groups that are most secure financially, with 100.0% of males and 100.0% of females in these age groups living above the poverty line.
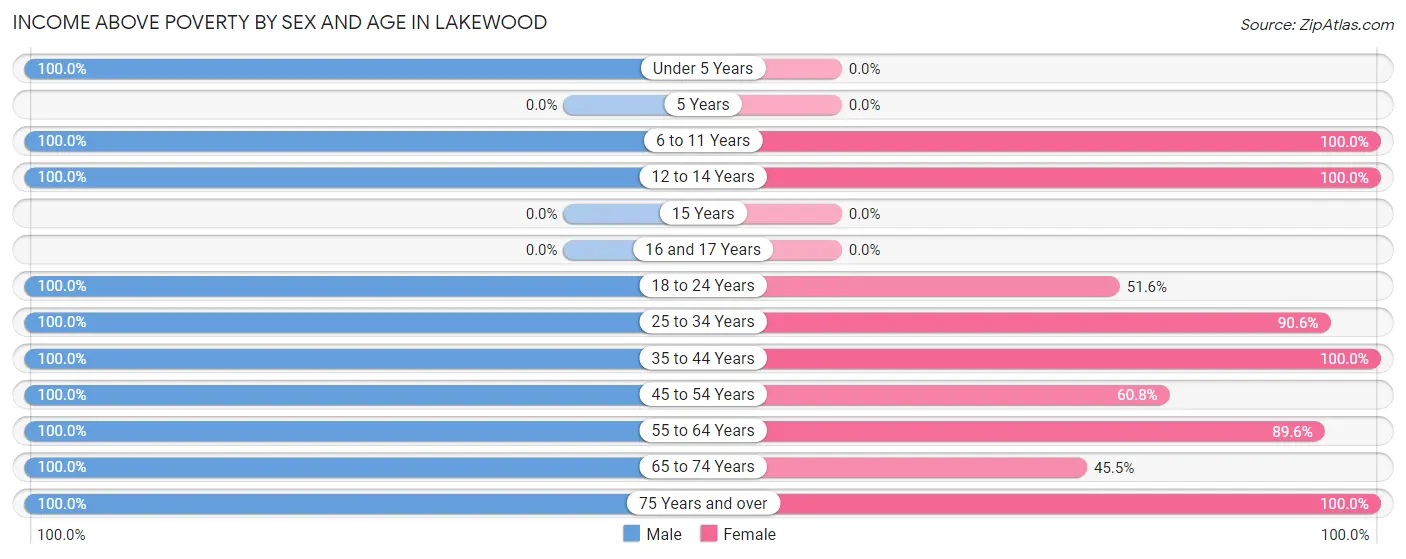
| Age Bracket | Male | Female |
| Under 5 Years | 29 (100.0%) | 0 (0.0%) |
| 5 Years | 0 (0.0%) | 0 (0.0%) |
| 6 to 11 Years | 52 (100.0%) | 61 (100.0%) |
| 12 to 14 Years | 26 (100.0%) | 151 (100.0%) |
| 15 Years | 0 (0.0%) | 0 (0.0%) |
| 16 and 17 Years | 0 (0.0%) | 0 (0.0%) |
| 18 to 24 Years | 108 (100.0%) | 16 (51.6%) |
| 25 to 34 Years | 390 (100.0%) | 184 (90.6%) |
| 35 to 44 Years | 117 (100.0%) | 332 (100.0%) |
| 45 to 54 Years | 103 (100.0%) | 107 (60.8%) |
| 55 to 64 Years | 349 (100.0%) | 302 (89.6%) |
| 65 to 74 Years | 158 (100.0%) | 158 (45.5%) |
| 75 Years and over | 62 (100.0%) | 103 (100.0%) |
| Total | 1,394 (100.0%) | 1,414 (81.2%) |
Income Below Poverty Among Married-Couple Families in Lakewood
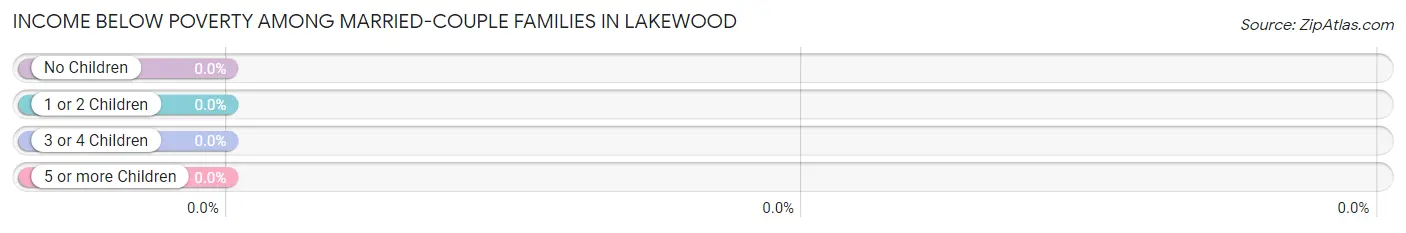
| Children | Above Poverty | Below Poverty |
| No Children | 424 (100.0%) | 0 (0.0%) |
| 1 or 2 Children | 153 (100.0%) | 0 (0.0%) |
| 3 or 4 Children | 0 (0.0%) | 0 (0.0%) |
| 5 or more Children | 0 (0.0%) | 0 (0.0%) |
| Total | 577 (100.0%) | 0 (0.0%) |
Income Below Poverty Among Single-Parent Households in Lakewood
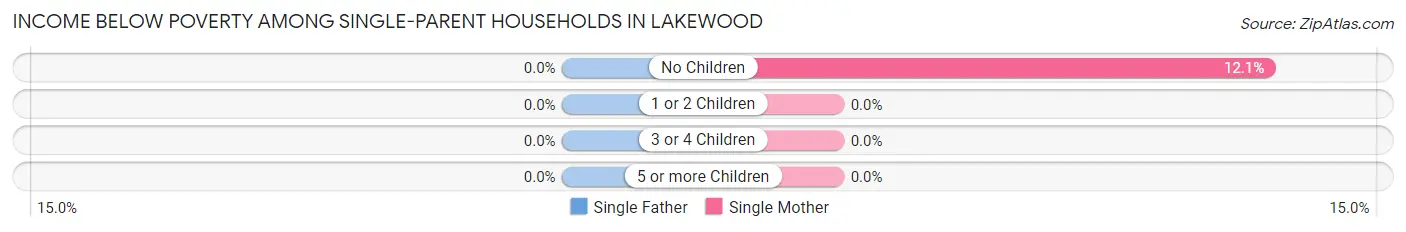
| Children | Single Father | Single Mother |
| No Children | 0 (0.0%) | 18 (12.1%) |
| 1 or 2 Children | 0 (0.0%) | 0 (0.0%) |
| 3 or 4 Children | 0 (0.0%) | 0 (0.0%) |
| 5 or more Children | 0 (0.0%) | 0 (0.0%) |
| Total | 0 (0.0%) | 18 (10.6%) |
Income Below Poverty Among Married-Couple vs Single-Parent Households in Lakewood
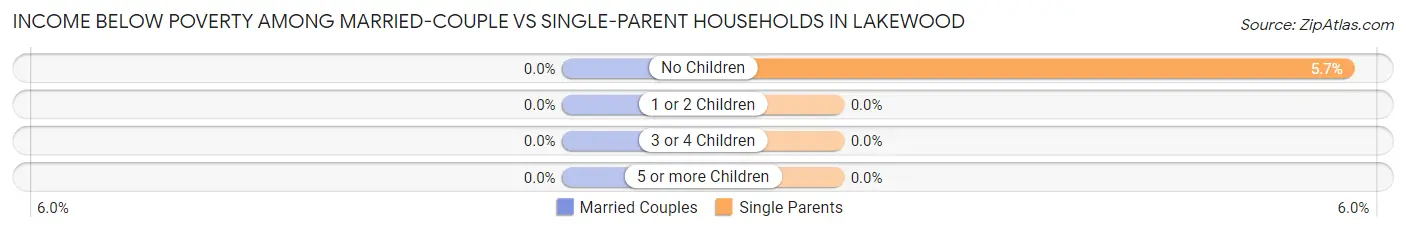
| Children | Married-Couple Families | Single-Parent Households |
| No Children | 0 (0.0%) | 18 (5.7%) |
| 1 or 2 Children | 0 (0.0%) | 0 (0.0%) |
| 3 or 4 Children | 0 (0.0%) | 0 (0.0%) |
| 5 or more Children | 0 (0.0%) | 0 (0.0%) |
| Total | 0 (0.0%) | 18 (5.1%) |
Race in Lakewood
The most populous races in Lakewood are White / Caucasian (1,531 | 48.8%), Black / African American (1,193 | 38.1%), and Two or more Races (370 | 11.8%).
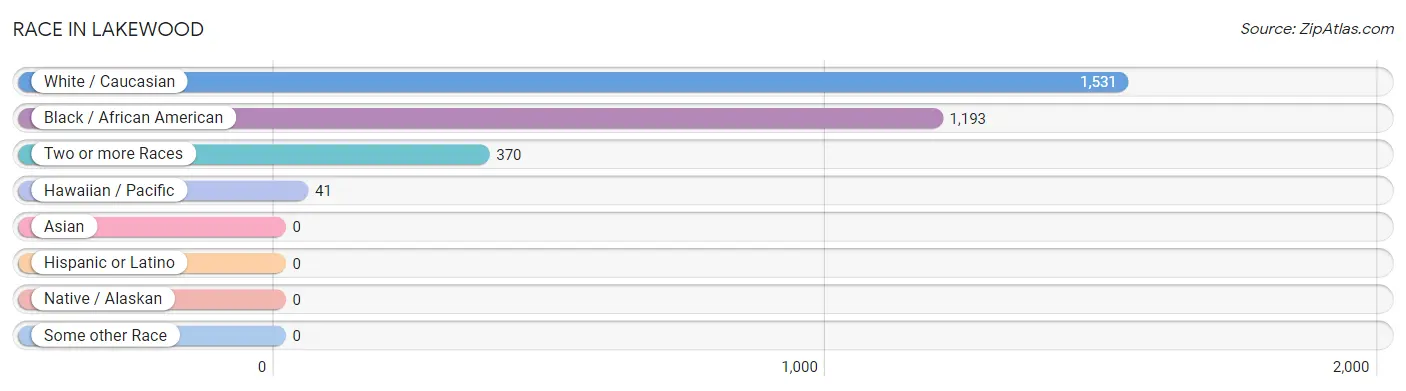
| Race | # Population | % Population |
| Asian | 0 | 0.0% |
| Black / African American | 1,193 | 38.1% |
| Hawaiian / Pacific | 41 | 1.3% |
| Hispanic or Latino | 0 | 0.0% |
| Native / Alaskan | 0 | 0.0% |
| White / Caucasian | 1,531 | 48.8% |
| Two or more Races | 370 | 11.8% |
| Some other Race | 0 | 0.0% |
| Total | 3,135 | 100.0% |
Ancestry in Lakewood
The most populous ancestries reported in Lakewood are American (347 | 11.1%), Irish (290 | 9.2%), German (247 | 7.9%), English (243 | 7.7%), and Norwegian (135 | 4.3%), together accounting for 40.3% of all Lakewood residents.
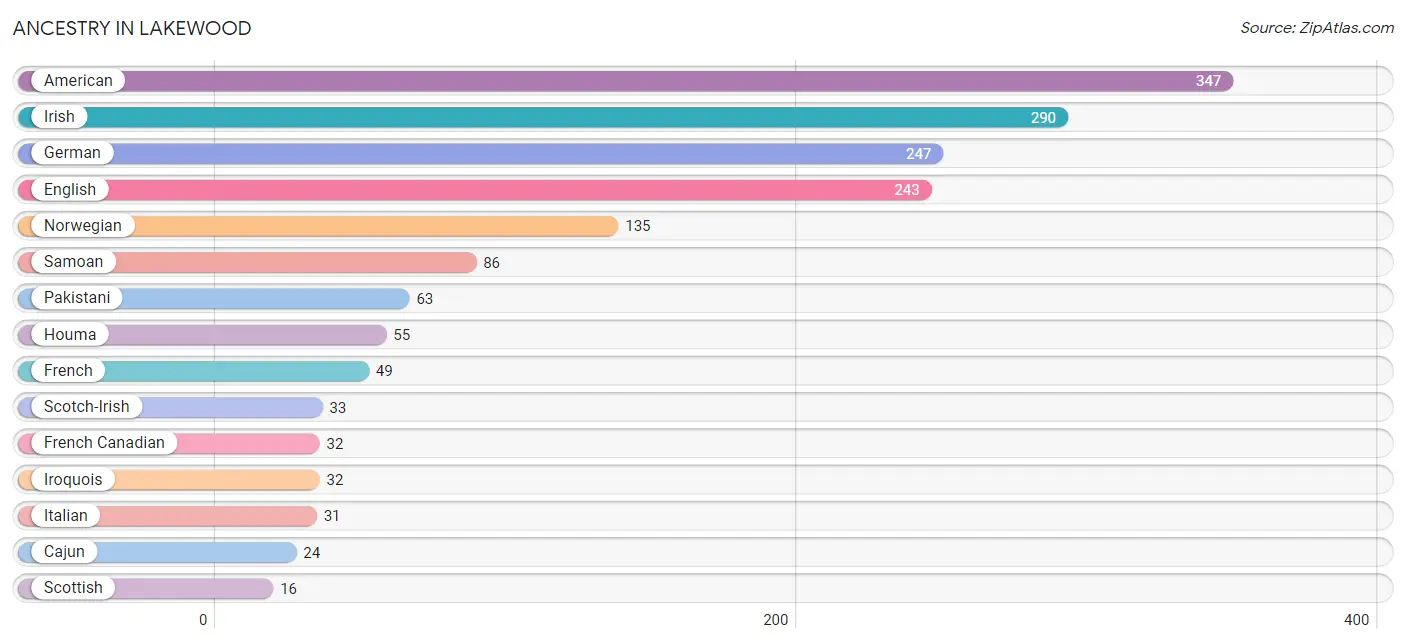
| Ancestry | # Population | % Population |
| American | 347 | 11.1% |
| Cajun | 24 | 0.8% |
| English | 243 | 7.7% |
| French | 49 | 1.6% |
| French Canadian | 32 | 1.0% |
| German | 247 | 7.9% |
| Houma | 55 | 1.8% |
| Irish | 290 | 9.2% |
| Iroquois | 32 | 1.0% |
| Italian | 31 | 1.0% |
| Norwegian | 135 | 4.3% |
| Pakistani | 63 | 2.0% |
| Romanian | 15 | 0.5% |
| Samoan | 86 | 2.7% |
| Scandinavian | 15 | 0.5% |
| Scotch-Irish | 33 | 1.1% |
| Scottish | 16 | 0.5% | View All 17 Rows |
Immigrants in Lakewood
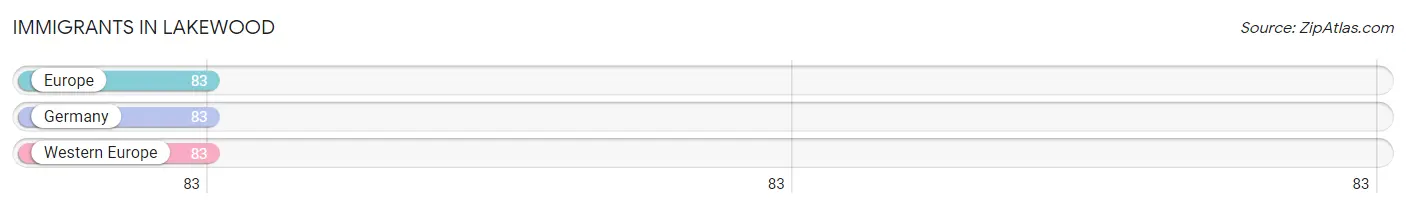
The most numerous immigrant groups reported in Lakewood came from Europe (83 | 2.6%), Germany (83 | 2.6%), and Western Europe (83 | 2.6%), together accounting for 8.0% of all Lakewood residents.
| Immigration Origin | # Population | % Population |
| Europe | 83 | 2.6% |
| Germany | 83 | 2.6% |
| Western Europe | 83 | 2.6% | View All 3 Rows |
Sex and Age in Lakewood
Sex and Age in Lakewood
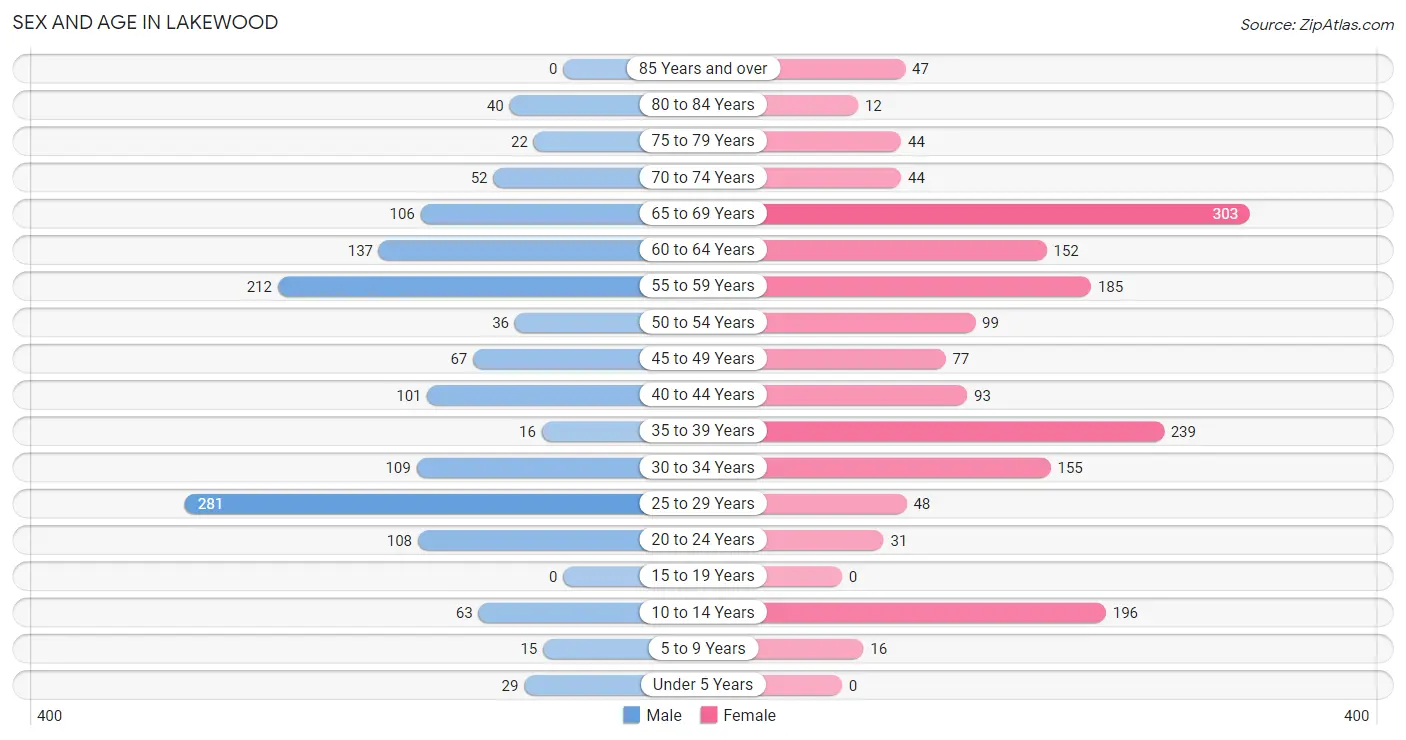
The most populous age groups in Lakewood are 25 to 29 Years (281 | 20.2%) for men and 65 to 69 Years (303 | 17.4%) for women.
| Age Bracket | Male | Female |
| Under 5 Years | 29 (2.1%) | 0 (0.0%) |
| 5 to 9 Years | 15 (1.1%) | 16 (0.9%) |
| 10 to 14 Years | 63 (4.5%) | 196 (11.3%) |
| 15 to 19 Years | 0 (0.0%) | 0 (0.0%) |
| 20 to 24 Years | 108 (7.7%) | 31 (1.8%) |
| 25 to 29 Years | 281 (20.2%) | 48 (2.8%) |
| 30 to 34 Years | 109 (7.8%) | 155 (8.9%) |
| 35 to 39 Years | 16 (1.1%) | 239 (13.7%) |
| 40 to 44 Years | 101 (7.2%) | 93 (5.3%) |
| 45 to 49 Years | 67 (4.8%) | 77 (4.4%) |
| 50 to 54 Years | 36 (2.6%) | 99 (5.7%) |
| 55 to 59 Years | 212 (15.2%) | 185 (10.6%) |
| 60 to 64 Years | 137 (9.8%) | 152 (8.7%) |
| 65 to 69 Years | 106 (7.6%) | 303 (17.4%) |
| 70 to 74 Years | 52 (3.7%) | 44 (2.5%) |
| 75 to 79 Years | 22 (1.6%) | 44 (2.5%) |
| 80 to 84 Years | 40 (2.9%) | 12 (0.7%) |
| 85 Years and over | 0 (0.0%) | 47 (2.7%) |
| Total | 1,394 (100.0%) | 1,741 (100.0%) |
Families and Households in Lakewood
Median Family Size in Lakewood
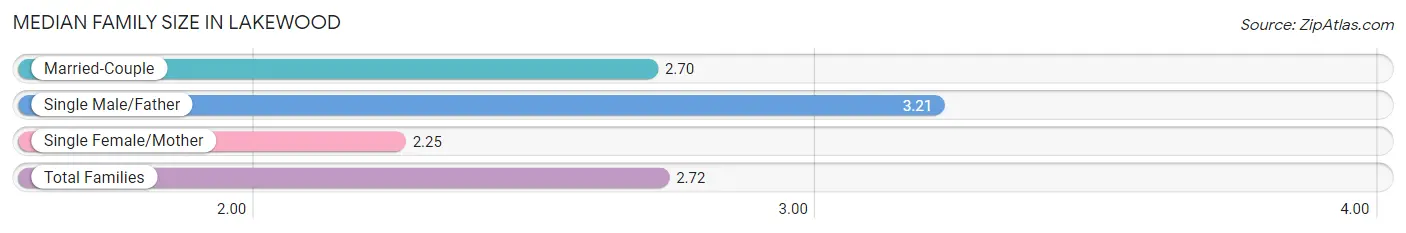
The median family size in Lakewood is 2.72 persons per family, with single male/father families (185 | 19.9%) accounting for the largest median family size of 3.21 persons per family. On the other hand, single female/mother families (169 | 18.1%) represent the smallest median family size with 2.25 persons per family.
| Family Type | # Families | Family Size |
| Married-Couple | 577 (62.0%) | 2.70 |
| Single Male/Father | 185 (19.9%) | 3.21 |
| Single Female/Mother | 169 (18.1%) | 2.25 |
| Total Families | 931 (100.0%) | 2.72 |
Median Household Size in Lakewood
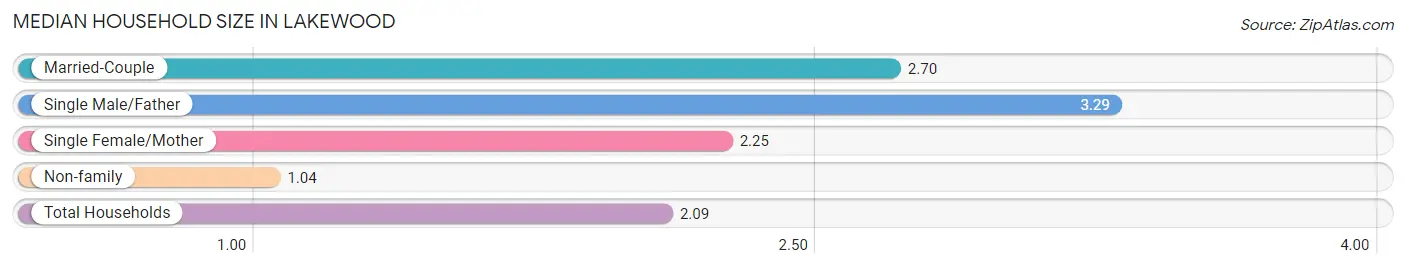
The median household size in Lakewood is 2.09 persons per household, with single male/father households (185 | 12.3%) accounting for the largest median household size of 3.29 persons per household. non-family households (569 | 37.9%) represent the smallest median household size with 1.04 persons per household.
| Household Type | # Households | Household Size |
| Married-Couple | 577 (38.5%) | 2.70 |
| Single Male/Father | 185 (12.3%) | 3.29 |
| Single Female/Mother | 169 (11.3%) | 2.25 |
| Non-family | 569 (37.9%) | 1.04 |
| Total Households | 1,500 (100.0%) | 2.09 |
Household Size by Marriage Status in Lakewood
Out of a total of 1,500 households in Lakewood, 931 (62.1%) are family households, while 569 (37.9%) are nonfamily households. The most numerous type of family households are 2-person households, comprising 609, and the most common type of nonfamily households are 1-person households, comprising 550.
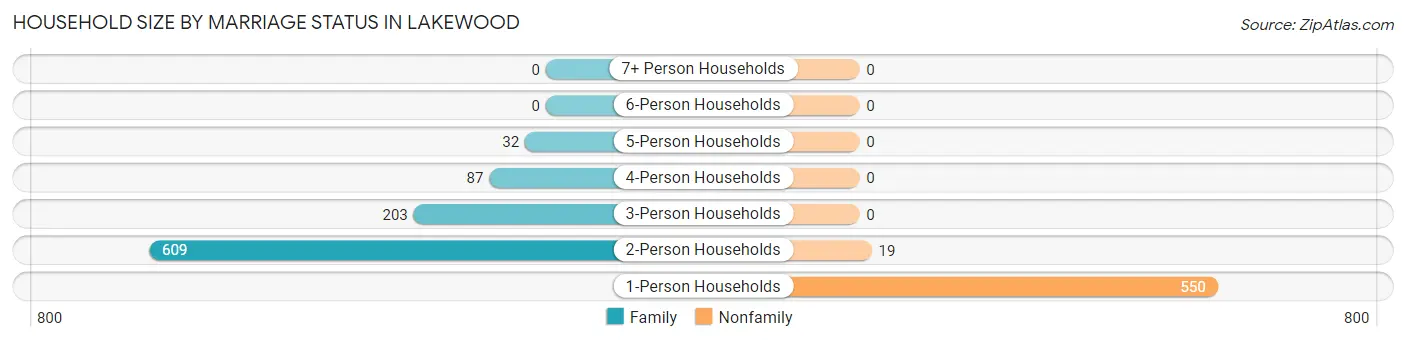
| Household Size | Family Households | Nonfamily Households |
| 1-Person Households | - | 550 (36.7%) |
| 2-Person Households | 609 (40.6%) | 19 (1.3%) |
| 3-Person Households | 203 (13.5%) | 0 (0.0%) |
| 4-Person Households | 87 (5.8%) | 0 (0.0%) |
| 5-Person Households | 32 (2.1%) | 0 (0.0%) |
| 6-Person Households | 0 (0.0%) | 0 (0.0%) |
| 7+ Person Households | 0 (0.0%) | 0 (0.0%) |
| Total | 931 (62.1%) | 569 (37.9%) |
Female Fertility in Lakewood
Fertility by Age in Lakewood
Average fertility rate in Lakewood is 22.0 births per 1,000 women. Women in the age bracket of 20 to 34 years have the highest fertility rate with 64.0 births per 1,000 women. Women in the age bracket of 20 to 34 years acount for 100.0% of all women with births.
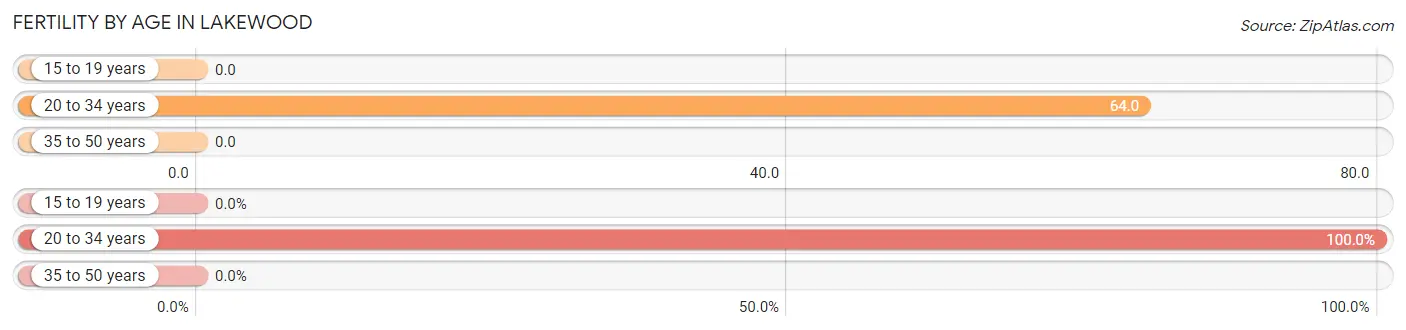
| Age Bracket | Women with Births | Births / 1,000 Women |
| 15 to 19 years | 0 (0.0%) | 0.0 |
| 20 to 34 years | 15 (100.0%) | 64.0 |
| 35 to 50 years | 0 (0.0%) | 0.0 |
| Total | 15 (100.0%) | 22.0 |
Fertility by Age by Marriage Status in Lakewood
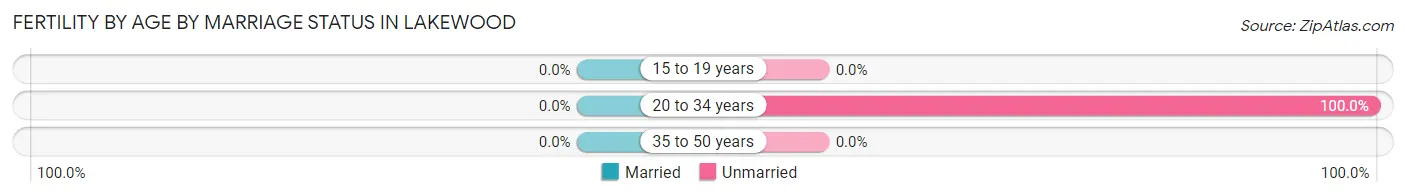
| Age Bracket | Married | Unmarried |
| 15 to 19 years | 0 (0.0%) | 0 (0.0%) |
| 20 to 34 years | 0 (0.0%) | 15 (100.0%) |
| 35 to 50 years | 0 (0.0%) | 0 (0.0%) |
| Total | 0 (0.0%) | 15 (100.0%) |
Fertility by Education in Lakewood
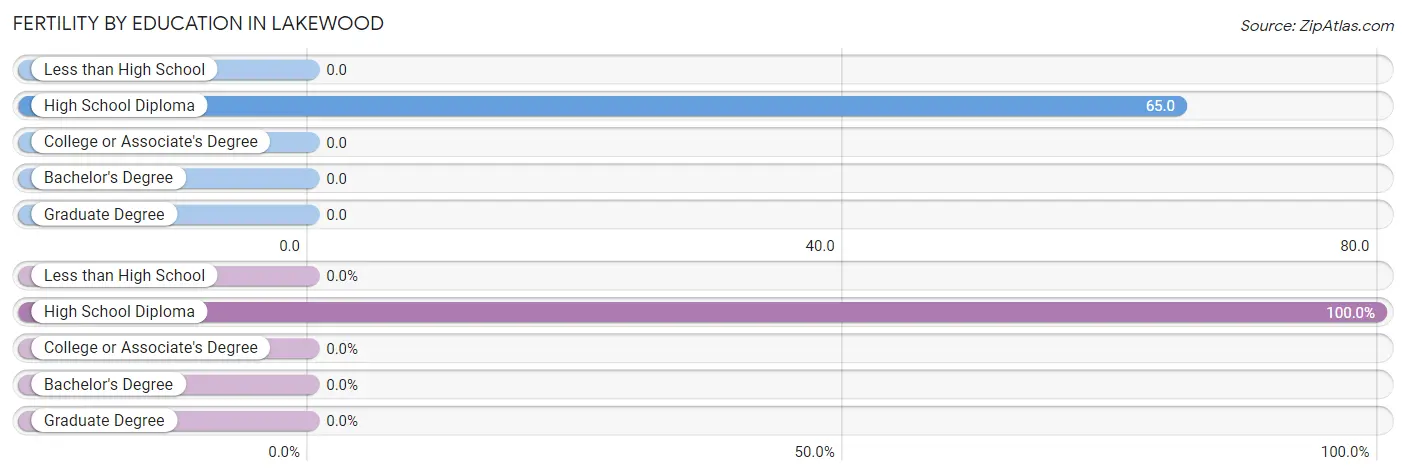
| Educational Attainment | Women with Births | Births / 1,000 Women |
| Less than High School | 0 (0.0%) | 0.0 |
| High School Diploma | 15 (100.0%) | 65.0 |
| College or Associate's Degree | 0 (0.0%) | 0.0 |
| Bachelor's Degree | 0 (0.0%) | 0.0 |
| Graduate Degree | 0 (0.0%) | 0.0 |
| Total | 15 (100.0%) | 22.0 |
Fertility by Education by Marriage Status in Lakewood
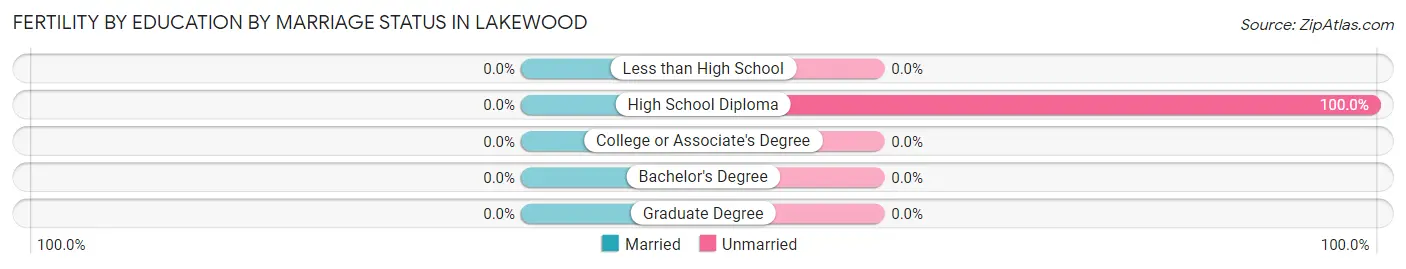
| Educational Attainment | Married | Unmarried |
| Less than High School | 0 (0.0%) | 0 (0.0%) |
| High School Diploma | 0 (0.0%) | 15 (100.0%) |
| College or Associate's Degree | 0 (0.0%) | 0 (0.0%) |
| Bachelor's Degree | 0 (0.0%) | 0 (0.0%) |
| Graduate Degree | 0 (0.0%) | 0 (0.0%) |
| Total | 0 (0.0%) | 15 (100.0%) |
Employment Characteristics in Lakewood
Employment by Class of Employer in Lakewood
Among the 1,669 employed individuals in Lakewood, private company employees (1,081 | 64.8%), not-for-profit organizations (280 | 16.8%), and self-employed (not incorporated) (169 | 10.1%) make up the most common classes of employment.
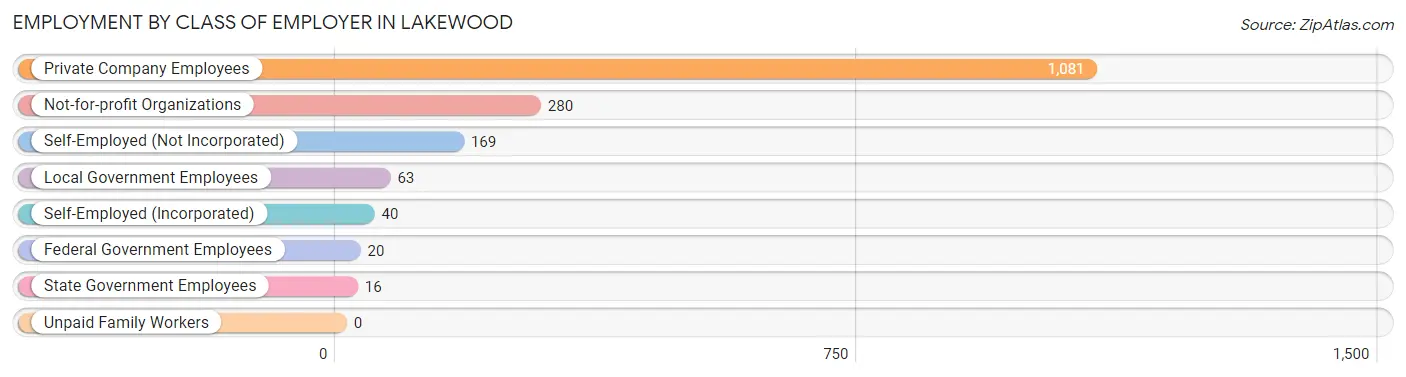
| Employer Class | # Employees | % Employees |
| Private Company Employees | 1,081 | 64.8% |
| Self-Employed (Incorporated) | 40 | 2.4% |
| Self-Employed (Not Incorporated) | 169 | 10.1% |
| Not-for-profit Organizations | 280 | 16.8% |
| Local Government Employees | 63 | 3.8% |
| State Government Employees | 16 | 1.0% |
| Federal Government Employees | 20 | 1.2% |
| Unpaid Family Workers | 0 | 0.0% |
| Total | 1,669 | 100.0% |
Employment Status by Age in Lakewood
According to the labor force statistics for Lakewood, out of the total population over 16 years of age (2,816), 64.8% or 1,825 individuals are in the labor force, with 8.6% or 157 of them unemployed. The age group with the highest labor force participation rate is 25 to 29 years, with 100.0% or 329 individuals in the labor force. Within the labor force, the 25 to 29 years age range has the highest percentage of unemployed individuals, with 31.0% or 102 of them being unemployed.
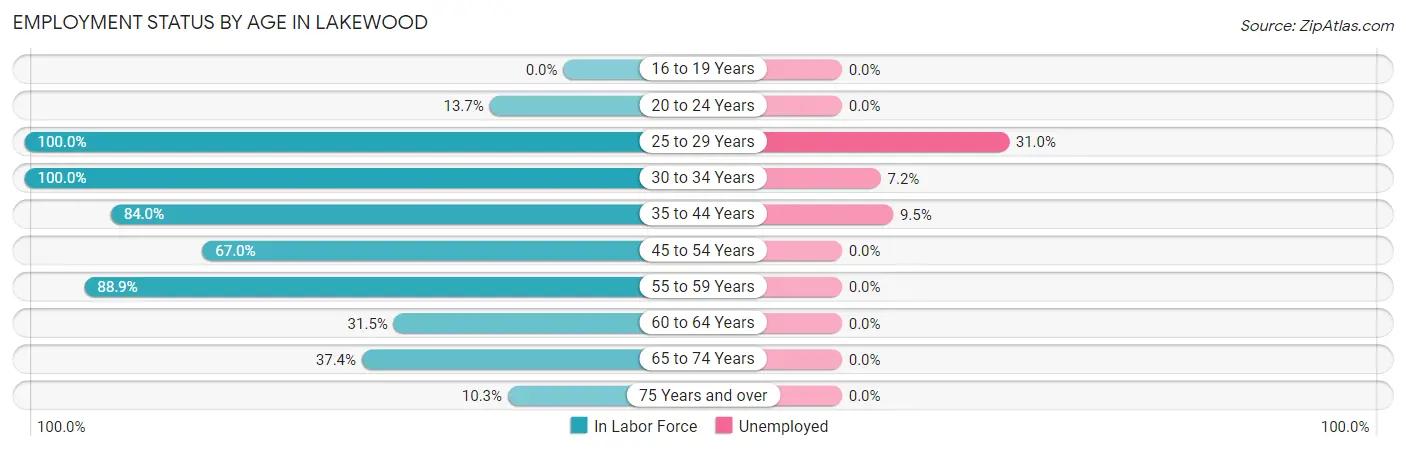
| Age Bracket | In Labor Force | Unemployed |
| 16 to 19 Years | 0 (0.0%) | 0 (0.0%) |
| 20 to 24 Years | 19 (13.7%) | 0 (0.0%) |
| 25 to 29 Years | 329 (100.0%) | 102 (31.0%) |
| 30 to 34 Years | 264 (100.0%) | 19 (7.2%) |
| 35 to 44 Years | 377 (84.0%) | 36 (9.5%) |
| 45 to 54 Years | 187 (67.0%) | 0 (0.0%) |
| 55 to 59 Years | 353 (88.9%) | 0 (0.0%) |
| 60 to 64 Years | 91 (31.5%) | 0 (0.0%) |
| 65 to 74 Years | 189 (37.4%) | 0 (0.0%) |
| 75 Years and over | 17 (10.3%) | 0 (0.0%) |
| Total | 1,825 (64.8%) | 157 (8.6%) |
Employment Status by Educational Attainment in Lakewood
According to labor force statistics for Lakewood, 79.8% of individuals (1,602) out of the total population between 25 and 64 years of age (2,007) are in the labor force, with 9.8% or 157 of them being unemployed. The group with the highest labor force participation rate are those with the educational attainment of college / associate degree, with 90.9% or 829 individuals in the labor force. Within the labor force, individuals with college / associate degree education have the highest percentage of unemployment, with 14.6% or 121 of them being unemployed.
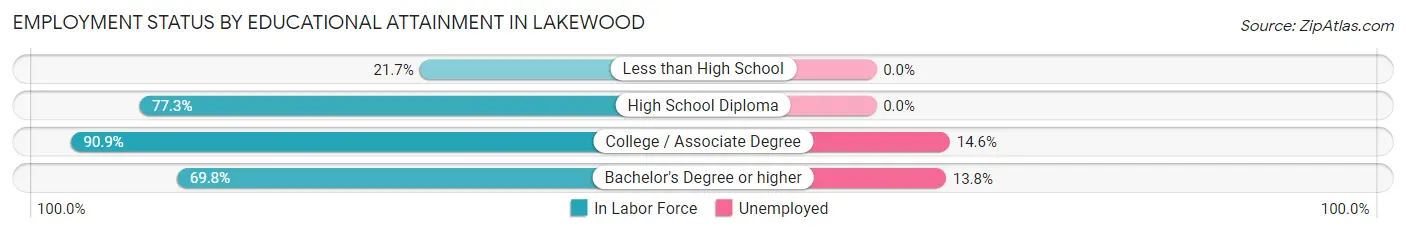
| Educational Attainment | In Labor Force | Unemployed |
| Less than High School | 18 (21.7%) | 0 (0.0%) |
| High School Diploma | 493 (77.3%) | 0 (0.0%) |
| College / Associate Degree | 829 (90.9%) | 133 (14.6%) |
| Bachelor's Degree or higher | 261 (69.8%) | 52 (13.8%) |
| Total | 1,602 (79.8%) | 197 (9.8%) |
Employment Occupations by Sex in Lakewood
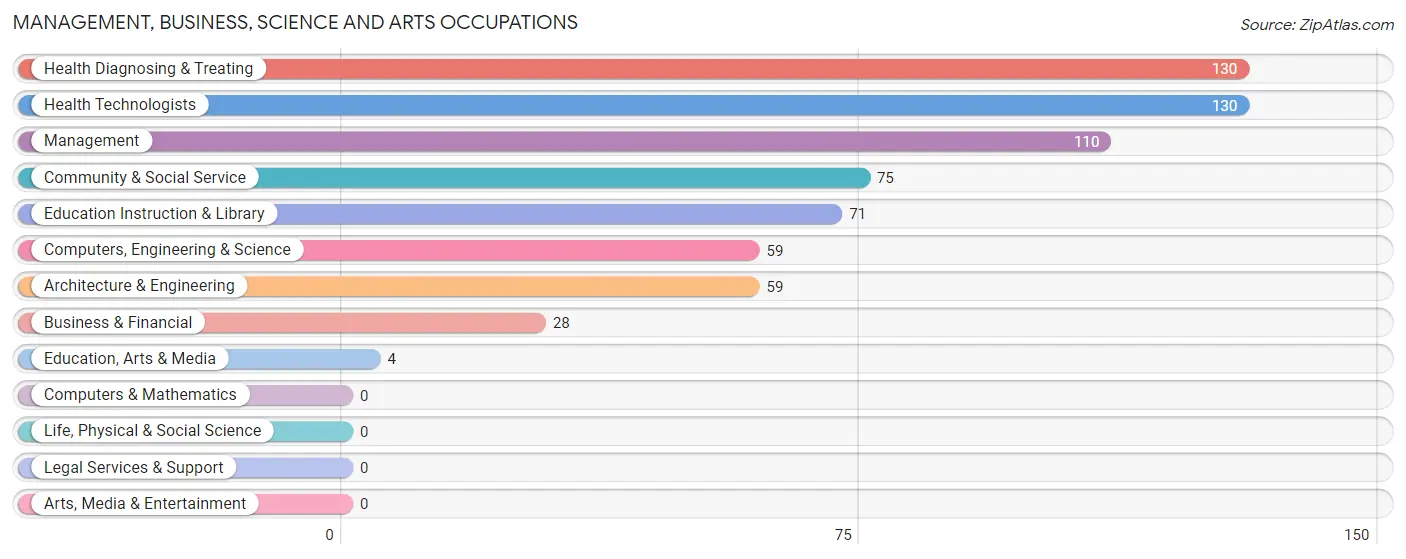
Management, Business, Science and Arts Occupations
The most common Management, Business, Science and Arts occupations in Lakewood are Health Diagnosing & Treating (130 | 7.8%), Health Technologists (130 | 7.8%), Management (110 | 6.6%), Community & Social Service (75 | 4.5%), and Education Instruction & Library (71 | 4.3%).
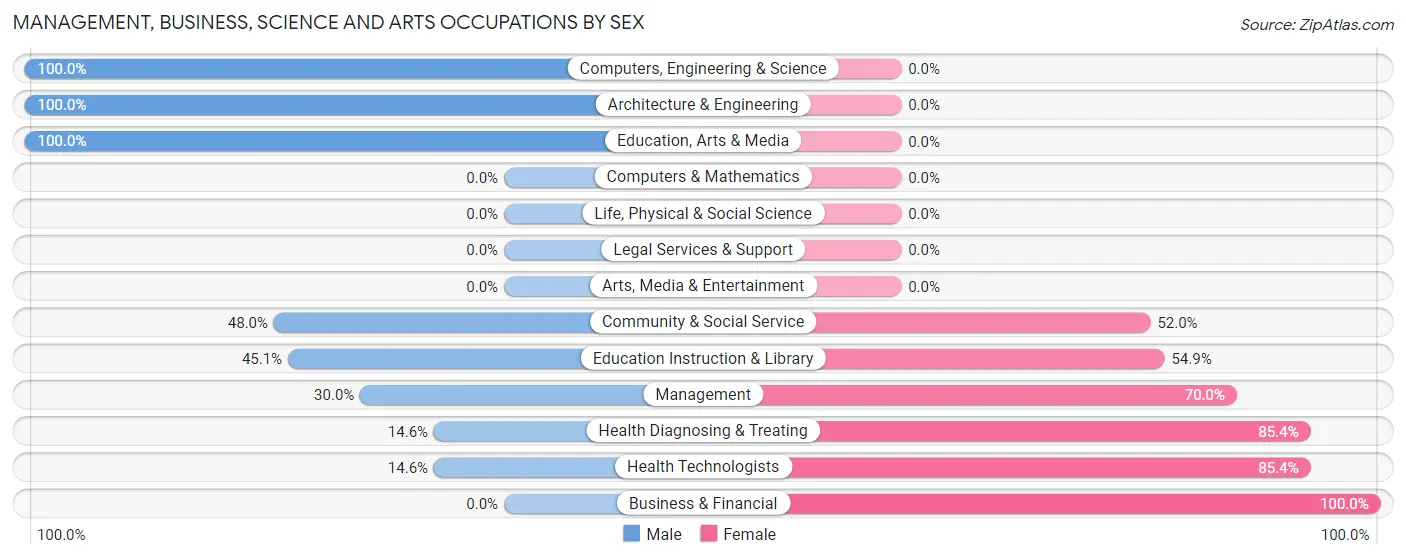
Management, Business, Science and Arts Occupations by Sex
Within the Management, Business, Science and Arts occupations in Lakewood, the most male-oriented occupations are Computers, Engineering & Science (100.0%), Architecture & Engineering (100.0%), and Education, Arts & Media (100.0%), while the most female-oriented occupations are Business & Financial (100.0%), Health Diagnosing & Treating (85.4%), and Health Technologists (85.4%).
| Occupation | Male | Female |
| Management | 33 (30.0%) | 77 (70.0%) |
| Business & Financial | 0 (0.0%) | 28 (100.0%) |
| Computers, Engineering & Science | 59 (100.0%) | 0 (0.0%) |
| Computers & Mathematics | 0 (0.0%) | 0 (0.0%) |
| Architecture & Engineering | 59 (100.0%) | 0 (0.0%) |
| Life, Physical & Social Science | 0 (0.0%) | 0 (0.0%) |
| Community & Social Service | 36 (48.0%) | 39 (52.0%) |
| Education, Arts & Media | 4 (100.0%) | 0 (0.0%) |
| Legal Services & Support | 0 (0.0%) | 0 (0.0%) |
| Education Instruction & Library | 32 (45.1%) | 39 (54.9%) |
| Arts, Media & Entertainment | 0 (0.0%) | 0 (0.0%) |
| Health Diagnosing & Treating | 19 (14.6%) | 111 (85.4%) |
| Health Technologists | 19 (14.6%) | 111 (85.4%) |
| Total (Category) | 147 (36.6%) | 255 (63.4%) |
| Total (Overall) | 879 (52.7%) | 790 (47.3%) |
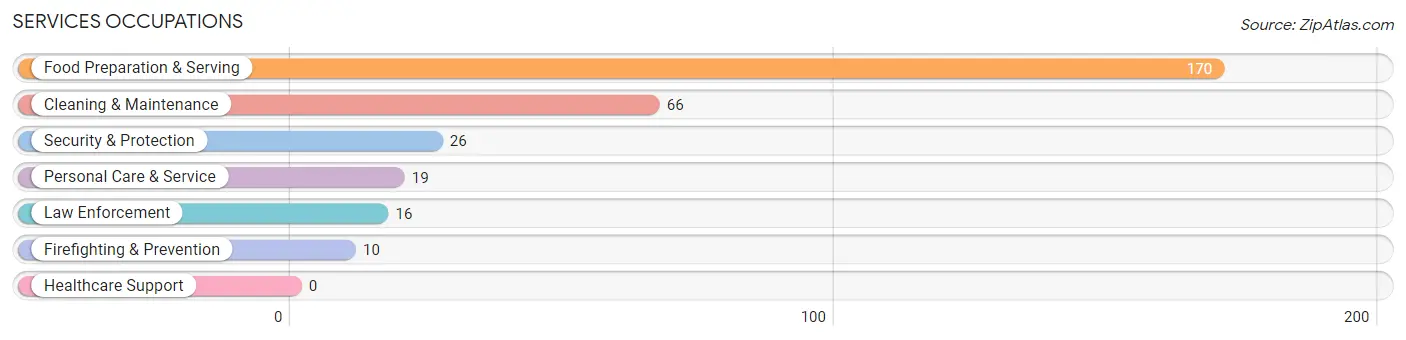
Services Occupations
The most common Services occupations in Lakewood are Food Preparation & Serving (170 | 10.2%), Cleaning & Maintenance (66 | 4.0%), Security & Protection (26 | 1.6%), Personal Care & Service (19 | 1.1%), and Law Enforcement (16 | 1.0%).
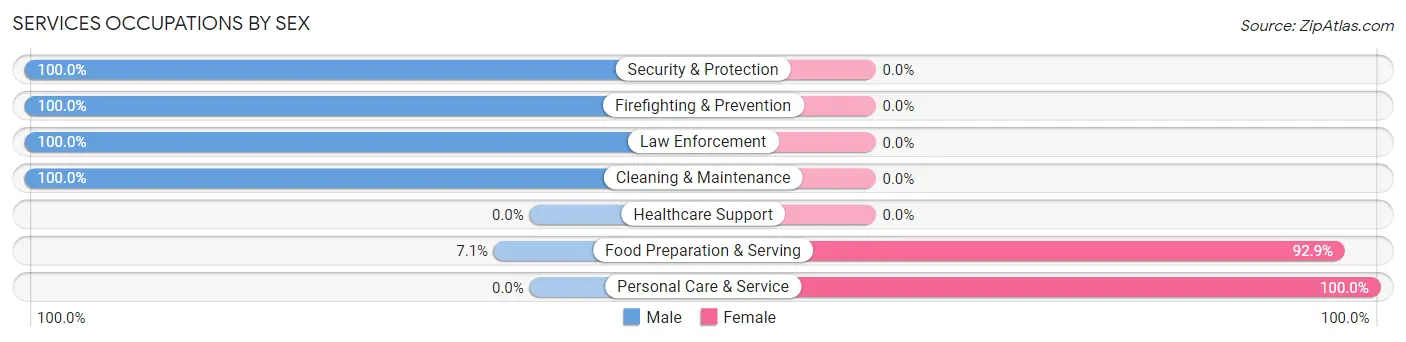
Services Occupations by Sex
Within the Services occupations in Lakewood, the most male-oriented occupations are Security & Protection (100.0%), Firefighting & Prevention (100.0%), and Law Enforcement (100.0%), while the most female-oriented occupations are Personal Care & Service (100.0%), and Food Preparation & Serving (92.9%).
| Occupation | Male | Female |
| Healthcare Support | 0 (0.0%) | 0 (0.0%) |
| Security & Protection | 26 (100.0%) | 0 (0.0%) |
| Firefighting & Prevention | 10 (100.0%) | 0 (0.0%) |
| Law Enforcement | 16 (100.0%) | 0 (0.0%) |
| Food Preparation & Serving | 12 (7.1%) | 158 (92.9%) |
| Cleaning & Maintenance | 66 (100.0%) | 0 (0.0%) |
| Personal Care & Service | 0 (0.0%) | 19 (100.0%) |
| Total (Category) | 104 (37.0%) | 177 (63.0%) |
| Total (Overall) | 879 (52.7%) | 790 (47.3%) |
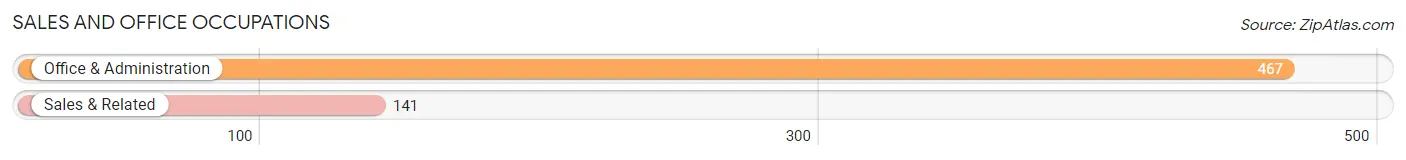
Sales and Office Occupations
The most common Sales and Office occupations in Lakewood are Office & Administration (467 | 28.0%), and Sales & Related (141 | 8.5%).
Sales and Office Occupations by Sex
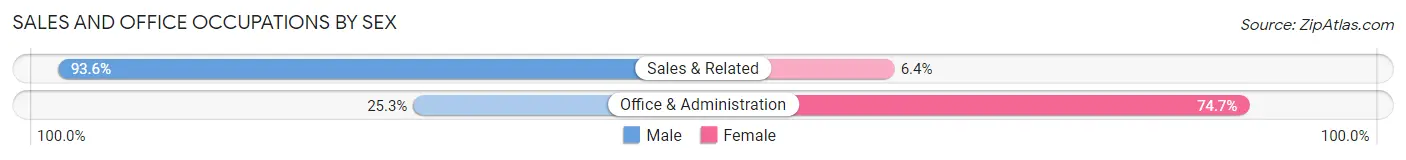
| Occupation | Male | Female |
| Sales & Related | 132 (93.6%) | 9 (6.4%) |
| Office & Administration | 118 (25.3%) | 349 (74.7%) |
| Total (Category) | 250 (41.1%) | 358 (58.9%) |
| Total (Overall) | 879 (52.7%) | 790 (47.3%) |
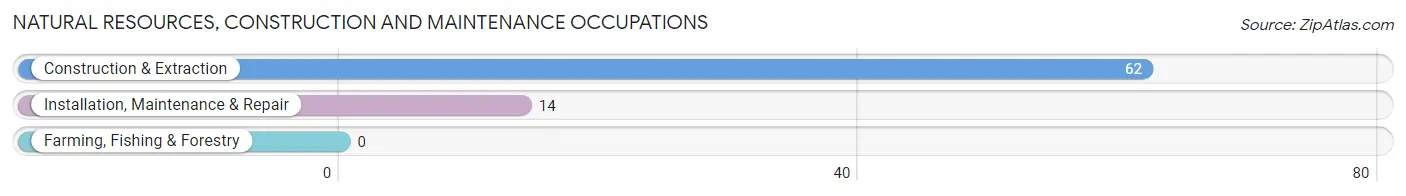
Natural Resources, Construction and Maintenance Occupations
The most common Natural Resources, Construction and Maintenance occupations in Lakewood are Construction & Extraction (62 | 3.7%), and Installation, Maintenance & Repair (14 | 0.8%).
Natural Resources, Construction and Maintenance Occupations by Sex
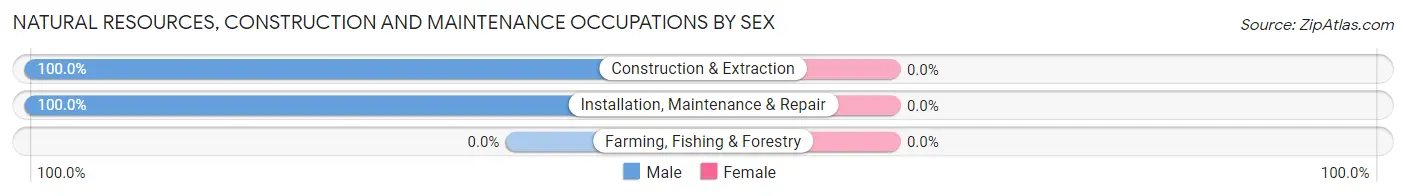
| Occupation | Male | Female |
| Farming, Fishing & Forestry | 0 (0.0%) | 0 (0.0%) |
| Construction & Extraction | 62 (100.0%) | 0 (0.0%) |
| Installation, Maintenance & Repair | 14 (100.0%) | 0 (0.0%) |
| Total (Category) | 76 (100.0%) | 0 (0.0%) |
| Total (Overall) | 879 (52.7%) | 790 (47.3%) |
Production, Transportation and Moving Occupations
The most common Production, Transportation and Moving occupations in Lakewood are Transportation (160 | 9.6%), Production (123 | 7.4%), and Material Moving (19 | 1.1%).
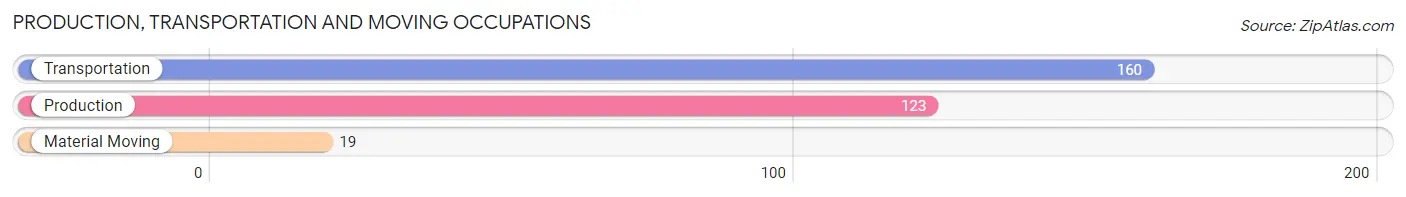
Production, Transportation and Moving Occupations by Sex
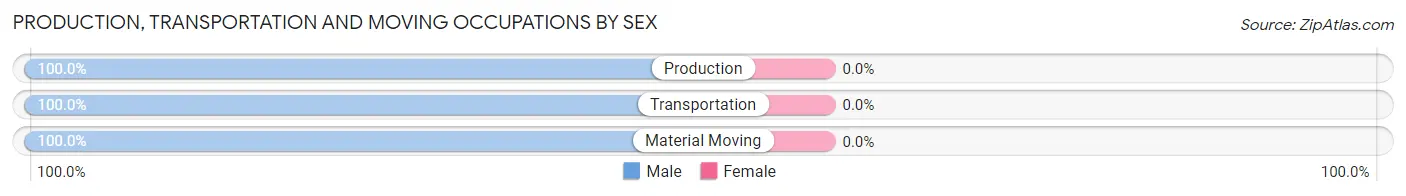
| Occupation | Male | Female |
| Production | 123 (100.0%) | 0 (0.0%) |
| Transportation | 160 (100.0%) | 0 (0.0%) |
| Material Moving | 19 (100.0%) | 0 (0.0%) |
| Total (Category) | 302 (100.0%) | 0 (0.0%) |
| Total (Overall) | 879 (52.7%) | 790 (47.3%) |
Employment Industries by Sex in Lakewood
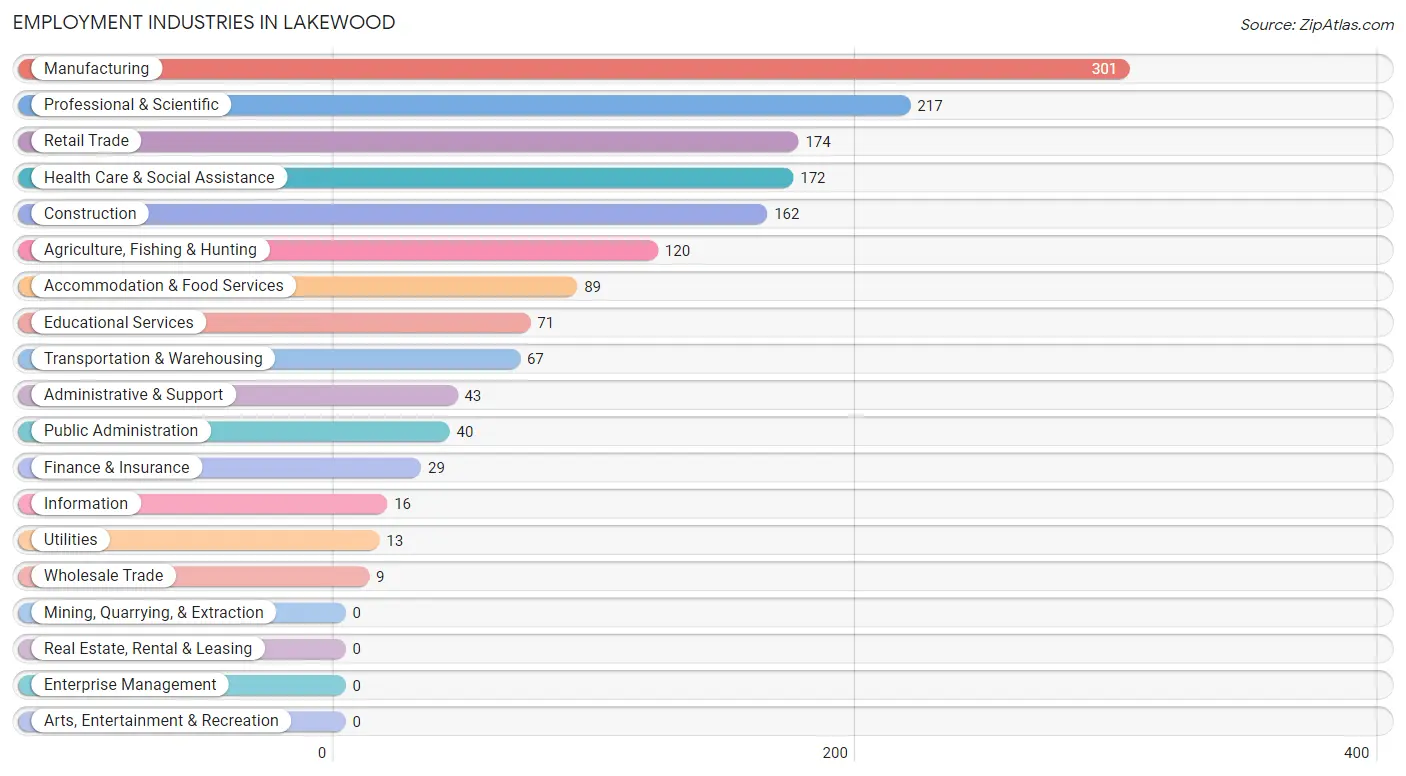
Employment Industries in Lakewood
The major employment industries in Lakewood include Manufacturing (301 | 18.0%), Professional & Scientific (217 | 13.0%), Retail Trade (174 | 10.4%), Health Care & Social Assistance (172 | 10.3%), and Construction (162 | 9.7%).
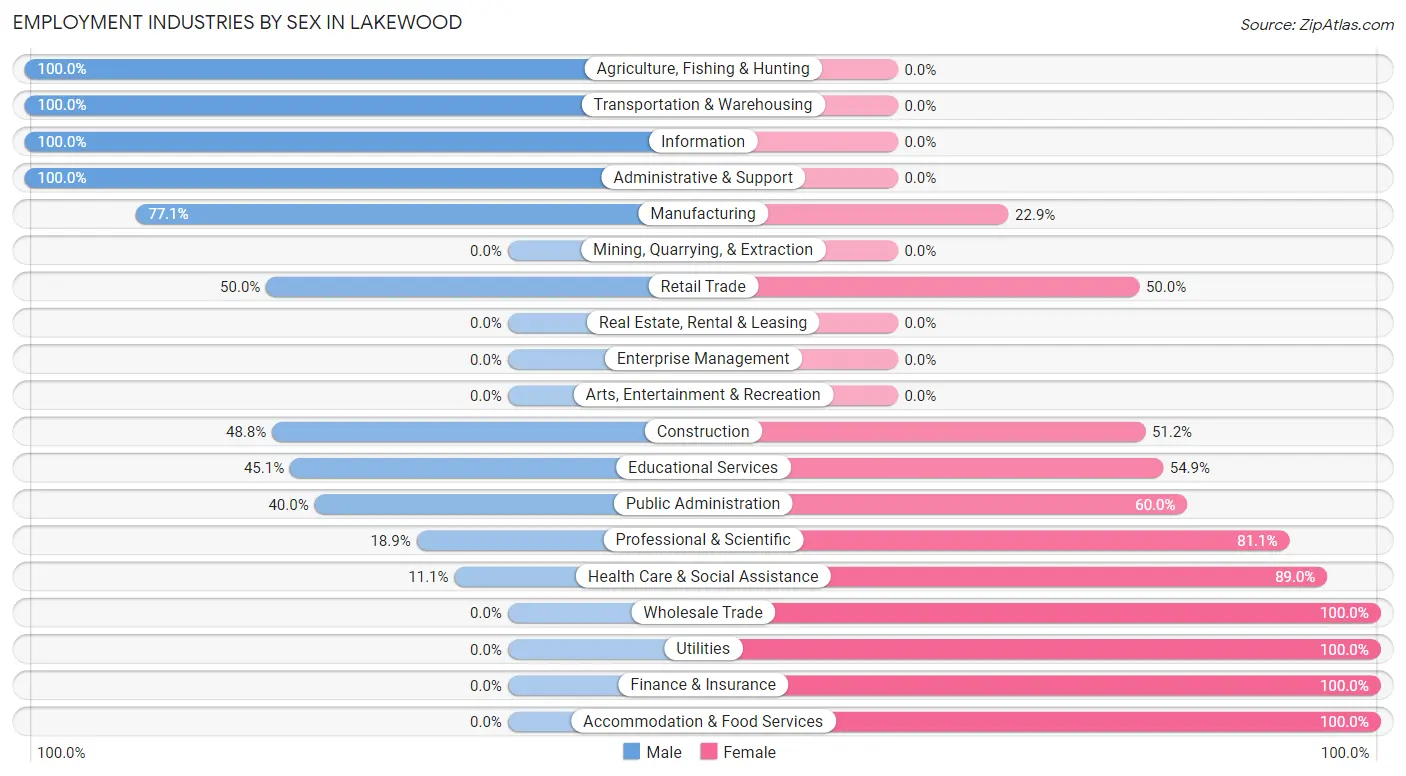
Employment Industries by Sex in Lakewood
The Lakewood industries that see more men than women are Agriculture, Fishing & Hunting (100.0%), Transportation & Warehousing (100.0%), and Information (100.0%), whereas the industries that tend to have a higher number of women are Wholesale Trade (100.0%), Utilities (100.0%), and Finance & Insurance (100.0%).
| Industry | Male | Female |
| Agriculture, Fishing & Hunting | 120 (100.0%) | 0 (0.0%) |
| Mining, Quarrying, & Extraction | 0 (0.0%) | 0 (0.0%) |
| Construction | 79 (48.8%) | 83 (51.2%) |
| Manufacturing | 232 (77.1%) | 69 (22.9%) |
| Wholesale Trade | 0 (0.0%) | 9 (100.0%) |
| Retail Trade | 87 (50.0%) | 87 (50.0%) |
| Transportation & Warehousing | 67 (100.0%) | 0 (0.0%) |
| Utilities | 0 (0.0%) | 13 (100.0%) |
| Information | 16 (100.0%) | 0 (0.0%) |
| Finance & Insurance | 0 (0.0%) | 29 (100.0%) |
| Real Estate, Rental & Leasing | 0 (0.0%) | 0 (0.0%) |
| Professional & Scientific | 41 (18.9%) | 176 (81.1%) |
| Enterprise Management | 0 (0.0%) | 0 (0.0%) |
| Administrative & Support | 43 (100.0%) | 0 (0.0%) |
| Educational Services | 32 (45.1%) | 39 (54.9%) |
| Health Care & Social Assistance | 19 (11.1%) | 153 (88.9%) |
| Arts, Entertainment & Recreation | 0 (0.0%) | 0 (0.0%) |
| Accommodation & Food Services | 0 (0.0%) | 89 (100.0%) |
| Public Administration | 16 (40.0%) | 24 (60.0%) |
| Total | 879 (52.7%) | 790 (47.3%) |
Education in Lakewood
School Enrollment in Lakewood
The most common levels of schooling among the 616 students in Lakewood are college / undergraduate (304 | 49.3%), middle school (217 | 35.2%), and elementary school (32 | 5.2%).

| School Level | # Students | % Students |
| Nursery / Preschool | 0 | 0.0% |
| Kindergarten | 15 | 2.4% |
| Elementary School | 32 | 5.2% |
| Middle School | 217 | 35.2% |
| High School | 26 | 4.2% |
| College / Undergraduate | 304 | 49.3% |
| Graduate / Professional | 22 | 3.6% |
| Total | 616 | 100.0% |
School Enrollment by Age by Funding Source in Lakewood
Out of a total of 616 students who are enrolled in schools in Lakewood, 189 (30.7%) attend a private institution, while the remaining 427 (69.3%) are enrolled in public schools. The age group of 20 to 24 year olds has the highest likelihood of being enrolled in private schools, with 89 (100.0% in the age bracket) enrolled. Conversely, the age group of 5 to 9 year old has the lowest likelihood of being enrolled in a private school, with 31 (100.0% in the age bracket) attending a public institution.
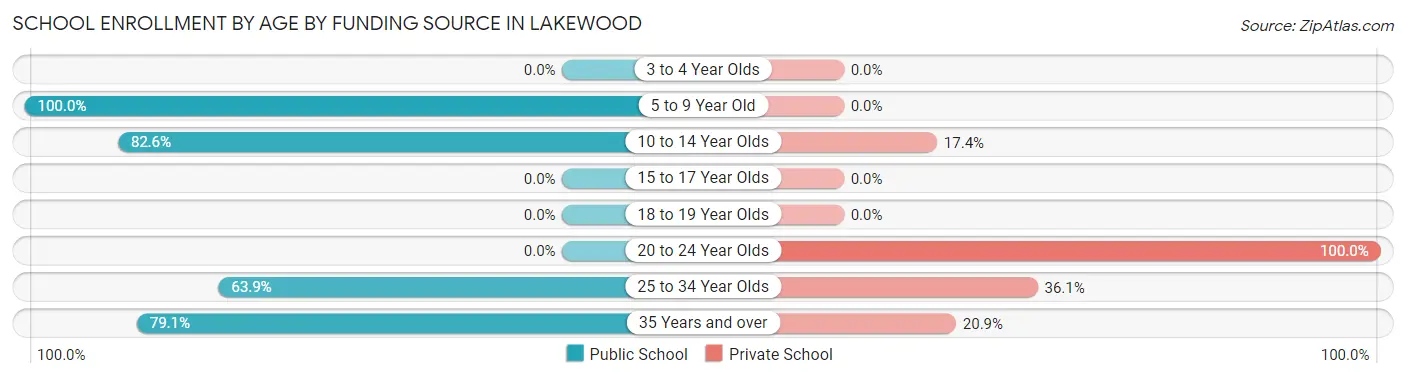
| Age Bracket | Public School | Private School |
| 3 to 4 Year Olds | 0 (0.0%) | 0 (0.0%) |
| 5 to 9 Year Old | 31 (100.0%) | 0 (0.0%) |
| 10 to 14 Year Olds | 214 (82.6%) | 45 (17.4%) |
| 15 to 17 Year Olds | 0 (0.0%) | 0 (0.0%) |
| 18 to 19 Year Olds | 0 (0.0%) | 0 (0.0%) |
| 20 to 24 Year Olds | 0 (0.0%) | 89 (100.0%) |
| 25 to 34 Year Olds | 23 (63.9%) | 13 (36.1%) |
| 35 Years and over | 159 (79.1%) | 42 (20.9%) |
| Total | 427 (69.3%) | 189 (30.7%) |
Educational Attainment by Field of Study in Lakewood
Physical & health sciences (119 | 22.4%), science & technology (111 | 20.9%), business (89 | 16.8%), engineering (75 | 14.1%), and psychology (52 | 9.8%) are the most common fields of study among 531 individuals in Lakewood who have obtained a bachelor's degree or higher.
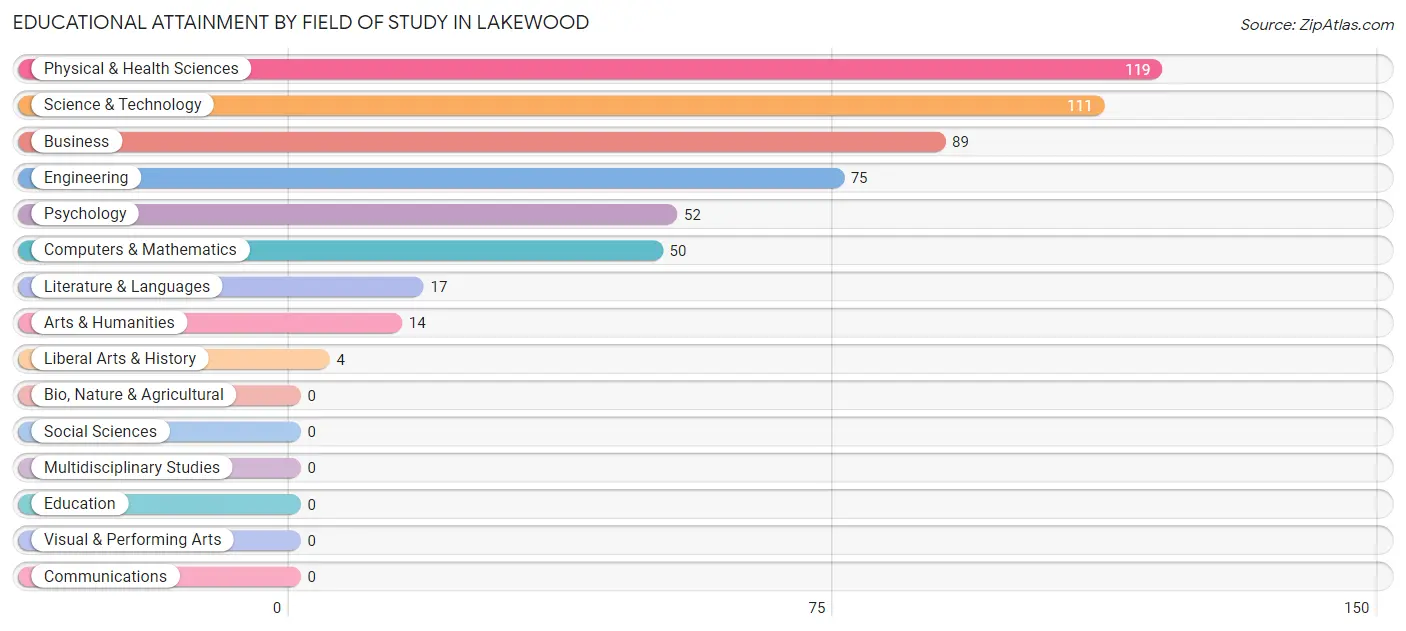
| Field of Study | # Graduates | % Graduates |
| Computers & Mathematics | 50 | 9.4% |
| Bio, Nature & Agricultural | 0 | 0.0% |
| Physical & Health Sciences | 119 | 22.4% |
| Psychology | 52 | 9.8% |
| Social Sciences | 0 | 0.0% |
| Engineering | 75 | 14.1% |
| Multidisciplinary Studies | 0 | 0.0% |
| Science & Technology | 111 | 20.9% |
| Business | 89 | 16.8% |
| Education | 0 | 0.0% |
| Literature & Languages | 17 | 3.2% |
| Liberal Arts & History | 4 | 0.7% |
| Visual & Performing Arts | 0 | 0.0% |
| Communications | 0 | 0.0% |
| Arts & Humanities | 14 | 2.6% |
| Total | 531 | 100.0% |
Transportation & Commute in Lakewood
Vehicle Availability by Sex in Lakewood
The most prevalent vehicle ownership categories in Lakewood are males with 2 vehicles (425, accounting for 48.3%) and females with 2 vehicles (401, making up 53.8%).
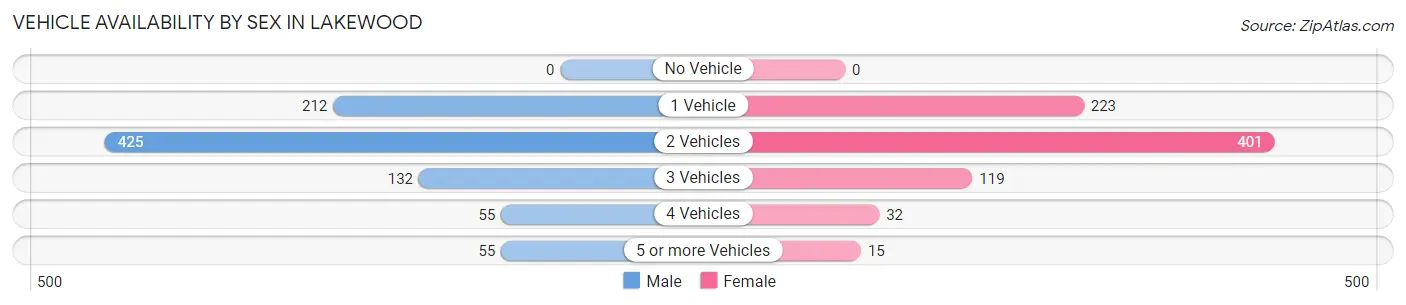
| Vehicles Available | Male | Female |
| No Vehicle | 0 (0.0%) | 0 (0.0%) |
| 1 Vehicle | 212 (24.1%) | 223 (28.2%) |
| 2 Vehicles | 425 (48.3%) | 401 (50.8%) |
| 3 Vehicles | 132 (15.0%) | 119 (15.1%) |
| 4 Vehicles | 55 (6.3%) | 32 (4.1%) |
| 5 or more Vehicles | 55 (6.3%) | 15 (1.9%) |
| Total | 879 (100.0%) | 790 (100.0%) |
Commute Time in Lakewood
The most frequently occuring commute durations in Lakewood are 60 to 89 minutes (370 commuters, 24.2%), 15 to 19 minutes (266 commuters, 17.4%), and 10 to 14 minutes (197 commuters, 12.9%).
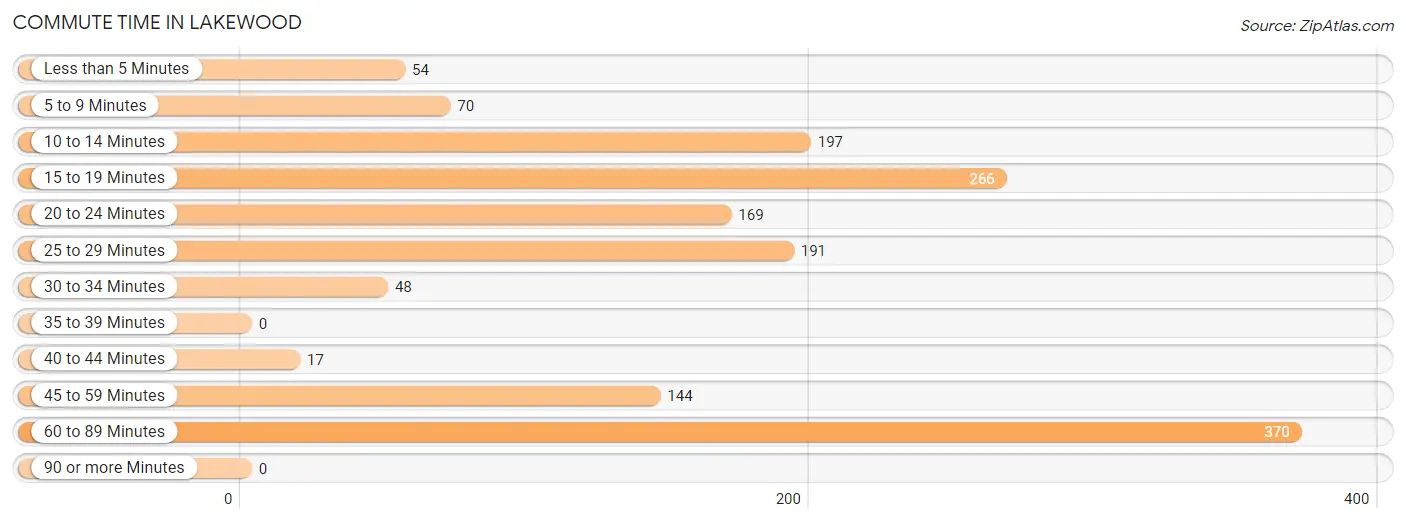
| Commute Time | # Commuters | % Commuters |
| Less than 5 Minutes | 54 | 3.5% |
| 5 to 9 Minutes | 70 | 4.6% |
| 10 to 14 Minutes | 197 | 12.9% |
| 15 to 19 Minutes | 266 | 17.4% |
| 20 to 24 Minutes | 169 | 11.1% |
| 25 to 29 Minutes | 191 | 12.5% |
| 30 to 34 Minutes | 48 | 3.2% |
| 35 to 39 Minutes | 0 | 0.0% |
| 40 to 44 Minutes | 17 | 1.1% |
| 45 to 59 Minutes | 144 | 9.4% |
| 60 to 89 Minutes | 370 | 24.2% |
| 90 or more Minutes | 0 | 0.0% |
Commute Time by Sex in Lakewood
The most common commute times in Lakewood are 25 to 29 minutes (171 commuters, 20.1%) for males and 60 to 89 minutes (235 commuters, 34.9%) for females.
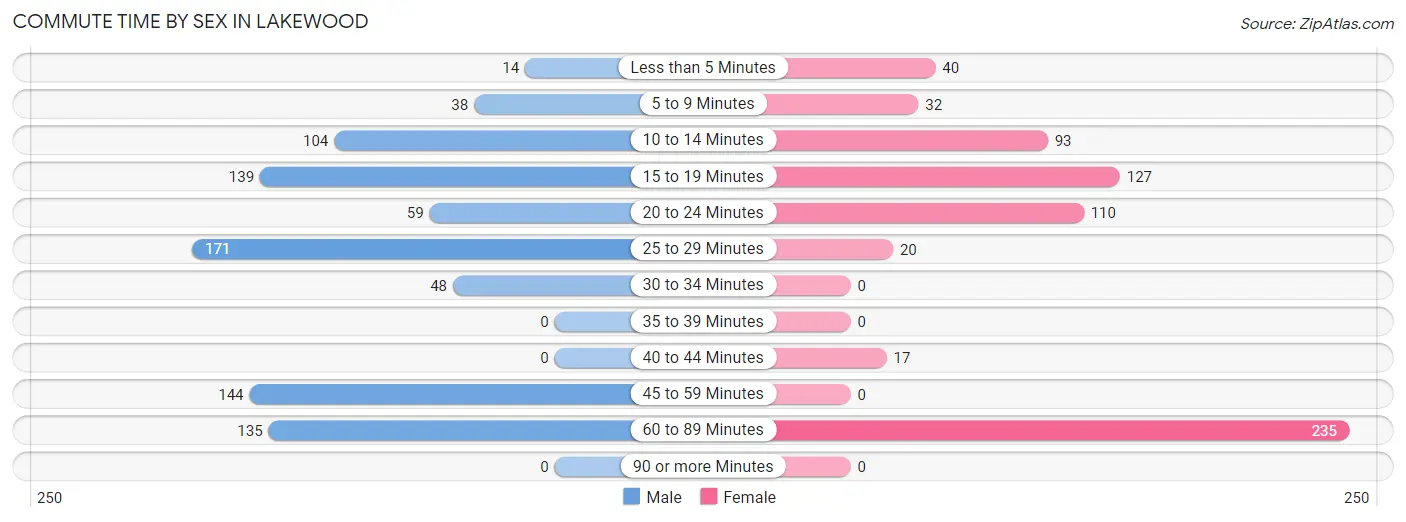
| Commute Time | Male | Female |
| Less than 5 Minutes | 14 (1.6%) | 40 (5.9%) |
| 5 to 9 Minutes | 38 (4.5%) | 32 (4.8%) |
| 10 to 14 Minutes | 104 (12.2%) | 93 (13.8%) |
| 15 to 19 Minutes | 139 (16.3%) | 127 (18.8%) |
| 20 to 24 Minutes | 59 (6.9%) | 110 (16.3%) |
| 25 to 29 Minutes | 171 (20.1%) | 20 (3.0%) |
| 30 to 34 Minutes | 48 (5.6%) | 0 (0.0%) |
| 35 to 39 Minutes | 0 (0.0%) | 0 (0.0%) |
| 40 to 44 Minutes | 0 (0.0%) | 17 (2.5%) |
| 45 to 59 Minutes | 144 (16.9%) | 0 (0.0%) |
| 60 to 89 Minutes | 135 (15.9%) | 235 (34.9%) |
| 90 or more Minutes | 0 (0.0%) | 0 (0.0%) |
Time of Departure to Work by Sex in Lakewood
The most frequent times of departure to work in Lakewood are 6:30 AM to 6:59 AM (187, 22.0%) for males and 6:30 AM to 6:59 AM (248, 36.8%) for females.
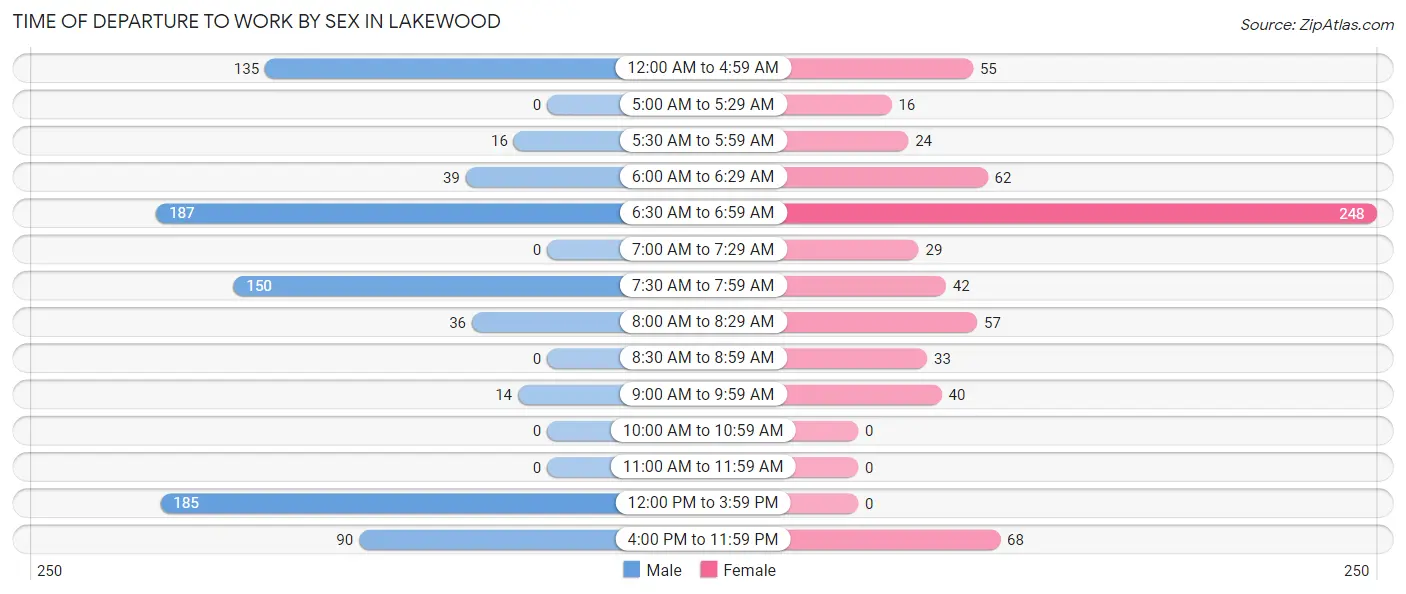
| Time of Departure | Male | Female |
| 12:00 AM to 4:59 AM | 135 (15.9%) | 55 (8.2%) |
| 5:00 AM to 5:29 AM | 0 (0.0%) | 16 (2.4%) |
| 5:30 AM to 5:59 AM | 16 (1.9%) | 24 (3.6%) |
| 6:00 AM to 6:29 AM | 39 (4.6%) | 62 (9.2%) |
| 6:30 AM to 6:59 AM | 187 (22.0%) | 248 (36.8%) |
| 7:00 AM to 7:29 AM | 0 (0.0%) | 29 (4.3%) |
| 7:30 AM to 7:59 AM | 150 (17.6%) | 42 (6.2%) |
| 8:00 AM to 8:29 AM | 36 (4.2%) | 57 (8.5%) |
| 8:30 AM to 8:59 AM | 0 (0.0%) | 33 (4.9%) |
| 9:00 AM to 9:59 AM | 14 (1.6%) | 40 (5.9%) |
| 10:00 AM to 10:59 AM | 0 (0.0%) | 0 (0.0%) |
| 11:00 AM to 11:59 AM | 0 (0.0%) | 0 (0.0%) |
| 12:00 PM to 3:59 PM | 185 (21.7%) | 0 (0.0%) |
| 4:00 PM to 11:59 PM | 90 (10.6%) | 68 (10.1%) |
| Total | 852 (100.0%) | 674 (100.0%) |
Housing Occupancy in Lakewood
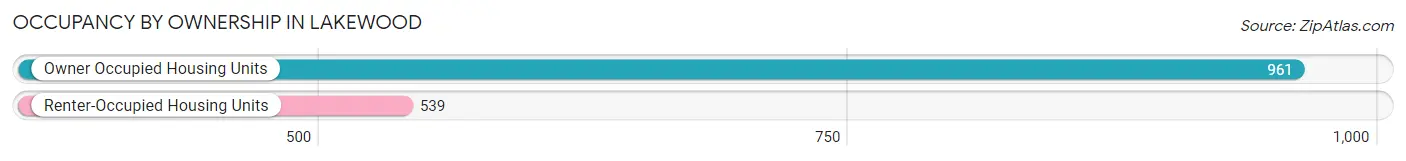
Occupancy by Ownership in Lakewood
Of the total 1,500 dwellings in Lakewood, owner-occupied units account for 961 (64.1%), while renter-occupied units make up 539 (35.9%).
| Occupancy | # Housing Units | % Housing Units |
| Owner Occupied Housing Units | 961 | 64.1% |
| Renter-Occupied Housing Units | 539 | 35.9% |
| Total Occupied Housing Units | 1,500 | 100.0% |
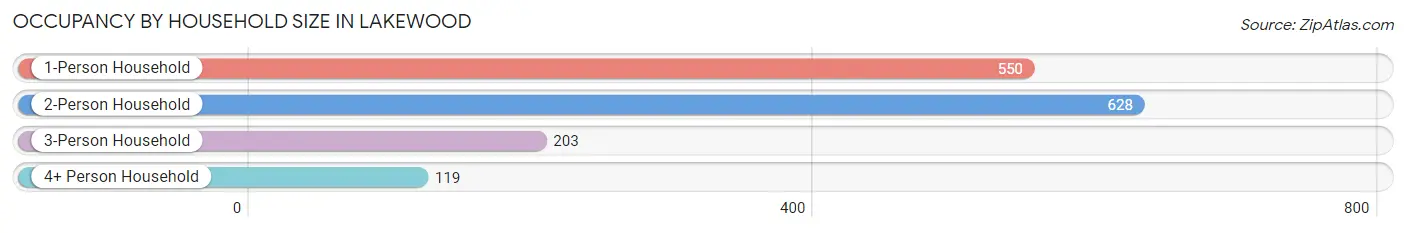
Occupancy by Household Size in Lakewood
| Household Size | # Housing Units | % Housing Units |
| 1-Person Household | 550 | 36.7% |
| 2-Person Household | 628 | 41.9% |
| 3-Person Household | 203 | 13.5% |
| 4+ Person Household | 119 | 7.9% |
| Total Housing Units | 1,500 | 100.0% |
Occupancy by Ownership by Household Size in Lakewood
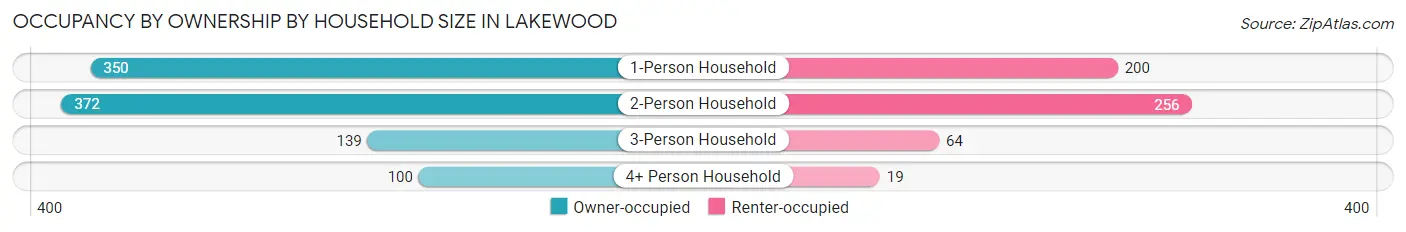
| Household Size | Owner-occupied | Renter-occupied |
| 1-Person Household | 350 (63.6%) | 200 (36.4%) |
| 2-Person Household | 372 (59.2%) | 256 (40.8%) |
| 3-Person Household | 139 (68.5%) | 64 (31.5%) |
| 4+ Person Household | 100 (84.0%) | 19 (16.0%) |
| Total Housing Units | 961 (64.1%) | 539 (35.9%) |
Occupancy by Educational Attainment in Lakewood
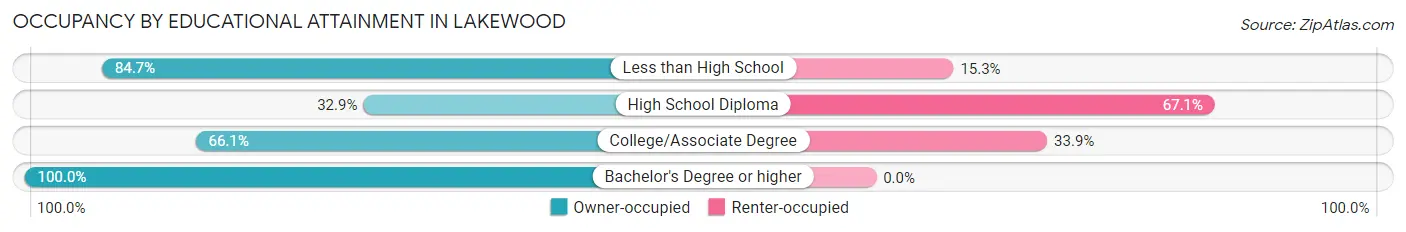
| Household Size | Owner-occupied | Renter-occupied |
| Less than High School | 94 (84.7%) | 17 (15.3%) |
| High School Diploma | 139 (32.9%) | 284 (67.1%) |
| College/Associate Degree | 464 (66.1%) | 238 (33.9%) |
| Bachelor's Degree or higher | 264 (100.0%) | 0 (0.0%) |
Occupancy by Age of Householder in Lakewood
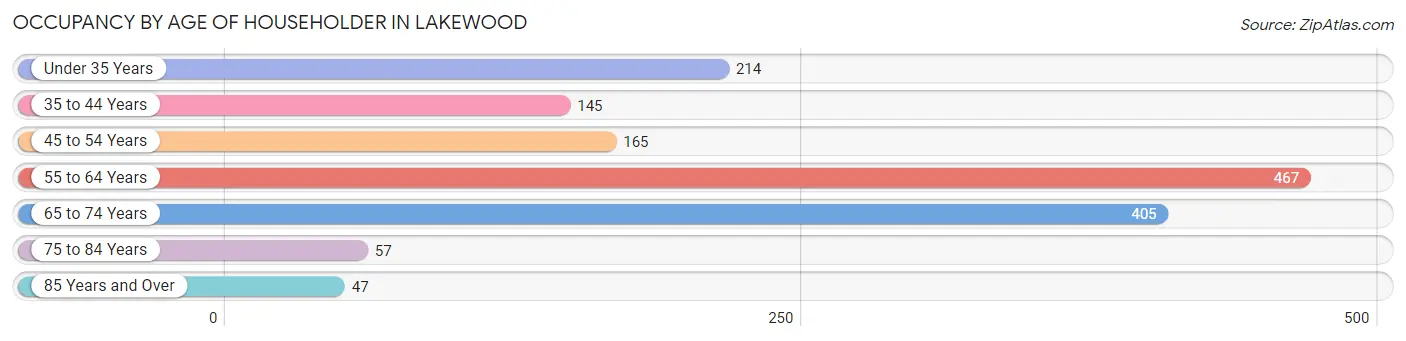
| Age Bracket | # Households | % Households |
| Under 35 Years | 214 | 14.3% |
| 35 to 44 Years | 145 | 9.7% |
| 45 to 54 Years | 165 | 11.0% |
| 55 to 64 Years | 467 | 31.1% |
| 65 to 74 Years | 405 | 27.0% |
| 75 to 84 Years | 57 | 3.8% |
| 85 Years and Over | 47 | 3.1% |
| Total | 1,500 | 100.0% |
Housing Finances in Lakewood
Median Income by Occupancy in Lakewood
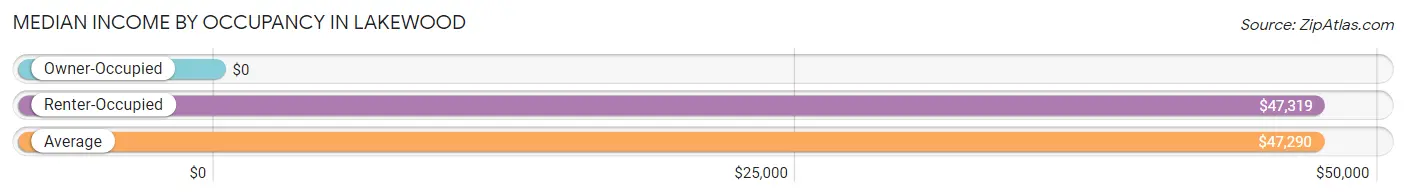
| Occupancy Type | # Households | Median Income |
| Owner-Occupied | 961 (64.1%) | $0 |
| Renter-Occupied | 539 (35.9%) | $47,319 |
| Average | 1,500 (100.0%) | $47,290 |
Occupancy by Householder Income Bracket in Lakewood
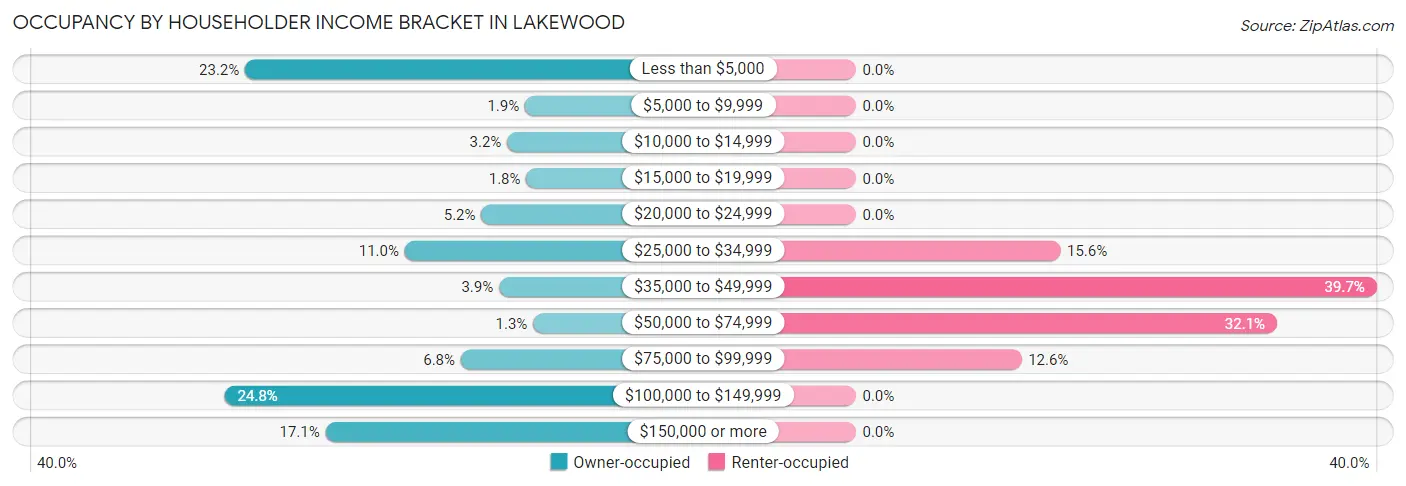
| Income Bracket | Owner-occupied | Renter-occupied |
| Less than $5,000 | 223 (23.2%) | 0 (0.0%) |
| $5,000 to $9,999 | 18 (1.9%) | 0 (0.0%) |
| $10,000 to $14,999 | 31 (3.2%) | 0 (0.0%) |
| $15,000 to $19,999 | 17 (1.8%) | 0 (0.0%) |
| $20,000 to $24,999 | 50 (5.2%) | 0 (0.0%) |
| $25,000 to $34,999 | 106 (11.0%) | 84 (15.6%) |
| $35,000 to $49,999 | 37 (3.8%) | 214 (39.7%) |
| $50,000 to $74,999 | 12 (1.3%) | 173 (32.1%) |
| $75,000 to $99,999 | 65 (6.8%) | 68 (12.6%) |
| $100,000 to $149,999 | 238 (24.8%) | 0 (0.0%) |
| $150,000 or more | 164 (17.1%) | 0 (0.0%) |
| Total | 961 (100.0%) | 539 (100.0%) |
Monthly Housing Cost Tiers in Lakewood
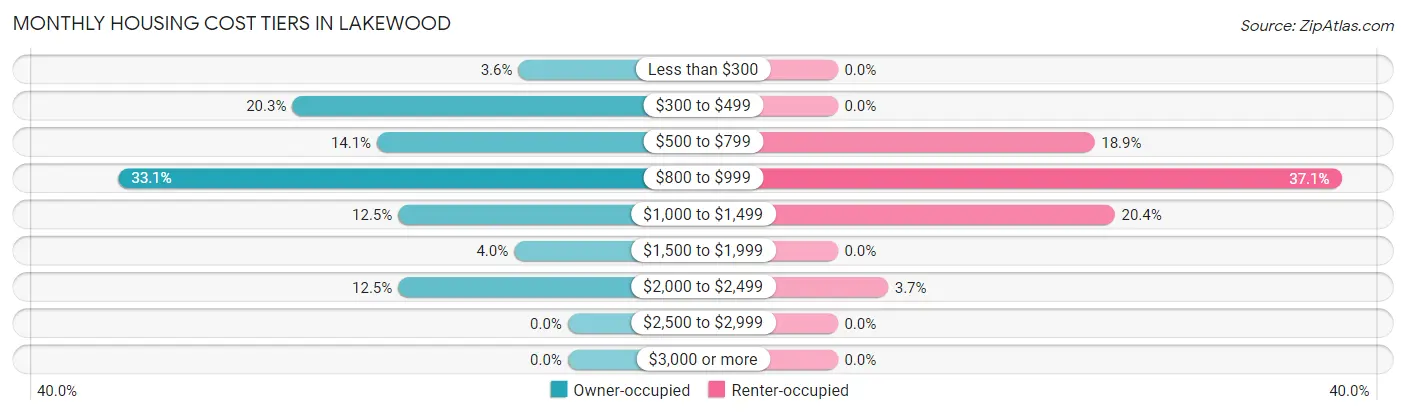
| Monthly Cost | Owner-occupied | Renter-occupied |
| Less than $300 | 35 (3.6%) | 0 (0.0%) |
| $300 to $499 | 195 (20.3%) | 0 (0.0%) |
| $500 to $799 | 135 (14.1%) | 102 (18.9%) |
| $800 to $999 | 318 (33.1%) | 200 (37.1%) |
| $1,000 to $1,499 | 120 (12.5%) | 110 (20.4%) |
| $1,500 to $1,999 | 38 (4.0%) | 0 (0.0%) |
| $2,000 to $2,499 | 120 (12.5%) | 20 (3.7%) |
| $2,500 to $2,999 | 0 (0.0%) | 0 (0.0%) |
| $3,000 or more | 0 (0.0%) | 0 (0.0%) |
| Total | 961 (100.0%) | 539 (100.0%) |
Physical Housing Characteristics in Lakewood
Housing Structures in Lakewood
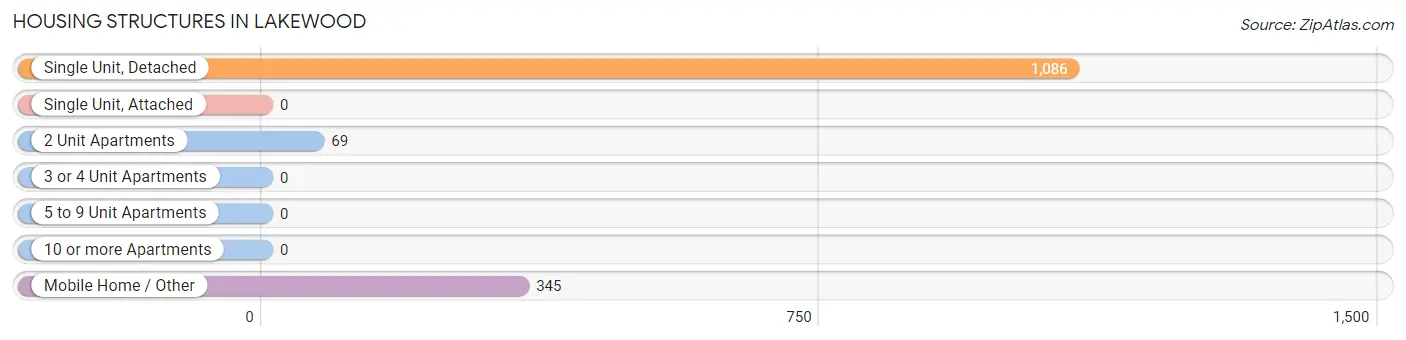
| Structure Type | # Housing Units | % Housing Units |
| Single Unit, Detached | 1,086 | 72.4% |
| Single Unit, Attached | 0 | 0.0% |
| 2 Unit Apartments | 69 | 4.6% |
| 3 or 4 Unit Apartments | 0 | 0.0% |
| 5 to 9 Unit Apartments | 0 | 0.0% |
| 10 or more Apartments | 0 | 0.0% |
| Mobile Home / Other | 345 | 23.0% |
| Total | 1,500 | 100.0% |
Housing Structures by Occupancy in Lakewood
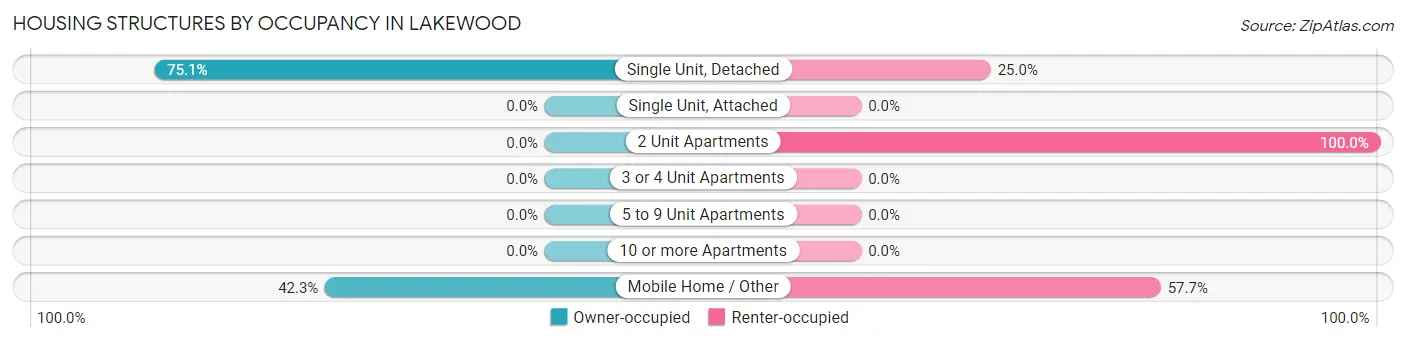
| Structure Type | Owner-occupied | Renter-occupied |
| Single Unit, Detached | 815 (75.0%) | 271 (24.9%) |
| Single Unit, Attached | 0 (0.0%) | 0 (0.0%) |
| 2 Unit Apartments | 0 (0.0%) | 69 (100.0%) |
| 3 or 4 Unit Apartments | 0 (0.0%) | 0 (0.0%) |
| 5 to 9 Unit Apartments | 0 (0.0%) | 0 (0.0%) |
| 10 or more Apartments | 0 (0.0%) | 0 (0.0%) |
| Mobile Home / Other | 146 (42.3%) | 199 (57.7%) |
| Total | 961 (64.1%) | 539 (35.9%) |
Housing Structures by Number of Rooms in Lakewood
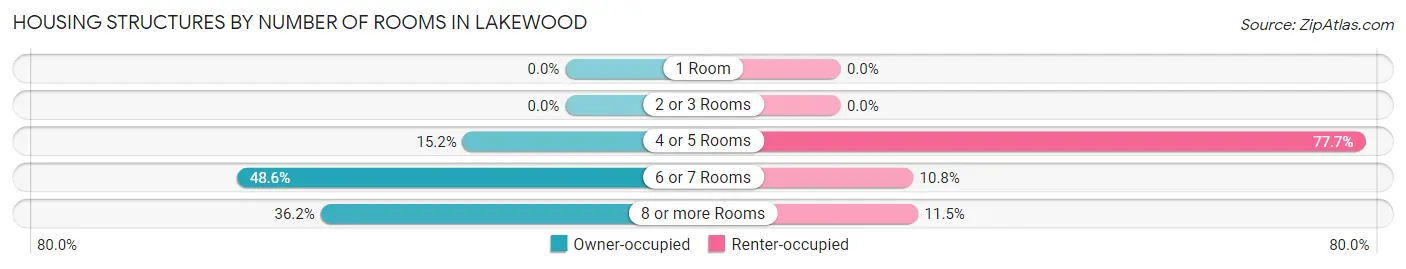
| Number of Rooms | Owner-occupied | Renter-occupied |
| 1 Room | 0 (0.0%) | 0 (0.0%) |
| 2 or 3 Rooms | 0 (0.0%) | 0 (0.0%) |
| 4 or 5 Rooms | 146 (15.2%) | 419 (77.7%) |
| 6 or 7 Rooms | 467 (48.6%) | 58 (10.8%) |
| 8 or more Rooms | 348 (36.2%) | 62 (11.5%) |
| Total | 961 (100.0%) | 539 (100.0%) |
Housing Structure by Heating Type in Lakewood
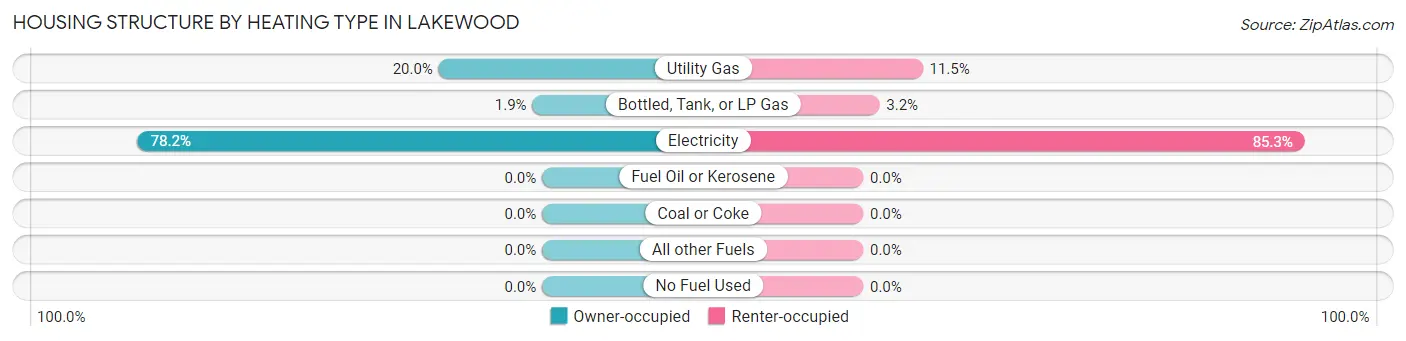
| Heating Type | Owner-occupied | Renter-occupied |
| Utility Gas | 192 (20.0%) | 62 (11.5%) |
| Bottled, Tank, or LP Gas | 18 (1.9%) | 17 (3.2%) |
| Electricity | 751 (78.1%) | 460 (85.3%) |
| Fuel Oil or Kerosene | 0 (0.0%) | 0 (0.0%) |
| Coal or Coke | 0 (0.0%) | 0 (0.0%) |
| All other Fuels | 0 (0.0%) | 0 (0.0%) |
| No Fuel Used | 0 (0.0%) | 0 (0.0%) |
| Total | 961 (100.0%) | 539 (100.0%) |
Household Vehicle Usage in Lakewood
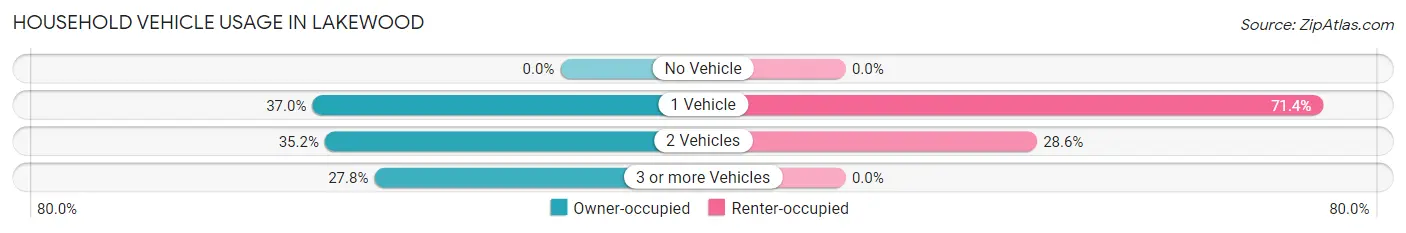
| Vehicles per Household | Owner-occupied | Renter-occupied |
| No Vehicle | 0 (0.0%) | 0 (0.0%) |
| 1 Vehicle | 356 (37.0%) | 385 (71.4%) |
| 2 Vehicles | 338 (35.2%) | 154 (28.6%) |
| 3 or more Vehicles | 267 (27.8%) | 0 (0.0%) |
| Total | 961 (100.0%) | 539 (100.0%) |
Real Estate & Mortgages in Lakewood
Real Estate and Mortgage Overview in Lakewood
| Characteristic | Without Mortgage | With Mortgage |
| Housing Units | 473 | 488 |
| Median Property Value | $164,000 | $318,800 |
| Median Household Income | $84,539 | $102 |
| Monthly Housing Costs | $509 | $0 |
| Real Estate Taxes | $846 | $57 |
Property Value by Mortgage Status in Lakewood
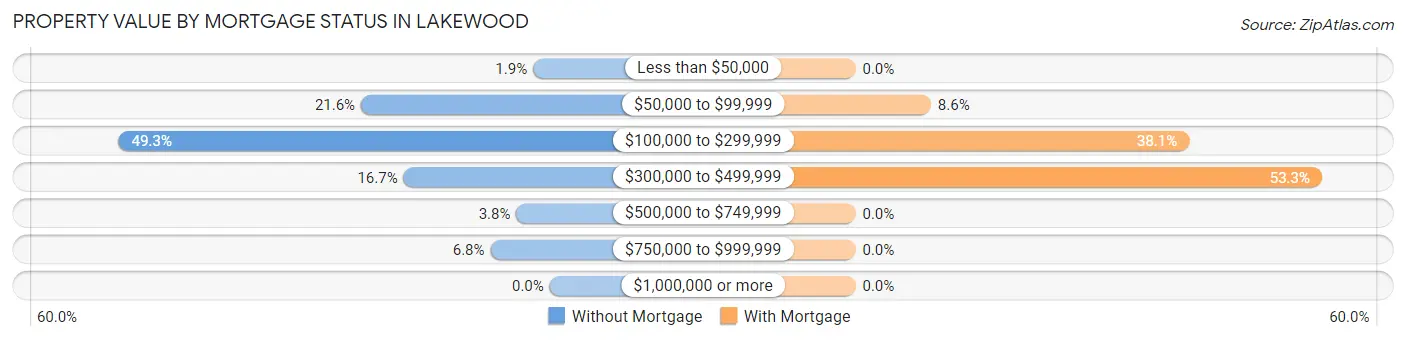
| Property Value | Without Mortgage | With Mortgage |
| Less than $50,000 | 9 (1.9%) | 0 (0.0%) |
| $50,000 to $99,999 | 102 (21.6%) | 42 (8.6%) |
| $100,000 to $299,999 | 233 (49.3%) | 186 (38.1%) |
| $300,000 to $499,999 | 79 (16.7%) | 260 (53.3%) |
| $500,000 to $749,999 | 18 (3.8%) | 0 (0.0%) |
| $750,000 to $999,999 | 32 (6.8%) | 0 (0.0%) |
| $1,000,000 or more | 0 (0.0%) | 0 (0.0%) |
| Total | 473 (100.0%) | 488 (100.0%) |
Household Income by Mortgage Status in Lakewood
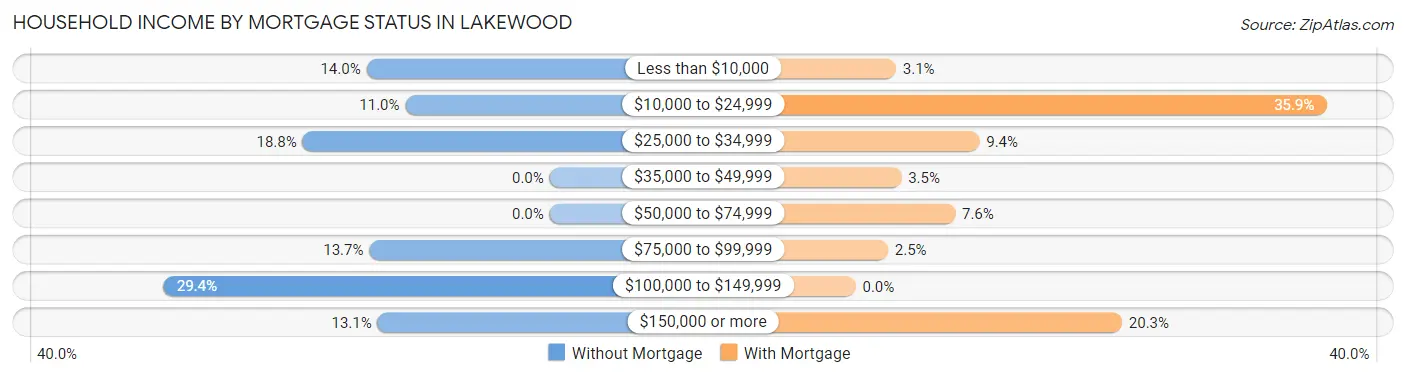
| Household Income | Without Mortgage | With Mortgage |
| Less than $10,000 | 66 (14.0%) | 15 (3.1%) |
| $10,000 to $24,999 | 52 (11.0%) | 175 (35.9%) |
| $25,000 to $34,999 | 89 (18.8%) | 46 (9.4%) |
| $35,000 to $49,999 | 0 (0.0%) | 17 (3.5%) |
| $50,000 to $74,999 | 0 (0.0%) | 37 (7.6%) |
| $75,000 to $99,999 | 65 (13.7%) | 12 (2.5%) |
| $100,000 to $149,999 | 139 (29.4%) | 0 (0.0%) |
| $150,000 or more | 62 (13.1%) | 99 (20.3%) |
| Total | 473 (100.0%) | 488 (100.0%) |
Property Value to Household Income Ratio in Lakewood
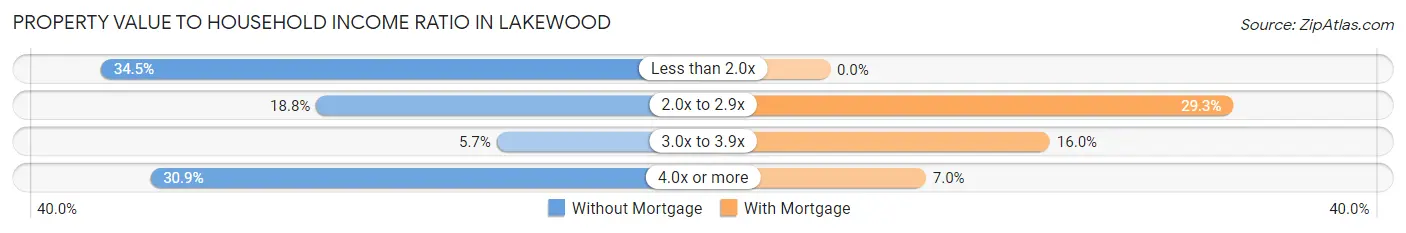
| Value-to-Income Ratio | Without Mortgage | With Mortgage |
| Less than 2.0x | 163 (34.5%) | 0 (0.0%) |
| 2.0x to 2.9x | 89 (18.8%) | 143 (29.3%) |
| 3.0x to 3.9x | 27 (5.7%) | 78 (16.0%) |
| 4.0x or more | 146 (30.9%) | 34 (7.0%) |
| Total | 473 (100.0%) | 488 (100.0%) |
Real Estate Taxes by Mortgage Status in Lakewood
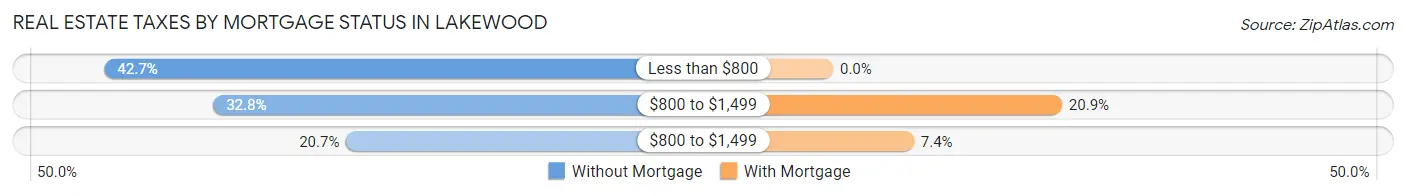
| Property Taxes | Without Mortgage | With Mortgage |
| Less than $800 | 202 (42.7%) | 0 (0.0%) |
| $800 to $1,499 | 155 (32.8%) | 102 (20.9%) |
| $800 to $1,499 | 98 (20.7%) | 36 (7.4%) |
| Total | 473 (100.0%) | 488 (100.0%) |
Health & Disability in Lakewood
Health Insurance Coverage by Age in Lakewood
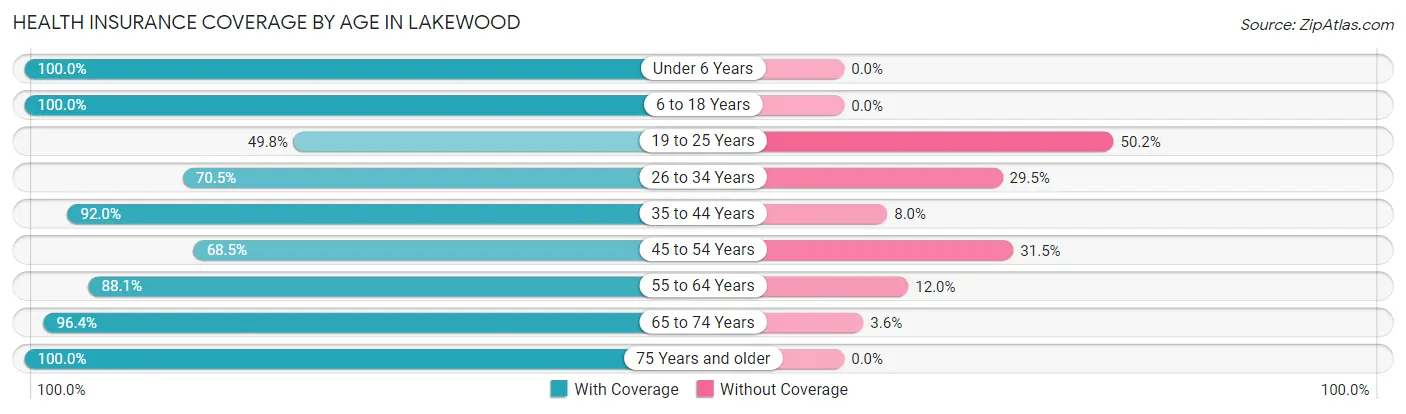
| Age Bracket | With Coverage | Without Coverage |
| Under 6 Years | 29 (100.0%) | 0 (0.0%) |
| 6 to 18 Years | 290 (100.0%) | 0 (0.0%) |
| 19 to 25 Years | 120 (49.8%) | 121 (50.2%) |
| 26 to 34 Years | 346 (70.5%) | 145 (29.5%) |
| 35 to 44 Years | 413 (92.0%) | 36 (8.0%) |
| 45 to 54 Years | 191 (68.5%) | 88 (31.5%) |
| 55 to 64 Years | 604 (88.0%) | 82 (11.9%) |
| 65 to 74 Years | 487 (96.4%) | 18 (3.6%) |
| 75 Years and older | 165 (100.0%) | 0 (0.0%) |
| Total | 2,645 (84.4%) | 490 (15.6%) |
Health Insurance Coverage by Citizenship Status in Lakewood
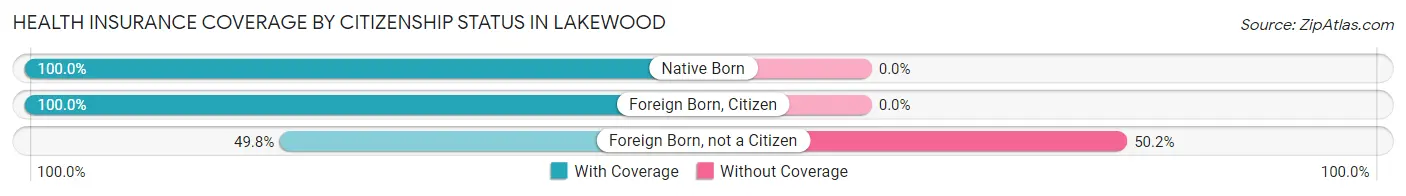
| Citizenship Status | With Coverage | Without Coverage |
| Native Born | 29 (100.0%) | 0 (0.0%) |
| Foreign Born, Citizen | 290 (100.0%) | 0 (0.0%) |
| Foreign Born, not a Citizen | 120 (49.8%) | 121 (50.2%) |
Health Insurance Coverage by Household Income in Lakewood
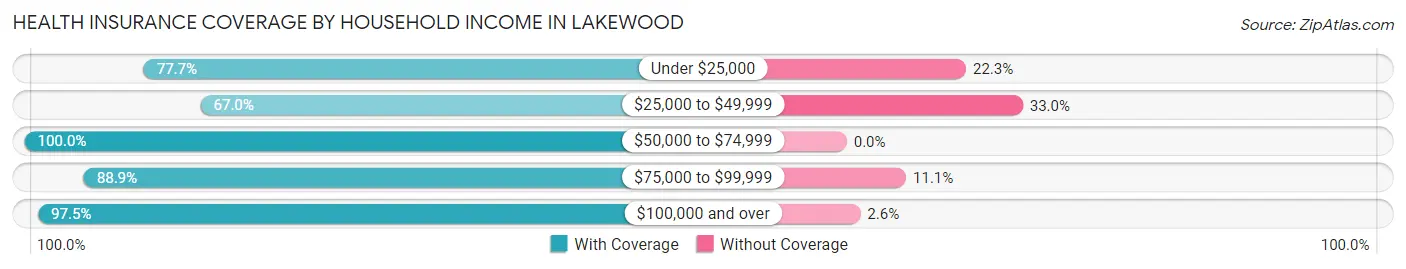
| Household Income | With Coverage | Without Coverage |
| Under $25,000 | 292 (77.7%) | 84 (22.3%) |
| $25,000 to $49,999 | 693 (67.0%) | 341 (33.0%) |
| $50,000 to $74,999 | 384 (100.0%) | 0 (0.0%) |
| $75,000 to $99,999 | 320 (88.9%) | 40 (11.1%) |
| $100,000 and over | 956 (97.5%) | 25 (2.5%) |
Public vs Private Health Insurance Coverage by Age in Lakewood
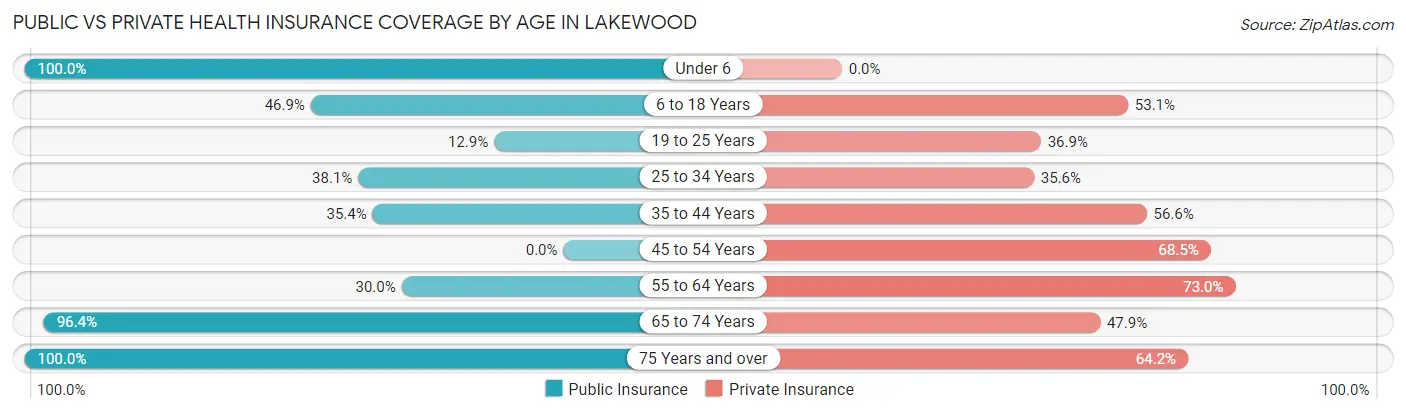
| Age Bracket | Public Insurance | Private Insurance |
| Under 6 | 29 (100.0%) | 0 (0.0%) |
| 6 to 18 Years | 136 (46.9%) | 154 (53.1%) |
| 19 to 25 Years | 31 (12.9%) | 89 (36.9%) |
| 25 to 34 Years | 187 (38.1%) | 175 (35.6%) |
| 35 to 44 Years | 159 (35.4%) | 254 (56.6%) |
| 45 to 54 Years | 0 (0.0%) | 191 (68.5%) |
| 55 to 64 Years | 206 (30.0%) | 501 (73.0%) |
| 65 to 74 Years | 487 (96.4%) | 242 (47.9%) |
| 75 Years and over | 165 (100.0%) | 106 (64.2%) |
| Total | 1,400 (44.7%) | 1,712 (54.6%) |
Disability Status by Sex by Age in Lakewood
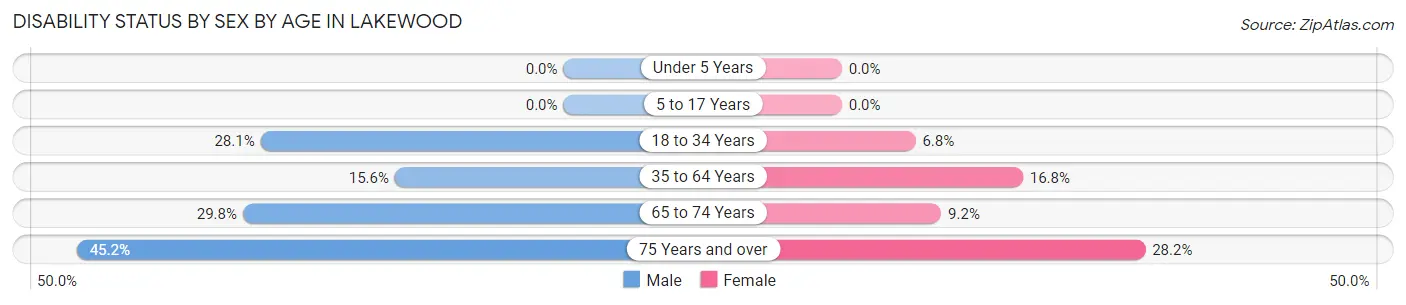
| Age Bracket | Male | Female |
| Under 5 Years | 0 (0.0%) | 0 (0.0%) |
| 5 to 17 Years | 0 (0.0%) | 0 (0.0%) |
| 18 to 34 Years | 140 (28.1%) | 16 (6.8%) |
| 35 to 64 Years | 89 (15.6%) | 142 (16.8%) |
| 65 to 74 Years | 47 (29.7%) | 32 (9.2%) |
| 75 Years and over | 28 (45.2%) | 29 (28.2%) |
Disability Class by Sex by Age in Lakewood
Disability Class: Hearing Difficulty
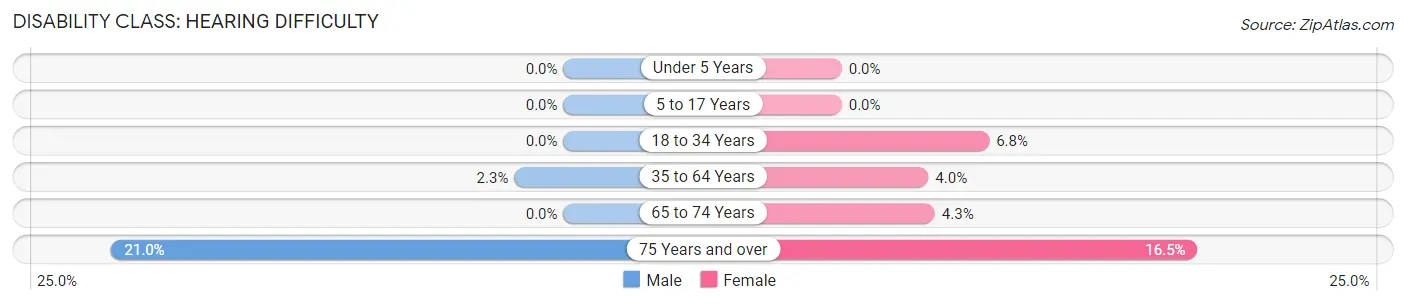
| Age Bracket | Male | Female |
| Under 5 Years | 0 (0.0%) | 0 (0.0%) |
| 5 to 17 Years | 0 (0.0%) | 0 (0.0%) |
| 18 to 34 Years | 0 (0.0%) | 16 (6.8%) |
| 35 to 64 Years | 13 (2.3%) | 34 (4.0%) |
| 65 to 74 Years | 0 (0.0%) | 15 (4.3%) |
| 75 Years and over | 13 (21.0%) | 17 (16.5%) |
Disability Class: Vision Difficulty
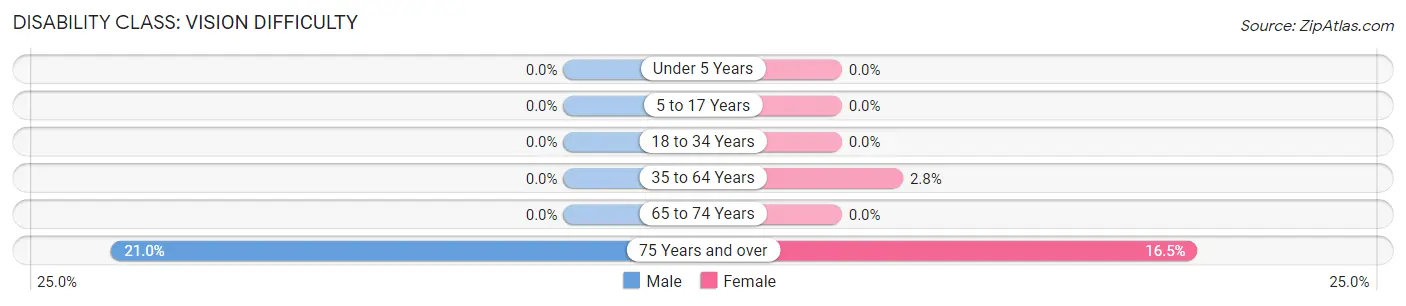
| Age Bracket | Male | Female |
| Under 5 Years | 0 (0.0%) | 0 (0.0%) |
| 5 to 17 Years | 0 (0.0%) | 0 (0.0%) |
| 18 to 34 Years | 0 (0.0%) | 0 (0.0%) |
| 35 to 64 Years | 0 (0.0%) | 24 (2.8%) |
| 65 to 74 Years | 0 (0.0%) | 0 (0.0%) |
| 75 Years and over | 13 (21.0%) | 17 (16.5%) |
Disability Class: Cognitive Difficulty
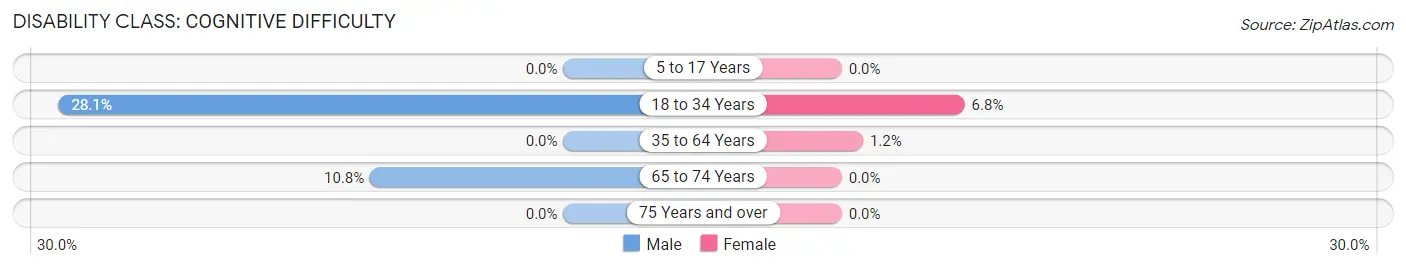
| Age Bracket | Male | Female |
| 5 to 17 Years | 0 (0.0%) | 0 (0.0%) |
| 18 to 34 Years | 140 (28.1%) | 16 (6.8%) |
| 35 to 64 Years | 0 (0.0%) | 10 (1.2%) |
| 65 to 74 Years | 17 (10.8%) | 0 (0.0%) |
| 75 Years and over | 0 (0.0%) | 0 (0.0%) |
Disability Class: Ambulatory Difficulty
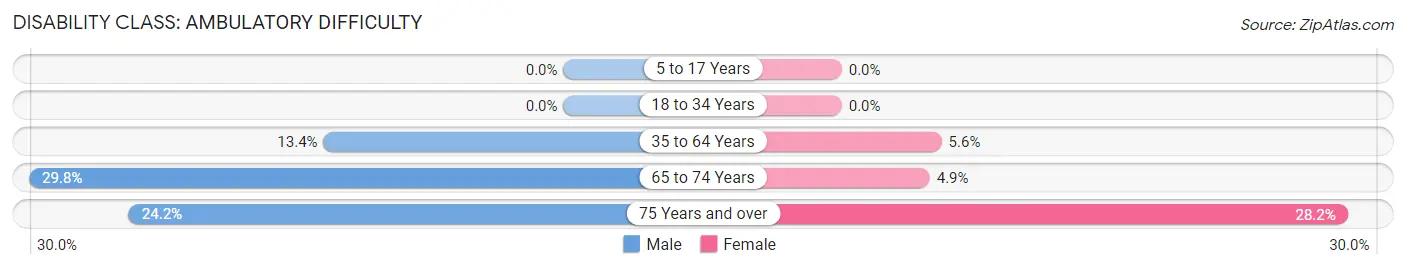
| Age Bracket | Male | Female |
| 5 to 17 Years | 0 (0.0%) | 0 (0.0%) |
| 18 to 34 Years | 0 (0.0%) | 0 (0.0%) |
| 35 to 64 Years | 76 (13.4%) | 47 (5.6%) |
| 65 to 74 Years | 47 (29.7%) | 17 (4.9%) |
| 75 Years and over | 15 (24.2%) | 29 (28.2%) |
Disability Class: Self-Care Difficulty
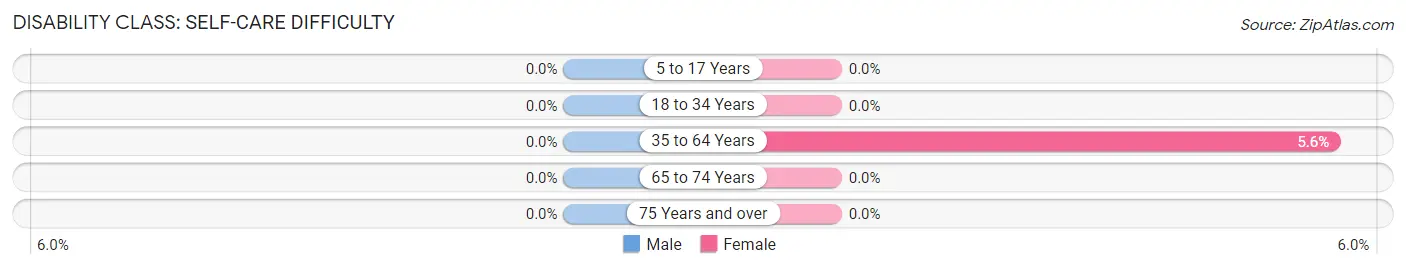
| Age Bracket | Male | Female |
| 5 to 17 Years | 0 (0.0%) | 0 (0.0%) |
| 18 to 34 Years | 0 (0.0%) | 0 (0.0%) |
| 35 to 64 Years | 0 (0.0%) | 47 (5.6%) |
| 65 to 74 Years | 0 (0.0%) | 0 (0.0%) |
| 75 Years and over | 0 (0.0%) | 0 (0.0%) |
Technology Access in Lakewood
Computing Device Access in Lakewood
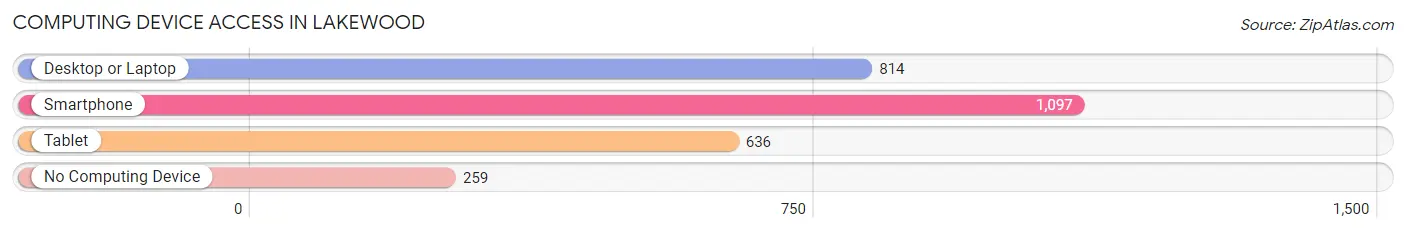
| Device Type | # Households | % Households |
| Desktop or Laptop | 814 | 54.3% |
| Smartphone | 1,097 | 73.1% |
| Tablet | 636 | 42.4% |
| No Computing Device | 259 | 17.3% |
| Total | 1,500 | 100.0% |
Internet Access in Lakewood
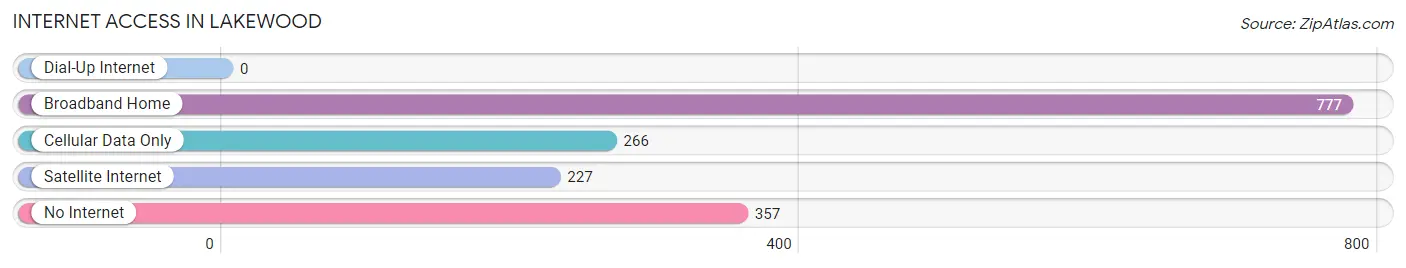
| Internet Type | # Households | % Households |
| Dial-Up Internet | 0 | 0.0% |
| Broadband Home | 777 | 51.8% |
| Cellular Data Only | 266 | 17.7% |
| Satellite Internet | 227 | 15.1% |
| No Internet | 357 | 23.8% |
| Total | 1,500 | 100.0% |
Lakewood Summary
Lakewood is a small town located in the state of South Carolina, United States. It is situated in the county of Berkeley, and is part of the Charleston-North Charleston-Summerville Metropolitan Statistical Area. The town has a population of approximately 1,000 people, and is located about 20 miles northwest of Charleston.
History
The town of Lakewood was founded in 1891 by a group of settlers from the nearby town of Summerville. The settlers were looking for a place to build a new community, and they chose the area around Lakewood because of its natural beauty and abundance of resources. The town was named after the nearby lake, which was named after the nearby town of Summerville.
The town grew slowly over the years, and by the early 1900s, it had become a popular destination for tourists and vacationers. The town was known for its beautiful scenery and its abundance of outdoor activities, such as fishing, hunting, and camping.
In the 1950s, the town began to experience a period of growth and development. The town was incorporated in 1956, and the population began to grow rapidly. By the 1970s, the town had become a popular destination for retirees and vacationers.
Geography
Lakewood is located in the southeastern part of South Carolina, in Berkeley County. The town is situated on the banks of the Ashley River, and is surrounded by the Francis Marion National Forest. The town is located about 20 miles northwest of Charleston, and is about an hour and a half drive from Myrtle Beach.
The town has a total area of 1.2 square miles, all of which is land. The town is located at an elevation of about 30 feet above sea level. The climate in Lakewood is humid subtropical, with hot, humid summers and mild winters.
Economy
The economy of Lakewood is largely based on tourism and retirement. The town is a popular destination for retirees and vacationers, and there are several resorts and hotels in the area. The town also has a number of restaurants, shops, and other businesses that cater to tourists and visitors.
The town also has a number of manufacturing and industrial businesses, including a paper mill and a lumber mill. The town is also home to a number of small businesses, such as auto repair shops, hardware stores, and other retail establishments.
Demographics
As of the 2010 census, the population of Lakewood was 1,000 people. The racial makeup of the town was 94.2% White, 2.2% African American, 0.2% Native American, 0.8% Asian, 0.2% from other races, and 2.4% from two or more races. Hispanic or Latino of any race were 1.2% of the population.
The median income for a household in the town was $37,500, and the median income for a family was $45,000. The per capita income for the town was $19,000. About 10.2% of families and 12.2% of the population were below the poverty line, including 16.7% of those under age 18 and 8.3% of those age 65 or over.
Common Questions
What is Per Capita Income in Lakewood?
Per Capita income in Lakewood is $35,745.
What is the Median Family Income in Lakewood?
Median Family Income in Lakewood is $69,514.
What is the Median Household income in Lakewood?
Median Household Income in Lakewood is $47,290.
What is Income or Wage Gap in Lakewood?
Income or Wage Gap in Lakewood is 7.7%.
Women in Lakewood earn 92.3 cents for every dollar earned by a man.
What is Inequality or Gini Index in Lakewood?
Inequality or Gini Index in Lakewood is 0.50.
What is the Total Population of Lakewood?
Total Population of Lakewood is 3,135.
What is the Total Male Population of Lakewood?
Total Male Population of Lakewood is 1,394.
What is the Total Female Population of Lakewood?
Total Female Population of Lakewood is 1,741.
What is the Ratio of Males per 100 Females in Lakewood?
There are 80.07 Males per 100 Females in Lakewood.
What is the Ratio of Females per 100 Males in Lakewood?
There are 124.89 Females per 100 Males in Lakewood.
What is the Median Population Age in Lakewood?
Median Population Age in Lakewood is 46.7 Years.
What is the Average Family Size in Lakewood
Average Family Size in Lakewood is 2.7 People.
What is the Average Household Size in Lakewood
Average Household Size in Lakewood is 2.1 People.
How Large is the Labor Force in Lakewood?
There are 1,825 People in the Labor Forcein in Lakewood.
What is the Percentage of People in the Labor Force in Lakewood?
64.8% of People are in the Labor Force in Lakewood.
What is the Unemployment Rate in Lakewood?
Unemployment Rate in Lakewood is 8.6%.