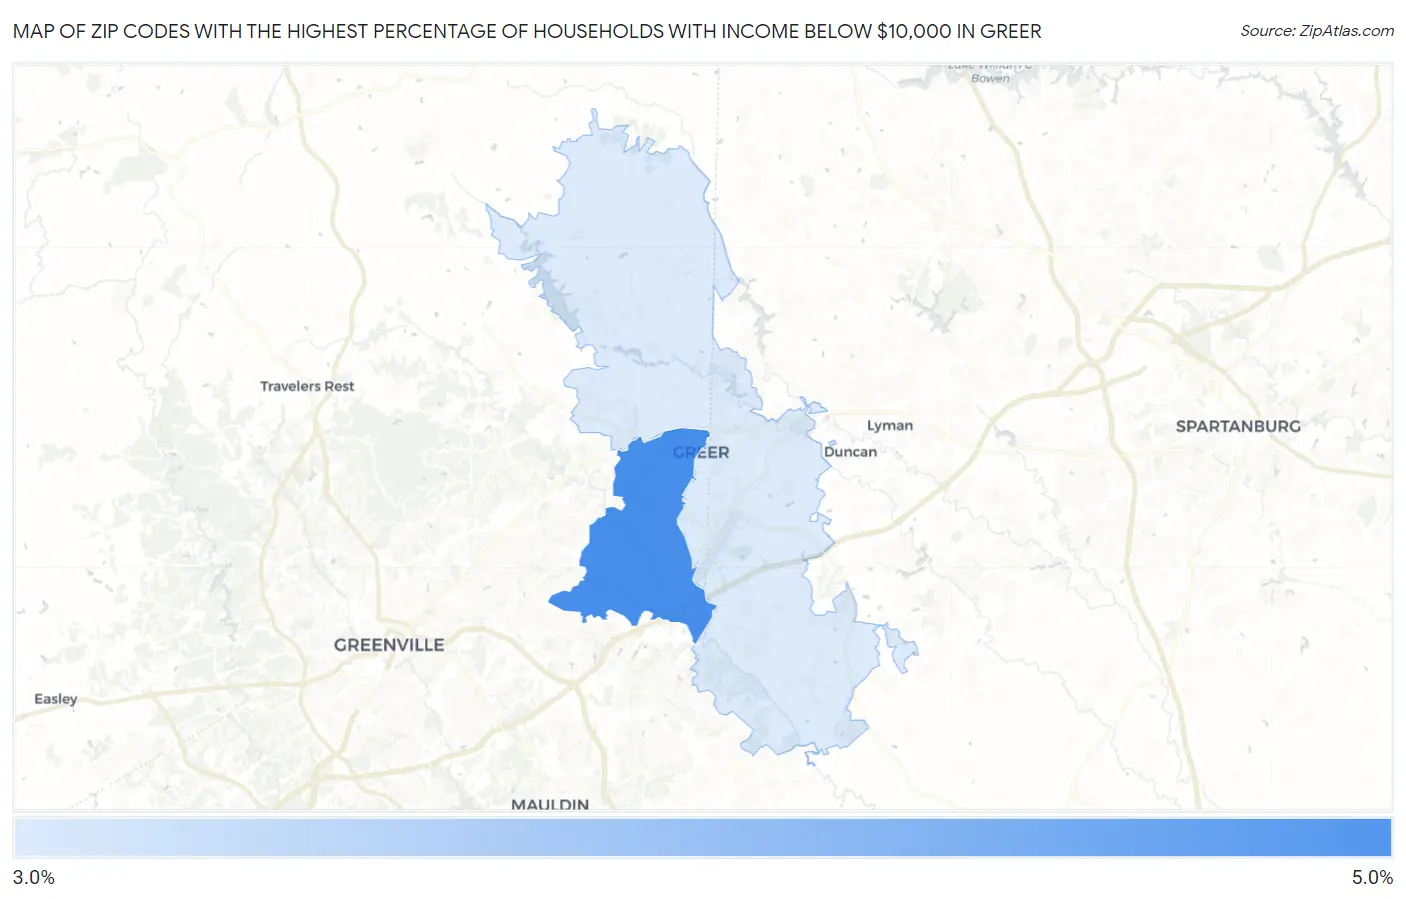
Zip Codes with the Highest Percentage of Households with Income Below $10,000 in Greer, SC
RELATED REPORTS & OPTIONS
Household Income | $0-10k
Greer
Compare Zip Codes
Map of Zip Codes with the Highest Percentage of Households with Income Below $10,000 in Greer
3.5%
4.3%
Zip Codes with the Highest Percentage of Households with Income Below $10,000 in Greer, SC
| Zip Code | Households with Income < $10k | vs State | vs National | |
| 1. | 29650 | 4.3% | 6.1%(-1.80)#273 | 4.9%(-0.600)#14,058 |
| 2. | 29651 | 3.5% | 6.1%(-2.60)#307 | 4.9%(-1.40)#17,190 |
1
Common Questions
What are the Top Zip Codes with the Highest Percentage of Households with Income Below $10,000 in Greer, SC?
Top Zip Codes with the Highest Percentage of Households with Income Below $10,000 in Greer, SC are:
What zip code has the Highest Percentage of Households with Income Below $10,000 in Greer, SC?
29650 has the Highest Percentage of Households with Income Below $10,000 in Greer, SC with 4.3%.
What is the Percentage of Households with Income Below $10,000 in Greer, SC?
Percentage of Households with Income Below $10,000 in Greer is 5.2%.
What is the Percentage of Households with Income Below $10,000 in South Carolina?
Percentage of Households with Income Below $10,000 in South Carolina is 6.1%.
What is the Percentage of Households with Income Below $10,000 in the United States?
Percentage of Households with Income Below $10,000 in the United States is 4.9%.