Bamberg, SC Map & Demographics
Bamberg Map
Bamberg Overview
$20,707
PER CAPITA INCOME
$58,838
AVG FAMILY INCOME
$27,021
AVG HOUSEHOLD INCOME
89.9%
WAGE / INCOME GAP [ % ]
10.1¢/ $1
WAGE / INCOME GAP [ $ ]
0.49
INEQUALITY / GINI INDEX
3,074
TOTAL POPULATION
1,430
MALE POPULATION
1,644
FEMALE POPULATION
86.98
MALES / 100 FEMALES
114.97
FEMALES / 100 MALES
47.7
MEDIAN AGE
3.5
AVG FAMILY SIZE
2.2
AVG HOUSEHOLD SIZE
1,163
LABOR FORCE [ PEOPLE ]
44.4%
PERCENT IN LABOR FORCE
11.1%
UNEMPLOYMENT RATE
Bamberg Zip Codes
Bamberg Area Codes
Income in Bamberg
Income Overview in Bamberg
Per Capita Income in Bamberg is $20,707, while median incomes of families and households are $58,838 and $27,021 respectively.
| Characteristic | Number | Measure |
| Per Capita Income | 3,074 | $20,707 |
| Median Family Income | 539 | $58,838 |
| Mean Family Income | 539 | $67,045 |
| Median Household Income | 1,214 | $27,021 |
| Mean Household Income | 1,214 | $48,125 |
| Income Deficit | 539 | $0 |
| Wage / Income Gap (%) | 3,074 | 89.91% |
| Wage / Income Gap ($) | 3,074 | 10.09¢ per $1 |
| Gini / Inequality Index | 3,074 | 0.49 |
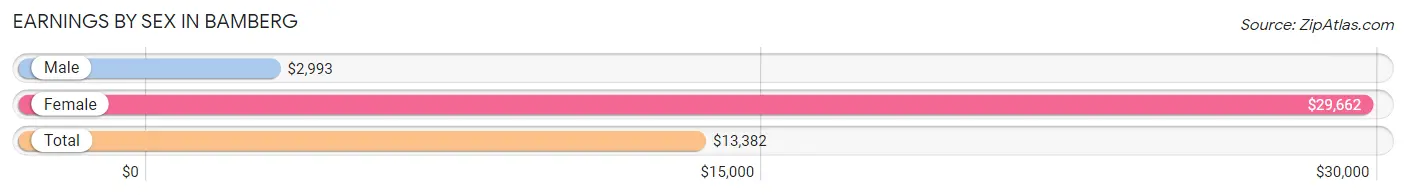
Earnings by Sex in Bamberg
Average Earnings in Bamberg are $13,382, $2,993 for men and $29,662 for women, a difference of 89.9%.
| Sex | Number | Average Earnings |
| Male | 490 (42.9%) | $2,993 |
| Female | 652 (57.1%) | $29,662 |
| Total | 1,142 (100.0%) | $13,382 |
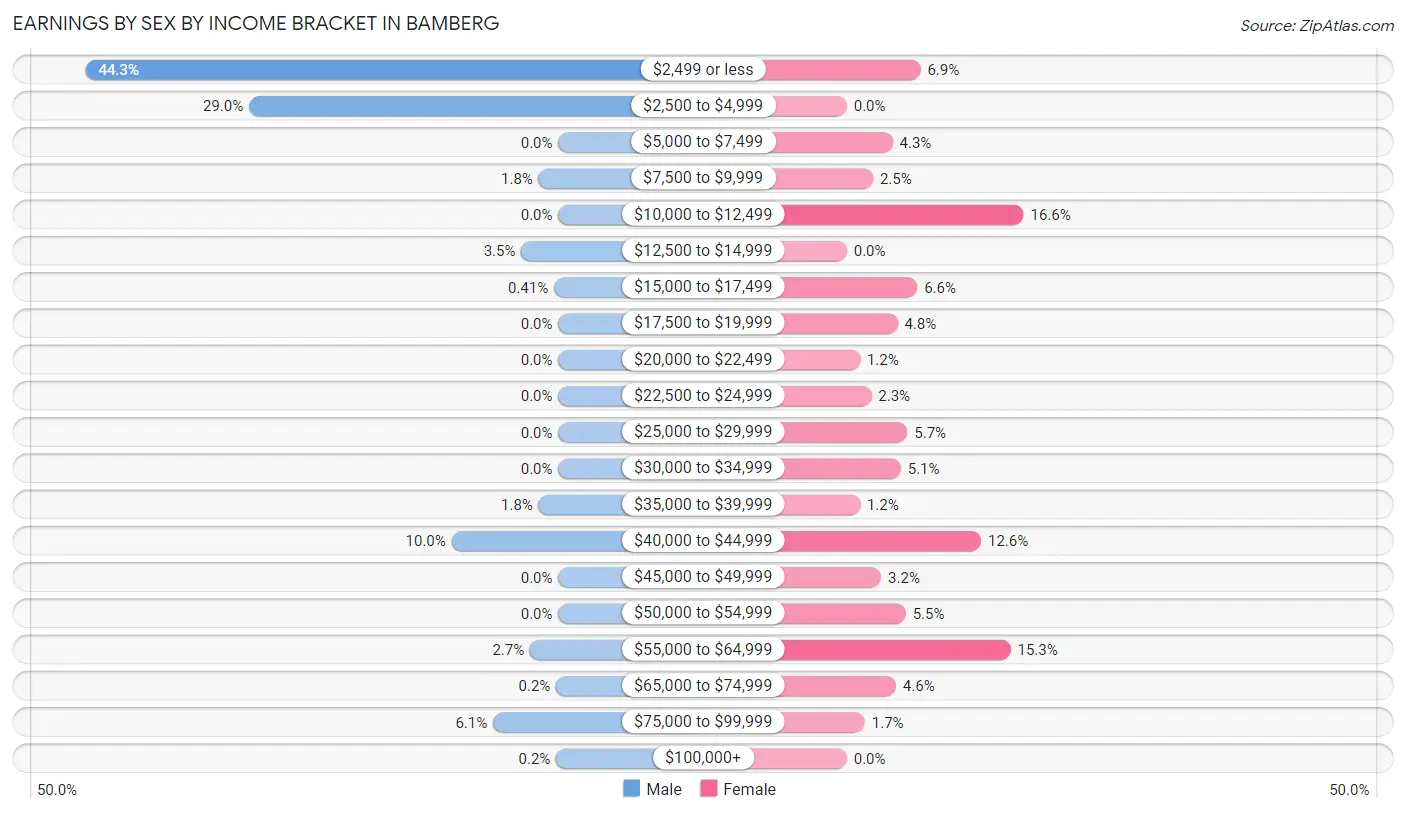
Earnings by Sex by Income Bracket in Bamberg
The most common earnings brackets in Bamberg are $2,499 or less for men (217 | 44.3%) and $10,000 to $12,499 for women (108 | 16.6%).
| Income | Male | Female |
| $2,499 or less | 217 (44.3%) | 45 (6.9%) |
| $2,500 to $4,999 | 142 (29.0%) | 0 (0.0%) |
| $5,000 to $7,499 | 0 (0.0%) | 28 (4.3%) |
| $7,500 to $9,999 | 9 (1.8%) | 16 (2.5%) |
| $10,000 to $12,499 | 0 (0.0%) | 108 (16.6%) |
| $12,500 to $14,999 | 17 (3.5%) | 0 (0.0%) |
| $15,000 to $17,499 | 2 (0.4%) | 43 (6.6%) |
| $17,500 to $19,999 | 0 (0.0%) | 31 (4.8%) |
| $20,000 to $22,499 | 0 (0.0%) | 8 (1.2%) |
| $22,500 to $24,999 | 0 (0.0%) | 15 (2.3%) |
| $25,000 to $29,999 | 0 (0.0%) | 37 (5.7%) |
| $30,000 to $34,999 | 0 (0.0%) | 33 (5.1%) |
| $35,000 to $39,999 | 9 (1.8%) | 8 (1.2%) |
| $40,000 to $44,999 | 49 (10.0%) | 82 (12.6%) |
| $45,000 to $49,999 | 0 (0.0%) | 21 (3.2%) |
| $50,000 to $54,999 | 0 (0.0%) | 36 (5.5%) |
| $55,000 to $64,999 | 13 (2.6%) | 100 (15.3%) |
| $65,000 to $74,999 | 1 (0.2%) | 30 (4.6%) |
| $75,000 to $99,999 | 30 (6.1%) | 11 (1.7%) |
| $100,000+ | 1 (0.2%) | 0 (0.0%) |
| Total | 490 (100.0%) | 652 (100.0%) |
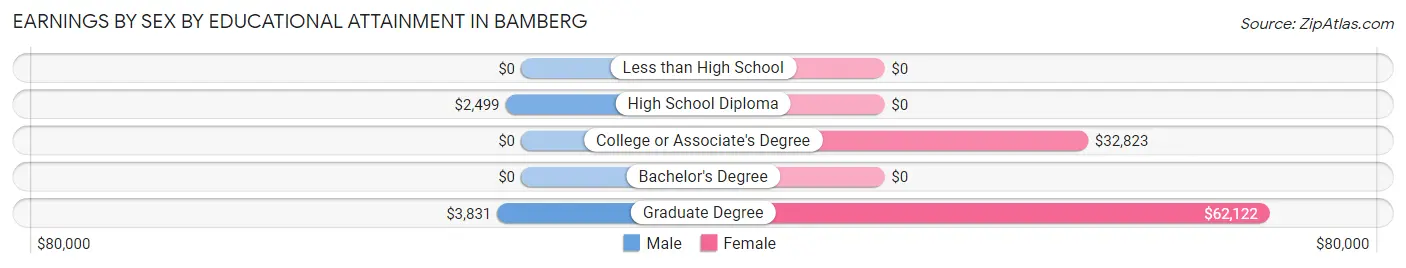
Earnings by Sex by Educational Attainment in Bamberg
Average earnings in Bamberg are $4,158 for men and $32,702 for women, a difference of 87.3%. Men with an educational attainment of graduate degree enjoy the highest average annual earnings of $3,831, while those with high school diploma education earn the least with $2,499. Women with an educational attainment of graduate degree earn the most with the average annual earnings of $62,122, while those with college or associate's degree education have the smallest earnings of $32,823.
| Educational Attainment | Male Income | Female Income |
| Less than High School | - | - |
| High School Diploma | $2,499 | $0 |
| College or Associate's Degree | - | - |
| Bachelor's Degree | - | - |
| Graduate Degree | $3,831 | $62,122 |
| Total | $4,158 | $32,702 |
Family Income in Bamberg
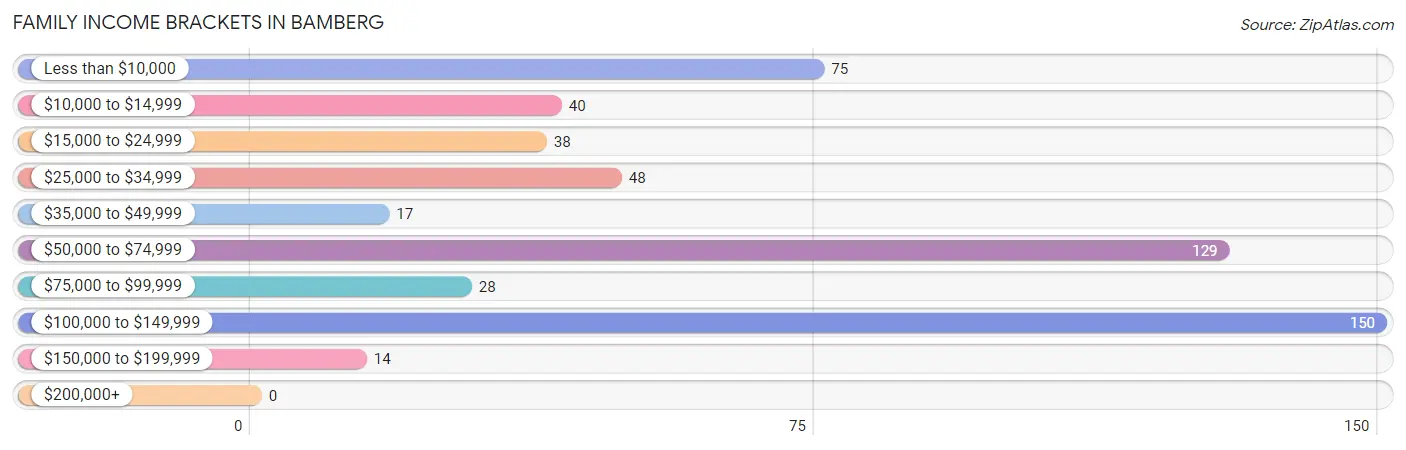
Family Income Brackets in Bamberg
According to the Bamberg family income data, there are 150 families falling into the $100,000 to $149,999 income range, which is the most common income bracket and makes up 27.8% of all families.
| Income Bracket | # Families | % Families |
| Less than $10,000 | 75 | 13.9% |
| $10,000 to $14,999 | 40 | 7.4% |
| $15,000 to $24,999 | 38 | 7.1% |
| $25,000 to $34,999 | 48 | 8.9% |
| $35,000 to $49,999 | 17 | 3.2% |
| $50,000 to $74,999 | 129 | 23.9% |
| $75,000 to $99,999 | 28 | 5.2% |
| $100,000 to $149,999 | 150 | 27.8% |
| $150,000 to $199,999 | 14 | 2.6% |
| $200,000+ | 0 | 0.0% |
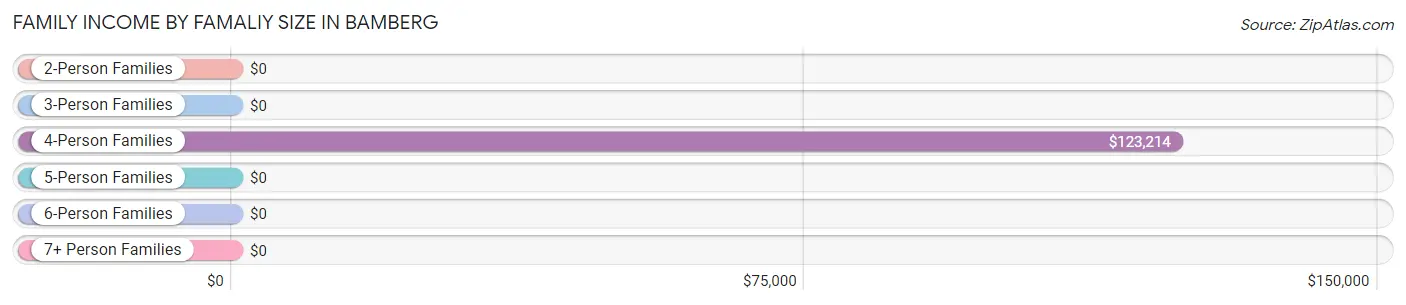
Family Income by Famaliy Size in Bamberg
4-person families (30 | 5.6%) account for the highest median family income in Bamberg with $123,214 per family, while 4-person families (30 | 5.6%) have the highest median income of $30,804 per family member.
| Income Bracket | # Families | Median Income |
| 2-Person Families | 271 (50.3%) | $0 |
| 3-Person Families | 149 (27.6%) | $0 |
| 4-Person Families | 30 (5.6%) | $123,214 |
| 5-Person Families | 66 (12.2%) | $0 |
| 6-Person Families | 23 (4.3%) | $0 |
| 7+ Person Families | 0 (0.0%) | $0 |
| Total | 539 (100.0%) | $58,838 |
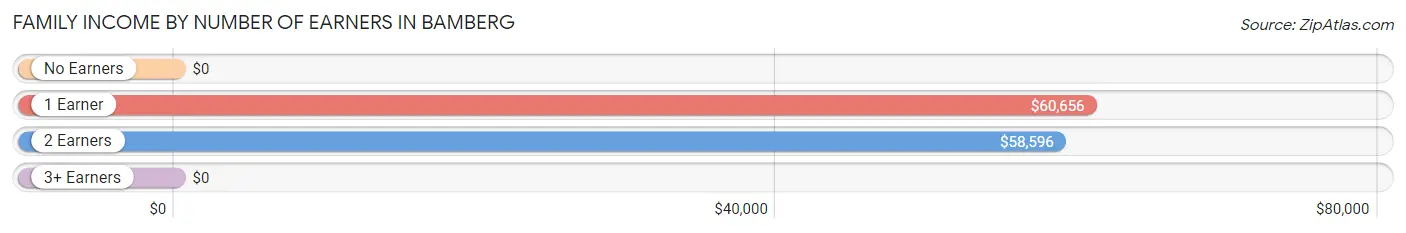
Family Income by Number of Earners in Bamberg
| Number of Earners | # Families | Median Income |
| No Earners | 185 (34.3%) | $0 |
| 1 Earner | 167 (31.0%) | $60,656 |
| 2 Earners | 166 (30.8%) | $58,596 |
| 3+ Earners | 21 (3.9%) | $0 |
| Total | 539 (100.0%) | $58,838 |
Household Income in Bamberg
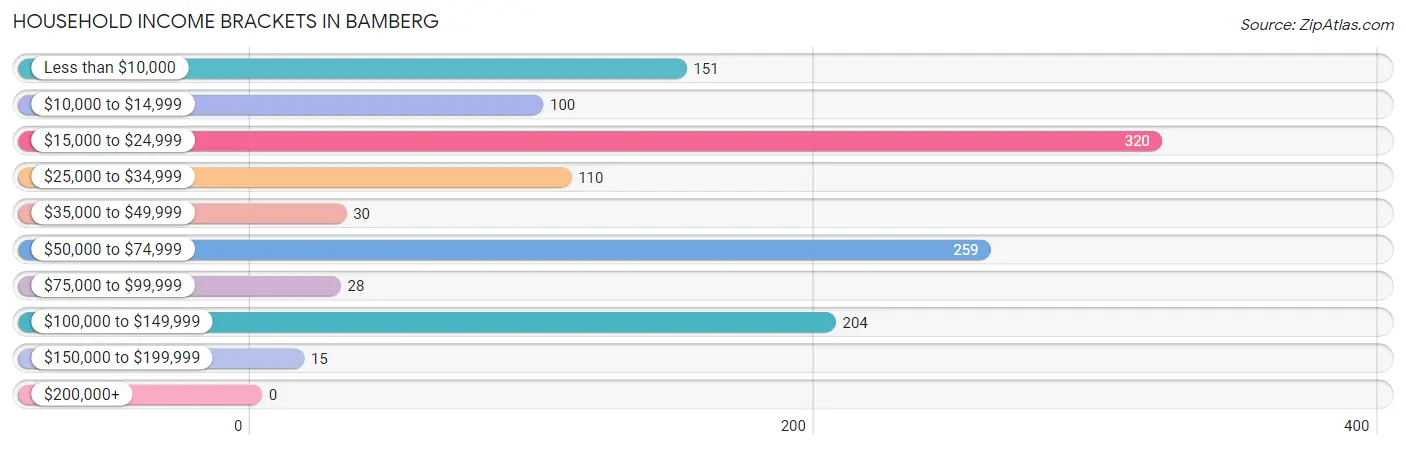
Household Income Brackets in Bamberg
With 320 households falling in the category, the $15,000 to $24,999 income range is the most frequent in Bamberg, accounting for 26.4% of all households.
| Income Bracket | # Households | % Households |
| Less than $10,000 | 151 | 12.4% |
| $10,000 to $14,999 | 100 | 8.2% |
| $15,000 to $24,999 | 320 | 26.4% |
| $25,000 to $34,999 | 110 | 9.1% |
| $35,000 to $49,999 | 30 | 2.5% |
| $50,000 to $74,999 | 259 | 21.3% |
| $75,000 to $99,999 | 28 | 2.3% |
| $100,000 to $149,999 | 204 | 16.8% |
| $150,000 to $199,999 | 15 | 1.2% |
| $200,000+ | 0 | 0.0% |
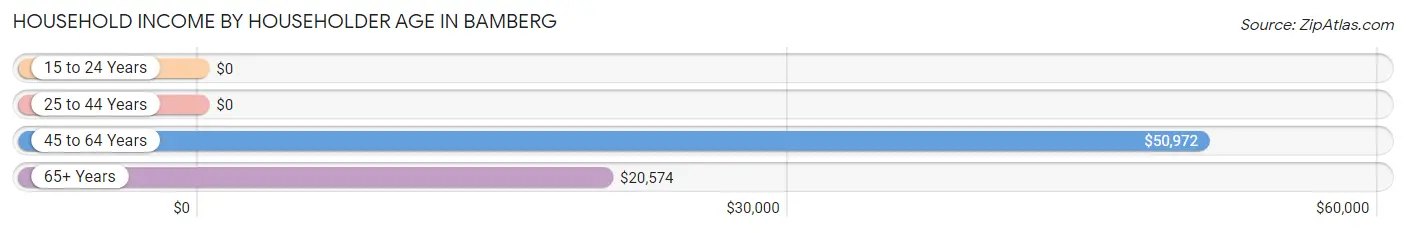
Household Income by Householder Age in Bamberg
The median household income in Bamberg is $27,021, with the highest median household income of $50,972 found in the 45 to 64 years age bracket for the primary householder. A total of 426 households (35.1%) fall into this category. Meanwhile, the 15 to 24 years age bracket for the primary householder has the lowest median household income of $0, with 49 households (4.0%) in this group.
| Income Bracket | # Households | Median Income |
| 15 to 24 Years | 49 (4.0%) | $0 |
| 25 to 44 Years | 150 (12.4%) | $0 |
| 45 to 64 Years | 426 (35.1%) | $50,972 |
| 65+ Years | 589 (48.5%) | $20,574 |
| Total | 1,214 (100.0%) | $27,021 |
Poverty in Bamberg
Income Below Poverty by Sex and Age in Bamberg
With 37.8% poverty level for males and 41.2% for females among the residents of Bamberg, 5 year old males and 5 year old females are the most vulnerable to poverty, with 27 males (100.0%) and 55 females (100.0%) in their respective age groups living below the poverty level.
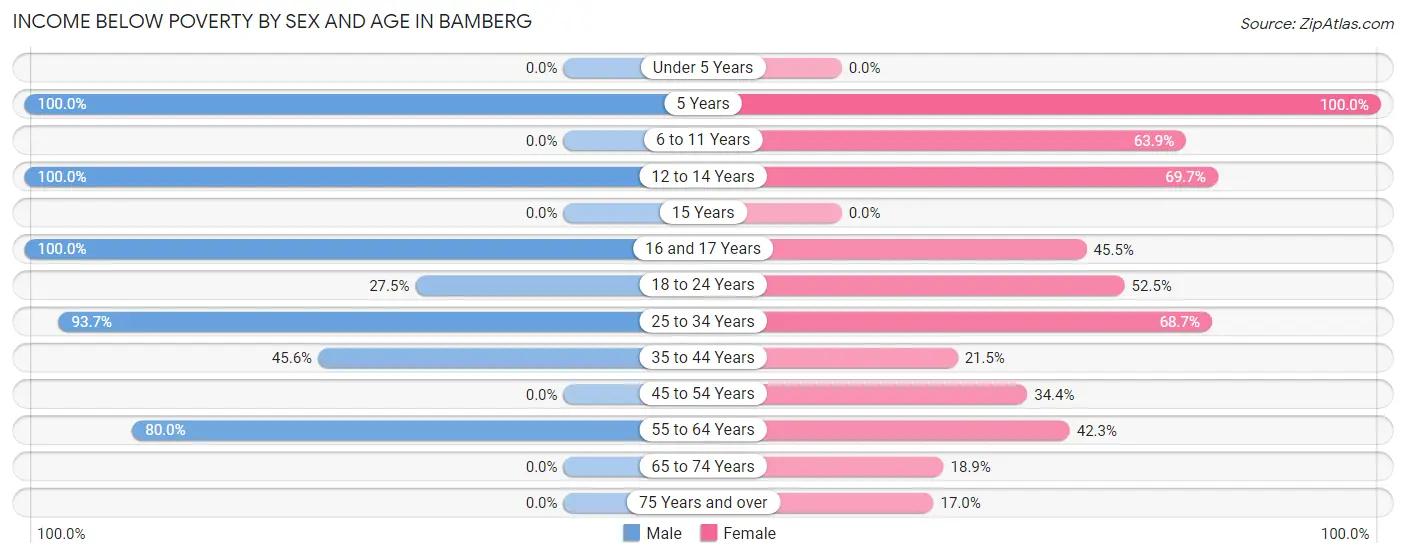
| Age Bracket | Male | Female |
| Under 5 Years | 0 (0.0%) | 0 (0.0%) |
| 5 Years | 27 (100.0%) | 55 (100.0%) |
| 6 to 11 Years | 0 (0.0%) | 92 (63.9%) |
| 12 to 14 Years | 62 (100.0%) | 53 (69.7%) |
| 15 Years | 0 (0.0%) | 0 (0.0%) |
| 16 and 17 Years | 49 (100.0%) | 5 (45.5%) |
| 18 to 24 Years | 94 (27.5%) | 21 (52.5%) |
| 25 to 34 Years | 148 (93.7%) | 138 (68.7%) |
| 35 to 44 Years | 41 (45.6%) | 20 (21.5%) |
| 45 to 54 Years | 0 (0.0%) | 62 (34.4%) |
| 55 to 64 Years | 88 (80.0%) | 135 (42.3%) |
| 65 to 74 Years | 0 (0.0%) | 55 (18.9%) |
| 75 Years and over | 0 (0.0%) | 23 (17.0%) |
| Total | 509 (37.8%) | 659 (41.2%) |
Income Above Poverty by Sex and Age in Bamberg
According to the poverty statistics in Bamberg, males aged under 5 years and females aged under 5 years are the age groups that are most secure financially, with 100.0% of males and 100.0% of females in these age groups living above the poverty line.
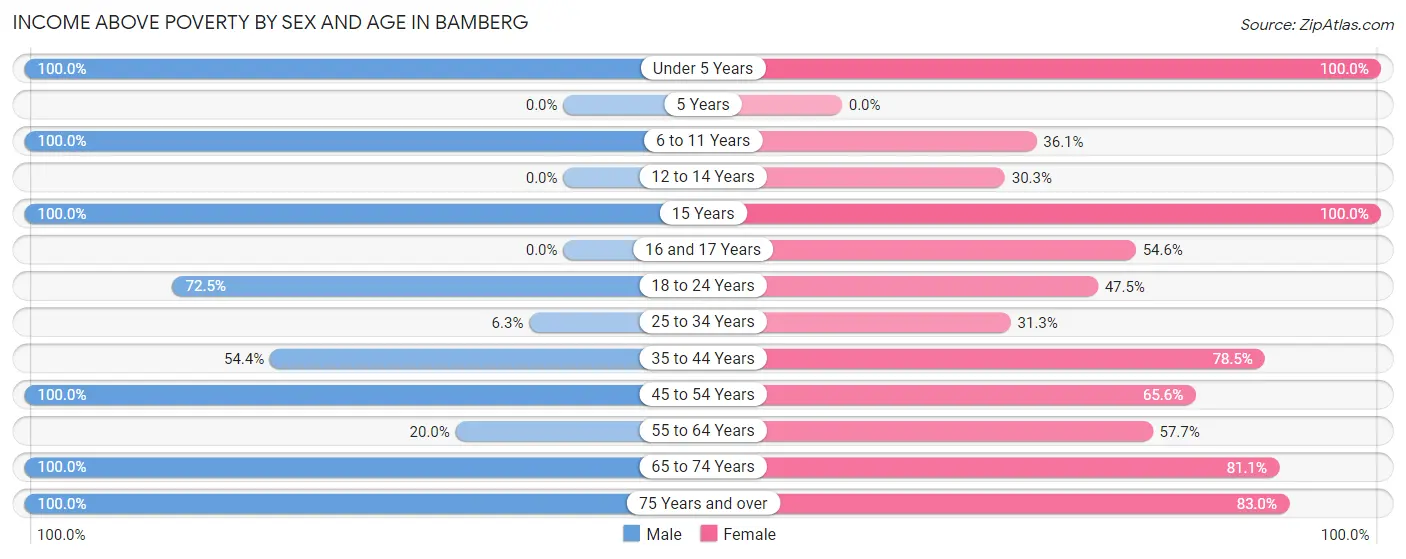
| Age Bracket | Male | Female |
| Under 5 Years | 6 (100.0%) | 17 (100.0%) |
| 5 Years | 0 (0.0%) | 0 (0.0%) |
| 6 to 11 Years | 29 (100.0%) | 52 (36.1%) |
| 12 to 14 Years | 0 (0.0%) | 23 (30.3%) |
| 15 Years | 3 (100.0%) | 36 (100.0%) |
| 16 and 17 Years | 0 (0.0%) | 6 (54.5%) |
| 18 to 24 Years | 248 (72.5%) | 19 (47.5%) |
| 25 to 34 Years | 10 (6.3%) | 63 (31.3%) |
| 35 to 44 Years | 49 (54.4%) | 73 (78.5%) |
| 45 to 54 Years | 37 (100.0%) | 118 (65.6%) |
| 55 to 64 Years | 22 (20.0%) | 184 (57.7%) |
| 65 to 74 Years | 187 (100.0%) | 236 (81.1%) |
| 75 Years and over | 246 (100.0%) | 112 (83.0%) |
| Total | 837 (62.2%) | 939 (58.8%) |
Income Below Poverty Among Married-Couple Families in Bamberg
The poverty statistics for married-couple families in Bamberg show that 19.2% or 42 of the total 219 families live below the poverty line. Families with 3 or 4 children have the highest poverty rate of 33.3%, comprising of 8 families. On the other hand, families with 1 or 2 children have the lowest poverty rate of 0.0%, which includes 0 families.
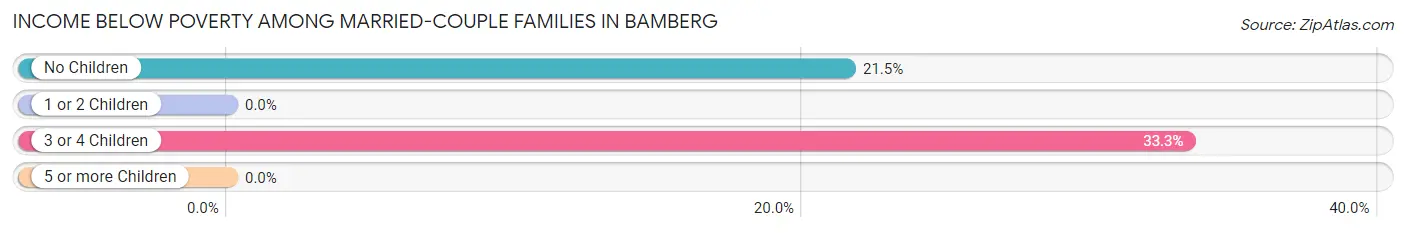
| Children | Above Poverty | Below Poverty |
| No Children | 124 (78.5%) | 34 (21.5%) |
| 1 or 2 Children | 37 (100.0%) | 0 (0.0%) |
| 3 or 4 Children | 16 (66.7%) | 8 (33.3%) |
| 5 or more Children | 0 (0.0%) | 0 (0.0%) |
| Total | 177 (80.8%) | 42 (19.2%) |
Income Below Poverty Among Single-Parent Households in Bamberg
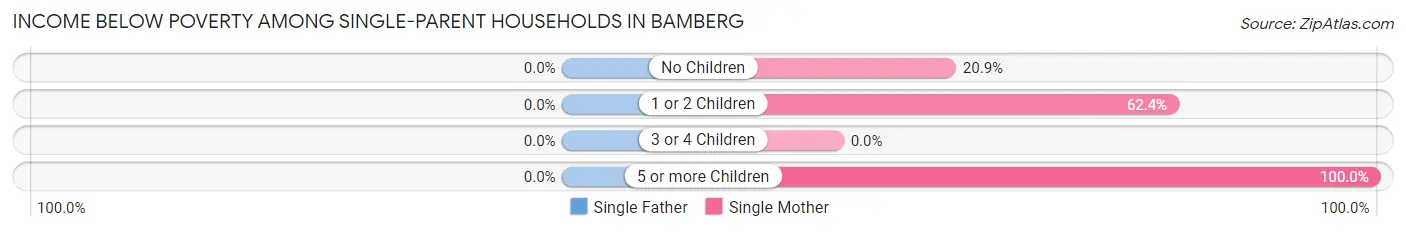
| Children | Single Father | Single Mother |
| No Children | 0 (0.0%) | 23 (20.9%) |
| 1 or 2 Children | 0 (0.0%) | 123 (62.4%) |
| 3 or 4 Children | 0 (0.0%) | 0 (0.0%) |
| 5 or more Children | 0 (0.0%) | 7 (100.0%) |
| Total | 0 (0.0%) | 153 (48.7%) |
Income Below Poverty Among Married-Couple vs Single-Parent Households in Bamberg
The poverty data for Bamberg shows that 42 of the married-couple family households (19.2%) and 153 of the single-parent households (47.8%) are living below the poverty level. Within the married-couple family households, those with 3 or 4 children have the highest poverty rate, with 8 households (33.3%) falling below the poverty line. Among the single-parent households, those with 5 or more children have the highest poverty rate, with 7 household (100.0%) living below poverty.
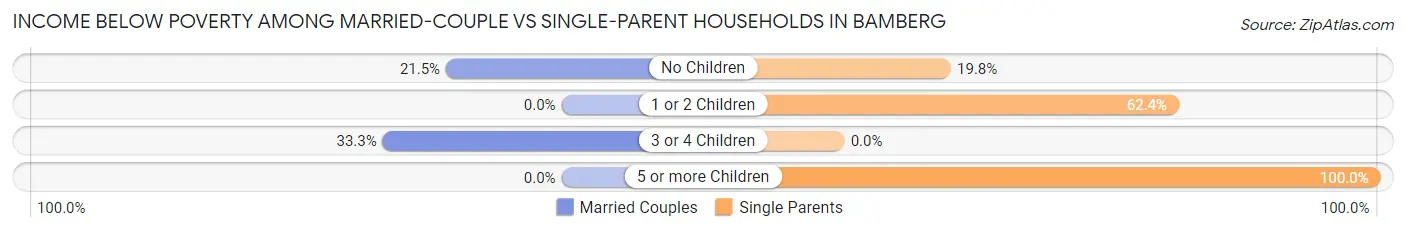
| Children | Married-Couple Families | Single-Parent Households |
| No Children | 34 (21.5%) | 23 (19.8%) |
| 1 or 2 Children | 0 (0.0%) | 123 (62.4%) |
| 3 or 4 Children | 8 (33.3%) | 0 (0.0%) |
| 5 or more Children | 0 (0.0%) | 7 (100.0%) |
| Total | 42 (19.2%) | 153 (47.8%) |
Race in Bamberg
The most populous races in Bamberg are Black / African American (1,959 | 63.7%), White / Caucasian (1,036 | 33.7%), and Hispanic or Latino (45 | 1.5%).
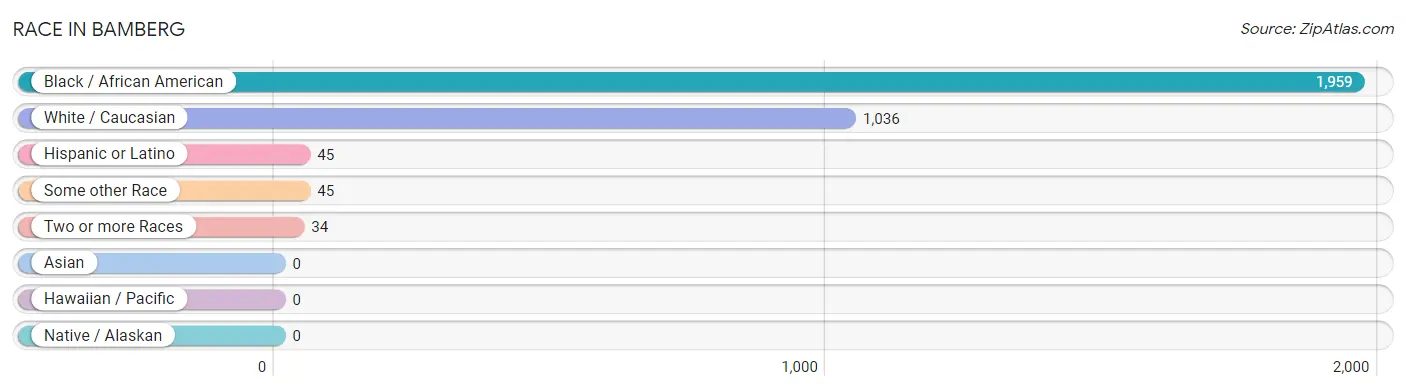
| Race | # Population | % Population |
| Asian | 0 | 0.0% |
| Black / African American | 1,959 | 63.7% |
| Hawaiian / Pacific | 0 | 0.0% |
| Hispanic or Latino | 45 | 1.5% |
| Native / Alaskan | 0 | 0.0% |
| White / Caucasian | 1,036 | 33.7% |
| Two or more Races | 34 | 1.1% |
| Some other Race | 45 | 1.5% |
| Total | 3,074 | 100.0% |
Ancestry in Bamberg
The most populous ancestries reported in Bamberg are American (509 | 16.6%), Mexican (45 | 1.5%), English (24 | 0.8%), German (11 | 0.4%), and Scottish (9 | 0.3%), together accounting for 19.5% of all Bamberg residents.
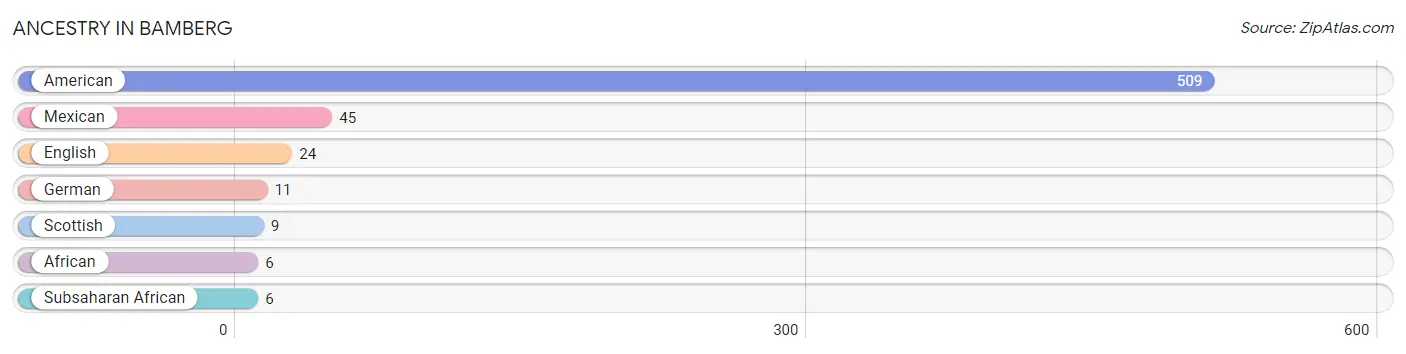
| Ancestry | # Population | % Population |
| African | 6 | 0.2% |
| American | 509 | 16.6% |
| English | 24 | 0.8% |
| German | 11 | 0.4% |
| Mexican | 45 | 1.5% |
| Scottish | 9 | 0.3% |
| Subsaharan African | 6 | 0.2% | View All 7 Rows |
Immigrants in Bamberg
The most numerous immigrant groups reported in Bamberg came from Central America (42 | 1.4%), Latin America (42 | 1.4%), and Mexico (42 | 1.4%), together accounting for 4.1% of all Bamberg residents.
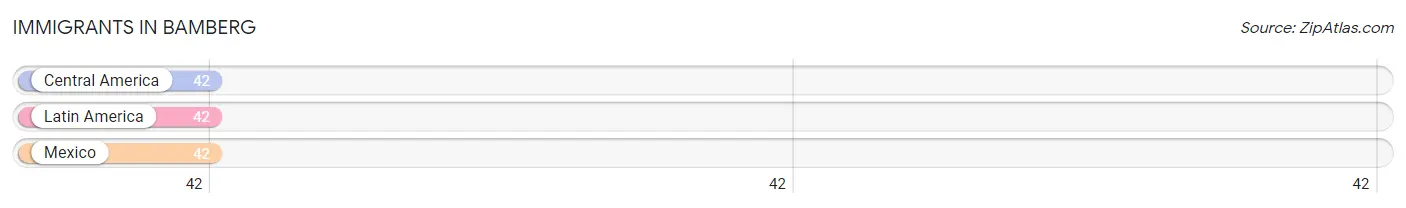
| Immigration Origin | # Population | % Population |
| Central America | 42 | 1.4% |
| Latin America | 42 | 1.4% |
| Mexico | 42 | 1.4% | View All 3 Rows |
Sex and Age in Bamberg
Sex and Age in Bamberg
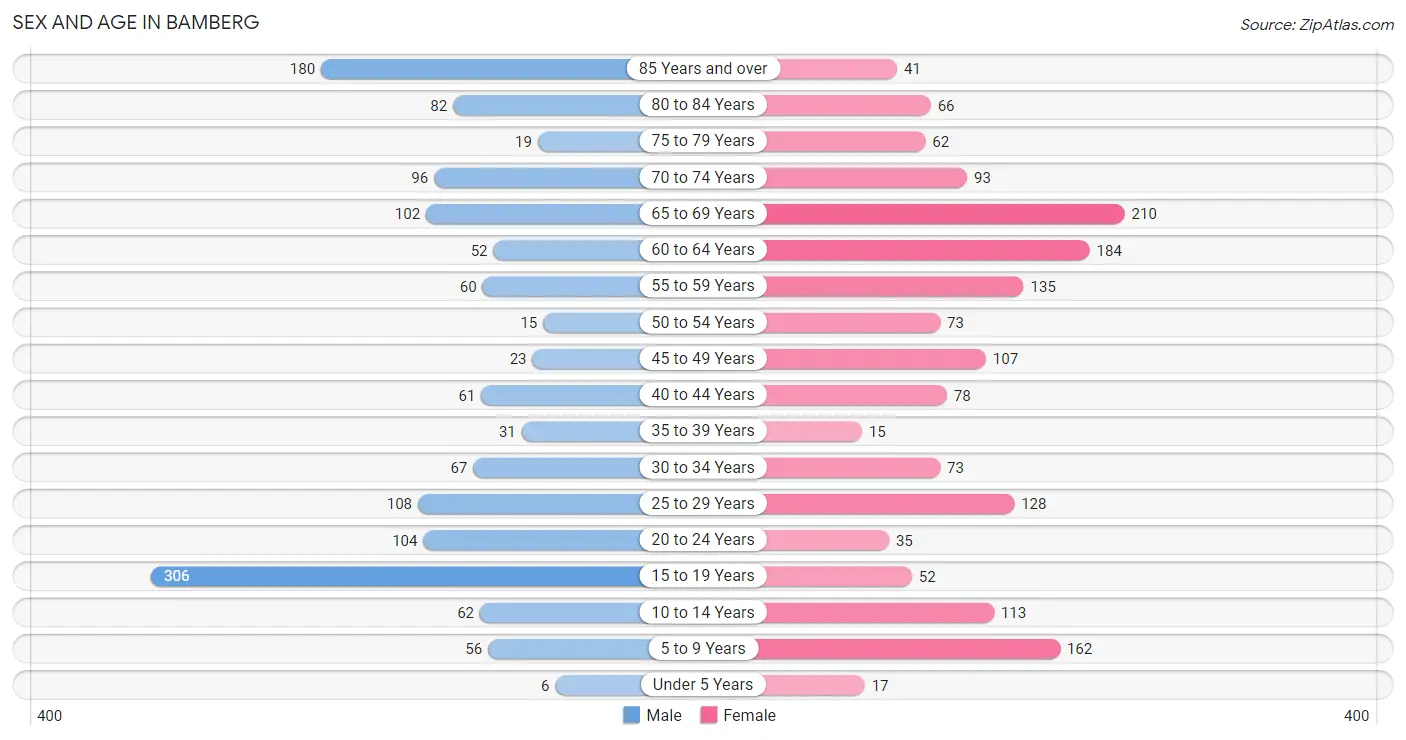
The most populous age groups in Bamberg are 15 to 19 Years (306 | 21.4%) for men and 65 to 69 Years (210 | 12.8%) for women.
| Age Bracket | Male | Female |
| Under 5 Years | 6 (0.4%) | 17 (1.0%) |
| 5 to 9 Years | 56 (3.9%) | 162 (9.9%) |
| 10 to 14 Years | 62 (4.3%) | 113 (6.9%) |
| 15 to 19 Years | 306 (21.4%) | 52 (3.2%) |
| 20 to 24 Years | 104 (7.3%) | 35 (2.1%) |
| 25 to 29 Years | 108 (7.5%) | 128 (7.8%) |
| 30 to 34 Years | 67 (4.7%) | 73 (4.4%) |
| 35 to 39 Years | 31 (2.2%) | 15 (0.9%) |
| 40 to 44 Years | 61 (4.3%) | 78 (4.7%) |
| 45 to 49 Years | 23 (1.6%) | 107 (6.5%) |
| 50 to 54 Years | 15 (1.1%) | 73 (4.4%) |
| 55 to 59 Years | 60 (4.2%) | 135 (8.2%) |
| 60 to 64 Years | 52 (3.6%) | 184 (11.2%) |
| 65 to 69 Years | 102 (7.1%) | 210 (12.8%) |
| 70 to 74 Years | 96 (6.7%) | 93 (5.7%) |
| 75 to 79 Years | 19 (1.3%) | 62 (3.8%) |
| 80 to 84 Years | 82 (5.7%) | 66 (4.0%) |
| 85 Years and over | 180 (12.6%) | 41 (2.5%) |
| Total | 1,430 (100.0%) | 1,644 (100.0%) |
Families and Households in Bamberg
Median Family Size in Bamberg
The median family size in Bamberg is 3.45 persons per family, with single male/father families (6 | 1.1%) accounting for the largest median family size of 4.17 persons per family. On the other hand, married-couple families (219 | 40.6%) represent the smallest median family size with 3.06 persons per family.
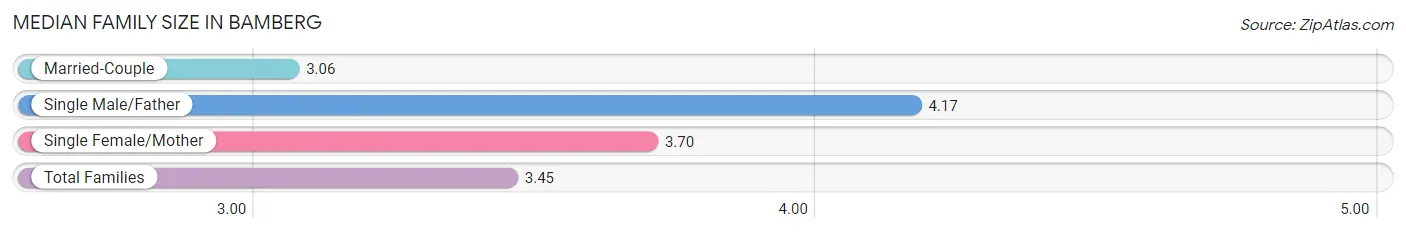
| Family Type | # Families | Family Size |
| Married-Couple | 219 (40.6%) | 3.06 |
| Single Male/Father | 6 (1.1%) | 4.17 |
| Single Female/Mother | 314 (58.3%) | 3.70 |
| Total Families | 539 (100.0%) | 3.45 |
Median Household Size in Bamberg
The median household size in Bamberg is 2.18 persons per household, with single male/father households (6 | 0.5%) accounting for the largest median household size of 4.17 persons per household. non-family households (675 | 55.6%) represent the smallest median household size with 1.03 persons per household.
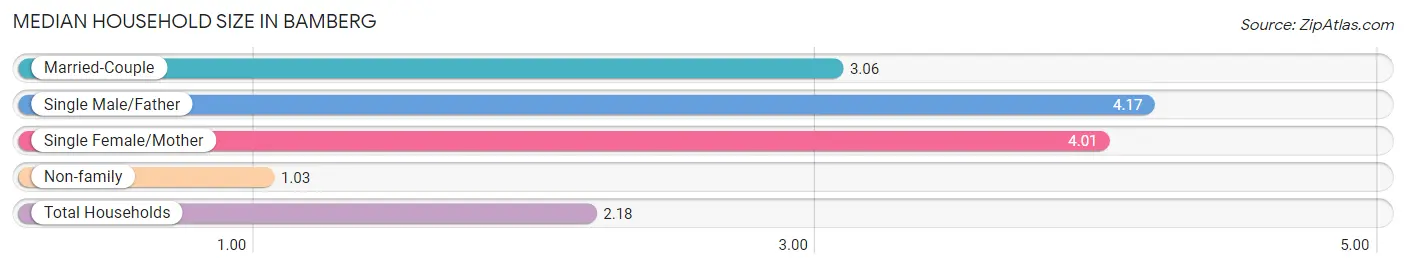
| Household Type | # Households | Household Size |
| Married-Couple | 219 (18.0%) | 3.06 |
| Single Male/Father | 6 (0.5%) | 4.17 |
| Single Female/Mother | 314 (25.9%) | 4.01 |
| Non-family | 675 (55.6%) | 1.03 |
| Total Households | 1,214 (100.0%) | 2.18 |
Household Size by Marriage Status in Bamberg
Out of a total of 1,214 households in Bamberg, 539 (44.4%) are family households, while 675 (55.6%) are nonfamily households. The most numerous type of family households are 2-person households, comprising 271, and the most common type of nonfamily households are 1-person households, comprising 595.
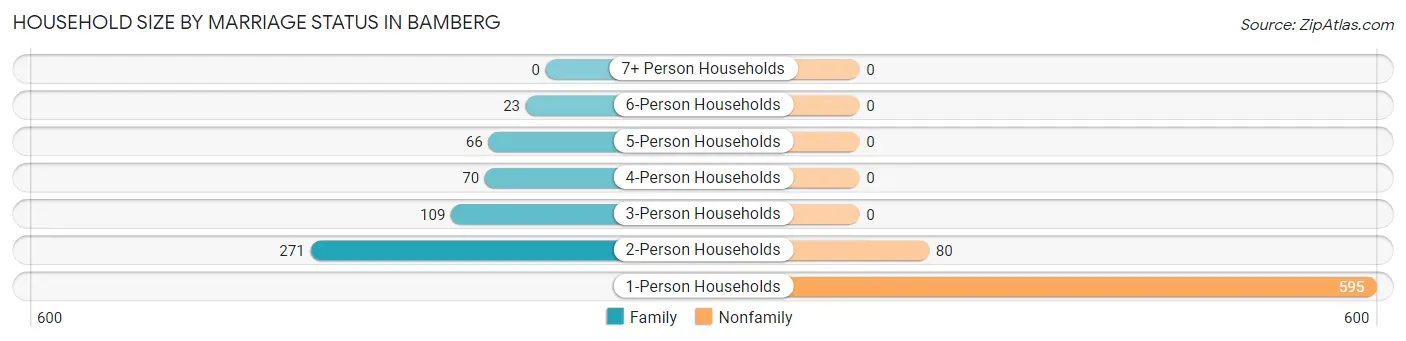
| Household Size | Family Households | Nonfamily Households |
| 1-Person Households | - | 595 (49.0%) |
| 2-Person Households | 271 (22.3%) | 80 (6.6%) |
| 3-Person Households | 109 (9.0%) | 0 (0.0%) |
| 4-Person Households | 70 (5.8%) | 0 (0.0%) |
| 5-Person Households | 66 (5.4%) | 0 (0.0%) |
| 6-Person Households | 23 (1.9%) | 0 (0.0%) |
| 7+ Person Households | 0 (0.0%) | 0 (0.0%) |
| Total | 539 (44.4%) | 675 (55.6%) |
Female Fertility in Bamberg
Fertility by Age in Bamberg
| Age Bracket | Women with Births | Births / 1,000 Women |
| 15 to 19 years | 0 (0.0%) | 0.0 |
| 20 to 34 years | 0 (0.0%) | 0.0 |
| 35 to 50 years | 0 (0.0%) | 0.0 |
| Total | 0 (0.0%) | 0.0 |
Fertility by Age by Marriage Status in Bamberg
| Age Bracket | Married | Unmarried |
| 15 to 19 years | 0 (0.0%) | 0 (0.0%) |
| 20 to 34 years | 0 (0.0%) | 0 (0.0%) |
| 35 to 50 years | 0 (0.0%) | 0 (0.0%) |
| Total | 0 (0.0%) | 0 (0.0%) |
Fertility by Education in Bamberg
| Educational Attainment | Women with Births | Births / 1,000 Women |
| Less than High School | 0 (0.0%) | 0.0 |
| High School Diploma | 0 (0.0%) | 0.0 |
| College or Associate's Degree | 0 (0.0%) | 0.0 |
| Bachelor's Degree | 0 (0.0%) | 0.0 |
| Graduate Degree | 0 (0.0%) | 0.0 |
| Total | 0 (0.0%) | 0.0 |
Fertility by Education by Marriage Status in Bamberg
| Educational Attainment | Married | Unmarried |
| Less than High School | 0 (0.0%) | 0 (0.0%) |
| High School Diploma | 0 (0.0%) | 0 (0.0%) |
| College or Associate's Degree | 0 (0.0%) | 0 (0.0%) |
| Bachelor's Degree | 0 (0.0%) | 0 (0.0%) |
| Graduate Degree | 0 (0.0%) | 0 (0.0%) |
| Total | 0 (0.0%) | 0 (0.0%) |
Employment Characteristics in Bamberg
Employment by Class of Employer in Bamberg
Among the 1,006 employed individuals in Bamberg, private company employees (859 | 85.4%), state government employees (69 | 6.9%), and local government employees (51 | 5.1%) make up the most common classes of employment.
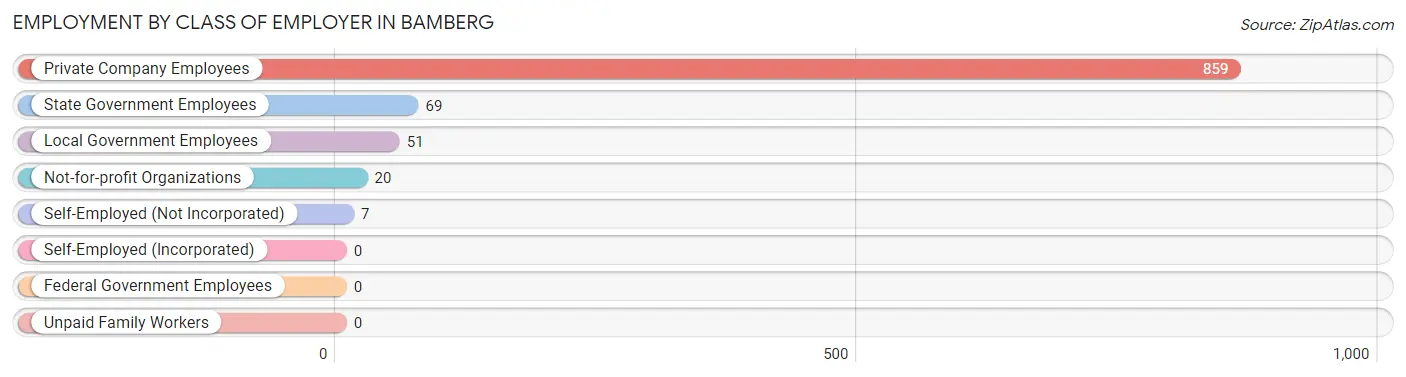
| Employer Class | # Employees | % Employees |
| Private Company Employees | 859 | 85.4% |
| Self-Employed (Incorporated) | 0 | 0.0% |
| Self-Employed (Not Incorporated) | 7 | 0.7% |
| Not-for-profit Organizations | 20 | 2.0% |
| Local Government Employees | 51 | 5.1% |
| State Government Employees | 69 | 6.9% |
| Federal Government Employees | 0 | 0.0% |
| Unpaid Family Workers | 0 | 0.0% |
| Total | 1,006 | 100.0% |
Employment Status by Age in Bamberg
According to the labor force statistics for Bamberg, out of the total population over 16 years of age (2,619), 44.4% or 1,163 individuals are in the labor force, with 11.1% or 129 of them unemployed. The age group with the highest labor force participation rate is 25 to 29 years, with 95.8% or 226 individuals in the labor force. Within the labor force, the 55 to 59 years age range has the highest percentage of unemployed individuals, with 33.7% or 33 of them being unemployed.
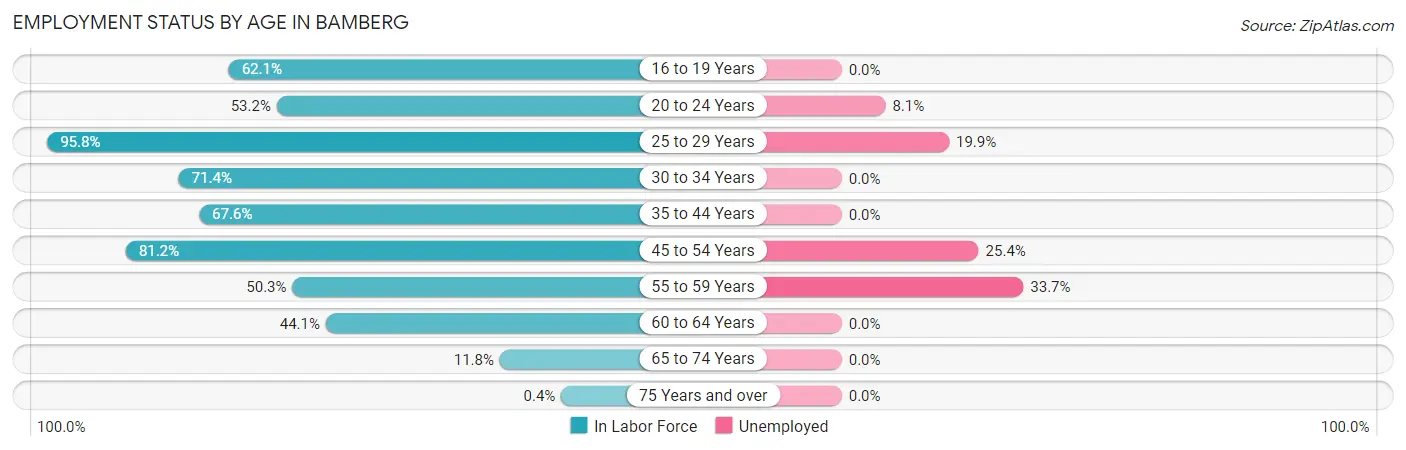
| Age Bracket | In Labor Force | Unemployed |
| 16 to 19 Years | 198 (62.1%) | 0 (0.0%) |
| 20 to 24 Years | 74 (53.2%) | 6 (8.1%) |
| 25 to 29 Years | 226 (95.8%) | 45 (19.9%) |
| 30 to 34 Years | 100 (71.4%) | 0 (0.0%) |
| 35 to 44 Years | 125 (67.6%) | 0 (0.0%) |
| 45 to 54 Years | 177 (81.2%) | 45 (25.4%) |
| 55 to 59 Years | 98 (50.3%) | 33 (33.7%) |
| 60 to 64 Years | 104 (44.1%) | 0 (0.0%) |
| 65 to 74 Years | 59 (11.8%) | 0 (0.0%) |
| 75 Years and over | 2 (0.4%) | 0 (0.0%) |
| Total | 1,163 (44.4%) | 129 (11.1%) |
Employment Status by Educational Attainment in Bamberg
According to labor force statistics for Bamberg, 68.6% of individuals (830) out of the total population between 25 and 64 years of age (1,210) are in the labor force, with 14.8% or 123 of them being unemployed. The group with the highest labor force participation rate are those with the educational attainment of bachelor's degree or higher, with 99.5% or 197 individuals in the labor force. Within the labor force, individuals with bachelor's degree or higher education have the highest percentage of unemployment, with 45.7% or 90 of them being unemployed.
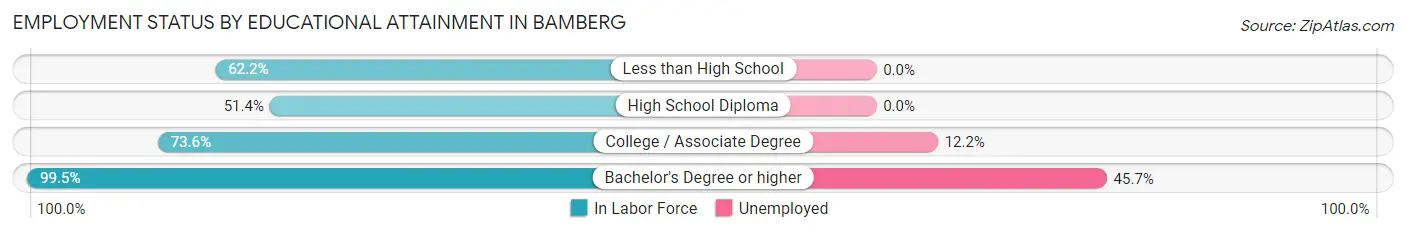
| Educational Attainment | In Labor Force | Unemployed |
| Less than High School | 178 (62.2%) | 0 (0.0%) |
| High School Diploma | 184 (51.4%) | 0 (0.0%) |
| College / Associate Degree | 271 (73.6%) | 45 (12.2%) |
| Bachelor's Degree or higher | 197 (99.5%) | 90 (45.7%) |
| Total | 830 (68.6%) | 179 (14.8%) |
Employment Occupations by Sex in Bamberg
Management, Business, Science and Arts Occupations
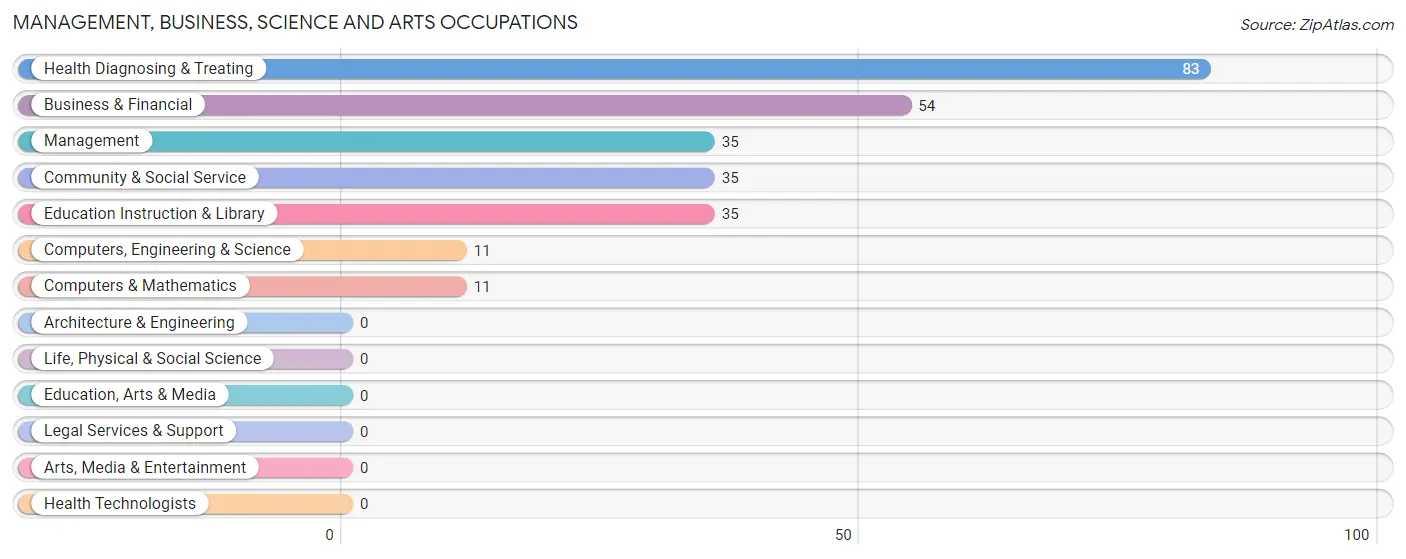
The most common Management, Business, Science and Arts occupations in Bamberg are Health Diagnosing & Treating (83 | 8.0%), Business & Financial (54 | 5.2%), Management (35 | 3.4%), Community & Social Service (35 | 3.4%), and Education Instruction & Library (35 | 3.4%).
Management, Business, Science and Arts Occupations by Sex
Within the Management, Business, Science and Arts occupations in Bamberg, the most male-oriented occupations are Management (37.1%), and Business & Financial (31.5%), while the most female-oriented occupations are Computers, Engineering & Science (100.0%), Computers & Mathematics (100.0%), and Community & Social Service (100.0%).
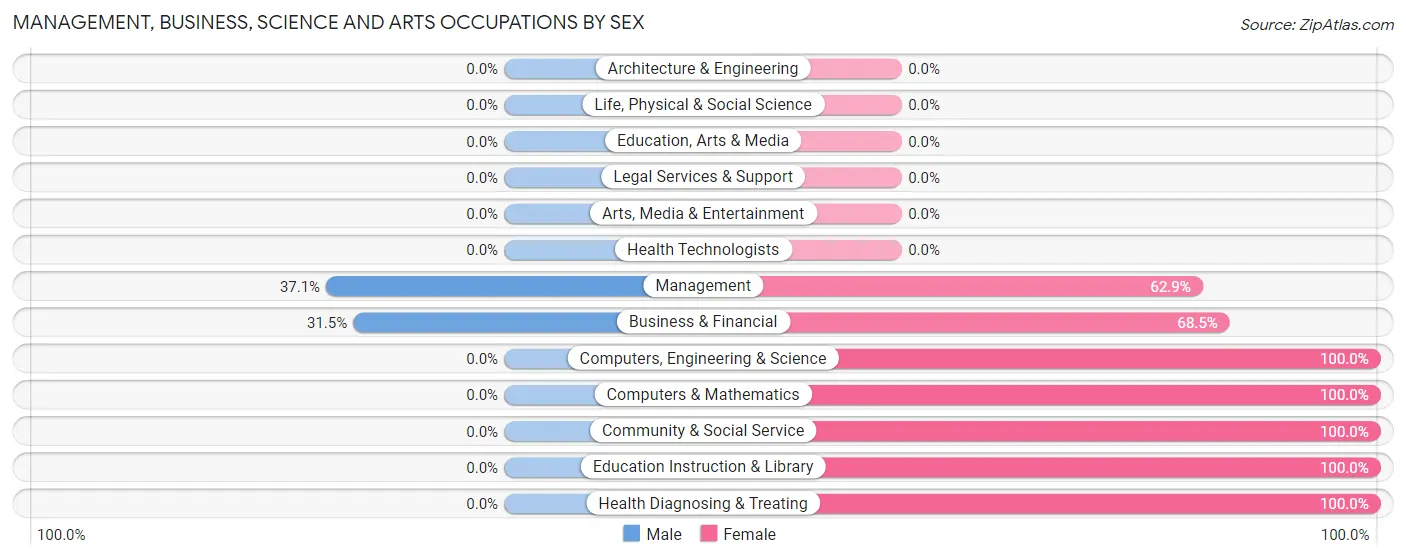
| Occupation | Male | Female |
| Management | 13 (37.1%) | 22 (62.9%) |
| Business & Financial | 17 (31.5%) | 37 (68.5%) |
| Computers, Engineering & Science | 0 (0.0%) | 11 (100.0%) |
| Computers & Mathematics | 0 (0.0%) | 11 (100.0%) |
| Architecture & Engineering | 0 (0.0%) | 0 (0.0%) |
| Life, Physical & Social Science | 0 (0.0%) | 0 (0.0%) |
| Community & Social Service | 0 (0.0%) | 35 (100.0%) |
| Education, Arts & Media | 0 (0.0%) | 0 (0.0%) |
| Legal Services & Support | 0 (0.0%) | 0 (0.0%) |
| Education Instruction & Library | 0 (0.0%) | 35 (100.0%) |
| Arts, Media & Entertainment | 0 (0.0%) | 0 (0.0%) |
| Health Diagnosing & Treating | 0 (0.0%) | 83 (100.0%) |
| Health Technologists | 0 (0.0%) | 0 (0.0%) |
| Total (Category) | 30 (13.8%) | 188 (86.2%) |
| Total (Overall) | 443 (42.8%) | 591 (57.2%) |
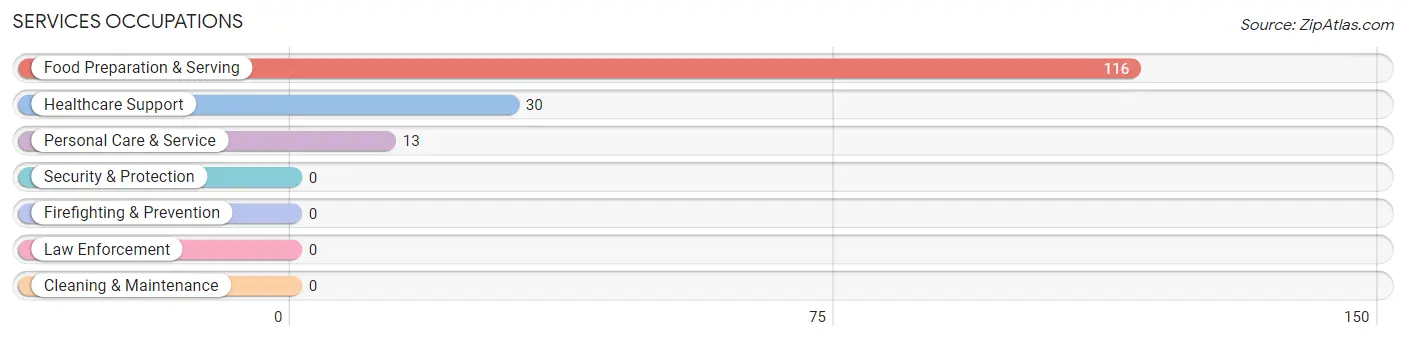
Services Occupations
The most common Services occupations in Bamberg are Food Preparation & Serving (116 | 11.2%), Healthcare Support (30 | 2.9%), and Personal Care & Service (13 | 1.3%).
Services Occupations by Sex
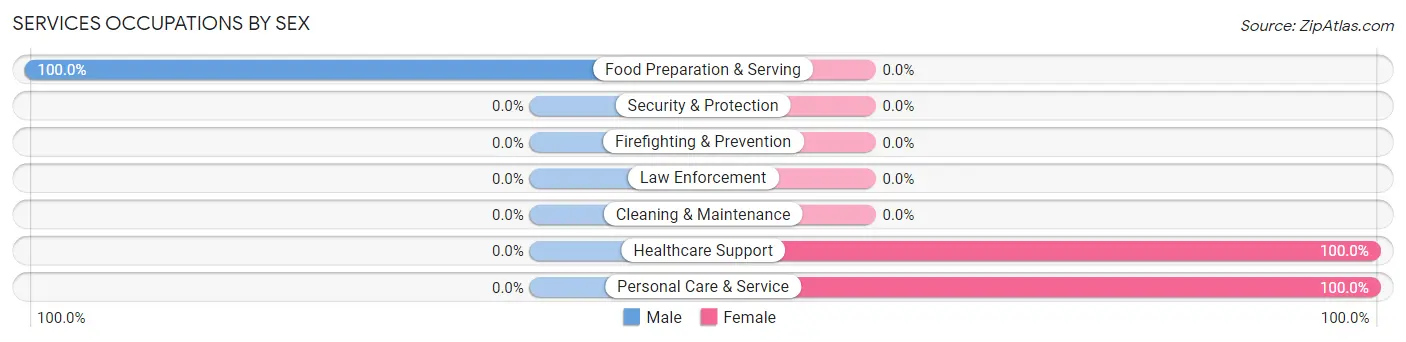
| Occupation | Male | Female |
| Healthcare Support | 0 (0.0%) | 30 (100.0%) |
| Security & Protection | 0 (0.0%) | 0 (0.0%) |
| Firefighting & Prevention | 0 (0.0%) | 0 (0.0%) |
| Law Enforcement | 0 (0.0%) | 0 (0.0%) |
| Food Preparation & Serving | 116 (100.0%) | 0 (0.0%) |
| Cleaning & Maintenance | 0 (0.0%) | 0 (0.0%) |
| Personal Care & Service | 0 (0.0%) | 13 (100.0%) |
| Total (Category) | 116 (73.0%) | 43 (27.0%) |
| Total (Overall) | 443 (42.8%) | 591 (57.2%) |
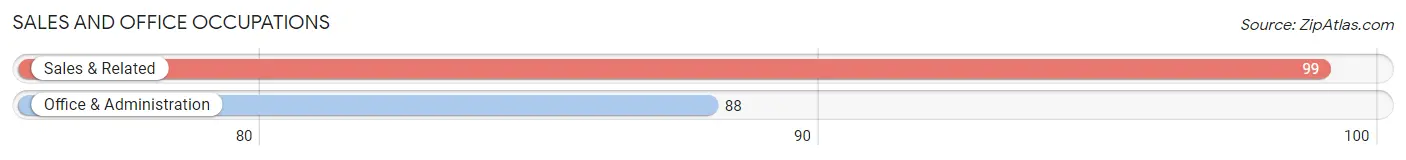
Sales and Office Occupations
The most common Sales and Office occupations in Bamberg are Sales & Related (99 | 9.6%), and Office & Administration (88 | 8.5%).
Sales and Office Occupations by Sex
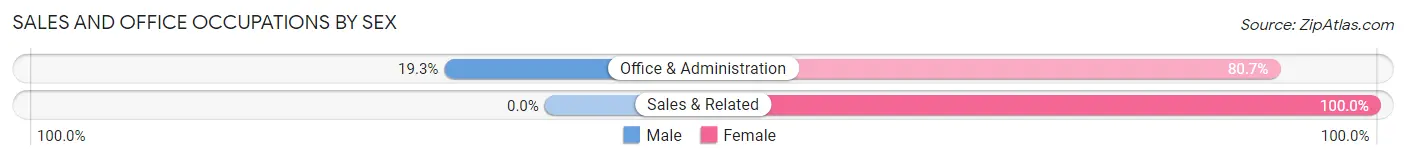
| Occupation | Male | Female |
| Sales & Related | 0 (0.0%) | 99 (100.0%) |
| Office & Administration | 17 (19.3%) | 71 (80.7%) |
| Total (Category) | 17 (9.1%) | 170 (90.9%) |
| Total (Overall) | 443 (42.8%) | 591 (57.2%) |
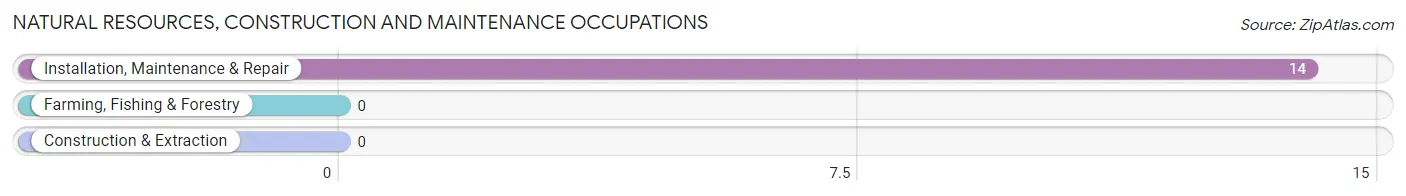
Natural Resources, Construction and Maintenance Occupations
The most common Natural Resources, Construction and Maintenance occupations in Bamberg are , and Installation, Maintenance & Repair (14 | 1.3%).
Natural Resources, Construction and Maintenance Occupations by Sex
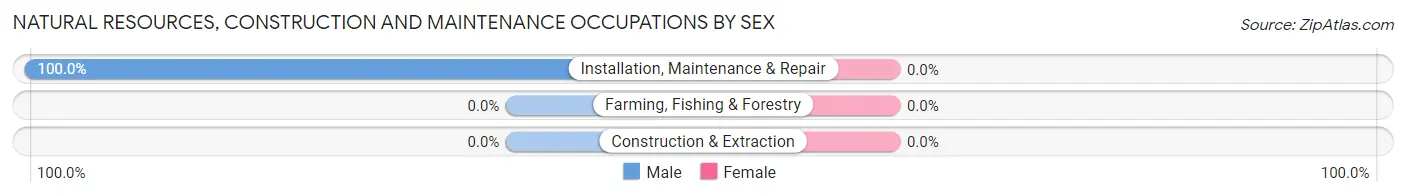
| Occupation | Male | Female |
| Farming, Fishing & Forestry | 0 (0.0%) | 0 (0.0%) |
| Construction & Extraction | 0 (0.0%) | 0 (0.0%) |
| Installation, Maintenance & Repair | 14 (100.0%) | 0 (0.0%) |
| Total (Category) | 14 (100.0%) | 0 (0.0%) |
| Total (Overall) | 443 (42.8%) | 591 (57.2%) |
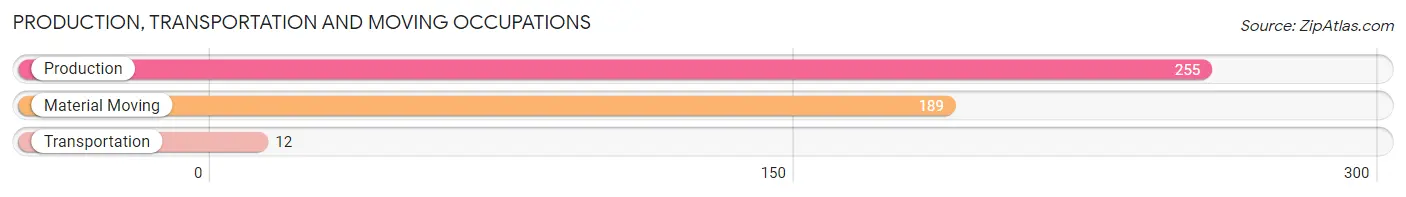
Production, Transportation and Moving Occupations
The most common Production, Transportation and Moving occupations in Bamberg are Production (255 | 24.7%), Material Moving (189 | 18.3%), and Transportation (12 | 1.2%).
Production, Transportation and Moving Occupations by Sex
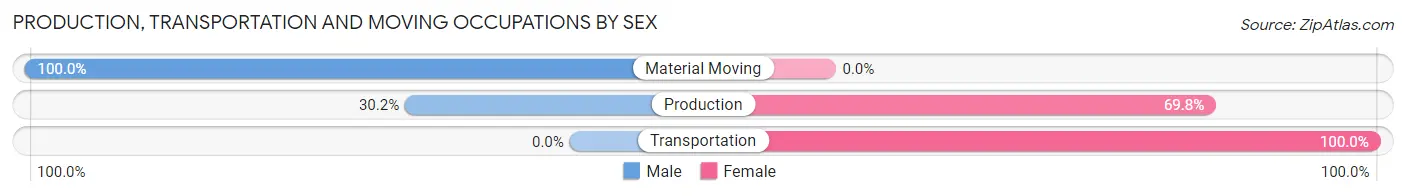
| Occupation | Male | Female |
| Production | 77 (30.2%) | 178 (69.8%) |
| Transportation | 0 (0.0%) | 12 (100.0%) |
| Material Moving | 189 (100.0%) | 0 (0.0%) |
| Total (Category) | 266 (58.3%) | 190 (41.7%) |
| Total (Overall) | 443 (42.8%) | 591 (57.2%) |
Employment Industries by Sex in Bamberg
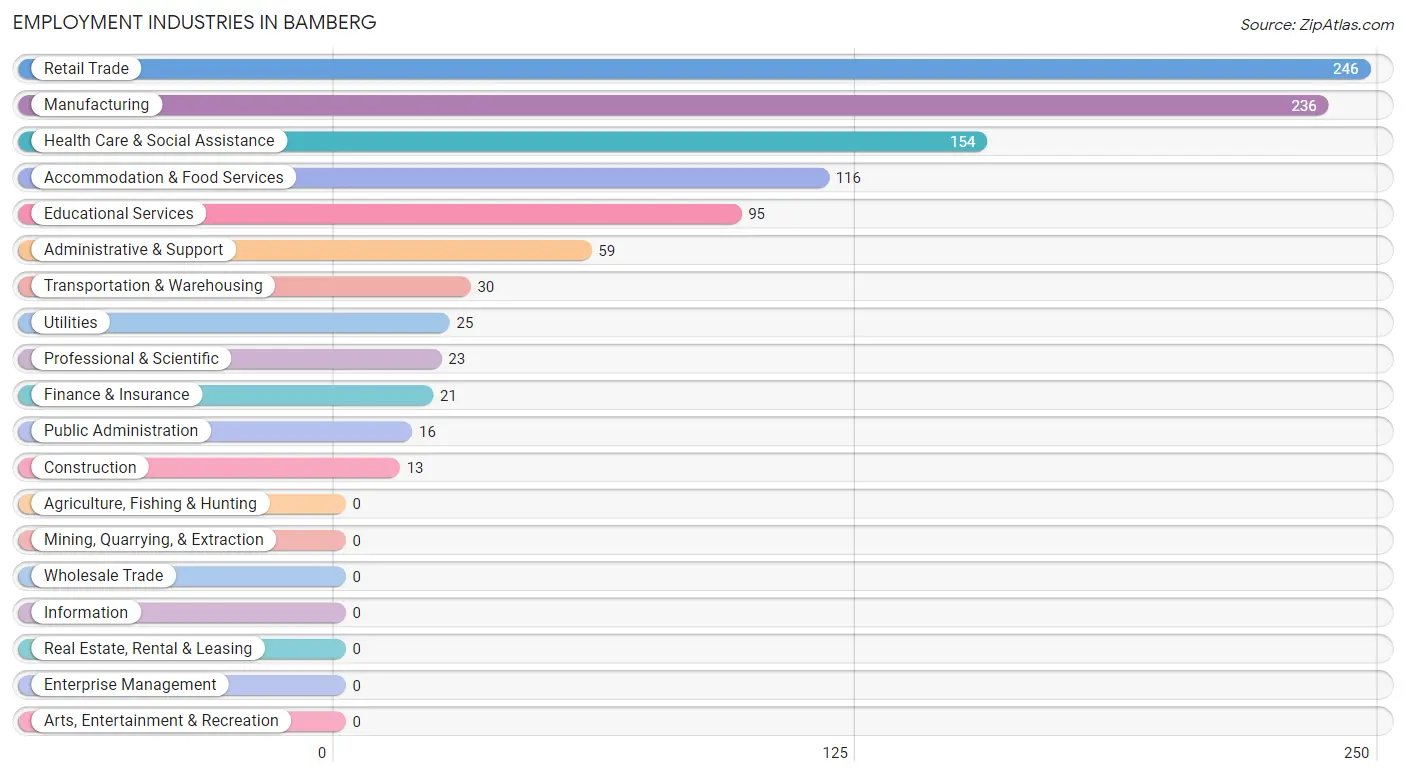
Employment Industries in Bamberg
The major employment industries in Bamberg include Retail Trade (246 | 23.8%), Manufacturing (236 | 22.8%), Health Care & Social Assistance (154 | 14.9%), Accommodation & Food Services (116 | 11.2%), and Educational Services (95 | 9.2%).
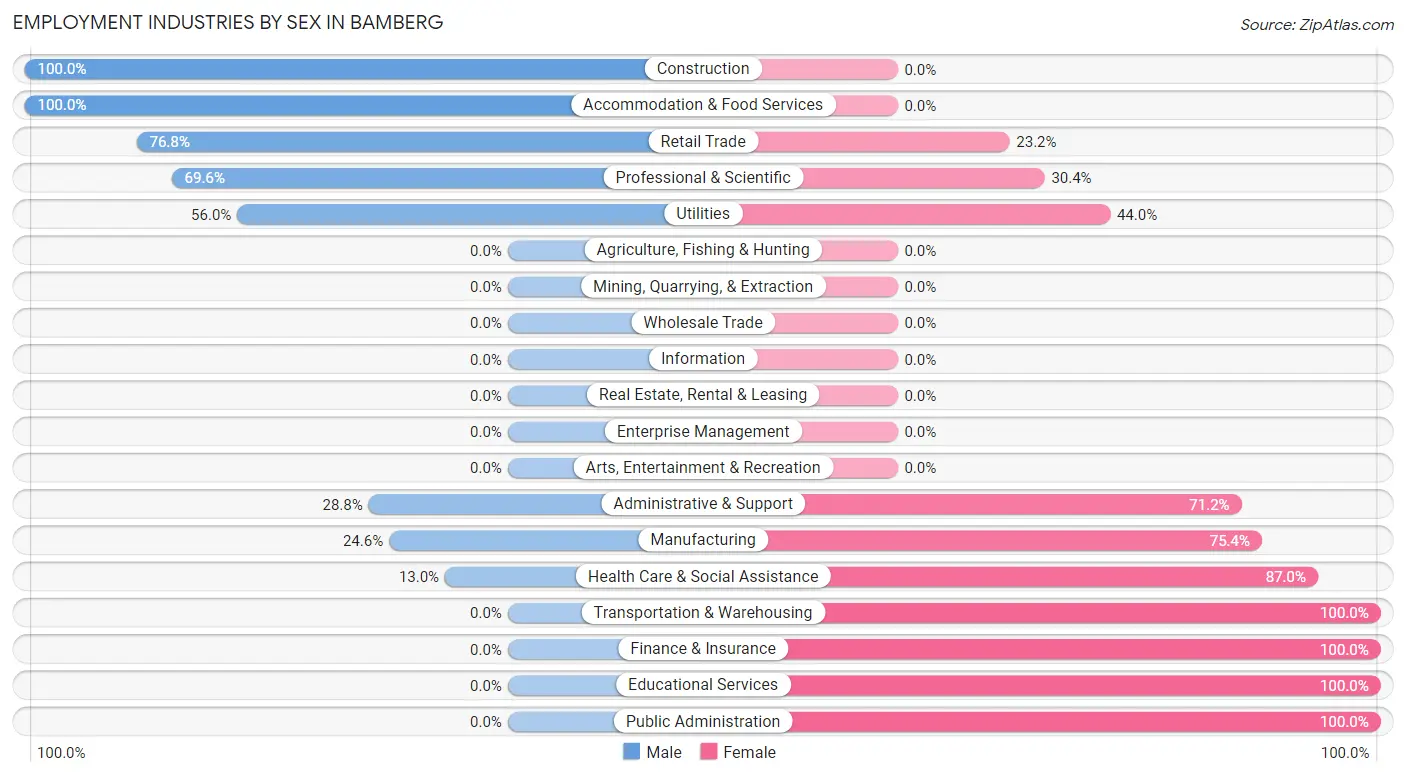
Employment Industries by Sex in Bamberg
The Bamberg industries that see more men than women are Construction (100.0%), Accommodation & Food Services (100.0%), and Retail Trade (76.8%), whereas the industries that tend to have a higher number of women are Transportation & Warehousing (100.0%), Finance & Insurance (100.0%), and Educational Services (100.0%).
| Industry | Male | Female |
| Agriculture, Fishing & Hunting | 0 (0.0%) | 0 (0.0%) |
| Mining, Quarrying, & Extraction | 0 (0.0%) | 0 (0.0%) |
| Construction | 13 (100.0%) | 0 (0.0%) |
| Manufacturing | 58 (24.6%) | 178 (75.4%) |
| Wholesale Trade | 0 (0.0%) | 0 (0.0%) |
| Retail Trade | 189 (76.8%) | 57 (23.2%) |
| Transportation & Warehousing | 0 (0.0%) | 30 (100.0%) |
| Utilities | 14 (56.0%) | 11 (44.0%) |
| Information | 0 (0.0%) | 0 (0.0%) |
| Finance & Insurance | 0 (0.0%) | 21 (100.0%) |
| Real Estate, Rental & Leasing | 0 (0.0%) | 0 (0.0%) |
| Professional & Scientific | 16 (69.6%) | 7 (30.4%) |
| Enterprise Management | 0 (0.0%) | 0 (0.0%) |
| Administrative & Support | 17 (28.8%) | 42 (71.2%) |
| Educational Services | 0 (0.0%) | 95 (100.0%) |
| Health Care & Social Assistance | 20 (13.0%) | 134 (87.0%) |
| Arts, Entertainment & Recreation | 0 (0.0%) | 0 (0.0%) |
| Accommodation & Food Services | 116 (100.0%) | 0 (0.0%) |
| Public Administration | 0 (0.0%) | 16 (100.0%) |
| Total | 443 (42.8%) | 591 (57.2%) |
Education in Bamberg
School Enrollment in Bamberg
The most common levels of schooling among the 786 students in Bamberg are college / undergraduate (250 | 31.8%), high school (188 | 23.9%), and middle school (126 | 16.0%).
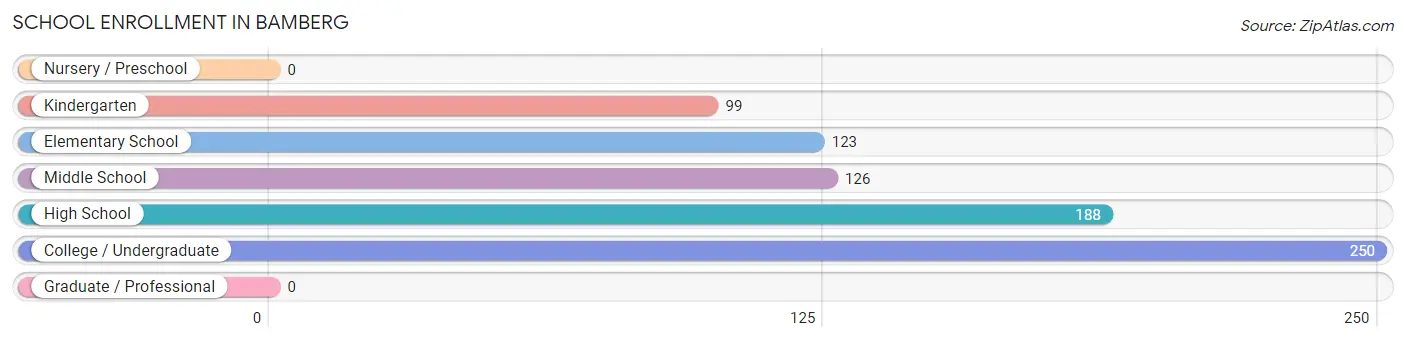
| School Level | # Students | % Students |
| Nursery / Preschool | 0 | 0.0% |
| Kindergarten | 99 | 12.6% |
| Elementary School | 123 | 15.7% |
| Middle School | 126 | 16.0% |
| High School | 188 | 23.9% |
| College / Undergraduate | 250 | 31.8% |
| Graduate / Professional | 0 | 0.0% |
| Total | 786 | 100.0% |
School Enrollment by Age by Funding Source in Bamberg
Out of a total of 786 students who are enrolled in schools in Bamberg, 193 (24.6%) attend a private institution, while the remaining 593 (75.4%) are enrolled in public schools. The age group of 18 to 19 year olds has the highest likelihood of being enrolled in private schools, with 193 (77.2% in the age bracket) enrolled. Conversely, the age group of 3 to 4 year olds has the lowest likelihood of being enrolled in a private school, with 17 (100.0% in the age bracket) attending a public institution.
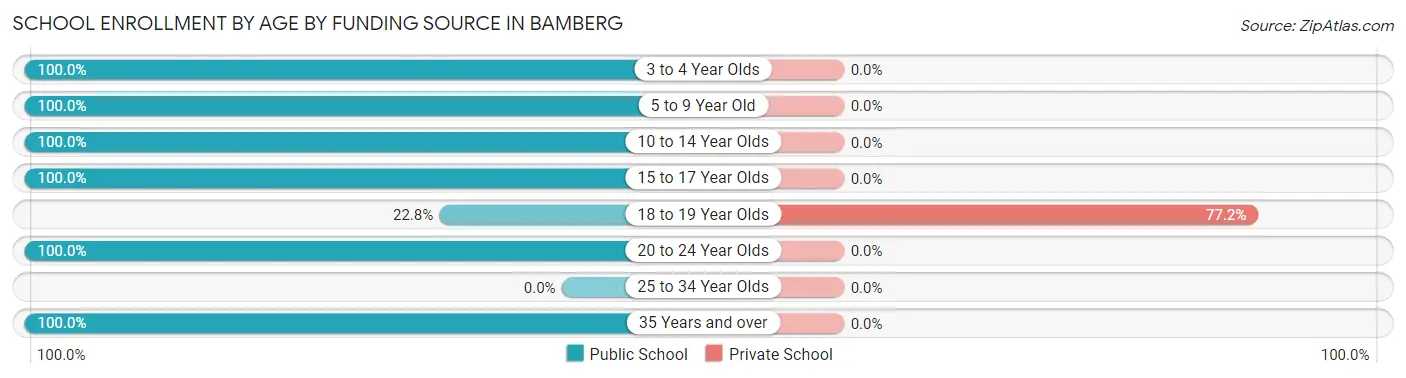
| Age Bracket | Public School | Private School |
| 3 to 4 Year Olds | 17 (100.0%) | 0 (0.0%) |
| 5 to 9 Year Old | 205 (100.0%) | 0 (0.0%) |
| 10 to 14 Year Olds | 175 (100.0%) | 0 (0.0%) |
| 15 to 17 Year Olds | 63 (100.0%) | 0 (0.0%) |
| 18 to 19 Year Olds | 57 (22.8%) | 193 (77.2%) |
| 20 to 24 Year Olds | 68 (100.0%) | 0 (0.0%) |
| 25 to 34 Year Olds | 0 (0.0%) | 0 (0.0%) |
| 35 Years and over | 8 (100.0%) | 0 (0.0%) |
| Total | 593 (75.4%) | 193 (24.6%) |
Educational Attainment by Field of Study in Bamberg
Education (142 | 31.4%), liberal arts & history (72 | 15.9%), arts & humanities (67 | 14.8%), business (58 | 12.8%), and literature & languages (30 | 6.6%) are the most common fields of study among 453 individuals in Bamberg who have obtained a bachelor's degree or higher.
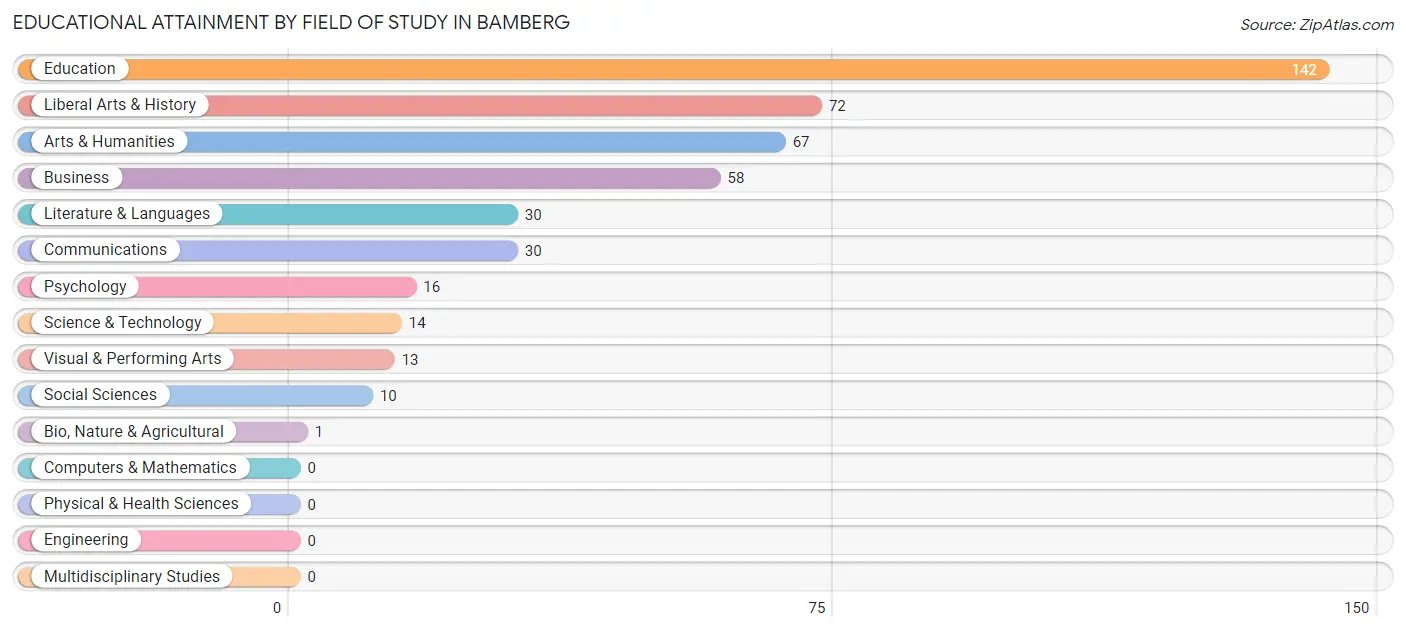
| Field of Study | # Graduates | % Graduates |
| Computers & Mathematics | 0 | 0.0% |
| Bio, Nature & Agricultural | 1 | 0.2% |
| Physical & Health Sciences | 0 | 0.0% |
| Psychology | 16 | 3.5% |
| Social Sciences | 10 | 2.2% |
| Engineering | 0 | 0.0% |
| Multidisciplinary Studies | 0 | 0.0% |
| Science & Technology | 14 | 3.1% |
| Business | 58 | 12.8% |
| Education | 142 | 31.4% |
| Literature & Languages | 30 | 6.6% |
| Liberal Arts & History | 72 | 15.9% |
| Visual & Performing Arts | 13 | 2.9% |
| Communications | 30 | 6.6% |
| Arts & Humanities | 67 | 14.8% |
| Total | 453 | 100.0% |
Transportation & Commute in Bamberg
Vehicle Availability by Sex in Bamberg
The most prevalent vehicle ownership categories in Bamberg are males with 2 vehicles (189, accounting for 46.6%) and females with 2 vehicles (150, making up 33.6%).
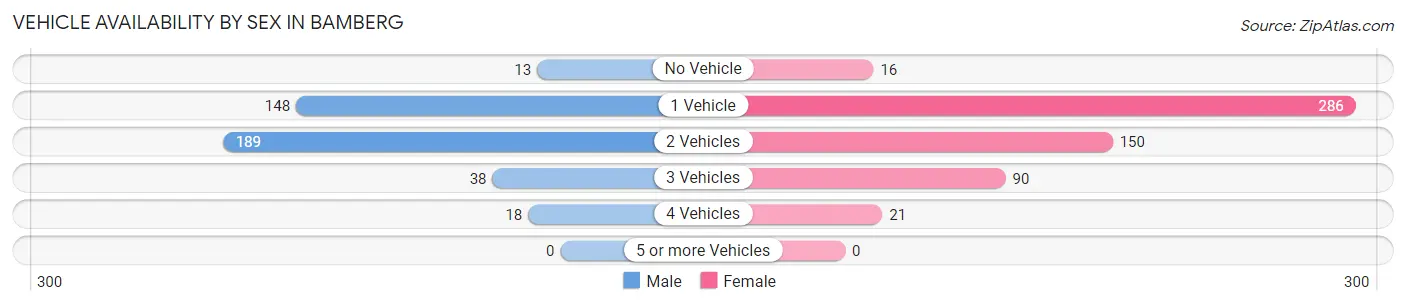
| Vehicles Available | Male | Female |
| No Vehicle | 13 (3.2%) | 16 (2.8%) |
| 1 Vehicle | 148 (36.4%) | 286 (50.8%) |
| 2 Vehicles | 189 (46.6%) | 150 (26.6%) |
| 3 Vehicles | 38 (9.4%) | 90 (16.0%) |
| 4 Vehicles | 18 (4.4%) | 21 (3.7%) |
| 5 or more Vehicles | 0 (0.0%) | 0 (0.0%) |
| Total | 406 (100.0%) | 563 (100.0%) |
Commute Time in Bamberg
The most frequently occuring commute durations in Bamberg are 25 to 29 minutes (268 commuters, 26.6%), 45 to 59 minutes (201 commuters, 20.0%), and less than 5 minutes (189 commuters, 18.8%).
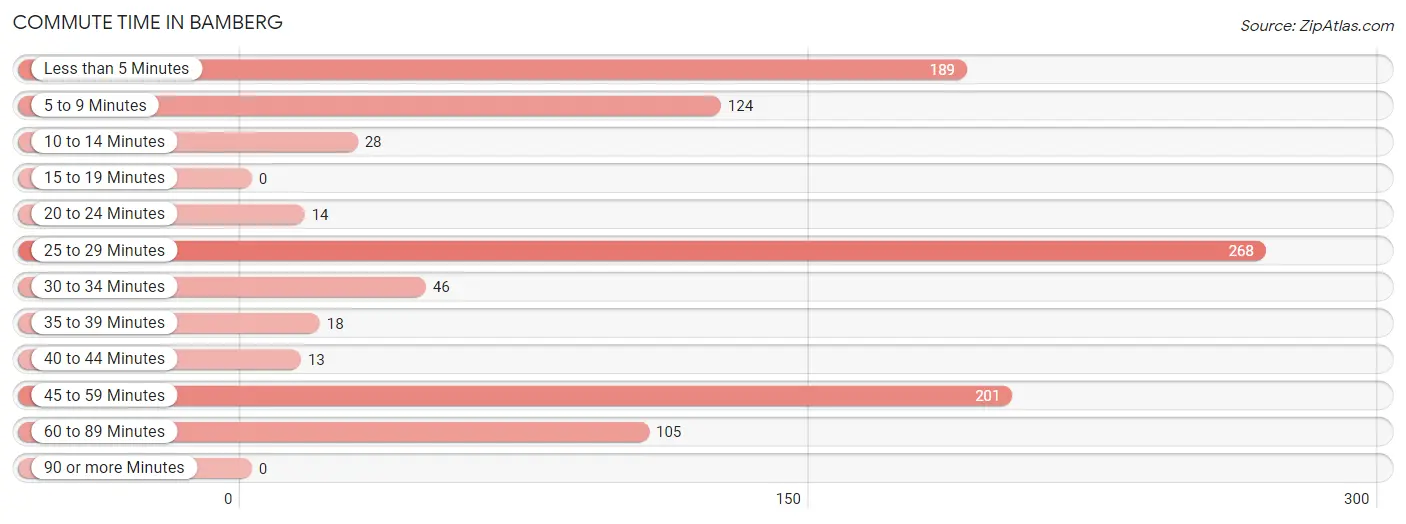
| Commute Time | # Commuters | % Commuters |
| Less than 5 Minutes | 189 | 18.8% |
| 5 to 9 Minutes | 124 | 12.3% |
| 10 to 14 Minutes | 28 | 2.8% |
| 15 to 19 Minutes | 0 | 0.0% |
| 20 to 24 Minutes | 14 | 1.4% |
| 25 to 29 Minutes | 268 | 26.6% |
| 30 to 34 Minutes | 46 | 4.6% |
| 35 to 39 Minutes | 18 | 1.8% |
| 40 to 44 Minutes | 13 | 1.3% |
| 45 to 59 Minutes | 201 | 20.0% |
| 60 to 89 Minutes | 105 | 10.4% |
| 90 or more Minutes | 0 | 0.0% |
Commute Time by Sex in Bamberg
The most common commute times in Bamberg are less than 5 minutes (189 commuters, 42.7%) for males and 25 to 29 minutes (203 commuters, 36.1%) for females.
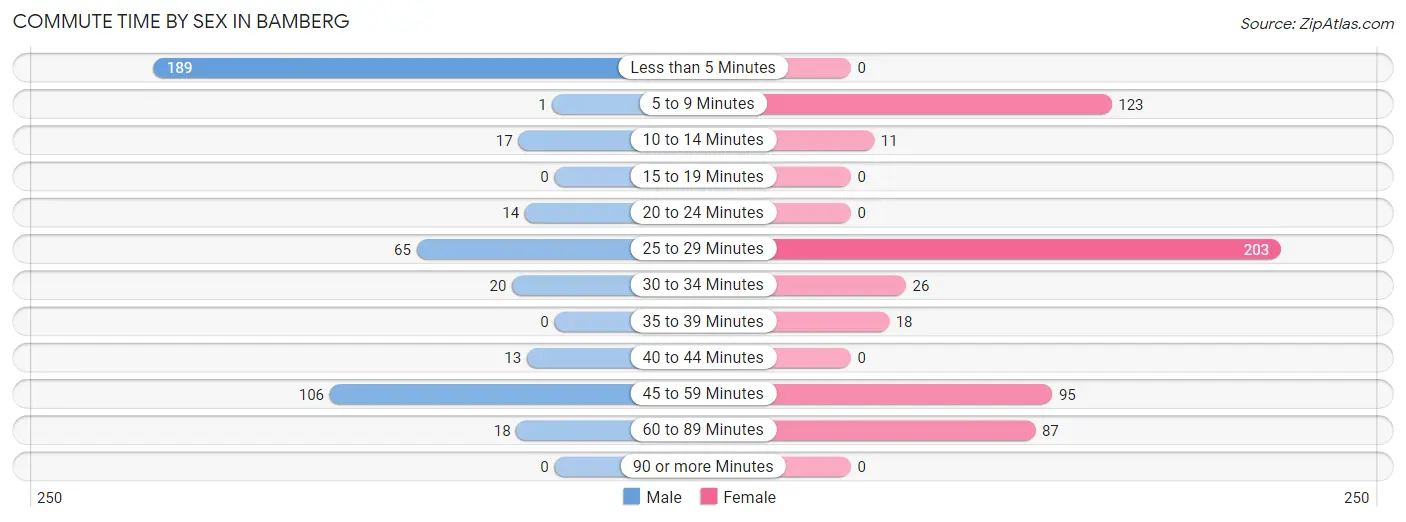
| Commute Time | Male | Female |
| Less than 5 Minutes | 189 (42.7%) | 0 (0.0%) |
| 5 to 9 Minutes | 1 (0.2%) | 123 (21.8%) |
| 10 to 14 Minutes | 17 (3.8%) | 11 (1.9%) |
| 15 to 19 Minutes | 0 (0.0%) | 0 (0.0%) |
| 20 to 24 Minutes | 14 (3.2%) | 0 (0.0%) |
| 25 to 29 Minutes | 65 (14.7%) | 203 (36.1%) |
| 30 to 34 Minutes | 20 (4.5%) | 26 (4.6%) |
| 35 to 39 Minutes | 0 (0.0%) | 18 (3.2%) |
| 40 to 44 Minutes | 13 (2.9%) | 0 (0.0%) |
| 45 to 59 Minutes | 106 (23.9%) | 95 (16.9%) |
| 60 to 89 Minutes | 18 (4.1%) | 87 (15.4%) |
| 90 or more Minutes | 0 (0.0%) | 0 (0.0%) |
Time of Departure to Work by Sex in Bamberg
The most frequent times of departure to work in Bamberg are 4:00 PM to 11:59 PM (206, 46.5%) for males and 7:00 AM to 7:29 AM (130, 23.1%) for females.
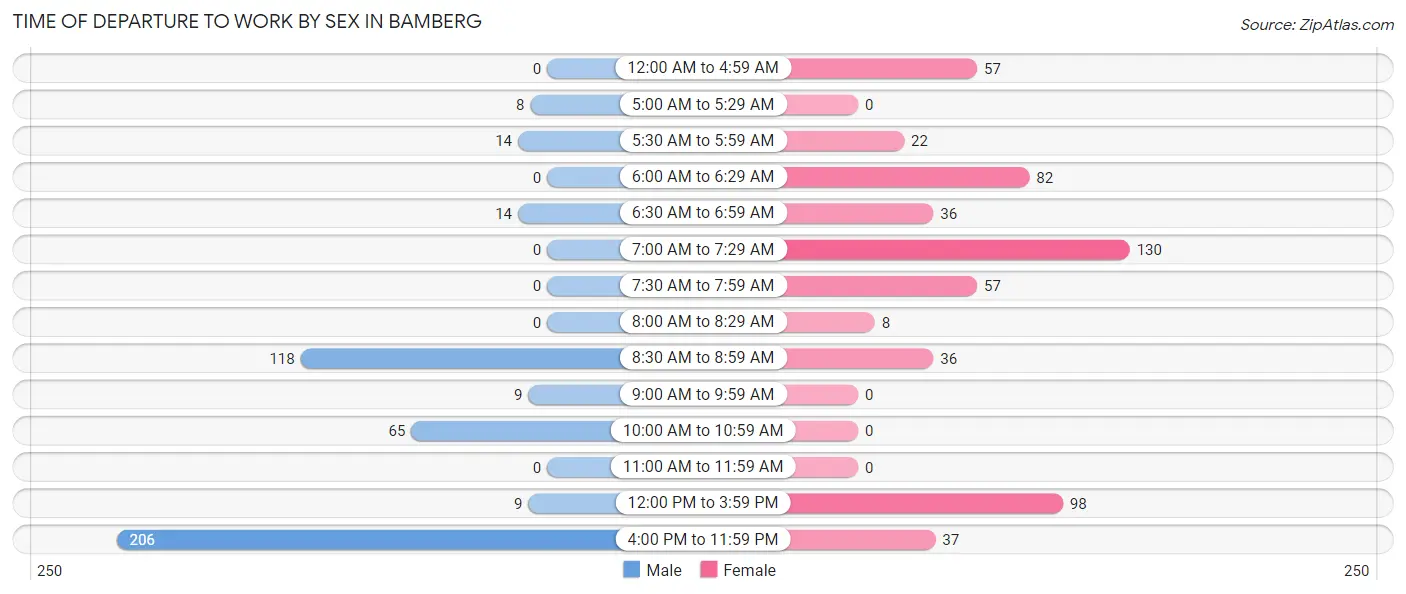
| Time of Departure | Male | Female |
| 12:00 AM to 4:59 AM | 0 (0.0%) | 57 (10.1%) |
| 5:00 AM to 5:29 AM | 8 (1.8%) | 0 (0.0%) |
| 5:30 AM to 5:59 AM | 14 (3.2%) | 22 (3.9%) |
| 6:00 AM to 6:29 AM | 0 (0.0%) | 82 (14.6%) |
| 6:30 AM to 6:59 AM | 14 (3.2%) | 36 (6.4%) |
| 7:00 AM to 7:29 AM | 0 (0.0%) | 130 (23.1%) |
| 7:30 AM to 7:59 AM | 0 (0.0%) | 57 (10.1%) |
| 8:00 AM to 8:29 AM | 0 (0.0%) | 8 (1.4%) |
| 8:30 AM to 8:59 AM | 118 (26.6%) | 36 (6.4%) |
| 9:00 AM to 9:59 AM | 9 (2.0%) | 0 (0.0%) |
| 10:00 AM to 10:59 AM | 65 (14.7%) | 0 (0.0%) |
| 11:00 AM to 11:59 AM | 0 (0.0%) | 0 (0.0%) |
| 12:00 PM to 3:59 PM | 9 (2.0%) | 98 (17.4%) |
| 4:00 PM to 11:59 PM | 206 (46.5%) | 37 (6.6%) |
| Total | 443 (100.0%) | 563 (100.0%) |
Housing Occupancy in Bamberg
Occupancy by Ownership in Bamberg
Of the total 1,214 dwellings in Bamberg, owner-occupied units account for 785 (64.7%), while renter-occupied units make up 429 (35.3%).
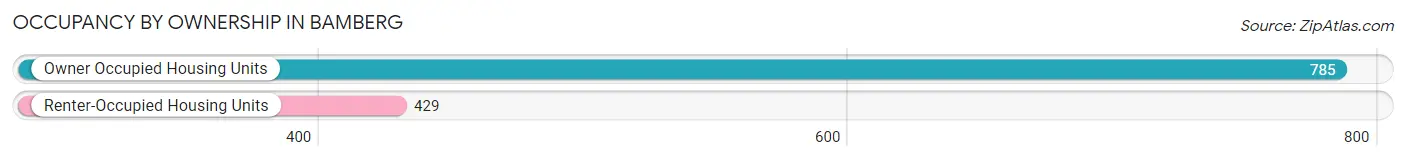
| Occupancy | # Housing Units | % Housing Units |
| Owner Occupied Housing Units | 785 | 64.7% |
| Renter-Occupied Housing Units | 429 | 35.3% |
| Total Occupied Housing Units | 1,214 | 100.0% |
Occupancy by Household Size in Bamberg
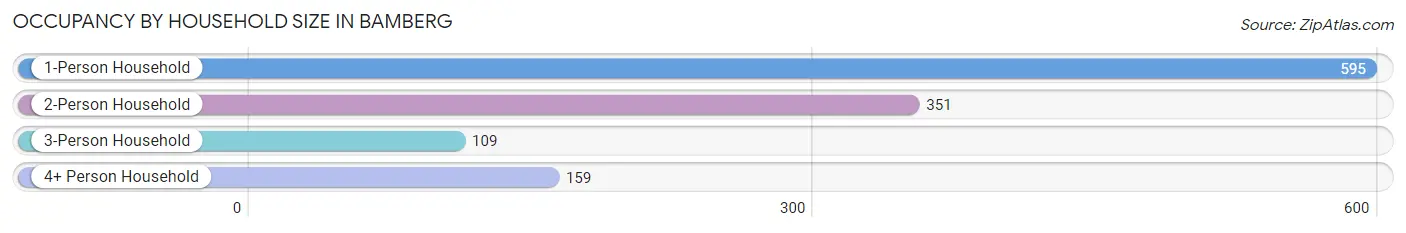
| Household Size | # Housing Units | % Housing Units |
| 1-Person Household | 595 | 49.0% |
| 2-Person Household | 351 | 28.9% |
| 3-Person Household | 109 | 9.0% |
| 4+ Person Household | 159 | 13.1% |
| Total Housing Units | 1,214 | 100.0% |
Occupancy by Ownership by Household Size in Bamberg
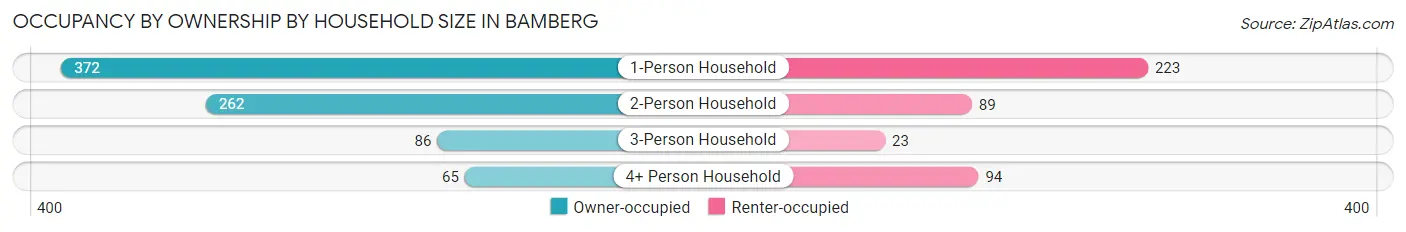
| Household Size | Owner-occupied | Renter-occupied |
| 1-Person Household | 372 (62.5%) | 223 (37.5%) |
| 2-Person Household | 262 (74.6%) | 89 (25.4%) |
| 3-Person Household | 86 (78.9%) | 23 (21.1%) |
| 4+ Person Household | 65 (40.9%) | 94 (59.1%) |
| Total Housing Units | 785 (64.7%) | 429 (35.3%) |
Occupancy by Educational Attainment in Bamberg
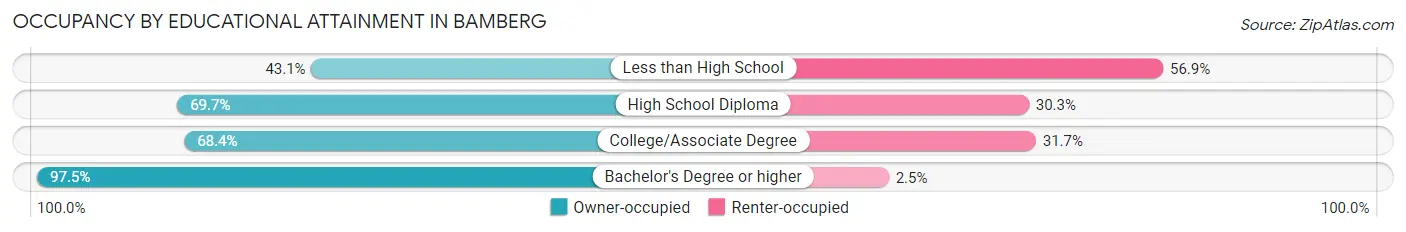
| Household Size | Owner-occupied | Renter-occupied |
| Less than High School | 182 (43.1%) | 240 (56.9%) |
| High School Diploma | 136 (69.7%) | 59 (30.3%) |
| College/Associate Degree | 270 (68.3%) | 125 (31.7%) |
| Bachelor's Degree or higher | 197 (97.5%) | 5 (2.5%) |
Occupancy by Age of Householder in Bamberg
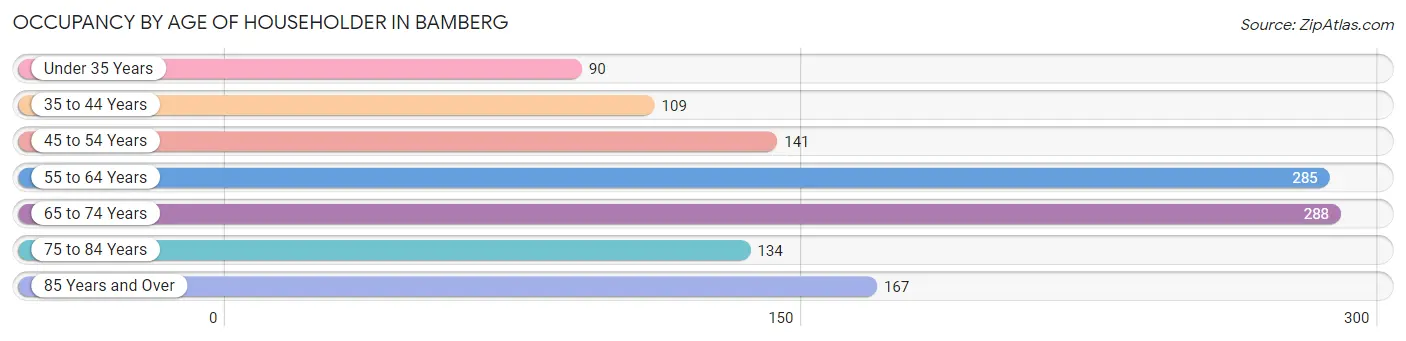
| Age Bracket | # Households | % Households |
| Under 35 Years | 90 | 7.4% |
| 35 to 44 Years | 109 | 9.0% |
| 45 to 54 Years | 141 | 11.6% |
| 55 to 64 Years | 285 | 23.5% |
| 65 to 74 Years | 288 | 23.7% |
| 75 to 84 Years | 134 | 11.0% |
| 85 Years and Over | 167 | 13.8% |
| Total | 1,214 | 100.0% |
Housing Finances in Bamberg
Median Income by Occupancy in Bamberg
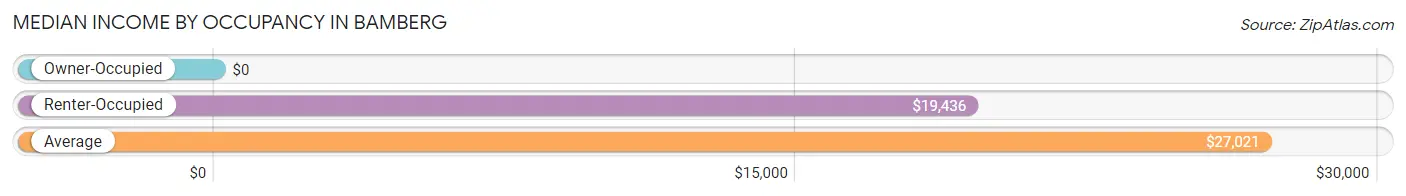
| Occupancy Type | # Households | Median Income |
| Owner-Occupied | 785 (64.7%) | $0 |
| Renter-Occupied | 429 (35.3%) | $19,436 |
| Average | 1,214 (100.0%) | $27,021 |
Occupancy by Householder Income Bracket in Bamberg
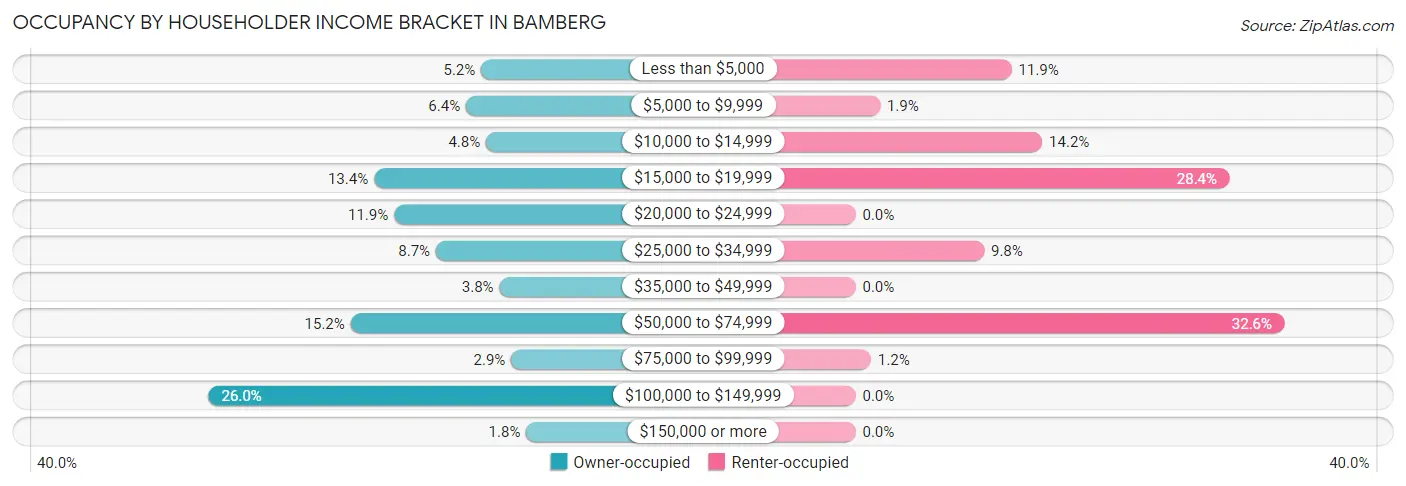
| Income Bracket | Owner-occupied | Renter-occupied |
| Less than $5,000 | 41 (5.2%) | 51 (11.9%) |
| $5,000 to $9,999 | 50 (6.4%) | 8 (1.9%) |
| $10,000 to $14,999 | 38 (4.8%) | 61 (14.2%) |
| $15,000 to $19,999 | 105 (13.4%) | 122 (28.4%) |
| $20,000 to $24,999 | 93 (11.8%) | 0 (0.0%) |
| $25,000 to $34,999 | 68 (8.7%) | 42 (9.8%) |
| $35,000 to $49,999 | 30 (3.8%) | 0 (0.0%) |
| $50,000 to $74,999 | 119 (15.2%) | 140 (32.6%) |
| $75,000 to $99,999 | 23 (2.9%) | 5 (1.2%) |
| $100,000 to $149,999 | 204 (26.0%) | 0 (0.0%) |
| $150,000 or more | 14 (1.8%) | 0 (0.0%) |
| Total | 785 (100.0%) | 429 (100.0%) |
Monthly Housing Cost Tiers in Bamberg
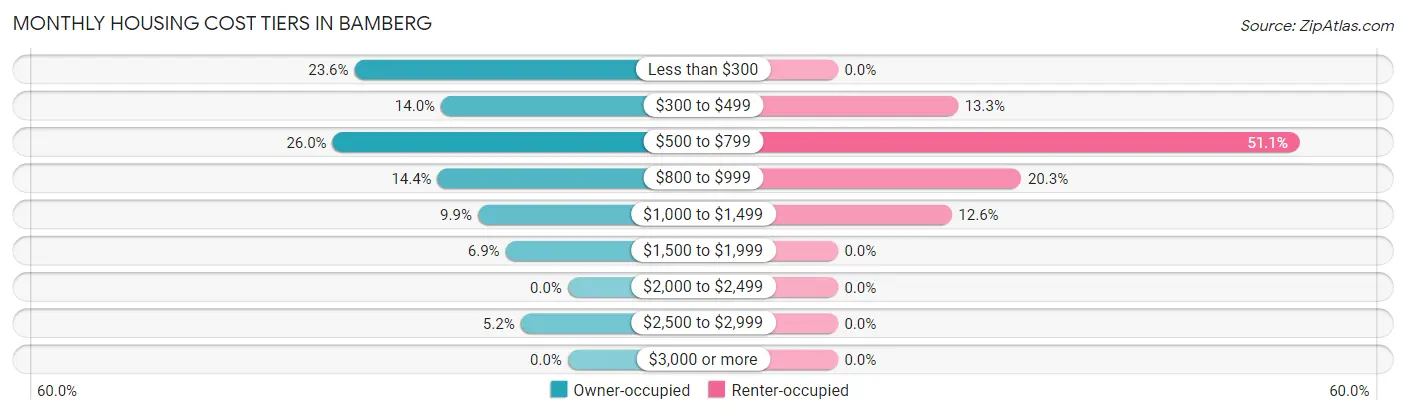
| Monthly Cost | Owner-occupied | Renter-occupied |
| Less than $300 | 185 (23.6%) | 0 (0.0%) |
| $300 to $499 | 110 (14.0%) | 57 (13.3%) |
| $500 to $799 | 204 (26.0%) | 219 (51.0%) |
| $800 to $999 | 113 (14.4%) | 87 (20.3%) |
| $1,000 to $1,499 | 78 (9.9%) | 54 (12.6%) |
| $1,500 to $1,999 | 54 (6.9%) | 0 (0.0%) |
| $2,000 to $2,499 | 0 (0.0%) | 0 (0.0%) |
| $2,500 to $2,999 | 41 (5.2%) | 0 (0.0%) |
| $3,000 or more | 0 (0.0%) | 0 (0.0%) |
| Total | 785 (100.0%) | 429 (100.0%) |
Physical Housing Characteristics in Bamberg
Housing Structures in Bamberg
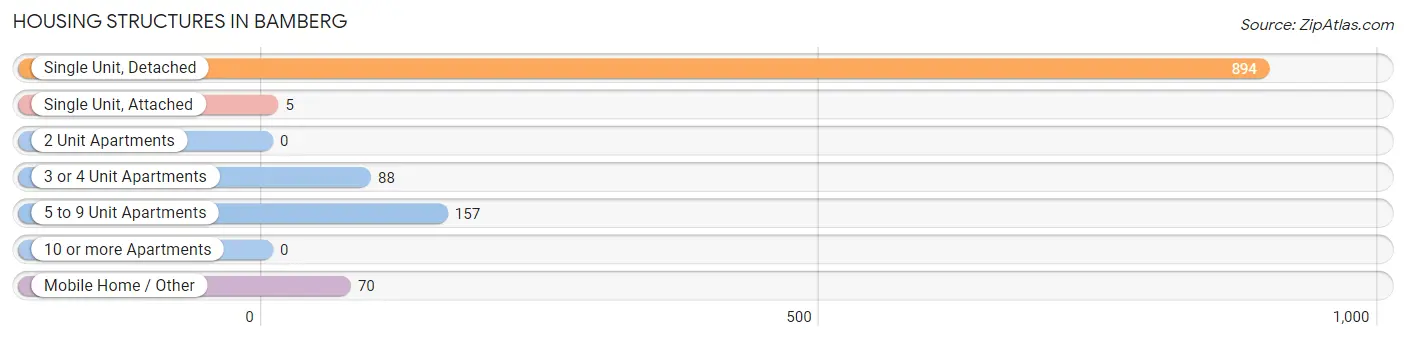
| Structure Type | # Housing Units | % Housing Units |
| Single Unit, Detached | 894 | 73.6% |
| Single Unit, Attached | 5 | 0.4% |
| 2 Unit Apartments | 0 | 0.0% |
| 3 or 4 Unit Apartments | 88 | 7.2% |
| 5 to 9 Unit Apartments | 157 | 12.9% |
| 10 or more Apartments | 0 | 0.0% |
| Mobile Home / Other | 70 | 5.8% |
| Total | 1,214 | 100.0% |
Housing Structures by Occupancy in Bamberg
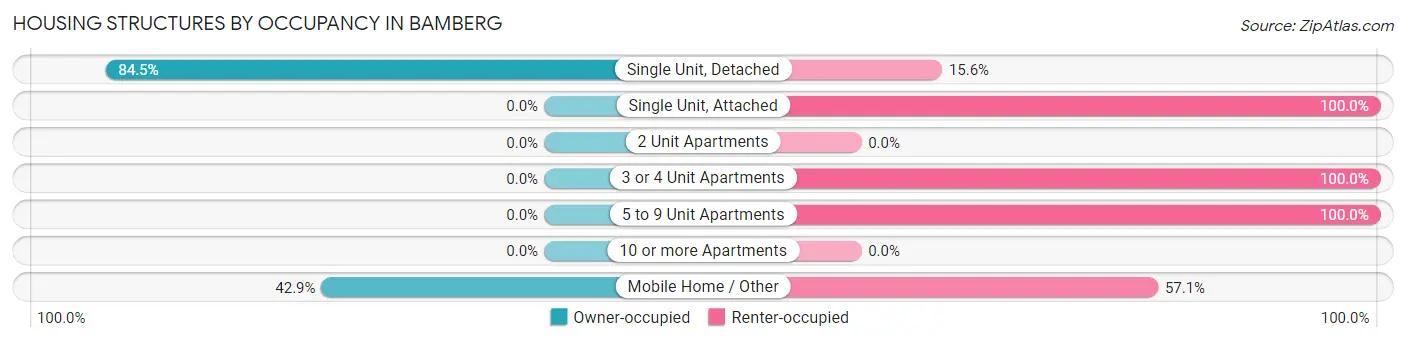
| Structure Type | Owner-occupied | Renter-occupied |
| Single Unit, Detached | 755 (84.5%) | 139 (15.5%) |
| Single Unit, Attached | 0 (0.0%) | 5 (100.0%) |
| 2 Unit Apartments | 0 (0.0%) | 0 (0.0%) |
| 3 or 4 Unit Apartments | 0 (0.0%) | 88 (100.0%) |
| 5 to 9 Unit Apartments | 0 (0.0%) | 157 (100.0%) |
| 10 or more Apartments | 0 (0.0%) | 0 (0.0%) |
| Mobile Home / Other | 30 (42.9%) | 40 (57.1%) |
| Total | 785 (64.7%) | 429 (35.3%) |
Housing Structures by Number of Rooms in Bamberg
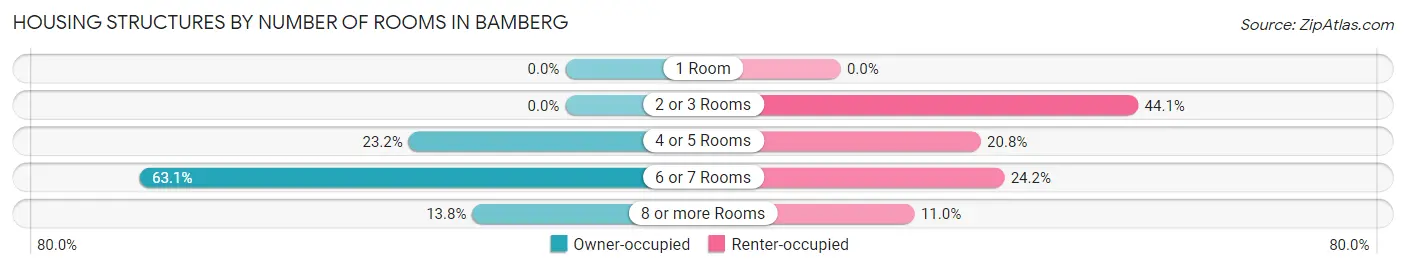
| Number of Rooms | Owner-occupied | Renter-occupied |
| 1 Room | 0 (0.0%) | 0 (0.0%) |
| 2 or 3 Rooms | 0 (0.0%) | 189 (44.1%) |
| 4 or 5 Rooms | 182 (23.2%) | 89 (20.7%) |
| 6 or 7 Rooms | 495 (63.1%) | 104 (24.2%) |
| 8 or more Rooms | 108 (13.8%) | 47 (11.0%) |
| Total | 785 (100.0%) | 429 (100.0%) |
Housing Structure by Heating Type in Bamberg
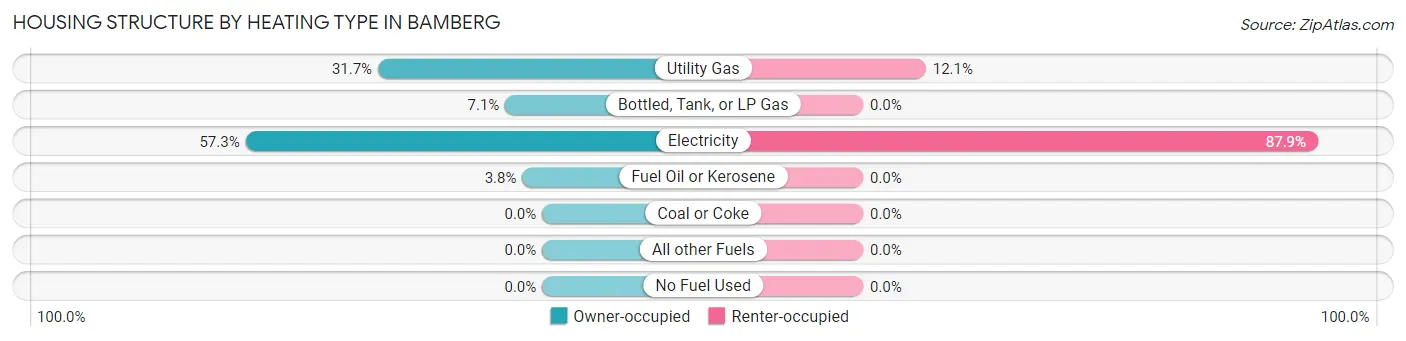
| Heating Type | Owner-occupied | Renter-occupied |
| Utility Gas | 249 (31.7%) | 52 (12.1%) |
| Bottled, Tank, or LP Gas | 56 (7.1%) | 0 (0.0%) |
| Electricity | 450 (57.3%) | 377 (87.9%) |
| Fuel Oil or Kerosene | 30 (3.8%) | 0 (0.0%) |
| Coal or Coke | 0 (0.0%) | 0 (0.0%) |
| All other Fuels | 0 (0.0%) | 0 (0.0%) |
| No Fuel Used | 0 (0.0%) | 0 (0.0%) |
| Total | 785 (100.0%) | 429 (100.0%) |
Household Vehicle Usage in Bamberg
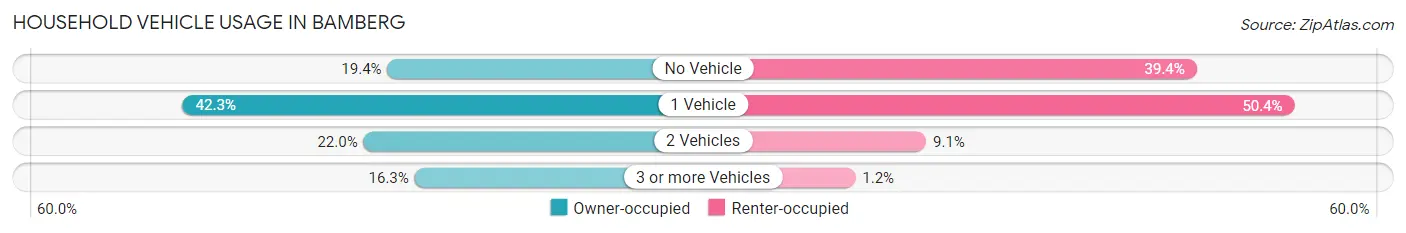
| Vehicles per Household | Owner-occupied | Renter-occupied |
| No Vehicle | 152 (19.4%) | 169 (39.4%) |
| 1 Vehicle | 332 (42.3%) | 216 (50.3%) |
| 2 Vehicles | 173 (22.0%) | 39 (9.1%) |
| 3 or more Vehicles | 128 (16.3%) | 5 (1.2%) |
| Total | 785 (100.0%) | 429 (100.0%) |
Real Estate & Mortgages in Bamberg
Real Estate and Mortgage Overview in Bamberg
| Characteristic | Without Mortgage | With Mortgage |
| Housing Units | 530 | 255 |
| Median Property Value | $83,600 | $135,000 |
| Median Household Income | $29,527 | $0 |
| Monthly Housing Costs | $438 | $0 |
| Real Estate Taxes | $751 | $27 |
Property Value by Mortgage Status in Bamberg
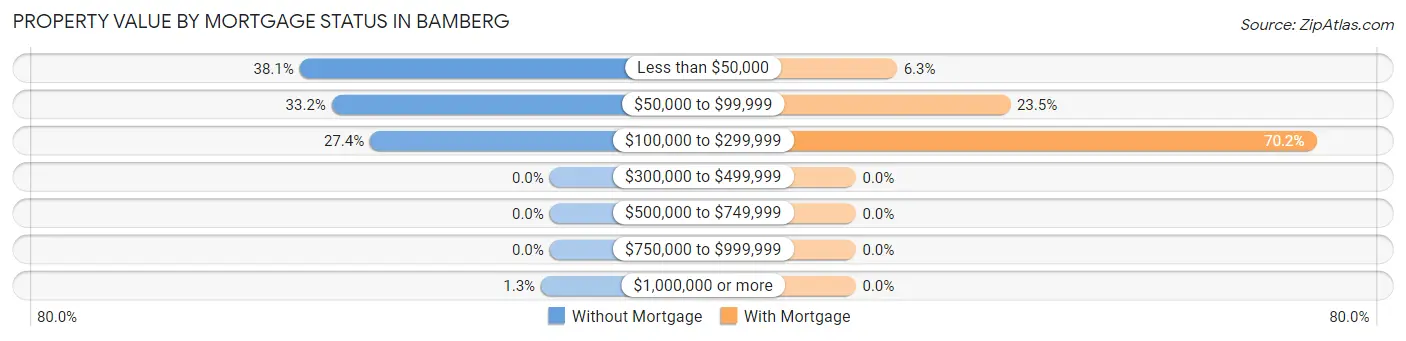
| Property Value | Without Mortgage | With Mortgage |
| Less than $50,000 | 202 (38.1%) | 16 (6.3%) |
| $50,000 to $99,999 | 176 (33.2%) | 60 (23.5%) |
| $100,000 to $299,999 | 145 (27.4%) | 179 (70.2%) |
| $300,000 to $499,999 | 0 (0.0%) | 0 (0.0%) |
| $500,000 to $749,999 | 0 (0.0%) | 0 (0.0%) |
| $750,000 to $999,999 | 0 (0.0%) | 0 (0.0%) |
| $1,000,000 or more | 7 (1.3%) | 0 (0.0%) |
| Total | 530 (100.0%) | 255 (100.0%) |
Household Income by Mortgage Status in Bamberg
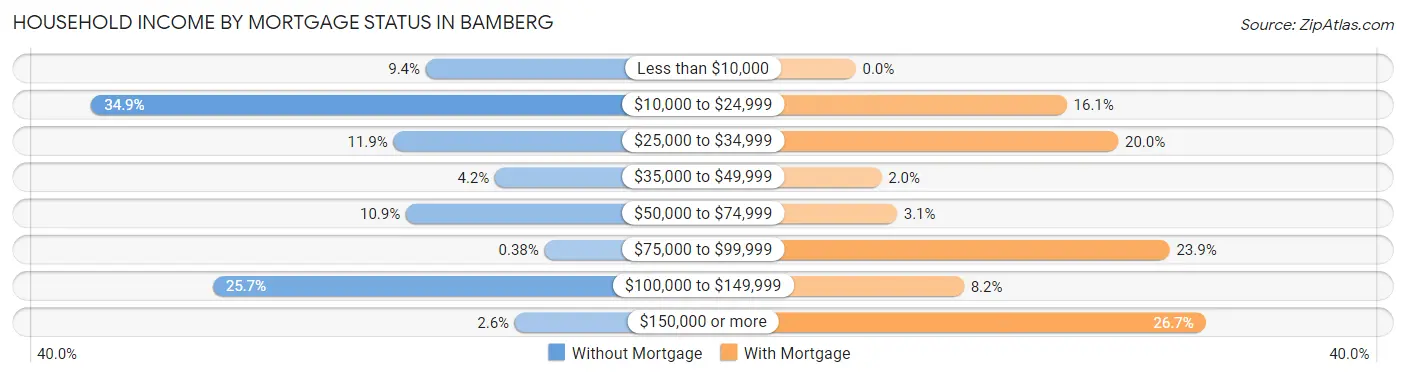
| Household Income | Without Mortgage | With Mortgage |
| Less than $10,000 | 50 (9.4%) | 0 (0.0%) |
| $10,000 to $24,999 | 185 (34.9%) | 41 (16.1%) |
| $25,000 to $34,999 | 63 (11.9%) | 51 (20.0%) |
| $35,000 to $49,999 | 22 (4.2%) | 5 (2.0%) |
| $50,000 to $74,999 | 58 (10.9%) | 8 (3.1%) |
| $75,000 to $99,999 | 2 (0.4%) | 61 (23.9%) |
| $100,000 to $149,999 | 136 (25.7%) | 21 (8.2%) |
| $150,000 or more | 14 (2.6%) | 68 (26.7%) |
| Total | 530 (100.0%) | 255 (100.0%) |
Property Value to Household Income Ratio in Bamberg
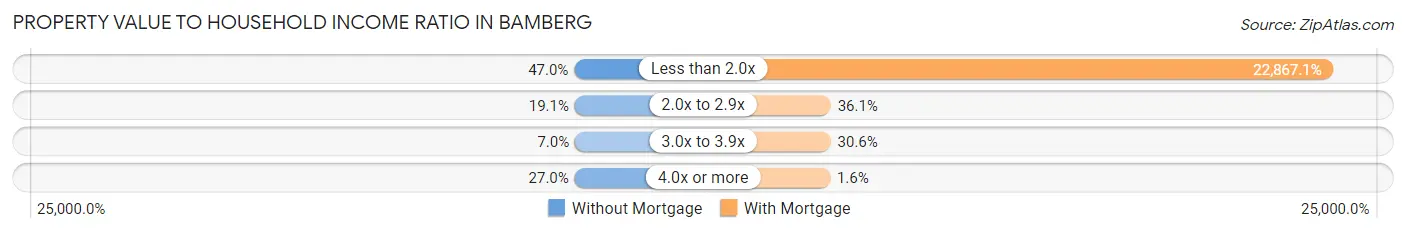
| Value-to-Income Ratio | Without Mortgage | With Mortgage |
| Less than 2.0x | 249 (47.0%) | 58,311 (22,867.1%) |
| 2.0x to 2.9x | 101 (19.1%) | 92 (36.1%) |
| 3.0x to 3.9x | 37 (7.0%) | 78 (30.6%) |
| 4.0x or more | 143 (27.0%) | 4 (1.6%) |
| Total | 530 (100.0%) | 255 (100.0%) |
Real Estate Taxes by Mortgage Status in Bamberg
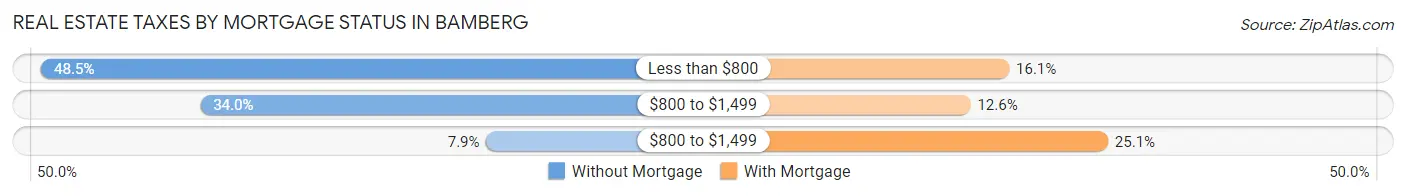
| Property Taxes | Without Mortgage | With Mortgage |
| Less than $800 | 257 (48.5%) | 41 (16.1%) |
| $800 to $1,499 | 180 (34.0%) | 32 (12.6%) |
| $800 to $1,499 | 42 (7.9%) | 64 (25.1%) |
| Total | 530 (100.0%) | 255 (100.0%) |
Health & Disability in Bamberg
Health Insurance Coverage by Age in Bamberg
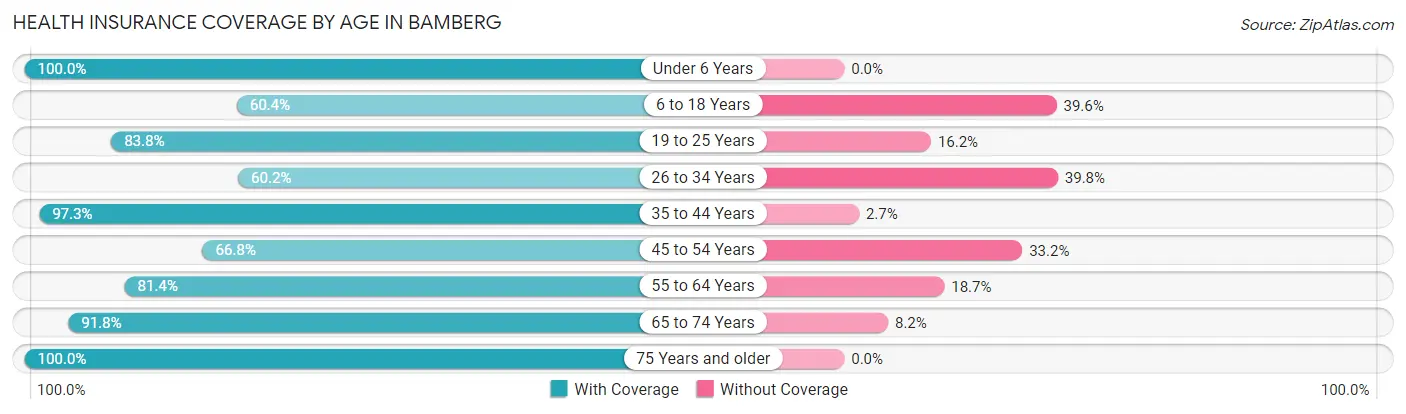
| Age Bracket | With Coverage | Without Coverage |
| Under 6 Years | 105 (100.0%) | 0 (0.0%) |
| 6 to 18 Years | 258 (60.4%) | 169 (39.6%) |
| 19 to 25 Years | 306 (83.8%) | 59 (16.2%) |
| 26 to 34 Years | 216 (60.2%) | 143 (39.8%) |
| 35 to 44 Years | 178 (97.3%) | 5 (2.7%) |
| 45 to 54 Years | 145 (66.8%) | 72 (33.2%) |
| 55 to 64 Years | 349 (81.4%) | 80 (18.6%) |
| 65 to 74 Years | 439 (91.8%) | 39 (8.2%) |
| 75 Years and older | 381 (100.0%) | 0 (0.0%) |
| Total | 2,377 (80.7%) | 567 (19.3%) |
Health Insurance Coverage by Citizenship Status in Bamberg
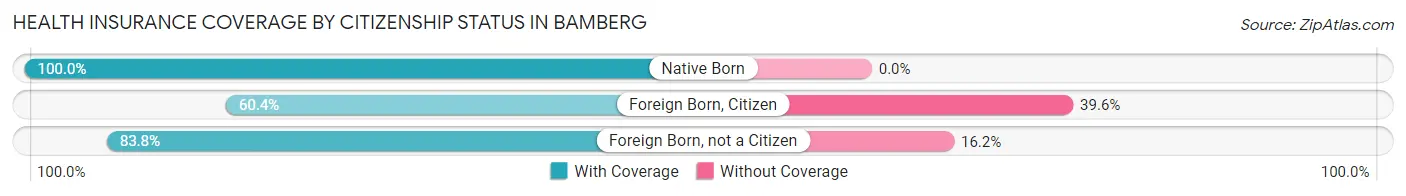
| Citizenship Status | With Coverage | Without Coverage |
| Native Born | 105 (100.0%) | 0 (0.0%) |
| Foreign Born, Citizen | 258 (60.4%) | 169 (39.6%) |
| Foreign Born, not a Citizen | 306 (83.8%) | 59 (16.2%) |
Health Insurance Coverage by Household Income in Bamberg
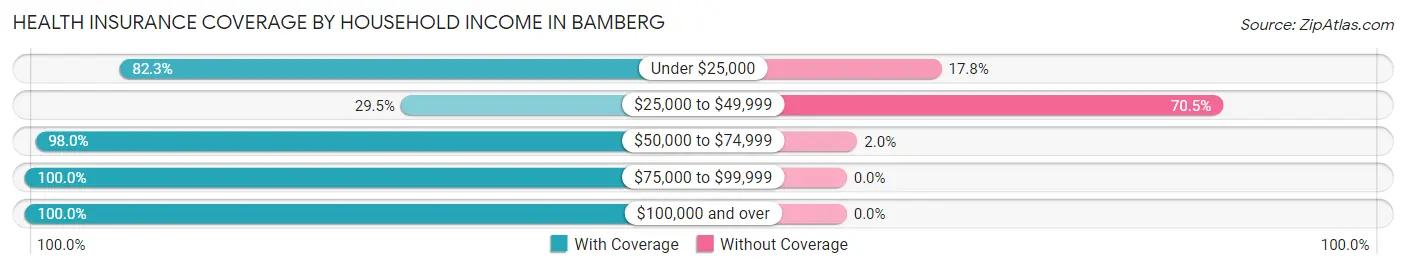
| Household Income | With Coverage | Without Coverage |
| Under $25,000 | 788 (82.3%) | 170 (17.7%) |
| $25,000 to $49,999 | 124 (29.5%) | 296 (70.5%) |
| $50,000 to $74,999 | 590 (98.0%) | 12 (2.0%) |
| $75,000 to $99,999 | 65 (100.0%) | 0 (0.0%) |
| $100,000 and over | 603 (100.0%) | 0 (0.0%) |
Public vs Private Health Insurance Coverage by Age in Bamberg
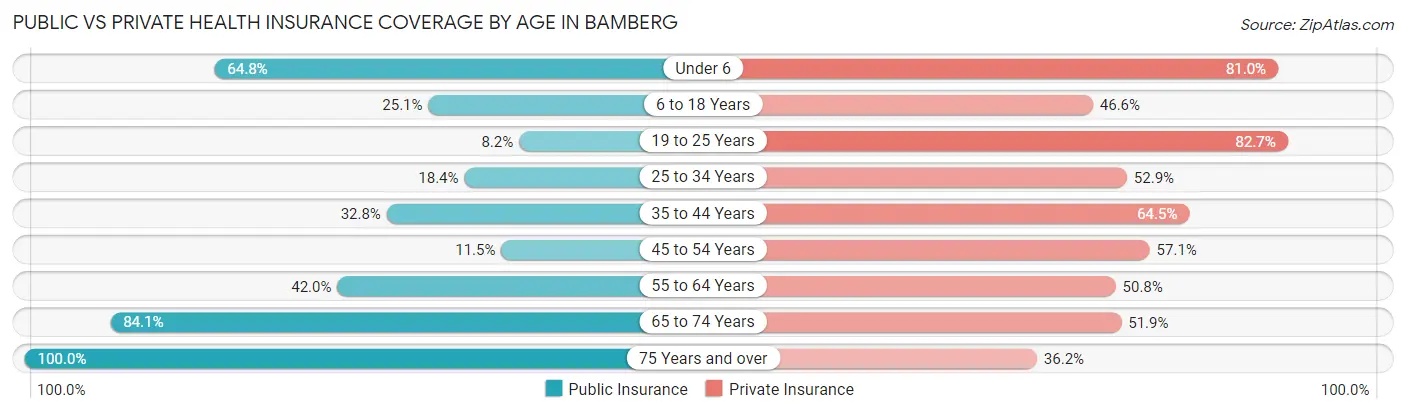
| Age Bracket | Public Insurance | Private Insurance |
| Under 6 | 68 (64.8%) | 85 (80.9%) |
| 6 to 18 Years | 107 (25.1%) | 199 (46.6%) |
| 19 to 25 Years | 30 (8.2%) | 302 (82.7%) |
| 25 to 34 Years | 66 (18.4%) | 190 (52.9%) |
| 35 to 44 Years | 60 (32.8%) | 118 (64.5%) |
| 45 to 54 Years | 25 (11.5%) | 124 (57.1%) |
| 55 to 64 Years | 180 (42.0%) | 218 (50.8%) |
| 65 to 74 Years | 402 (84.1%) | 248 (51.9%) |
| 75 Years and over | 381 (100.0%) | 138 (36.2%) |
| Total | 1,319 (44.8%) | 1,622 (55.1%) |
Disability Status by Sex by Age in Bamberg
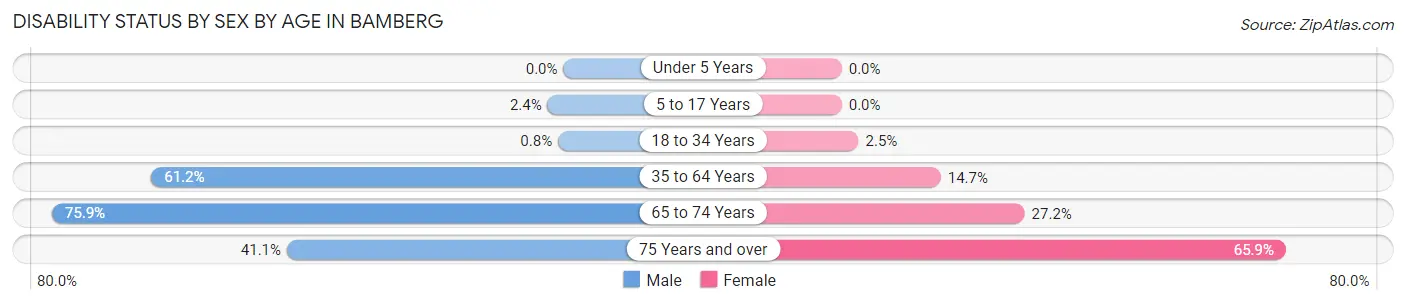
| Age Bracket | Male | Female |
| Under 5 Years | 0 (0.0%) | 0 (0.0%) |
| 5 to 17 Years | 4 (2.4%) | 0 (0.0%) |
| 18 to 34 Years | 4 (0.8%) | 6 (2.5%) |
| 35 to 64 Years | 145 (61.2%) | 87 (14.7%) |
| 65 to 74 Years | 142 (75.9%) | 79 (27.2%) |
| 75 Years and over | 101 (41.1%) | 89 (65.9%) |
Disability Class by Sex by Age in Bamberg
Disability Class: Hearing Difficulty
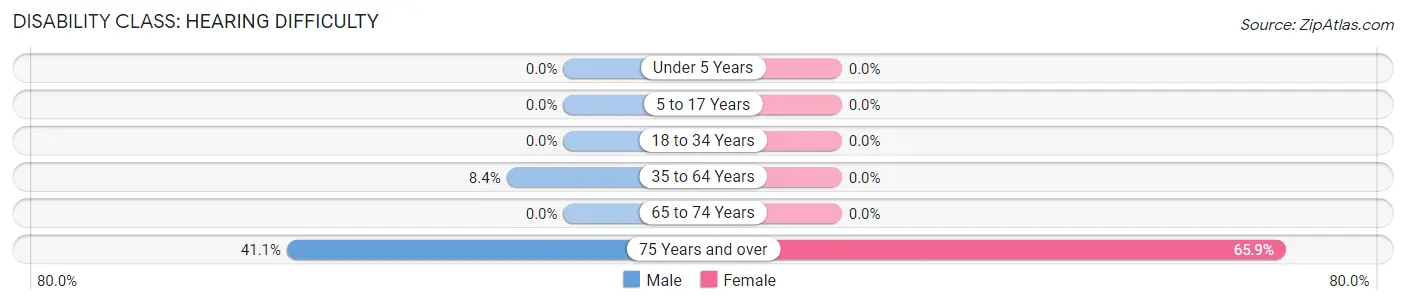
| Age Bracket | Male | Female |
| Under 5 Years | 0 (0.0%) | 0 (0.0%) |
| 5 to 17 Years | 0 (0.0%) | 0 (0.0%) |
| 18 to 34 Years | 0 (0.0%) | 0 (0.0%) |
| 35 to 64 Years | 20 (8.4%) | 0 (0.0%) |
| 65 to 74 Years | 0 (0.0%) | 0 (0.0%) |
| 75 Years and over | 101 (41.1%) | 89 (65.9%) |
Disability Class: Vision Difficulty
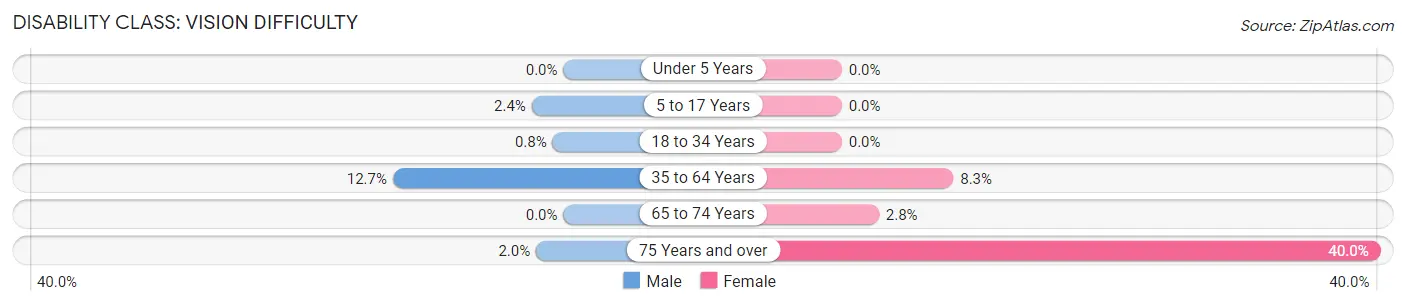
| Age Bracket | Male | Female |
| Under 5 Years | 0 (0.0%) | 0 (0.0%) |
| 5 to 17 Years | 4 (2.4%) | 0 (0.0%) |
| 18 to 34 Years | 4 (0.8%) | 0 (0.0%) |
| 35 to 64 Years | 30 (12.7%) | 49 (8.3%) |
| 65 to 74 Years | 0 (0.0%) | 8 (2.8%) |
| 75 Years and over | 5 (2.0%) | 54 (40.0%) |
Disability Class: Cognitive Difficulty
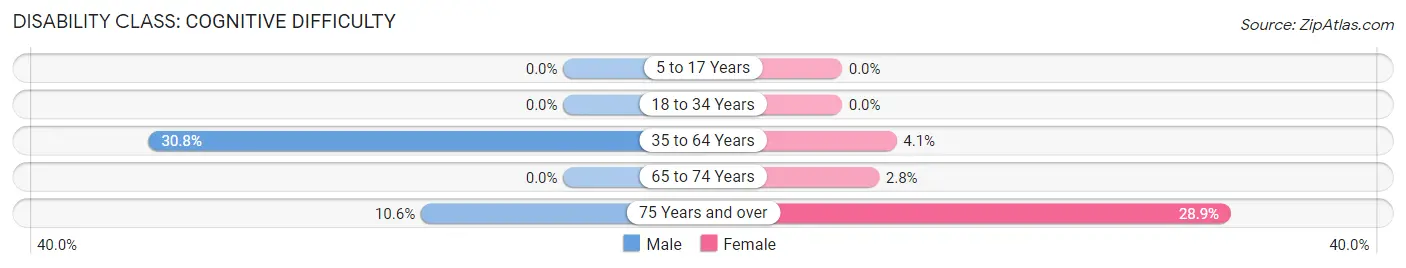
| Age Bracket | Male | Female |
| 5 to 17 Years | 0 (0.0%) | 0 (0.0%) |
| 18 to 34 Years | 0 (0.0%) | 0 (0.0%) |
| 35 to 64 Years | 73 (30.8%) | 24 (4.1%) |
| 65 to 74 Years | 0 (0.0%) | 8 (2.8%) |
| 75 Years and over | 26 (10.6%) | 39 (28.9%) |
Disability Class: Ambulatory Difficulty
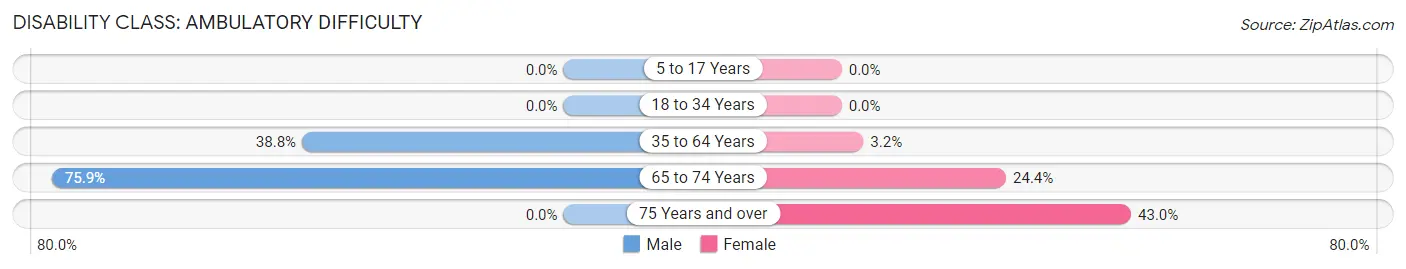
| Age Bracket | Male | Female |
| 5 to 17 Years | 0 (0.0%) | 0 (0.0%) |
| 18 to 34 Years | 0 (0.0%) | 0 (0.0%) |
| 35 to 64 Years | 92 (38.8%) | 19 (3.2%) |
| 65 to 74 Years | 142 (75.9%) | 71 (24.4%) |
| 75 Years and over | 0 (0.0%) | 58 (43.0%) |
Disability Class: Self-Care Difficulty
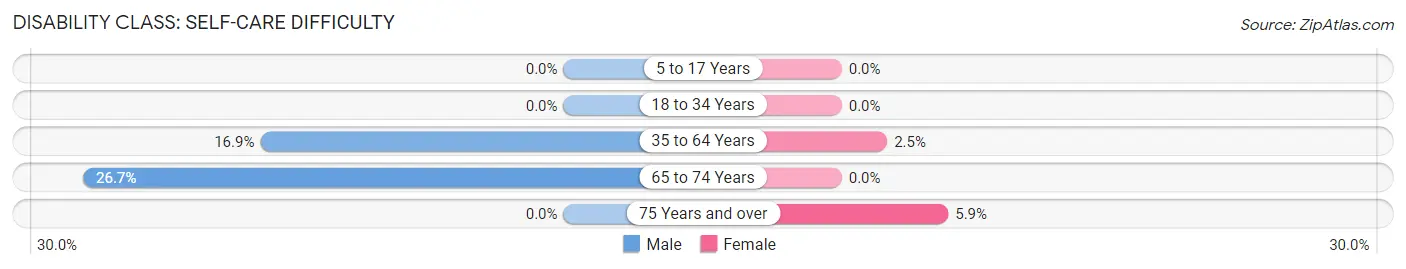
| Age Bracket | Male | Female |
| 5 to 17 Years | 0 (0.0%) | 0 (0.0%) |
| 18 to 34 Years | 0 (0.0%) | 0 (0.0%) |
| 35 to 64 Years | 40 (16.9%) | 15 (2.5%) |
| 65 to 74 Years | 50 (26.7%) | 0 (0.0%) |
| 75 Years and over | 0 (0.0%) | 8 (5.9%) |
Technology Access in Bamberg
Computing Device Access in Bamberg
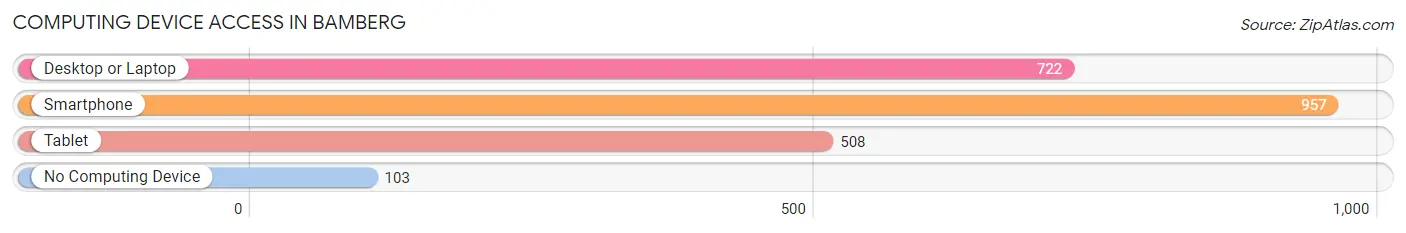
| Device Type | # Households | % Households |
| Desktop or Laptop | 722 | 59.5% |
| Smartphone | 957 | 78.8% |
| Tablet | 508 | 41.8% |
| No Computing Device | 103 | 8.5% |
| Total | 1,214 | 100.0% |
Internet Access in Bamberg
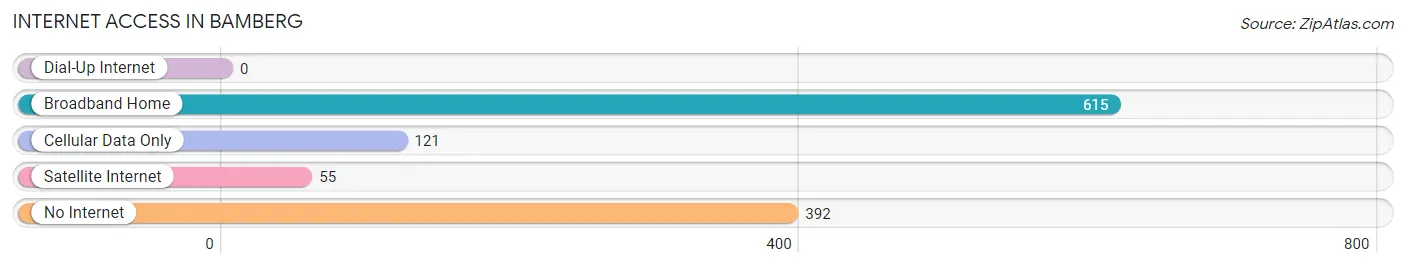
| Internet Type | # Households | % Households |
| Dial-Up Internet | 0 | 0.0% |
| Broadband Home | 615 | 50.7% |
| Cellular Data Only | 121 | 10.0% |
| Satellite Internet | 55 | 4.5% |
| No Internet | 392 | 32.3% |
| Total | 1,214 | 100.0% |
Bamberg Summary
Bamberg is a small city located in the state of South Carolina, United States. It is the county seat of Bamberg County and is situated in the heart of the South Carolina Lowcountry. The city has a population of 3,073 as of the 2010 census.
Geography
Bamberg is located in the Piedmont region of South Carolina, approximately halfway between Columbia and Charleston. It is situated on the banks of the Edisto River, which flows through the city. The city is surrounded by rural farmland and is located in the heart of the South Carolina Lowcountry. The city has a total area of 2.2 square miles, all of which is land.
History
Bamberg was founded in 1787 by German immigrants who had settled in the area. The city was named after the city of Bamberg in Germany. The city was incorporated in 1891 and has remained a small, rural community ever since.
Economy
Bamberg’s economy is largely based on agriculture and manufacturing. The city is home to several large poultry processing plants, as well as a number of smaller businesses. The city is also home to a number of small retail stores and restaurants.
Demographics
As of the 2010 census, Bamberg had a population of 3,073. The racial makeup of the city was 57.3% White, 39.2% African American, 0.3% Native American, 0.7% Asian, 0.1% Pacific Islander, 1.2% from other races, and 1.2% from two or more races. Hispanic or Latino of any race were 2.3% of the population.
The median income for a household in the city was $27,917, and the median income for a family was $35,625. The per capita income for the city was $14,945. About 22.2% of families and 25.2% of the population were below the poverty line, including 36.2% of those under age 18 and 16.2% of those age 65 or over.
Conclusion
Bamberg is a small city located in the state of South Carolina, United States. It is the county seat of Bamberg County and is situated in the heart of the South Carolina Lowcountry. The city has a population of 3,073 as of the 2010 census. The city’s economy is largely based on agriculture and manufacturing, and it is home to several large poultry processing plants, as well as a number of smaller businesses. The racial makeup of the city is 57.3% White, 39.2% African American, 0.3% Native American, 0.7% Asian, 0.1% Pacific Islander, 1.2% from other races, and 1.2% from two or more races. The median income for a household in the city was $27,917, and the median income for a family was $35,625. About 22.2% of families and 25.2% of the population were below the poverty line.
Common Questions
What is Per Capita Income in Bamberg?
Per Capita income in Bamberg is $20,707.
What is the Median Family Income in Bamberg?
Median Family Income in Bamberg is $58,838.
What is the Median Household income in Bamberg?
Median Household Income in Bamberg is $27,021.
What is Income or Wage Gap in Bamberg?
Income or Wage Gap in Bamberg is 89.9%.
Women in Bamberg earn 10.1 cents for every dollar earned by a man.
What is Inequality or Gini Index in Bamberg?
Inequality or Gini Index in Bamberg is 0.49.
What is the Total Population of Bamberg?
Total Population of Bamberg is 3,074.
What is the Total Male Population of Bamberg?
Total Male Population of Bamberg is 1,430.
What is the Total Female Population of Bamberg?
Total Female Population of Bamberg is 1,644.
What is the Ratio of Males per 100 Females in Bamberg?
There are 86.98 Males per 100 Females in Bamberg.
What is the Ratio of Females per 100 Males in Bamberg?
There are 114.97 Females per 100 Males in Bamberg.
What is the Median Population Age in Bamberg?
Median Population Age in Bamberg is 47.7 Years.
What is the Average Family Size in Bamberg
Average Family Size in Bamberg is 3.5 People.
What is the Average Household Size in Bamberg
Average Household Size in Bamberg is 2.2 People.
How Large is the Labor Force in Bamberg?
There are 1,163 People in the Labor Forcein in Bamberg.
What is the Percentage of People in the Labor Force in Bamberg?
44.4% of People are in the Labor Force in Bamberg.
What is the Unemployment Rate in Bamberg?
Unemployment Rate in Bamberg is 11.1%.