Springfield, SC Map & Demographics
Springfield Map
Springfield Overview
$18,076
PER CAPITA INCOME
$44,722
AVG FAMILY INCOME
$32,266
AVG HOUSEHOLD INCOME
32.3%
WAGE / INCOME GAP [ % ]
67.7¢/ $1
WAGE / INCOME GAP [ $ ]
0.49
INEQUALITY / GINI INDEX
482
TOTAL POPULATION
274
MALE POPULATION
208
FEMALE POPULATION
131.73
MALES / 100 FEMALES
75.91
FEMALES / 100 MALES
35.6
MEDIAN AGE
4.1
AVG FAMILY SIZE
2.9
AVG HOUSEHOLD SIZE
151
LABOR FORCE [ PEOPLE ]
42.1%
PERCENT IN LABOR FORCE
10.6%
UNEMPLOYMENT RATE
Springfield Zip Codes
Springfield Area Codes
Income in Springfield
Income Overview in Springfield
Per Capita Income in Springfield is $18,076, while median incomes of families and households are $44,722 and $32,266 respectively.
| Characteristic | Number | Measure |
| Per Capita Income | 482 | $18,076 |
| Median Family Income | 102 | $44,722 |
| Mean Family Income | 102 | $60,054 |
| Median Household Income | 165 | $32,266 |
| Mean Household Income | 165 | $48,291 |
| Income Deficit | 102 | $0 |
| Wage / Income Gap (%) | 482 | 32.27% |
| Wage / Income Gap ($) | 482 | 67.73¢ per $1 |
| Gini / Inequality Index | 482 | 0.49 |
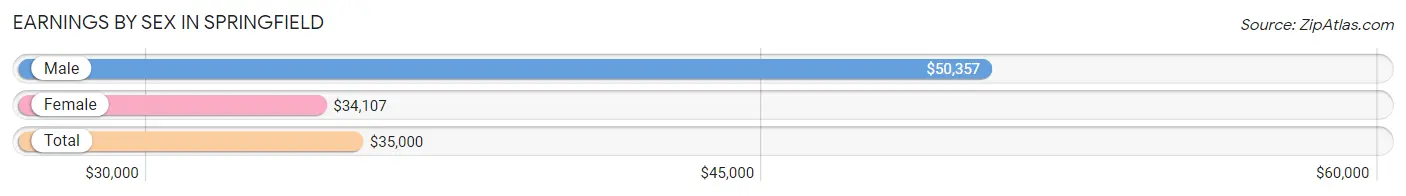
Earnings by Sex in Springfield
Average Earnings in Springfield are $35,000, $50,357 for men and $34,107 for women, a difference of 32.3%.
| Sex | Number | Average Earnings |
| Male | 74 (45.7%) | $50,357 |
| Female | 88 (54.3%) | $34,107 |
| Total | 162 (100.0%) | $35,000 |
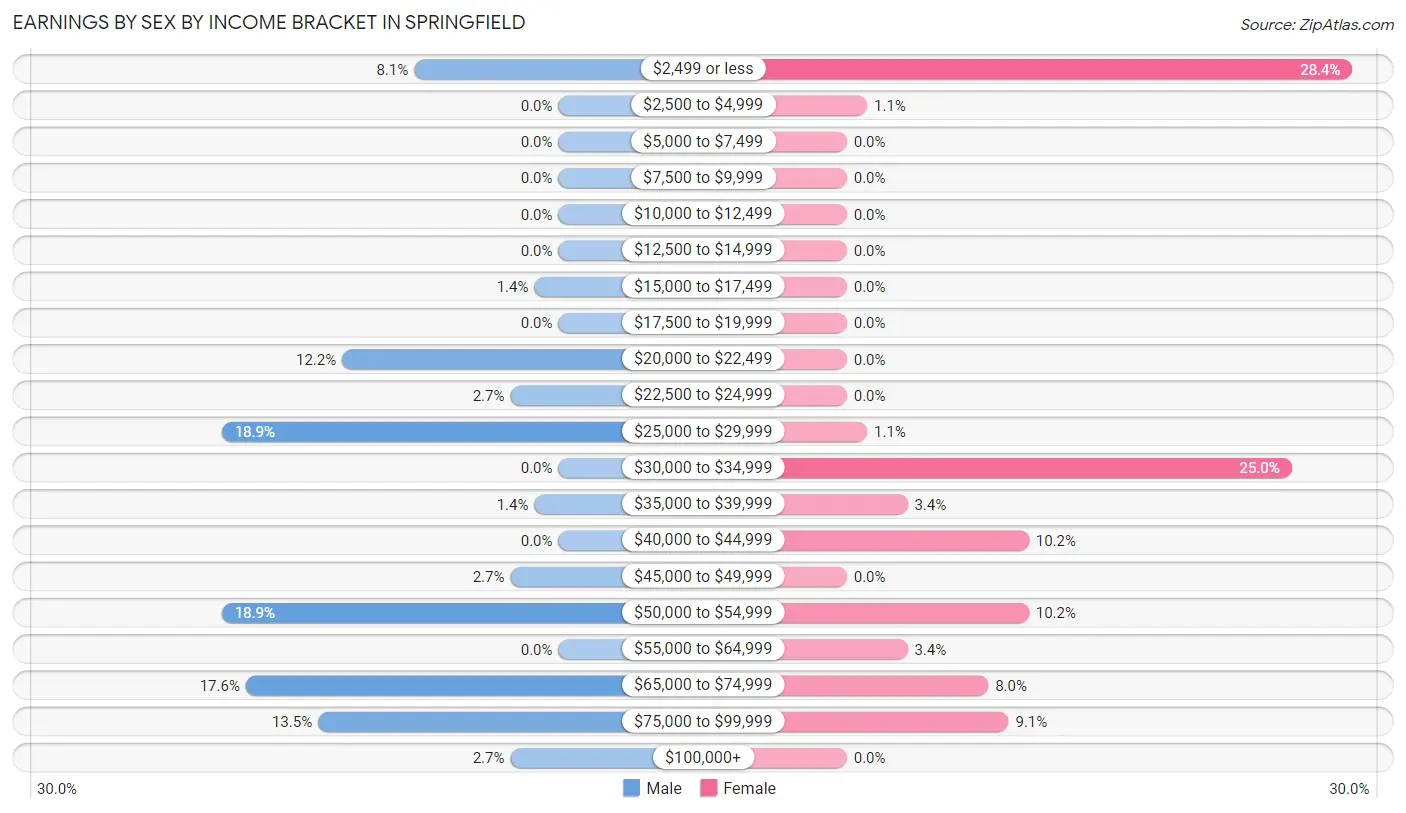
Earnings by Sex by Income Bracket in Springfield
The most common earnings brackets in Springfield are $25,000 to $29,999 for men (14 | 18.9%) and $2,499 or less for women (25 | 28.4%).
| Income | Male | Female |
| $2,499 or less | 6 (8.1%) | 25 (28.4%) |
| $2,500 to $4,999 | 0 (0.0%) | 1 (1.1%) |
| $5,000 to $7,499 | 0 (0.0%) | 0 (0.0%) |
| $7,500 to $9,999 | 0 (0.0%) | 0 (0.0%) |
| $10,000 to $12,499 | 0 (0.0%) | 0 (0.0%) |
| $12,500 to $14,999 | 0 (0.0%) | 0 (0.0%) |
| $15,000 to $17,499 | 1 (1.3%) | 0 (0.0%) |
| $17,500 to $19,999 | 0 (0.0%) | 0 (0.0%) |
| $20,000 to $22,499 | 9 (12.2%) | 0 (0.0%) |
| $22,500 to $24,999 | 2 (2.7%) | 0 (0.0%) |
| $25,000 to $29,999 | 14 (18.9%) | 1 (1.1%) |
| $30,000 to $34,999 | 0 (0.0%) | 22 (25.0%) |
| $35,000 to $39,999 | 1 (1.3%) | 3 (3.4%) |
| $40,000 to $44,999 | 0 (0.0%) | 9 (10.2%) |
| $45,000 to $49,999 | 2 (2.7%) | 0 (0.0%) |
| $50,000 to $54,999 | 14 (18.9%) | 9 (10.2%) |
| $55,000 to $64,999 | 0 (0.0%) | 3 (3.4%) |
| $65,000 to $74,999 | 13 (17.6%) | 7 (8.0%) |
| $75,000 to $99,999 | 10 (13.5%) | 8 (9.1%) |
| $100,000+ | 2 (2.7%) | 0 (0.0%) |
| Total | 74 (100.0%) | 88 (100.0%) |
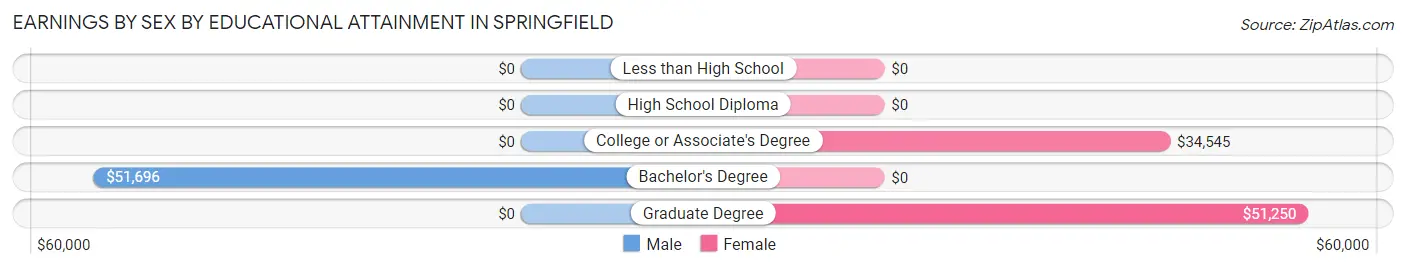
Earnings by Sex by Educational Attainment in Springfield
Average earnings in Springfield are $51,786 for men and $43,333 for women, a difference of 16.3%. Men with an educational attainment of bachelor's degree enjoy the highest average annual earnings of $51,696, while those with bachelor's degree education earn the least with $51,696. Women with an educational attainment of graduate degree earn the most with the average annual earnings of $51,250, while those with college or associate's degree education have the smallest earnings of $34,545.
| Educational Attainment | Male Income | Female Income |
| Less than High School | - | - |
| High School Diploma | - | - |
| College or Associate's Degree | - | - |
| Bachelor's Degree | $51,696 | $0 |
| Graduate Degree | - | - |
| Total | $51,786 | $43,333 |
Family Income in Springfield
Family Income Brackets in Springfield
According to the Springfield family income data, there are 23 families falling into the $35,000 to $49,999 income range, which is the most common income bracket and makes up 22.6% of all families.
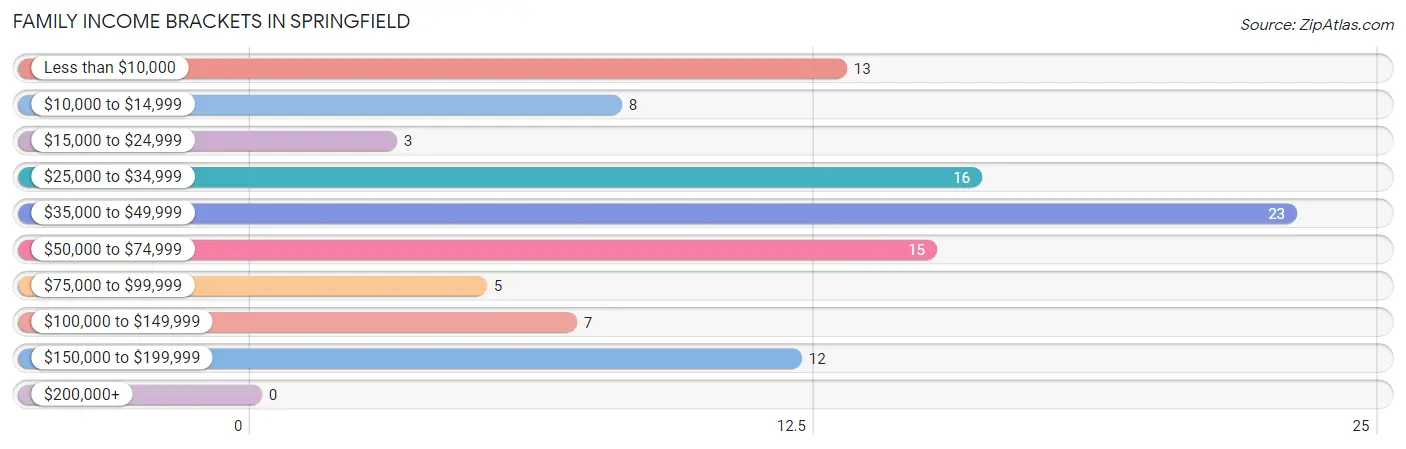
| Income Bracket | # Families | % Families |
| Less than $10,000 | 13 | 12.7% |
| $10,000 to $14,999 | 8 | 7.8% |
| $15,000 to $24,999 | 3 | 2.9% |
| $25,000 to $34,999 | 16 | 15.7% |
| $35,000 to $49,999 | 23 | 22.5% |
| $50,000 to $74,999 | 15 | 14.7% |
| $75,000 to $99,999 | 5 | 4.9% |
| $100,000 to $149,999 | 7 | 6.9% |
| $150,000 to $199,999 | 12 | 11.8% |
| $200,000+ | 0 | 0.0% |
Family Income by Famaliy Size in Springfield
3-person families (8 | 7.8%) account for the highest median family income in Springfield with $98,750 per family, while 3-person families (8 | 7.8%) have the highest median income of $32,917 per family member.
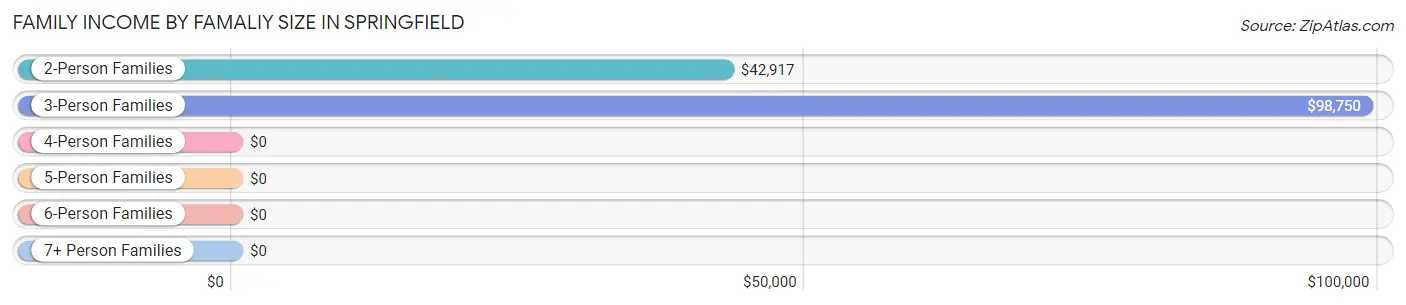
| Income Bracket | # Families | Median Income |
| 2-Person Families | 47 (46.1%) | $42,917 |
| 3-Person Families | 8 (7.8%) | $98,750 |
| 4-Person Families | 17 (16.7%) | $0 |
| 5-Person Families | 30 (29.4%) | $0 |
| 6-Person Families | 0 (0.0%) | $0 |
| 7+ Person Families | 0 (0.0%) | $0 |
| Total | 102 (100.0%) | $44,722 |
Family Income by Number of Earners in Springfield
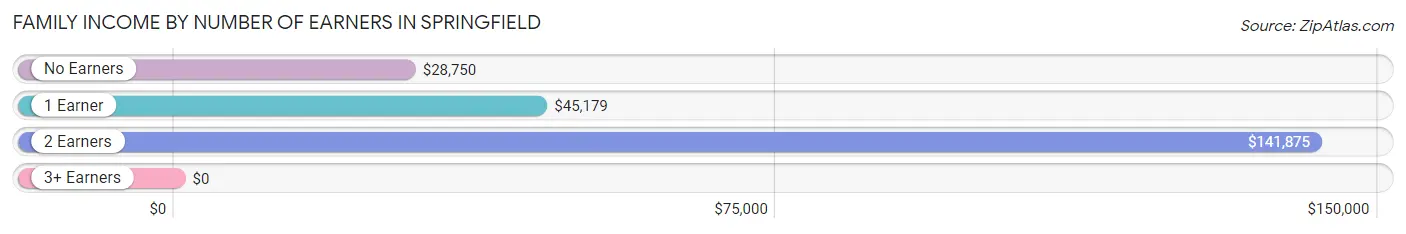
| Number of Earners | # Families | Median Income |
| No Earners | 42 (41.2%) | $28,750 |
| 1 Earner | 35 (34.3%) | $45,179 |
| 2 Earners | 16 (15.7%) | $141,875 |
| 3+ Earners | 9 (8.8%) | $0 |
| Total | 102 (100.0%) | $44,722 |
Household Income in Springfield
Household Income Brackets in Springfield
With 32 households falling in the category, the $35,000 to $49,999 income range is the most frequent in Springfield, accounting for 19.4% of all households.
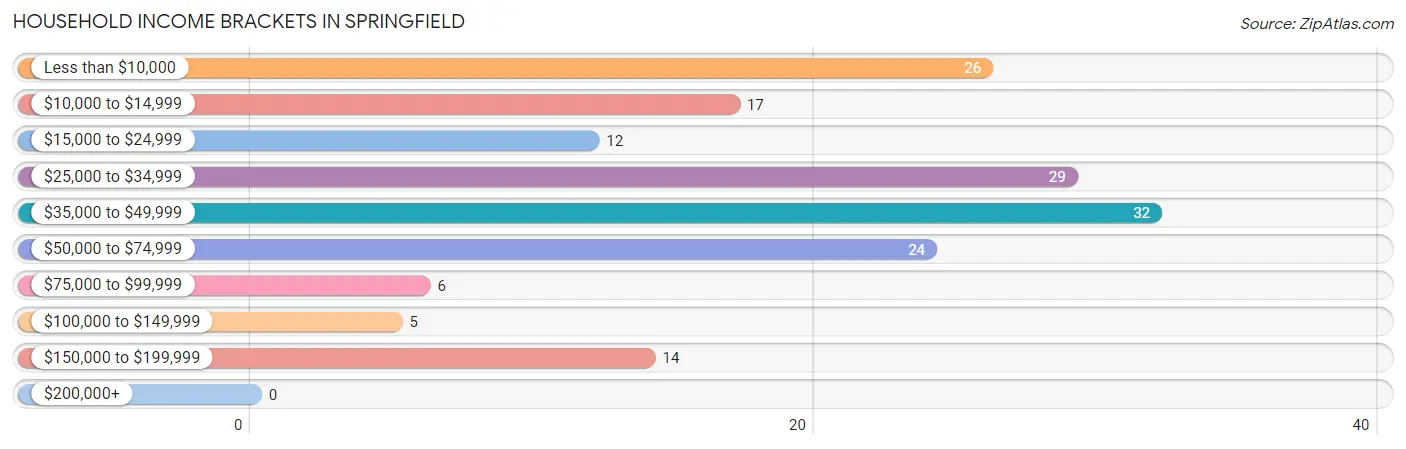
| Income Bracket | # Households | % Households |
| Less than $10,000 | 26 | 15.8% |
| $10,000 to $14,999 | 17 | 10.3% |
| $15,000 to $24,999 | 12 | 7.3% |
| $25,000 to $34,999 | 29 | 17.6% |
| $35,000 to $49,999 | 32 | 19.4% |
| $50,000 to $74,999 | 24 | 14.5% |
| $75,000 to $99,999 | 6 | 3.6% |
| $100,000 to $149,999 | 5 | 3.0% |
| $150,000 to $199,999 | 14 | 8.5% |
| $200,000+ | 0 | 0.0% |
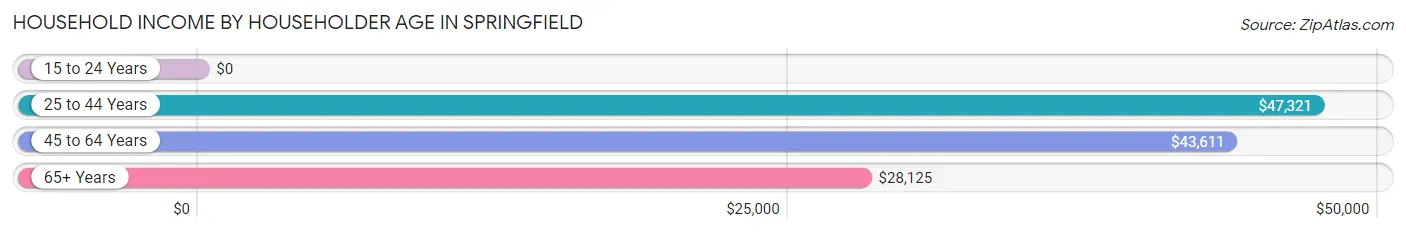
Household Income by Householder Age in Springfield
The median household income in Springfield is $32,266, with the highest median household income of $47,321 found in the 25 to 44 years age bracket for the primary householder. A total of 31 households (18.8%) fall into this category. Meanwhile, the 15 to 24 years age bracket for the primary householder has the lowest median household income of $0, with 1 households (0.6%) in this group.
| Income Bracket | # Households | Median Income |
| 15 to 24 Years | 1 (0.6%) | $0 |
| 25 to 44 Years | 31 (18.8%) | $47,321 |
| 45 to 64 Years | 70 (42.4%) | $43,611 |
| 65+ Years | 63 (38.2%) | $28,125 |
| Total | 165 (100.0%) | $32,266 |
Poverty in Springfield
Income Below Poverty by Sex and Age in Springfield
With 41.2% poverty level for males and 28.8% for females among the residents of Springfield, under 5 year old males and 18 to 24 year old females are the most vulnerable to poverty, with 61 males (89.7%) and 18 females (81.8%) in their respective age groups living below the poverty level.
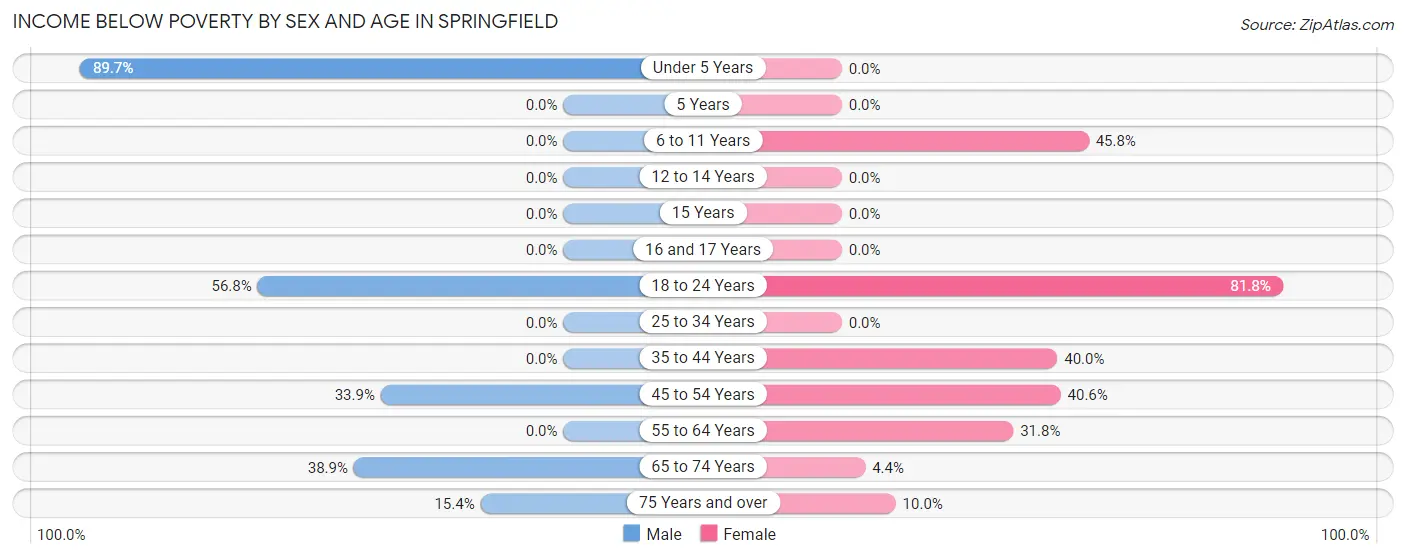
| Age Bracket | Male | Female |
| Under 5 Years | 61 (89.7%) | 0 (0.0%) |
| 5 Years | 0 (0.0%) | 0 (0.0%) |
| 6 to 11 Years | 0 (0.0%) | 11 (45.8%) |
| 12 to 14 Years | 0 (0.0%) | 0 (0.0%) |
| 15 Years | 0 (0.0%) | 0 (0.0%) |
| 16 and 17 Years | 0 (0.0%) | 0 (0.0%) |
| 18 to 24 Years | 21 (56.8%) | 18 (81.8%) |
| 25 to 34 Years | 0 (0.0%) | 0 (0.0%) |
| 35 to 44 Years | 0 (0.0%) | 8 (40.0%) |
| 45 to 54 Years | 20 (33.9%) | 13 (40.6%) |
| 55 to 64 Years | 0 (0.0%) | 7 (31.8%) |
| 65 to 74 Years | 7 (38.9%) | 1 (4.3%) |
| 75 Years and over | 4 (15.4%) | 2 (10.0%) |
| Total | 113 (41.2%) | 60 (28.8%) |
Income Above Poverty by Sex and Age in Springfield
According to the poverty statistics in Springfield, males aged 6 to 11 years and females aged under 5 years are the age groups that are most secure financially, with 100.0% of males and 100.0% of females in these age groups living above the poverty line.
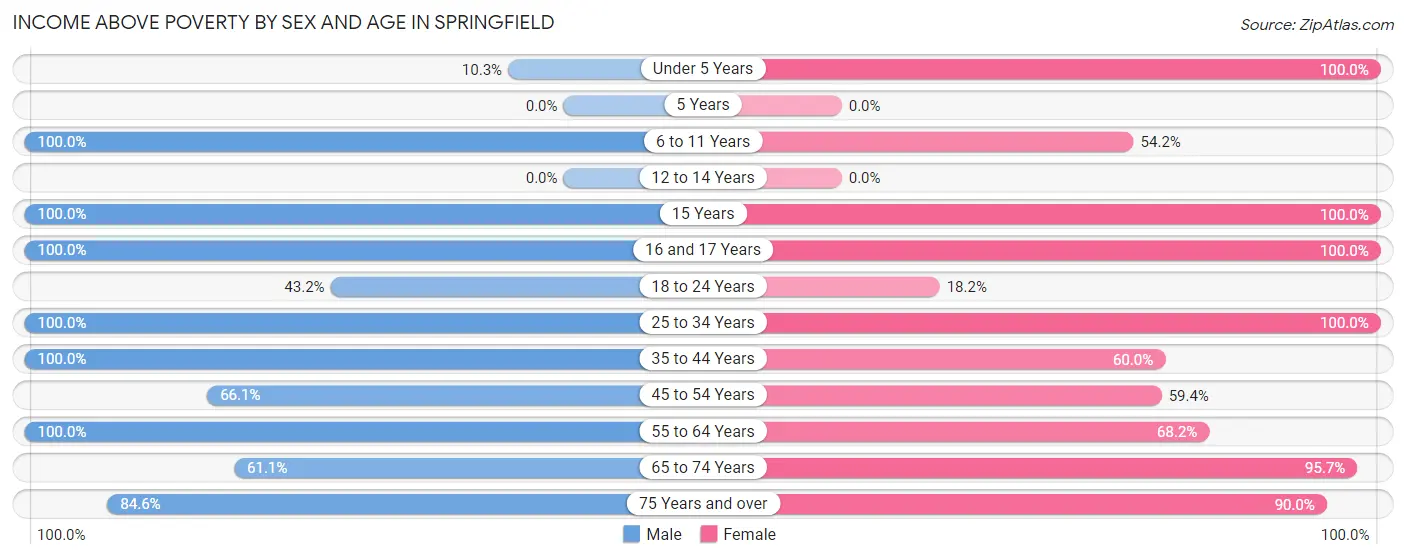
| Age Bracket | Male | Female |
| Under 5 Years | 7 (10.3%) | 9 (100.0%) |
| 5 Years | 0 (0.0%) | 0 (0.0%) |
| 6 to 11 Years | 11 (100.0%) | 13 (54.2%) |
| 12 to 14 Years | 0 (0.0%) | 0 (0.0%) |
| 15 Years | 5 (100.0%) | 6 (100.0%) |
| 16 and 17 Years | 5 (100.0%) | 11 (100.0%) |
| 18 to 24 Years | 16 (43.2%) | 4 (18.2%) |
| 25 to 34 Years | 19 (100.0%) | 19 (100.0%) |
| 35 to 44 Years | 5 (100.0%) | 12 (60.0%) |
| 45 to 54 Years | 39 (66.1%) | 19 (59.4%) |
| 55 to 64 Years | 21 (100.0%) | 15 (68.2%) |
| 65 to 74 Years | 11 (61.1%) | 22 (95.7%) |
| 75 Years and over | 22 (84.6%) | 18 (90.0%) |
| Total | 161 (58.8%) | 148 (71.2%) |
Income Below Poverty Among Married-Couple Families in Springfield
The poverty statistics for married-couple families in Springfield show that 17.3% or 13 of the total 75 families live below the poverty line. Families with 1 or 2 children have the highest poverty rate of 52.0%, comprising of 13 families. On the other hand, families with no children have the lowest poverty rate of 0.0%, which includes 0 families.
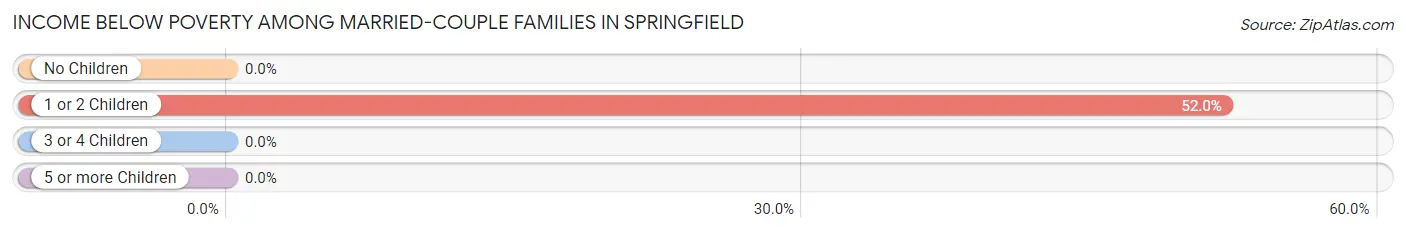
| Children | Above Poverty | Below Poverty |
| No Children | 44 (100.0%) | 0 (0.0%) |
| 1 or 2 Children | 12 (48.0%) | 13 (52.0%) |
| 3 or 4 Children | 6 (100.0%) | 0 (0.0%) |
| 5 or more Children | 0 (0.0%) | 0 (0.0%) |
| Total | 62 (82.7%) | 13 (17.3%) |
Income Below Poverty Among Single-Parent Households in Springfield
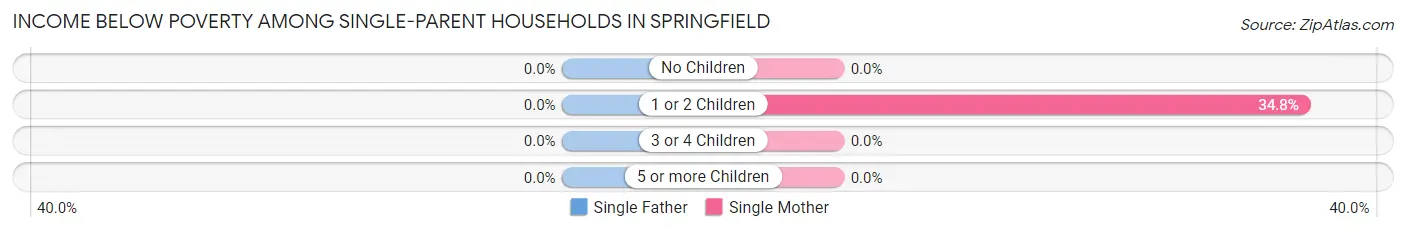
| Children | Single Father | Single Mother |
| No Children | 0 (0.0%) | 0 (0.0%) |
| 1 or 2 Children | 0 (0.0%) | 8 (34.8%) |
| 3 or 4 Children | 0 (0.0%) | 0 (0.0%) |
| 5 or more Children | 0 (0.0%) | 0 (0.0%) |
| Total | 0 (0.0%) | 8 (34.8%) |
Income Below Poverty Among Married-Couple vs Single-Parent Households in Springfield
The poverty data for Springfield shows that 13 of the married-couple family households (17.3%) and 8 of the single-parent households (29.6%) are living below the poverty level. Within the married-couple family households, those with 1 or 2 children have the highest poverty rate, with 13 households (52.0%) falling below the poverty line. Among the single-parent households, those with 1 or 2 children have the highest poverty rate, with 8 household (29.6%) living below poverty.
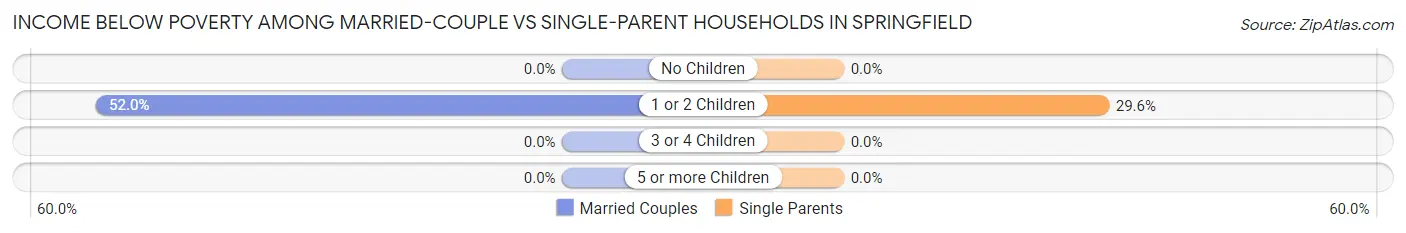
| Children | Married-Couple Families | Single-Parent Households |
| No Children | 0 (0.0%) | 0 (0.0%) |
| 1 or 2 Children | 13 (52.0%) | 8 (29.6%) |
| 3 or 4 Children | 0 (0.0%) | 0 (0.0%) |
| 5 or more Children | 0 (0.0%) | 0 (0.0%) |
| Total | 13 (17.3%) | 8 (29.6%) |
Race in Springfield
The most populous races in Springfield are Black / African American (262 | 54.4%), White / Caucasian (206 | 42.7%), and Native / Alaskan (10 | 2.1%).
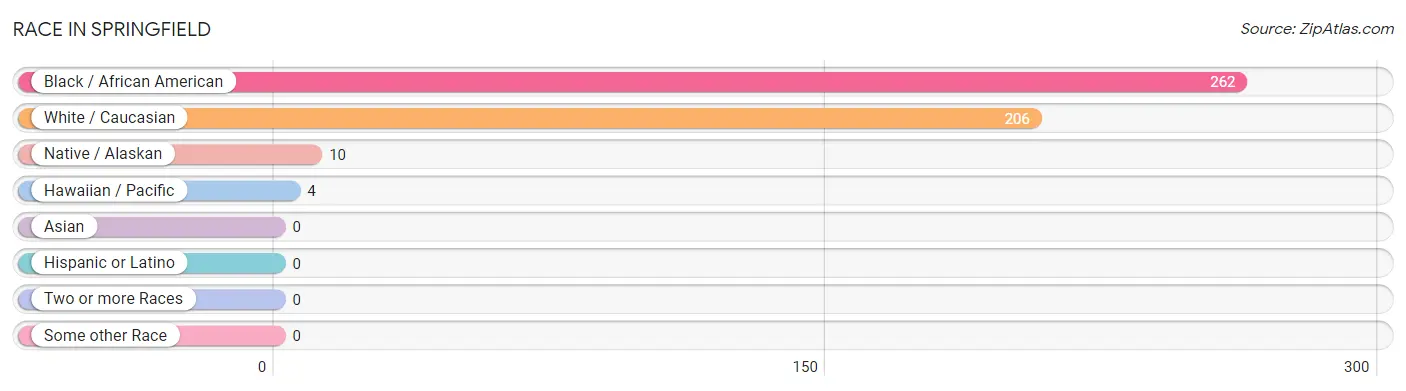
| Race | # Population | % Population |
| Asian | 0 | 0.0% |
| Black / African American | 262 | 54.4% |
| Hawaiian / Pacific | 4 | 0.8% |
| Hispanic or Latino | 0 | 0.0% |
| Native / Alaskan | 10 | 2.1% |
| White / Caucasian | 206 | 42.7% |
| Two or more Races | 0 | 0.0% |
| Some other Race | 0 | 0.0% |
| Total | 482 | 100.0% |
Ancestry in Springfield
The most populous ancestries reported in Springfield are American (23 | 4.8%), English (19 | 3.9%), German (16 | 3.3%), Chippewa (6 | 1.2%), and Irish (6 | 1.2%), together accounting for 14.5% of all Springfield residents.
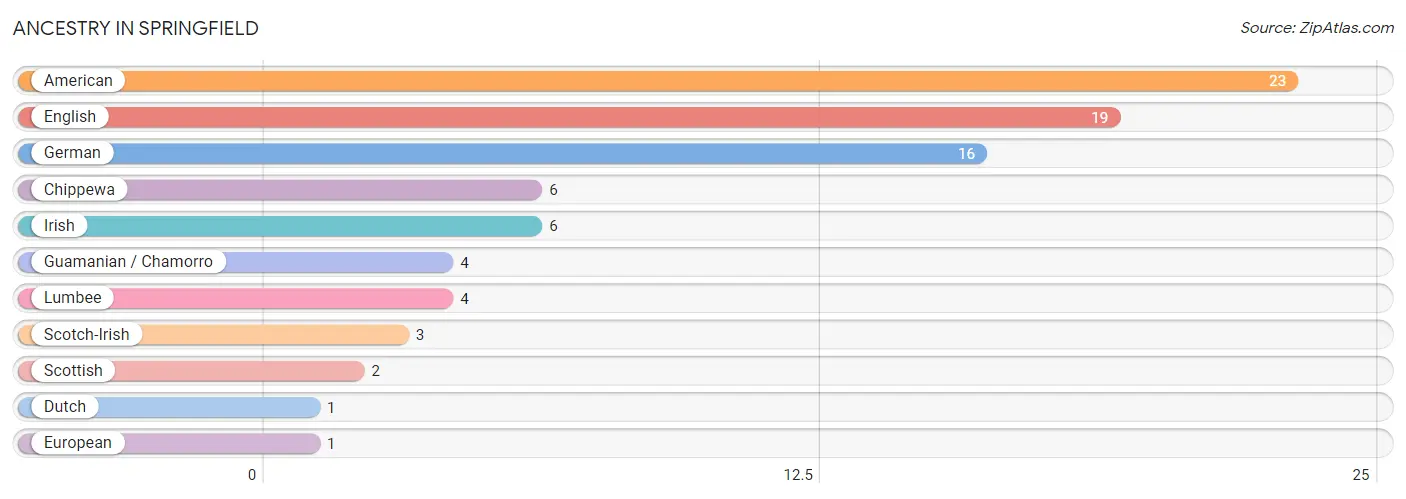
| Ancestry | # Population | % Population |
| American | 23 | 4.8% |
| Chippewa | 6 | 1.2% |
| Dutch | 1 | 0.2% |
| English | 19 | 3.9% |
| European | 1 | 0.2% |
| German | 16 | 3.3% |
| Guamanian / Chamorro | 4 | 0.8% |
| Irish | 6 | 1.2% |
| Lumbee | 4 | 0.8% |
| Scotch-Irish | 3 | 0.6% |
| Scottish | 2 | 0.4% | View All 11 Rows |
Immigrants in Springfield

| Immigration Origin | # Population | % Population | View All 0 Rows |
Sex and Age in Springfield
Sex and Age in Springfield
The most populous age groups in Springfield are Under 5 Years (68 | 24.8%) for men and 15 to 19 Years (21 | 10.1%) for women.
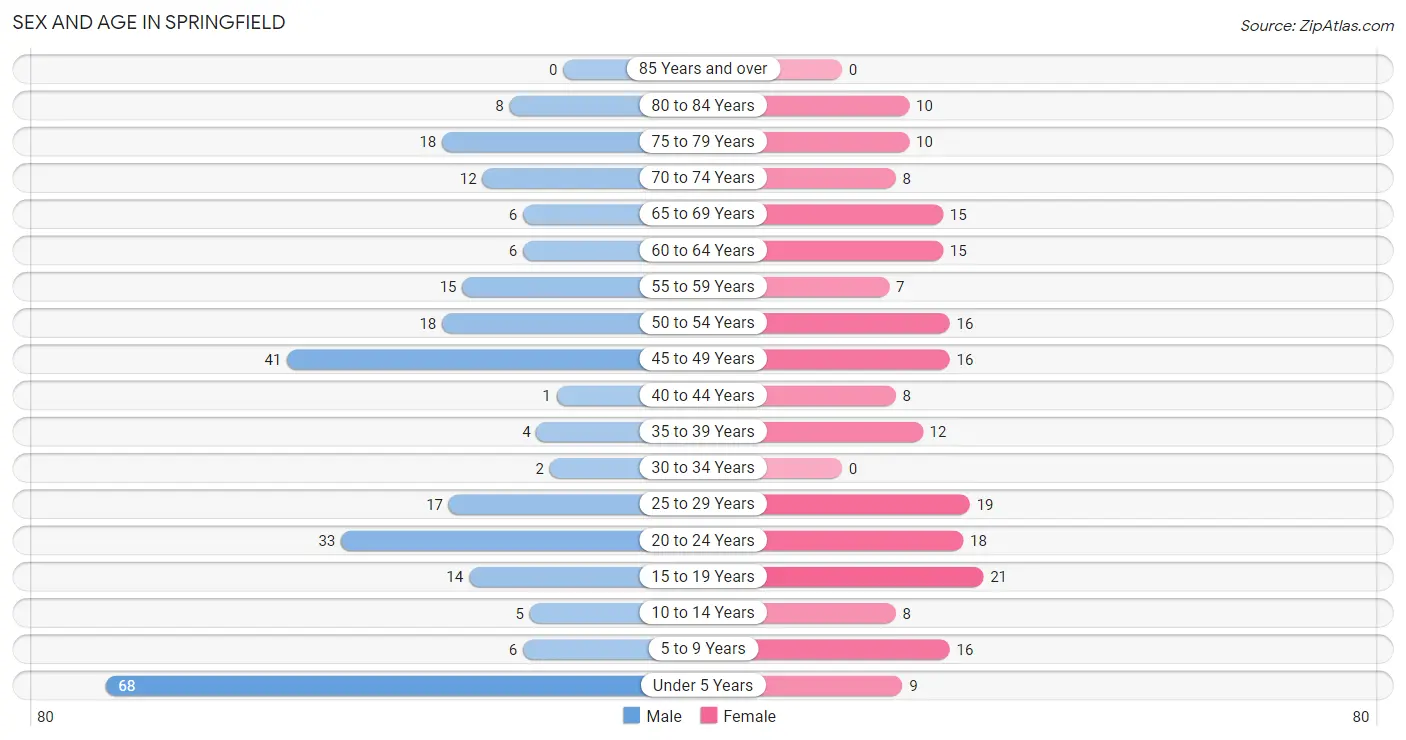
| Age Bracket | Male | Female |
| Under 5 Years | 68 (24.8%) | 9 (4.3%) |
| 5 to 9 Years | 6 (2.2%) | 16 (7.7%) |
| 10 to 14 Years | 5 (1.8%) | 8 (3.8%) |
| 15 to 19 Years | 14 (5.1%) | 21 (10.1%) |
| 20 to 24 Years | 33 (12.0%) | 18 (8.6%) |
| 25 to 29 Years | 17 (6.2%) | 19 (9.1%) |
| 30 to 34 Years | 2 (0.7%) | 0 (0.0%) |
| 35 to 39 Years | 4 (1.5%) | 12 (5.8%) |
| 40 to 44 Years | 1 (0.4%) | 8 (3.8%) |
| 45 to 49 Years | 41 (15.0%) | 16 (7.7%) |
| 50 to 54 Years | 18 (6.6%) | 16 (7.7%) |
| 55 to 59 Years | 15 (5.5%) | 7 (3.4%) |
| 60 to 64 Years | 6 (2.2%) | 15 (7.2%) |
| 65 to 69 Years | 6 (2.2%) | 15 (7.2%) |
| 70 to 74 Years | 12 (4.4%) | 8 (3.8%) |
| 75 to 79 Years | 18 (6.6%) | 10 (4.8%) |
| 80 to 84 Years | 8 (2.9%) | 10 (4.8%) |
| 85 Years and over | 0 (0.0%) | 0 (0.0%) |
| Total | 274 (100.0%) | 208 (100.0%) |
Families and Households in Springfield
Median Family Size in Springfield
The median family size in Springfield is 4.07 persons per family, with single male/father families (4 | 3.9%) accounting for the largest median family size of 5 persons per family. On the other hand, married-couple families (75 | 73.5%) represent the smallest median family size with 3.81 persons per family.
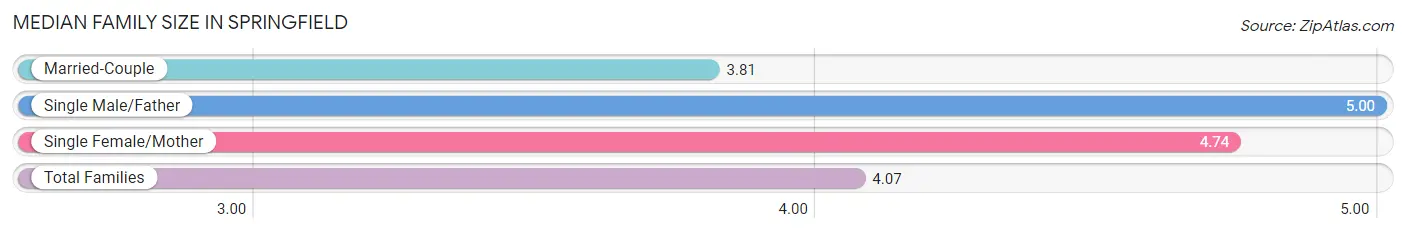
| Family Type | # Families | Family Size |
| Married-Couple | 75 (73.5%) | 3.81 |
| Single Male/Father | 4 (3.9%) | 5.00 |
| Single Female/Mother | 23 (22.6%) | 4.74 |
| Total Families | 102 (100.0%) | 4.07 |
Median Household Size in Springfield
The median household size in Springfield is 2.92 persons per household, with single male/father households (4 | 2.4%) accounting for the largest median household size of 5 persons per household. non-family households (63 | 38.2%) represent the smallest median household size with 1.02 persons per household.
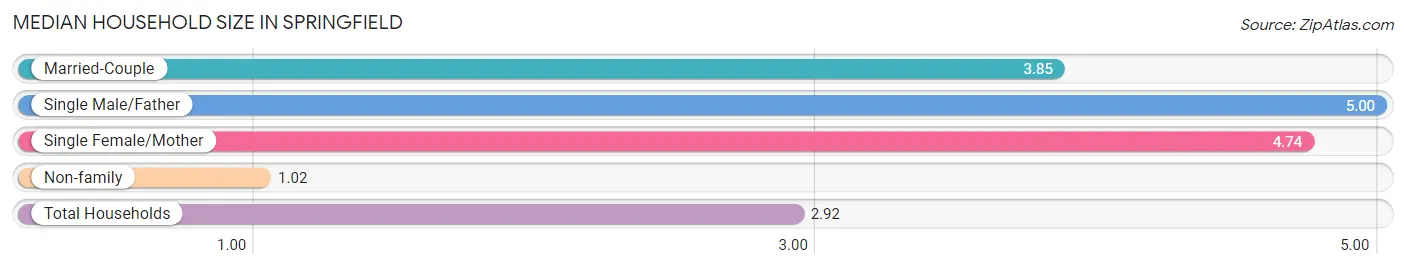
| Household Type | # Households | Household Size |
| Married-Couple | 75 (45.5%) | 3.85 |
| Single Male/Father | 4 (2.4%) | 5.00 |
| Single Female/Mother | 23 (13.9%) | 4.74 |
| Non-family | 63 (38.2%) | 1.02 |
| Total Households | 165 (100.0%) | 2.92 |
Household Size by Marriage Status in Springfield
Out of a total of 165 households in Springfield, 102 (61.8%) are family households, while 63 (38.2%) are nonfamily households. The most numerous type of family households are 2-person households, comprising 45, and the most common type of nonfamily households are 1-person households, comprising 62.
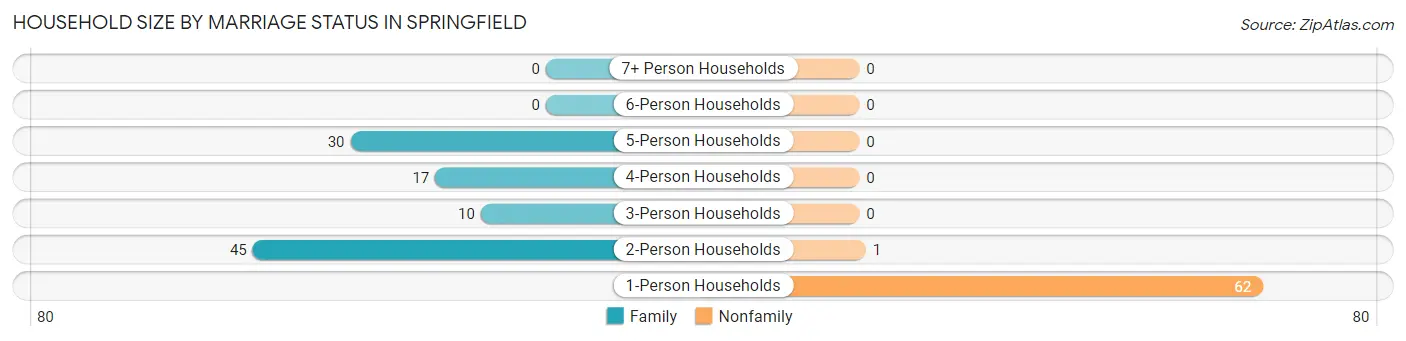
| Household Size | Family Households | Nonfamily Households |
| 1-Person Households | - | 62 (37.6%) |
| 2-Person Households | 45 (27.3%) | 1 (0.6%) |
| 3-Person Households | 10 (6.1%) | 0 (0.0%) |
| 4-Person Households | 17 (10.3%) | 0 (0.0%) |
| 5-Person Households | 30 (18.2%) | 0 (0.0%) |
| 6-Person Households | 0 (0.0%) | 0 (0.0%) |
| 7+ Person Households | 0 (0.0%) | 0 (0.0%) |
| Total | 102 (61.8%) | 63 (38.2%) |
Female Fertility in Springfield
Fertility by Age in Springfield
Average fertility rate in Springfield is 41.0 births per 1,000 women. Women in the age bracket of 20 to 34 years have the highest fertility rate with 108.0 births per 1,000 women. Women in the age bracket of 20 to 34 years acount for 100.0% of all women with births.
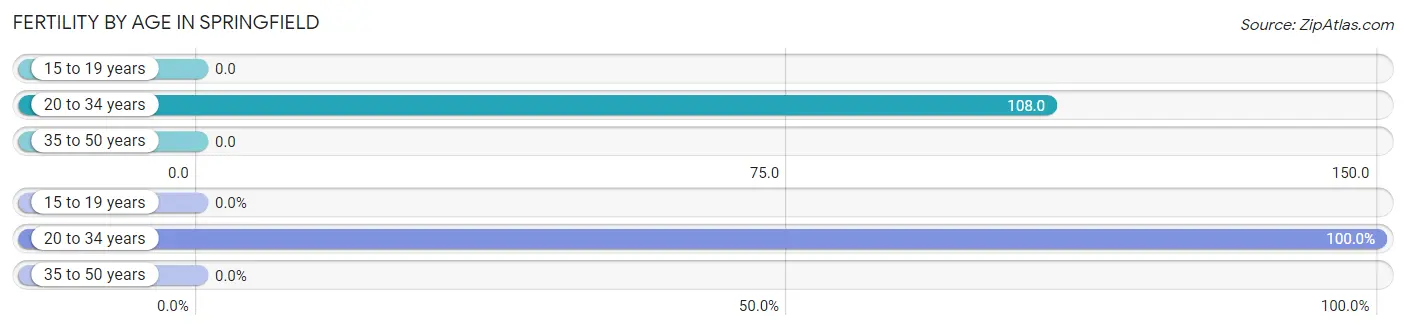
| Age Bracket | Women with Births | Births / 1,000 Women |
| 15 to 19 years | 0 (0.0%) | 0.0 |
| 20 to 34 years | 4 (100.0%) | 108.0 |
| 35 to 50 years | 0 (0.0%) | 0.0 |
| Total | 4 (100.0%) | 41.0 |
Fertility by Age by Marriage Status in Springfield
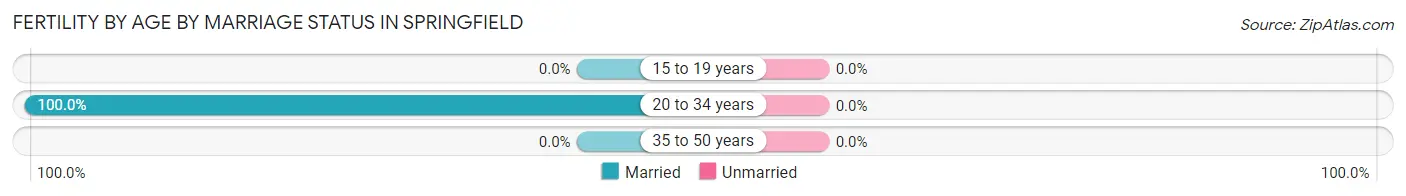
| Age Bracket | Married | Unmarried |
| 15 to 19 years | 0 (0.0%) | 0 (0.0%) |
| 20 to 34 years | 4 (100.0%) | 0 (0.0%) |
| 35 to 50 years | 0 (0.0%) | 0 (0.0%) |
| Total | 4 (100.0%) | 0 (0.0%) |
Fertility by Education in Springfield
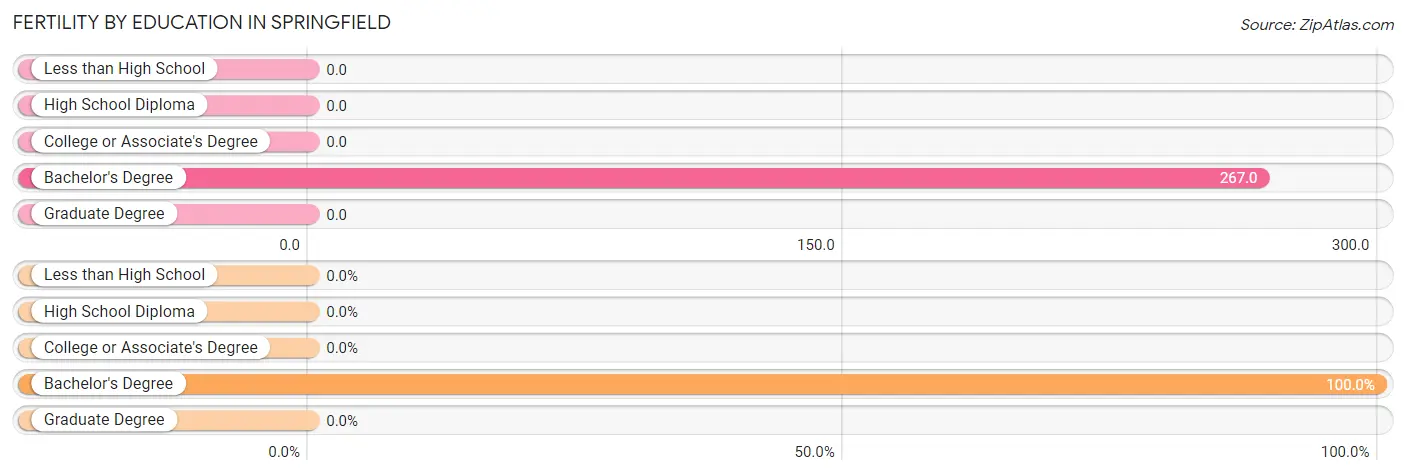
| Educational Attainment | Women with Births | Births / 1,000 Women |
| Less than High School | 0 (0.0%) | 0.0 |
| High School Diploma | 0 (0.0%) | 0.0 |
| College or Associate's Degree | 0 (0.0%) | 0.0 |
| Bachelor's Degree | 4 (100.0%) | 267.0 |
| Graduate Degree | 0 (0.0%) | 0.0 |
| Total | 4 (100.0%) | 41.0 |
Fertility by Education by Marriage Status in Springfield
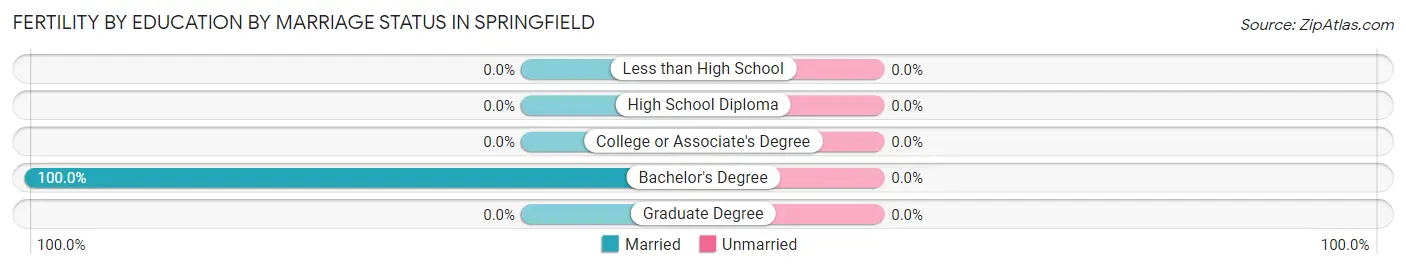
| Educational Attainment | Married | Unmarried |
| Less than High School | 0 (0.0%) | 0 (0.0%) |
| High School Diploma | 0 (0.0%) | 0 (0.0%) |
| College or Associate's Degree | 0 (0.0%) | 0 (0.0%) |
| Bachelor's Degree | 4 (100.0%) | 0 (0.0%) |
| Graduate Degree | 0 (0.0%) | 0 (0.0%) |
| Total | 4 (100.0%) | 0 (0.0%) |
Employment Characteristics in Springfield
Employment by Class of Employer in Springfield
Among the 133 employed individuals in Springfield, private company employees (90 | 67.7%), local government employees (19 | 14.3%), and state government employees (13 | 9.8%) make up the most common classes of employment.
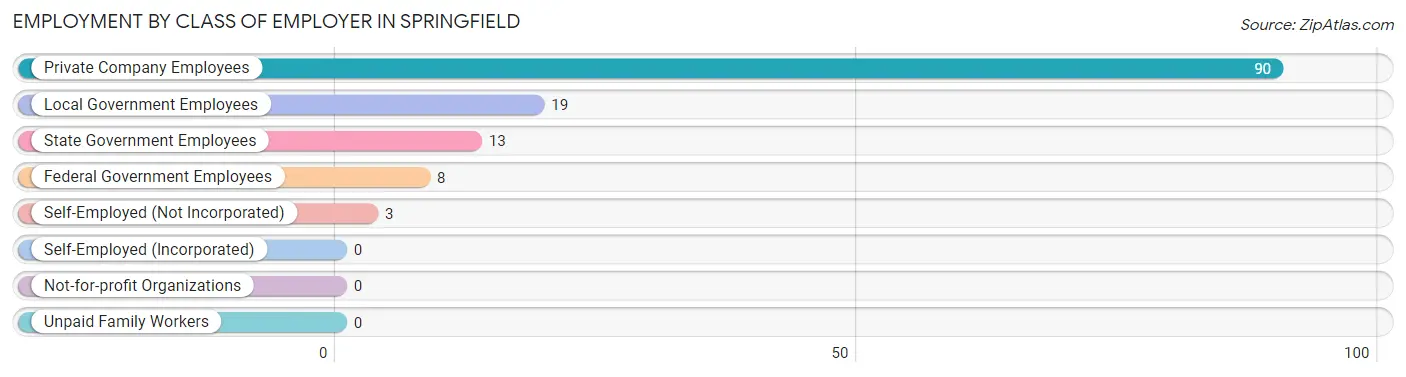
| Employer Class | # Employees | % Employees |
| Private Company Employees | 90 | 67.7% |
| Self-Employed (Incorporated) | 0 | 0.0% |
| Self-Employed (Not Incorporated) | 3 | 2.3% |
| Not-for-profit Organizations | 0 | 0.0% |
| Local Government Employees | 19 | 14.3% |
| State Government Employees | 13 | 9.8% |
| Federal Government Employees | 8 | 6.0% |
| Unpaid Family Workers | 0 | 0.0% |
| Total | 133 | 100.0% |
Employment Status by Age in Springfield
According to the labor force statistics for Springfield, out of the total population over 16 years of age (359), 42.1% or 151 individuals are in the labor force, with 10.6% or 16 of them unemployed. The age group with the highest labor force participation rate is 30 to 34 years, with 100.0% or 2 individuals in the labor force. Within the labor force, the 25 to 29 years age range has the highest percentage of unemployed individuals, with 28.0% or 7 of them being unemployed.
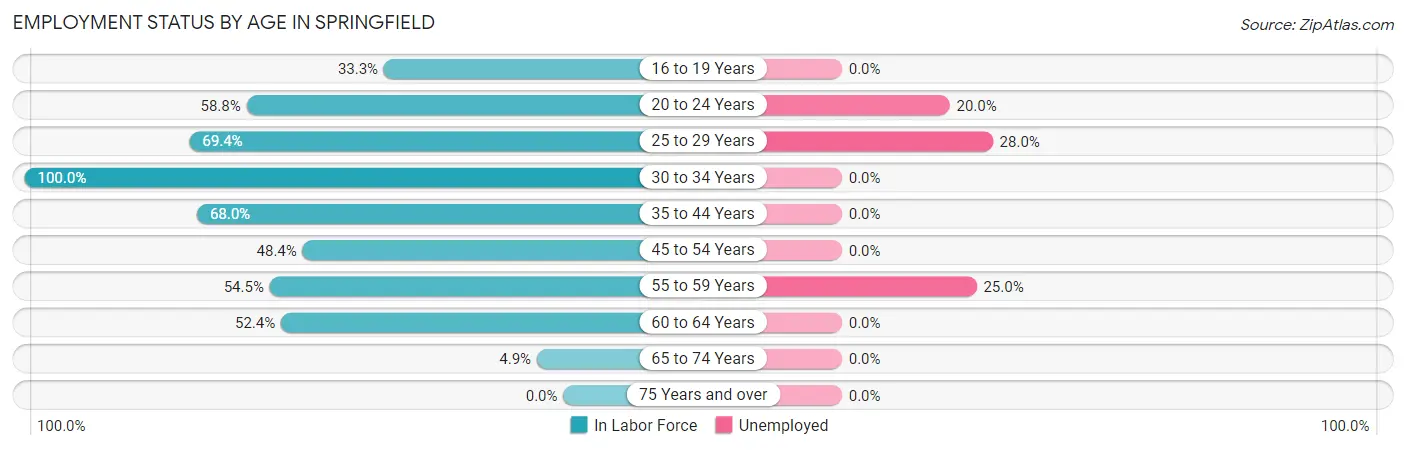
| Age Bracket | In Labor Force | Unemployed |
| 16 to 19 Years | 8 (33.3%) | 0 (0.0%) |
| 20 to 24 Years | 30 (58.8%) | 6 (20.0%) |
| 25 to 29 Years | 25 (69.4%) | 7 (28.0%) |
| 30 to 34 Years | 2 (100.0%) | 0 (0.0%) |
| 35 to 44 Years | 17 (68.0%) | 0 (0.0%) |
| 45 to 54 Years | 44 (48.4%) | 0 (0.0%) |
| 55 to 59 Years | 12 (54.5%) | 3 (25.0%) |
| 60 to 64 Years | 11 (52.4%) | 0 (0.0%) |
| 65 to 74 Years | 2 (4.9%) | 0 (0.0%) |
| 75 Years and over | 0 (0.0%) | 0 (0.0%) |
| Total | 151 (42.1%) | 16 (10.6%) |
Employment Status by Educational Attainment in Springfield
According to labor force statistics for Springfield, 56.3% of individuals (111) out of the total population between 25 and 64 years of age (197) are in the labor force, with 9.0% or 10 of them being unemployed. The group with the highest labor force participation rate are those with the educational attainment of bachelor's degree or higher, with 85.5% or 47 individuals in the labor force. Within the labor force, individuals with high school diploma education have the highest percentage of unemployment, with 16.7% or 3 of them being unemployed.
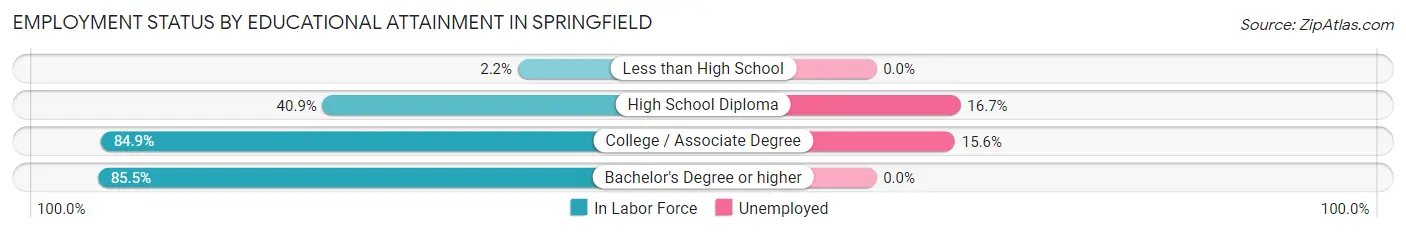
| Educational Attainment | In Labor Force | Unemployed |
| Less than High School | 1 (2.2%) | 0 (0.0%) |
| High School Diploma | 18 (40.9%) | 7 (16.7%) |
| College / Associate Degree | 45 (84.9%) | 8 (15.6%) |
| Bachelor's Degree or higher | 47 (85.5%) | 0 (0.0%) |
| Total | 111 (56.3%) | 18 (9.0%) |
Employment Occupations by Sex in Springfield
Management, Business, Science and Arts Occupations
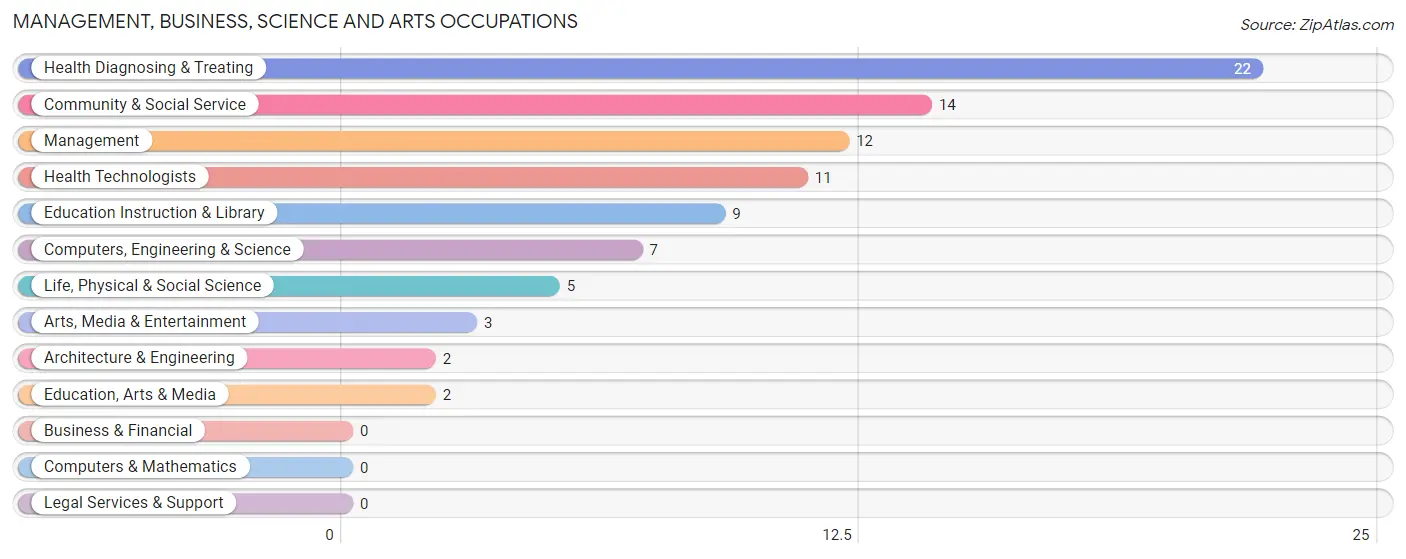
The most common Management, Business, Science and Arts occupations in Springfield are Health Diagnosing & Treating (22 | 16.3%), Community & Social Service (14 | 10.4%), Management (12 | 8.9%), Health Technologists (11 | 8.2%), and Education Instruction & Library (9 | 6.7%).
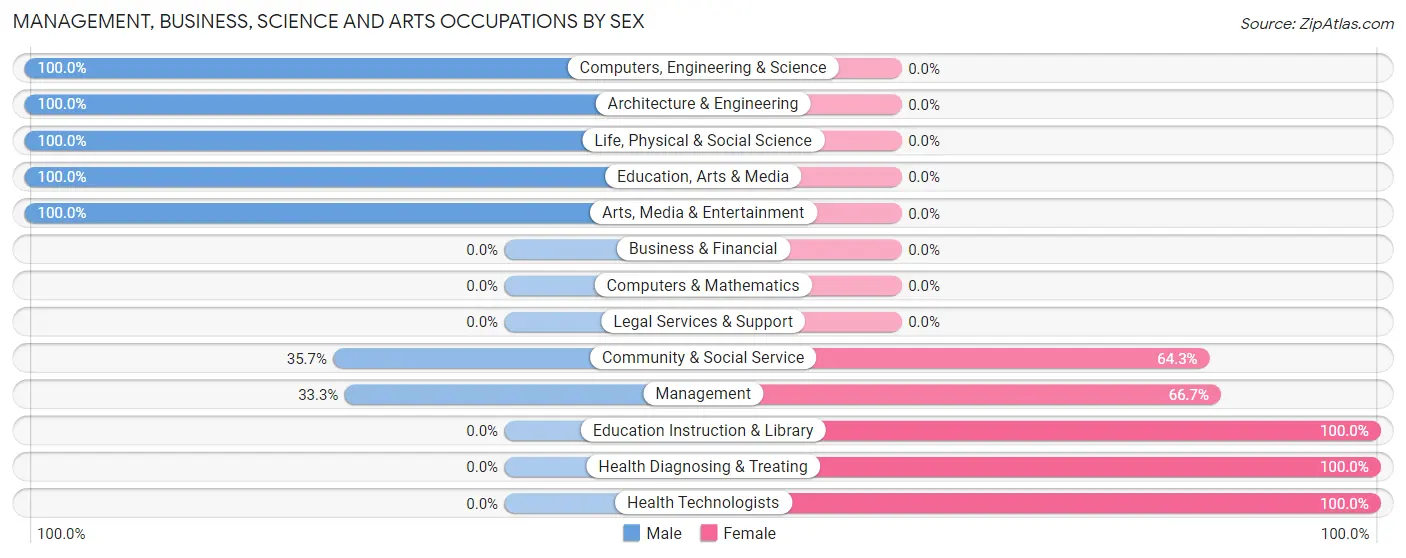
Management, Business, Science and Arts Occupations by Sex
Within the Management, Business, Science and Arts occupations in Springfield, the most male-oriented occupations are Computers, Engineering & Science (100.0%), Architecture & Engineering (100.0%), and Life, Physical & Social Science (100.0%), while the most female-oriented occupations are Education Instruction & Library (100.0%), Health Diagnosing & Treating (100.0%), and Health Technologists (100.0%).
| Occupation | Male | Female |
| Management | 4 (33.3%) | 8 (66.7%) |
| Business & Financial | 0 (0.0%) | 0 (0.0%) |
| Computers, Engineering & Science | 7 (100.0%) | 0 (0.0%) |
| Computers & Mathematics | 0 (0.0%) | 0 (0.0%) |
| Architecture & Engineering | 2 (100.0%) | 0 (0.0%) |
| Life, Physical & Social Science | 5 (100.0%) | 0 (0.0%) |
| Community & Social Service | 5 (35.7%) | 9 (64.3%) |
| Education, Arts & Media | 2 (100.0%) | 0 (0.0%) |
| Legal Services & Support | 0 (0.0%) | 0 (0.0%) |
| Education Instruction & Library | 0 (0.0%) | 9 (100.0%) |
| Arts, Media & Entertainment | 3 (100.0%) | 0 (0.0%) |
| Health Diagnosing & Treating | 0 (0.0%) | 22 (100.0%) |
| Health Technologists | 0 (0.0%) | 11 (100.0%) |
| Total (Category) | 16 (29.1%) | 39 (70.9%) |
| Total (Overall) | 65 (48.1%) | 70 (51.8%) |
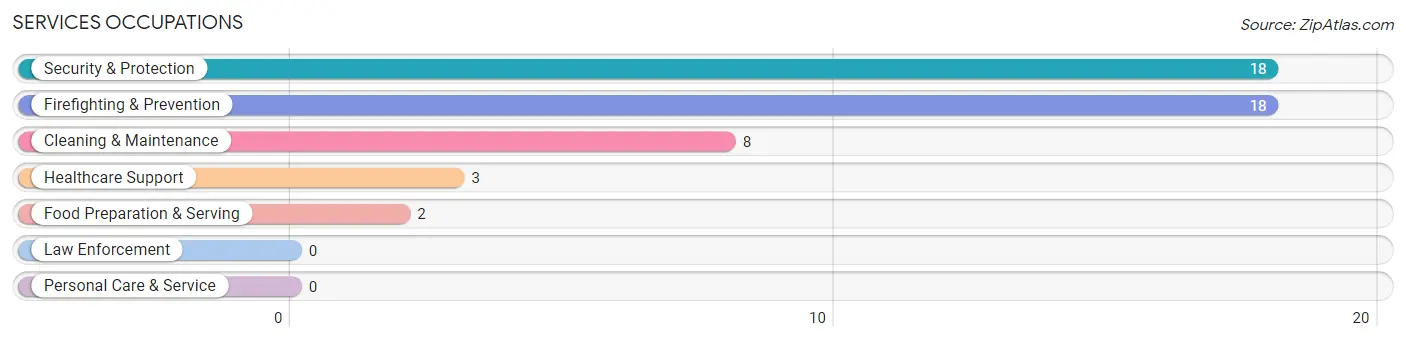
Services Occupations
The most common Services occupations in Springfield are Security & Protection (18 | 13.3%), Firefighting & Prevention (18 | 13.3%), Cleaning & Maintenance (8 | 5.9%), Healthcare Support (3 | 2.2%), and Food Preparation & Serving (2 | 1.5%).
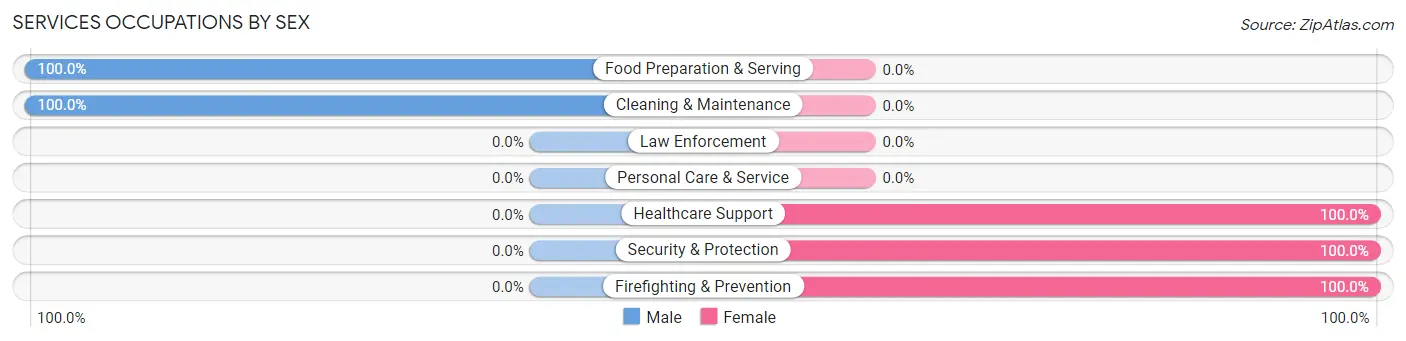
Services Occupations by Sex
Within the Services occupations in Springfield, the most male-oriented occupations are Food Preparation & Serving (100.0%), and Cleaning & Maintenance (100.0%), while the most female-oriented occupations are Healthcare Support (100.0%), Security & Protection (100.0%), and Firefighting & Prevention (100.0%).
| Occupation | Male | Female |
| Healthcare Support | 0 (0.0%) | 3 (100.0%) |
| Security & Protection | 0 (0.0%) | 18 (100.0%) |
| Firefighting & Prevention | 0 (0.0%) | 18 (100.0%) |
| Law Enforcement | 0 (0.0%) | 0 (0.0%) |
| Food Preparation & Serving | 2 (100.0%) | 0 (0.0%) |
| Cleaning & Maintenance | 8 (100.0%) | 0 (0.0%) |
| Personal Care & Service | 0 (0.0%) | 0 (0.0%) |
| Total (Category) | 10 (32.3%) | 21 (67.7%) |
| Total (Overall) | 65 (48.1%) | 70 (51.8%) |
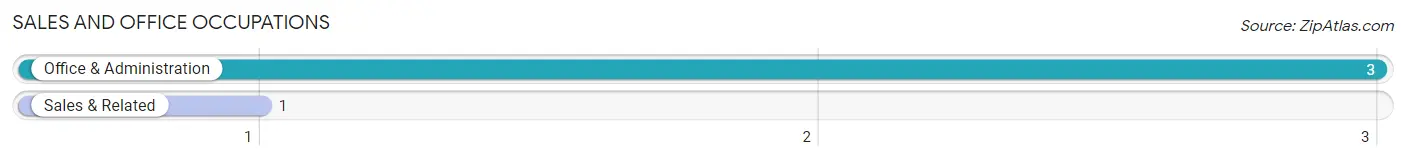
Sales and Office Occupations
The most common Sales and Office occupations in Springfield are Office & Administration (3 | 2.2%), and Sales & Related (1 | 0.7%).
Sales and Office Occupations by Sex
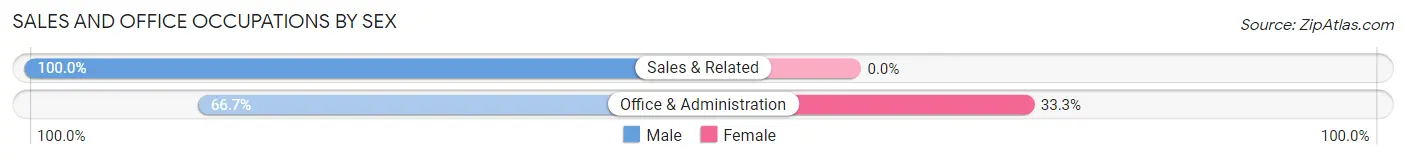
| Occupation | Male | Female |
| Sales & Related | 1 (100.0%) | 0 (0.0%) |
| Office & Administration | 2 (66.7%) | 1 (33.3%) |
| Total (Category) | 3 (75.0%) | 1 (25.0%) |
| Total (Overall) | 65 (48.1%) | 70 (51.8%) |
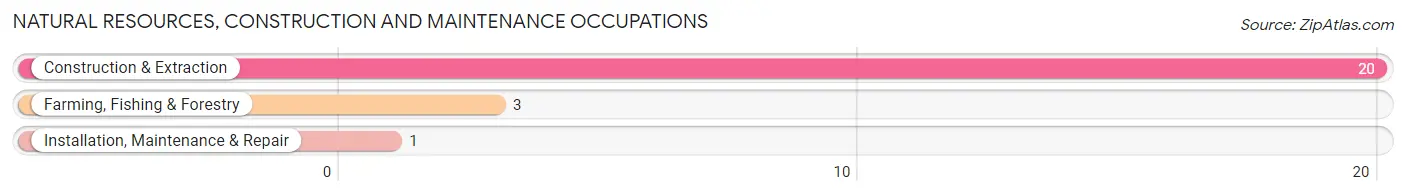
Natural Resources, Construction and Maintenance Occupations
The most common Natural Resources, Construction and Maintenance occupations in Springfield are Construction & Extraction (20 | 14.8%), Farming, Fishing & Forestry (3 | 2.2%), and Installation, Maintenance & Repair (1 | 0.7%).
Natural Resources, Construction and Maintenance Occupations by Sex
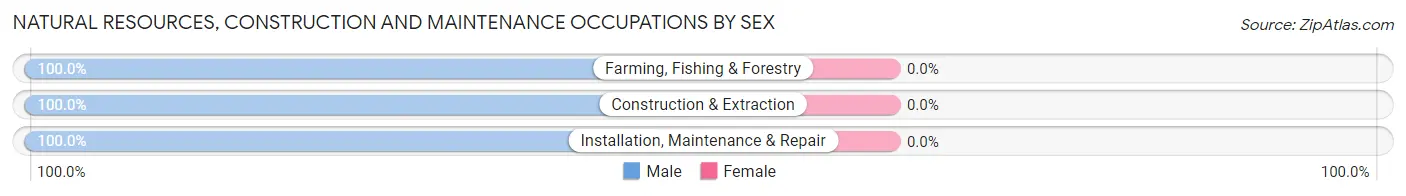
| Occupation | Male | Female |
| Farming, Fishing & Forestry | 3 (100.0%) | 0 (0.0%) |
| Construction & Extraction | 20 (100.0%) | 0 (0.0%) |
| Installation, Maintenance & Repair | 1 (100.0%) | 0 (0.0%) |
| Total (Category) | 24 (100.0%) | 0 (0.0%) |
| Total (Overall) | 65 (48.1%) | 70 (51.8%) |
Production, Transportation and Moving Occupations
The most common Production, Transportation and Moving occupations in Springfield are Production (10 | 7.4%), Material Moving (9 | 6.7%), and Transportation (2 | 1.5%).
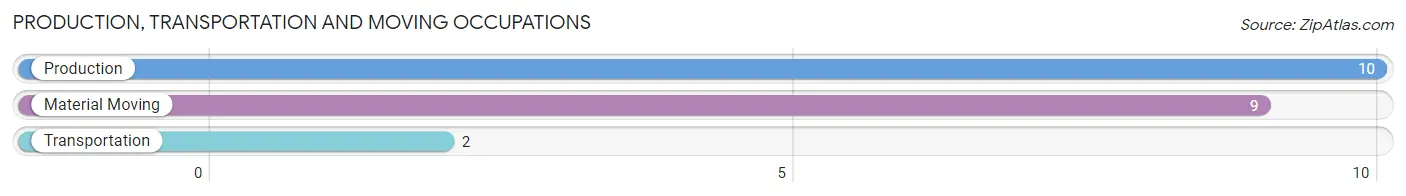
Production, Transportation and Moving Occupations by Sex
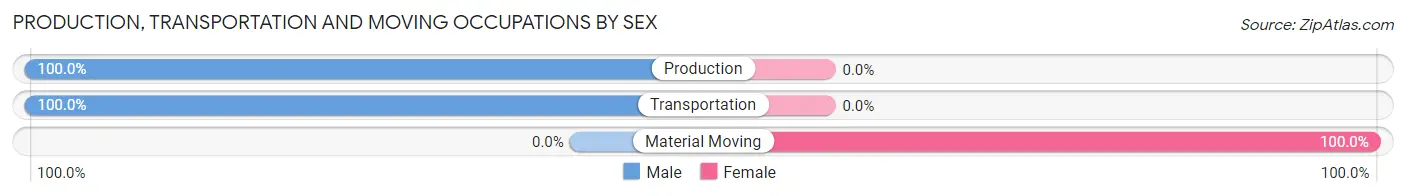
| Occupation | Male | Female |
| Production | 10 (100.0%) | 0 (0.0%) |
| Transportation | 2 (100.0%) | 0 (0.0%) |
| Material Moving | 0 (0.0%) | 9 (100.0%) |
| Total (Category) | 12 (57.1%) | 9 (42.9%) |
| Total (Overall) | 65 (48.1%) | 70 (51.8%) |
Employment Industries by Sex in Springfield
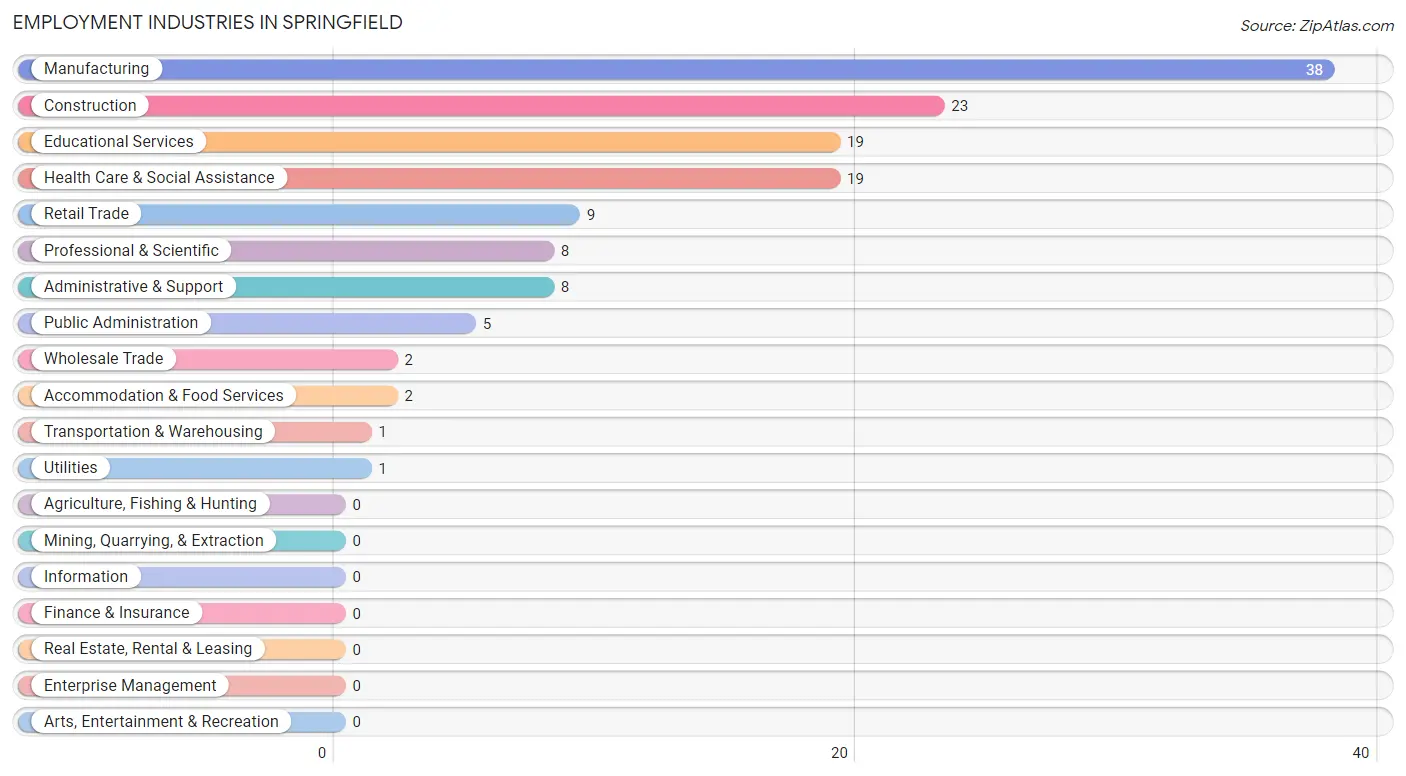
Employment Industries in Springfield
The major employment industries in Springfield include Manufacturing (38 | 28.1%), Construction (23 | 17.0%), Educational Services (19 | 14.1%), Health Care & Social Assistance (19 | 14.1%), and Retail Trade (9 | 6.7%).
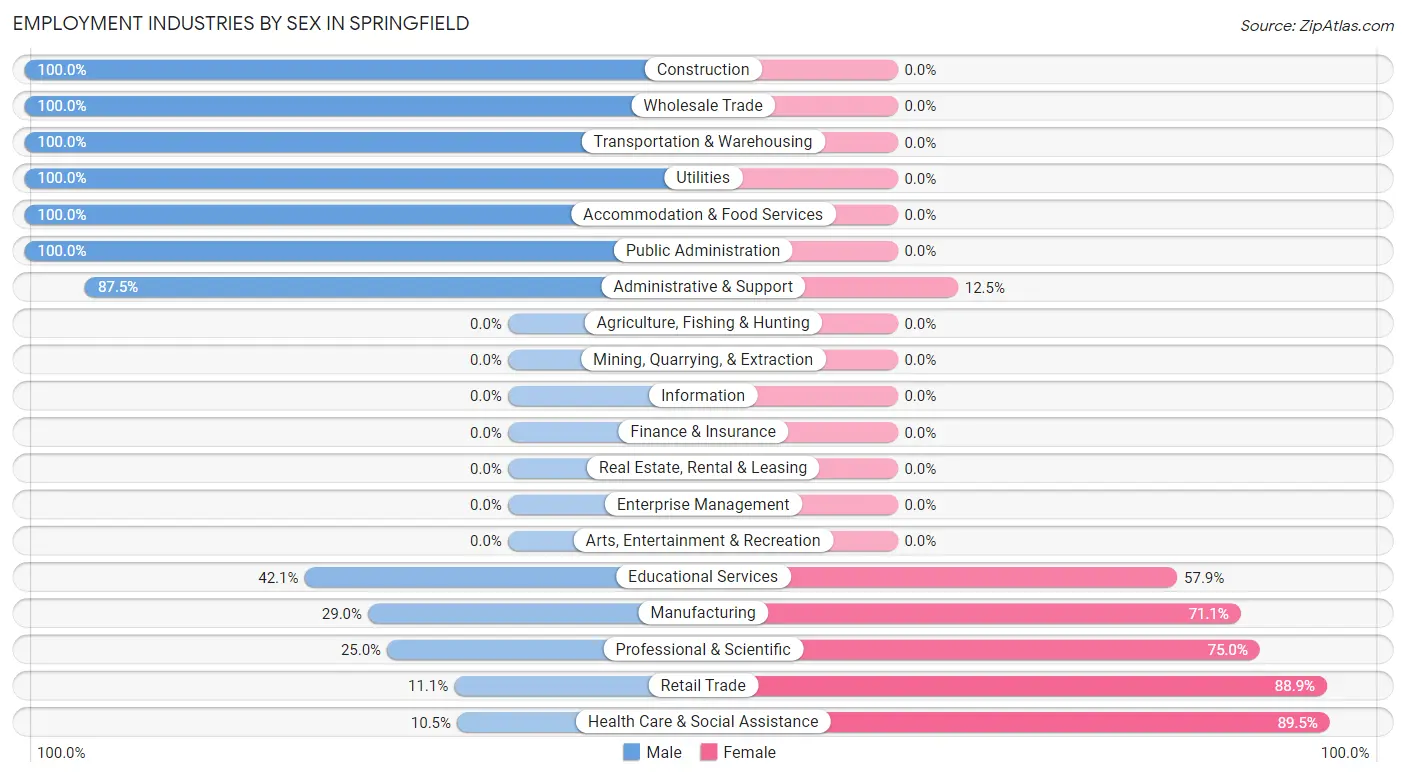
Employment Industries by Sex in Springfield
The Springfield industries that see more men than women are Construction (100.0%), Wholesale Trade (100.0%), and Transportation & Warehousing (100.0%), whereas the industries that tend to have a higher number of women are Health Care & Social Assistance (89.5%), Retail Trade (88.9%), and Professional & Scientific (75.0%).
| Industry | Male | Female |
| Agriculture, Fishing & Hunting | 0 (0.0%) | 0 (0.0%) |
| Mining, Quarrying, & Extraction | 0 (0.0%) | 0 (0.0%) |
| Construction | 23 (100.0%) | 0 (0.0%) |
| Manufacturing | 11 (28.9%) | 27 (71.1%) |
| Wholesale Trade | 2 (100.0%) | 0 (0.0%) |
| Retail Trade | 1 (11.1%) | 8 (88.9%) |
| Transportation & Warehousing | 1 (100.0%) | 0 (0.0%) |
| Utilities | 1 (100.0%) | 0 (0.0%) |
| Information | 0 (0.0%) | 0 (0.0%) |
| Finance & Insurance | 0 (0.0%) | 0 (0.0%) |
| Real Estate, Rental & Leasing | 0 (0.0%) | 0 (0.0%) |
| Professional & Scientific | 2 (25.0%) | 6 (75.0%) |
| Enterprise Management | 0 (0.0%) | 0 (0.0%) |
| Administrative & Support | 7 (87.5%) | 1 (12.5%) |
| Educational Services | 8 (42.1%) | 11 (57.9%) |
| Health Care & Social Assistance | 2 (10.5%) | 17 (89.5%) |
| Arts, Entertainment & Recreation | 0 (0.0%) | 0 (0.0%) |
| Accommodation & Food Services | 2 (100.0%) | 0 (0.0%) |
| Public Administration | 5 (100.0%) | 0 (0.0%) |
| Total | 65 (48.1%) | 70 (51.8%) |
Education in Springfield
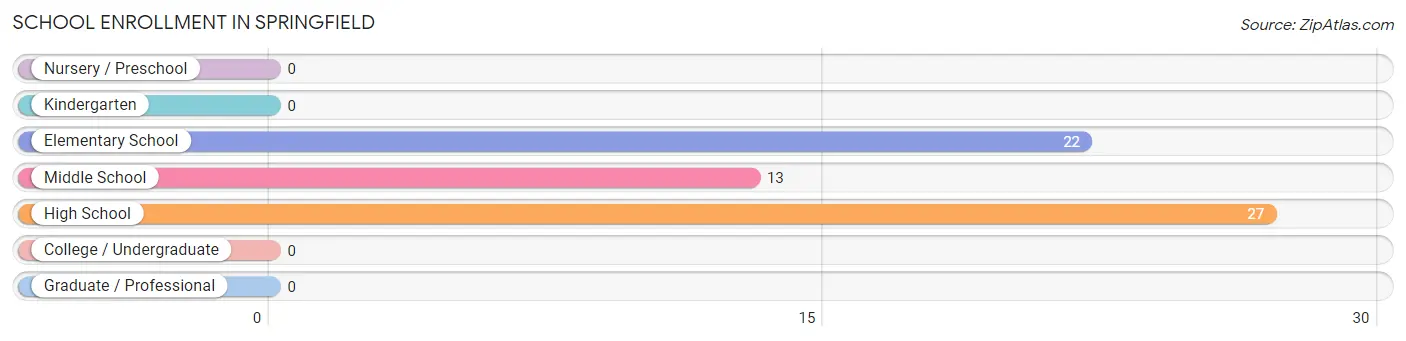
School Enrollment in Springfield
The most common levels of schooling among the 62 students in Springfield are high school (27 | 43.5%), elementary school (22 | 35.5%), and middle school (13 | 21.0%).
| School Level | # Students | % Students |
| Nursery / Preschool | 0 | 0.0% |
| Kindergarten | 0 | 0.0% |
| Elementary School | 22 | 35.5% |
| Middle School | 13 | 21.0% |
| High School | 27 | 43.5% |
| College / Undergraduate | 0 | 0.0% |
| Graduate / Professional | 0 | 0.0% |
| Total | 62 | 100.0% |
School Enrollment by Age by Funding Source in Springfield
Out of a total of 62 students who are enrolled in schools in Springfield, 16 (25.8%) attend a private institution, while the remaining 46 (74.2%) are enrolled in public schools. The age group of 15 to 17 year olds has the highest likelihood of being enrolled in private schools, with 10 (37.0% in the age bracket) enrolled. Conversely, the age group of 10 to 14 year olds has the lowest likelihood of being enrolled in a private school, with 13 (100.0% in the age bracket) attending a public institution.
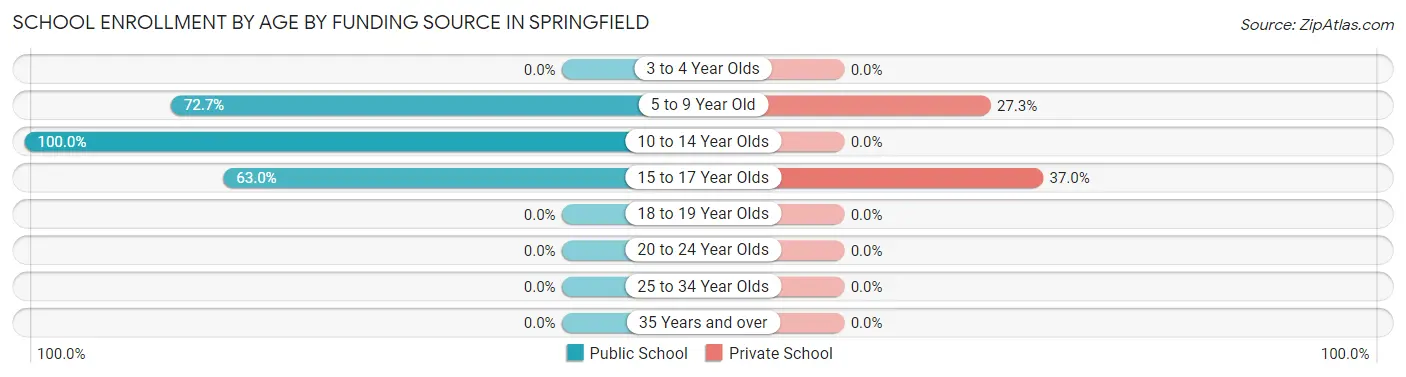
| Age Bracket | Public School | Private School |
| 3 to 4 Year Olds | 0 (0.0%) | 0 (0.0%) |
| 5 to 9 Year Old | 16 (72.7%) | 6 (27.3%) |
| 10 to 14 Year Olds | 13 (100.0%) | 0 (0.0%) |
| 15 to 17 Year Olds | 17 (63.0%) | 10 (37.0%) |
| 18 to 19 Year Olds | 0 (0.0%) | 0 (0.0%) |
| 20 to 24 Year Olds | 0 (0.0%) | 0 (0.0%) |
| 25 to 34 Year Olds | 0 (0.0%) | 0 (0.0%) |
| 35 Years and over | 0 (0.0%) | 0 (0.0%) |
| Total | 46 (74.2%) | 16 (25.8%) |
Educational Attainment by Field of Study in Springfield
Arts & humanities (16 | 27.1%), education (15 | 25.4%), science & technology (11 | 18.6%), bio, nature & agricultural (9 | 15.2%), and multidisciplinary studies (4 | 6.8%) are the most common fields of study among 59 individuals in Springfield who have obtained a bachelor's degree or higher.
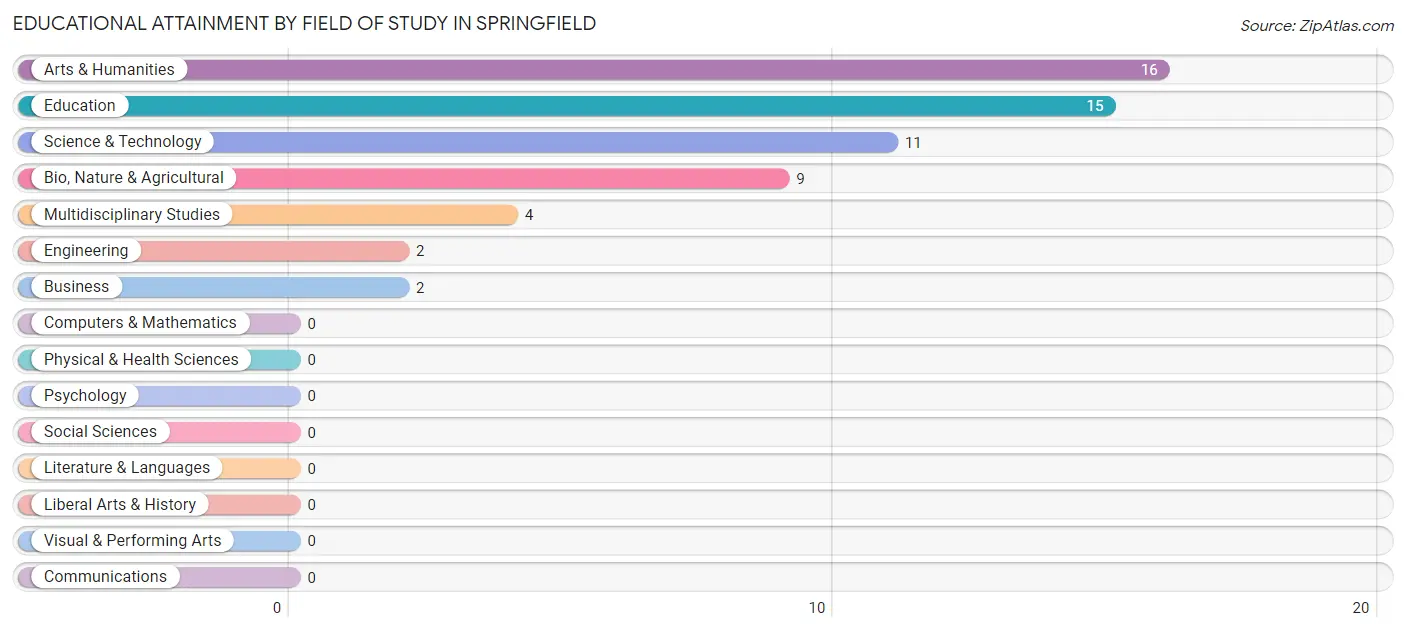
| Field of Study | # Graduates | % Graduates |
| Computers & Mathematics | 0 | 0.0% |
| Bio, Nature & Agricultural | 9 | 15.2% |
| Physical & Health Sciences | 0 | 0.0% |
| Psychology | 0 | 0.0% |
| Social Sciences | 0 | 0.0% |
| Engineering | 2 | 3.4% |
| Multidisciplinary Studies | 4 | 6.8% |
| Science & Technology | 11 | 18.6% |
| Business | 2 | 3.4% |
| Education | 15 | 25.4% |
| Literature & Languages | 0 | 0.0% |
| Liberal Arts & History | 0 | 0.0% |
| Visual & Performing Arts | 0 | 0.0% |
| Communications | 0 | 0.0% |
| Arts & Humanities | 16 | 27.1% |
| Total | 59 | 100.0% |
Transportation & Commute in Springfield
Vehicle Availability by Sex in Springfield
The most prevalent vehicle ownership categories in Springfield are males with 4 vehicles (20, accounting for 31.8%) and females with 4 vehicles (16, making up 28.6%).
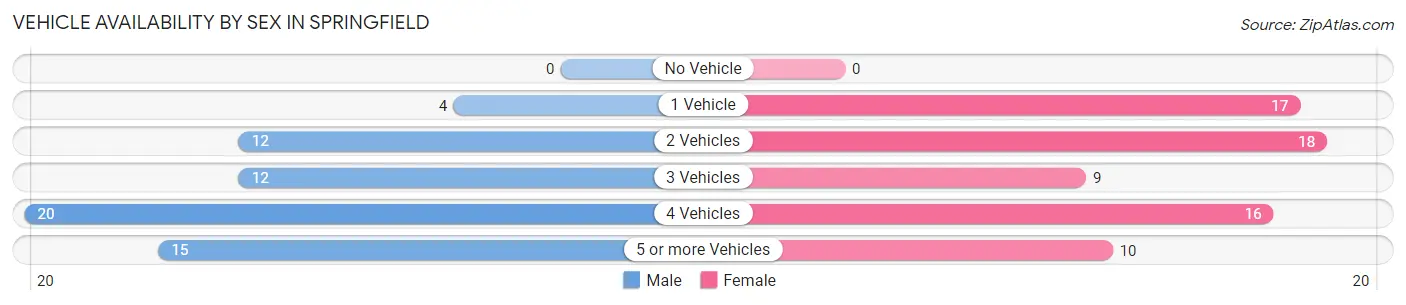
| Vehicles Available | Male | Female |
| No Vehicle | 0 (0.0%) | 0 (0.0%) |
| 1 Vehicle | 4 (6.4%) | 17 (24.3%) |
| 2 Vehicles | 12 (19.1%) | 18 (25.7%) |
| 3 Vehicles | 12 (19.1%) | 9 (12.9%) |
| 4 Vehicles | 20 (31.8%) | 16 (22.9%) |
| 5 or more Vehicles | 15 (23.8%) | 10 (14.3%) |
| Total | 63 (100.0%) | 70 (100.0%) |
Commute Time in Springfield
The most frequently occuring commute durations in Springfield are 45 to 59 minutes (36 commuters, 27.3%), 40 to 44 minutes (22 commuters, 16.7%), and 25 to 29 minutes (18 commuters, 13.6%).
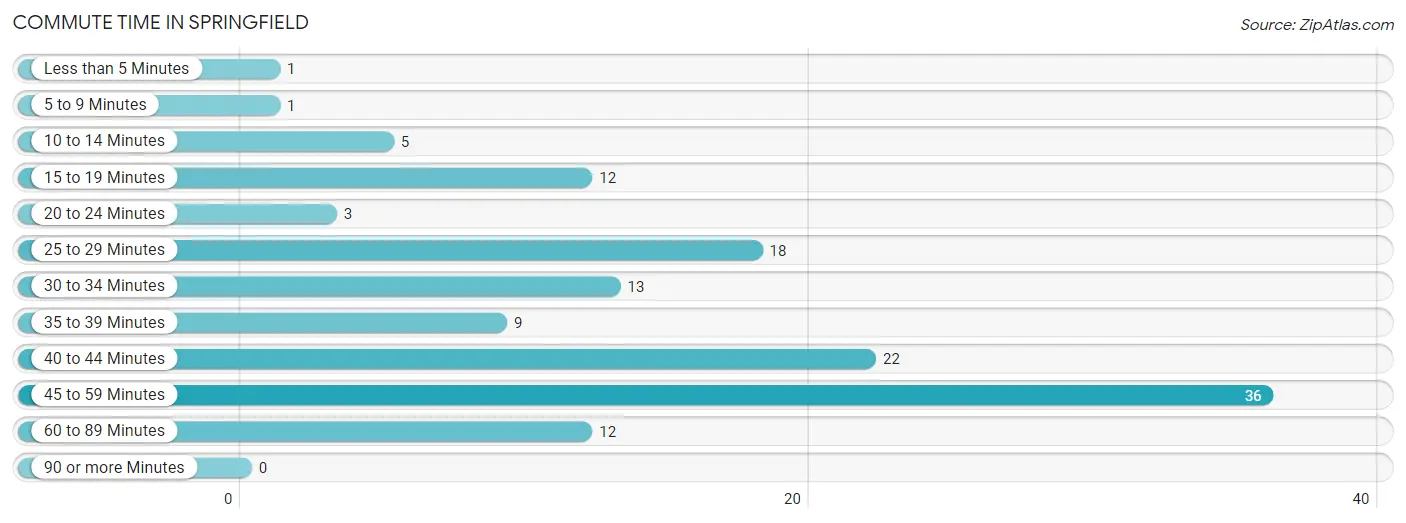
| Commute Time | # Commuters | % Commuters |
| Less than 5 Minutes | 1 | 0.8% |
| 5 to 9 Minutes | 1 | 0.8% |
| 10 to 14 Minutes | 5 | 3.8% |
| 15 to 19 Minutes | 12 | 9.1% |
| 20 to 24 Minutes | 3 | 2.3% |
| 25 to 29 Minutes | 18 | 13.6% |
| 30 to 34 Minutes | 13 | 9.9% |
| 35 to 39 Minutes | 9 | 6.8% |
| 40 to 44 Minutes | 22 | 16.7% |
| 45 to 59 Minutes | 36 | 27.3% |
| 60 to 89 Minutes | 12 | 9.1% |
| 90 or more Minutes | 0 | 0.0% |
Commute Time by Sex in Springfield
The most common commute times in Springfield are 25 to 29 minutes (18 commuters, 28.6%) for males and 45 to 59 minutes (26 commuters, 37.7%) for females.
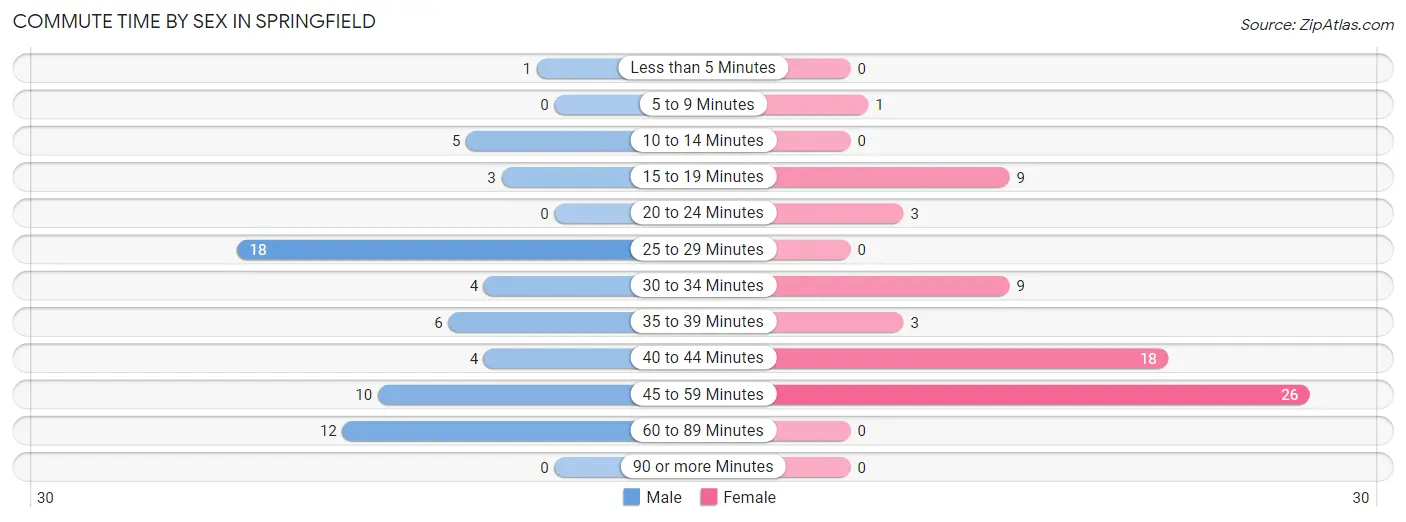
| Commute Time | Male | Female |
| Less than 5 Minutes | 1 (1.6%) | 0 (0.0%) |
| 5 to 9 Minutes | 0 (0.0%) | 1 (1.5%) |
| 10 to 14 Minutes | 5 (7.9%) | 0 (0.0%) |
| 15 to 19 Minutes | 3 (4.8%) | 9 (13.0%) |
| 20 to 24 Minutes | 0 (0.0%) | 3 (4.3%) |
| 25 to 29 Minutes | 18 (28.6%) | 0 (0.0%) |
| 30 to 34 Minutes | 4 (6.4%) | 9 (13.0%) |
| 35 to 39 Minutes | 6 (9.5%) | 3 (4.3%) |
| 40 to 44 Minutes | 4 (6.4%) | 18 (26.1%) |
| 45 to 59 Minutes | 10 (15.9%) | 26 (37.7%) |
| 60 to 89 Minutes | 12 (19.1%) | 0 (0.0%) |
| 90 or more Minutes | 0 (0.0%) | 0 (0.0%) |
Time of Departure to Work by Sex in Springfield
The most frequent times of departure to work in Springfield are 6:30 AM to 6:59 AM (20, 31.8%) for males and 6:30 AM to 6:59 AM (27, 39.1%) for females.
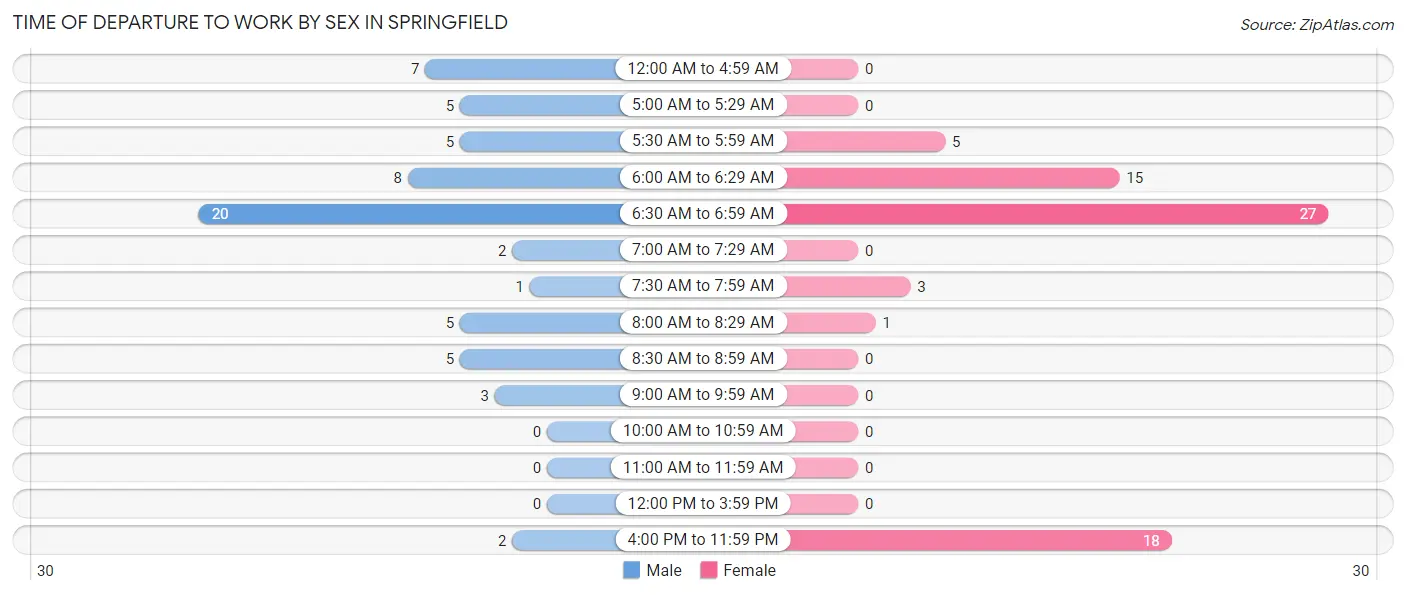
| Time of Departure | Male | Female |
| 12:00 AM to 4:59 AM | 7 (11.1%) | 0 (0.0%) |
| 5:00 AM to 5:29 AM | 5 (7.9%) | 0 (0.0%) |
| 5:30 AM to 5:59 AM | 5 (7.9%) | 5 (7.2%) |
| 6:00 AM to 6:29 AM | 8 (12.7%) | 15 (21.7%) |
| 6:30 AM to 6:59 AM | 20 (31.8%) | 27 (39.1%) |
| 7:00 AM to 7:29 AM | 2 (3.2%) | 0 (0.0%) |
| 7:30 AM to 7:59 AM | 1 (1.6%) | 3 (4.3%) |
| 8:00 AM to 8:29 AM | 5 (7.9%) | 1 (1.5%) |
| 8:30 AM to 8:59 AM | 5 (7.9%) | 0 (0.0%) |
| 9:00 AM to 9:59 AM | 3 (4.8%) | 0 (0.0%) |
| 10:00 AM to 10:59 AM | 0 (0.0%) | 0 (0.0%) |
| 11:00 AM to 11:59 AM | 0 (0.0%) | 0 (0.0%) |
| 12:00 PM to 3:59 PM | 0 (0.0%) | 0 (0.0%) |
| 4:00 PM to 11:59 PM | 2 (3.2%) | 18 (26.1%) |
| Total | 63 (100.0%) | 69 (100.0%) |
Housing Occupancy in Springfield
Occupancy by Ownership in Springfield
Of the total 165 dwellings in Springfield, owner-occupied units account for 129 (78.2%), while renter-occupied units make up 36 (21.8%).
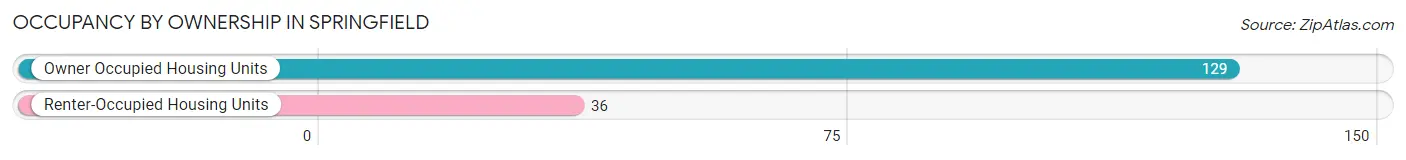
| Occupancy | # Housing Units | % Housing Units |
| Owner Occupied Housing Units | 129 | 78.2% |
| Renter-Occupied Housing Units | 36 | 21.8% |
| Total Occupied Housing Units | 165 | 100.0% |
Occupancy by Household Size in Springfield
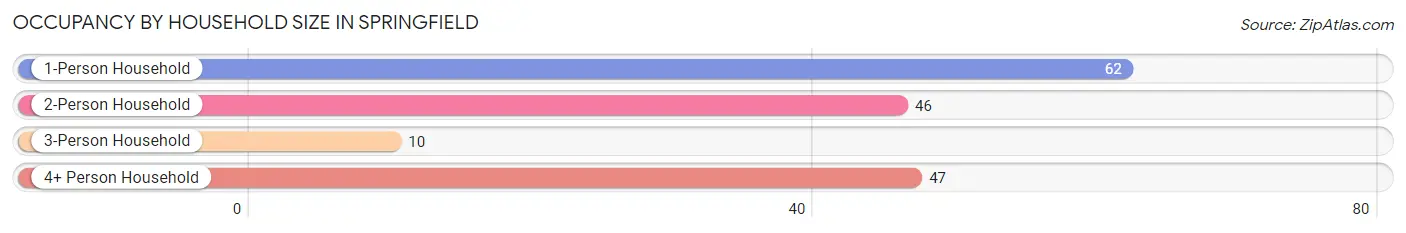
| Household Size | # Housing Units | % Housing Units |
| 1-Person Household | 62 | 37.6% |
| 2-Person Household | 46 | 27.9% |
| 3-Person Household | 10 | 6.1% |
| 4+ Person Household | 47 | 28.5% |
| Total Housing Units | 165 | 100.0% |
Occupancy by Ownership by Household Size in Springfield
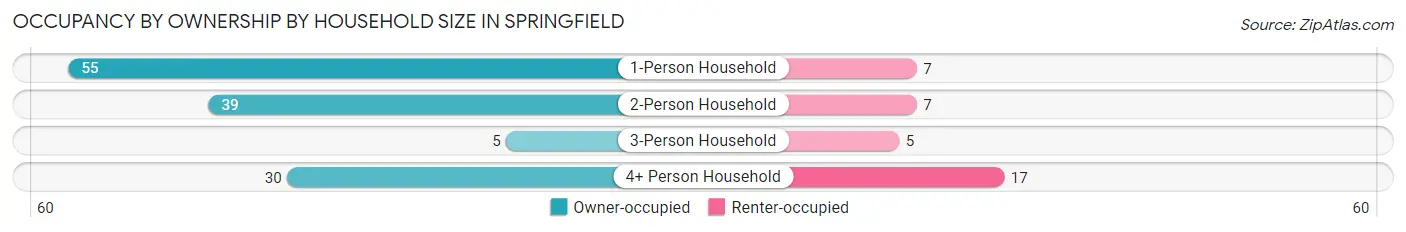
| Household Size | Owner-occupied | Renter-occupied |
| 1-Person Household | 55 (88.7%) | 7 (11.3%) |
| 2-Person Household | 39 (84.8%) | 7 (15.2%) |
| 3-Person Household | 5 (50.0%) | 5 (50.0%) |
| 4+ Person Household | 30 (63.8%) | 17 (36.2%) |
| Total Housing Units | 129 (78.2%) | 36 (21.8%) |
Occupancy by Educational Attainment in Springfield
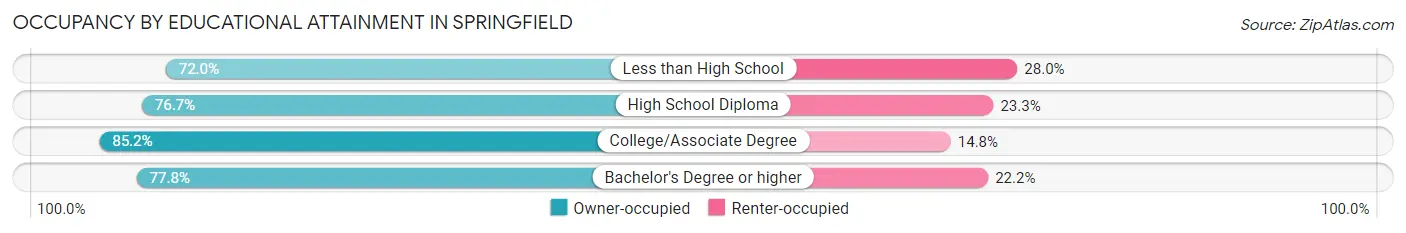
| Household Size | Owner-occupied | Renter-occupied |
| Less than High School | 36 (72.0%) | 14 (28.0%) |
| High School Diploma | 33 (76.7%) | 10 (23.3%) |
| College/Associate Degree | 46 (85.2%) | 8 (14.8%) |
| Bachelor's Degree or higher | 14 (77.8%) | 4 (22.2%) |
Occupancy by Age of Householder in Springfield
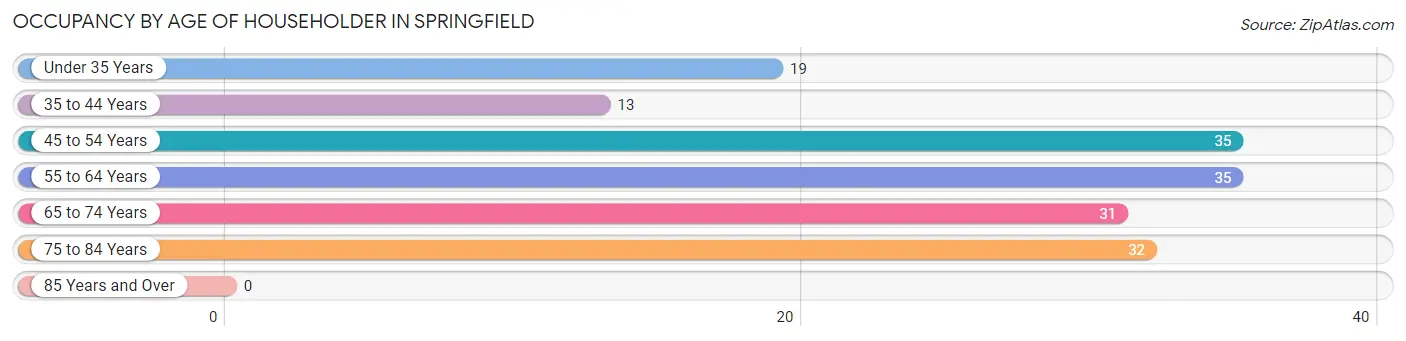
| Age Bracket | # Households | % Households |
| Under 35 Years | 19 | 11.5% |
| 35 to 44 Years | 13 | 7.9% |
| 45 to 54 Years | 35 | 21.2% |
| 55 to 64 Years | 35 | 21.2% |
| 65 to 74 Years | 31 | 18.8% |
| 75 to 84 Years | 32 | 19.4% |
| 85 Years and Over | 0 | 0.0% |
| Total | 165 | 100.0% |
Housing Finances in Springfield
Median Income by Occupancy in Springfield
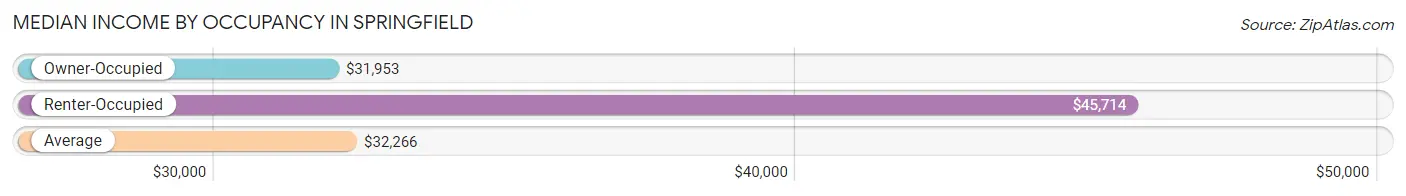
| Occupancy Type | # Households | Median Income |
| Owner-Occupied | 129 (78.2%) | $31,953 |
| Renter-Occupied | 36 (21.8%) | $45,714 |
| Average | 165 (100.0%) | $32,266 |
Occupancy by Householder Income Bracket in Springfield
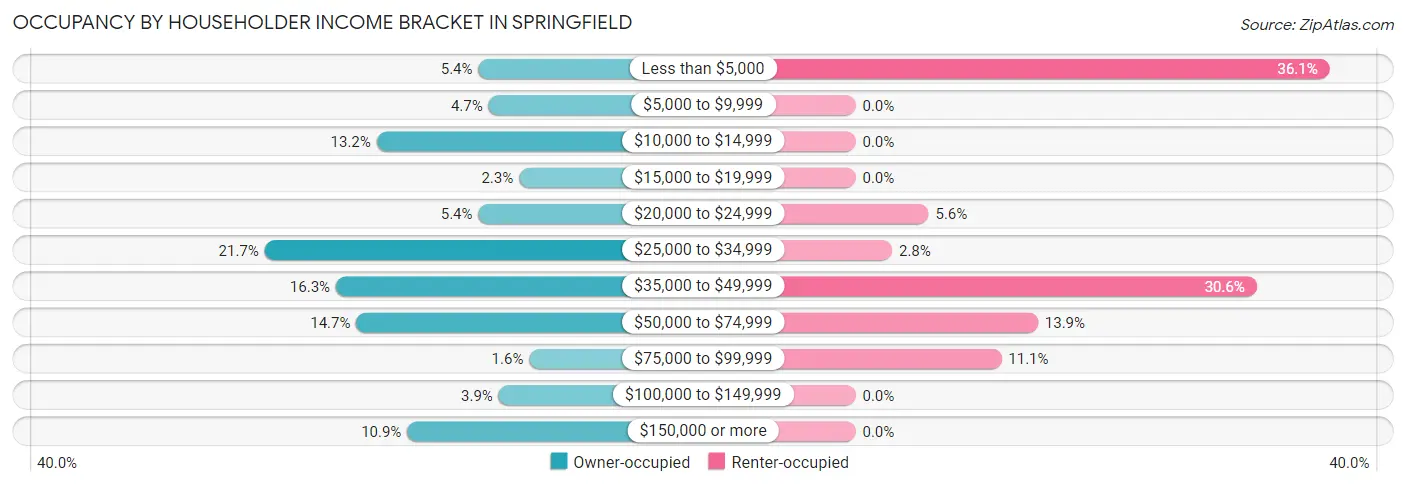
| Income Bracket | Owner-occupied | Renter-occupied |
| Less than $5,000 | 7 (5.4%) | 13 (36.1%) |
| $5,000 to $9,999 | 6 (4.6%) | 0 (0.0%) |
| $10,000 to $14,999 | 17 (13.2%) | 0 (0.0%) |
| $15,000 to $19,999 | 3 (2.3%) | 0 (0.0%) |
| $20,000 to $24,999 | 7 (5.4%) | 2 (5.6%) |
| $25,000 to $34,999 | 28 (21.7%) | 1 (2.8%) |
| $35,000 to $49,999 | 21 (16.3%) | 11 (30.6%) |
| $50,000 to $74,999 | 19 (14.7%) | 5 (13.9%) |
| $75,000 to $99,999 | 2 (1.5%) | 4 (11.1%) |
| $100,000 to $149,999 | 5 (3.9%) | 0 (0.0%) |
| $150,000 or more | 14 (10.8%) | 0 (0.0%) |
| Total | 129 (100.0%) | 36 (100.0%) |
Monthly Housing Cost Tiers in Springfield
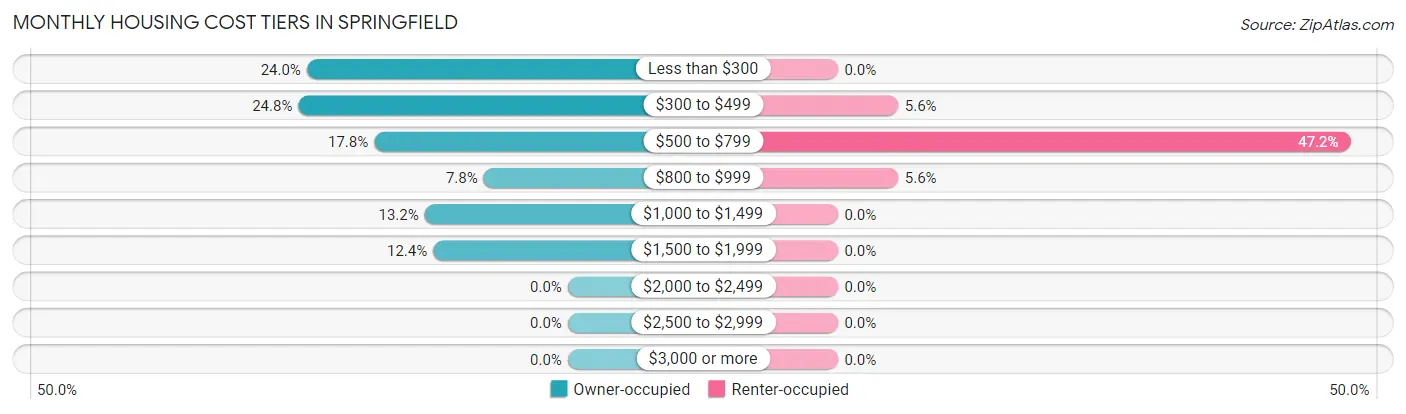
| Monthly Cost | Owner-occupied | Renter-occupied |
| Less than $300 | 31 (24.0%) | 0 (0.0%) |
| $300 to $499 | 32 (24.8%) | 2 (5.6%) |
| $500 to $799 | 23 (17.8%) | 17 (47.2%) |
| $800 to $999 | 10 (7.7%) | 2 (5.6%) |
| $1,000 to $1,499 | 17 (13.2%) | 0 (0.0%) |
| $1,500 to $1,999 | 16 (12.4%) | 0 (0.0%) |
| $2,000 to $2,499 | 0 (0.0%) | 0 (0.0%) |
| $2,500 to $2,999 | 0 (0.0%) | 0 (0.0%) |
| $3,000 or more | 0 (0.0%) | 0 (0.0%) |
| Total | 129 (100.0%) | 36 (100.0%) |
Physical Housing Characteristics in Springfield
Housing Structures in Springfield
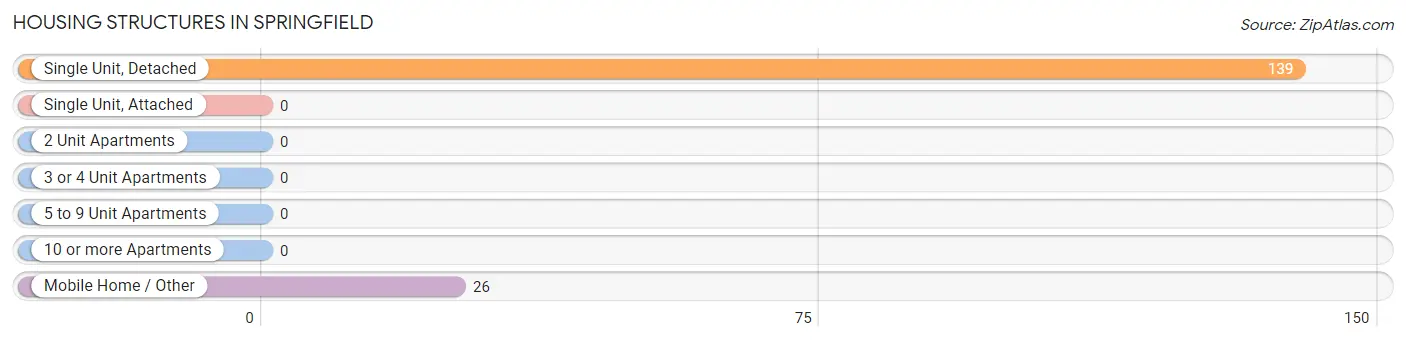
| Structure Type | # Housing Units | % Housing Units |
| Single Unit, Detached | 139 | 84.2% |
| Single Unit, Attached | 0 | 0.0% |
| 2 Unit Apartments | 0 | 0.0% |
| 3 or 4 Unit Apartments | 0 | 0.0% |
| 5 to 9 Unit Apartments | 0 | 0.0% |
| 10 or more Apartments | 0 | 0.0% |
| Mobile Home / Other | 26 | 15.8% |
| Total | 165 | 100.0% |
Housing Structures by Occupancy in Springfield
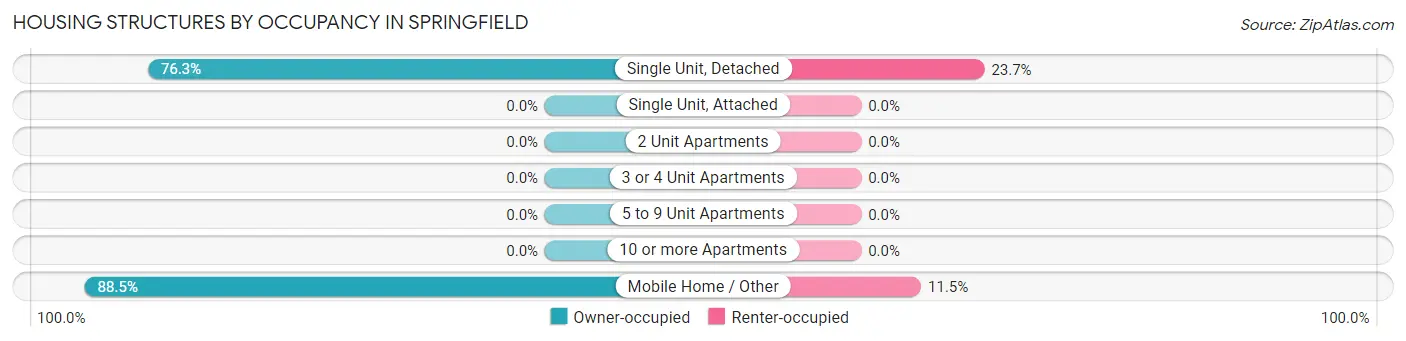
| Structure Type | Owner-occupied | Renter-occupied |
| Single Unit, Detached | 106 (76.3%) | 33 (23.7%) |
| Single Unit, Attached | 0 (0.0%) | 0 (0.0%) |
| 2 Unit Apartments | 0 (0.0%) | 0 (0.0%) |
| 3 or 4 Unit Apartments | 0 (0.0%) | 0 (0.0%) |
| 5 to 9 Unit Apartments | 0 (0.0%) | 0 (0.0%) |
| 10 or more Apartments | 0 (0.0%) | 0 (0.0%) |
| Mobile Home / Other | 23 (88.5%) | 3 (11.5%) |
| Total | 129 (78.2%) | 36 (21.8%) |
Housing Structures by Number of Rooms in Springfield
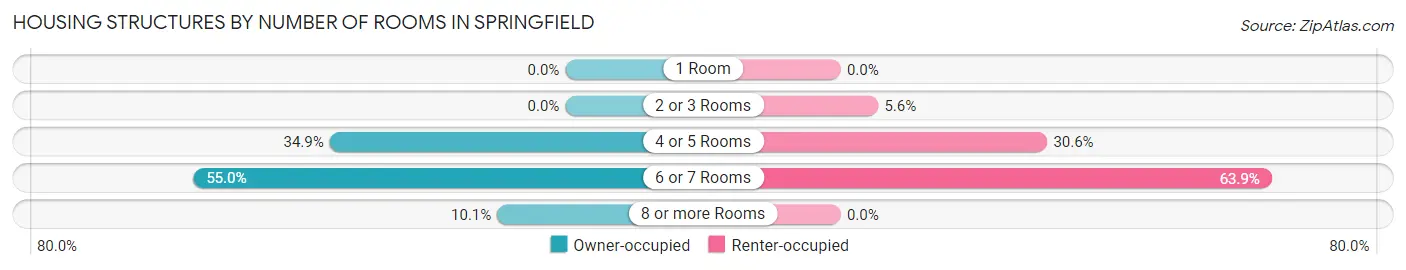
| Number of Rooms | Owner-occupied | Renter-occupied |
| 1 Room | 0 (0.0%) | 0 (0.0%) |
| 2 or 3 Rooms | 0 (0.0%) | 2 (5.6%) |
| 4 or 5 Rooms | 45 (34.9%) | 11 (30.6%) |
| 6 or 7 Rooms | 71 (55.0%) | 23 (63.9%) |
| 8 or more Rooms | 13 (10.1%) | 0 (0.0%) |
| Total | 129 (100.0%) | 36 (100.0%) |
Housing Structure by Heating Type in Springfield
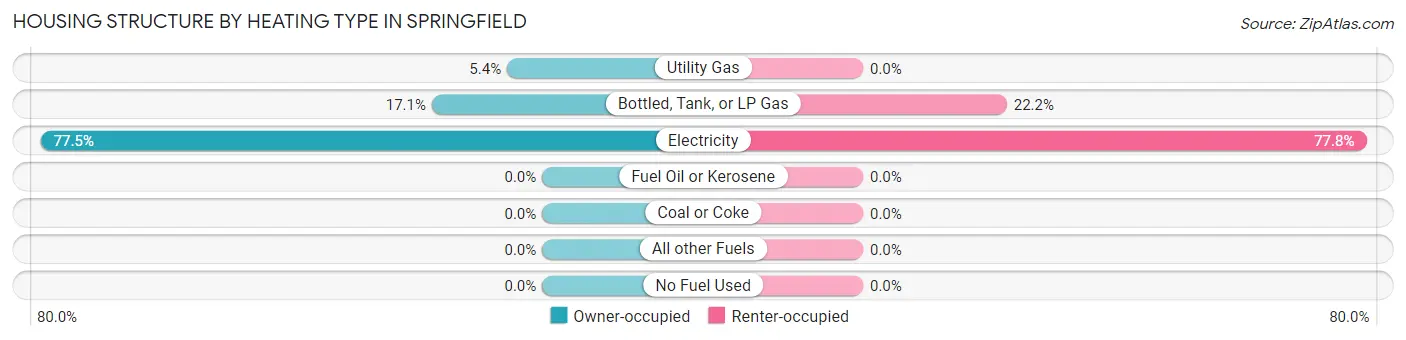
| Heating Type | Owner-occupied | Renter-occupied |
| Utility Gas | 7 (5.4%) | 0 (0.0%) |
| Bottled, Tank, or LP Gas | 22 (17.1%) | 8 (22.2%) |
| Electricity | 100 (77.5%) | 28 (77.8%) |
| Fuel Oil or Kerosene | 0 (0.0%) | 0 (0.0%) |
| Coal or Coke | 0 (0.0%) | 0 (0.0%) |
| All other Fuels | 0 (0.0%) | 0 (0.0%) |
| No Fuel Used | 0 (0.0%) | 0 (0.0%) |
| Total | 129 (100.0%) | 36 (100.0%) |
Household Vehicle Usage in Springfield
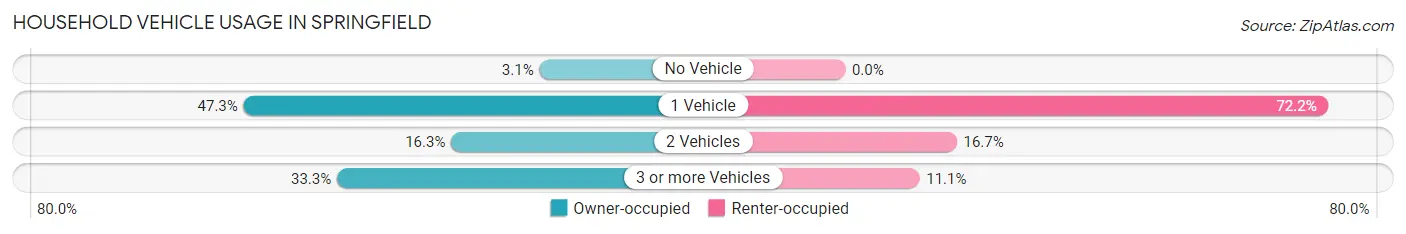
| Vehicles per Household | Owner-occupied | Renter-occupied |
| No Vehicle | 4 (3.1%) | 0 (0.0%) |
| 1 Vehicle | 61 (47.3%) | 26 (72.2%) |
| 2 Vehicles | 21 (16.3%) | 6 (16.7%) |
| 3 or more Vehicles | 43 (33.3%) | 4 (11.1%) |
| Total | 129 (100.0%) | 36 (100.0%) |
Real Estate & Mortgages in Springfield
Real Estate and Mortgage Overview in Springfield
| Characteristic | Without Mortgage | With Mortgage |
| Housing Units | 77 | 52 |
| Median Property Value | $73,800 | $112,500 |
| Median Household Income | $29,792 | $12 |
| Monthly Housing Costs | $353 | $0 |
| Real Estate Taxes | $430 | $2 |
Property Value by Mortgage Status in Springfield
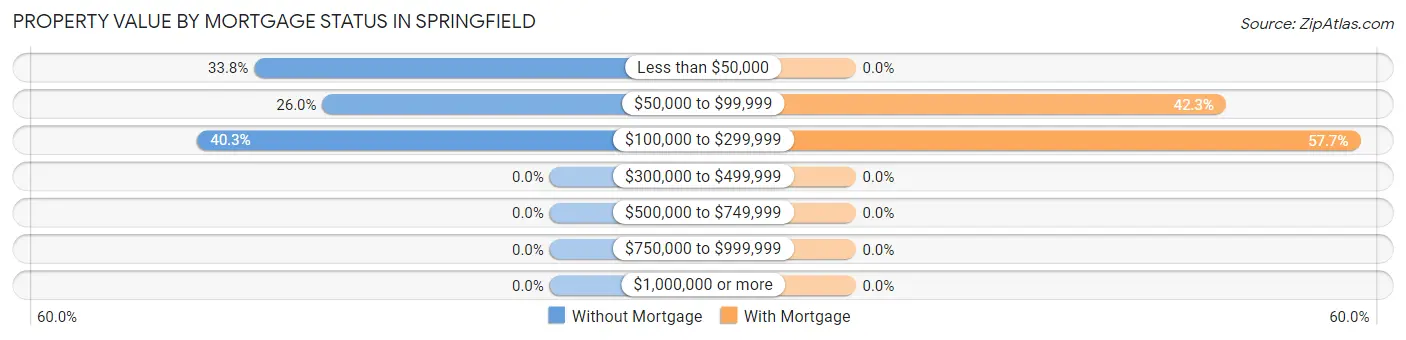
| Property Value | Without Mortgage | With Mortgage |
| Less than $50,000 | 26 (33.8%) | 0 (0.0%) |
| $50,000 to $99,999 | 20 (26.0%) | 22 (42.3%) |
| $100,000 to $299,999 | 31 (40.3%) | 30 (57.7%) |
| $300,000 to $499,999 | 0 (0.0%) | 0 (0.0%) |
| $500,000 to $749,999 | 0 (0.0%) | 0 (0.0%) |
| $750,000 to $999,999 | 0 (0.0%) | 0 (0.0%) |
| $1,000,000 or more | 0 (0.0%) | 0 (0.0%) |
| Total | 77 (100.0%) | 52 (100.0%) |
Household Income by Mortgage Status in Springfield
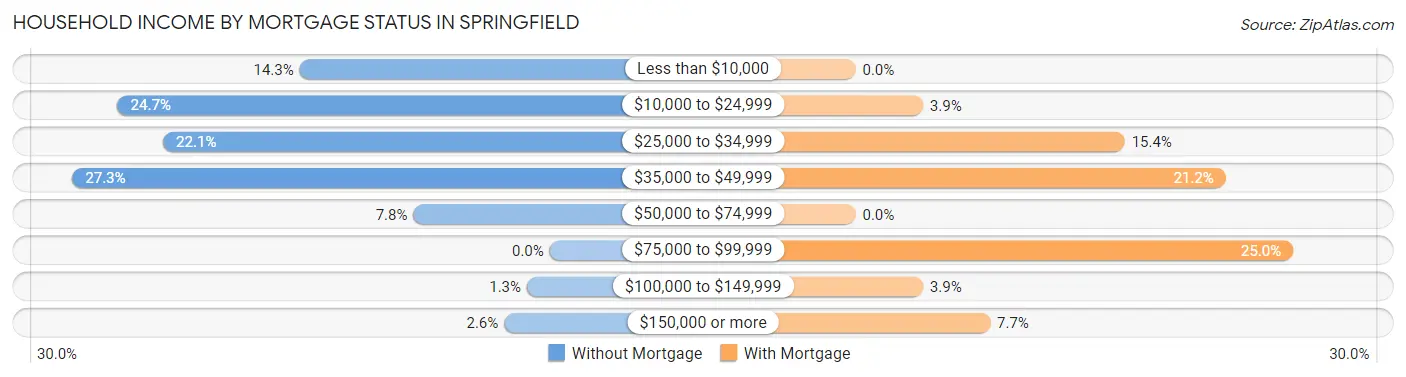
| Household Income | Without Mortgage | With Mortgage |
| Less than $10,000 | 11 (14.3%) | 0 (0.0%) |
| $10,000 to $24,999 | 19 (24.7%) | 2 (3.8%) |
| $25,000 to $34,999 | 17 (22.1%) | 8 (15.4%) |
| $35,000 to $49,999 | 21 (27.3%) | 11 (21.1%) |
| $50,000 to $74,999 | 6 (7.8%) | 0 (0.0%) |
| $75,000 to $99,999 | 0 (0.0%) | 13 (25.0%) |
| $100,000 to $149,999 | 1 (1.3%) | 2 (3.8%) |
| $150,000 or more | 2 (2.6%) | 4 (7.7%) |
| Total | 77 (100.0%) | 52 (100.0%) |
Property Value to Household Income Ratio in Springfield
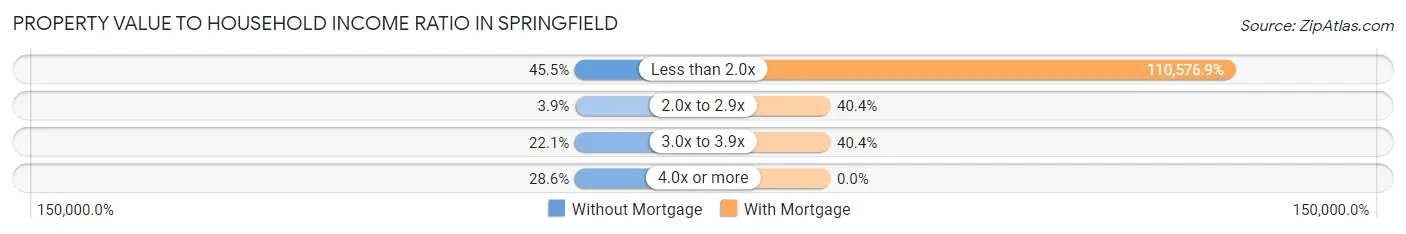
| Value-to-Income Ratio | Without Mortgage | With Mortgage |
| Less than 2.0x | 35 (45.5%) | 57,500 (110,576.9%) |
| 2.0x to 2.9x | 3 (3.9%) | 21 (40.4%) |
| 3.0x to 3.9x | 17 (22.1%) | 21 (40.4%) |
| 4.0x or more | 22 (28.6%) | 0 (0.0%) |
| Total | 77 (100.0%) | 52 (100.0%) |
Real Estate Taxes by Mortgage Status in Springfield
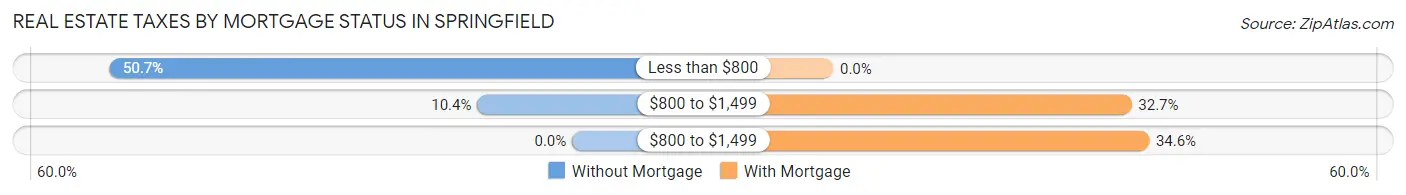
| Property Taxes | Without Mortgage | With Mortgage |
| Less than $800 | 39 (50.6%) | 0 (0.0%) |
| $800 to $1,499 | 8 (10.4%) | 17 (32.7%) |
| $800 to $1,499 | 0 (0.0%) | 18 (34.6%) |
| Total | 77 (100.0%) | 52 (100.0%) |
Health & Disability in Springfield
Health Insurance Coverage by Age in Springfield
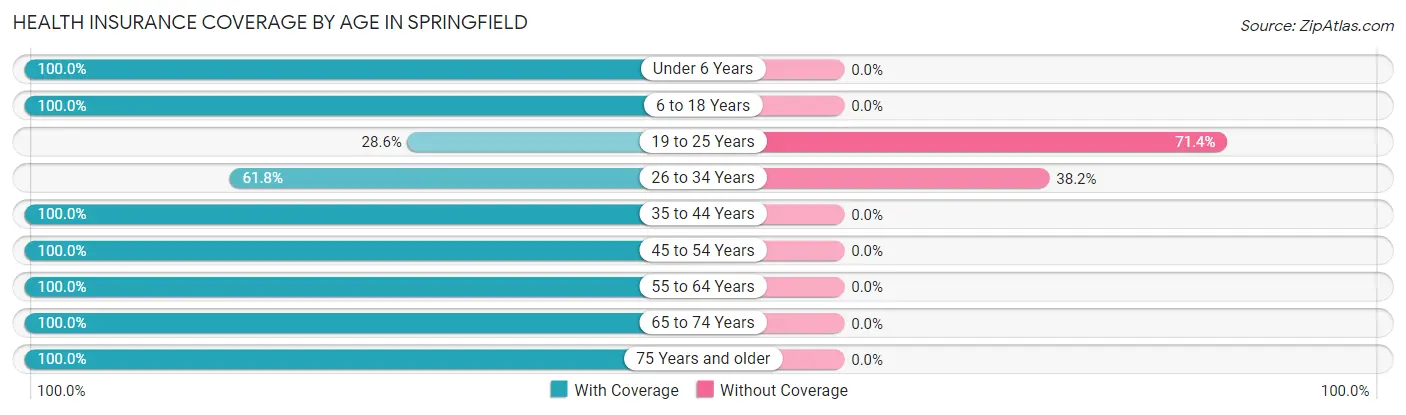
| Age Bracket | With Coverage | Without Coverage |
| Under 6 Years | 77 (100.0%) | 0 (0.0%) |
| 6 to 18 Years | 69 (100.0%) | 0 (0.0%) |
| 19 to 25 Years | 16 (28.6%) | 40 (71.4%) |
| 26 to 34 Years | 21 (61.8%) | 13 (38.2%) |
| 35 to 44 Years | 25 (100.0%) | 0 (0.0%) |
| 45 to 54 Years | 91 (100.0%) | 0 (0.0%) |
| 55 to 64 Years | 43 (100.0%) | 0 (0.0%) |
| 65 to 74 Years | 41 (100.0%) | 0 (0.0%) |
| 75 Years and older | 46 (100.0%) | 0 (0.0%) |
| Total | 429 (89.0%) | 53 (11.0%) |
Health Insurance Coverage by Citizenship Status in Springfield
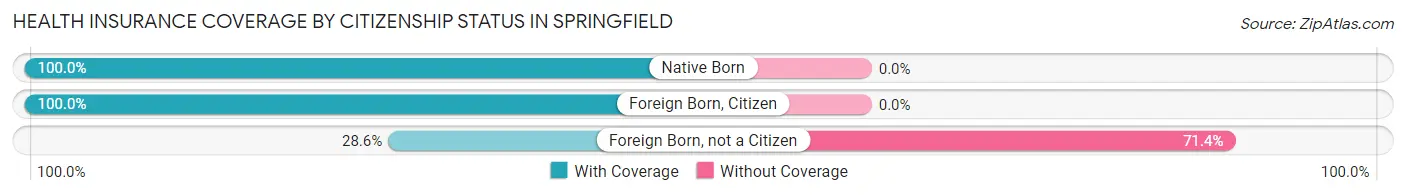
| Citizenship Status | With Coverage | Without Coverage |
| Native Born | 77 (100.0%) | 0 (0.0%) |
| Foreign Born, Citizen | 69 (100.0%) | 0 (0.0%) |
| Foreign Born, not a Citizen | 16 (28.6%) | 40 (71.4%) |
Health Insurance Coverage by Household Income in Springfield
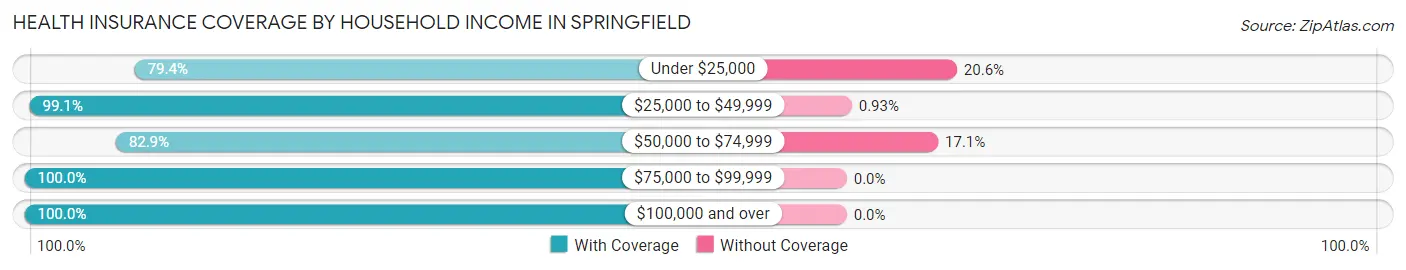
| Household Income | With Coverage | Without Coverage |
| Under $25,000 | 150 (79.4%) | 39 (20.6%) |
| $25,000 to $49,999 | 107 (99.1%) | 1 (0.9%) |
| $50,000 to $74,999 | 63 (82.9%) | 13 (17.1%) |
| $75,000 to $99,999 | 15 (100.0%) | 0 (0.0%) |
| $100,000 and over | 94 (100.0%) | 0 (0.0%) |
Public vs Private Health Insurance Coverage by Age in Springfield
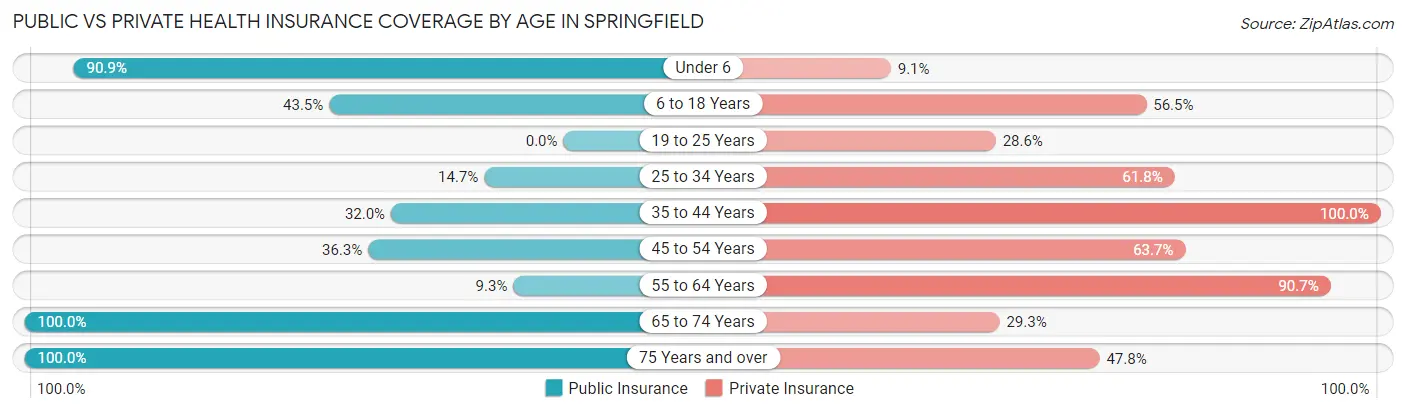
| Age Bracket | Public Insurance | Private Insurance |
| Under 6 | 70 (90.9%) | 7 (9.1%) |
| 6 to 18 Years | 30 (43.5%) | 39 (56.5%) |
| 19 to 25 Years | 0 (0.0%) | 16 (28.6%) |
| 25 to 34 Years | 5 (14.7%) | 21 (61.8%) |
| 35 to 44 Years | 8 (32.0%) | 25 (100.0%) |
| 45 to 54 Years | 33 (36.3%) | 58 (63.7%) |
| 55 to 64 Years | 4 (9.3%) | 39 (90.7%) |
| 65 to 74 Years | 41 (100.0%) | 12 (29.3%) |
| 75 Years and over | 46 (100.0%) | 22 (47.8%) |
| Total | 237 (49.2%) | 239 (49.6%) |
Disability Status by Sex by Age in Springfield
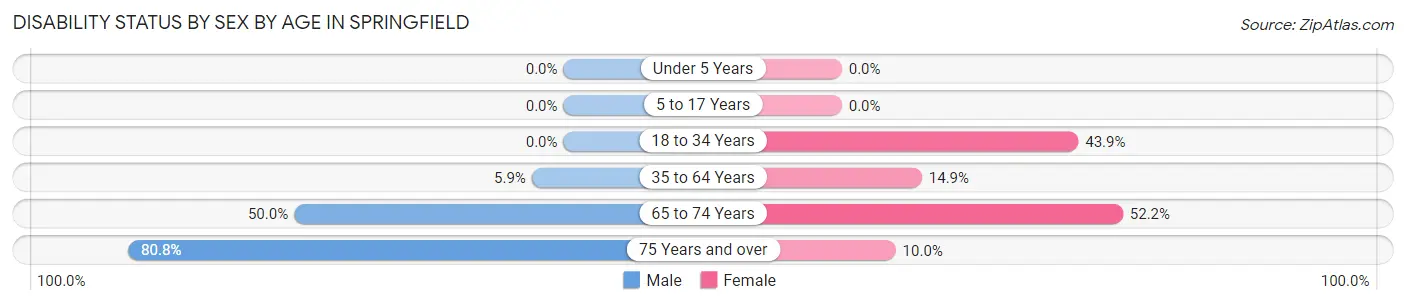
| Age Bracket | Male | Female |
| Under 5 Years | 0 (0.0%) | 0 (0.0%) |
| 5 to 17 Years | 0 (0.0%) | 0 (0.0%) |
| 18 to 34 Years | 0 (0.0%) | 18 (43.9%) |
| 35 to 64 Years | 5 (5.9%) | 11 (14.9%) |
| 65 to 74 Years | 9 (50.0%) | 12 (52.2%) |
| 75 Years and over | 21 (80.8%) | 2 (10.0%) |
Disability Class by Sex by Age in Springfield
Disability Class: Hearing Difficulty
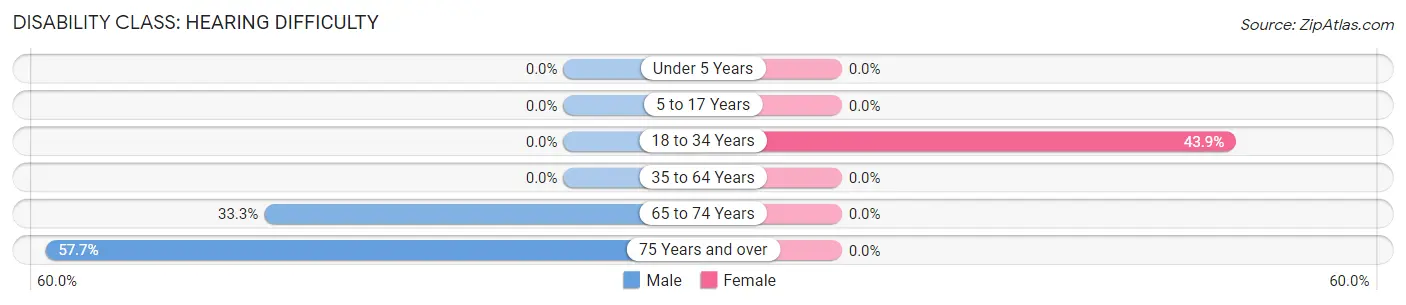
| Age Bracket | Male | Female |
| Under 5 Years | 0 (0.0%) | 0 (0.0%) |
| 5 to 17 Years | 0 (0.0%) | 0 (0.0%) |
| 18 to 34 Years | 0 (0.0%) | 18 (43.9%) |
| 35 to 64 Years | 0 (0.0%) | 0 (0.0%) |
| 65 to 74 Years | 6 (33.3%) | 0 (0.0%) |
| 75 Years and over | 15 (57.7%) | 0 (0.0%) |
Disability Class: Vision Difficulty
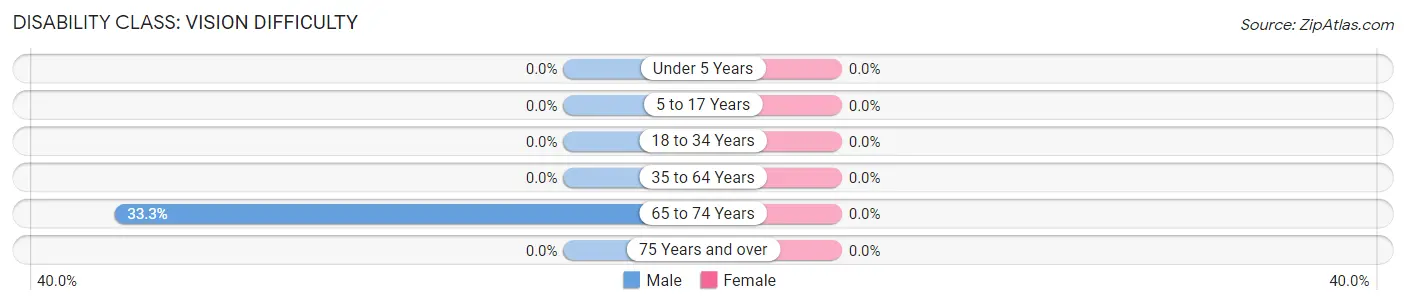
| Age Bracket | Male | Female |
| Under 5 Years | 0 (0.0%) | 0 (0.0%) |
| 5 to 17 Years | 0 (0.0%) | 0 (0.0%) |
| 18 to 34 Years | 0 (0.0%) | 0 (0.0%) |
| 35 to 64 Years | 0 (0.0%) | 0 (0.0%) |
| 65 to 74 Years | 6 (33.3%) | 0 (0.0%) |
| 75 Years and over | 0 (0.0%) | 0 (0.0%) |
Disability Class: Cognitive Difficulty
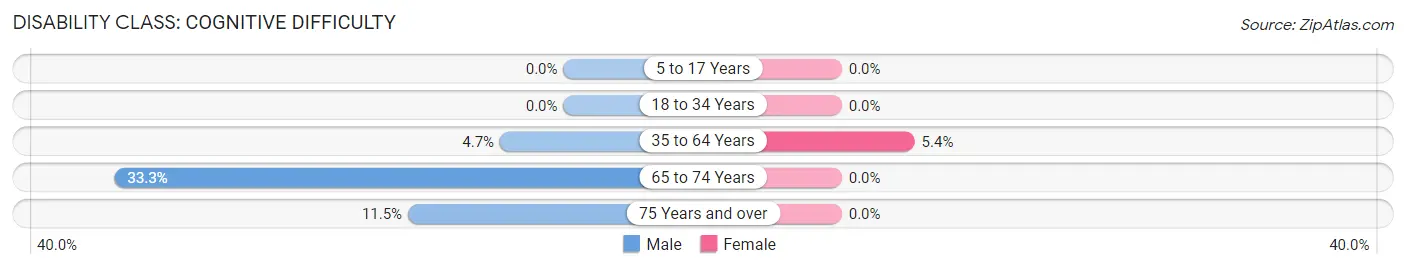
| Age Bracket | Male | Female |
| 5 to 17 Years | 0 (0.0%) | 0 (0.0%) |
| 18 to 34 Years | 0 (0.0%) | 0 (0.0%) |
| 35 to 64 Years | 4 (4.7%) | 4 (5.4%) |
| 65 to 74 Years | 6 (33.3%) | 0 (0.0%) |
| 75 Years and over | 3 (11.5%) | 0 (0.0%) |
Disability Class: Ambulatory Difficulty
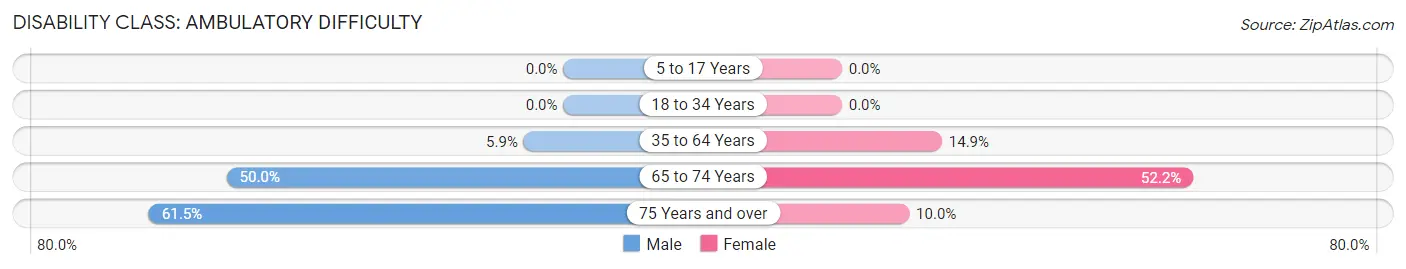
| Age Bracket | Male | Female |
| 5 to 17 Years | 0 (0.0%) | 0 (0.0%) |
| 18 to 34 Years | 0 (0.0%) | 0 (0.0%) |
| 35 to 64 Years | 5 (5.9%) | 11 (14.9%) |
| 65 to 74 Years | 9 (50.0%) | 12 (52.2%) |
| 75 Years and over | 16 (61.5%) | 2 (10.0%) |
Disability Class: Self-Care Difficulty
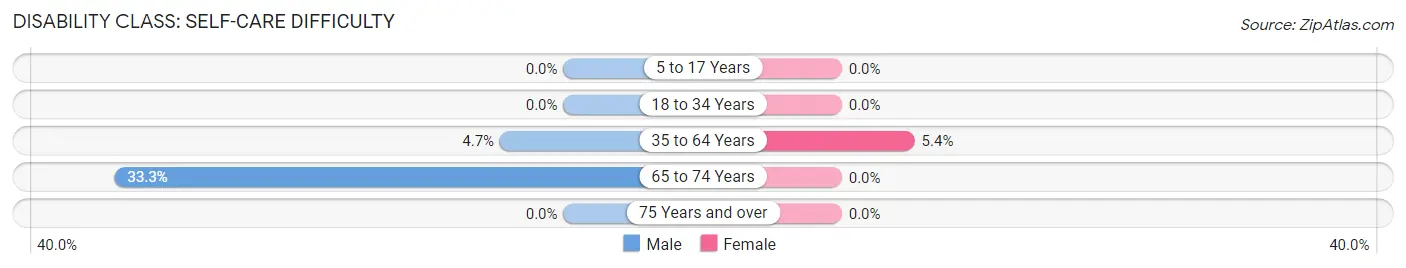
| Age Bracket | Male | Female |
| 5 to 17 Years | 0 (0.0%) | 0 (0.0%) |
| 18 to 34 Years | 0 (0.0%) | 0 (0.0%) |
| 35 to 64 Years | 4 (4.7%) | 4 (5.4%) |
| 65 to 74 Years | 6 (33.3%) | 0 (0.0%) |
| 75 Years and over | 0 (0.0%) | 0 (0.0%) |
Technology Access in Springfield
Computing Device Access in Springfield
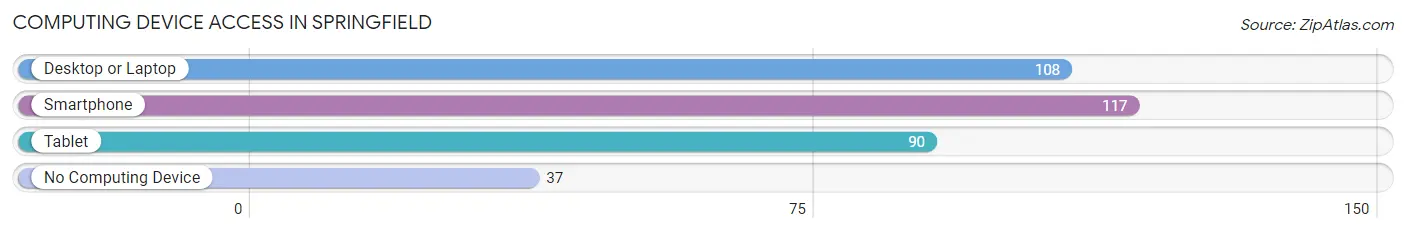
| Device Type | # Households | % Households |
| Desktop or Laptop | 108 | 65.4% |
| Smartphone | 117 | 70.9% |
| Tablet | 90 | 54.5% |
| No Computing Device | 37 | 22.4% |
| Total | 165 | 100.0% |
Internet Access in Springfield
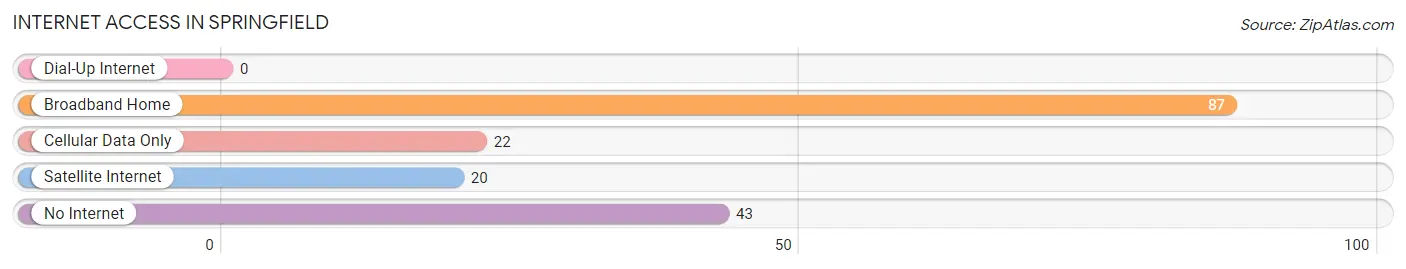
| Internet Type | # Households | % Households |
| Dial-Up Internet | 0 | 0.0% |
| Broadband Home | 87 | 52.7% |
| Cellular Data Only | 22 | 13.3% |
| Satellite Internet | 20 | 12.1% |
| No Internet | 43 | 26.1% |
| Total | 165 | 100.0% |
Springfield Summary
Springfield is a small town located in South Carolina, United States. It is situated in the northeastern part of the state, about 25 miles from the state capital of Columbia. The town has a population of approximately 1,500 people and is part of the Florence County.
History
The town of Springfield was founded in 1820 by a group of settlers from North Carolina. The town was named after the nearby Springfield Plantation, which was owned by the family of William Henry Gist, a prominent South Carolina politician. The town was incorporated in 1822 and was the first town in Florence County.
In the early years, Springfield was a small agricultural community, with cotton and tobacco being the main crops. The town also had a few small businesses, such as a general store and a blacksmith shop.
In the late 19th century, the town began to grow and develop. The railroad arrived in 1887, connecting Springfield to other towns in the region. This allowed for the growth of the local economy and the population began to increase.
In the early 20th century, Springfield was a thriving community. The town had several stores, a bank, a hotel, and a movie theater. The town also had a cotton mill, which provided jobs for many of the town’s residents.
Geography
Springfield is located in the northeastern part of South Carolina, about 25 miles from the state capital of Columbia. The town is situated in the Pee Dee region of the state, which is known for its flat terrain and sandy soil. The town is located on the banks of the Great Pee Dee River, which provides a source of water for the town.
The climate in Springfield is humid subtropical, with hot summers and mild winters. The average annual temperature is around 70 degrees Fahrenheit. The town receives an average of 48 inches of rain per year.
Economy
The economy of Springfield is largely based on agriculture. The town is home to several farms, which produce cotton, tobacco, soybeans, and other crops. The town also has a few small businesses, such as a general store and a blacksmith shop.
The town is also home to a few manufacturing companies, which produce furniture, textiles, and other products. The town also has a few restaurants and other small businesses.
Demographics
As of the 2010 census, the population of Springfield was 1,500 people. The town has a population that is predominantly white, with African Americans making up about 10% of the population. The median household income in the town is around $35,000.
The town has a few churches, including the Springfield Baptist Church, which was founded in 1820. The town also has a few schools, including the Springfield Elementary School and the Springfield High School.
Conclusion
Springfield is a small town located in South Carolina, United States. It is situated in the northeastern part of the state, about 25 miles from the state capital of Columbia. The town has a population of approximately 1,500 people and is part of the Florence County. The town has a long history, with the railroad arriving in 1887 and the town becoming a thriving community in the early 20th century. The economy of Springfield is largely based on agriculture, with a few small businesses and manufacturing companies. The town has a predominantly white population, with African Americans making up about 10% of the population. The town has a few churches and schools, and the median household income is around $35,000.
Common Questions
What is Per Capita Income in Springfield?
Per Capita income in Springfield is $18,076.
What is the Median Family Income in Springfield?
Median Family Income in Springfield is $44,722.
What is the Median Household income in Springfield?
Median Household Income in Springfield is $32,266.
What is Income or Wage Gap in Springfield?
Income or Wage Gap in Springfield is 32.3%.
Women in Springfield earn 67.7 cents for every dollar earned by a man.
What is Inequality or Gini Index in Springfield?
Inequality or Gini Index in Springfield is 0.49.
What is the Total Population of Springfield?
Total Population of Springfield is 482.
What is the Total Male Population of Springfield?
Total Male Population of Springfield is 274.
What is the Total Female Population of Springfield?
Total Female Population of Springfield is 208.
What is the Ratio of Males per 100 Females in Springfield?
There are 131.73 Males per 100 Females in Springfield.
What is the Ratio of Females per 100 Males in Springfield?
There are 75.91 Females per 100 Males in Springfield.
What is the Median Population Age in Springfield?
Median Population Age in Springfield is 35.6 Years.
What is the Average Family Size in Springfield
Average Family Size in Springfield is 4.1 People.
What is the Average Household Size in Springfield
Average Household Size in Springfield is 2.9 People.
How Large is the Labor Force in Springfield?
There are 151 People in the Labor Forcein in Springfield.
What is the Percentage of People in the Labor Force in Springfield?
42.1% of People are in the Labor Force in Springfield.
What is the Unemployment Rate in Springfield?
Unemployment Rate in Springfield is 10.6%.