Estill, SC Map & Demographics
Estill Map
Estill Overview
$18,135
PER CAPITA INCOME
$41,463
AVG FAMILY INCOME
$33,405
AVG HOUSEHOLD INCOME
28.2%
WAGE / INCOME GAP [ % ]
71.8¢/ $1
WAGE / INCOME GAP [ $ ]
$11,436
FAMILY INCOME DEFICIT
0.52
INEQUALITY / GINI INDEX
2,230
TOTAL POPULATION
1,211
MALE POPULATION
1,019
FEMALE POPULATION
118.84
MALES / 100 FEMALES
84.15
FEMALES / 100 MALES
33.4
MEDIAN AGE
3.4
AVG FAMILY SIZE
2.8
AVG HOUSEHOLD SIZE
1,054
LABOR FORCE [ PEOPLE ]
59.3%
PERCENT IN LABOR FORCE
12.5%
UNEMPLOYMENT RATE
Estill Zip Codes
Estill Area Codes
Income in Estill
Income Overview in Estill
Per Capita Income in Estill is $18,135, while median incomes of families and households are $41,463 and $33,405 respectively.
| Characteristic | Number | Measure |
| Per Capita Income | 2,230 | $18,135 |
| Median Family Income | 504 | $41,463 |
| Mean Family Income | 504 | $48,476 |
| Median Household Income | 763 | $33,405 |
| Mean Household Income | 763 | $43,679 |
| Income Deficit | 504 | $11,436 |
| Wage / Income Gap (%) | 2,230 | 28.22% |
| Wage / Income Gap ($) | 2,230 | 71.78¢ per $1 |
| Gini / Inequality Index | 2,230 | 0.52 |
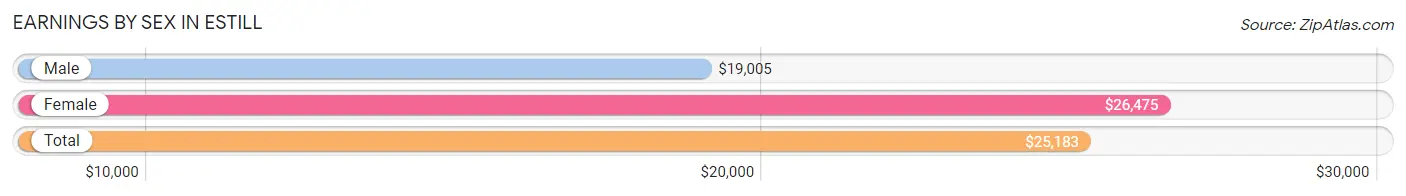
Earnings by Sex in Estill
Average Earnings in Estill are $25,183, $19,005 for men and $26,475 for women, a difference of 28.2%.
| Sex | Number | Average Earnings |
| Male | 672 (62.4%) | $19,005 |
| Female | 405 (37.6%) | $26,475 |
| Total | 1,077 (100.0%) | $25,183 |
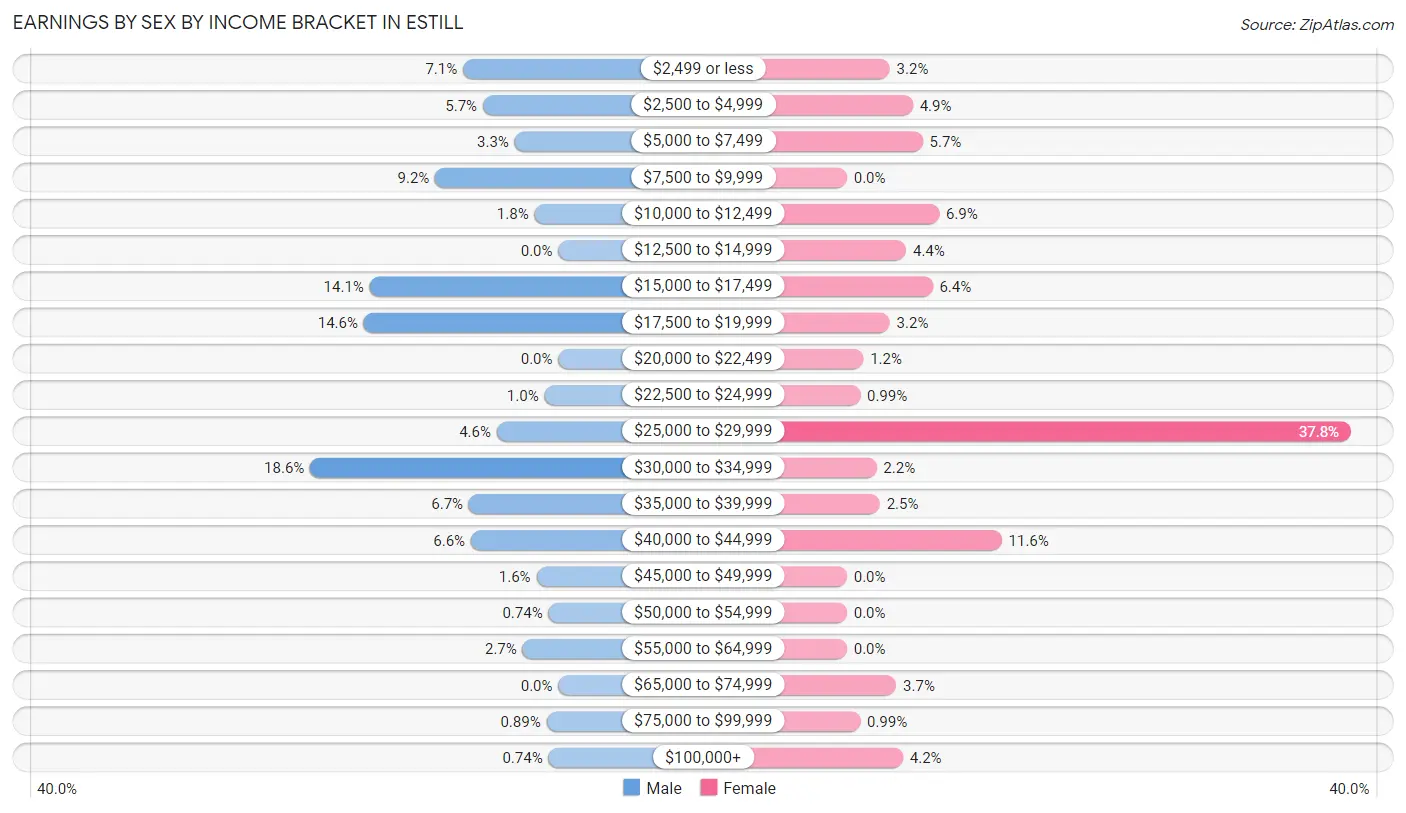
Earnings by Sex by Income Bracket in Estill
The most common earnings brackets in Estill are $30,000 to $34,999 for men (125 | 18.6%) and $25,000 to $29,999 for women (153 | 37.8%).
| Income | Male | Female |
| $2,499 or less | 48 (7.1%) | 13 (3.2%) |
| $2,500 to $4,999 | 38 (5.7%) | 20 (4.9%) |
| $5,000 to $7,499 | 22 (3.3%) | 23 (5.7%) |
| $7,500 to $9,999 | 62 (9.2%) | 0 (0.0%) |
| $10,000 to $12,499 | 12 (1.8%) | 28 (6.9%) |
| $12,500 to $14,999 | 0 (0.0%) | 18 (4.4%) |
| $15,000 to $17,499 | 95 (14.1%) | 26 (6.4%) |
| $17,500 to $19,999 | 98 (14.6%) | 13 (3.2%) |
| $20,000 to $22,499 | 0 (0.0%) | 5 (1.2%) |
| $22,500 to $24,999 | 7 (1.0%) | 4 (1.0%) |
| $25,000 to $29,999 | 31 (4.6%) | 153 (37.8%) |
| $30,000 to $34,999 | 125 (18.6%) | 9 (2.2%) |
| $35,000 to $39,999 | 45 (6.7%) | 10 (2.5%) |
| $40,000 to $44,999 | 44 (6.6%) | 47 (11.6%) |
| $45,000 to $49,999 | 11 (1.6%) | 0 (0.0%) |
| $50,000 to $54,999 | 5 (0.7%) | 0 (0.0%) |
| $55,000 to $64,999 | 18 (2.7%) | 0 (0.0%) |
| $65,000 to $74,999 | 0 (0.0%) | 15 (3.7%) |
| $75,000 to $99,999 | 6 (0.9%) | 4 (1.0%) |
| $100,000+ | 5 (0.7%) | 17 (4.2%) |
| Total | 672 (100.0%) | 405 (100.0%) |
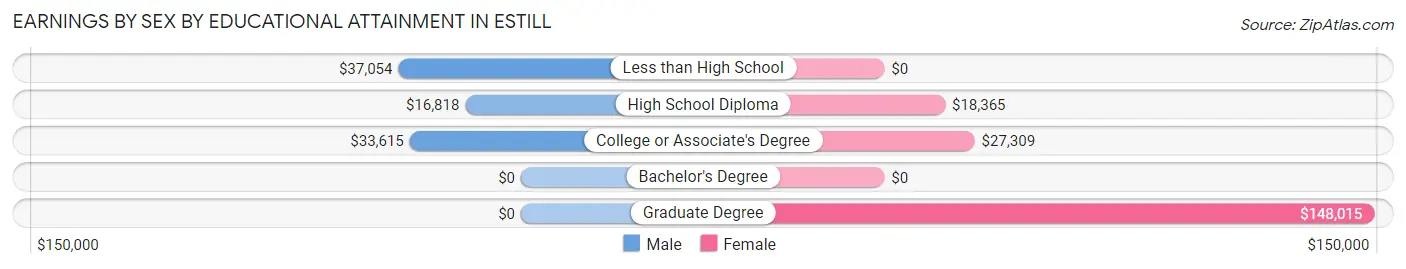
Earnings by Sex by Educational Attainment in Estill
Average earnings in Estill are $28,387 for men and $26,736 for women, a difference of 5.8%. Men with an educational attainment of less than high school enjoy the highest average annual earnings of $37,054, while those with high school diploma education earn the least with $16,818. Women with an educational attainment of graduate degree earn the most with the average annual earnings of $148,015, while those with high school diploma education have the smallest earnings of $18,365.
| Educational Attainment | Male Income | Female Income |
| Less than High School | $37,054 | $0 |
| High School Diploma | $16,818 | $18,365 |
| College or Associate's Degree | $33,615 | $27,309 |
| Bachelor's Degree | - | - |
| Graduate Degree | - | - |
| Total | $28,387 | $26,736 |
Family Income in Estill
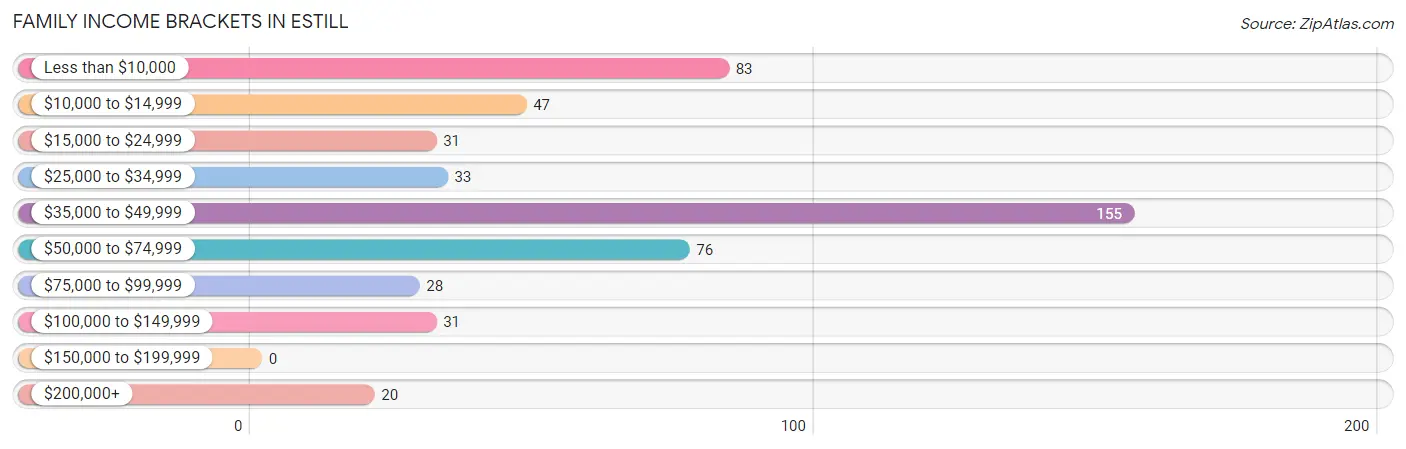
Family Income Brackets in Estill
According to the Estill family income data, there are 155 families falling into the $35,000 to $49,999 income range, which is the most common income bracket and makes up 30.7% of all families.
| Income Bracket | # Families | % Families |
| Less than $10,000 | 83 | 16.5% |
| $10,000 to $14,999 | 47 | 9.3% |
| $15,000 to $24,999 | 31 | 6.2% |
| $25,000 to $34,999 | 33 | 6.5% |
| $35,000 to $49,999 | 155 | 30.8% |
| $50,000 to $74,999 | 76 | 15.1% |
| $75,000 to $99,999 | 28 | 5.6% |
| $100,000 to $149,999 | 31 | 6.2% |
| $150,000 to $199,999 | 0 | 0.0% |
| $200,000+ | 20 | 4.0% |
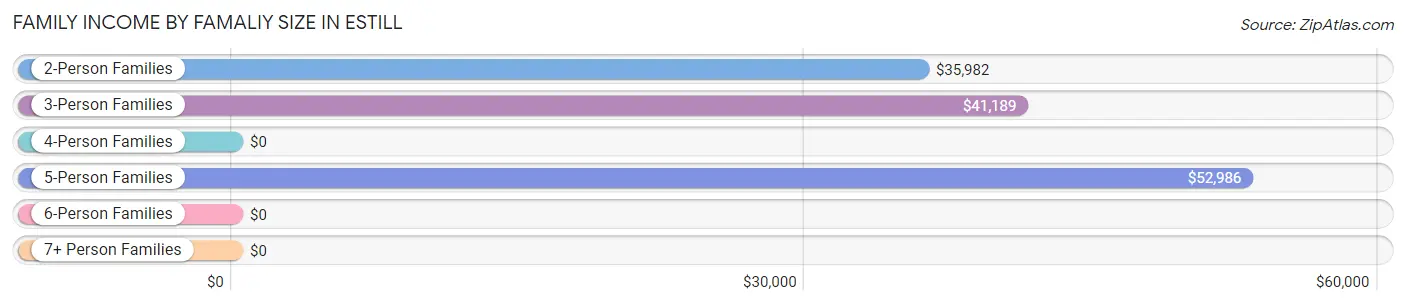
Family Income by Famaliy Size in Estill
5-person families (96 | 19.1%) account for the highest median family income in Estill with $52,986 per family, while 2-person families (199 | 39.5%) have the highest median income of $17,991 per family member.
| Income Bracket | # Families | Median Income |
| 2-Person Families | 199 (39.5%) | $35,982 |
| 3-Person Families | 167 (33.1%) | $41,189 |
| 4-Person Families | 42 (8.3%) | $0 |
| 5-Person Families | 96 (19.1%) | $52,986 |
| 6-Person Families | 0 (0.0%) | $0 |
| 7+ Person Families | 0 (0.0%) | $0 |
| Total | 504 (100.0%) | $41,463 |
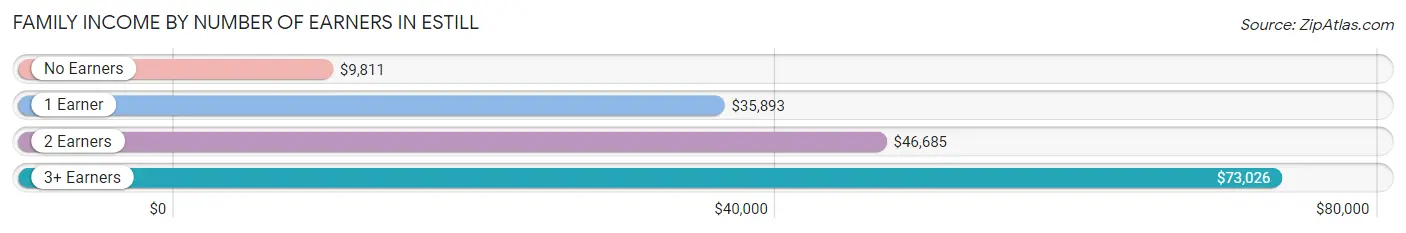
Family Income by Number of Earners in Estill
The median family income in Estill is $41,463, with families comprising 3+ earners (90) having the highest median family income of $73,026, while families with no earners (139) have the lowest median family income of $9,811, accounting for 17.9% and 27.6% of families, respectively.
| Number of Earners | # Families | Median Income |
| No Earners | 139 (27.6%) | $9,811 |
| 1 Earner | 142 (28.2%) | $35,893 |
| 2 Earners | 133 (26.4%) | $46,685 |
| 3+ Earners | 90 (17.9%) | $73,026 |
| Total | 504 (100.0%) | $41,463 |
Household Income in Estill
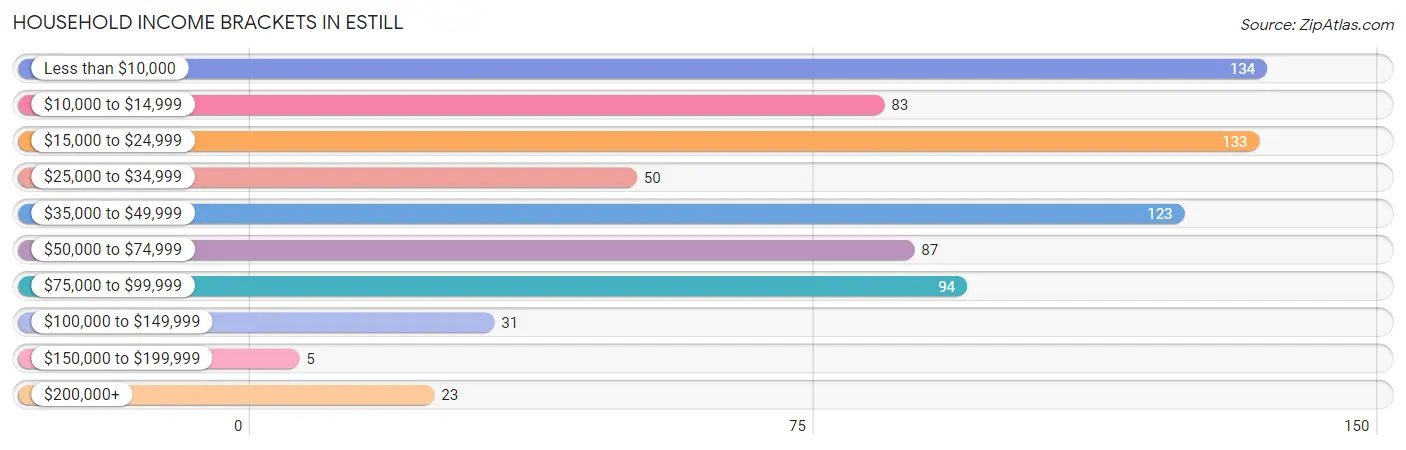
Household Income Brackets in Estill
With 134 households falling in the category, the less than $10,000 income range is the most frequent in Estill, accounting for 17.6% of all households. In contrast, only 5 households (0.7%) fall into the $150,000 to $199,999 income bracket, making it the least populous group.
| Income Bracket | # Households | % Households |
| Less than $10,000 | 134 | 17.6% |
| $10,000 to $14,999 | 83 | 10.9% |
| $15,000 to $24,999 | 133 | 17.4% |
| $25,000 to $34,999 | 50 | 6.6% |
| $35,000 to $49,999 | 123 | 16.1% |
| $50,000 to $74,999 | 87 | 11.4% |
| $75,000 to $99,999 | 94 | 12.3% |
| $100,000 to $149,999 | 31 | 4.1% |
| $150,000 to $199,999 | 5 | 0.7% |
| $200,000+ | 23 | 3.0% |
Household Income by Householder Age in Estill
The median household income in Estill is $33,405, with the highest median household income of $52,986 found in the 45 to 64 years age bracket for the primary householder. A total of 334 households (43.8%) fall into this category. Meanwhile, the 15 to 24 years age bracket for the primary householder has the lowest median household income of $0, with 29 households (3.8%) in this group.
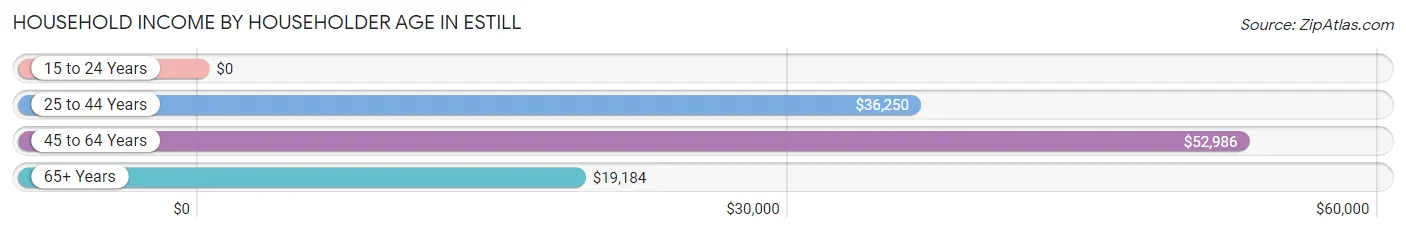
| Income Bracket | # Households | Median Income |
| 15 to 24 Years | 29 (3.8%) | $0 |
| 25 to 44 Years | 192 (25.2%) | $36,250 |
| 45 to 64 Years | 334 (43.8%) | $52,986 |
| 65+ Years | 208 (27.3%) | $19,184 |
| Total | 763 (100.0%) | $33,405 |
Poverty in Estill
Income Below Poverty by Sex and Age in Estill
With 31.2% poverty level for males and 39.6% for females among the residents of Estill, 15 year old males and 12 to 14 year old females are the most vulnerable to poverty, with 38 males (100.0%) and 29 females (70.7%) in their respective age groups living below the poverty level.
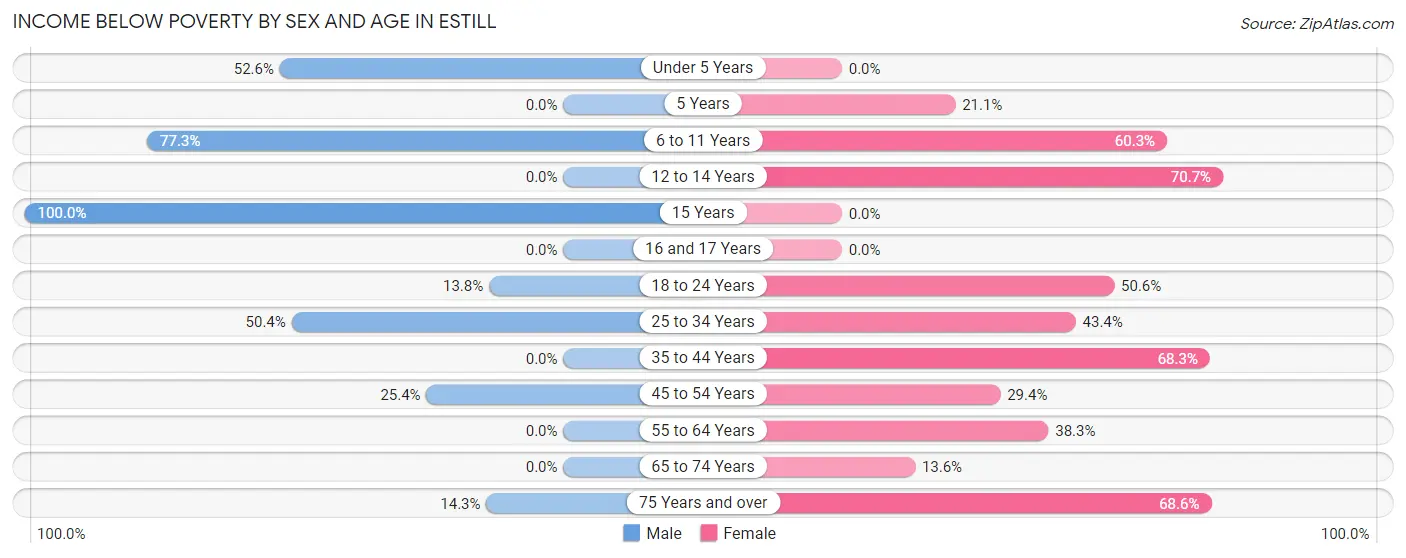
| Age Bracket | Male | Female |
| Under 5 Years | 80 (52.6%) | 0 (0.0%) |
| 5 Years | 0 (0.0%) | 12 (21.0%) |
| 6 to 11 Years | 51 (77.3%) | 35 (60.3%) |
| 12 to 14 Years | 0 (0.0%) | 29 (70.7%) |
| 15 Years | 38 (100.0%) | 0 (0.0%) |
| 16 and 17 Years | 0 (0.0%) | 0 (0.0%) |
| 18 to 24 Years | 32 (13.8%) | 46 (50.5%) |
| 25 to 34 Years | 115 (50.4%) | 69 (43.4%) |
| 35 to 44 Years | 0 (0.0%) | 28 (68.3%) |
| 45 to 54 Years | 47 (25.4%) | 60 (29.4%) |
| 55 to 64 Years | 0 (0.0%) | 23 (38.3%) |
| 65 to 74 Years | 0 (0.0%) | 11 (13.6%) |
| 75 Years and over | 12 (14.3%) | 48 (68.6%) |
| Total | 375 (31.2%) | 361 (39.6%) |
Income Above Poverty by Sex and Age in Estill
According to the poverty statistics in Estill, males aged 12 to 14 years and females aged under 5 years are the age groups that are most secure financially, with 100.0% of males and 100.0% of females in these age groups living above the poverty line.
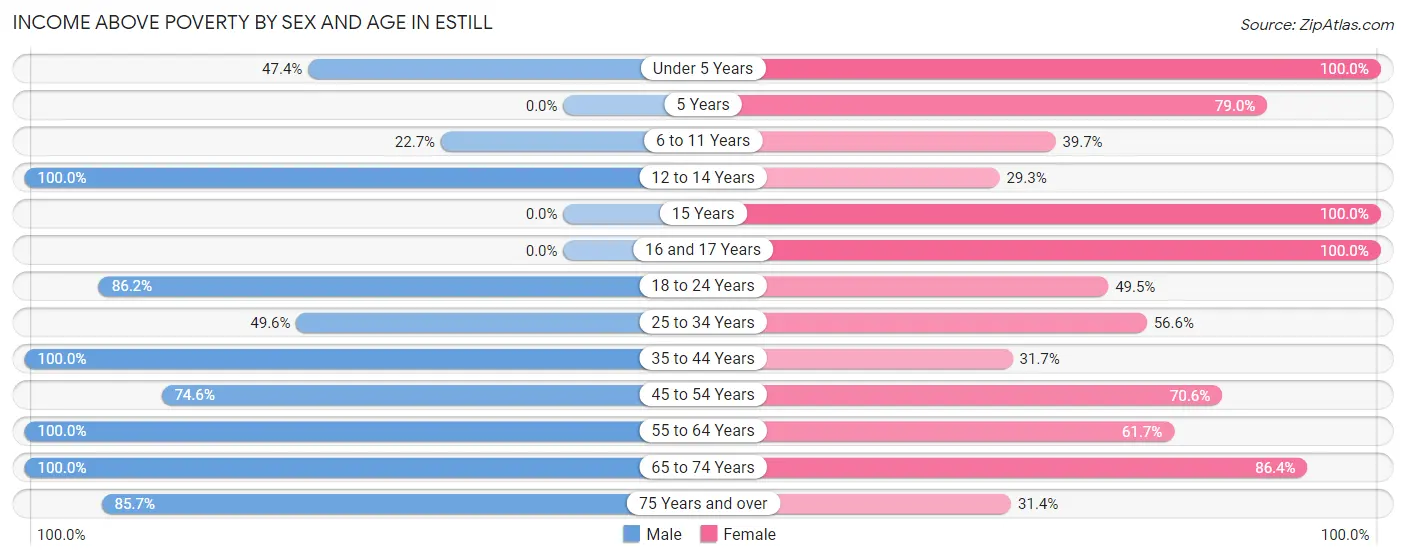
| Age Bracket | Male | Female |
| Under 5 Years | 72 (47.4%) | 8 (100.0%) |
| 5 Years | 0 (0.0%) | 45 (78.9%) |
| 6 to 11 Years | 15 (22.7%) | 23 (39.7%) |
| 12 to 14 Years | 18 (100.0%) | 12 (29.3%) |
| 15 Years | 0 (0.0%) | 14 (100.0%) |
| 16 and 17 Years | 0 (0.0%) | 27 (100.0%) |
| 18 to 24 Years | 200 (86.2%) | 45 (49.4%) |
| 25 to 34 Years | 113 (49.6%) | 90 (56.6%) |
| 35 to 44 Years | 98 (100.0%) | 13 (31.7%) |
| 45 to 54 Years | 138 (74.6%) | 144 (70.6%) |
| 55 to 64 Years | 31 (100.0%) | 37 (61.7%) |
| 65 to 74 Years | 70 (100.0%) | 70 (86.4%) |
| 75 Years and over | 72 (85.7%) | 22 (31.4%) |
| Total | 827 (68.8%) | 550 (60.4%) |
Income Below Poverty Among Married-Couple Families in Estill
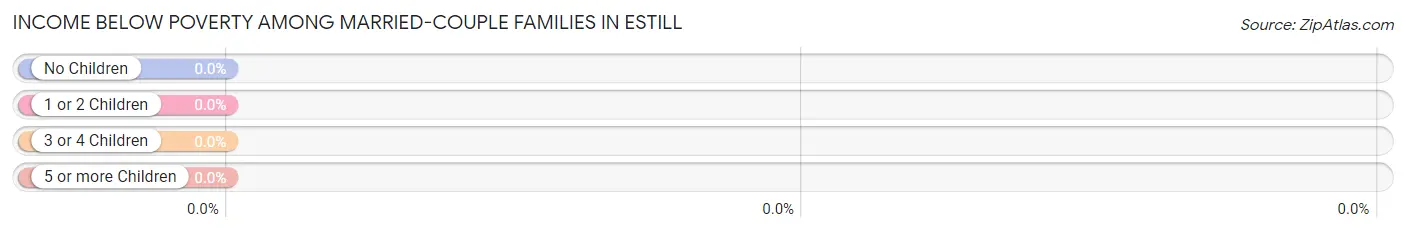
| Children | Above Poverty | Below Poverty |
| No Children | 91 (100.0%) | 0 (0.0%) |
| 1 or 2 Children | 72 (100.0%) | 0 (0.0%) |
| 3 or 4 Children | 20 (100.0%) | 0 (0.0%) |
| 5 or more Children | 0 (0.0%) | 0 (0.0%) |
| Total | 183 (100.0%) | 0 (0.0%) |
Income Below Poverty Among Single-Parent Households in Estill
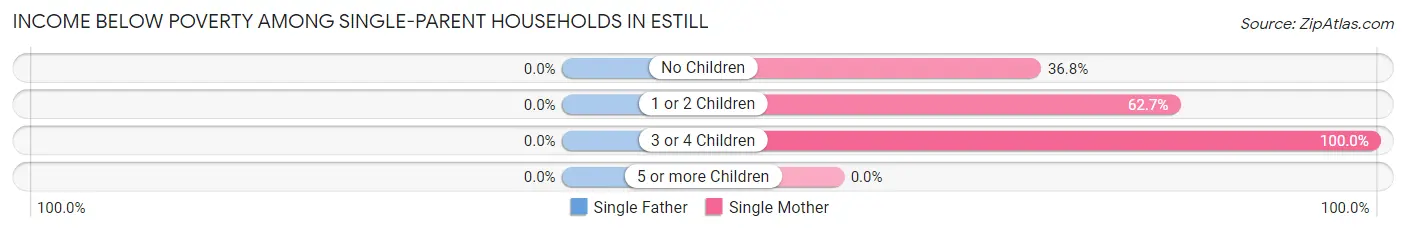
| Children | Single Father | Single Mother |
| No Children | 0 (0.0%) | 43 (36.7%) |
| 1 or 2 Children | 0 (0.0%) | 94 (62.7%) |
| 3 or 4 Children | 0 (0.0%) | 36 (100.0%) |
| 5 or more Children | 0 (0.0%) | 0 (0.0%) |
| Total | 0 (0.0%) | 173 (57.1%) |
Income Below Poverty Among Married-Couple vs Single-Parent Households in Estill
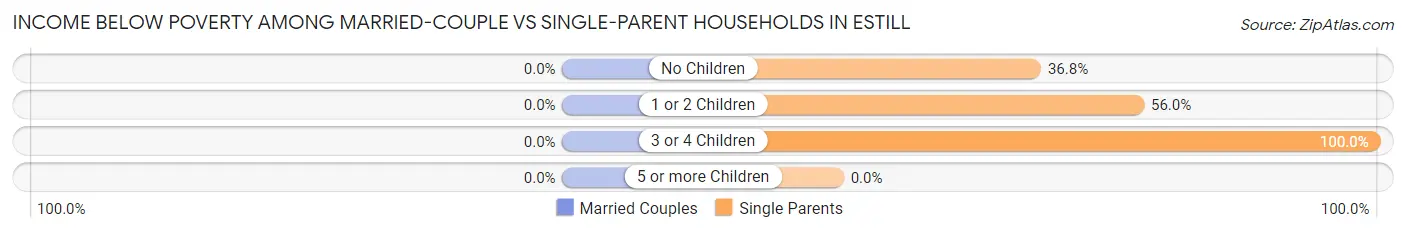
| Children | Married-Couple Families | Single-Parent Households |
| No Children | 0 (0.0%) | 43 (36.7%) |
| 1 or 2 Children | 0 (0.0%) | 94 (55.9%) |
| 3 or 4 Children | 0 (0.0%) | 36 (100.0%) |
| 5 or more Children | 0 (0.0%) | 0 (0.0%) |
| Total | 0 (0.0%) | 173 (53.9%) |
Race in Estill
The most populous races in Estill are Black / African American (1,907 | 85.5%), Hispanic or Latino (214 | 9.6%), and Some other Race (214 | 9.6%).
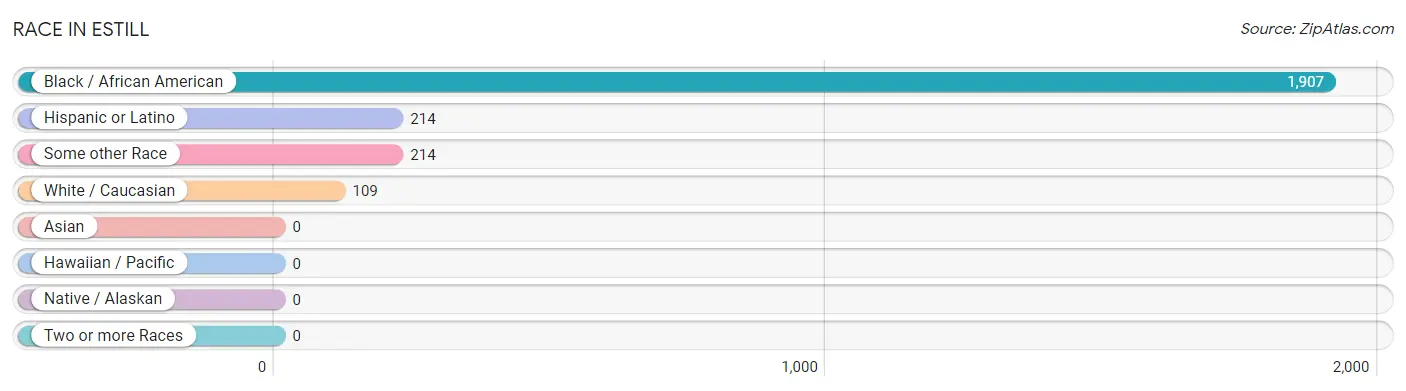
| Race | # Population | % Population |
| Asian | 0 | 0.0% |
| Black / African American | 1,907 | 85.5% |
| Hawaiian / Pacific | 0 | 0.0% |
| Hispanic or Latino | 214 | 9.6% |
| Native / Alaskan | 0 | 0.0% |
| White / Caucasian | 109 | 4.9% |
| Two or more Races | 0 | 0.0% |
| Some other Race | 214 | 9.6% |
| Total | 2,230 | 100.0% |
Ancestry in Estill
The most populous ancestries reported in Estill are Mexican (214 | 9.6%), American (112 | 5.0%), African (50 | 2.2%), Subsaharan African (50 | 2.2%), and English (8 | 0.4%), together accounting for 19.5% of all Estill residents.
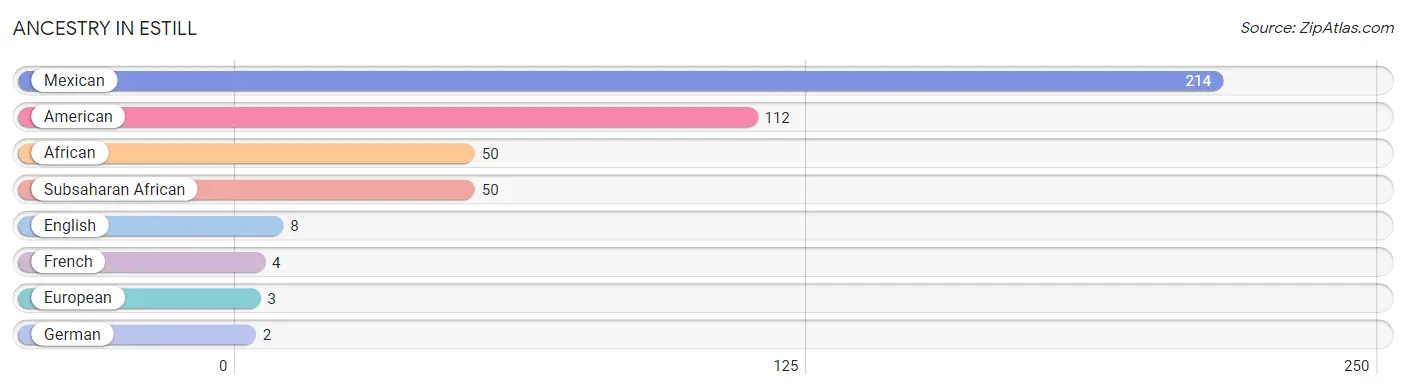
| Ancestry | # Population | % Population |
| African | 50 | 2.2% |
| American | 112 | 5.0% |
| English | 8 | 0.4% |
| European | 3 | 0.1% |
| French | 4 | 0.2% |
| German | 2 | 0.1% |
| Mexican | 214 | 9.6% |
| Subsaharan African | 50 | 2.2% | View All 8 Rows |
Immigrants in Estill
The most numerous immigrant groups reported in Estill came from Central America (110 | 4.9%), Latin America (110 | 4.9%), and Mexico (110 | 4.9%), together accounting for 14.8% of all Estill residents.
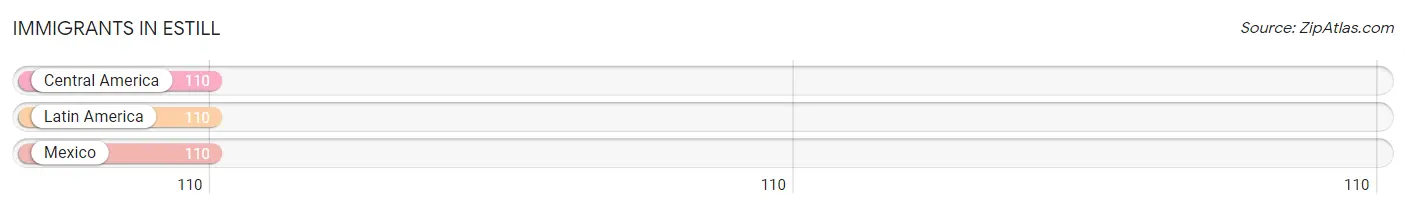
| Immigration Origin | # Population | % Population |
| Central America | 110 | 4.9% |
| Latin America | 110 | 4.9% |
| Mexico | 110 | 4.9% | View All 3 Rows |
Sex and Age in Estill
Sex and Age in Estill
The most populous age groups in Estill are 15 to 19 Years (168 | 13.9%) for men and 45 to 49 Years (139 | 13.6%) for women.
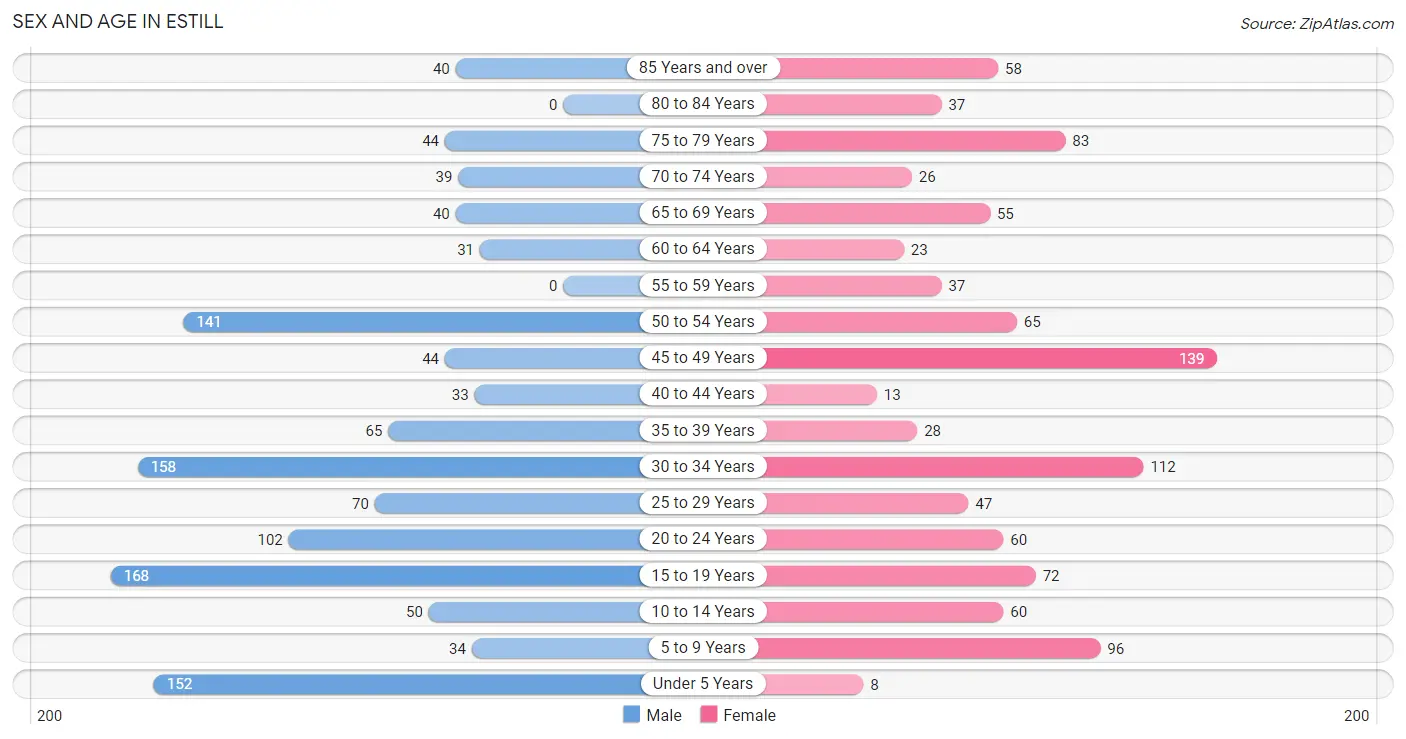
| Age Bracket | Male | Female |
| Under 5 Years | 152 (12.6%) | 8 (0.8%) |
| 5 to 9 Years | 34 (2.8%) | 96 (9.4%) |
| 10 to 14 Years | 50 (4.1%) | 60 (5.9%) |
| 15 to 19 Years | 168 (13.9%) | 72 (7.1%) |
| 20 to 24 Years | 102 (8.4%) | 60 (5.9%) |
| 25 to 29 Years | 70 (5.8%) | 47 (4.6%) |
| 30 to 34 Years | 158 (13.1%) | 112 (11.0%) |
| 35 to 39 Years | 65 (5.4%) | 28 (2.8%) |
| 40 to 44 Years | 33 (2.7%) | 13 (1.3%) |
| 45 to 49 Years | 44 (3.6%) | 139 (13.6%) |
| 50 to 54 Years | 141 (11.6%) | 65 (6.4%) |
| 55 to 59 Years | 0 (0.0%) | 37 (3.6%) |
| 60 to 64 Years | 31 (2.6%) | 23 (2.3%) |
| 65 to 69 Years | 40 (3.3%) | 55 (5.4%) |
| 70 to 74 Years | 39 (3.2%) | 26 (2.5%) |
| 75 to 79 Years | 44 (3.6%) | 83 (8.2%) |
| 80 to 84 Years | 0 (0.0%) | 37 (3.6%) |
| 85 Years and over | 40 (3.3%) | 58 (5.7%) |
| Total | 1,211 (100.0%) | 1,019 (100.0%) |
Families and Households in Estill
Median Family Size in Estill
The median family size in Estill is 3.42 persons per family, with married-couple families (183 | 36.3%) accounting for the largest median family size of 4.16 persons per family. On the other hand, single male/father families (18 | 3.6%) represent the smallest median family size with 2.11 persons per family.
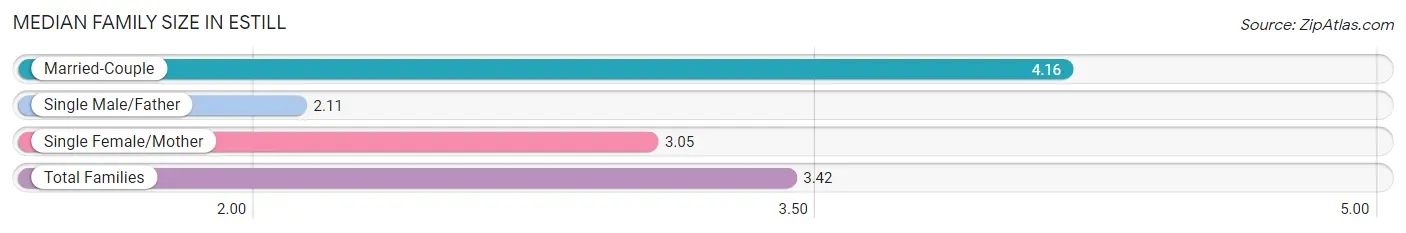
| Family Type | # Families | Family Size |
| Married-Couple | 183 (36.3%) | 4.16 |
| Single Male/Father | 18 (3.6%) | 2.11 |
| Single Female/Mother | 303 (60.1%) | 3.05 |
| Total Families | 504 (100.0%) | 3.42 |
Median Household Size in Estill
The median household size in Estill is 2.76 persons per household, with married-couple households (183 | 24.0%) accounting for the largest median household size of 4.16 persons per household. non-family households (259 | 33.9%) represent the smallest median household size with 1.15 persons per household.
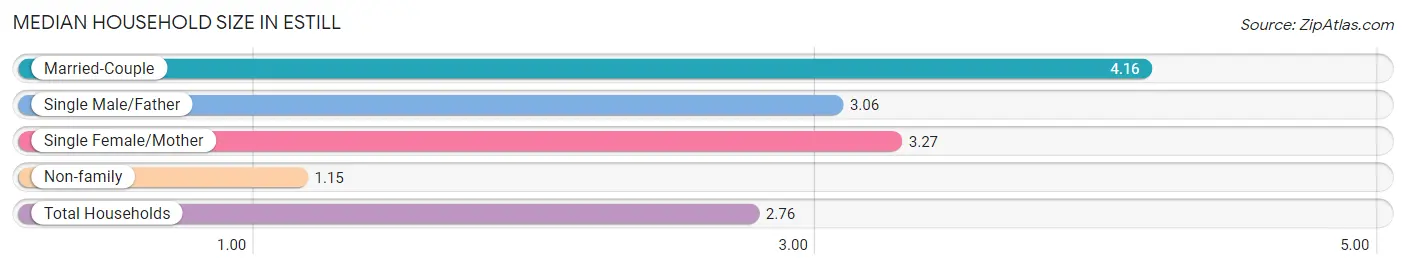
| Household Type | # Households | Household Size |
| Married-Couple | 183 (24.0%) | 4.16 |
| Single Male/Father | 18 (2.4%) | 3.06 |
| Single Female/Mother | 303 (39.7%) | 3.27 |
| Non-family | 259 (33.9%) | 1.15 |
| Total Households | 763 (100.0%) | 2.76 |
Household Size by Marriage Status in Estill
Out of a total of 763 households in Estill, 504 (66.1%) are family households, while 259 (33.9%) are nonfamily households. The most numerous type of family households are 3-person households, comprising 250, and the most common type of nonfamily households are 1-person households, comprising 241.
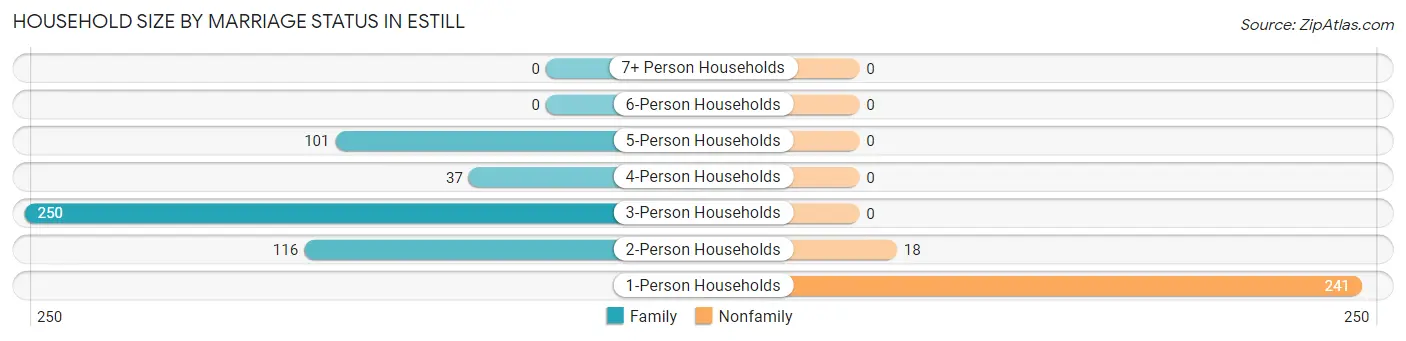
| Household Size | Family Households | Nonfamily Households |
| 1-Person Households | - | 241 (31.6%) |
| 2-Person Households | 116 (15.2%) | 18 (2.4%) |
| 3-Person Households | 250 (32.8%) | 0 (0.0%) |
| 4-Person Households | 37 (4.9%) | 0 (0.0%) |
| 5-Person Households | 101 (13.2%) | 0 (0.0%) |
| 6-Person Households | 0 (0.0%) | 0 (0.0%) |
| 7+ Person Households | 0 (0.0%) | 0 (0.0%) |
| Total | 504 (66.1%) | 259 (33.9%) |
Female Fertility in Estill
Fertility by Age in Estill
Average fertility rate in Estill is 206.0 births per 1,000 women. Women in the age bracket of 15 to 19 years have the highest fertility rate with 375.0 births per 1,000 women. Women in the age bracket of 20 to 34 years acount for 72.2% of all women with births.
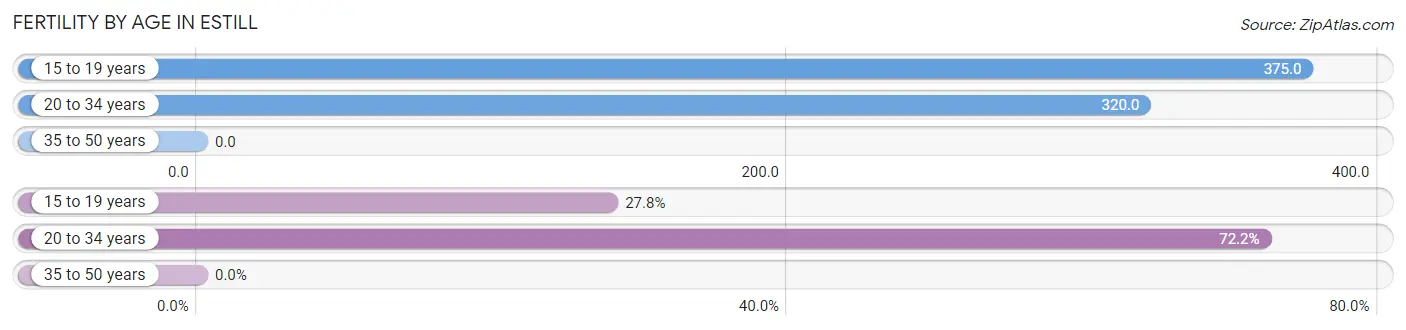
| Age Bracket | Women with Births | Births / 1,000 Women |
| 15 to 19 years | 27 (27.8%) | 375.0 |
| 20 to 34 years | 70 (72.2%) | 320.0 |
| 35 to 50 years | 0 (0.0%) | 0.0 |
| Total | 97 (100.0%) | 206.0 |
Fertility by Age by Marriage Status in Estill
20.6% of women with births (97) in Estill are married. The highest percentage of unmarried women with births falls into 15 to 19 years age bracket with 100.0% of them unmarried at the time of birth, while the lowest percentage of unmarried women with births belong to 20 to 34 years age bracket with 71.4% of them unmarried.
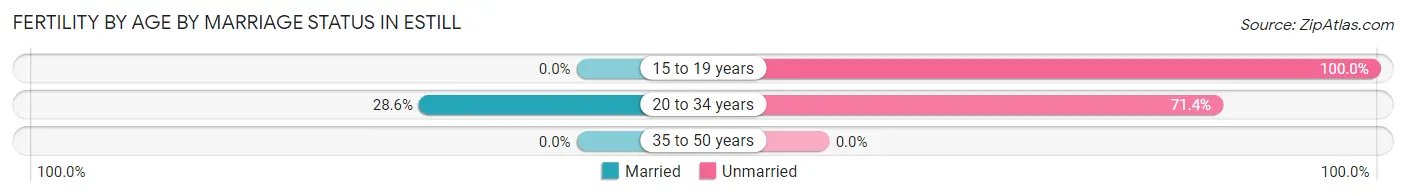
| Age Bracket | Married | Unmarried |
| 15 to 19 years | 0 (0.0%) | 27 (100.0%) |
| 20 to 34 years | 20 (28.6%) | 50 (71.4%) |
| 35 to 50 years | 0 (0.0%) | 0 (0.0%) |
| Total | 20 (20.6%) | 77 (79.4%) |
Fertility by Education in Estill
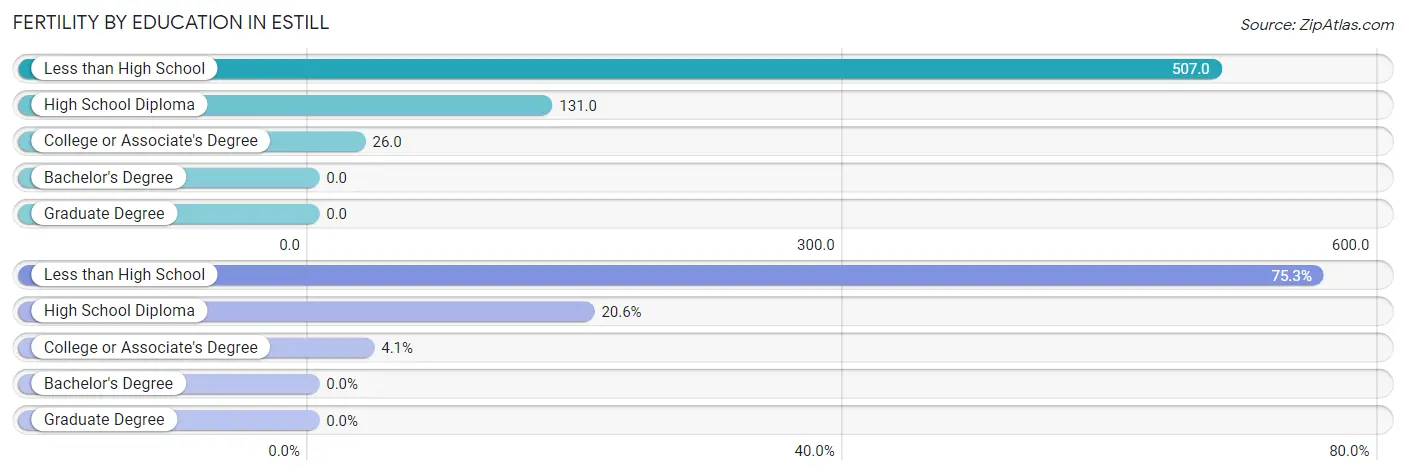
| Educational Attainment | Women with Births | Births / 1,000 Women |
| Less than High School | 73 (75.3%) | 507.0 |
| High School Diploma | 20 (20.6%) | 131.0 |
| College or Associate's Degree | 4 (4.1%) | 26.0 |
| Bachelor's Degree | 0 (0.0%) | 0.0 |
| Graduate Degree | 0 (0.0%) | 0.0 |
| Total | 97 (100.0%) | 206.0 |
Fertility by Education by Marriage Status in Estill
79.4% of women with births in Estill are unmarried. Women with the educational attainment of high school diploma are most likely to be married with 100.0% of them married at childbirth, while women with the educational attainment of less than high school are least likely to be married with 100.0% of them unmarried at childbirth.
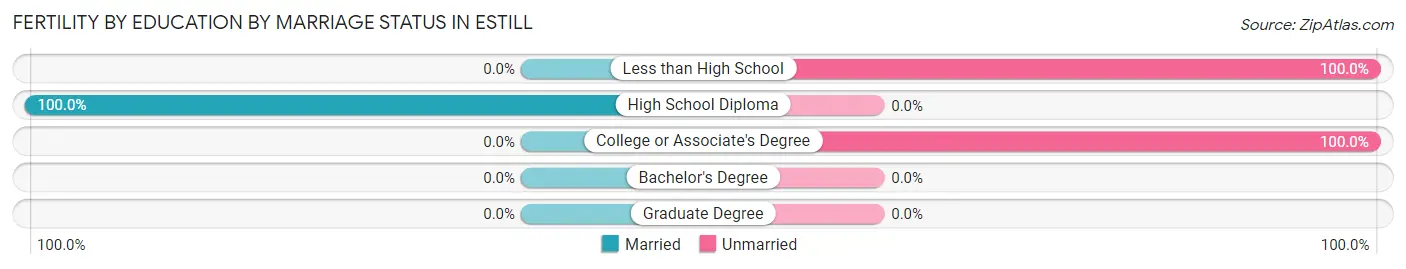
| Educational Attainment | Married | Unmarried |
| Less than High School | 0 (0.0%) | 73 (100.0%) |
| High School Diploma | 20 (100.0%) | 0 (0.0%) |
| College or Associate's Degree | 0 (0.0%) | 4 (100.0%) |
| Bachelor's Degree | 0 (0.0%) | 0 (0.0%) |
| Graduate Degree | 0 (0.0%) | 0 (0.0%) |
| Total | 20 (20.6%) | 77 (79.4%) |
Employment Characteristics in Estill
Employment by Class of Employer in Estill
Among the 919 employed individuals in Estill, private company employees (679 | 73.9%), state government employees (77 | 8.4%), and self-employed (not incorporated) (74 | 8.1%) make up the most common classes of employment.
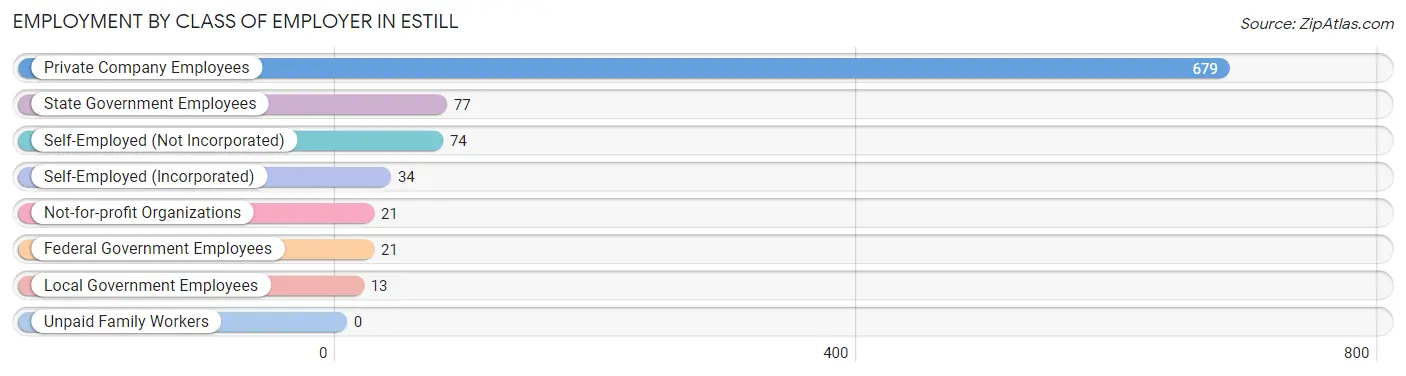
| Employer Class | # Employees | % Employees |
| Private Company Employees | 679 | 73.9% |
| Self-Employed (Incorporated) | 34 | 3.7% |
| Self-Employed (Not Incorporated) | 74 | 8.1% |
| Not-for-profit Organizations | 21 | 2.3% |
| Local Government Employees | 13 | 1.4% |
| State Government Employees | 77 | 8.4% |
| Federal Government Employees | 21 | 2.3% |
| Unpaid Family Workers | 0 | 0.0% |
| Total | 919 | 100.0% |
Employment Status by Age in Estill
According to the labor force statistics for Estill, out of the total population over 16 years of age (1,778), 59.3% or 1,054 individuals are in the labor force, with 12.5% or 132 of them unemployed. The age group with the highest labor force participation rate is 55 to 59 years, with 100.0% or 37 individuals in the labor force. Within the labor force, the 20 to 24 years age range has the highest percentage of unemployed individuals, with 86.1% or 87 of them being unemployed.
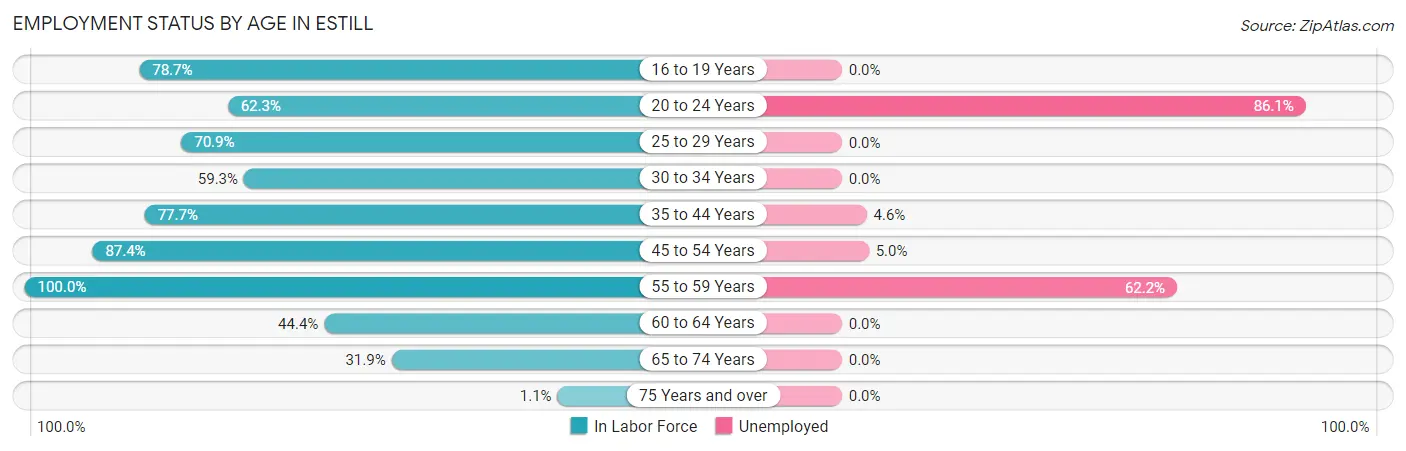
| Age Bracket | In Labor Force | Unemployed |
| 16 to 19 Years | 148 (78.7%) | 0 (0.0%) |
| 20 to 24 Years | 101 (62.3%) | 87 (86.1%) |
| 25 to 29 Years | 83 (70.9%) | 0 (0.0%) |
| 30 to 34 Years | 160 (59.3%) | 0 (0.0%) |
| 35 to 44 Years | 108 (77.7%) | 5 (4.6%) |
| 45 to 54 Years | 340 (87.4%) | 17 (5.0%) |
| 55 to 59 Years | 37 (100.0%) | 23 (62.2%) |
| 60 to 64 Years | 24 (44.4%) | 0 (0.0%) |
| 65 to 74 Years | 51 (31.9%) | 0 (0.0%) |
| 75 Years and over | 3 (1.1%) | 0 (0.0%) |
| Total | 1,054 (59.3%) | 132 (12.5%) |
Employment Status by Educational Attainment in Estill
According to labor force statistics for Estill, 74.8% of individuals (752) out of the total population between 25 and 64 years of age (1,006) are in the labor force, with 6.0% or 45 of them being unemployed. The group with the highest labor force participation rate are those with the educational attainment of college / associate degree, with 89.0% or 299 individuals in the labor force. Within the labor force, individuals with less than high school education have the highest percentage of unemployment, with 29.5% or 23 of them being unemployed.
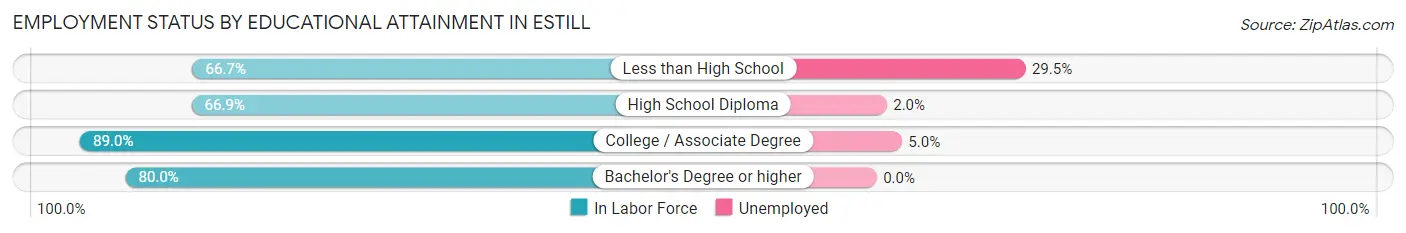
| Educational Attainment | In Labor Force | Unemployed |
| Less than High School | 78 (66.7%) | 35 (29.5%) |
| High School Diploma | 343 (66.9%) | 10 (2.0%) |
| College / Associate Degree | 299 (89.0%) | 17 (5.0%) |
| Bachelor's Degree or higher | 32 (80.0%) | 0 (0.0%) |
| Total | 752 (74.8%) | 60 (6.0%) |
Employment Occupations by Sex in Estill
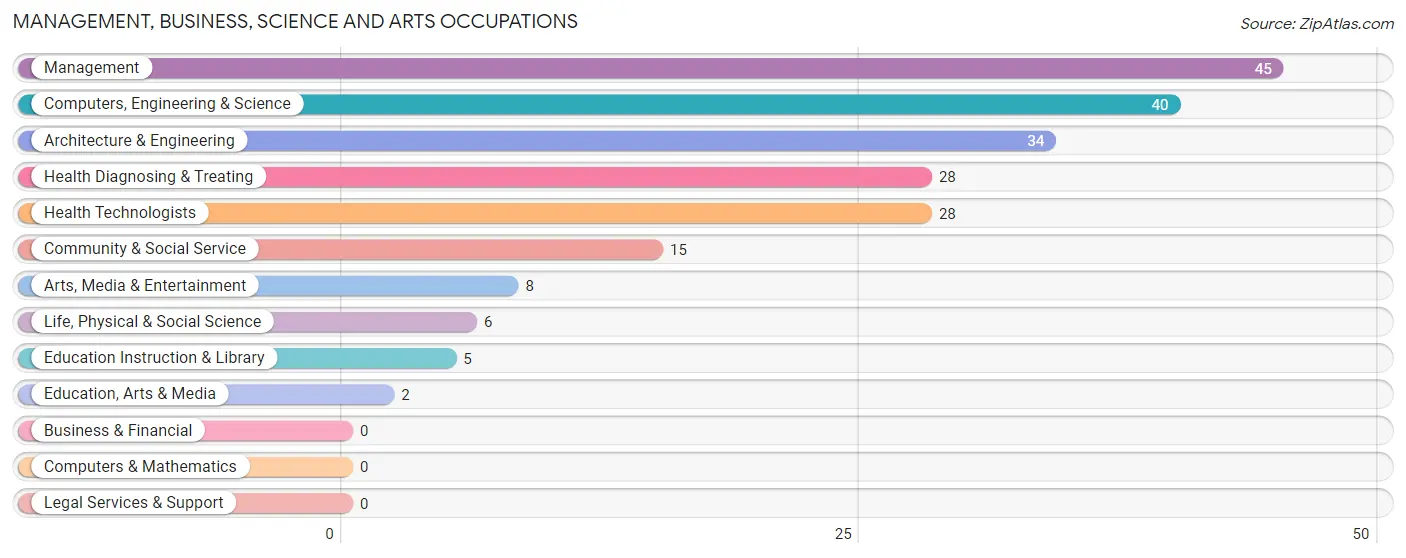
Management, Business, Science and Arts Occupations
The most common Management, Business, Science and Arts occupations in Estill are Management (45 | 4.9%), Computers, Engineering & Science (40 | 4.3%), Architecture & Engineering (34 | 3.7%), Health Diagnosing & Treating (28 | 3.0%), and Health Technologists (28 | 3.0%).
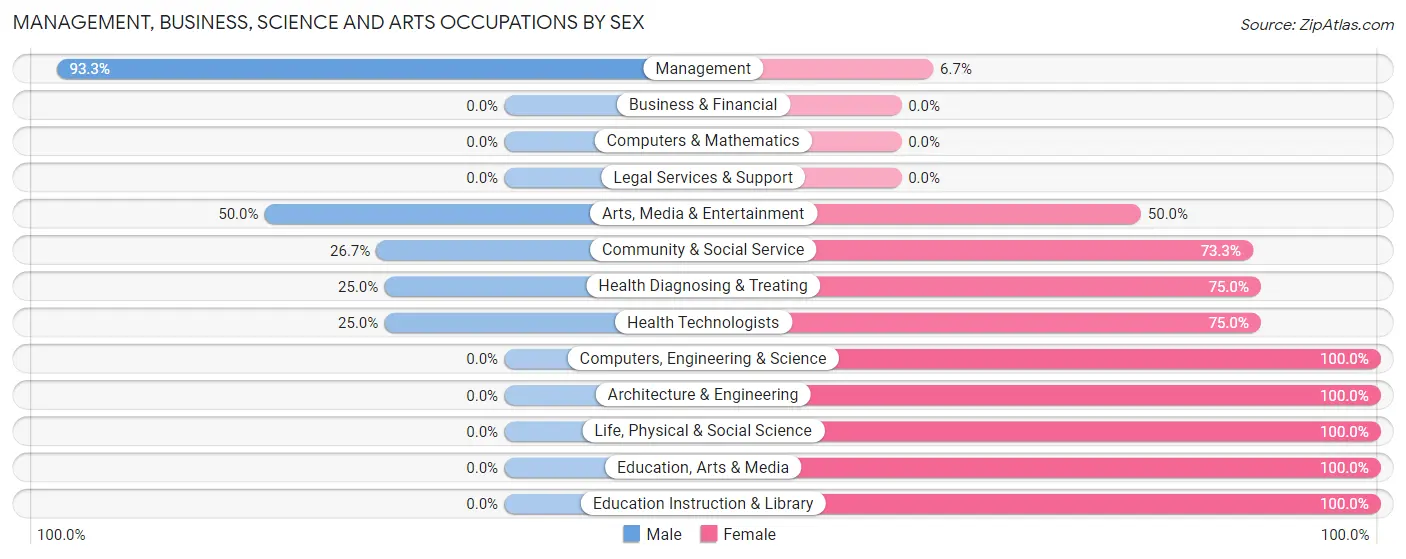
Management, Business, Science and Arts Occupations by Sex
Within the Management, Business, Science and Arts occupations in Estill, the most male-oriented occupations are Management (93.3%), Arts, Media & Entertainment (50.0%), and Community & Social Service (26.7%), while the most female-oriented occupations are Computers, Engineering & Science (100.0%), Architecture & Engineering (100.0%), and Life, Physical & Social Science (100.0%).
| Occupation | Male | Female |
| Management | 42 (93.3%) | 3 (6.7%) |
| Business & Financial | 0 (0.0%) | 0 (0.0%) |
| Computers, Engineering & Science | 0 (0.0%) | 40 (100.0%) |
| Computers & Mathematics | 0 (0.0%) | 0 (0.0%) |
| Architecture & Engineering | 0 (0.0%) | 34 (100.0%) |
| Life, Physical & Social Science | 0 (0.0%) | 6 (100.0%) |
| Community & Social Service | 4 (26.7%) | 11 (73.3%) |
| Education, Arts & Media | 0 (0.0%) | 2 (100.0%) |
| Legal Services & Support | 0 (0.0%) | 0 (0.0%) |
| Education Instruction & Library | 0 (0.0%) | 5 (100.0%) |
| Arts, Media & Entertainment | 4 (50.0%) | 4 (50.0%) |
| Health Diagnosing & Treating | 7 (25.0%) | 21 (75.0%) |
| Health Technologists | 7 (25.0%) | 21 (75.0%) |
| Total (Category) | 53 (41.4%) | 75 (58.6%) |
| Total (Overall) | 571 (61.9%) | 352 (38.1%) |
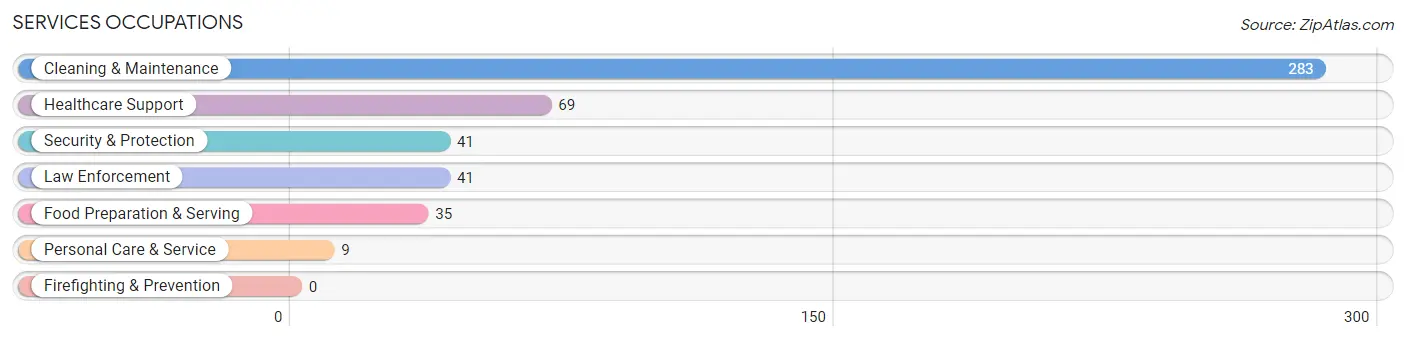
Services Occupations
The most common Services occupations in Estill are Cleaning & Maintenance (283 | 30.7%), Healthcare Support (69 | 7.5%), Security & Protection (41 | 4.4%), Law Enforcement (41 | 4.4%), and Food Preparation & Serving (35 | 3.8%).
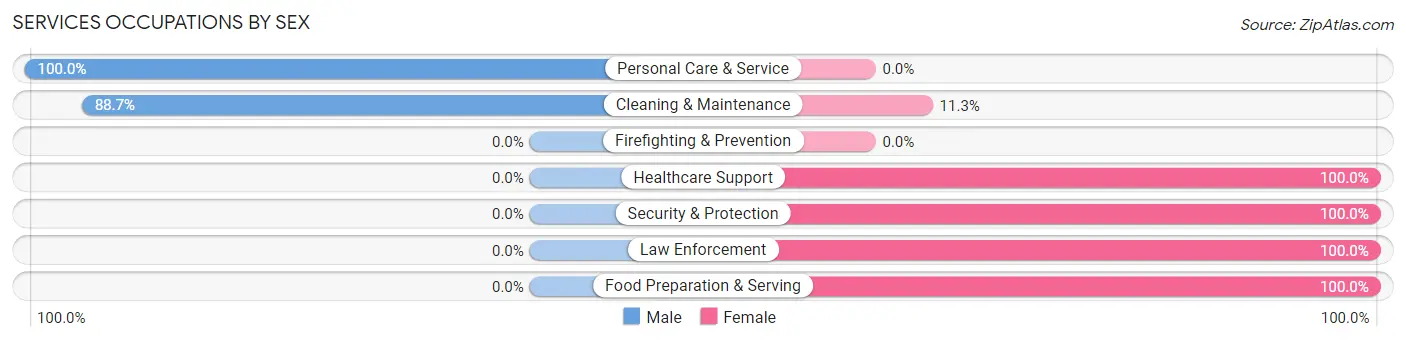
Services Occupations by Sex
Within the Services occupations in Estill, the most male-oriented occupations are Personal Care & Service (100.0%), and Cleaning & Maintenance (88.7%), while the most female-oriented occupations are Healthcare Support (100.0%), Security & Protection (100.0%), and Law Enforcement (100.0%).
| Occupation | Male | Female |
| Healthcare Support | 0 (0.0%) | 69 (100.0%) |
| Security & Protection | 0 (0.0%) | 41 (100.0%) |
| Firefighting & Prevention | 0 (0.0%) | 0 (0.0%) |
| Law Enforcement | 0 (0.0%) | 41 (100.0%) |
| Food Preparation & Serving | 0 (0.0%) | 35 (100.0%) |
| Cleaning & Maintenance | 251 (88.7%) | 32 (11.3%) |
| Personal Care & Service | 9 (100.0%) | 0 (0.0%) |
| Total (Category) | 260 (59.5%) | 177 (40.5%) |
| Total (Overall) | 571 (61.9%) | 352 (38.1%) |
Sales and Office Occupations
The most common Sales and Office occupations in Estill are Office & Administration (65 | 7.0%), and Sales & Related (36 | 3.9%).
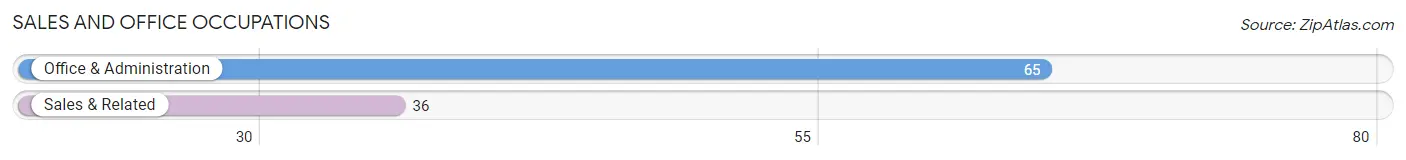
Sales and Office Occupations by Sex
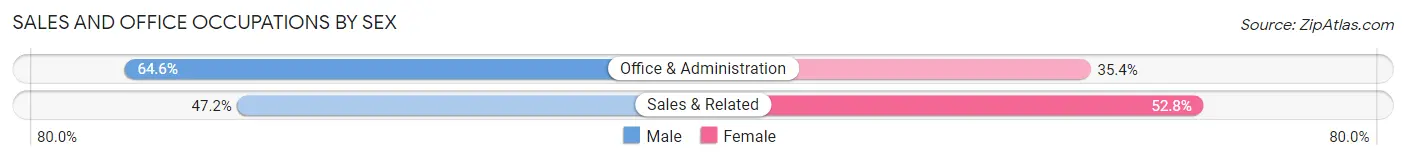
| Occupation | Male | Female |
| Sales & Related | 17 (47.2%) | 19 (52.8%) |
| Office & Administration | 42 (64.6%) | 23 (35.4%) |
| Total (Category) | 59 (58.4%) | 42 (41.6%) |
| Total (Overall) | 571 (61.9%) | 352 (38.1%) |
Natural Resources, Construction and Maintenance Occupations
The most common Natural Resources, Construction and Maintenance occupations in Estill are , and Construction & Extraction (53 | 5.7%).
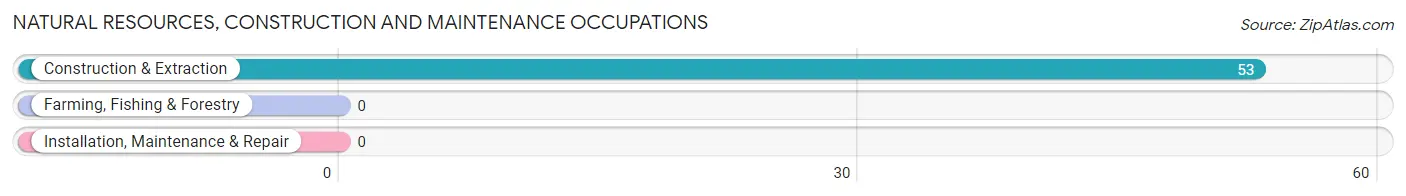
Natural Resources, Construction and Maintenance Occupations by Sex

| Occupation | Male | Female |
| Farming, Fishing & Forestry | 0 (0.0%) | 0 (0.0%) |
| Construction & Extraction | 53 (100.0%) | 0 (0.0%) |
| Installation, Maintenance & Repair | 0 (0.0%) | 0 (0.0%) |
| Total (Category) | 53 (100.0%) | 0 (0.0%) |
| Total (Overall) | 571 (61.9%) | 352 (38.1%) |
Production, Transportation and Moving Occupations
The most common Production, Transportation and Moving occupations in Estill are Production (83 | 9.0%), Transportation (77 | 8.3%), and Material Moving (44 | 4.8%).
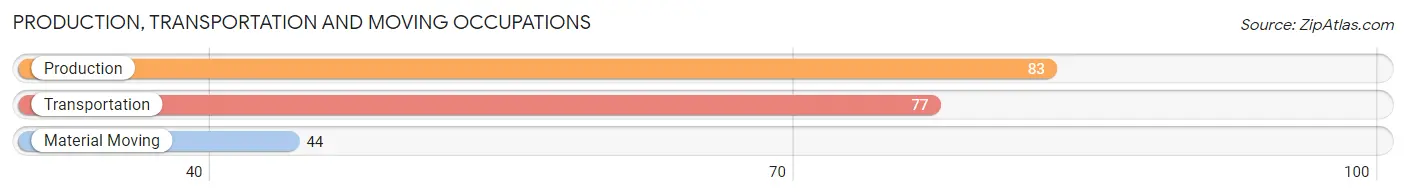
Production, Transportation and Moving Occupations by Sex
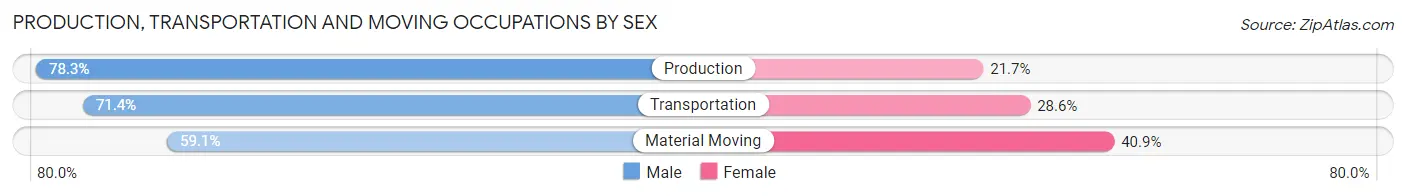
| Occupation | Male | Female |
| Production | 65 (78.3%) | 18 (21.7%) |
| Transportation | 55 (71.4%) | 22 (28.6%) |
| Material Moving | 26 (59.1%) | 18 (40.9%) |
| Total (Category) | 146 (71.6%) | 58 (28.4%) |
| Total (Overall) | 571 (61.9%) | 352 (38.1%) |
Employment Industries by Sex in Estill
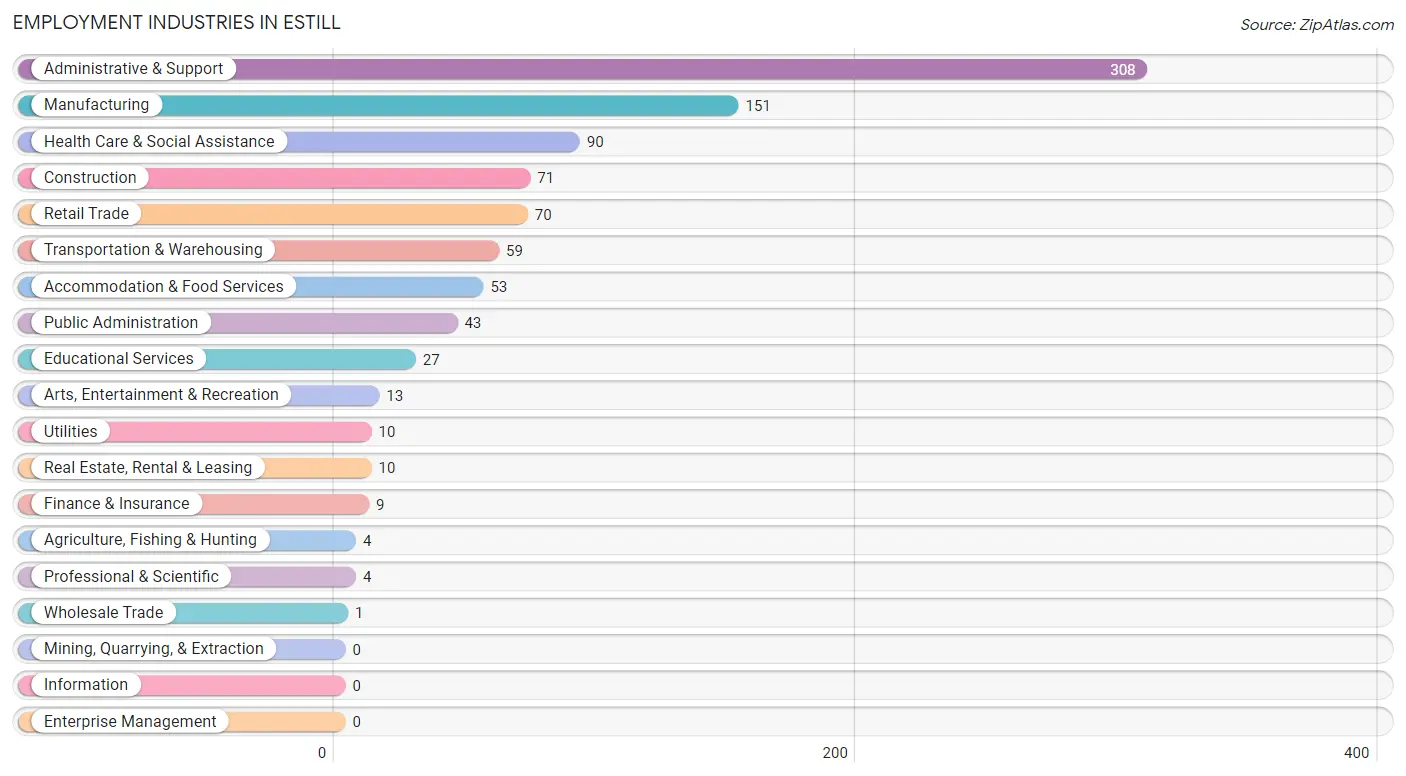
Employment Industries in Estill
The major employment industries in Estill include Administrative & Support (308 | 33.4%), Manufacturing (151 | 16.4%), Health Care & Social Assistance (90 | 9.8%), Construction (71 | 7.7%), and Retail Trade (70 | 7.6%).
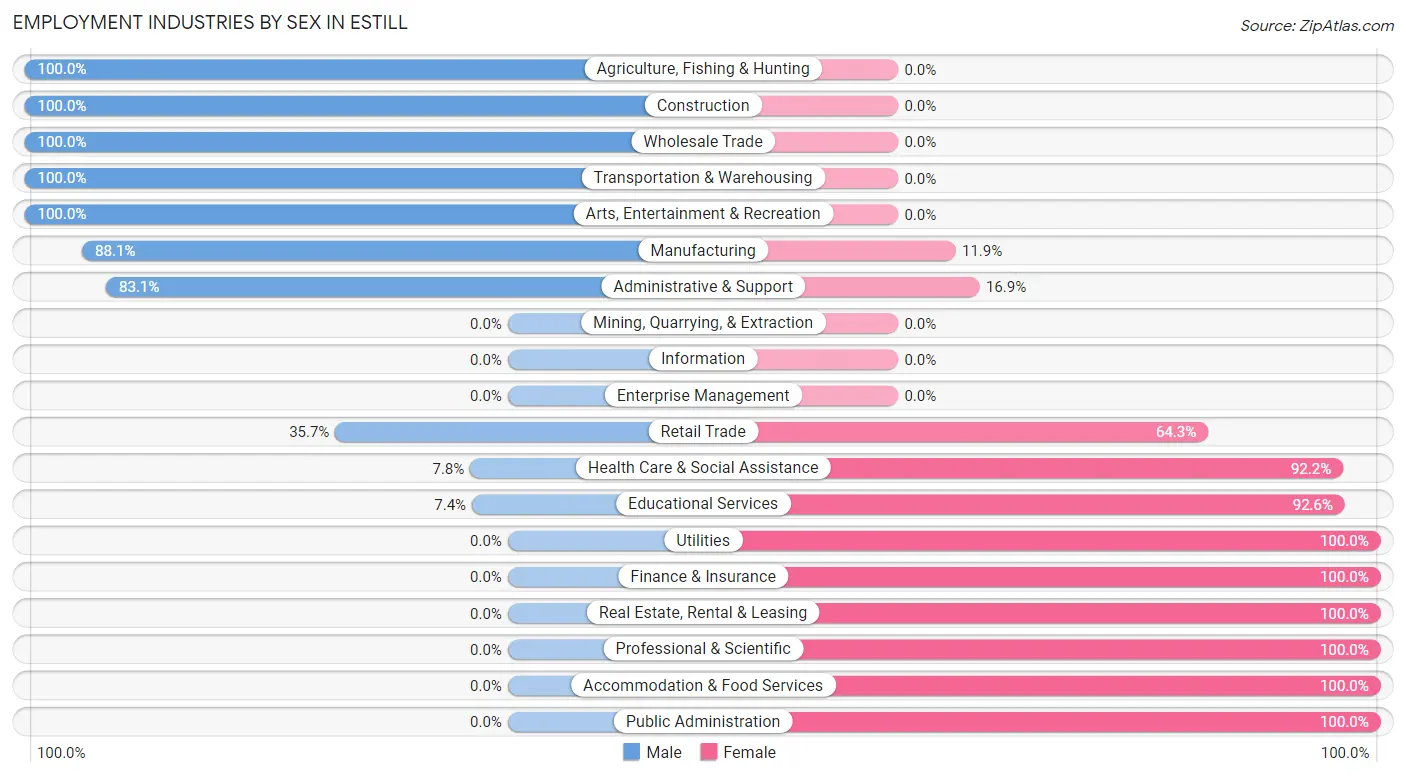
Employment Industries by Sex in Estill
The Estill industries that see more men than women are Agriculture, Fishing & Hunting (100.0%), Construction (100.0%), and Wholesale Trade (100.0%), whereas the industries that tend to have a higher number of women are Utilities (100.0%), Finance & Insurance (100.0%), and Real Estate, Rental & Leasing (100.0%).
| Industry | Male | Female |
| Agriculture, Fishing & Hunting | 4 (100.0%) | 0 (0.0%) |
| Mining, Quarrying, & Extraction | 0 (0.0%) | 0 (0.0%) |
| Construction | 71 (100.0%) | 0 (0.0%) |
| Manufacturing | 133 (88.1%) | 18 (11.9%) |
| Wholesale Trade | 1 (100.0%) | 0 (0.0%) |
| Retail Trade | 25 (35.7%) | 45 (64.3%) |
| Transportation & Warehousing | 59 (100.0%) | 0 (0.0%) |
| Utilities | 0 (0.0%) | 10 (100.0%) |
| Information | 0 (0.0%) | 0 (0.0%) |
| Finance & Insurance | 0 (0.0%) | 9 (100.0%) |
| Real Estate, Rental & Leasing | 0 (0.0%) | 10 (100.0%) |
| Professional & Scientific | 0 (0.0%) | 4 (100.0%) |
| Enterprise Management | 0 (0.0%) | 0 (0.0%) |
| Administrative & Support | 256 (83.1%) | 52 (16.9%) |
| Educational Services | 2 (7.4%) | 25 (92.6%) |
| Health Care & Social Assistance | 7 (7.8%) | 83 (92.2%) |
| Arts, Entertainment & Recreation | 13 (100.0%) | 0 (0.0%) |
| Accommodation & Food Services | 0 (0.0%) | 53 (100.0%) |
| Public Administration | 0 (0.0%) | 43 (100.0%) |
| Total | 571 (61.9%) | 352 (38.1%) |
Education in Estill
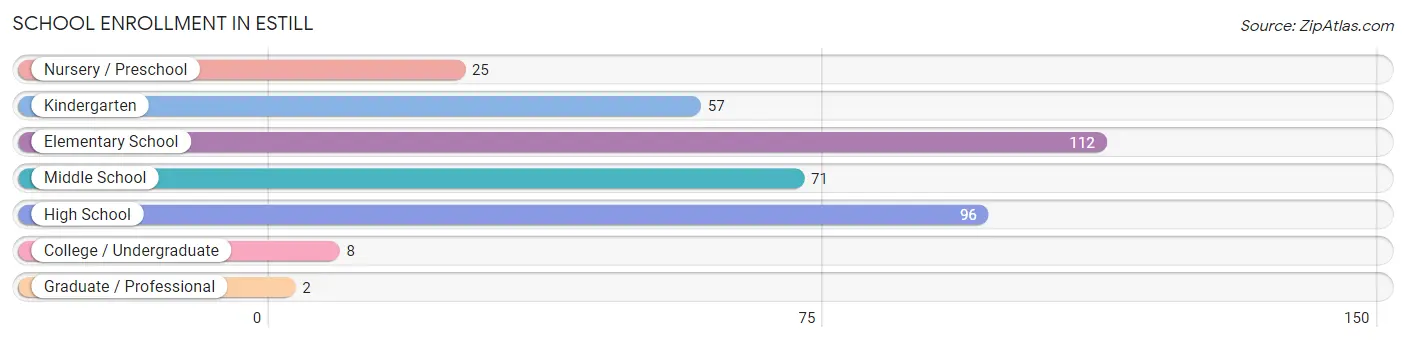
School Enrollment in Estill
The most common levels of schooling among the 371 students in Estill are elementary school (112 | 30.2%), high school (96 | 25.9%), and middle school (71 | 19.1%).
| School Level | # Students | % Students |
| Nursery / Preschool | 25 | 6.7% |
| Kindergarten | 57 | 15.4% |
| Elementary School | 112 | 30.2% |
| Middle School | 71 | 19.1% |
| High School | 96 | 25.9% |
| College / Undergraduate | 8 | 2.2% |
| Graduate / Professional | 2 | 0.5% |
| Total | 371 | 100.0% |
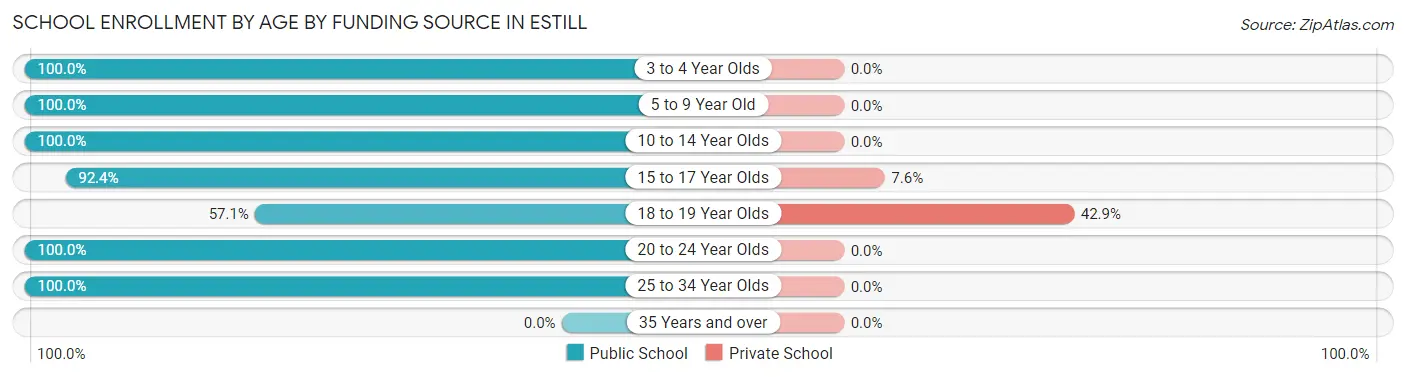
School Enrollment by Age by Funding Source in Estill
Out of a total of 371 students who are enrolled in schools in Estill, 15 (4.0%) attend a private institution, while the remaining 356 (96.0%) are enrolled in public schools. The age group of 18 to 19 year olds has the highest likelihood of being enrolled in private schools, with 9 (42.9% in the age bracket) enrolled. Conversely, the age group of 3 to 4 year olds has the lowest likelihood of being enrolled in a private school, with 25 (100.0% in the age bracket) attending a public institution.
| Age Bracket | Public School | Private School |
| 3 to 4 Year Olds | 25 (100.0%) | 0 (0.0%) |
| 5 to 9 Year Old | 130 (100.0%) | 0 (0.0%) |
| 10 to 14 Year Olds | 110 (100.0%) | 0 (0.0%) |
| 15 to 17 Year Olds | 73 (92.4%) | 6 (7.6%) |
| 18 to 19 Year Olds | 12 (57.1%) | 9 (42.9%) |
| 20 to 24 Year Olds | 4 (100.0%) | 0 (0.0%) |
| 25 to 34 Year Olds | 2 (100.0%) | 0 (0.0%) |
| 35 Years and over | 0 (0.0%) | 0 (0.0%) |
| Total | 356 (96.0%) | 15 (4.0%) |
Educational Attainment by Field of Study in Estill
Business (39 | 29.8%), science & technology (21 | 16.0%), bio, nature & agricultural (19 | 14.5%), physical & health sciences (17 | 13.0%), and literature & languages (14 | 10.7%) are the most common fields of study among 131 individuals in Estill who have obtained a bachelor's degree or higher.

| Field of Study | # Graduates | % Graduates |
| Computers & Mathematics | 0 | 0.0% |
| Bio, Nature & Agricultural | 19 | 14.5% |
| Physical & Health Sciences | 17 | 13.0% |
| Psychology | 6 | 4.6% |
| Social Sciences | 5 | 3.8% |
| Engineering | 0 | 0.0% |
| Multidisciplinary Studies | 0 | 0.0% |
| Science & Technology | 21 | 16.0% |
| Business | 39 | 29.8% |
| Education | 10 | 7.6% |
| Literature & Languages | 14 | 10.7% |
| Liberal Arts & History | 0 | 0.0% |
| Visual & Performing Arts | 0 | 0.0% |
| Communications | 0 | 0.0% |
| Arts & Humanities | 0 | 0.0% |
| Total | 131 | 100.0% |
Transportation & Commute in Estill
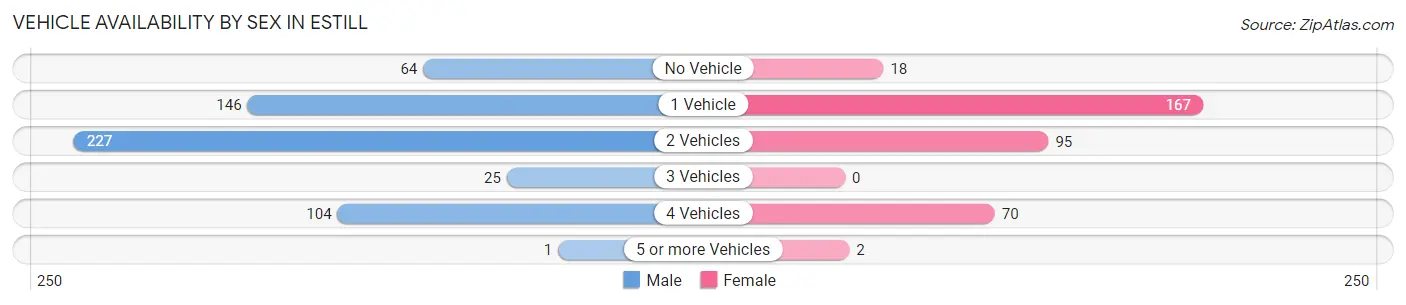
Vehicle Availability by Sex in Estill
The most prevalent vehicle ownership categories in Estill are males with 2 vehicles (227, accounting for 40.0%) and females with 2 vehicles (95, making up 64.5%).
| Vehicles Available | Male | Female |
| No Vehicle | 64 (11.3%) | 18 (5.1%) |
| 1 Vehicle | 146 (25.8%) | 167 (47.4%) |
| 2 Vehicles | 227 (40.0%) | 95 (27.0%) |
| 3 Vehicles | 25 (4.4%) | 0 (0.0%) |
| 4 Vehicles | 104 (18.3%) | 70 (19.9%) |
| 5 or more Vehicles | 1 (0.2%) | 2 (0.6%) |
| Total | 567 (100.0%) | 352 (100.0%) |
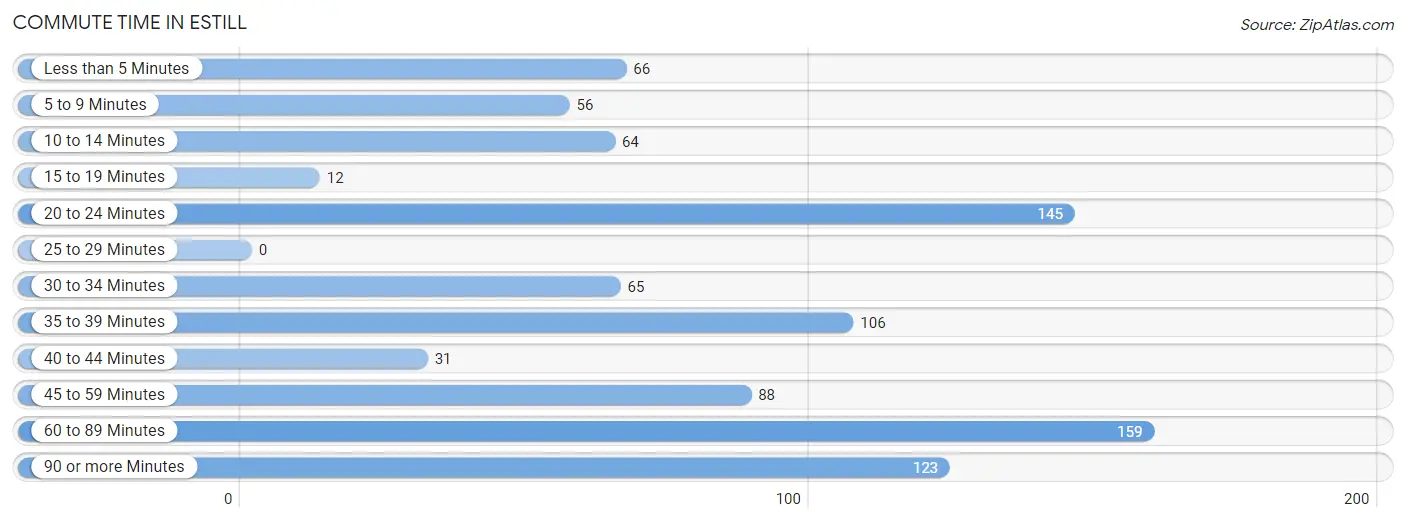
Commute Time in Estill
The most frequently occuring commute durations in Estill are 60 to 89 minutes (159 commuters, 17.4%), 20 to 24 minutes (145 commuters, 15.9%), and 90 or more minutes (123 commuters, 13.4%).
| Commute Time | # Commuters | % Commuters |
| Less than 5 Minutes | 66 | 7.2% |
| 5 to 9 Minutes | 56 | 6.1% |
| 10 to 14 Minutes | 64 | 7.0% |
| 15 to 19 Minutes | 12 | 1.3% |
| 20 to 24 Minutes | 145 | 15.9% |
| 25 to 29 Minutes | 0 | 0.0% |
| 30 to 34 Minutes | 65 | 7.1% |
| 35 to 39 Minutes | 106 | 11.6% |
| 40 to 44 Minutes | 31 | 3.4% |
| 45 to 59 Minutes | 88 | 9.6% |
| 60 to 89 Minutes | 159 | 17.4% |
| 90 or more Minutes | 123 | 13.4% |
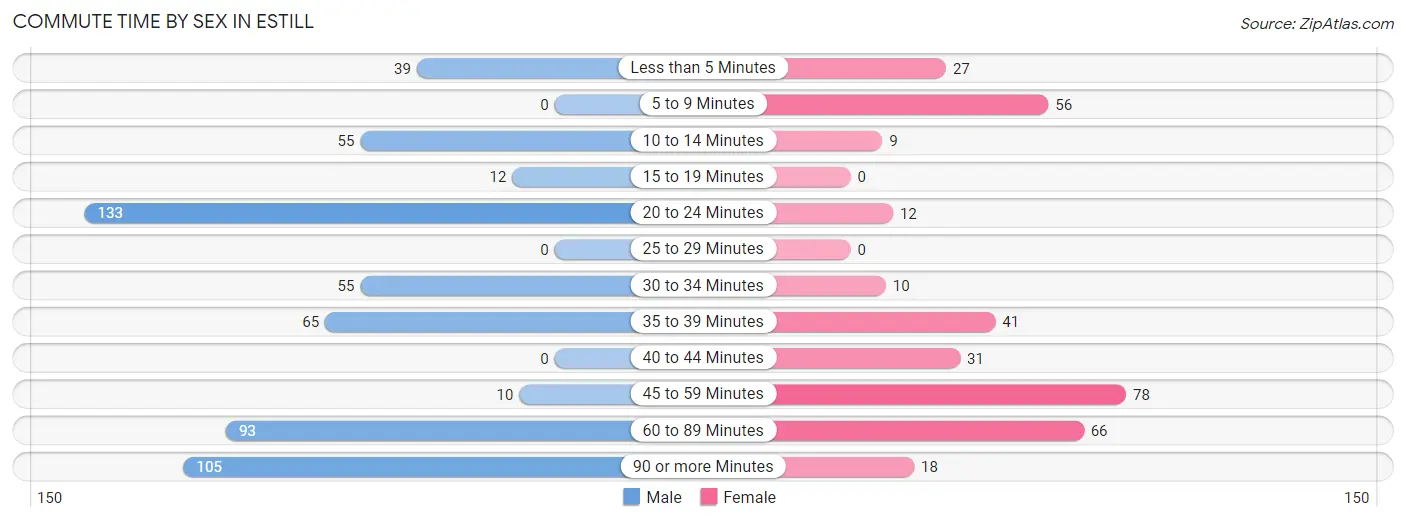
Commute Time by Sex in Estill
The most common commute times in Estill are 20 to 24 minutes (133 commuters, 23.5%) for males and 45 to 59 minutes (78 commuters, 22.4%) for females.
| Commute Time | Male | Female |
| Less than 5 Minutes | 39 (6.9%) | 27 (7.8%) |
| 5 to 9 Minutes | 0 (0.0%) | 56 (16.1%) |
| 10 to 14 Minutes | 55 (9.7%) | 9 (2.6%) |
| 15 to 19 Minutes | 12 (2.1%) | 0 (0.0%) |
| 20 to 24 Minutes | 133 (23.5%) | 12 (3.5%) |
| 25 to 29 Minutes | 0 (0.0%) | 0 (0.0%) |
| 30 to 34 Minutes | 55 (9.7%) | 10 (2.9%) |
| 35 to 39 Minutes | 65 (11.5%) | 41 (11.8%) |
| 40 to 44 Minutes | 0 (0.0%) | 31 (8.9%) |
| 45 to 59 Minutes | 10 (1.8%) | 78 (22.4%) |
| 60 to 89 Minutes | 93 (16.4%) | 66 (19.0%) |
| 90 or more Minutes | 105 (18.5%) | 18 (5.2%) |
Time of Departure to Work by Sex in Estill
The most frequent times of departure to work in Estill are 5:30 AM to 5:59 AM (147, 25.9%) for males and 5:00 AM to 5:29 AM (128, 36.8%) for females.
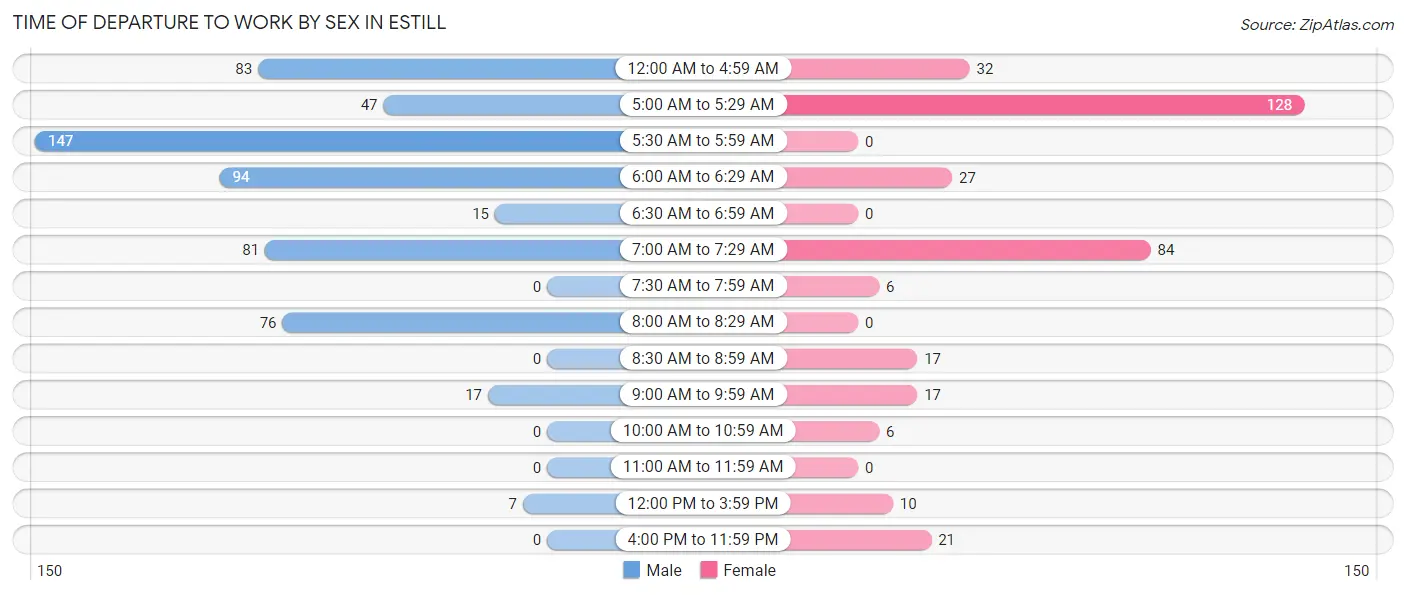
| Time of Departure | Male | Female |
| 12:00 AM to 4:59 AM | 83 (14.6%) | 32 (9.2%) |
| 5:00 AM to 5:29 AM | 47 (8.3%) | 128 (36.8%) |
| 5:30 AM to 5:59 AM | 147 (25.9%) | 0 (0.0%) |
| 6:00 AM to 6:29 AM | 94 (16.6%) | 27 (7.8%) |
| 6:30 AM to 6:59 AM | 15 (2.6%) | 0 (0.0%) |
| 7:00 AM to 7:29 AM | 81 (14.3%) | 84 (24.1%) |
| 7:30 AM to 7:59 AM | 0 (0.0%) | 6 (1.7%) |
| 8:00 AM to 8:29 AM | 76 (13.4%) | 0 (0.0%) |
| 8:30 AM to 8:59 AM | 0 (0.0%) | 17 (4.9%) |
| 9:00 AM to 9:59 AM | 17 (3.0%) | 17 (4.9%) |
| 10:00 AM to 10:59 AM | 0 (0.0%) | 6 (1.7%) |
| 11:00 AM to 11:59 AM | 0 (0.0%) | 0 (0.0%) |
| 12:00 PM to 3:59 PM | 7 (1.2%) | 10 (2.9%) |
| 4:00 PM to 11:59 PM | 0 (0.0%) | 21 (6.0%) |
| Total | 567 (100.0%) | 348 (100.0%) |
Housing Occupancy in Estill
Occupancy by Ownership in Estill
Of the total 763 dwellings in Estill, owner-occupied units account for 457 (59.9%), while renter-occupied units make up 306 (40.1%).
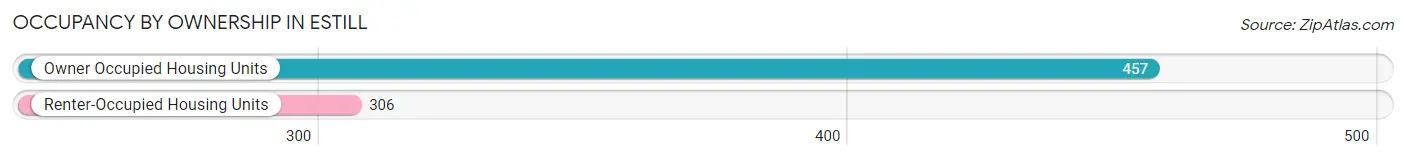
| Occupancy | # Housing Units | % Housing Units |
| Owner Occupied Housing Units | 457 | 59.9% |
| Renter-Occupied Housing Units | 306 | 40.1% |
| Total Occupied Housing Units | 763 | 100.0% |
Occupancy by Household Size in Estill
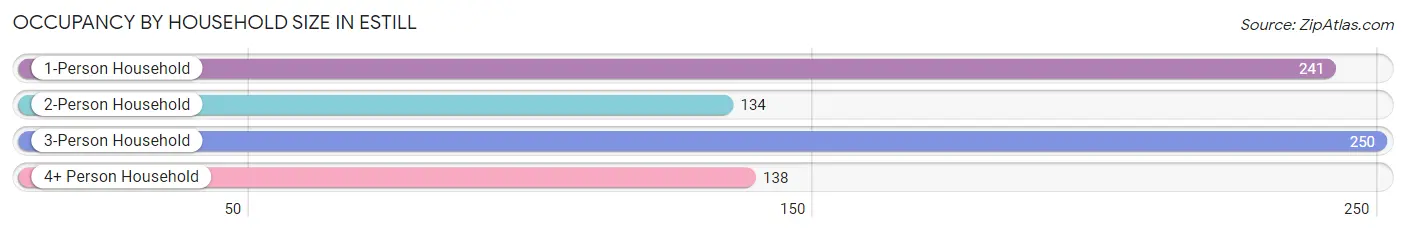
| Household Size | # Housing Units | % Housing Units |
| 1-Person Household | 241 | 31.6% |
| 2-Person Household | 134 | 17.6% |
| 3-Person Household | 250 | 32.8% |
| 4+ Person Household | 138 | 18.1% |
| Total Housing Units | 763 | 100.0% |
Occupancy by Ownership by Household Size in Estill
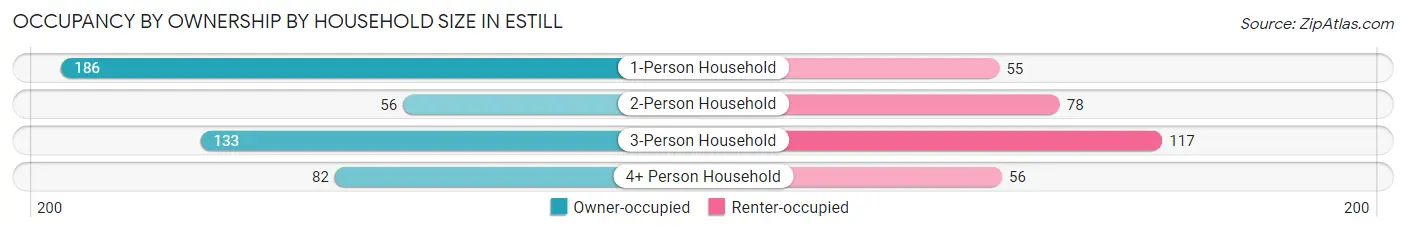
| Household Size | Owner-occupied | Renter-occupied |
| 1-Person Household | 186 (77.2%) | 55 (22.8%) |
| 2-Person Household | 56 (41.8%) | 78 (58.2%) |
| 3-Person Household | 133 (53.2%) | 117 (46.8%) |
| 4+ Person Household | 82 (59.4%) | 56 (40.6%) |
| Total Housing Units | 457 (59.9%) | 306 (40.1%) |
Occupancy by Educational Attainment in Estill
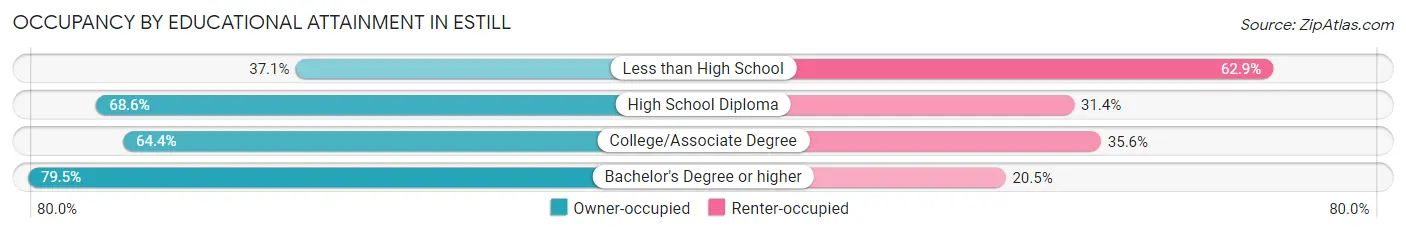
| Household Size | Owner-occupied | Renter-occupied |
| Less than High School | 73 (37.1%) | 124 (62.9%) |
| High School Diploma | 223 (68.6%) | 102 (31.4%) |
| College/Associate Degree | 130 (64.4%) | 72 (35.6%) |
| Bachelor's Degree or higher | 31 (79.5%) | 8 (20.5%) |
Occupancy by Age of Householder in Estill
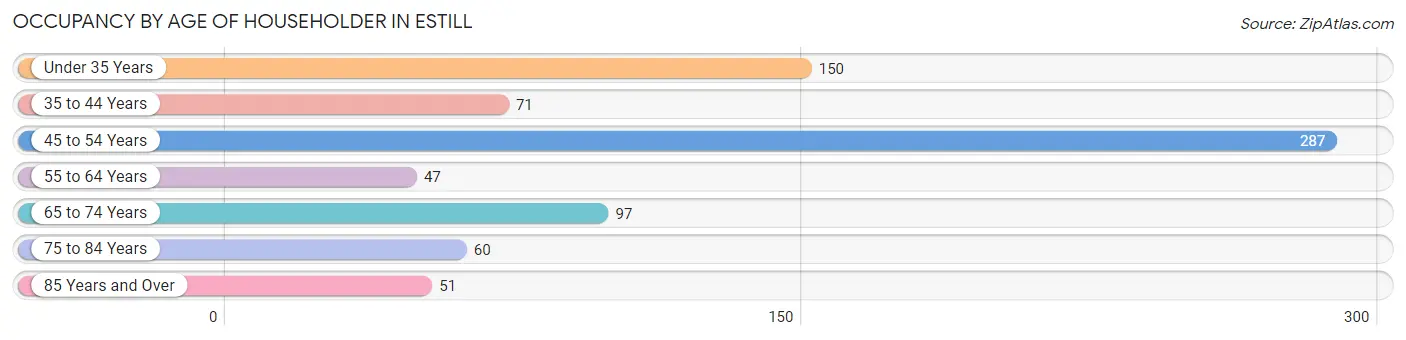
| Age Bracket | # Households | % Households |
| Under 35 Years | 150 | 19.7% |
| 35 to 44 Years | 71 | 9.3% |
| 45 to 54 Years | 287 | 37.6% |
| 55 to 64 Years | 47 | 6.2% |
| 65 to 74 Years | 97 | 12.7% |
| 75 to 84 Years | 60 | 7.9% |
| 85 Years and Over | 51 | 6.7% |
| Total | 763 | 100.0% |
Housing Finances in Estill
Median Income by Occupancy in Estill
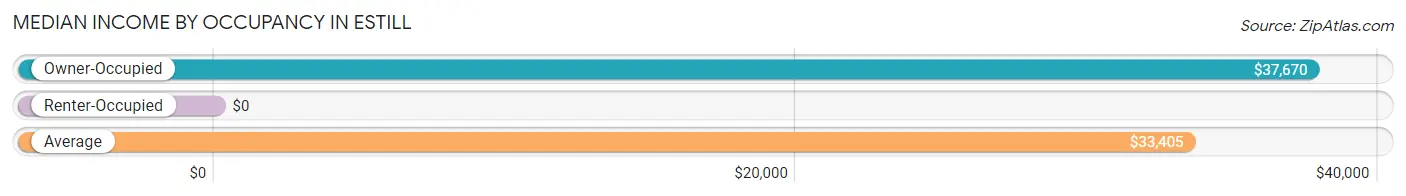
| Occupancy Type | # Households | Median Income |
| Owner-Occupied | 457 (59.9%) | $37,670 |
| Renter-Occupied | 306 (40.1%) | $0 |
| Average | 763 (100.0%) | $33,405 |
Occupancy by Householder Income Bracket in Estill
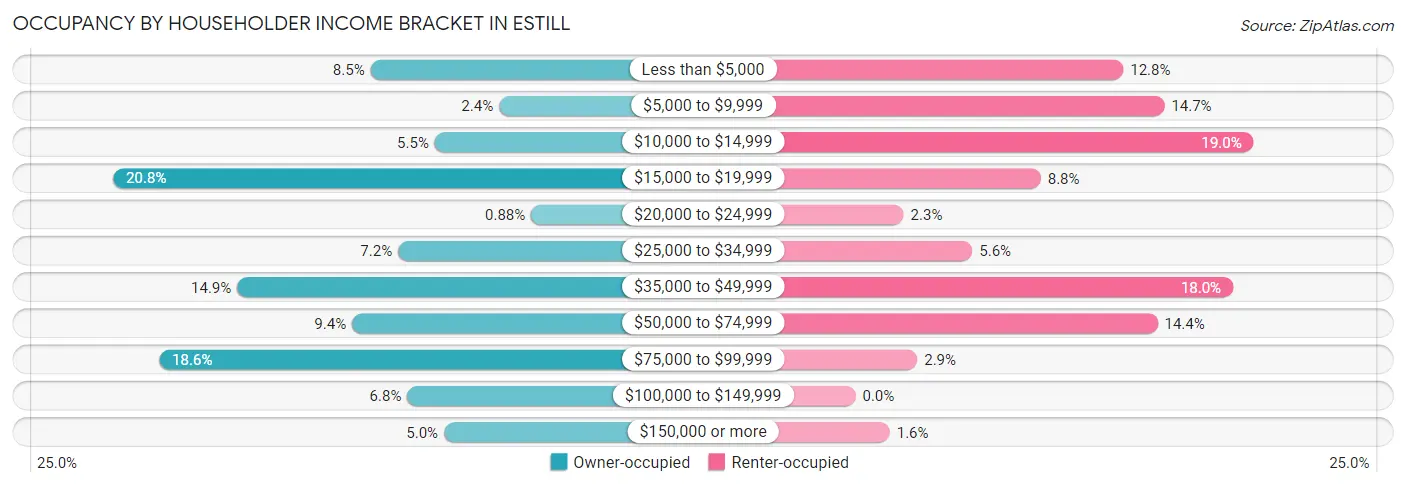
| Income Bracket | Owner-occupied | Renter-occupied |
| Less than $5,000 | 39 (8.5%) | 39 (12.8%) |
| $5,000 to $9,999 | 11 (2.4%) | 45 (14.7%) |
| $10,000 to $14,999 | 25 (5.5%) | 58 (19.0%) |
| $15,000 to $19,999 | 95 (20.8%) | 27 (8.8%) |
| $20,000 to $24,999 | 4 (0.9%) | 7 (2.3%) |
| $25,000 to $34,999 | 33 (7.2%) | 17 (5.6%) |
| $35,000 to $49,999 | 68 (14.9%) | 55 (18.0%) |
| $50,000 to $74,999 | 43 (9.4%) | 44 (14.4%) |
| $75,000 to $99,999 | 85 (18.6%) | 9 (2.9%) |
| $100,000 to $149,999 | 31 (6.8%) | 0 (0.0%) |
| $150,000 or more | 23 (5.0%) | 5 (1.6%) |
| Total | 457 (100.0%) | 306 (100.0%) |
Monthly Housing Cost Tiers in Estill
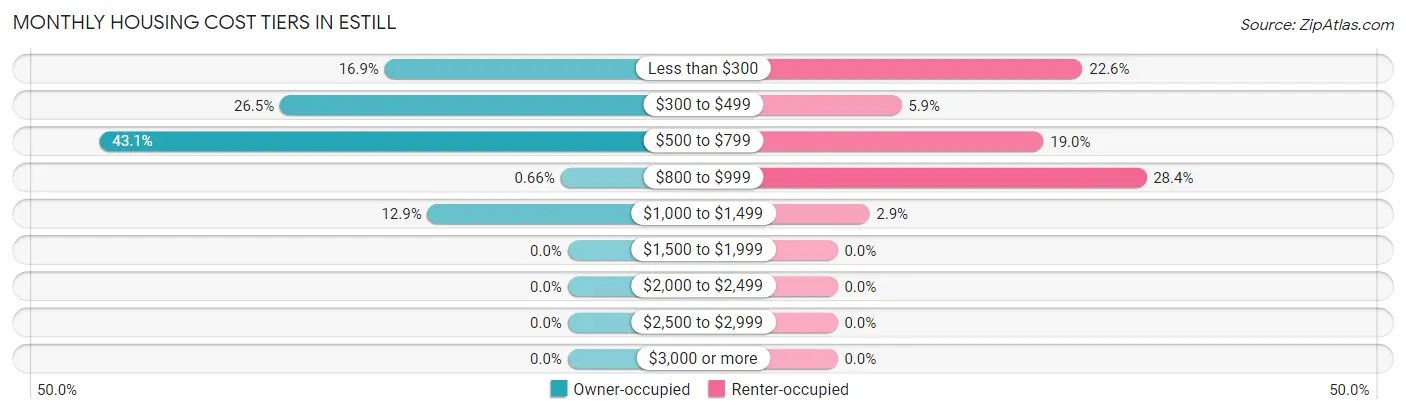
| Monthly Cost | Owner-occupied | Renter-occupied |
| Less than $300 | 77 (16.9%) | 69 (22.6%) |
| $300 to $499 | 121 (26.5%) | 18 (5.9%) |
| $500 to $799 | 197 (43.1%) | 58 (19.0%) |
| $800 to $999 | 3 (0.7%) | 87 (28.4%) |
| $1,000 to $1,499 | 59 (12.9%) | 9 (2.9%) |
| $1,500 to $1,999 | 0 (0.0%) | 0 (0.0%) |
| $2,000 to $2,499 | 0 (0.0%) | 0 (0.0%) |
| $2,500 to $2,999 | 0 (0.0%) | 0 (0.0%) |
| $3,000 or more | 0 (0.0%) | 0 (0.0%) |
| Total | 457 (100.0%) | 306 (100.0%) |
Physical Housing Characteristics in Estill
Housing Structures in Estill
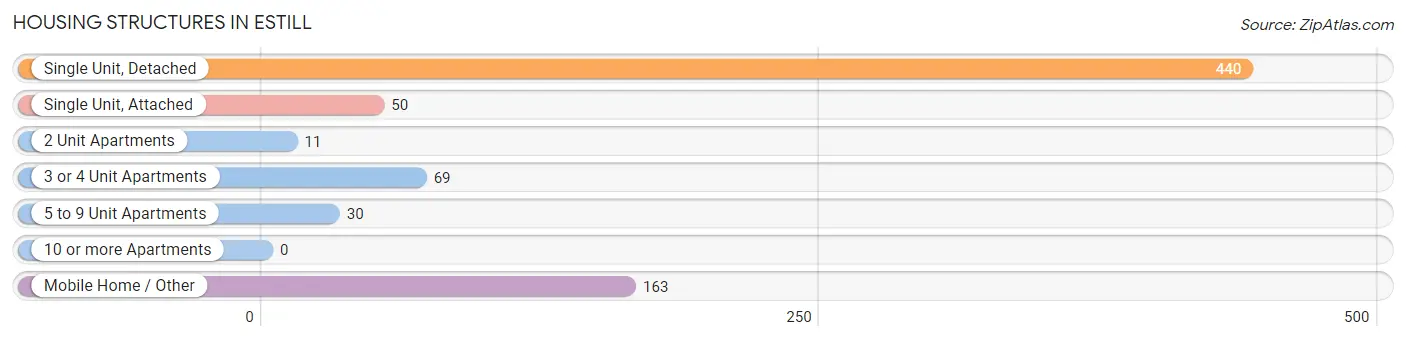
| Structure Type | # Housing Units | % Housing Units |
| Single Unit, Detached | 440 | 57.7% |
| Single Unit, Attached | 50 | 6.6% |
| 2 Unit Apartments | 11 | 1.4% |
| 3 or 4 Unit Apartments | 69 | 9.0% |
| 5 to 9 Unit Apartments | 30 | 3.9% |
| 10 or more Apartments | 0 | 0.0% |
| Mobile Home / Other | 163 | 21.4% |
| Total | 763 | 100.0% |
Housing Structures by Occupancy in Estill
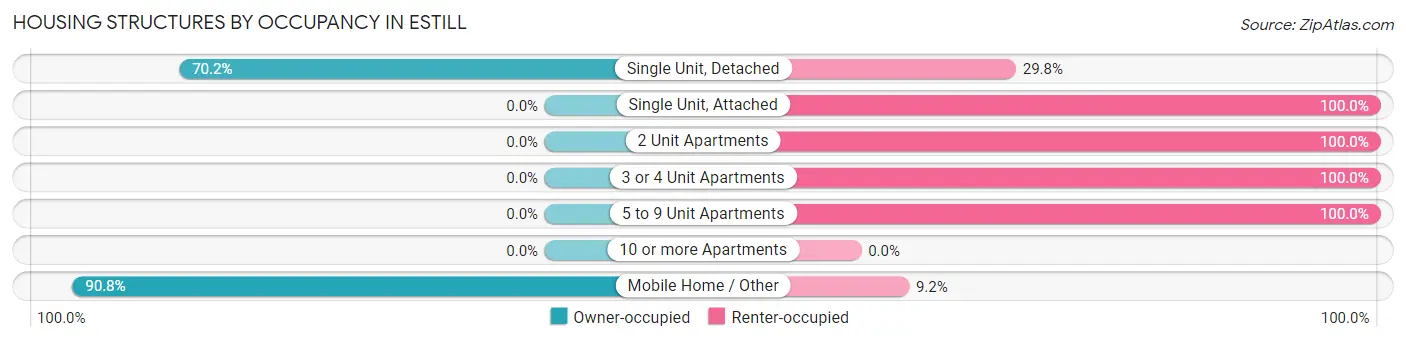
| Structure Type | Owner-occupied | Renter-occupied |
| Single Unit, Detached | 309 (70.2%) | 131 (29.8%) |
| Single Unit, Attached | 0 (0.0%) | 50 (100.0%) |
| 2 Unit Apartments | 0 (0.0%) | 11 (100.0%) |
| 3 or 4 Unit Apartments | 0 (0.0%) | 69 (100.0%) |
| 5 to 9 Unit Apartments | 0 (0.0%) | 30 (100.0%) |
| 10 or more Apartments | 0 (0.0%) | 0 (0.0%) |
| Mobile Home / Other | 148 (90.8%) | 15 (9.2%) |
| Total | 457 (59.9%) | 306 (40.1%) |
Housing Structures by Number of Rooms in Estill
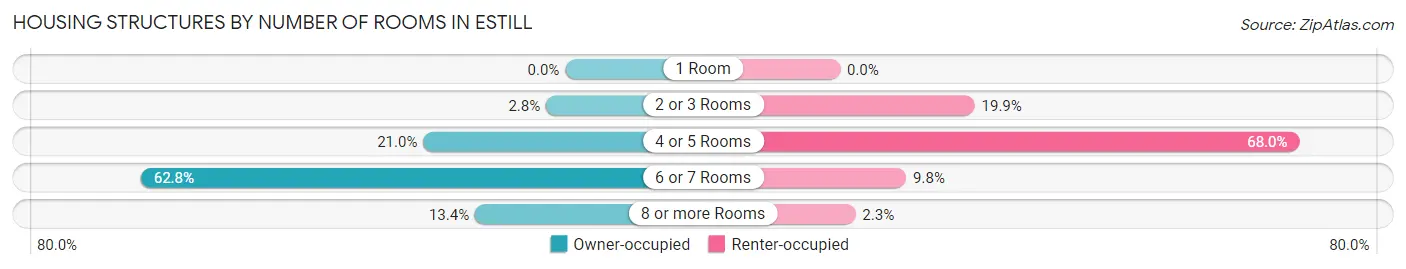
| Number of Rooms | Owner-occupied | Renter-occupied |
| 1 Room | 0 (0.0%) | 0 (0.0%) |
| 2 or 3 Rooms | 13 (2.8%) | 61 (19.9%) |
| 4 or 5 Rooms | 96 (21.0%) | 208 (68.0%) |
| 6 or 7 Rooms | 287 (62.8%) | 30 (9.8%) |
| 8 or more Rooms | 61 (13.4%) | 7 (2.3%) |
| Total | 457 (100.0%) | 306 (100.0%) |
Housing Structure by Heating Type in Estill
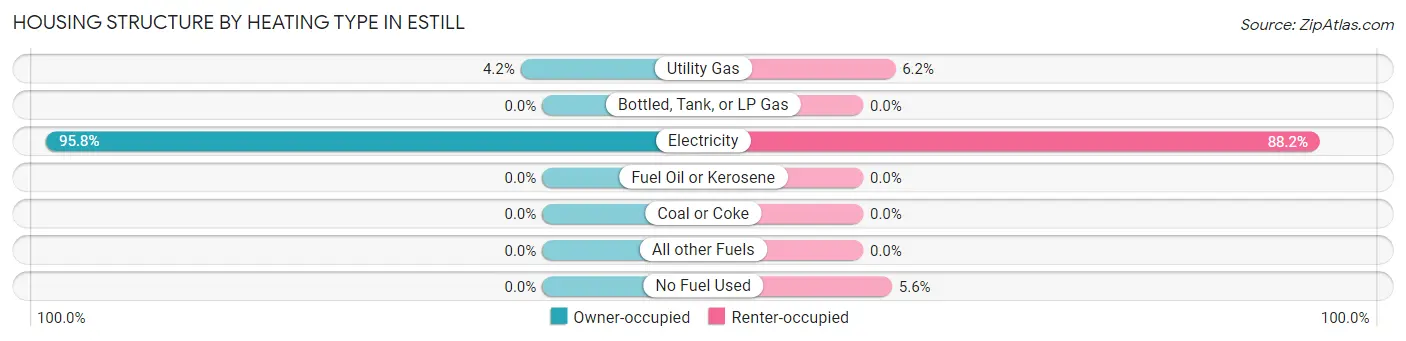
| Heating Type | Owner-occupied | Renter-occupied |
| Utility Gas | 19 (4.2%) | 19 (6.2%) |
| Bottled, Tank, or LP Gas | 0 (0.0%) | 0 (0.0%) |
| Electricity | 438 (95.8%) | 270 (88.2%) |
| Fuel Oil or Kerosene | 0 (0.0%) | 0 (0.0%) |
| Coal or Coke | 0 (0.0%) | 0 (0.0%) |
| All other Fuels | 0 (0.0%) | 0 (0.0%) |
| No Fuel Used | 0 (0.0%) | 17 (5.6%) |
| Total | 457 (100.0%) | 306 (100.0%) |
Household Vehicle Usage in Estill
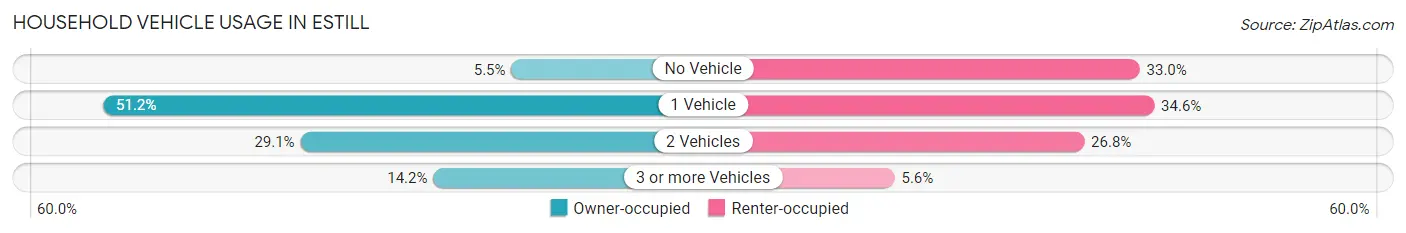
| Vehicles per Household | Owner-occupied | Renter-occupied |
| No Vehicle | 25 (5.5%) | 101 (33.0%) |
| 1 Vehicle | 234 (51.2%) | 106 (34.6%) |
| 2 Vehicles | 133 (29.1%) | 82 (26.8%) |
| 3 or more Vehicles | 65 (14.2%) | 17 (5.6%) |
| Total | 457 (100.0%) | 306 (100.0%) |
Real Estate & Mortgages in Estill
Real Estate and Mortgage Overview in Estill
| Characteristic | Without Mortgage | With Mortgage |
| Housing Units | 378 | 79 |
| Median Property Value | $78,700 | $218,900 |
| Median Household Income | $39,432 | $17 |
| Monthly Housing Costs | $447 | $0 |
| Real Estate Taxes | $547 | $0 |
Property Value by Mortgage Status in Estill
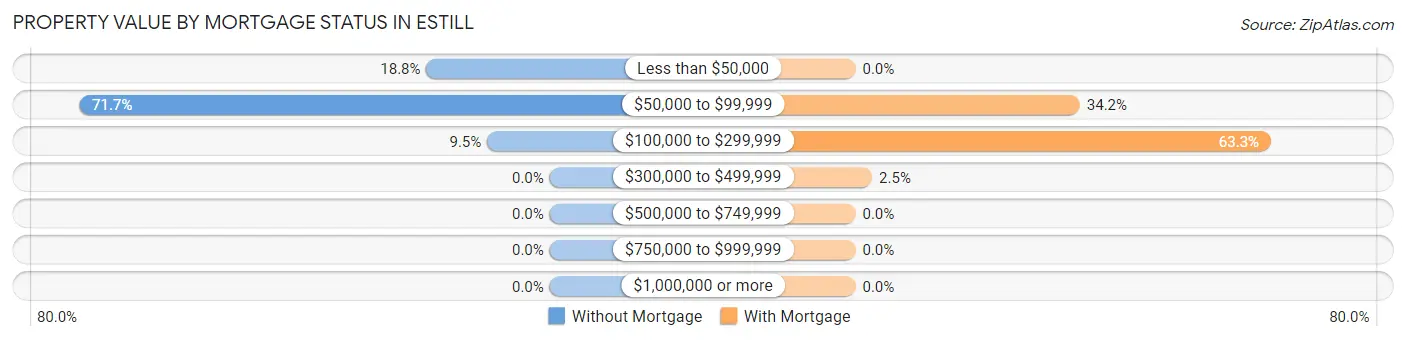
| Property Value | Without Mortgage | With Mortgage |
| Less than $50,000 | 71 (18.8%) | 0 (0.0%) |
| $50,000 to $99,999 | 271 (71.7%) | 27 (34.2%) |
| $100,000 to $299,999 | 36 (9.5%) | 50 (63.3%) |
| $300,000 to $499,999 | 0 (0.0%) | 2 (2.5%) |
| $500,000 to $749,999 | 0 (0.0%) | 0 (0.0%) |
| $750,000 to $999,999 | 0 (0.0%) | 0 (0.0%) |
| $1,000,000 or more | 0 (0.0%) | 0 (0.0%) |
| Total | 378 (100.0%) | 79 (100.0%) |
Household Income by Mortgage Status in Estill
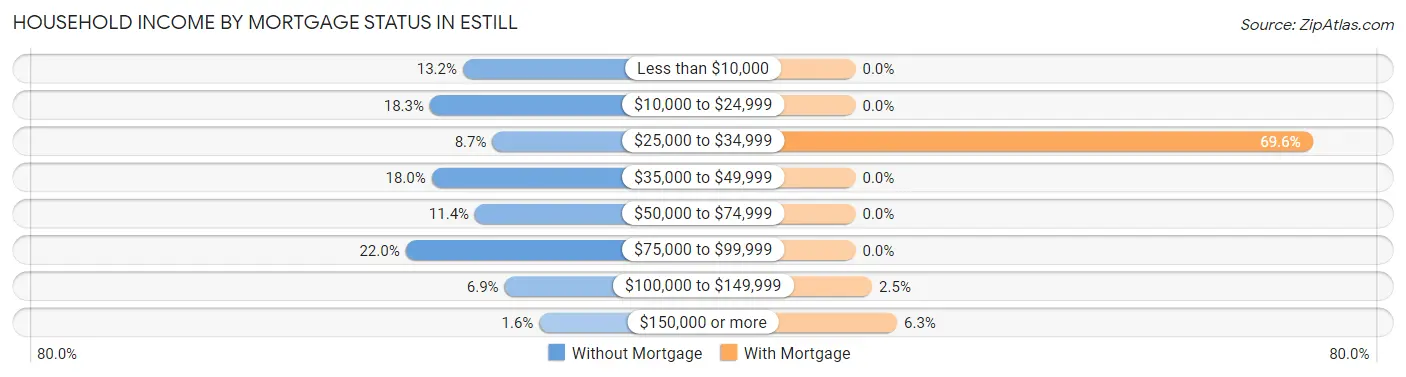
| Household Income | Without Mortgage | With Mortgage |
| Less than $10,000 | 50 (13.2%) | 0 (0.0%) |
| $10,000 to $24,999 | 69 (18.2%) | 0 (0.0%) |
| $25,000 to $34,999 | 33 (8.7%) | 55 (69.6%) |
| $35,000 to $49,999 | 68 (18.0%) | 0 (0.0%) |
| $50,000 to $74,999 | 43 (11.4%) | 0 (0.0%) |
| $75,000 to $99,999 | 83 (22.0%) | 0 (0.0%) |
| $100,000 to $149,999 | 26 (6.9%) | 2 (2.5%) |
| $150,000 or more | 6 (1.6%) | 5 (6.3%) |
| Total | 378 (100.0%) | 79 (100.0%) |
Property Value to Household Income Ratio in Estill
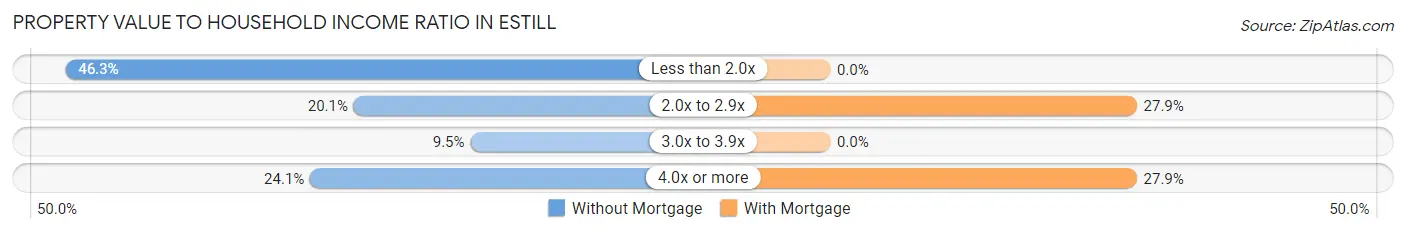
| Value-to-Income Ratio | Without Mortgage | With Mortgage |
| Less than 2.0x | 175 (46.3%) | 0 (0.0%) |
| 2.0x to 2.9x | 76 (20.1%) | 22 (27.9%) |
| 3.0x to 3.9x | 36 (9.5%) | 0 (0.0%) |
| 4.0x or more | 91 (24.1%) | 22 (27.9%) |
| Total | 378 (100.0%) | 79 (100.0%) |
Real Estate Taxes by Mortgage Status in Estill
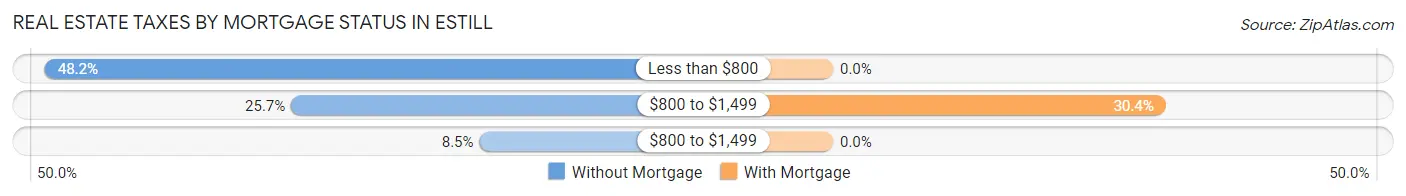
| Property Taxes | Without Mortgage | With Mortgage |
| Less than $800 | 182 (48.1%) | 0 (0.0%) |
| $800 to $1,499 | 97 (25.7%) | 24 (30.4%) |
| $800 to $1,499 | 32 (8.5%) | 0 (0.0%) |
| Total | 378 (100.0%) | 79 (100.0%) |
Health & Disability in Estill
Health Insurance Coverage by Age in Estill
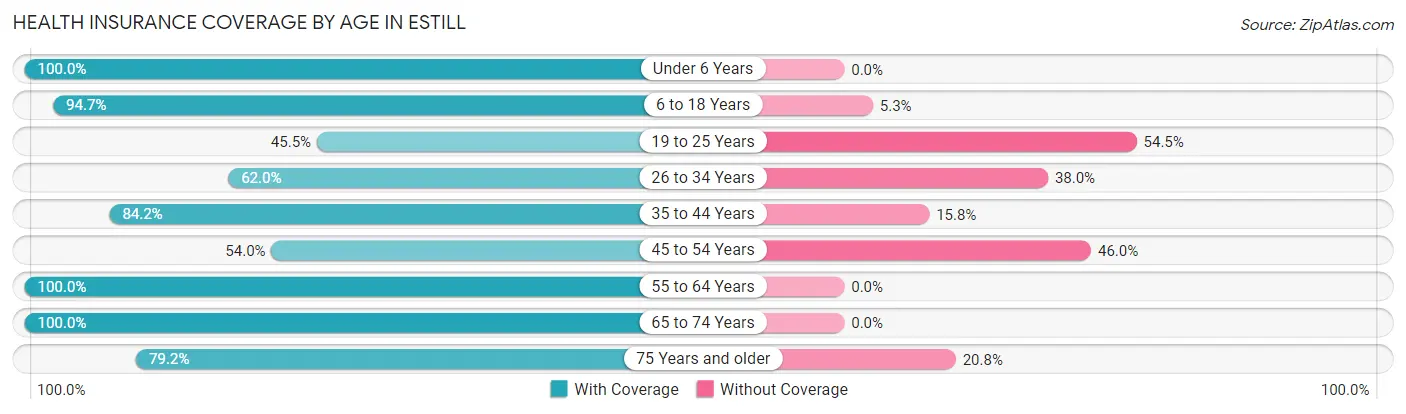
| Age Bracket | With Coverage | Without Coverage |
| Under 6 Years | 217 (100.0%) | 0 (0.0%) |
| 6 to 18 Years | 302 (94.7%) | 17 (5.3%) |
| 19 to 25 Years | 121 (45.5%) | 145 (54.5%) |
| 26 to 34 Years | 240 (62.0%) | 147 (38.0%) |
| 35 to 44 Years | 117 (84.2%) | 22 (15.8%) |
| 45 to 54 Years | 210 (54.0%) | 179 (46.0%) |
| 55 to 64 Years | 91 (100.0%) | 0 (0.0%) |
| 65 to 74 Years | 151 (100.0%) | 0 (0.0%) |
| 75 Years and older | 122 (79.2%) | 32 (20.8%) |
| Total | 1,571 (74.4%) | 542 (25.7%) |
Health Insurance Coverage by Citizenship Status in Estill
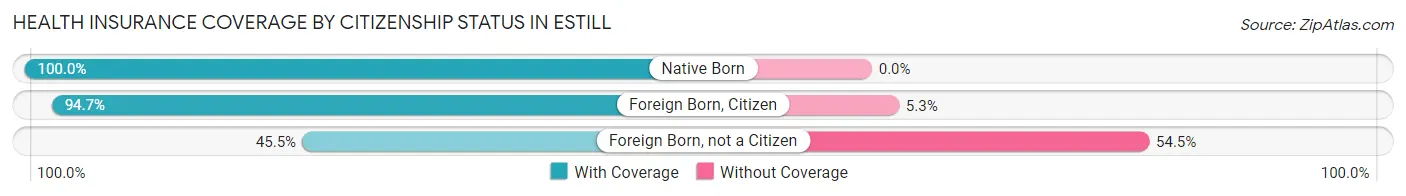
| Citizenship Status | With Coverage | Without Coverage |
| Native Born | 217 (100.0%) | 0 (0.0%) |
| Foreign Born, Citizen | 302 (94.7%) | 17 (5.3%) |
| Foreign Born, not a Citizen | 121 (45.5%) | 145 (54.5%) |
Health Insurance Coverage by Household Income in Estill
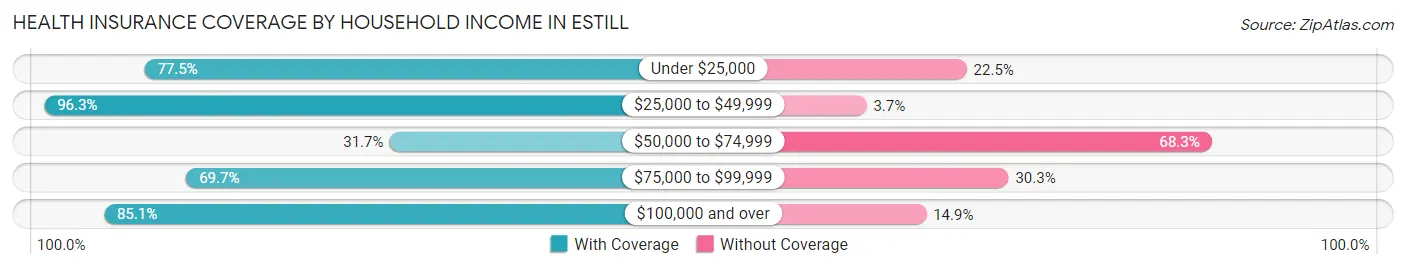
| Household Income | With Coverage | Without Coverage |
| Under $25,000 | 573 (77.5%) | 166 (22.5%) |
| $25,000 to $49,999 | 445 (96.3%) | 17 (3.7%) |
| $50,000 to $74,999 | 108 (31.7%) | 233 (68.3%) |
| $75,000 to $99,999 | 191 (69.7%) | 83 (30.3%) |
| $100,000 and over | 246 (85.1%) | 43 (14.9%) |
Public vs Private Health Insurance Coverage by Age in Estill
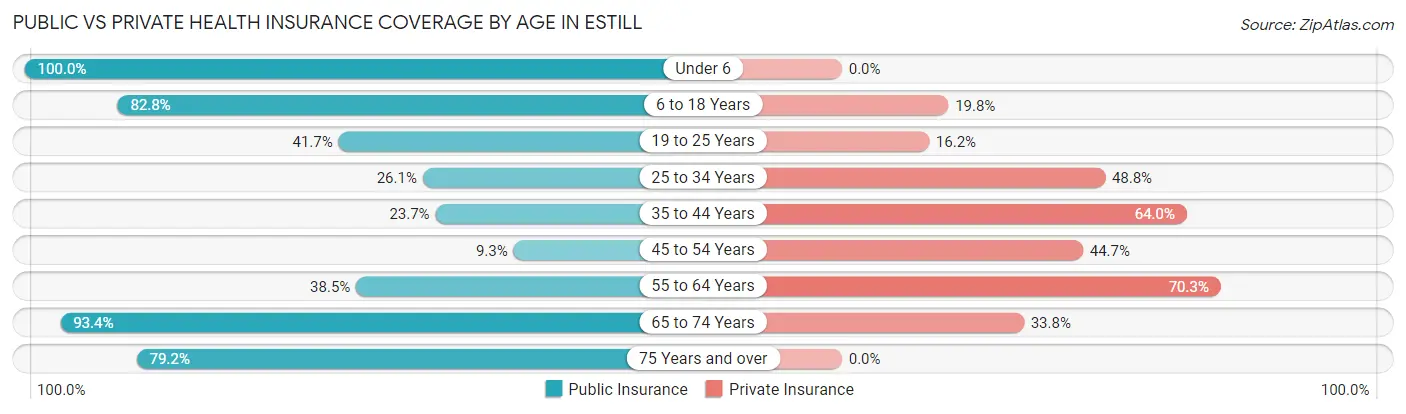
| Age Bracket | Public Insurance | Private Insurance |
| Under 6 | 217 (100.0%) | 0 (0.0%) |
| 6 to 18 Years | 264 (82.8%) | 63 (19.8%) |
| 19 to 25 Years | 111 (41.7%) | 43 (16.2%) |
| 25 to 34 Years | 101 (26.1%) | 189 (48.8%) |
| 35 to 44 Years | 33 (23.7%) | 89 (64.0%) |
| 45 to 54 Years | 36 (9.2%) | 174 (44.7%) |
| 55 to 64 Years | 35 (38.5%) | 64 (70.3%) |
| 65 to 74 Years | 141 (93.4%) | 51 (33.8%) |
| 75 Years and over | 122 (79.2%) | 0 (0.0%) |
| Total | 1,060 (50.2%) | 673 (31.9%) |
Disability Status by Sex by Age in Estill
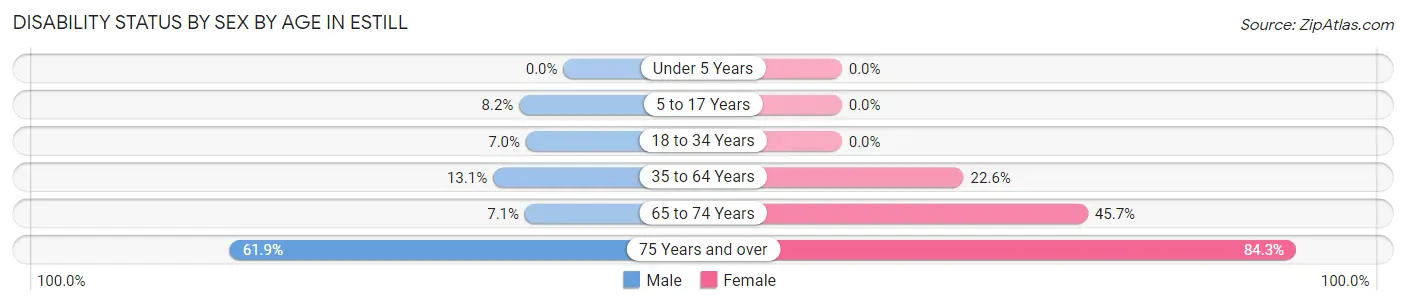
| Age Bracket | Male | Female |
| Under 5 Years | 0 (0.0%) | 0 (0.0%) |
| 5 to 17 Years | 10 (8.2%) | 0 (0.0%) |
| 18 to 34 Years | 32 (7.0%) | 0 (0.0%) |
| 35 to 64 Years | 41 (13.1%) | 69 (22.6%) |
| 65 to 74 Years | 5 (7.1%) | 37 (45.7%) |
| 75 Years and over | 52 (61.9%) | 59 (84.3%) |
Disability Class by Sex by Age in Estill
Disability Class: Hearing Difficulty
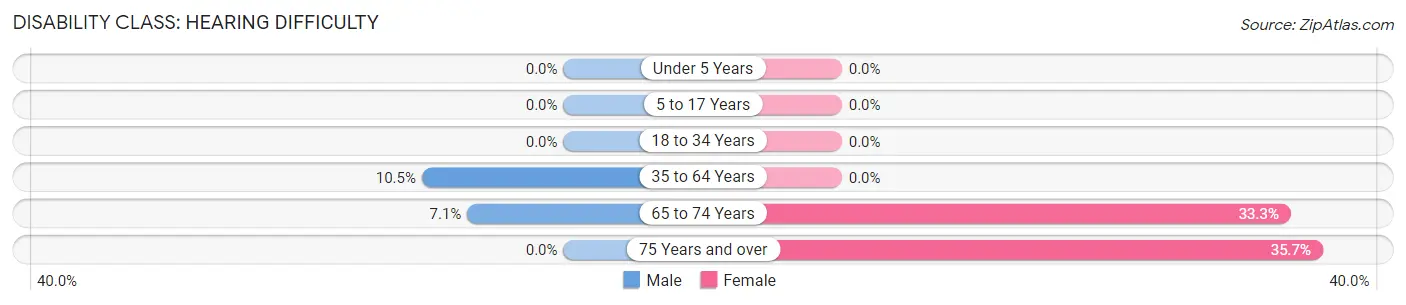
| Age Bracket | Male | Female |
| Under 5 Years | 0 (0.0%) | 0 (0.0%) |
| 5 to 17 Years | 0 (0.0%) | 0 (0.0%) |
| 18 to 34 Years | 0 (0.0%) | 0 (0.0%) |
| 35 to 64 Years | 33 (10.5%) | 0 (0.0%) |
| 65 to 74 Years | 5 (7.1%) | 27 (33.3%) |
| 75 Years and over | 0 (0.0%) | 25 (35.7%) |
Disability Class: Vision Difficulty
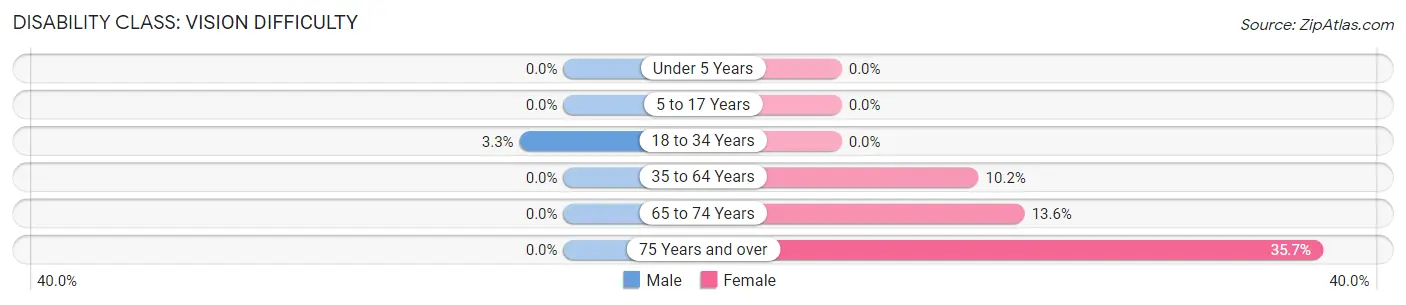
| Age Bracket | Male | Female |
| Under 5 Years | 0 (0.0%) | 0 (0.0%) |
| 5 to 17 Years | 0 (0.0%) | 0 (0.0%) |
| 18 to 34 Years | 15 (3.3%) | 0 (0.0%) |
| 35 to 64 Years | 0 (0.0%) | 31 (10.2%) |
| 65 to 74 Years | 0 (0.0%) | 11 (13.6%) |
| 75 Years and over | 0 (0.0%) | 25 (35.7%) |
Disability Class: Cognitive Difficulty
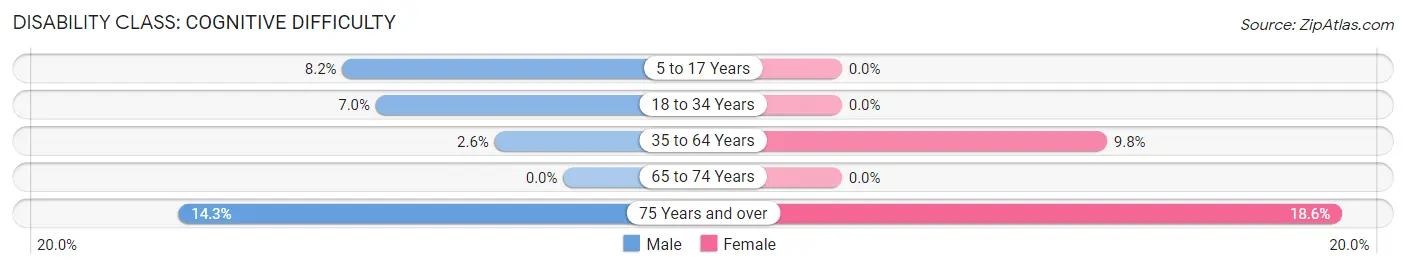
| Age Bracket | Male | Female |
| 5 to 17 Years | 10 (8.2%) | 0 (0.0%) |
| 18 to 34 Years | 32 (7.0%) | 0 (0.0%) |
| 35 to 64 Years | 8 (2.5%) | 30 (9.8%) |
| 65 to 74 Years | 0 (0.0%) | 0 (0.0%) |
| 75 Years and over | 12 (14.3%) | 13 (18.6%) |
Disability Class: Ambulatory Difficulty
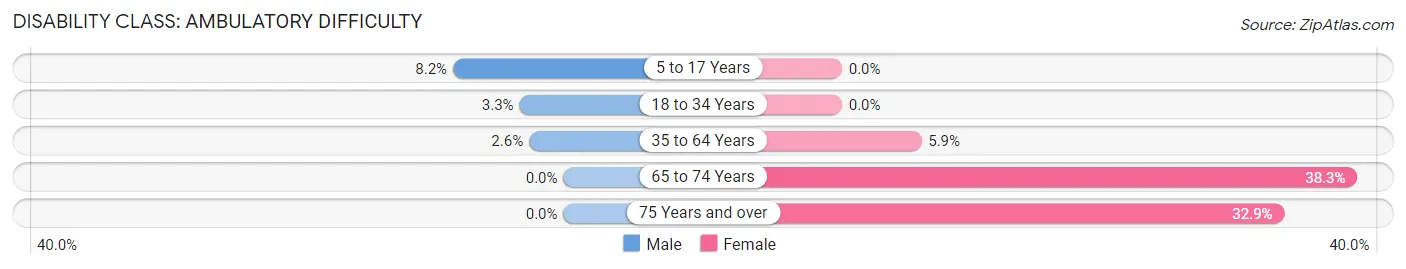
| Age Bracket | Male | Female |
| 5 to 17 Years | 10 (8.2%) | 0 (0.0%) |
| 18 to 34 Years | 15 (3.3%) | 0 (0.0%) |
| 35 to 64 Years | 8 (2.5%) | 18 (5.9%) |
| 65 to 74 Years | 0 (0.0%) | 31 (38.3%) |
| 75 Years and over | 0 (0.0%) | 23 (32.9%) |
Disability Class: Self-Care Difficulty
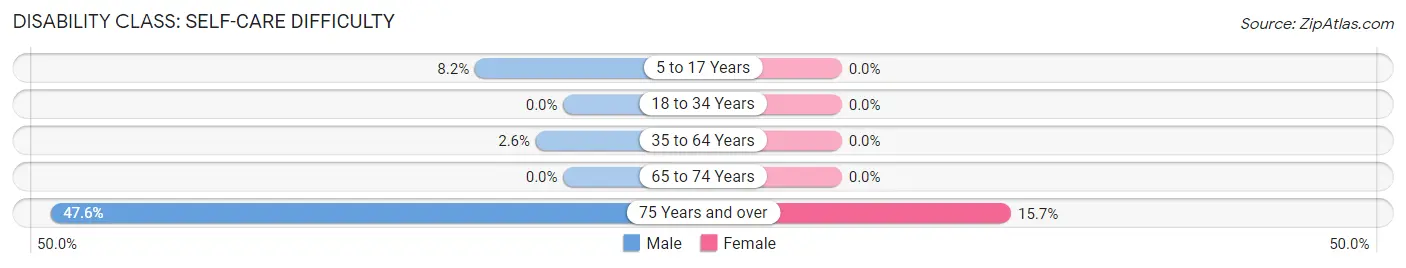
| Age Bracket | Male | Female |
| 5 to 17 Years | 10 (8.2%) | 0 (0.0%) |
| 18 to 34 Years | 0 (0.0%) | 0 (0.0%) |
| 35 to 64 Years | 8 (2.5%) | 0 (0.0%) |
| 65 to 74 Years | 0 (0.0%) | 0 (0.0%) |
| 75 Years and over | 40 (47.6%) | 11 (15.7%) |
Technology Access in Estill
Computing Device Access in Estill
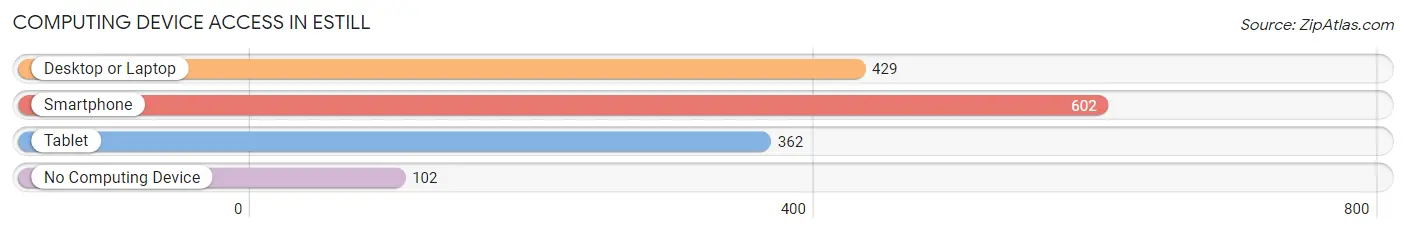
| Device Type | # Households | % Households |
| Desktop or Laptop | 429 | 56.2% |
| Smartphone | 602 | 78.9% |
| Tablet | 362 | 47.4% |
| No Computing Device | 102 | 13.4% |
| Total | 763 | 100.0% |
Internet Access in Estill
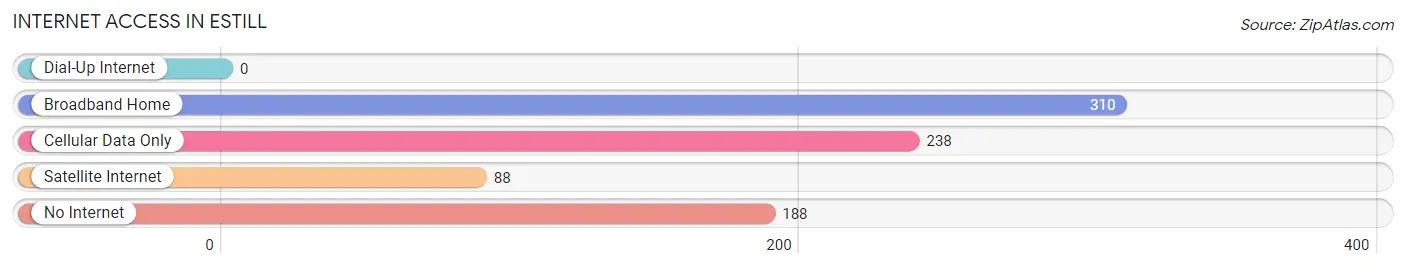
| Internet Type | # Households | % Households |
| Dial-Up Internet | 0 | 0.0% |
| Broadband Home | 310 | 40.6% |
| Cellular Data Only | 238 | 31.2% |
| Satellite Internet | 88 | 11.5% |
| No Internet | 188 | 24.6% |
| Total | 763 | 100.0% |
Estill Summary
Estill, South Carolina is a small town located in Hampton County, South Carolina. It is situated on the banks of the Great Pee Dee River, about 30 miles from the Atlantic Ocean. Estill is a rural community with a population of 1,845 people, according to the 2010 census.
Geography
Estill is located in the Lowcountry region of South Carolina, which is characterized by its flat terrain and coastal plains. The town is situated on the banks of the Great Pee Dee River, which is a major tributary of the Atlantic Ocean. Estill is surrounded by several small towns and villages, including Varnville, Luray, and Brunson. The town is also located near the Francis Marion National Forest, which is a popular destination for outdoor recreation.
The climate in Estill is humid subtropical, with hot, humid summers and mild winters. The average annual temperature is around 70 degrees Fahrenheit, with an average high of around 90 degrees in the summer and an average low of around 50 degrees in the winter. The area receives an average of 48 inches of precipitation per year, with most of it falling in the summer months.
Economy
Estill’s economy is largely based on agriculture and forestry. The town is home to several farms, which produce a variety of crops, including corn, soybeans, cotton, and peanuts. The town is also home to several timber companies, which harvest and process timber for use in construction and other industries.
In addition to agriculture and forestry, Estill is home to several small businesses, including restaurants, retail stores, and service providers. The town is also home to a few manufacturing companies, which produce a variety of products, including furniture, clothing, and electronics.
Demographics
Estill has a population of 1,845 people, according to the 2010 census. The town is predominantly white, with a population that is 87.3% white, 8.2% African American, and 4.5% Hispanic or Latino. The median household income in Estill is $31,250, and the median home value is $90,000.
Estill is served by the Hampton County School District, which includes three elementary schools, one middle school, and one high school. The town is also home to several churches, including Baptist, Methodist, and Presbyterian.
Estill is a small, rural town with a strong sense of community. The town is home to a variety of businesses and industries, and its residents enjoy a variety of outdoor activities, including fishing, hunting, and camping. Estill is a great place to live and work, and its residents take pride in their town and its history.
Common Questions
What is Per Capita Income in Estill?
Per Capita income in Estill is $18,135.
What is the Median Family Income in Estill?
Median Family Income in Estill is $41,463.
What is the Median Household income in Estill?
Median Household Income in Estill is $33,405.
What is Income or Wage Gap in Estill?
Income or Wage Gap in Estill is 28.2%.
Women in Estill earn 71.8 cents for every dollar earned by a man.
What is Family Income Deficit in Estill?
Family Income Deficit in Estill is $11,436.
Families that are below poverty line in Estill earn $11,436 less on average than the poverty threshold level.
What is Inequality or Gini Index in Estill?
Inequality or Gini Index in Estill is 0.52.
What is the Total Population of Estill?
Total Population of Estill is 2,230.
What is the Total Male Population of Estill?
Total Male Population of Estill is 1,211.
What is the Total Female Population of Estill?
Total Female Population of Estill is 1,019.
What is the Ratio of Males per 100 Females in Estill?
There are 118.84 Males per 100 Females in Estill.
What is the Ratio of Females per 100 Males in Estill?
There are 84.15 Females per 100 Males in Estill.
What is the Median Population Age in Estill?
Median Population Age in Estill is 33.4 Years.
What is the Average Family Size in Estill
Average Family Size in Estill is 3.4 People.
What is the Average Household Size in Estill
Average Household Size in Estill is 2.8 People.
How Large is the Labor Force in Estill?
There are 1,054 People in the Labor Forcein in Estill.
What is the Percentage of People in the Labor Force in Estill?
59.3% of People are in the Labor Force in Estill.
What is the Unemployment Rate in Estill?
Unemployment Rate in Estill is 12.5%.