Ridgeway, SC Map & Demographics
Ridgeway Map
Ridgeway Overview
$29,501
PER CAPITA INCOME
$47,500
AVG FAMILY INCOME
$40,500
AVG HOUSEHOLD INCOME
$10,068
FAMILY INCOME DEFICIT
0.57
INEQUALITY / GINI INDEX
251
TOTAL POPULATION
124
MALE POPULATION
127
FEMALE POPULATION
97.64
MALES / 100 FEMALES
102.42
FEMALES / 100 MALES
56.5
MEDIAN AGE
2.5
AVG FAMILY SIZE
2.0
AVG HOUSEHOLD SIZE
131
LABOR FORCE [ PEOPLE ]
60.6%
PERCENT IN LABOR FORCE
1.5%
UNEMPLOYMENT RATE
Ridgeway Zip Codes
Ridgeway Area Codes
Income in Ridgeway
Income Overview in Ridgeway
Per Capita Income in Ridgeway is $29,501, while median incomes of families and households are $47,500 and $40,500 respectively.
| Characteristic | Number | Measure |
| Per Capita Income | 251 | $29,501 |
| Median Family Income | 78 | $47,500 |
| Mean Family Income | 78 | $75,847 |
| Median Household Income | 128 | $40,500 |
| Mean Household Income | 128 | $59,910 |
| Income Deficit | 78 | $10,068 |
| Wage / Income Gap (%) | 251 | 0.00% |
| Wage / Income Gap ($) | 251 | 100.00¢ per $1 |
| Gini / Inequality Index | 251 | 0.57 |
Earnings by Sex in Ridgeway
| Sex | Number | Average Earnings |
| Male | 56 (42.1%) | $0 |
| Female | 77 (57.9%) | $0 |
| Total | 133 (100.0%) | $0 |
Earnings by Sex by Income Bracket in Ridgeway
The most common earnings brackets in Ridgeway are $7,500 to $9,999 for men (9 | 16.1%) and $2,500 to $4,999 for women (19 | 24.7%).
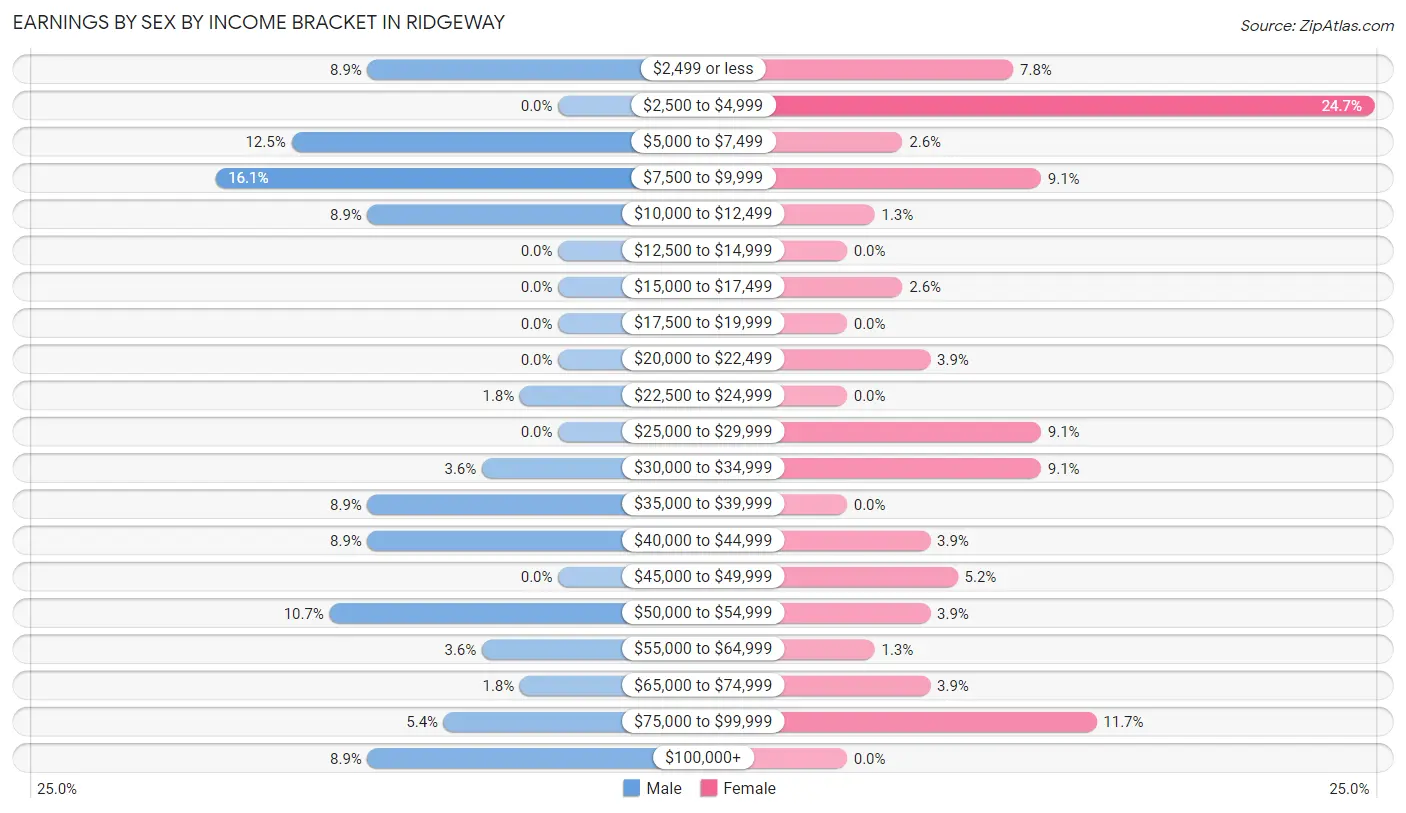
| Income | Male | Female |
| $2,499 or less | 5 (8.9%) | 6 (7.8%) |
| $2,500 to $4,999 | 0 (0.0%) | 19 (24.7%) |
| $5,000 to $7,499 | 7 (12.5%) | 2 (2.6%) |
| $7,500 to $9,999 | 9 (16.1%) | 7 (9.1%) |
| $10,000 to $12,499 | 5 (8.9%) | 1 (1.3%) |
| $12,500 to $14,999 | 0 (0.0%) | 0 (0.0%) |
| $15,000 to $17,499 | 0 (0.0%) | 2 (2.6%) |
| $17,500 to $19,999 | 0 (0.0%) | 0 (0.0%) |
| $20,000 to $22,499 | 0 (0.0%) | 3 (3.9%) |
| $22,500 to $24,999 | 1 (1.8%) | 0 (0.0%) |
| $25,000 to $29,999 | 0 (0.0%) | 7 (9.1%) |
| $30,000 to $34,999 | 2 (3.6%) | 7 (9.1%) |
| $35,000 to $39,999 | 5 (8.9%) | 0 (0.0%) |
| $40,000 to $44,999 | 5 (8.9%) | 3 (3.9%) |
| $45,000 to $49,999 | 0 (0.0%) | 4 (5.2%) |
| $50,000 to $54,999 | 6 (10.7%) | 3 (3.9%) |
| $55,000 to $64,999 | 2 (3.6%) | 1 (1.3%) |
| $65,000 to $74,999 | 1 (1.8%) | 3 (3.9%) |
| $75,000 to $99,999 | 3 (5.4%) | 9 (11.7%) |
| $100,000+ | 5 (8.9%) | 0 (0.0%) |
| Total | 56 (100.0%) | 77 (100.0%) |
Earnings by Sex by Educational Attainment in Ridgeway
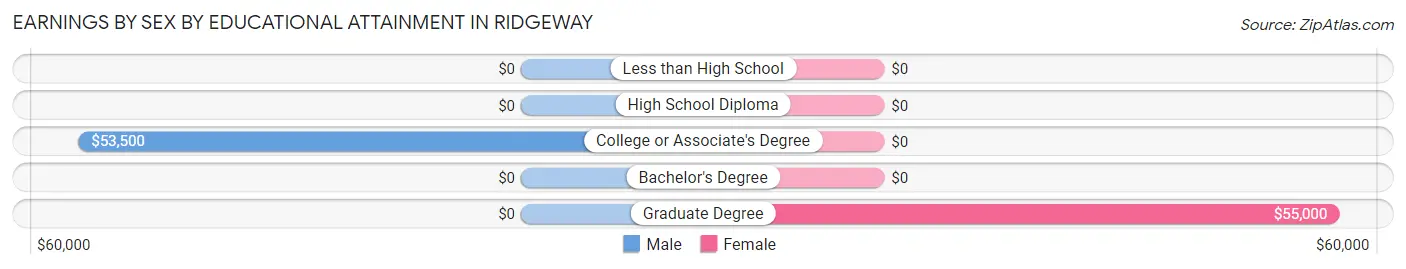
| Educational Attainment | Male Income | Female Income |
| Less than High School | - | - |
| High School Diploma | - | - |
| College or Associate's Degree | $53,500 | $0 |
| Bachelor's Degree | - | - |
| Graduate Degree | - | - |
| Total | $38,750 | $0 |
Family Income in Ridgeway
Family Income Brackets in Ridgeway
According to the Ridgeway family income data, there are 14 families falling into the less than $10,000 income range, which is the most common income bracket and makes up 17.9% of all families.
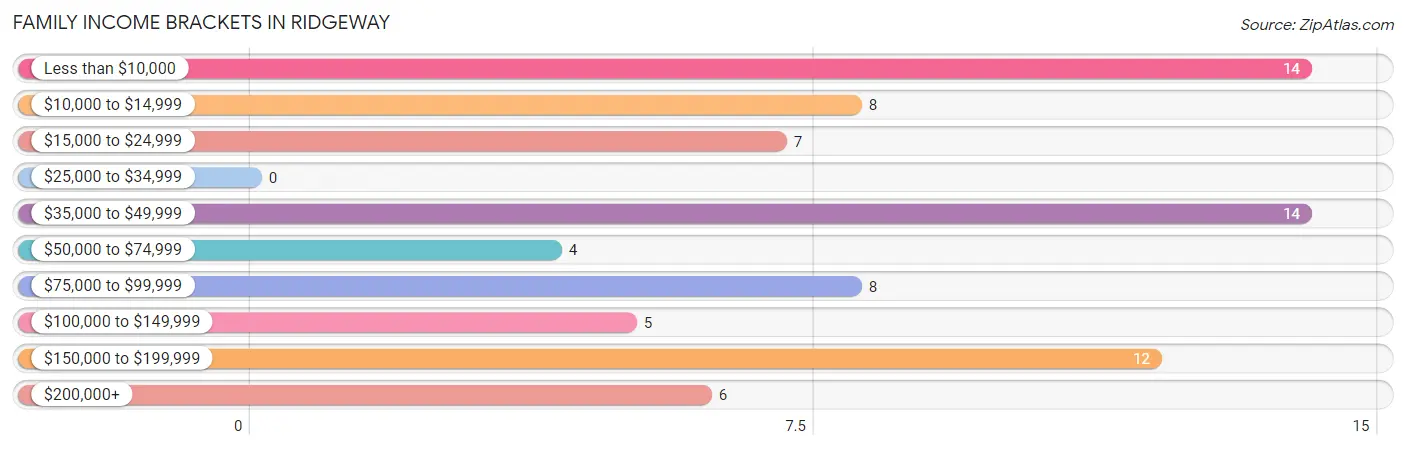
| Income Bracket | # Families | % Families |
| Less than $10,000 | 14 | 17.9% |
| $10,000 to $14,999 | 8 | 10.3% |
| $15,000 to $24,999 | 7 | 9.0% |
| $25,000 to $34,999 | 0 | 0.0% |
| $35,000 to $49,999 | 14 | 17.9% |
| $50,000 to $74,999 | 4 | 5.1% |
| $75,000 to $99,999 | 8 | 10.3% |
| $100,000 to $149,999 | 5 | 6.4% |
| $150,000 to $199,999 | 12 | 15.4% |
| $200,000+ | 6 | 7.7% |
Family Income by Famaliy Size in Ridgeway
4-person families (7 | 9.0%) account for the highest median family income in Ridgeway with $76,250 per family, while 2-person families (55 | 70.5%) have the highest median income of $25,208 per family member.
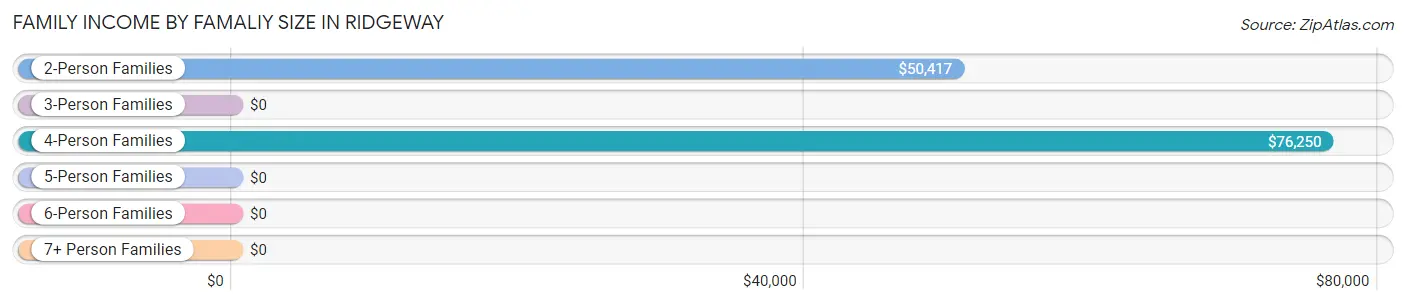
| Income Bracket | # Families | Median Income |
| 2-Person Families | 55 (70.5%) | $50,417 |
| 3-Person Families | 16 (20.5%) | $0 |
| 4-Person Families | 7 (9.0%) | $76,250 |
| 5-Person Families | 0 (0.0%) | $0 |
| 6-Person Families | 0 (0.0%) | $0 |
| 7+ Person Families | 0 (0.0%) | $0 |
| Total | 78 (100.0%) | $47,500 |
Family Income by Number of Earners in Ridgeway
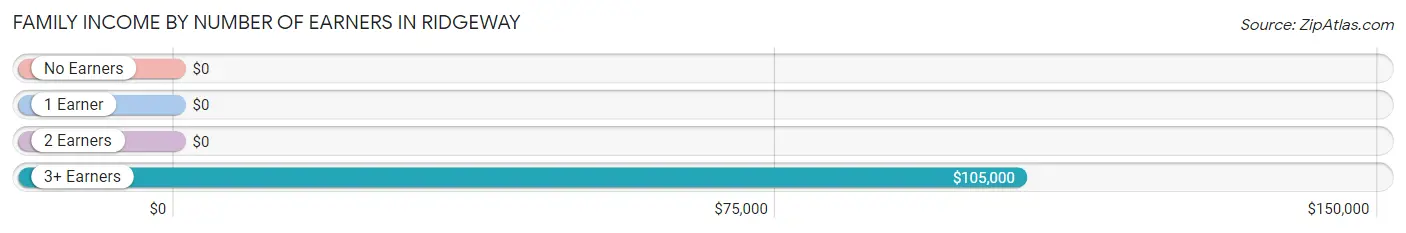
| Number of Earners | # Families | Median Income |
| No Earners | 16 (20.5%) | $0 |
| 1 Earner | 25 (32.1%) | $0 |
| 2 Earners | 29 (37.2%) | $0 |
| 3+ Earners | 8 (10.3%) | $105,000 |
| Total | 78 (100.0%) | $47,500 |
Household Income in Ridgeway
Household Income Brackets in Ridgeway
With 31 households falling in the category, the less than $10,000 income range is the most frequent in Ridgeway, accounting for 24.2% of all households. In contrast, only 3 households (2.3%) fall into the $25,000 to $34,999 income bracket, making it the least populous group.
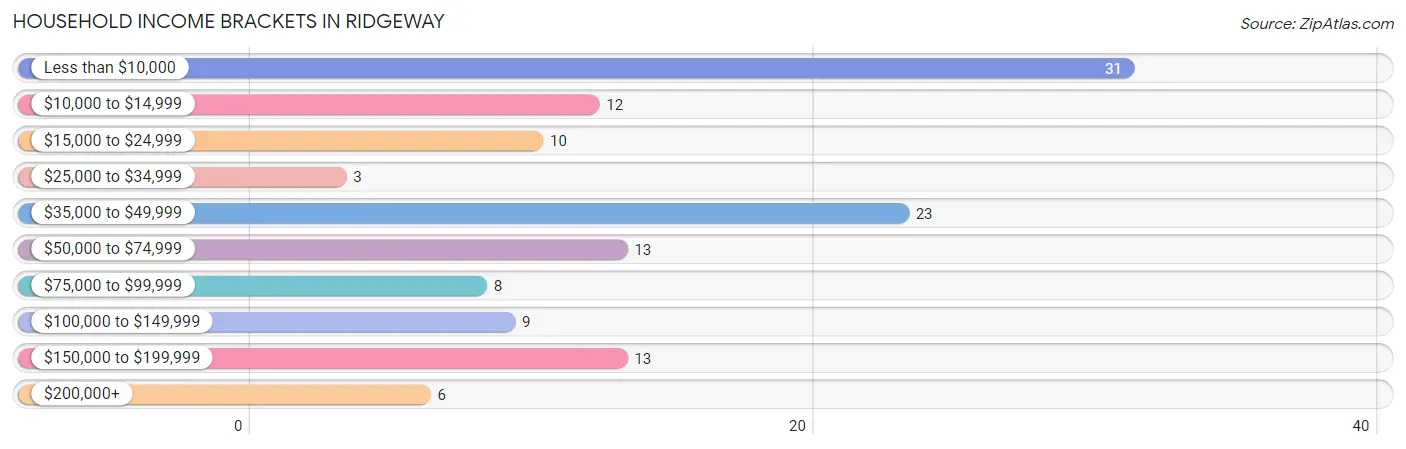
| Income Bracket | # Households | % Households |
| Less than $10,000 | 31 | 24.2% |
| $10,000 to $14,999 | 12 | 9.4% |
| $15,000 to $24,999 | 10 | 7.8% |
| $25,000 to $34,999 | 3 | 2.3% |
| $35,000 to $49,999 | 23 | 18.0% |
| $50,000 to $74,999 | 13 | 10.2% |
| $75,000 to $99,999 | 8 | 6.3% |
| $100,000 to $149,999 | 9 | 7.0% |
| $150,000 to $199,999 | 13 | 10.2% |
| $200,000+ | 6 | 4.7% |
Household Income by Householder Age in Ridgeway
The median household income in Ridgeway is $40,500, with the highest median household income of $41,750 found in the 25 to 44 years age bracket for the primary householder. A total of 21 households (16.4%) fall into this category. Meanwhile, the 15 to 24 years age bracket for the primary householder has the lowest median household income of $0, with 7 households (5.5%) in this group.
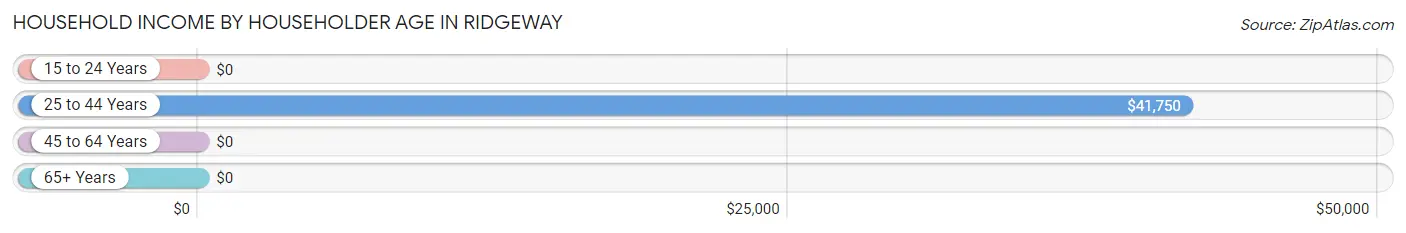
| Income Bracket | # Households | Median Income |
| 15 to 24 Years | 7 (5.5%) | $0 |
| 25 to 44 Years | 21 (16.4%) | $41,750 |
| 45 to 64 Years | 31 (24.2%) | $0 |
| 65+ Years | 69 (53.9%) | $0 |
| Total | 128 (100.0%) | $40,500 |
Poverty in Ridgeway
Income Below Poverty by Sex and Age in Ridgeway
With 43.5% poverty level for males and 35.4% for females among the residents of Ridgeway, under 5 year old males and 25 to 34 year old females are the most vulnerable to poverty, with 17 males (100.0%) and 16 females (69.6%) in their respective age groups living below the poverty level.
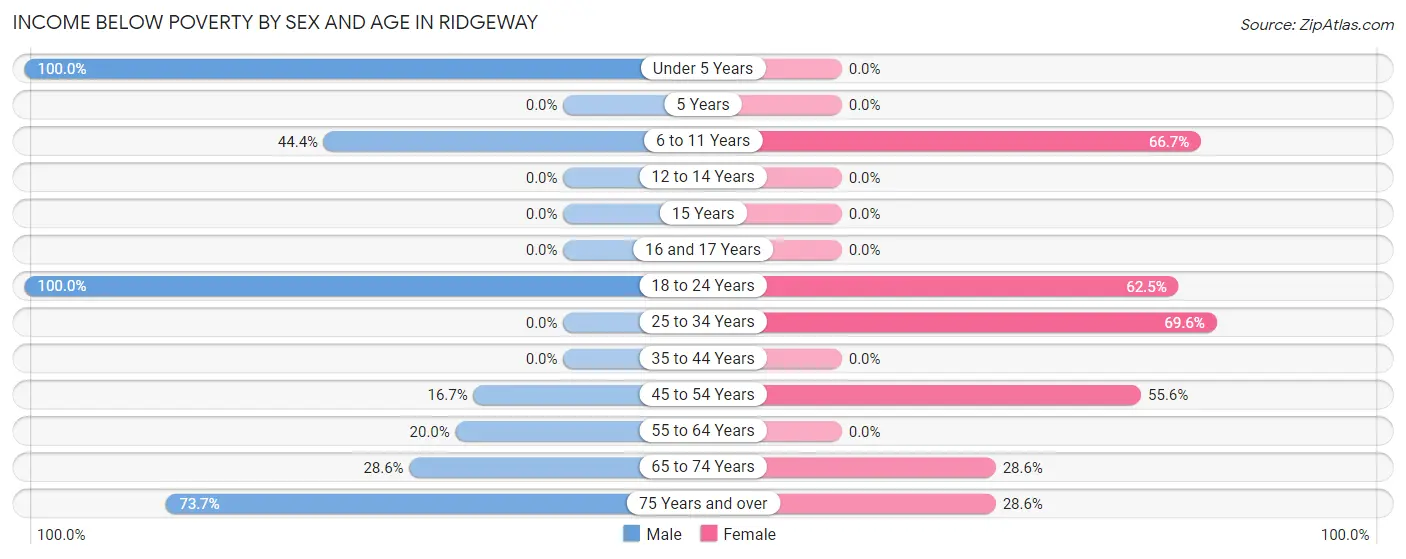
| Age Bracket | Male | Female |
| Under 5 Years | 17 (100.0%) | 0 (0.0%) |
| 5 Years | 0 (0.0%) | 0 (0.0%) |
| 6 to 11 Years | 4 (44.4%) | 2 (66.7%) |
| 12 to 14 Years | 0 (0.0%) | 0 (0.0%) |
| 15 Years | 0 (0.0%) | 0 (0.0%) |
| 16 and 17 Years | 0 (0.0%) | 0 (0.0%) |
| 18 to 24 Years | 7 (100.0%) | 5 (62.5%) |
| 25 to 34 Years | 0 (0.0%) | 16 (69.6%) |
| 35 to 44 Years | 0 (0.0%) | 0 (0.0%) |
| 45 to 54 Years | 1 (16.7%) | 10 (55.6%) |
| 55 to 64 Years | 3 (20.0%) | 0 (0.0%) |
| 65 to 74 Years | 8 (28.6%) | 10 (28.6%) |
| 75 Years and over | 14 (73.7%) | 2 (28.6%) |
| Total | 54 (43.5%) | 45 (35.4%) |
Income Above Poverty by Sex and Age in Ridgeway
According to the poverty statistics in Ridgeway, males aged 12 to 14 years and females aged 12 to 14 years are the age groups that are most secure financially, with 100.0% of males and 100.0% of females in these age groups living above the poverty line.
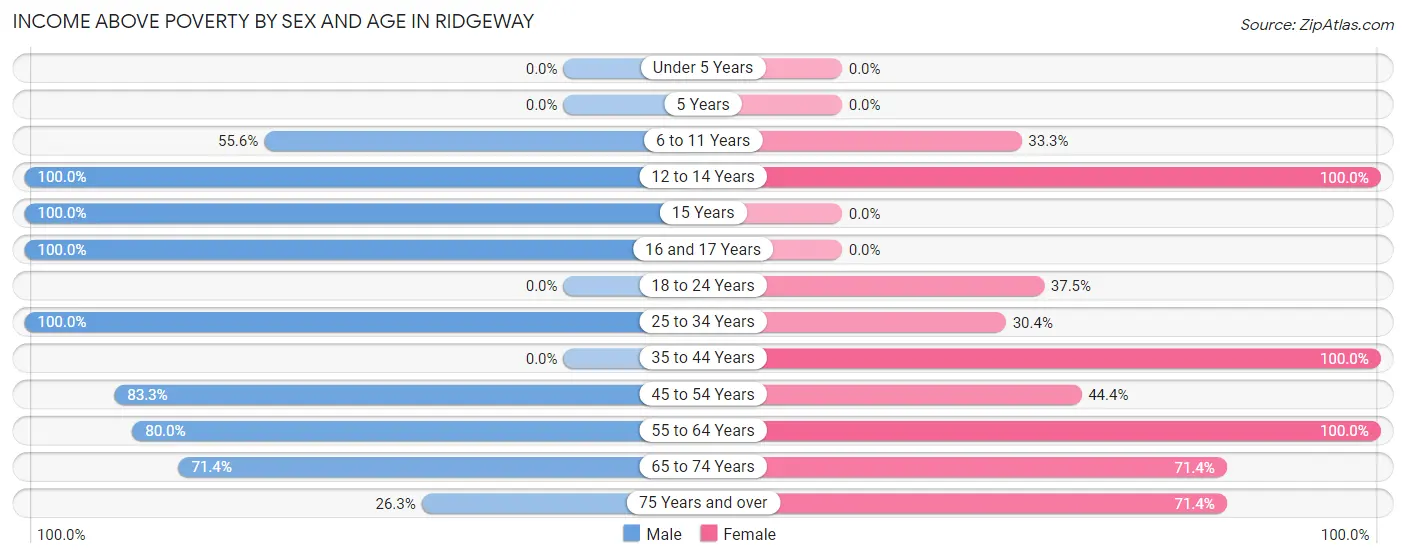
| Age Bracket | Male | Female |
| Under 5 Years | 0 (0.0%) | 0 (0.0%) |
| 5 Years | 0 (0.0%) | 0 (0.0%) |
| 6 to 11 Years | 5 (55.6%) | 1 (33.3%) |
| 12 to 14 Years | 2 (100.0%) | 3 (100.0%) |
| 15 Years | 1 (100.0%) | 0 (0.0%) |
| 16 and 17 Years | 5 (100.0%) | 0 (0.0%) |
| 18 to 24 Years | 0 (0.0%) | 3 (37.5%) |
| 25 to 34 Years | 15 (100.0%) | 7 (30.4%) |
| 35 to 44 Years | 0 (0.0%) | 5 (100.0%) |
| 45 to 54 Years | 5 (83.3%) | 8 (44.4%) |
| 55 to 64 Years | 12 (80.0%) | 25 (100.0%) |
| 65 to 74 Years | 20 (71.4%) | 25 (71.4%) |
| 75 Years and over | 5 (26.3%) | 5 (71.4%) |
| Total | 70 (56.5%) | 82 (64.6%) |
Income Below Poverty Among Married-Couple Families in Ridgeway
The poverty statistics for married-couple families in Ridgeway show that 28.8% or 15 of the total 52 families live below the poverty line. Families with 1 or 2 children have the highest poverty rate of 53.8%, comprising of 7 families. On the other hand, families with no children have the lowest poverty rate of 20.5%, which includes 8 families.
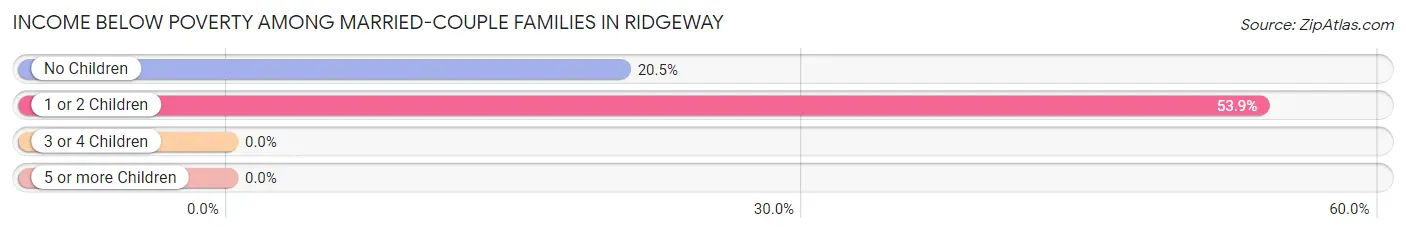
| Children | Above Poverty | Below Poverty |
| No Children | 31 (79.5%) | 8 (20.5%) |
| 1 or 2 Children | 6 (46.2%) | 7 (53.8%) |
| 3 or 4 Children | 0 (0.0%) | 0 (0.0%) |
| 5 or more Children | 0 (0.0%) | 0 (0.0%) |
| Total | 37 (71.2%) | 15 (28.8%) |
Income Below Poverty Among Single-Parent Households in Ridgeway
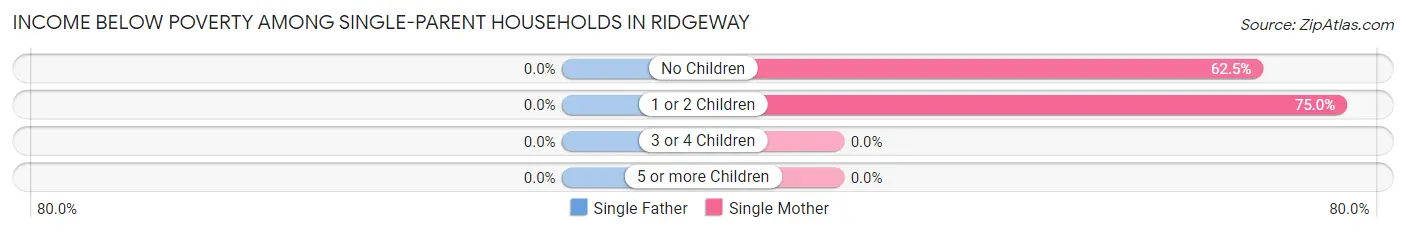
| Children | Single Father | Single Mother |
| No Children | 0 (0.0%) | 10 (62.5%) |
| 1 or 2 Children | 0 (0.0%) | 3 (75.0%) |
| 3 or 4 Children | 0 (0.0%) | 0 (0.0%) |
| 5 or more Children | 0 (0.0%) | 0 (0.0%) |
| Total | 0 (0.0%) | 13 (65.0%) |
Income Below Poverty Among Married-Couple vs Single-Parent Households in Ridgeway
The poverty data for Ridgeway shows that 15 of the married-couple family households (28.8%) and 13 of the single-parent households (50.0%) are living below the poverty level. Within the married-couple family households, those with 1 or 2 children have the highest poverty rate, with 7 households (53.8%) falling below the poverty line. Among the single-parent households, those with no children have the highest poverty rate, with 10 household (62.5%) living below poverty.
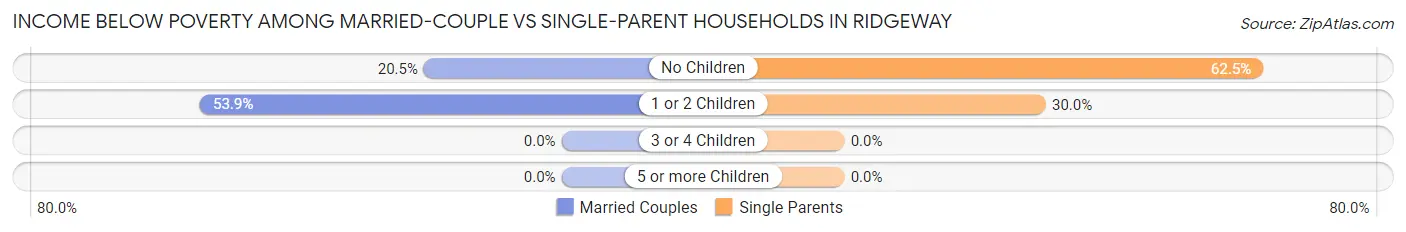
| Children | Married-Couple Families | Single-Parent Households |
| No Children | 8 (20.5%) | 10 (62.5%) |
| 1 or 2 Children | 7 (53.8%) | 3 (30.0%) |
| 3 or 4 Children | 0 (0.0%) | 0 (0.0%) |
| 5 or more Children | 0 (0.0%) | 0 (0.0%) |
| Total | 15 (28.8%) | 13 (50.0%) |
Race in Ridgeway
The most populous races in Ridgeway are White / Caucasian (173 | 68.9%), Black / African American (75 | 29.9%), and Hispanic or Latino (5 | 2.0%).
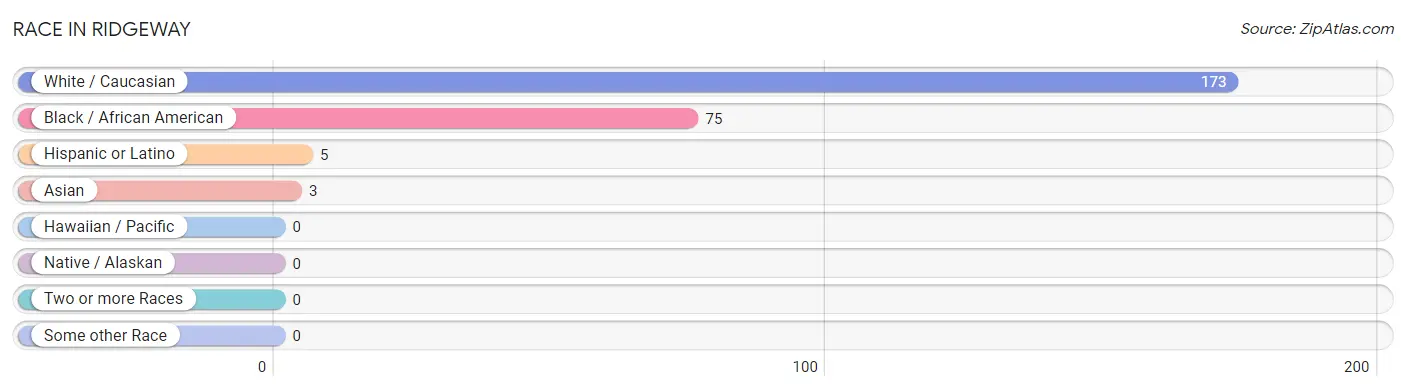
| Race | # Population | % Population |
| Asian | 3 | 1.2% |
| Black / African American | 75 | 29.9% |
| Hawaiian / Pacific | 0 | 0.0% |
| Hispanic or Latino | 5 | 2.0% |
| Native / Alaskan | 0 | 0.0% |
| White / Caucasian | 173 | 68.9% |
| Two or more Races | 0 | 0.0% |
| Some other Race | 0 | 0.0% |
| Total | 251 | 100.0% |
Ancestry in Ridgeway
The most populous ancestries reported in Ridgeway are German (29 | 11.6%), English (20 | 8.0%), Irish (17 | 6.8%), Scottish (11 | 4.4%), and European (9 | 3.6%), together accounting for 34.3% of all Ridgeway residents.
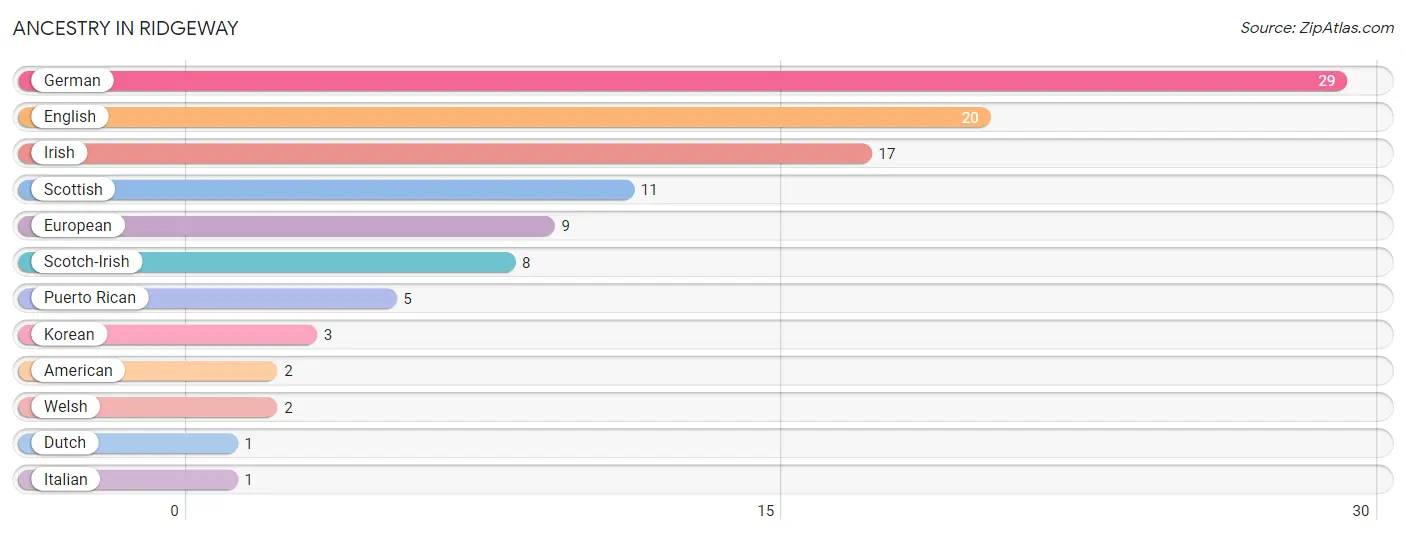
| Ancestry | # Population | % Population |
| American | 2 | 0.8% |
| Dutch | 1 | 0.4% |
| English | 20 | 8.0% |
| European | 9 | 3.6% |
| German | 29 | 11.6% |
| Irish | 17 | 6.8% |
| Italian | 1 | 0.4% |
| Korean | 3 | 1.2% |
| Puerto Rican | 5 | 2.0% |
| Scotch-Irish | 8 | 3.2% |
| Scottish | 11 | 4.4% |
| Welsh | 2 | 0.8% | View All 12 Rows |
Immigrants in Ridgeway
The most numerous immigrant groups reported in Ridgeway came from Asia (3 | 1.2%), Philippines (3 | 1.2%), South Eastern Asia (3 | 1.2%), Europe (1 | 0.4%), and Northern Europe (1 | 0.4%), together accounting for 4.4% of all Ridgeway residents.
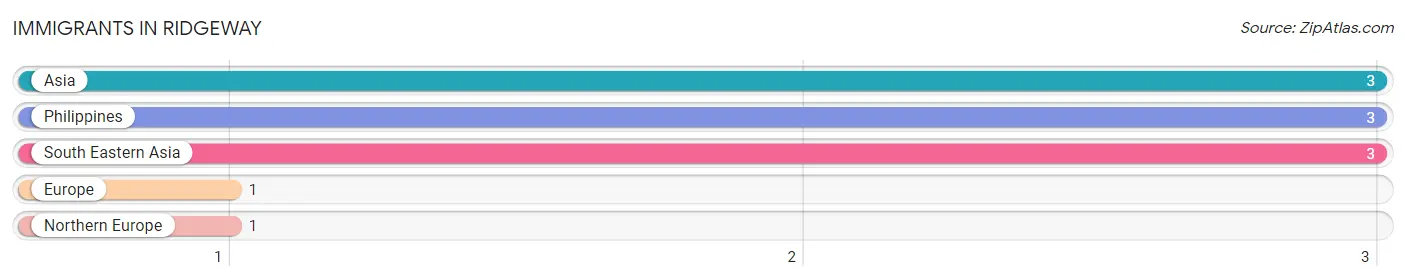
| Immigration Origin | # Population | % Population |
| Asia | 3 | 1.2% |
| Europe | 1 | 0.4% |
| Northern Europe | 1 | 0.4% |
| Philippines | 3 | 1.2% |
| South Eastern Asia | 3 | 1.2% | View All 5 Rows |
Sex and Age in Ridgeway
Sex and Age in Ridgeway
The most populous age groups in Ridgeway are Under 5 Years (17 | 13.7%) for men and 65 to 69 Years (21 | 16.5%) for women.
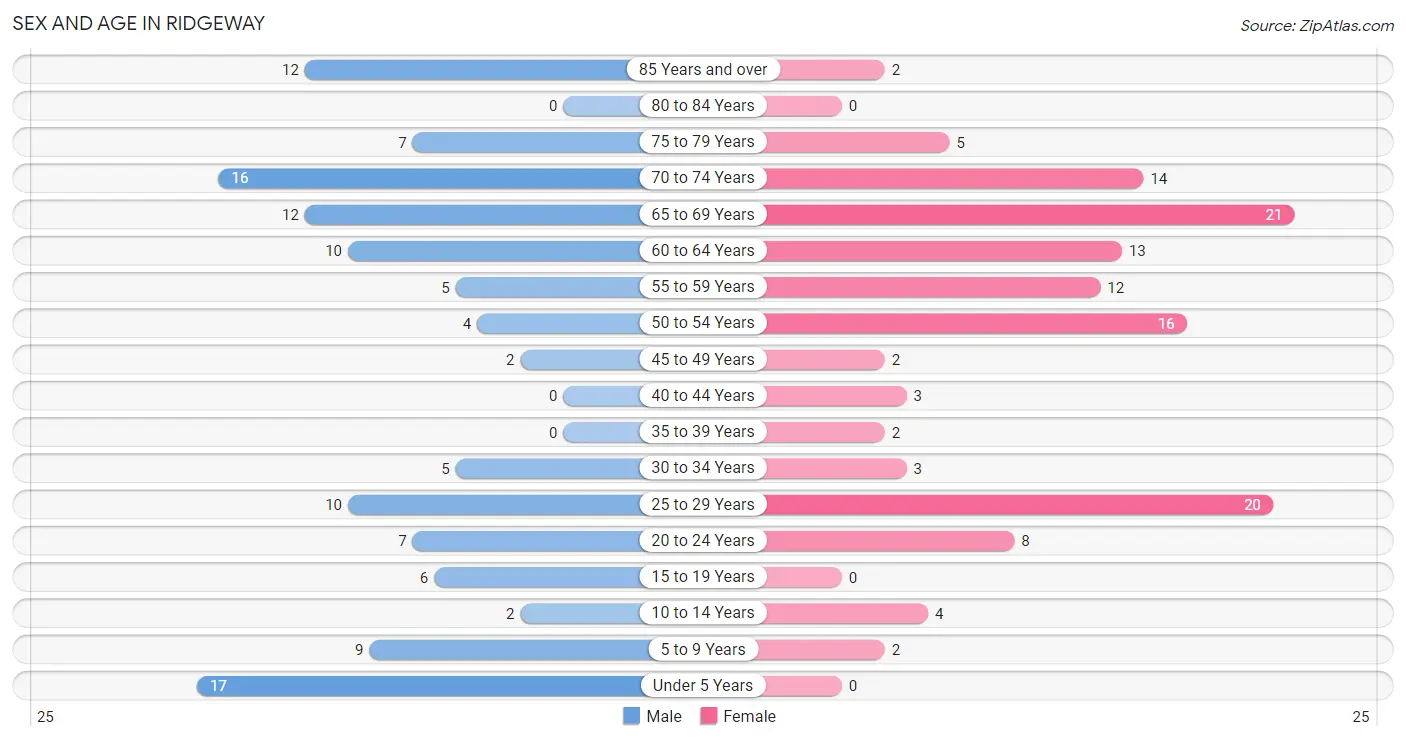
| Age Bracket | Male | Female |
| Under 5 Years | 17 (13.7%) | 0 (0.0%) |
| 5 to 9 Years | 9 (7.3%) | 2 (1.6%) |
| 10 to 14 Years | 2 (1.6%) | 4 (3.2%) |
| 15 to 19 Years | 6 (4.8%) | 0 (0.0%) |
| 20 to 24 Years | 7 (5.7%) | 8 (6.3%) |
| 25 to 29 Years | 10 (8.1%) | 20 (15.8%) |
| 30 to 34 Years | 5 (4.0%) | 3 (2.4%) |
| 35 to 39 Years | 0 (0.0%) | 2 (1.6%) |
| 40 to 44 Years | 0 (0.0%) | 3 (2.4%) |
| 45 to 49 Years | 2 (1.6%) | 2 (1.6%) |
| 50 to 54 Years | 4 (3.2%) | 16 (12.6%) |
| 55 to 59 Years | 5 (4.0%) | 12 (9.5%) |
| 60 to 64 Years | 10 (8.1%) | 13 (10.2%) |
| 65 to 69 Years | 12 (9.7%) | 21 (16.5%) |
| 70 to 74 Years | 16 (12.9%) | 14 (11.0%) |
| 75 to 79 Years | 7 (5.7%) | 5 (3.9%) |
| 80 to 84 Years | 0 (0.0%) | 0 (0.0%) |
| 85 Years and over | 12 (9.7%) | 2 (1.6%) |
| Total | 124 (100.0%) | 127 (100.0%) |
Families and Households in Ridgeway
Median Family Size in Ridgeway
The median family size in Ridgeway is 2.55 persons per family, with single female/mother families (20 | 25.6%) accounting for the largest median family size of 2.6 persons per family. On the other hand, single male/father families (6 | 7.7%) represent the smallest median family size with 2.17 persons per family.
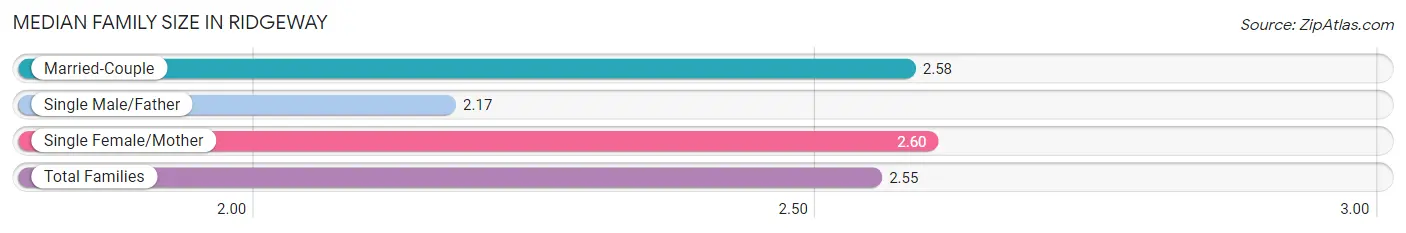
| Family Type | # Families | Family Size |
| Married-Couple | 52 (66.7%) | 2.58 |
| Single Male/Father | 6 (7.7%) | 2.17 |
| Single Female/Mother | 20 (25.6%) | 2.60 |
| Total Families | 78 (100.0%) | 2.55 |
Median Household Size in Ridgeway
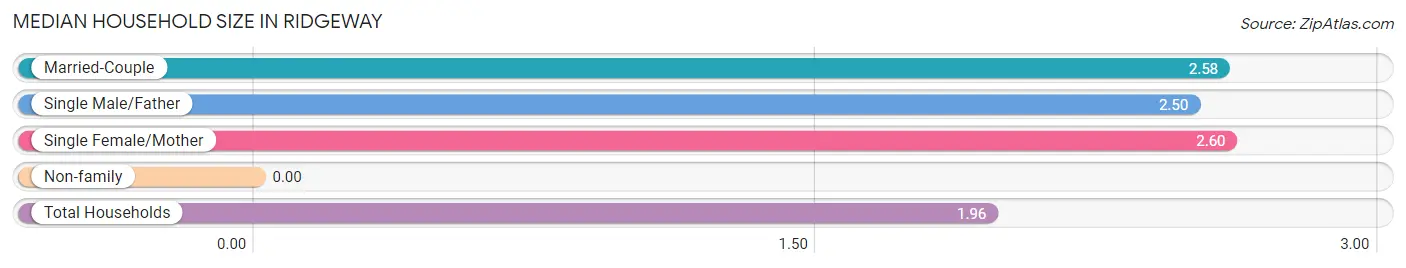
| Household Type | # Households | Household Size |
| Married-Couple | 52 (40.6%) | 2.58 |
| Single Male/Father | 6 (4.7%) | 2.50 |
| Single Female/Mother | 20 (15.6%) | 2.60 |
| Non-family | 50 (39.1%) | - |
| Total Households | 128 (100.0%) | 1.96 |
Household Size by Marriage Status in Ridgeway
Out of a total of 128 households in Ridgeway, 78 (60.9%) are family households, while 50 (39.1%) are nonfamily households. The most numerous type of family households are 2-person households, comprising 55, and the most common type of nonfamily households are 1-person households, comprising 50.
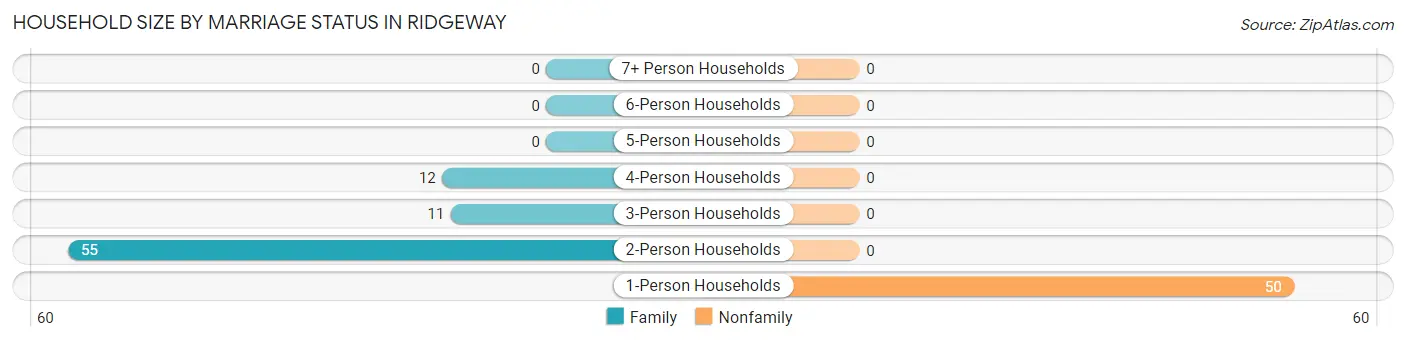
| Household Size | Family Households | Nonfamily Households |
| 1-Person Households | - | 50 (39.1%) |
| 2-Person Households | 55 (43.0%) | 0 (0.0%) |
| 3-Person Households | 11 (8.6%) | 0 (0.0%) |
| 4-Person Households | 12 (9.4%) | 0 (0.0%) |
| 5-Person Households | 0 (0.0%) | 0 (0.0%) |
| 6-Person Households | 0 (0.0%) | 0 (0.0%) |
| 7+ Person Households | 0 (0.0%) | 0 (0.0%) |
| Total | 78 (60.9%) | 50 (39.1%) |
Female Fertility in Ridgeway
Fertility by Age in Ridgeway
| Age Bracket | Women with Births | Births / 1,000 Women |
| 15 to 19 years | 0 (0.0%) | 0.0 |
| 20 to 34 years | 0 (0.0%) | 0.0 |
| 35 to 50 years | 0 (0.0%) | 0.0 |
| Total | 0 (0.0%) | 0.0 |
Fertility by Age by Marriage Status in Ridgeway
| Age Bracket | Married | Unmarried |
| 15 to 19 years | 0 (0.0%) | 0 (0.0%) |
| 20 to 34 years | 0 (0.0%) | 0 (0.0%) |
| 35 to 50 years | 0 (0.0%) | 0 (0.0%) |
| Total | 0 (0.0%) | 0 (0.0%) |
Fertility by Education in Ridgeway
| Educational Attainment | Women with Births | Births / 1,000 Women |
| Less than High School | 0 (0.0%) | 0.0 |
| High School Diploma | 0 (0.0%) | 0.0 |
| College or Associate's Degree | 0 (0.0%) | 0.0 |
| Bachelor's Degree | 0 (0.0%) | 0.0 |
| Graduate Degree | 0 (0.0%) | 0.0 |
| Total | 0 (0.0%) | 0.0 |
Fertility by Education by Marriage Status in Ridgeway
| Educational Attainment | Married | Unmarried |
| Less than High School | 0 (0.0%) | 0 (0.0%) |
| High School Diploma | 0 (0.0%) | 0 (0.0%) |
| College or Associate's Degree | 0 (0.0%) | 0 (0.0%) |
| Bachelor's Degree | 0 (0.0%) | 0 (0.0%) |
| Graduate Degree | 0 (0.0%) | 0 (0.0%) |
| Total | 0 (0.0%) | 0 (0.0%) |
Employment Characteristics in Ridgeway
Employment by Class of Employer in Ridgeway
Among the 129 employed individuals in Ridgeway, private company employees (77 | 59.7%), local government employees (27 | 20.9%), and self-employed (not incorporated) (10 | 7.7%) make up the most common classes of employment.
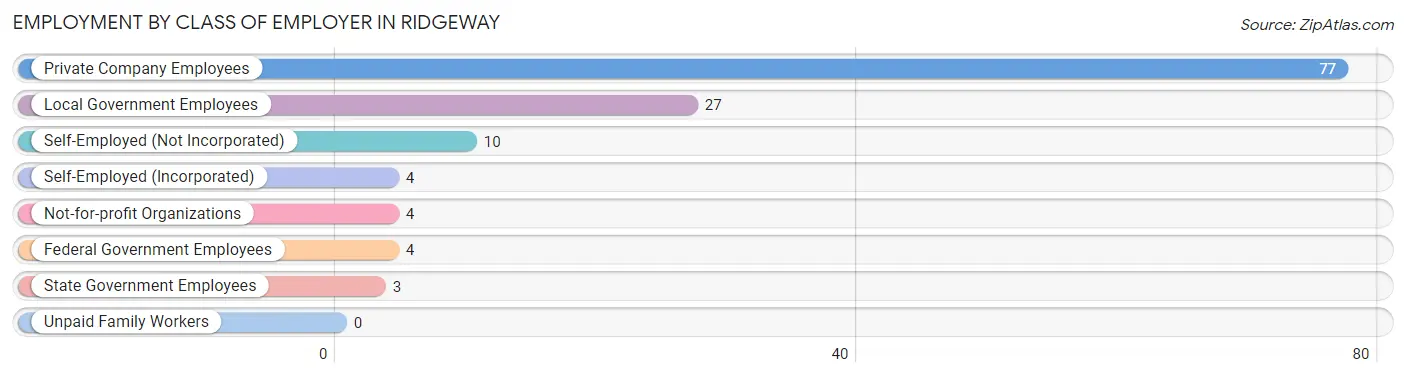
| Employer Class | # Employees | % Employees |
| Private Company Employees | 77 | 59.7% |
| Self-Employed (Incorporated) | 4 | 3.1% |
| Self-Employed (Not Incorporated) | 10 | 7.7% |
| Not-for-profit Organizations | 4 | 3.1% |
| Local Government Employees | 27 | 20.9% |
| State Government Employees | 3 | 2.3% |
| Federal Government Employees | 4 | 3.1% |
| Unpaid Family Workers | 0 | 0.0% |
| Total | 129 | 100.0% |
Employment Status by Age in Ridgeway
According to the labor force statistics for Ridgeway, out of the total population over 16 years of age (216), 60.6% or 131 individuals are in the labor force, with 1.5% or 2 of them unemployed. The age group with the highest labor force participation rate is 16 to 19 years, with 100.0% or 5 individuals in the labor force. Within the labor force, the 30 to 34 years age range has the highest percentage of unemployed individuals, with 25.0% or 2 of them being unemployed.
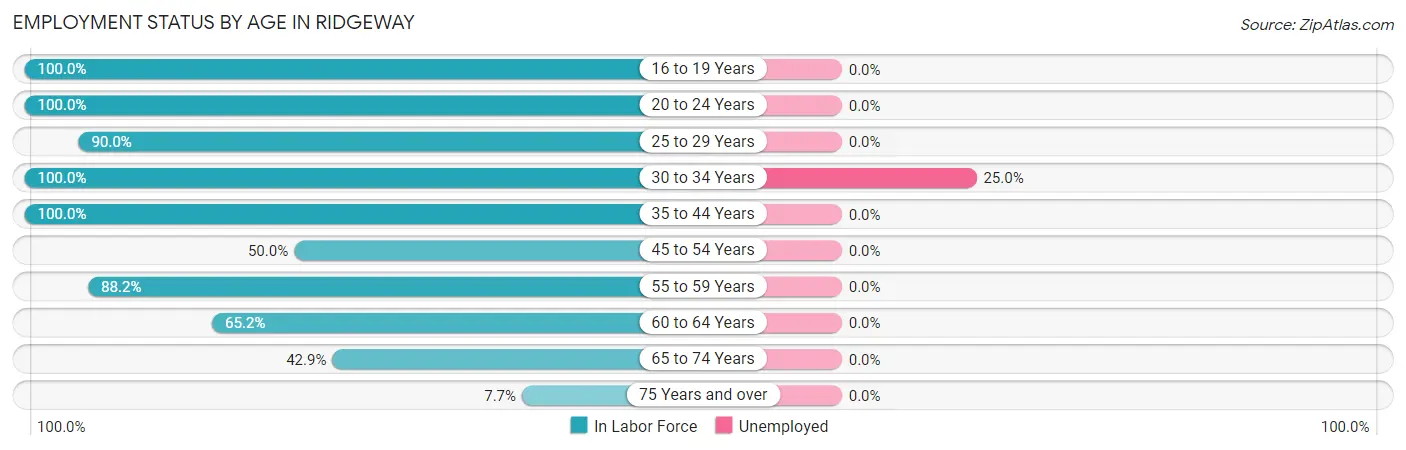
| Age Bracket | In Labor Force | Unemployed |
| 16 to 19 Years | 5 (100.0%) | 0 (0.0%) |
| 20 to 24 Years | 15 (100.0%) | 0 (0.0%) |
| 25 to 29 Years | 27 (90.0%) | 0 (0.0%) |
| 30 to 34 Years | 8 (100.0%) | 2 (25.0%) |
| 35 to 44 Years | 5 (100.0%) | 0 (0.0%) |
| 45 to 54 Years | 12 (50.0%) | 0 (0.0%) |
| 55 to 59 Years | 15 (88.2%) | 0 (0.0%) |
| 60 to 64 Years | 15 (65.2%) | 0 (0.0%) |
| 65 to 74 Years | 27 (42.9%) | 0 (0.0%) |
| 75 Years and over | 2 (7.7%) | 0 (0.0%) |
| Total | 131 (60.6%) | 2 (1.5%) |
Employment Status by Educational Attainment in Ridgeway
According to labor force statistics for Ridgeway, 76.6% of individuals (82) out of the total population between 25 and 64 years of age (107) are in the labor force, with 2.4% or 2 of them being unemployed. The group with the highest labor force participation rate are those with the educational attainment of bachelor's degree or higher, with 96.3% or 26 individuals in the labor force. Within the labor force, individuals with high school diploma education have the highest percentage of unemployment, with 11.1% or 2 of them being unemployed.
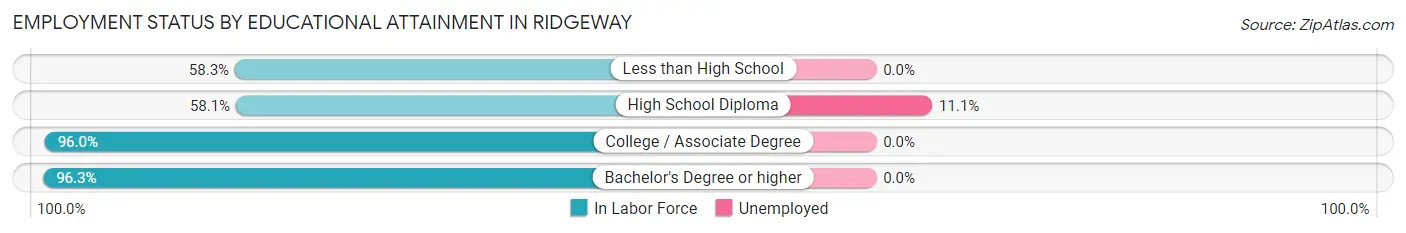
| Educational Attainment | In Labor Force | Unemployed |
| Less than High School | 14 (58.3%) | 0 (0.0%) |
| High School Diploma | 18 (58.1%) | 3 (11.1%) |
| College / Associate Degree | 24 (96.0%) | 0 (0.0%) |
| Bachelor's Degree or higher | 26 (96.3%) | 0 (0.0%) |
| Total | 82 (76.6%) | 3 (2.4%) |
Employment Occupations by Sex in Ridgeway
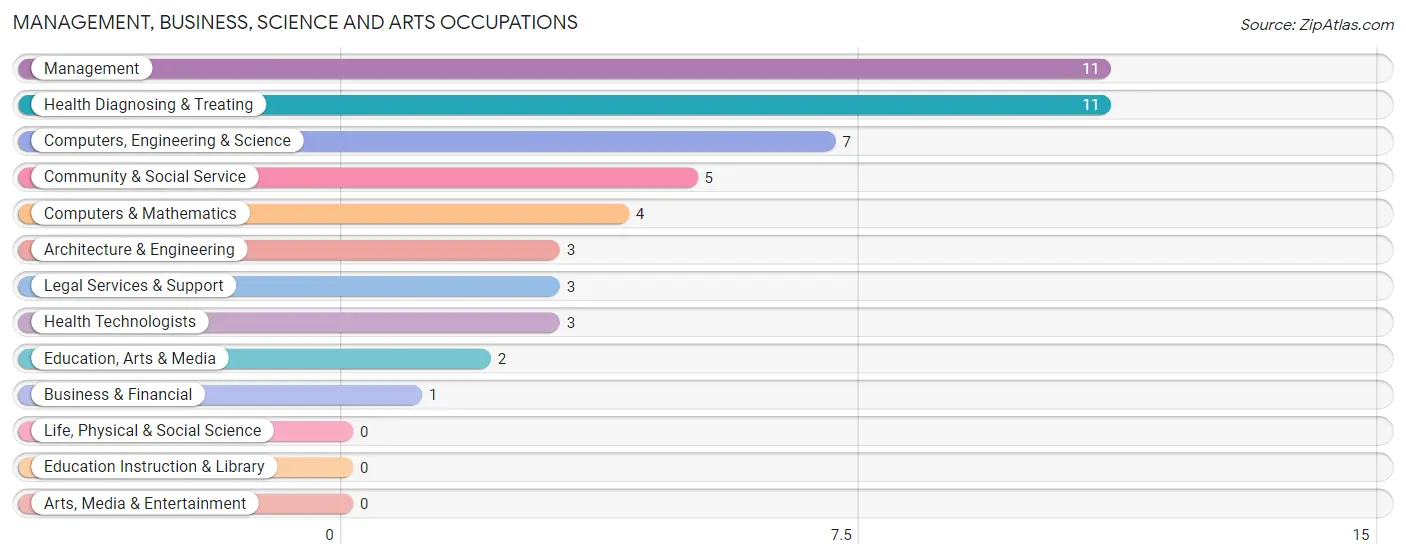
Management, Business, Science and Arts Occupations
The most common Management, Business, Science and Arts occupations in Ridgeway are Management (11 | 8.5%), Health Diagnosing & Treating (11 | 8.5%), Computers, Engineering & Science (7 | 5.4%), Community & Social Service (5 | 3.9%), and Computers & Mathematics (4 | 3.1%).
Management, Business, Science and Arts Occupations by Sex
Within the Management, Business, Science and Arts occupations in Ridgeway, the most male-oriented occupations are Architecture & Engineering (100.0%), Computers, Engineering & Science (71.4%), and Legal Services & Support (66.7%), while the most female-oriented occupations are Business & Financial (100.0%), Education, Arts & Media (100.0%), and Health Diagnosing & Treating (100.0%).
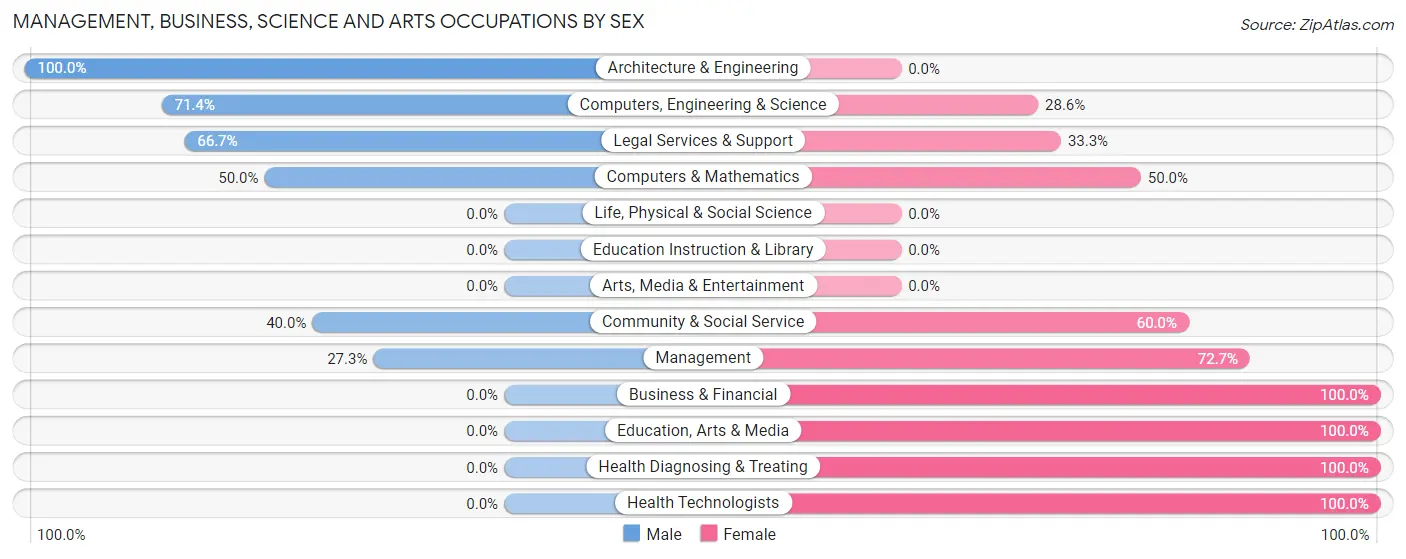
| Occupation | Male | Female |
| Management | 3 (27.3%) | 8 (72.7%) |
| Business & Financial | 0 (0.0%) | 1 (100.0%) |
| Computers, Engineering & Science | 5 (71.4%) | 2 (28.6%) |
| Computers & Mathematics | 2 (50.0%) | 2 (50.0%) |
| Architecture & Engineering | 3 (100.0%) | 0 (0.0%) |
| Life, Physical & Social Science | 0 (0.0%) | 0 (0.0%) |
| Community & Social Service | 2 (40.0%) | 3 (60.0%) |
| Education, Arts & Media | 0 (0.0%) | 2 (100.0%) |
| Legal Services & Support | 2 (66.7%) | 1 (33.3%) |
| Education Instruction & Library | 0 (0.0%) | 0 (0.0%) |
| Arts, Media & Entertainment | 0 (0.0%) | 0 (0.0%) |
| Health Diagnosing & Treating | 0 (0.0%) | 11 (100.0%) |
| Health Technologists | 0 (0.0%) | 3 (100.0%) |
| Total (Category) | 10 (28.6%) | 25 (71.4%) |
| Total (Overall) | 56 (43.4%) | 73 (56.6%) |
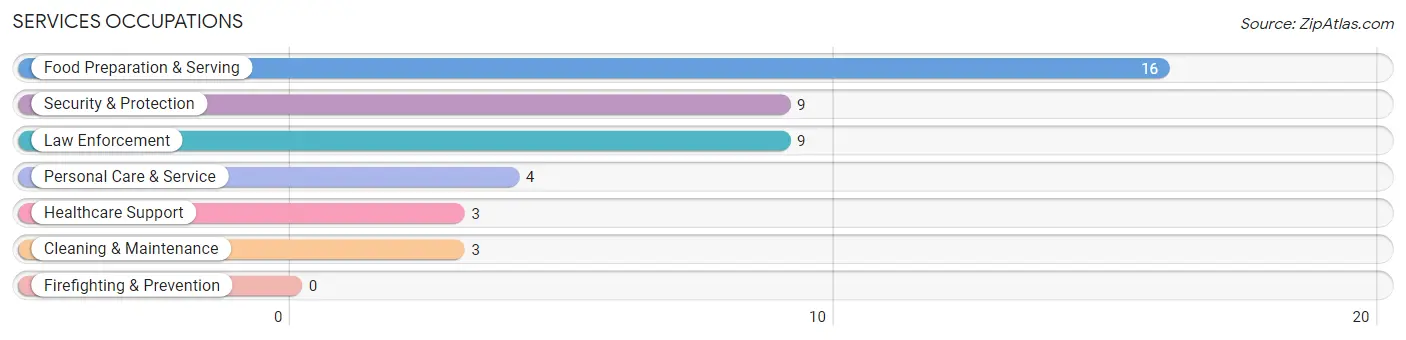
Services Occupations
The most common Services occupations in Ridgeway are Food Preparation & Serving (16 | 12.4%), Security & Protection (9 | 7.0%), Law Enforcement (9 | 7.0%), Personal Care & Service (4 | 3.1%), and Healthcare Support (3 | 2.3%).
Services Occupations by Sex
Within the Services occupations in Ridgeway, the most male-oriented occupations are Security & Protection (100.0%), Law Enforcement (100.0%), and Cleaning & Maintenance (100.0%), while the most female-oriented occupations are Healthcare Support (100.0%), Food Preparation & Serving (100.0%), and Personal Care & Service (100.0%).
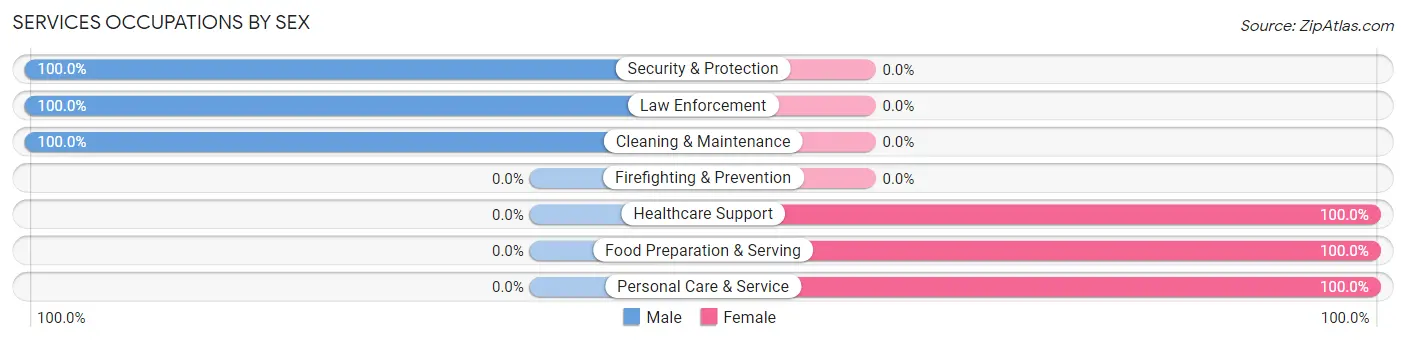
| Occupation | Male | Female |
| Healthcare Support | 0 (0.0%) | 3 (100.0%) |
| Security & Protection | 9 (100.0%) | 0 (0.0%) |
| Firefighting & Prevention | 0 (0.0%) | 0 (0.0%) |
| Law Enforcement | 9 (100.0%) | 0 (0.0%) |
| Food Preparation & Serving | 0 (0.0%) | 16 (100.0%) |
| Cleaning & Maintenance | 3 (100.0%) | 0 (0.0%) |
| Personal Care & Service | 0 (0.0%) | 4 (100.0%) |
| Total (Category) | 12 (34.3%) | 23 (65.7%) |
| Total (Overall) | 56 (43.4%) | 73 (56.6%) |
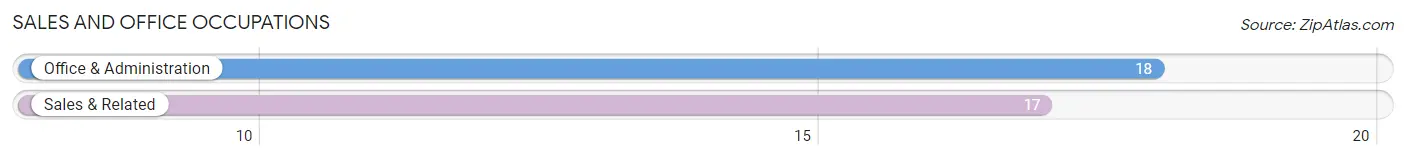
Sales and Office Occupations
The most common Sales and Office occupations in Ridgeway are Office & Administration (18 | 14.0%), and Sales & Related (17 | 13.2%).
Sales and Office Occupations by Sex
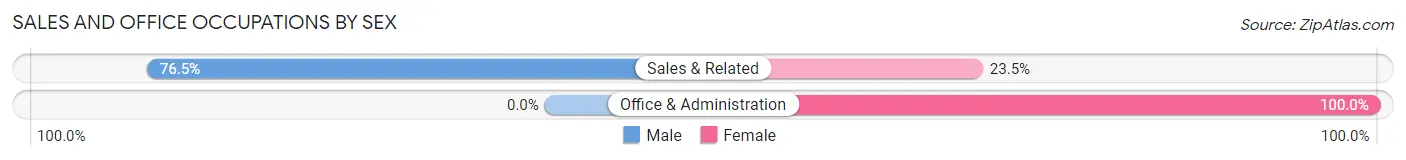
| Occupation | Male | Female |
| Sales & Related | 13 (76.5%) | 4 (23.5%) |
| Office & Administration | 0 (0.0%) | 18 (100.0%) |
| Total (Category) | 13 (37.1%) | 22 (62.9%) |
| Total (Overall) | 56 (43.4%) | 73 (56.6%) |
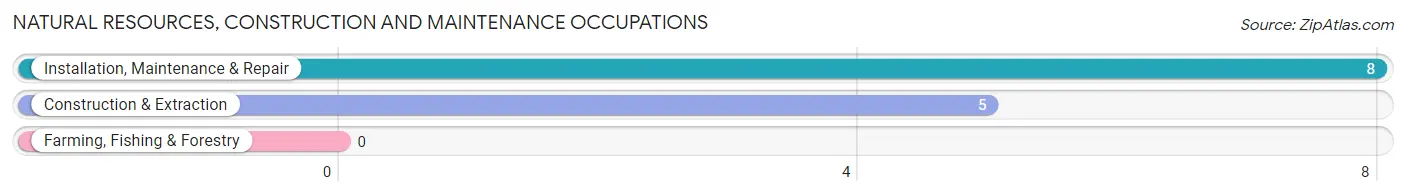
Natural Resources, Construction and Maintenance Occupations
The most common Natural Resources, Construction and Maintenance occupations in Ridgeway are Installation, Maintenance & Repair (8 | 6.2%), and Construction & Extraction (5 | 3.9%).
Natural Resources, Construction and Maintenance Occupations by Sex
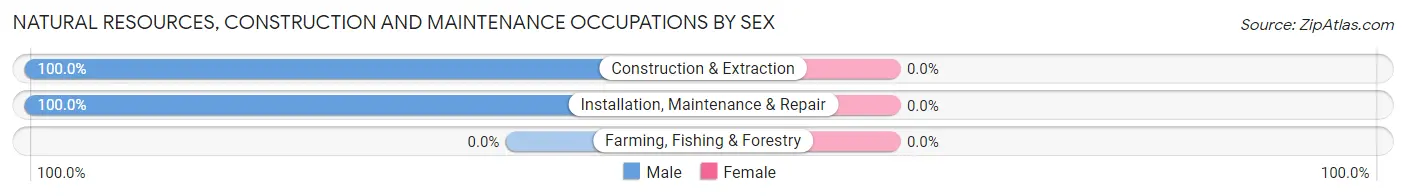
| Occupation | Male | Female |
| Farming, Fishing & Forestry | 0 (0.0%) | 0 (0.0%) |
| Construction & Extraction | 5 (100.0%) | 0 (0.0%) |
| Installation, Maintenance & Repair | 8 (100.0%) | 0 (0.0%) |
| Total (Category) | 13 (100.0%) | 0 (0.0%) |
| Total (Overall) | 56 (43.4%) | 73 (56.6%) |
Production, Transportation and Moving Occupations
The most common Production, Transportation and Moving occupations in Ridgeway are Production (5 | 3.9%), Material Moving (5 | 3.9%), and Transportation (1 | 0.8%).
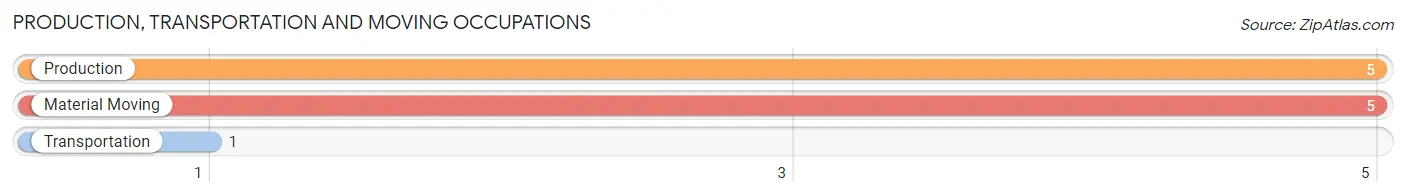
Production, Transportation and Moving Occupations by Sex
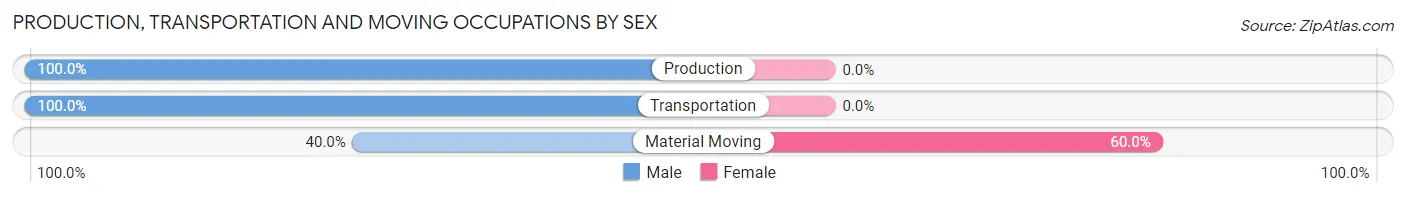
| Occupation | Male | Female |
| Production | 5 (100.0%) | 0 (0.0%) |
| Transportation | 1 (100.0%) | 0 (0.0%) |
| Material Moving | 2 (40.0%) | 3 (60.0%) |
| Total (Category) | 8 (72.7%) | 3 (27.3%) |
| Total (Overall) | 56 (43.4%) | 73 (56.6%) |
Employment Industries by Sex in Ridgeway
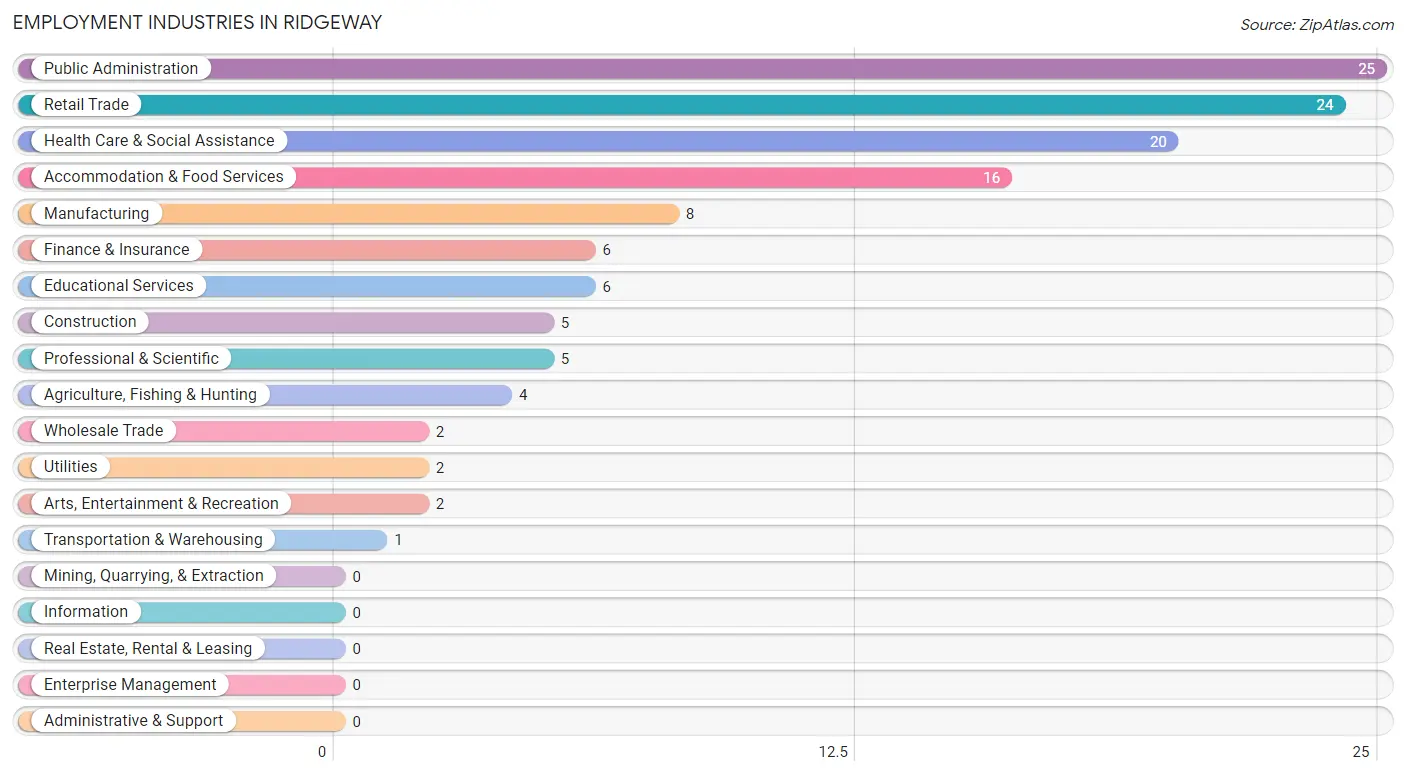
Employment Industries in Ridgeway
The major employment industries in Ridgeway include Public Administration (25 | 19.4%), Retail Trade (24 | 18.6%), Health Care & Social Assistance (20 | 15.5%), Accommodation & Food Services (16 | 12.4%), and Manufacturing (8 | 6.2%).
Employment Industries by Sex in Ridgeway
The Ridgeway industries that see more men than women are Construction (100.0%), Transportation & Warehousing (100.0%), and Utilities (100.0%), whereas the industries that tend to have a higher number of women are Agriculture, Fishing & Hunting (100.0%), Health Care & Social Assistance (100.0%), and Accommodation & Food Services (100.0%).
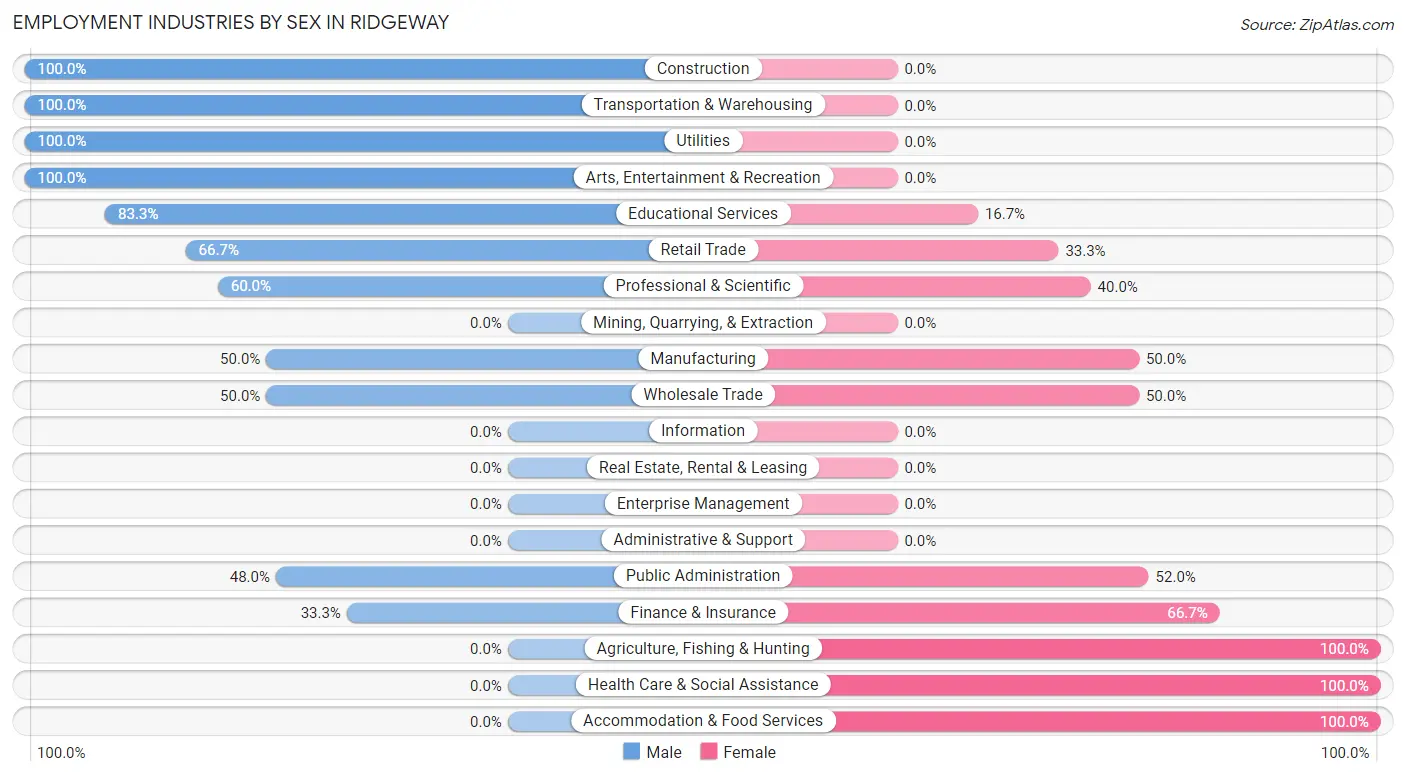
| Industry | Male | Female |
| Agriculture, Fishing & Hunting | 0 (0.0%) | 4 (100.0%) |
| Mining, Quarrying, & Extraction | 0 (0.0%) | 0 (0.0%) |
| Construction | 5 (100.0%) | 0 (0.0%) |
| Manufacturing | 4 (50.0%) | 4 (50.0%) |
| Wholesale Trade | 1 (50.0%) | 1 (50.0%) |
| Retail Trade | 16 (66.7%) | 8 (33.3%) |
| Transportation & Warehousing | 1 (100.0%) | 0 (0.0%) |
| Utilities | 2 (100.0%) | 0 (0.0%) |
| Information | 0 (0.0%) | 0 (0.0%) |
| Finance & Insurance | 2 (33.3%) | 4 (66.7%) |
| Real Estate, Rental & Leasing | 0 (0.0%) | 0 (0.0%) |
| Professional & Scientific | 3 (60.0%) | 2 (40.0%) |
| Enterprise Management | 0 (0.0%) | 0 (0.0%) |
| Administrative & Support | 0 (0.0%) | 0 (0.0%) |
| Educational Services | 5 (83.3%) | 1 (16.7%) |
| Health Care & Social Assistance | 0 (0.0%) | 20 (100.0%) |
| Arts, Entertainment & Recreation | 2 (100.0%) | 0 (0.0%) |
| Accommodation & Food Services | 0 (0.0%) | 16 (100.0%) |
| Public Administration | 12 (48.0%) | 13 (52.0%) |
| Total | 56 (43.4%) | 73 (56.6%) |
Education in Ridgeway
School Enrollment in Ridgeway
The most common levels of schooling among the 25 students in Ridgeway are elementary school (9 | 36.0%), high school (8 | 32.0%), and kindergarten (3 | 12.0%).
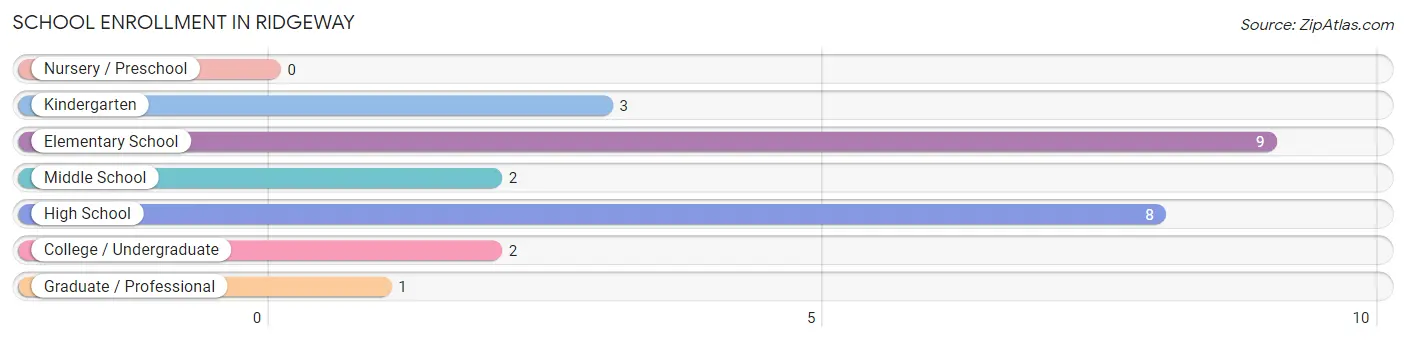
| School Level | # Students | % Students |
| Nursery / Preschool | 0 | 0.0% |
| Kindergarten | 3 | 12.0% |
| Elementary School | 9 | 36.0% |
| Middle School | 2 | 8.0% |
| High School | 8 | 32.0% |
| College / Undergraduate | 2 | 8.0% |
| Graduate / Professional | 1 | 4.0% |
| Total | 25 | 100.0% |
School Enrollment by Age by Funding Source in Ridgeway
Out of a total of 25 students who are enrolled in schools in Ridgeway, 9 (36.0%) attend a private institution, while the remaining 16 (64.0%) are enrolled in public schools. The age group of 15 to 17 year olds has the highest likelihood of being enrolled in private schools, with 3 (60.0% in the age bracket) enrolled. Conversely, the age group of 20 to 24 year olds has the lowest likelihood of being enrolled in a private school, with 1 (100.0% in the age bracket) attending a public institution.
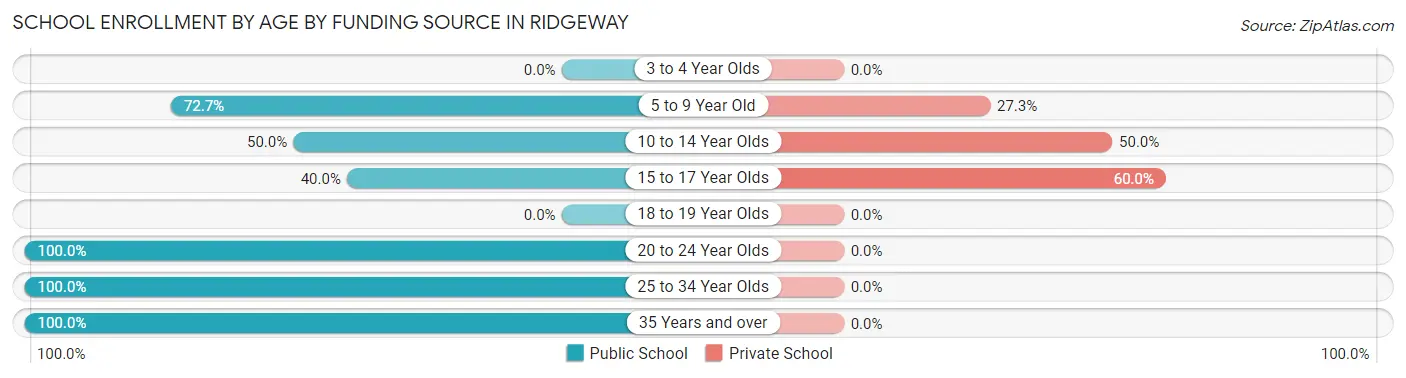
| Age Bracket | Public School | Private School |
| 3 to 4 Year Olds | 0 (0.0%) | 0 (0.0%) |
| 5 to 9 Year Old | 8 (72.7%) | 3 (27.3%) |
| 10 to 14 Year Olds | 3 (50.0%) | 3 (50.0%) |
| 15 to 17 Year Olds | 2 (40.0%) | 3 (60.0%) |
| 18 to 19 Year Olds | 0 (0.0%) | 0 (0.0%) |
| 20 to 24 Year Olds | 1 (100.0%) | 0 (0.0%) |
| 25 to 34 Year Olds | 1 (100.0%) | 0 (0.0%) |
| 35 Years and over | 1 (100.0%) | 0 (0.0%) |
| Total | 16 (64.0%) | 9 (36.0%) |
Educational Attainment by Field of Study in Ridgeway
Liberal arts & history (14 | 23.3%), science & technology (10 | 16.7%), business (10 | 16.7%), social sciences (6 | 10.0%), and arts & humanities (6 | 10.0%) are the most common fields of study among 60 individuals in Ridgeway who have obtained a bachelor's degree or higher.
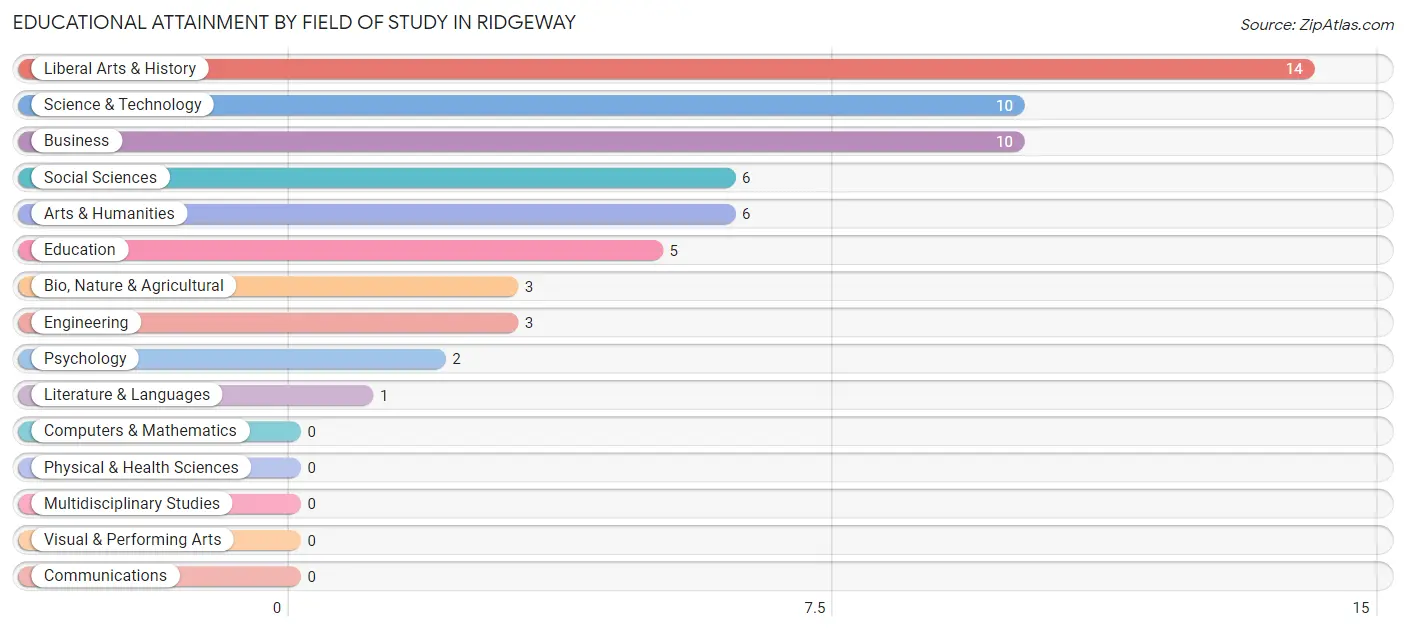
| Field of Study | # Graduates | % Graduates |
| Computers & Mathematics | 0 | 0.0% |
| Bio, Nature & Agricultural | 3 | 5.0% |
| Physical & Health Sciences | 0 | 0.0% |
| Psychology | 2 | 3.3% |
| Social Sciences | 6 | 10.0% |
| Engineering | 3 | 5.0% |
| Multidisciplinary Studies | 0 | 0.0% |
| Science & Technology | 10 | 16.7% |
| Business | 10 | 16.7% |
| Education | 5 | 8.3% |
| Literature & Languages | 1 | 1.7% |
| Liberal Arts & History | 14 | 23.3% |
| Visual & Performing Arts | 0 | 0.0% |
| Communications | 0 | 0.0% |
| Arts & Humanities | 6 | 10.0% |
| Total | 60 | 100.0% |
Transportation & Commute in Ridgeway
Vehicle Availability by Sex in Ridgeway
The most prevalent vehicle ownership categories in Ridgeway are males with 2 vehicles (24, accounting for 42.9%) and females with 2 vehicles (30, making up 32.9%).
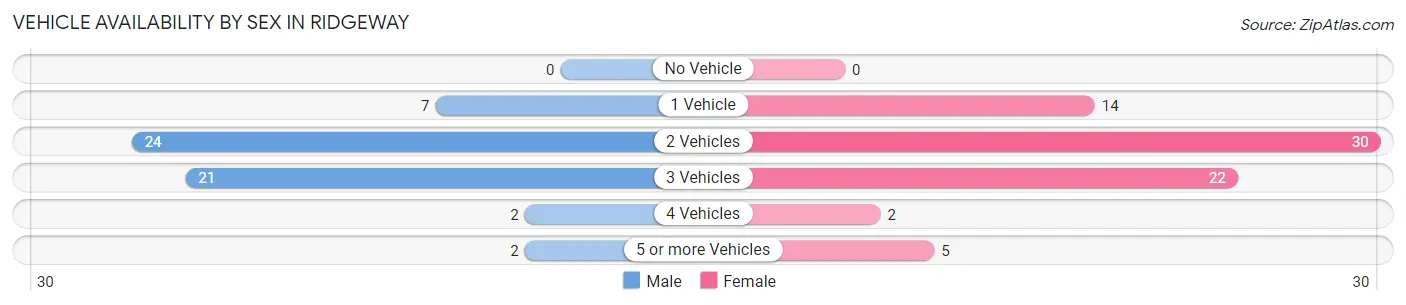
| Vehicles Available | Male | Female |
| No Vehicle | 0 (0.0%) | 0 (0.0%) |
| 1 Vehicle | 7 (12.5%) | 14 (19.2%) |
| 2 Vehicles | 24 (42.9%) | 30 (41.1%) |
| 3 Vehicles | 21 (37.5%) | 22 (30.1%) |
| 4 Vehicles | 2 (3.6%) | 2 (2.7%) |
| 5 or more Vehicles | 2 (3.6%) | 5 (6.9%) |
| Total | 56 (100.0%) | 73 (100.0%) |
Commute Time in Ridgeway
The most frequently occuring commute durations in Ridgeway are 25 to 29 minutes (42 commuters, 34.7%), 30 to 34 minutes (24 commuters, 19.8%), and 35 to 39 minutes (13 commuters, 10.7%).
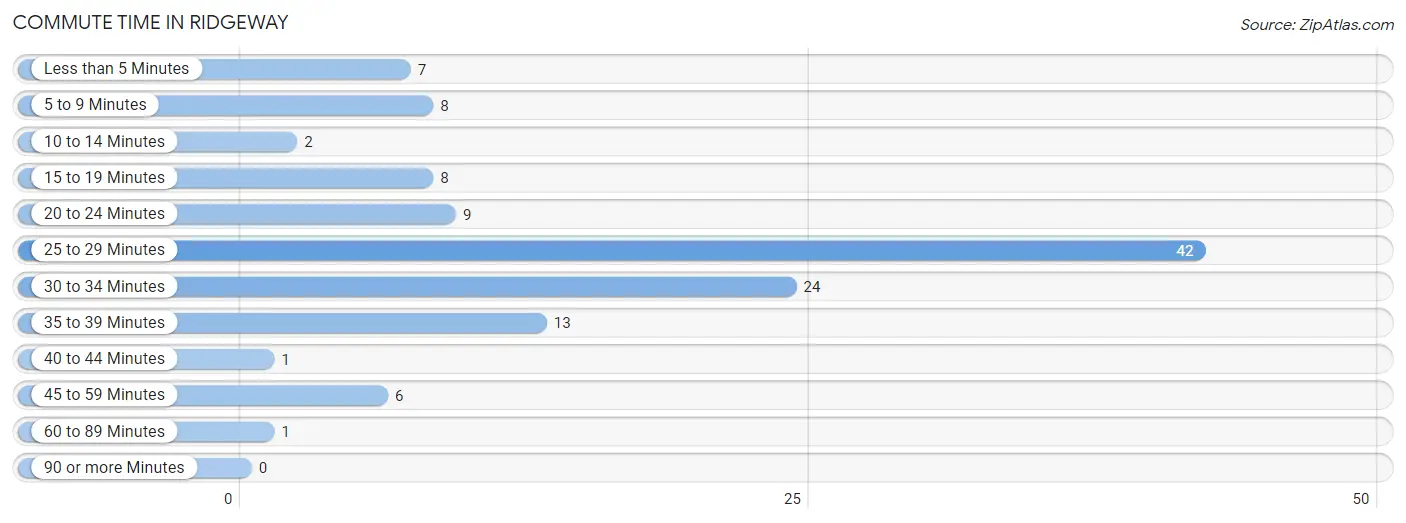
| Commute Time | # Commuters | % Commuters |
| Less than 5 Minutes | 7 | 5.8% |
| 5 to 9 Minutes | 8 | 6.6% |
| 10 to 14 Minutes | 2 | 1.7% |
| 15 to 19 Minutes | 8 | 6.6% |
| 20 to 24 Minutes | 9 | 7.4% |
| 25 to 29 Minutes | 42 | 34.7% |
| 30 to 34 Minutes | 24 | 19.8% |
| 35 to 39 Minutes | 13 | 10.7% |
| 40 to 44 Minutes | 1 | 0.8% |
| 45 to 59 Minutes | 6 | 5.0% |
| 60 to 89 Minutes | 1 | 0.8% |
| 90 or more Minutes | 0 | 0.0% |
Commute Time by Sex in Ridgeway
The most common commute times in Ridgeway are 25 to 29 minutes (18 commuters, 32.7%) for males and 25 to 29 minutes (24 commuters, 36.4%) for females.
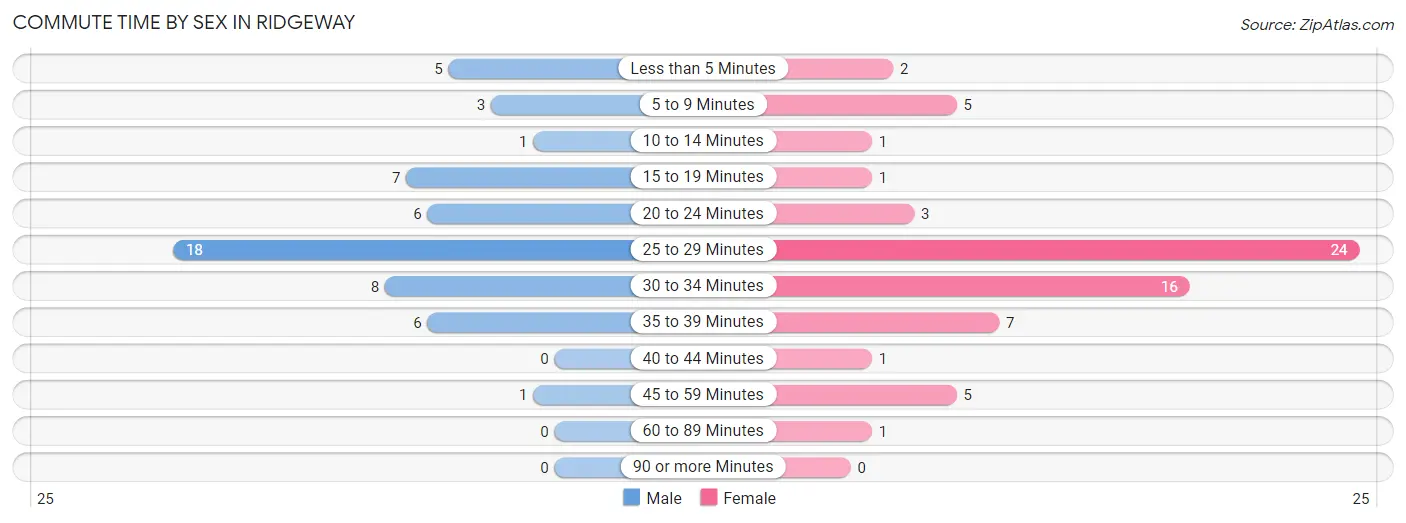
| Commute Time | Male | Female |
| Less than 5 Minutes | 5 (9.1%) | 2 (3.0%) |
| 5 to 9 Minutes | 3 (5.4%) | 5 (7.6%) |
| 10 to 14 Minutes | 1 (1.8%) | 1 (1.5%) |
| 15 to 19 Minutes | 7 (12.7%) | 1 (1.5%) |
| 20 to 24 Minutes | 6 (10.9%) | 3 (4.5%) |
| 25 to 29 Minutes | 18 (32.7%) | 24 (36.4%) |
| 30 to 34 Minutes | 8 (14.5%) | 16 (24.2%) |
| 35 to 39 Minutes | 6 (10.9%) | 7 (10.6%) |
| 40 to 44 Minutes | 0 (0.0%) | 1 (1.5%) |
| 45 to 59 Minutes | 1 (1.8%) | 5 (7.6%) |
| 60 to 89 Minutes | 0 (0.0%) | 1 (1.5%) |
| 90 or more Minutes | 0 (0.0%) | 0 (0.0%) |
Time of Departure to Work by Sex in Ridgeway
The most frequent times of departure to work in Ridgeway are 6:30 AM to 6:59 AM (12, 21.8%) for males and 7:00 AM to 7:29 AM (26, 39.4%) for females.
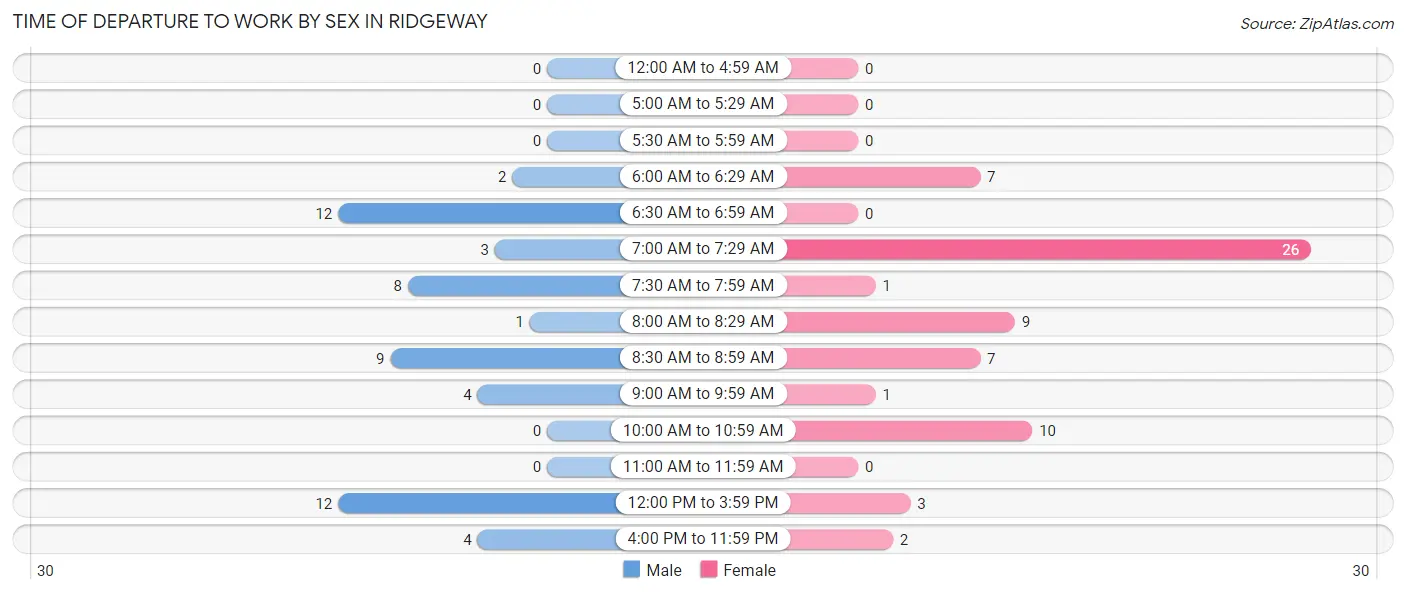
| Time of Departure | Male | Female |
| 12:00 AM to 4:59 AM | 0 (0.0%) | 0 (0.0%) |
| 5:00 AM to 5:29 AM | 0 (0.0%) | 0 (0.0%) |
| 5:30 AM to 5:59 AM | 0 (0.0%) | 0 (0.0%) |
| 6:00 AM to 6:29 AM | 2 (3.6%) | 7 (10.6%) |
| 6:30 AM to 6:59 AM | 12 (21.8%) | 0 (0.0%) |
| 7:00 AM to 7:29 AM | 3 (5.4%) | 26 (39.4%) |
| 7:30 AM to 7:59 AM | 8 (14.5%) | 1 (1.5%) |
| 8:00 AM to 8:29 AM | 1 (1.8%) | 9 (13.6%) |
| 8:30 AM to 8:59 AM | 9 (16.4%) | 7 (10.6%) |
| 9:00 AM to 9:59 AM | 4 (7.3%) | 1 (1.5%) |
| 10:00 AM to 10:59 AM | 0 (0.0%) | 10 (15.1%) |
| 11:00 AM to 11:59 AM | 0 (0.0%) | 0 (0.0%) |
| 12:00 PM to 3:59 PM | 12 (21.8%) | 3 (4.5%) |
| 4:00 PM to 11:59 PM | 4 (7.3%) | 2 (3.0%) |
| Total | 55 (100.0%) | 66 (100.0%) |
Housing Occupancy in Ridgeway
Occupancy by Ownership in Ridgeway
Of the total 128 dwellings in Ridgeway, owner-occupied units account for 87 (68.0%), while renter-occupied units make up 41 (32.0%).
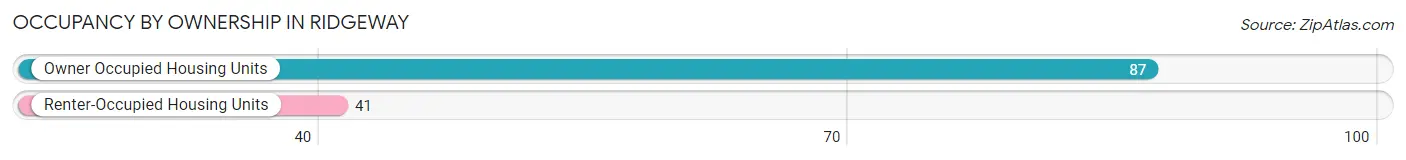
| Occupancy | # Housing Units | % Housing Units |
| Owner Occupied Housing Units | 87 | 68.0% |
| Renter-Occupied Housing Units | 41 | 32.0% |
| Total Occupied Housing Units | 128 | 100.0% |
Occupancy by Household Size in Ridgeway
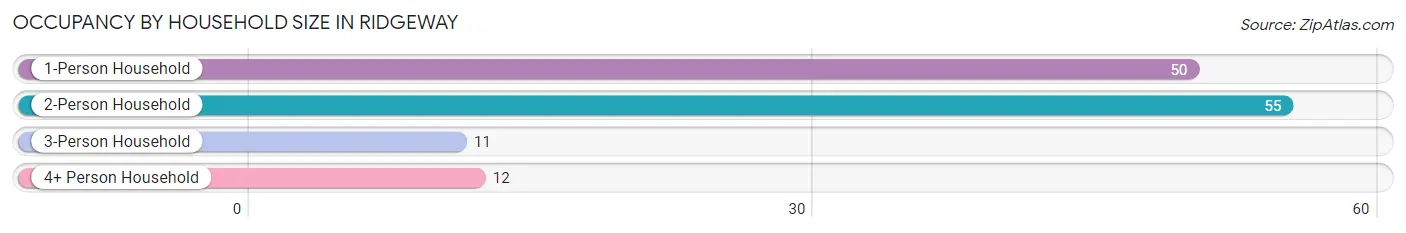
| Household Size | # Housing Units | % Housing Units |
| 1-Person Household | 50 | 39.1% |
| 2-Person Household | 55 | 43.0% |
| 3-Person Household | 11 | 8.6% |
| 4+ Person Household | 12 | 9.4% |
| Total Housing Units | 128 | 100.0% |
Occupancy by Ownership by Household Size in Ridgeway
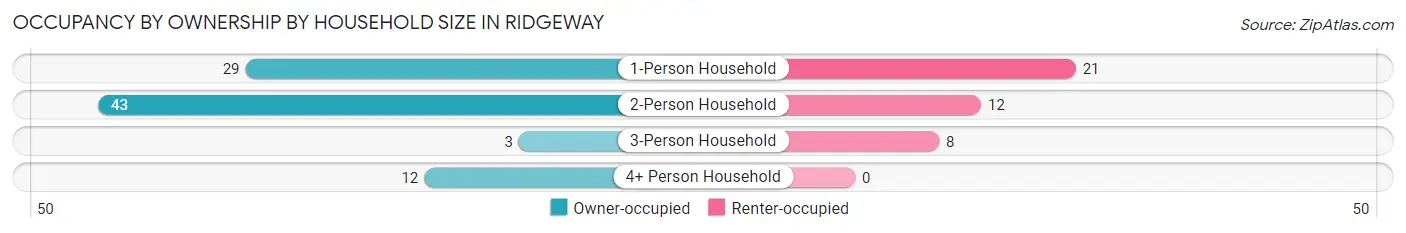
| Household Size | Owner-occupied | Renter-occupied |
| 1-Person Household | 29 (58.0%) | 21 (42.0%) |
| 2-Person Household | 43 (78.2%) | 12 (21.8%) |
| 3-Person Household | 3 (27.3%) | 8 (72.7%) |
| 4+ Person Household | 12 (100.0%) | 0 (0.0%) |
| Total Housing Units | 87 (68.0%) | 41 (32.0%) |
Occupancy by Educational Attainment in Ridgeway
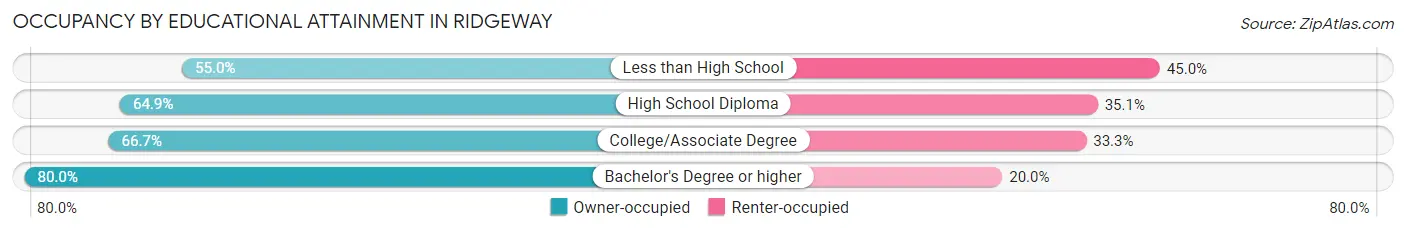
| Household Size | Owner-occupied | Renter-occupied |
| Less than High School | 11 (55.0%) | 9 (45.0%) |
| High School Diploma | 24 (64.9%) | 13 (35.1%) |
| College/Associate Degree | 24 (66.7%) | 12 (33.3%) |
| Bachelor's Degree or higher | 28 (80.0%) | 7 (20.0%) |
Occupancy by Age of Householder in Ridgeway
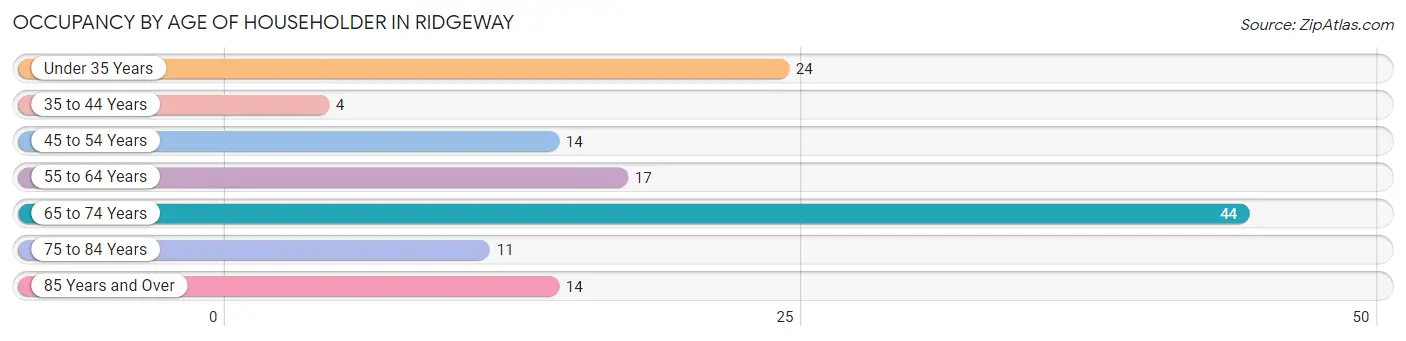
| Age Bracket | # Households | % Households |
| Under 35 Years | 24 | 18.8% |
| 35 to 44 Years | 4 | 3.1% |
| 45 to 54 Years | 14 | 10.9% |
| 55 to 64 Years | 17 | 13.3% |
| 65 to 74 Years | 44 | 34.4% |
| 75 to 84 Years | 11 | 8.6% |
| 85 Years and Over | 14 | 10.9% |
| Total | 128 | 100.0% |
Housing Finances in Ridgeway
Median Income by Occupancy in Ridgeway
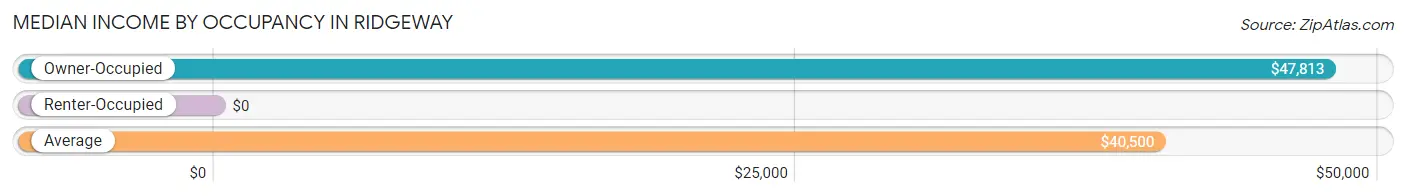
| Occupancy Type | # Households | Median Income |
| Owner-Occupied | 87 (68.0%) | $47,813 |
| Renter-Occupied | 41 (32.0%) | $0 |
| Average | 128 (100.0%) | $40,500 |
Occupancy by Householder Income Bracket in Ridgeway
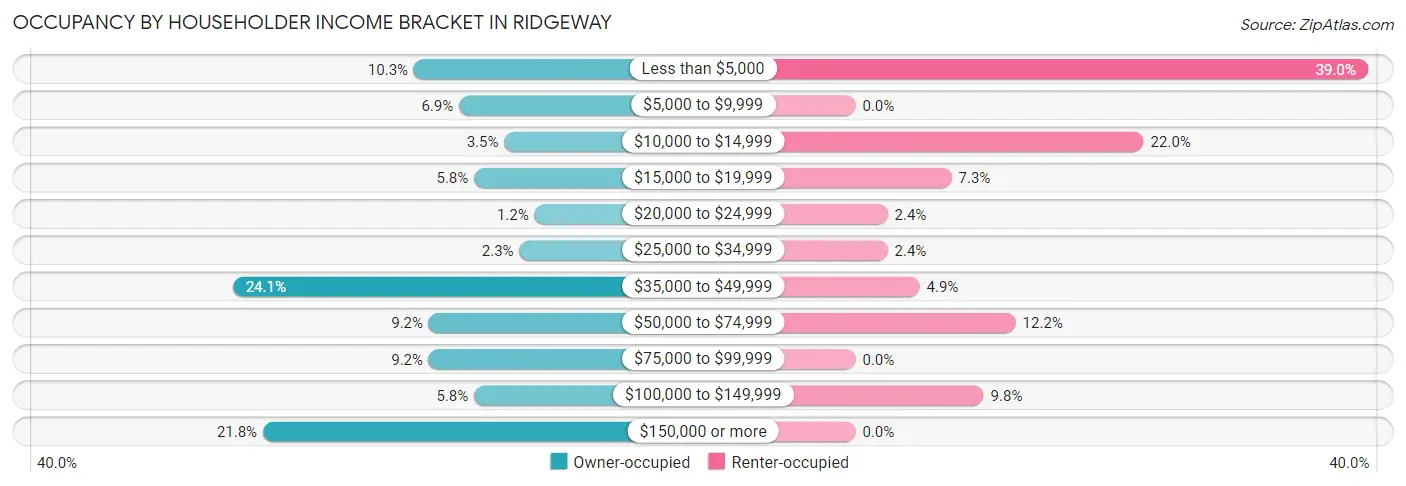
| Income Bracket | Owner-occupied | Renter-occupied |
| Less than $5,000 | 9 (10.3%) | 16 (39.0%) |
| $5,000 to $9,999 | 6 (6.9%) | 0 (0.0%) |
| $10,000 to $14,999 | 3 (3.5%) | 9 (22.0%) |
| $15,000 to $19,999 | 5 (5.8%) | 3 (7.3%) |
| $20,000 to $24,999 | 1 (1.1%) | 1 (2.4%) |
| $25,000 to $34,999 | 2 (2.3%) | 1 (2.4%) |
| $35,000 to $49,999 | 21 (24.1%) | 2 (4.9%) |
| $50,000 to $74,999 | 8 (9.2%) | 5 (12.2%) |
| $75,000 to $99,999 | 8 (9.2%) | 0 (0.0%) |
| $100,000 to $149,999 | 5 (5.8%) | 4 (9.8%) |
| $150,000 or more | 19 (21.8%) | 0 (0.0%) |
| Total | 87 (100.0%) | 41 (100.0%) |
Monthly Housing Cost Tiers in Ridgeway
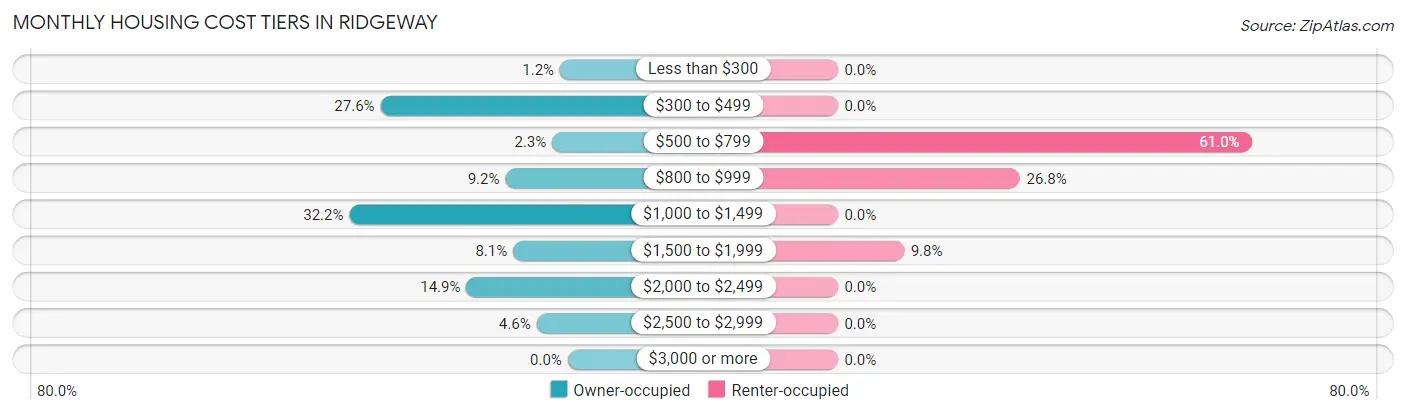
| Monthly Cost | Owner-occupied | Renter-occupied |
| Less than $300 | 1 (1.1%) | 0 (0.0%) |
| $300 to $499 | 24 (27.6%) | 0 (0.0%) |
| $500 to $799 | 2 (2.3%) | 25 (61.0%) |
| $800 to $999 | 8 (9.2%) | 11 (26.8%) |
| $1,000 to $1,499 | 28 (32.2%) | 0 (0.0%) |
| $1,500 to $1,999 | 7 (8.1%) | 4 (9.8%) |
| $2,000 to $2,499 | 13 (14.9%) | 0 (0.0%) |
| $2,500 to $2,999 | 4 (4.6%) | 0 (0.0%) |
| $3,000 or more | 0 (0.0%) | 0 (0.0%) |
| Total | 87 (100.0%) | 41 (100.0%) |
Physical Housing Characteristics in Ridgeway
Housing Structures in Ridgeway
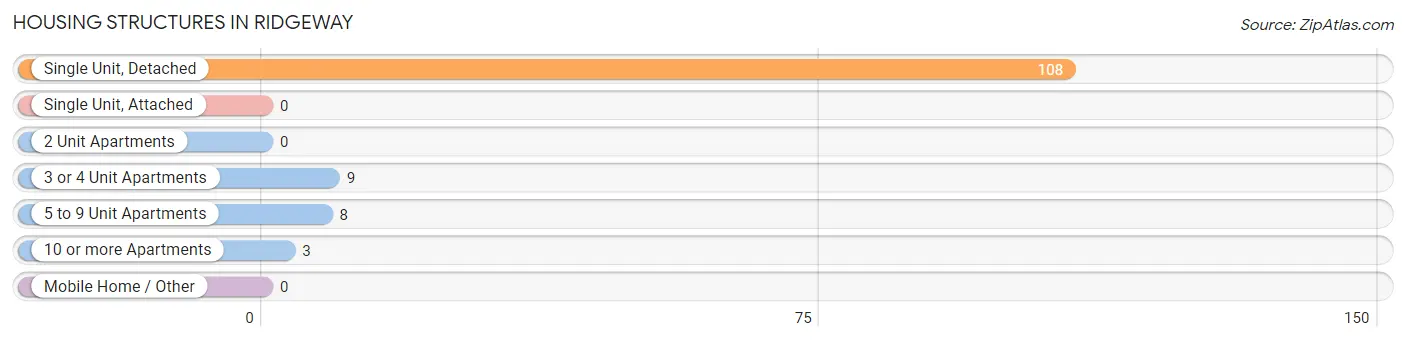
| Structure Type | # Housing Units | % Housing Units |
| Single Unit, Detached | 108 | 84.4% |
| Single Unit, Attached | 0 | 0.0% |
| 2 Unit Apartments | 0 | 0.0% |
| 3 or 4 Unit Apartments | 9 | 7.0% |
| 5 to 9 Unit Apartments | 8 | 6.2% |
| 10 or more Apartments | 3 | 2.3% |
| Mobile Home / Other | 0 | 0.0% |
| Total | 128 | 100.0% |
Housing Structures by Occupancy in Ridgeway
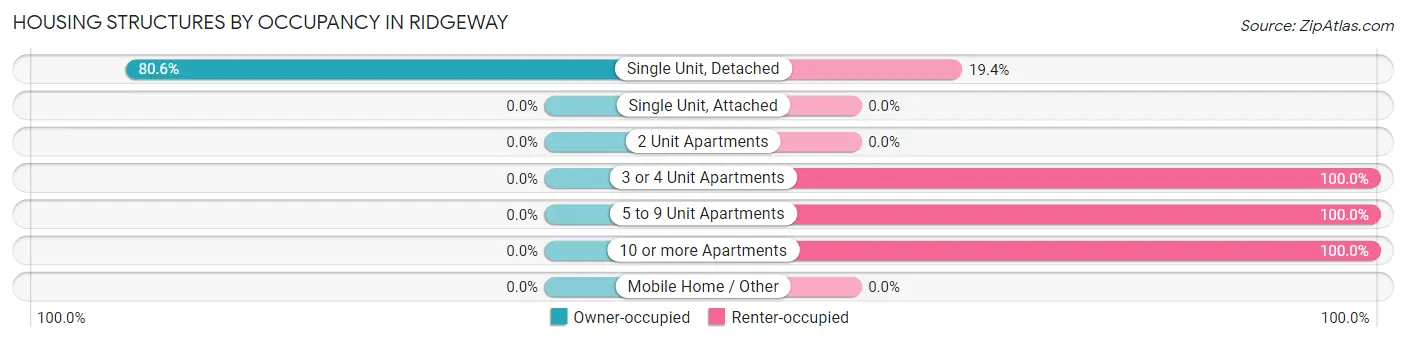
| Structure Type | Owner-occupied | Renter-occupied |
| Single Unit, Detached | 87 (80.6%) | 21 (19.4%) |
| Single Unit, Attached | 0 (0.0%) | 0 (0.0%) |
| 2 Unit Apartments | 0 (0.0%) | 0 (0.0%) |
| 3 or 4 Unit Apartments | 0 (0.0%) | 9 (100.0%) |
| 5 to 9 Unit Apartments | 0 (0.0%) | 8 (100.0%) |
| 10 or more Apartments | 0 (0.0%) | 3 (100.0%) |
| Mobile Home / Other | 0 (0.0%) | 0 (0.0%) |
| Total | 87 (68.0%) | 41 (32.0%) |
Housing Structures by Number of Rooms in Ridgeway
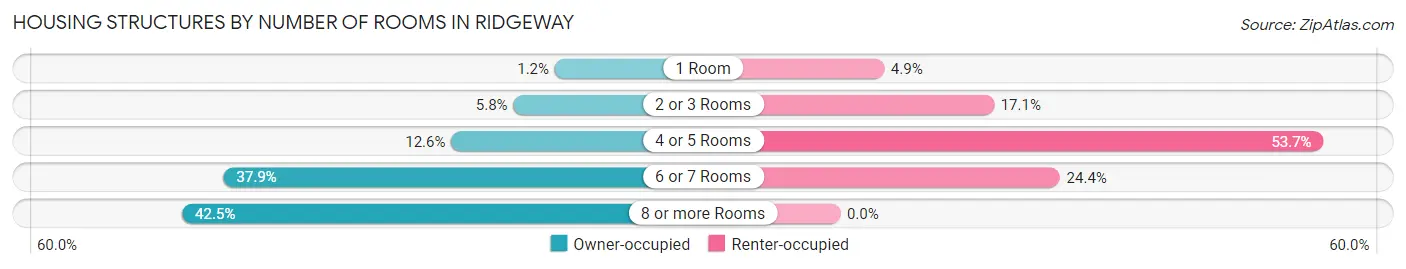
| Number of Rooms | Owner-occupied | Renter-occupied |
| 1 Room | 1 (1.1%) | 2 (4.9%) |
| 2 or 3 Rooms | 5 (5.8%) | 7 (17.1%) |
| 4 or 5 Rooms | 11 (12.6%) | 22 (53.7%) |
| 6 or 7 Rooms | 33 (37.9%) | 10 (24.4%) |
| 8 or more Rooms | 37 (42.5%) | 0 (0.0%) |
| Total | 87 (100.0%) | 41 (100.0%) |
Housing Structure by Heating Type in Ridgeway
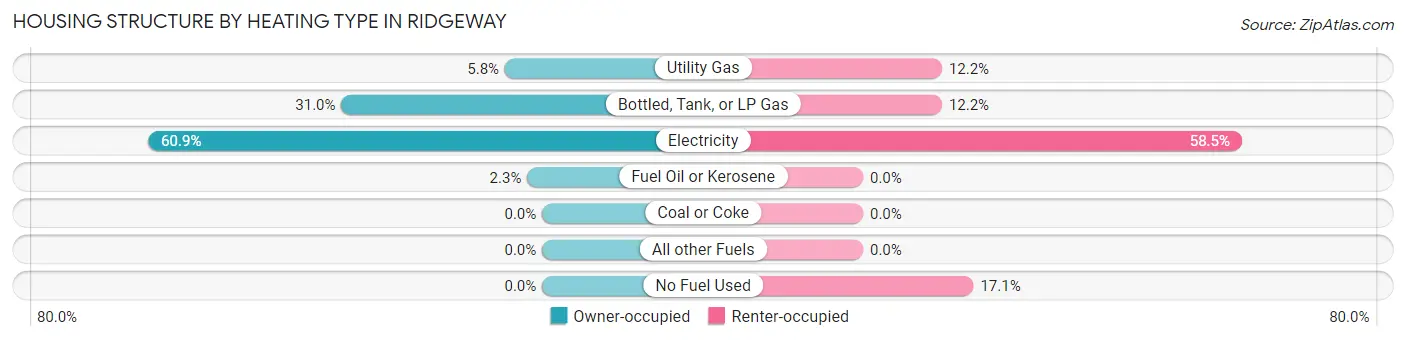
| Heating Type | Owner-occupied | Renter-occupied |
| Utility Gas | 5 (5.8%) | 5 (12.2%) |
| Bottled, Tank, or LP Gas | 27 (31.0%) | 5 (12.2%) |
| Electricity | 53 (60.9%) | 24 (58.5%) |
| Fuel Oil or Kerosene | 2 (2.3%) | 0 (0.0%) |
| Coal or Coke | 0 (0.0%) | 0 (0.0%) |
| All other Fuels | 0 (0.0%) | 0 (0.0%) |
| No Fuel Used | 0 (0.0%) | 7 (17.1%) |
| Total | 87 (100.0%) | 41 (100.0%) |
Household Vehicle Usage in Ridgeway
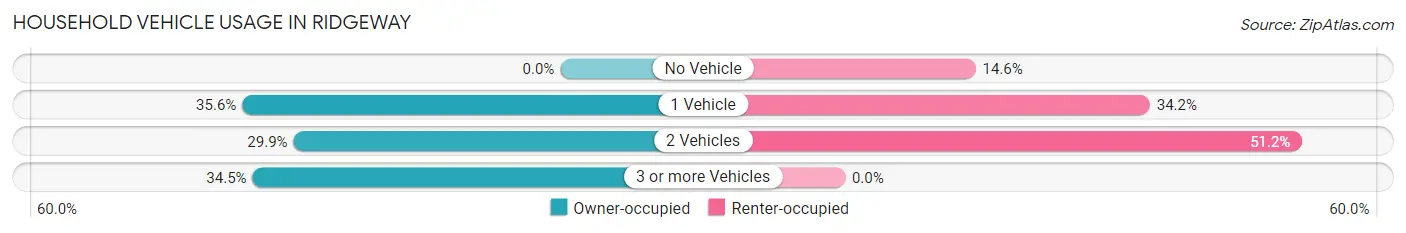
| Vehicles per Household | Owner-occupied | Renter-occupied |
| No Vehicle | 0 (0.0%) | 6 (14.6%) |
| 1 Vehicle | 31 (35.6%) | 14 (34.2%) |
| 2 Vehicles | 26 (29.9%) | 21 (51.2%) |
| 3 or more Vehicles | 30 (34.5%) | 0 (0.0%) |
| Total | 87 (100.0%) | 41 (100.0%) |
Real Estate & Mortgages in Ridgeway
Real Estate and Mortgage Overview in Ridgeway
| Characteristic | Without Mortgage | With Mortgage |
| Housing Units | 28 | 59 |
| Median Property Value | $179,200 | $154,200 |
| Median Household Income | $35,000 | $15 |
| Monthly Housing Costs | $427 | $0 |
| Real Estate Taxes | $533 | $0 |
Property Value by Mortgage Status in Ridgeway
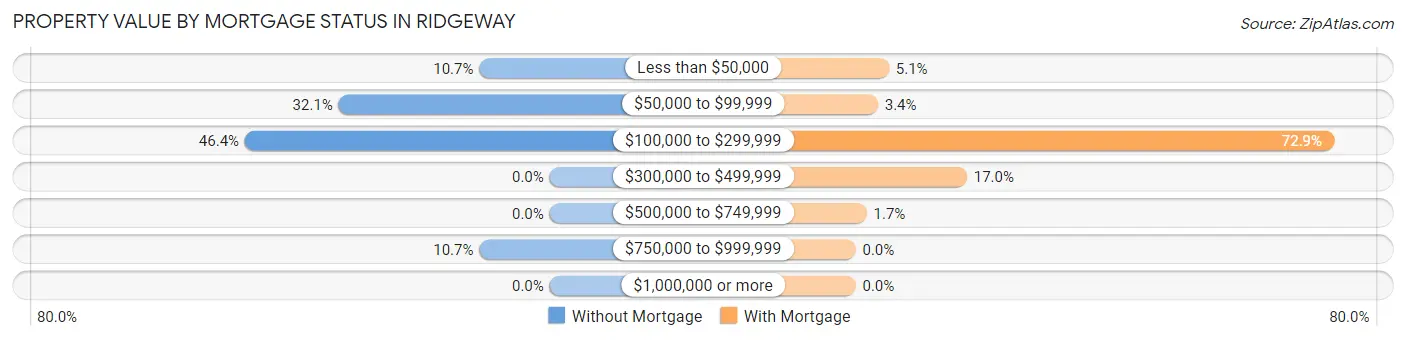
| Property Value | Without Mortgage | With Mortgage |
| Less than $50,000 | 3 (10.7%) | 3 (5.1%) |
| $50,000 to $99,999 | 9 (32.1%) | 2 (3.4%) |
| $100,000 to $299,999 | 13 (46.4%) | 43 (72.9%) |
| $300,000 to $499,999 | 0 (0.0%) | 10 (17.0%) |
| $500,000 to $749,999 | 0 (0.0%) | 1 (1.7%) |
| $750,000 to $999,999 | 3 (10.7%) | 0 (0.0%) |
| $1,000,000 or more | 0 (0.0%) | 0 (0.0%) |
| Total | 28 (100.0%) | 59 (100.0%) |
Household Income by Mortgage Status in Ridgeway
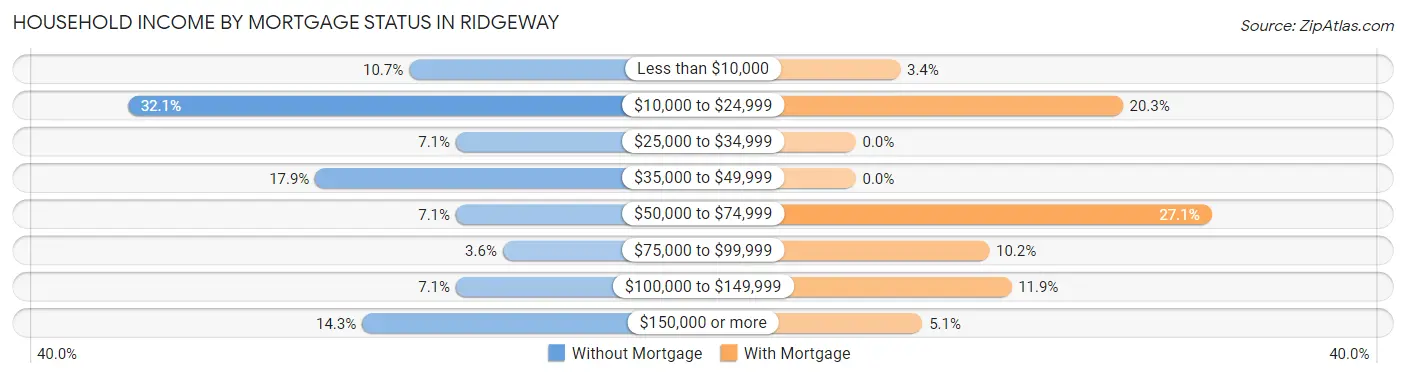
| Household Income | Without Mortgage | With Mortgage |
| Less than $10,000 | 3 (10.7%) | 2 (3.4%) |
| $10,000 to $24,999 | 9 (32.1%) | 12 (20.3%) |
| $25,000 to $34,999 | 2 (7.1%) | 0 (0.0%) |
| $35,000 to $49,999 | 5 (17.9%) | 0 (0.0%) |
| $50,000 to $74,999 | 2 (7.1%) | 16 (27.1%) |
| $75,000 to $99,999 | 1 (3.6%) | 6 (10.2%) |
| $100,000 to $149,999 | 2 (7.1%) | 7 (11.9%) |
| $150,000 or more | 4 (14.3%) | 3 (5.1%) |
| Total | 28 (100.0%) | 59 (100.0%) |
Property Value to Household Income Ratio in Ridgeway
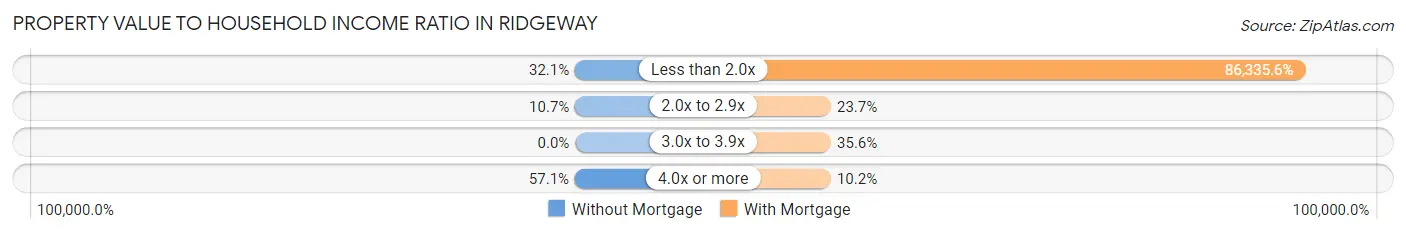
| Value-to-Income Ratio | Without Mortgage | With Mortgage |
| Less than 2.0x | 9 (32.1%) | 50,938 (86,335.6%) |
| 2.0x to 2.9x | 3 (10.7%) | 14 (23.7%) |
| 3.0x to 3.9x | 0 (0.0%) | 21 (35.6%) |
| 4.0x or more | 16 (57.1%) | 6 (10.2%) |
| Total | 28 (100.0%) | 59 (100.0%) |
Real Estate Taxes by Mortgage Status in Ridgeway
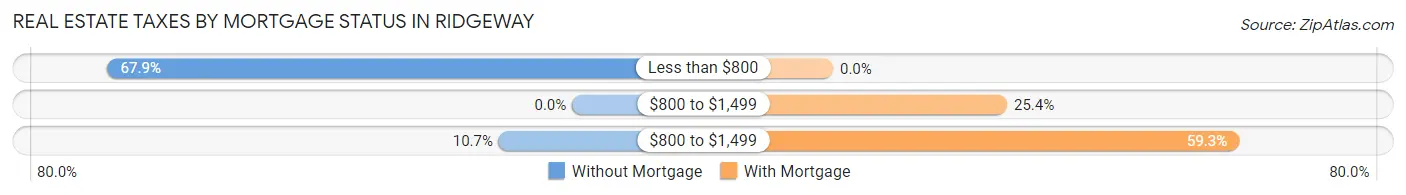
| Property Taxes | Without Mortgage | With Mortgage |
| Less than $800 | 19 (67.9%) | 0 (0.0%) |
| $800 to $1,499 | 0 (0.0%) | 15 (25.4%) |
| $800 to $1,499 | 3 (10.7%) | 35 (59.3%) |
| Total | 28 (100.0%) | 59 (100.0%) |
Health & Disability in Ridgeway
Health Insurance Coverage by Age in Ridgeway
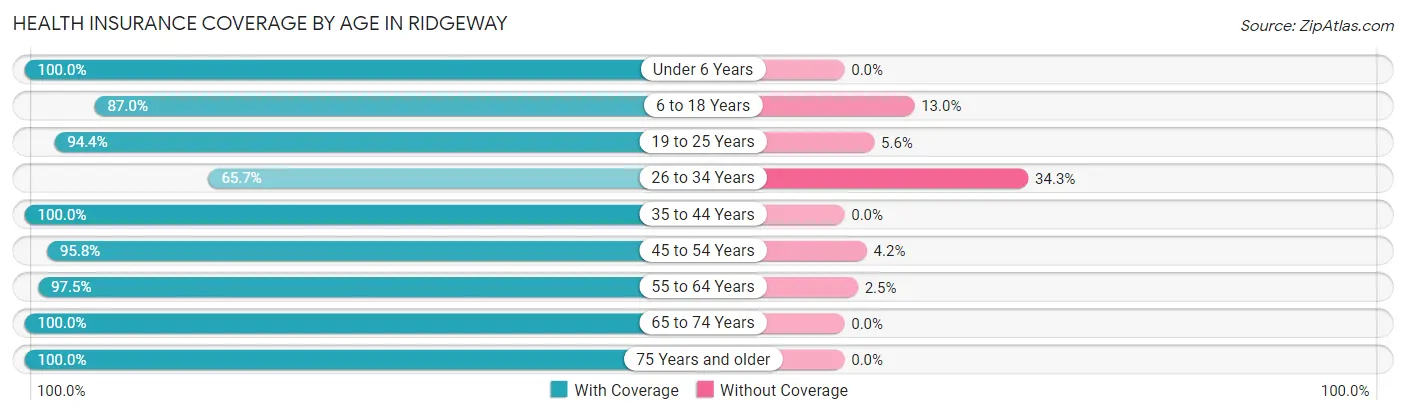
| Age Bracket | With Coverage | Without Coverage |
| Under 6 Years | 17 (100.0%) | 0 (0.0%) |
| 6 to 18 Years | 20 (87.0%) | 3 (13.0%) |
| 19 to 25 Years | 17 (94.4%) | 1 (5.6%) |
| 26 to 34 Years | 23 (65.7%) | 12 (34.3%) |
| 35 to 44 Years | 5 (100.0%) | 0 (0.0%) |
| 45 to 54 Years | 23 (95.8%) | 1 (4.2%) |
| 55 to 64 Years | 39 (97.5%) | 1 (2.5%) |
| 65 to 74 Years | 63 (100.0%) | 0 (0.0%) |
| 75 Years and older | 26 (100.0%) | 0 (0.0%) |
| Total | 233 (92.8%) | 18 (7.2%) |
Health Insurance Coverage by Citizenship Status in Ridgeway
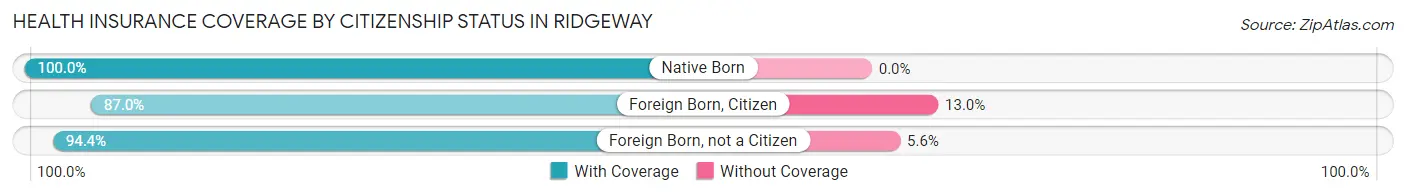
| Citizenship Status | With Coverage | Without Coverage |
| Native Born | 17 (100.0%) | 0 (0.0%) |
| Foreign Born, Citizen | 20 (87.0%) | 3 (13.0%) |
| Foreign Born, not a Citizen | 17 (94.4%) | 1 (5.6%) |
Health Insurance Coverage by Household Income in Ridgeway
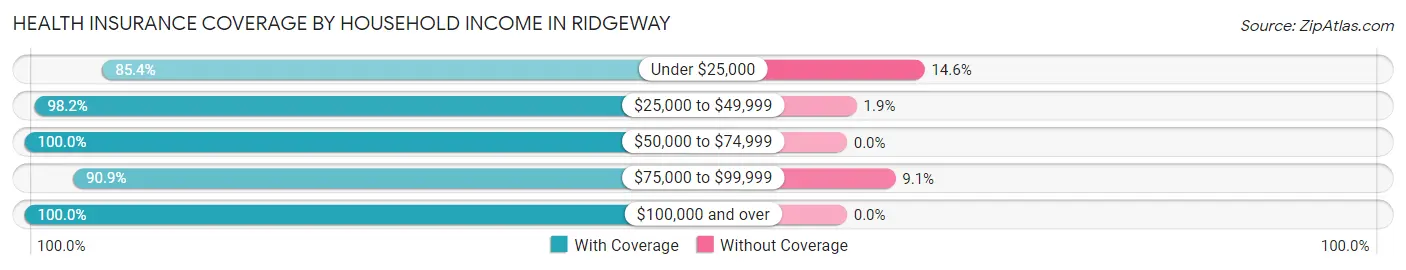
| Household Income | With Coverage | Without Coverage |
| Under $25,000 | 88 (85.4%) | 15 (14.6%) |
| $25,000 to $49,999 | 53 (98.2%) | 1 (1.8%) |
| $50,000 to $74,999 | 18 (100.0%) | 0 (0.0%) |
| $75,000 to $99,999 | 20 (90.9%) | 2 (9.1%) |
| $100,000 and over | 54 (100.0%) | 0 (0.0%) |
Public vs Private Health Insurance Coverage by Age in Ridgeway
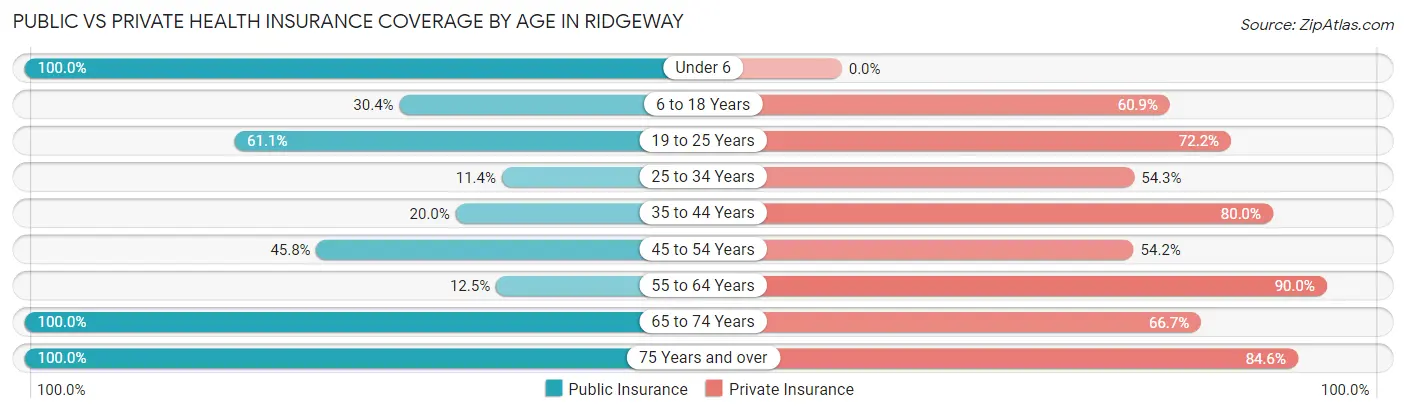
| Age Bracket | Public Insurance | Private Insurance |
| Under 6 | 17 (100.0%) | 0 (0.0%) |
| 6 to 18 Years | 7 (30.4%) | 14 (60.9%) |
| 19 to 25 Years | 11 (61.1%) | 13 (72.2%) |
| 25 to 34 Years | 4 (11.4%) | 19 (54.3%) |
| 35 to 44 Years | 1 (20.0%) | 4 (80.0%) |
| 45 to 54 Years | 11 (45.8%) | 13 (54.2%) |
| 55 to 64 Years | 5 (12.5%) | 36 (90.0%) |
| 65 to 74 Years | 63 (100.0%) | 42 (66.7%) |
| 75 Years and over | 26 (100.0%) | 22 (84.6%) |
| Total | 145 (57.8%) | 163 (64.9%) |
Disability Status by Sex by Age in Ridgeway
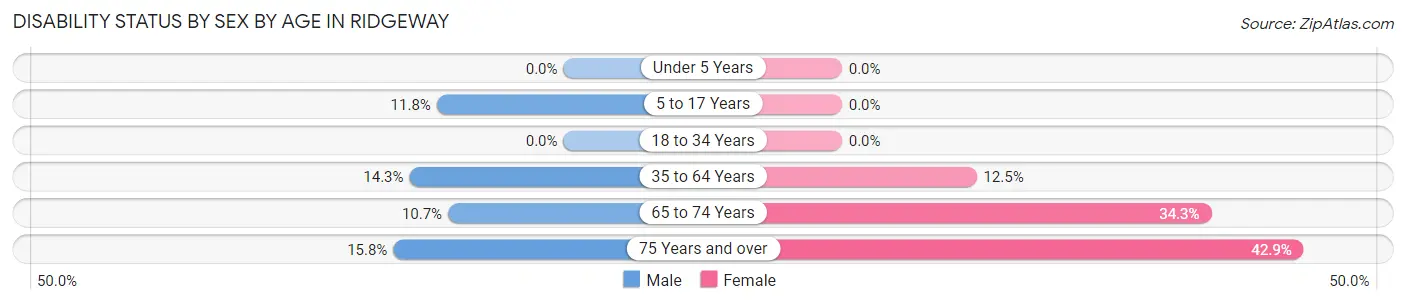
| Age Bracket | Male | Female |
| Under 5 Years | 0 (0.0%) | 0 (0.0%) |
| 5 to 17 Years | 2 (11.8%) | 0 (0.0%) |
| 18 to 34 Years | 0 (0.0%) | 0 (0.0%) |
| 35 to 64 Years | 3 (14.3%) | 6 (12.5%) |
| 65 to 74 Years | 3 (10.7%) | 12 (34.3%) |
| 75 Years and over | 3 (15.8%) | 3 (42.9%) |
Disability Class by Sex by Age in Ridgeway
Disability Class: Hearing Difficulty
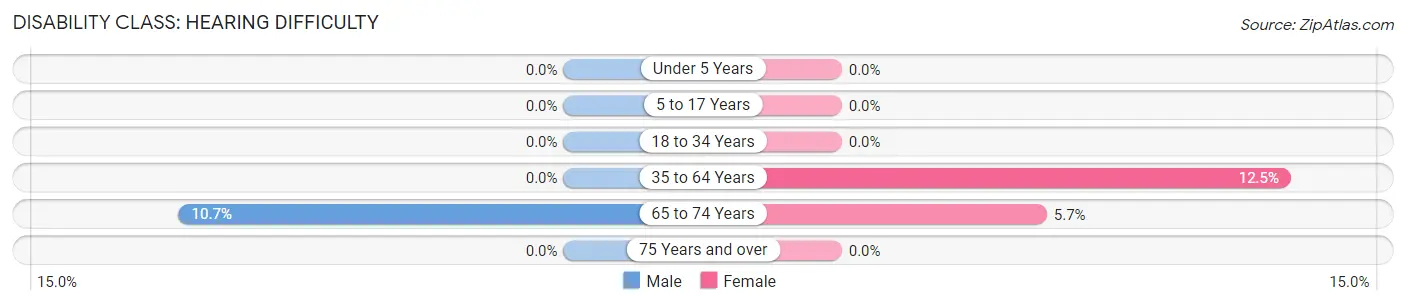
| Age Bracket | Male | Female |
| Under 5 Years | 0 (0.0%) | 0 (0.0%) |
| 5 to 17 Years | 0 (0.0%) | 0 (0.0%) |
| 18 to 34 Years | 0 (0.0%) | 0 (0.0%) |
| 35 to 64 Years | 0 (0.0%) | 6 (12.5%) |
| 65 to 74 Years | 3 (10.7%) | 2 (5.7%) |
| 75 Years and over | 0 (0.0%) | 0 (0.0%) |
Disability Class: Vision Difficulty
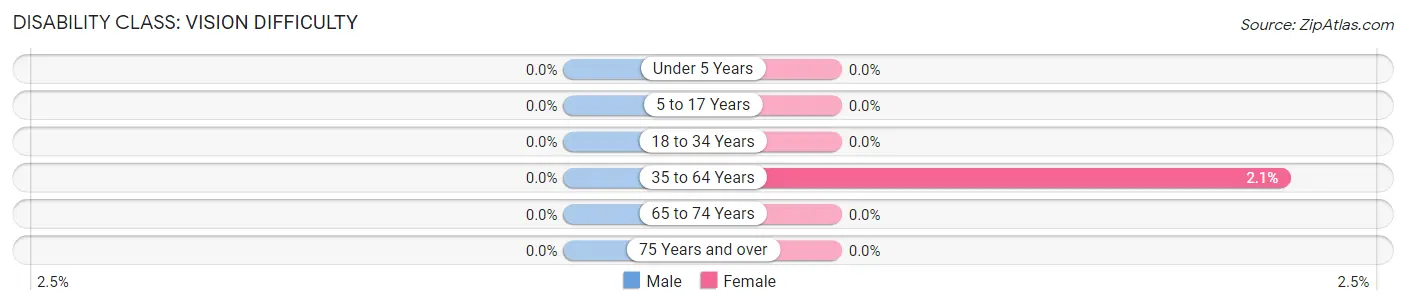
| Age Bracket | Male | Female |
| Under 5 Years | 0 (0.0%) | 0 (0.0%) |
| 5 to 17 Years | 0 (0.0%) | 0 (0.0%) |
| 18 to 34 Years | 0 (0.0%) | 0 (0.0%) |
| 35 to 64 Years | 0 (0.0%) | 1 (2.1%) |
| 65 to 74 Years | 0 (0.0%) | 0 (0.0%) |
| 75 Years and over | 0 (0.0%) | 0 (0.0%) |
Disability Class: Cognitive Difficulty
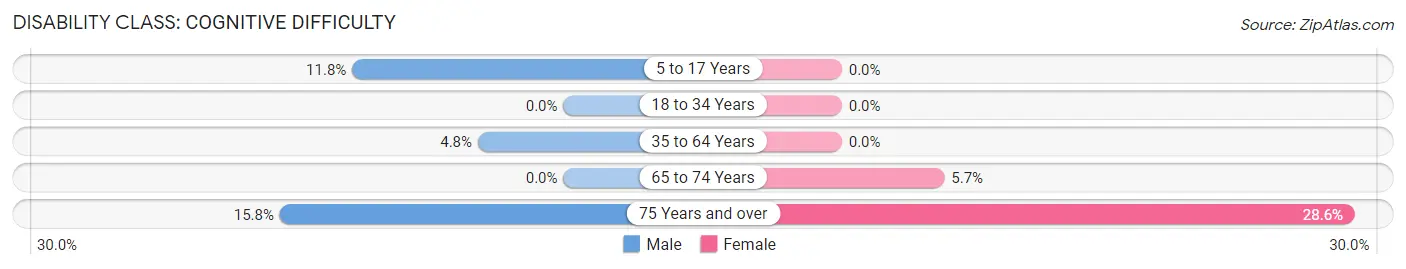
| Age Bracket | Male | Female |
| 5 to 17 Years | 2 (11.8%) | 0 (0.0%) |
| 18 to 34 Years | 0 (0.0%) | 0 (0.0%) |
| 35 to 64 Years | 1 (4.8%) | 0 (0.0%) |
| 65 to 74 Years | 0 (0.0%) | 2 (5.7%) |
| 75 Years and over | 3 (15.8%) | 2 (28.6%) |
Disability Class: Ambulatory Difficulty
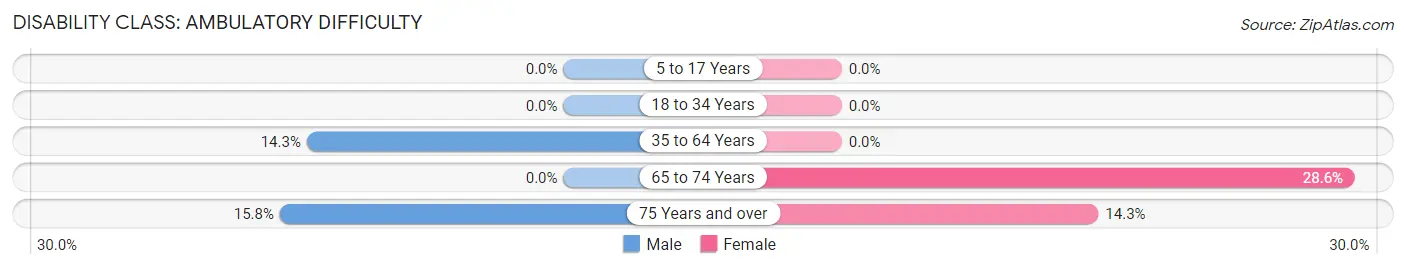
| Age Bracket | Male | Female |
| 5 to 17 Years | 0 (0.0%) | 0 (0.0%) |
| 18 to 34 Years | 0 (0.0%) | 0 (0.0%) |
| 35 to 64 Years | 3 (14.3%) | 0 (0.0%) |
| 65 to 74 Years | 0 (0.0%) | 10 (28.6%) |
| 75 Years and over | 3 (15.8%) | 1 (14.3%) |
Disability Class: Self-Care Difficulty
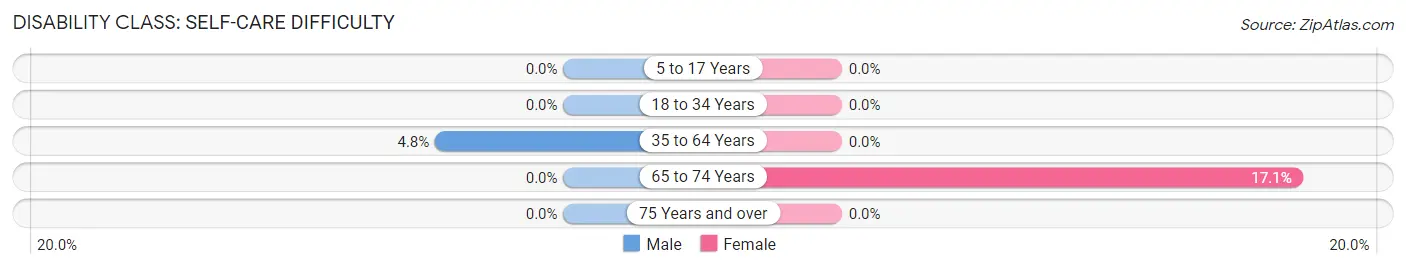
| Age Bracket | Male | Female |
| 5 to 17 Years | 0 (0.0%) | 0 (0.0%) |
| 18 to 34 Years | 0 (0.0%) | 0 (0.0%) |
| 35 to 64 Years | 1 (4.8%) | 0 (0.0%) |
| 65 to 74 Years | 0 (0.0%) | 6 (17.1%) |
| 75 Years and over | 0 (0.0%) | 0 (0.0%) |
Technology Access in Ridgeway
Computing Device Access in Ridgeway

| Device Type | # Households | % Households |
| Desktop or Laptop | 105 | 82.0% |
| Smartphone | 115 | 89.8% |
| Tablet | 90 | 70.3% |
| No Computing Device | 6 | 4.7% |
| Total | 128 | 100.0% |
Internet Access in Ridgeway
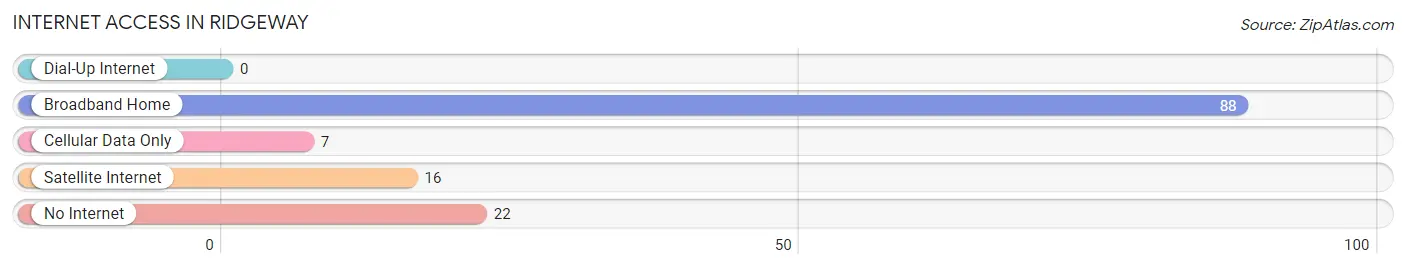
| Internet Type | # Households | % Households |
| Dial-Up Internet | 0 | 0.0% |
| Broadband Home | 88 | 68.8% |
| Cellular Data Only | 7 | 5.5% |
| Satellite Internet | 16 | 12.5% |
| No Internet | 22 | 17.2% |
| Total | 128 | 100.0% |
Ridgeway Summary
Ridgeway is a small town located in Fairfield County, South Carolina. It is situated in the Midlands region of the state, approximately 25 miles northwest of Columbia, the state capital. The town has a population of approximately 1,500 people and is part of the Columbia Metropolitan Statistical Area.
History
Ridgeway was founded in 1820 by a group of settlers from Virginia. The town was named after the nearby ridge, which was used as a landmark by the settlers. The town was incorporated in 1871 and was the first town in Fairfield County to be incorporated.
Ridgeway was an important stop on the Charlotte-to-Columbia railroad line, which was completed in 1852. The town was also the site of a major Civil War battle in 1865, when Union forces defeated Confederate forces in the Battle of Ridgeway.
Geography
Ridgeway is located in the Midlands region of South Carolina, approximately 25 miles northwest of Columbia. The town is situated in the Piedmont region of the state, which is characterized by rolling hills and flat plains. The town is located on the banks of the Broad River, which flows through the town and provides a source of recreation for the residents.
The climate in Ridgeway is humid subtropical, with hot, humid summers and mild winters. The average annual temperature is around 70 degrees Fahrenheit, with an average high of around 90 degrees in the summer and an average low of around 50 degrees in the winter.
Economy
Ridgeway’s economy is largely based on agriculture and manufacturing. The town is home to several large farms, which produce a variety of crops, including corn, soybeans, cotton, and tobacco. The town is also home to several manufacturing companies, which produce a variety of products, including furniture, textiles, and automotive parts.
The town is also home to several small businesses, including restaurants, retail stores, and service providers. The town is also home to a number of tourist attractions, including the Ridgeway Historic District, which is listed on the National Register of Historic Places.
Demographics
Ridgeway has a population of approximately 1,500 people, with a median age of 39. The town is predominantly white, with a small African American population. The town has a median household income of $37,000, and the poverty rate is around 15%.
The town is served by the Fairfield County School District, which includes two elementary schools, one middle school, and one high school. The town is also home to several churches, including the Ridgeway United Methodist Church and the Ridgeway Baptist Church.
Conclusion
Ridgeway is a small town located in Fairfield County, South Carolina. It is situated in the Midlands region of the state, approximately 25 miles northwest of Columbia, the state capital. The town has a population of approximately 1,500 people and is part of the Columbia Metropolitan Statistical Area. The town’s economy is largely based on agriculture and manufacturing, and the town is home to several tourist attractions, including the Ridgeway Historic District. The town is served by the Fairfield County School District, and the town is predominantly white, with a small African American population.
Common Questions
What is Per Capita Income in Ridgeway?
Per Capita income in Ridgeway is $29,501.
What is the Median Family Income in Ridgeway?
Median Family Income in Ridgeway is $47,500.
What is the Median Household income in Ridgeway?
Median Household Income in Ridgeway is $40,500.
What is Family Income Deficit in Ridgeway?
Family Income Deficit in Ridgeway is $10,068.
Families that are below poverty line in Ridgeway earn $10,068 less on average than the poverty threshold level.
What is Inequality or Gini Index in Ridgeway?
Inequality or Gini Index in Ridgeway is 0.57.
What is the Total Population of Ridgeway?
Total Population of Ridgeway is 251.
What is the Total Male Population of Ridgeway?
Total Male Population of Ridgeway is 124.
What is the Total Female Population of Ridgeway?
Total Female Population of Ridgeway is 127.
What is the Ratio of Males per 100 Females in Ridgeway?
There are 97.64 Males per 100 Females in Ridgeway.
What is the Ratio of Females per 100 Males in Ridgeway?
There are 102.42 Females per 100 Males in Ridgeway.
What is the Median Population Age in Ridgeway?
Median Population Age in Ridgeway is 56.5 Years.
What is the Average Family Size in Ridgeway
Average Family Size in Ridgeway is 2.5 People.
What is the Average Household Size in Ridgeway
Average Household Size in Ridgeway is 2.0 People.
How Large is the Labor Force in Ridgeway?
There are 131 People in the Labor Forcein in Ridgeway.
What is the Percentage of People in the Labor Force in Ridgeway?
60.6% of People are in the Labor Force in Ridgeway.
What is the Unemployment Rate in Ridgeway?
Unemployment Rate in Ridgeway is 1.5%.