Camden, SC Map & Demographics
Camden Map
Camden Overview
$38,569
PER CAPITA INCOME
$84,893
AVG FAMILY INCOME
$54,141
AVG HOUSEHOLD INCOME
30.3%
WAGE / INCOME GAP [ % ]
69.7¢/ $1
WAGE / INCOME GAP [ $ ]
$10,908
FAMILY INCOME DEFICIT
0.53
INEQUALITY / GINI INDEX
7,834
TOTAL POPULATION
3,338
MALE POPULATION
4,496
FEMALE POPULATION
74.24
MALES / 100 FEMALES
134.69
FEMALES / 100 MALES
47.9
MEDIAN AGE
2.9
AVG FAMILY SIZE
2.1
AVG HOUSEHOLD SIZE
3,733
LABOR FORCE [ PEOPLE ]
55.5%
PERCENT IN LABOR FORCE
3.0%
UNEMPLOYMENT RATE
Camden Zip Codes
Camden Area Codes
Income in Camden
Income Overview in Camden
Per Capita Income in Camden is $38,569, while median incomes of families and households are $84,893 and $54,141 respectively.
| Characteristic | Number | Measure |
| Per Capita Income | 7,834 | $38,569 |
| Median Family Income | 2,037 | $84,893 |
| Mean Family Income | 2,037 | $110,375 |
| Median Household Income | 3,662 | $54,141 |
| Mean Household Income | 3,662 | $79,824 |
| Income Deficit | 2,037 | $10,908 |
| Wage / Income Gap (%) | 7,834 | 30.29% |
| Wage / Income Gap ($) | 7,834 | 69.71¢ per $1 |
| Gini / Inequality Index | 7,834 | 0.53 |
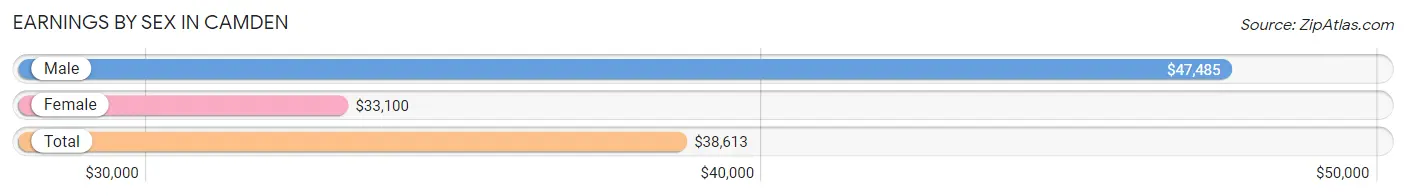
Earnings by Sex in Camden
Average Earnings in Camden are $38,613, $47,485 for men and $33,100 for women, a difference of 30.3%.
| Sex | Number | Average Earnings |
| Male | 1,941 (49.6%) | $47,485 |
| Female | 1,968 (50.3%) | $33,100 |
| Total | 3,909 (100.0%) | $38,613 |
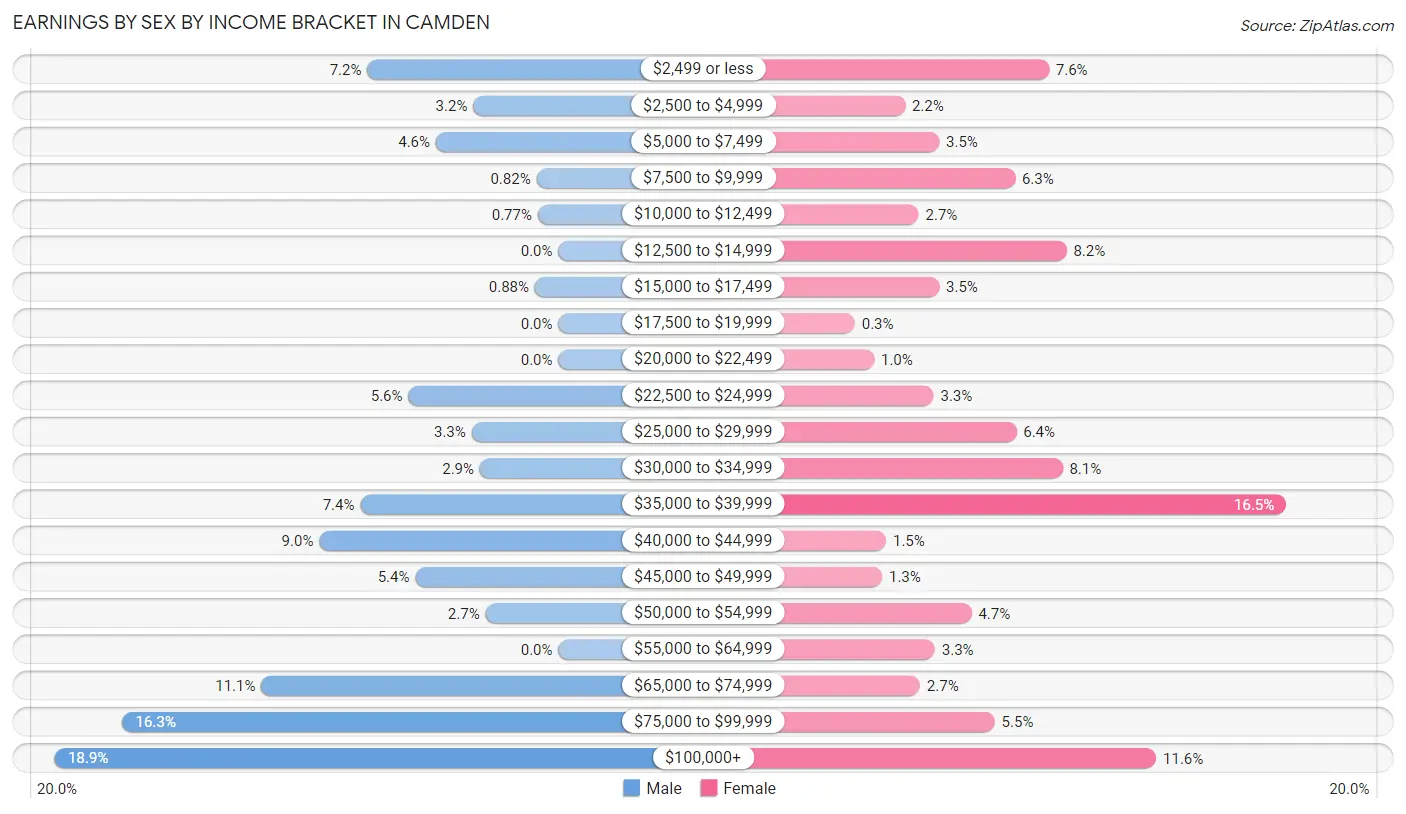
Earnings by Sex by Income Bracket in Camden
The most common earnings brackets in Camden are $100,000+ for men (366 | 18.9%) and $35,000 to $39,999 for women (324 | 16.5%).
| Income | Male | Female |
| $2,499 or less | 139 (7.2%) | 149 (7.6%) |
| $2,500 to $4,999 | 62 (3.2%) | 43 (2.2%) |
| $5,000 to $7,499 | 89 (4.6%) | 68 (3.5%) |
| $7,500 to $9,999 | 16 (0.8%) | 124 (6.3%) |
| $10,000 to $12,499 | 15 (0.8%) | 53 (2.7%) |
| $12,500 to $14,999 | 0 (0.0%) | 162 (8.2%) |
| $15,000 to $17,499 | 17 (0.9%) | 68 (3.5%) |
| $17,500 to $19,999 | 0 (0.0%) | 6 (0.3%) |
| $20,000 to $22,499 | 0 (0.0%) | 20 (1.0%) |
| $22,500 to $24,999 | 109 (5.6%) | 64 (3.3%) |
| $25,000 to $29,999 | 63 (3.3%) | 125 (6.4%) |
| $30,000 to $34,999 | 57 (2.9%) | 159 (8.1%) |
| $35,000 to $39,999 | 144 (7.4%) | 324 (16.5%) |
| $40,000 to $44,999 | 174 (9.0%) | 29 (1.5%) |
| $45,000 to $49,999 | 104 (5.4%) | 26 (1.3%) |
| $50,000 to $54,999 | 53 (2.7%) | 92 (4.7%) |
| $55,000 to $64,999 | 0 (0.0%) | 65 (3.3%) |
| $65,000 to $74,999 | 216 (11.1%) | 54 (2.7%) |
| $75,000 to $99,999 | 317 (16.3%) | 109 (5.5%) |
| $100,000+ | 366 (18.9%) | 228 (11.6%) |
| Total | 1,941 (100.0%) | 1,968 (100.0%) |
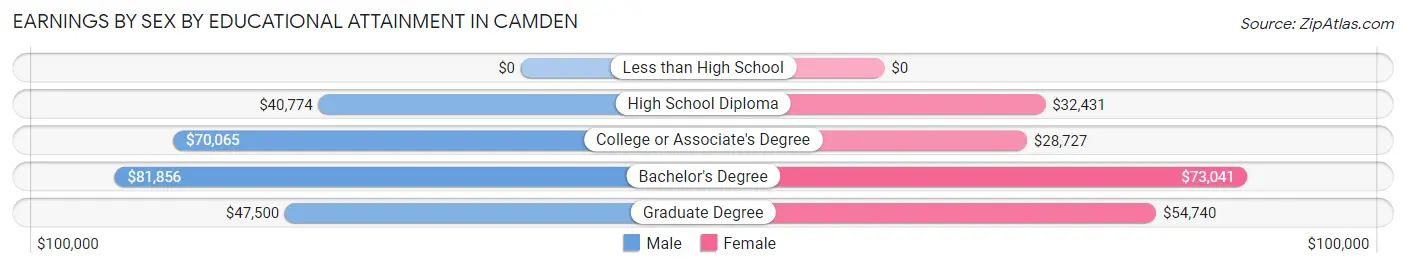
Earnings by Sex by Educational Attainment in Camden
Average earnings in Camden are $69,333 for men and $34,383 for women, a difference of 50.4%. Men with an educational attainment of bachelor's degree enjoy the highest average annual earnings of $81,856, while those with high school diploma education earn the least with $40,774. Women with an educational attainment of bachelor's degree earn the most with the average annual earnings of $73,041, while those with college or associate's degree education have the smallest earnings of $28,727.
| Educational Attainment | Male Income | Female Income |
| Less than High School | - | - |
| High School Diploma | $40,774 | $32,431 |
| College or Associate's Degree | $70,065 | $28,727 |
| Bachelor's Degree | $81,856 | $73,041 |
| Graduate Degree | $47,500 | $54,740 |
| Total | $69,333 | $34,383 |
Family Income in Camden
Family Income Brackets in Camden
According to the Camden family income data, there are 432 families falling into the $100,000 to $149,999 income range, which is the most common income bracket and makes up 21.2% of all families. Conversely, the $15,000 to $24,999 income bracket is the least frequent group with only 55 families (2.7%) belonging to this category.
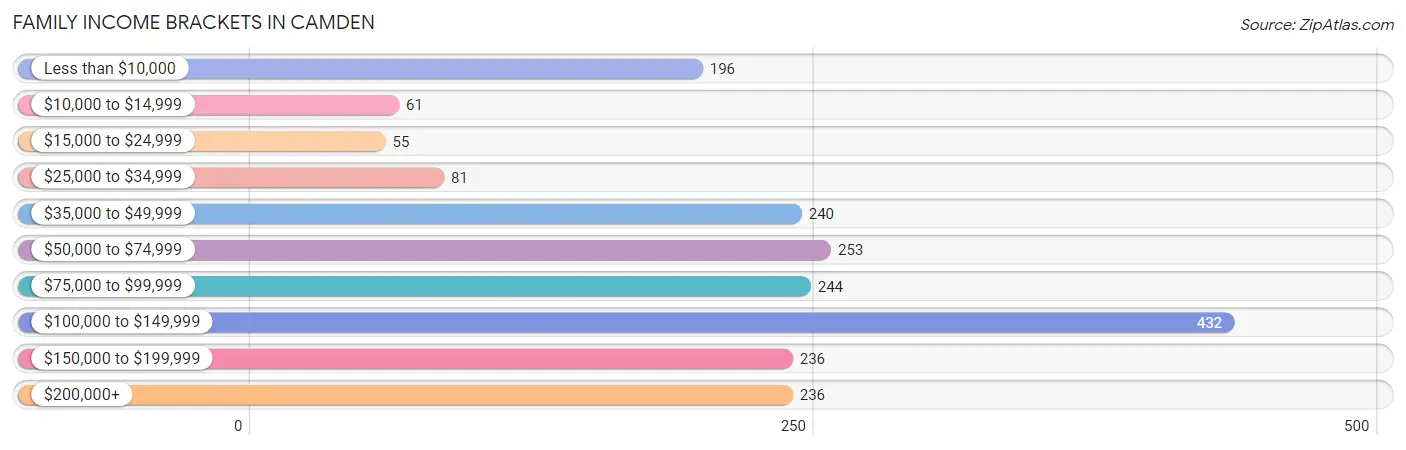
| Income Bracket | # Families | % Families |
| Less than $10,000 | 196 | 9.6% |
| $10,000 to $14,999 | 61 | 3.0% |
| $15,000 to $24,999 | 55 | 2.7% |
| $25,000 to $34,999 | 81 | 4.0% |
| $35,000 to $49,999 | 240 | 11.8% |
| $50,000 to $74,999 | 253 | 12.4% |
| $75,000 to $99,999 | 244 | 12.0% |
| $100,000 to $149,999 | 432 | 21.2% |
| $150,000 to $199,999 | 236 | 11.6% |
| $200,000+ | 236 | 11.6% |
Family Income by Famaliy Size in Camden
4-person families (360 | 17.7%) account for the highest median family income in Camden with $119,695 per family, while 3-person families (517 | 25.4%) have the highest median income of $38,802 per family member.
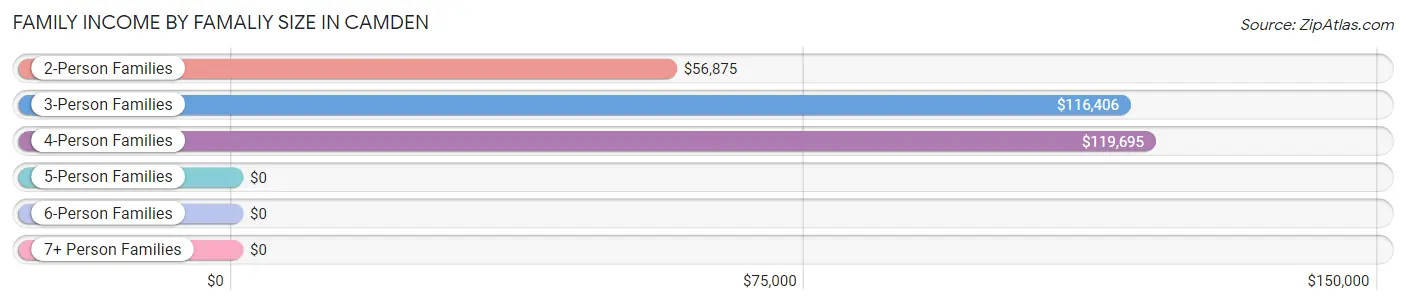
| Income Bracket | # Families | Median Income |
| 2-Person Families | 1,124 (55.2%) | $56,875 |
| 3-Person Families | 517 (25.4%) | $116,406 |
| 4-Person Families | 360 (17.7%) | $119,695 |
| 5-Person Families | 23 (1.1%) | $0 |
| 6-Person Families | 0 (0.0%) | $0 |
| 7+ Person Families | 13 (0.6%) | $0 |
| Total | 2,037 (100.0%) | $84,893 |
Family Income by Number of Earners in Camden
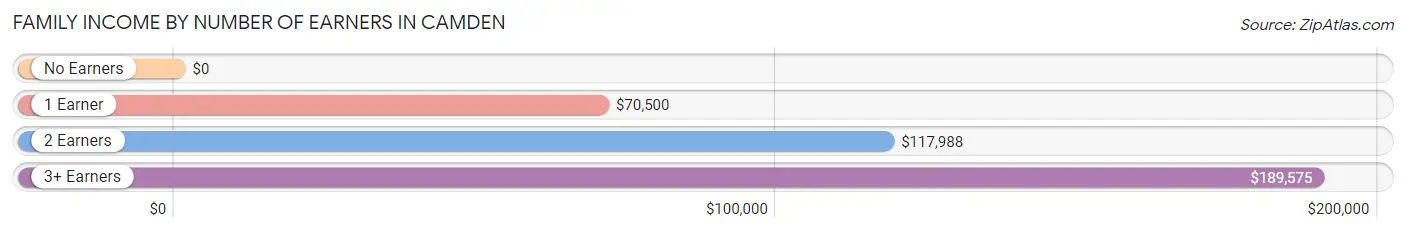
| Number of Earners | # Families | Median Income |
| No Earners | 299 (14.7%) | $0 |
| 1 Earner | 730 (35.8%) | $70,500 |
| 2 Earners | 868 (42.6%) | $117,988 |
| 3+ Earners | 140 (6.9%) | $189,575 |
| Total | 2,037 (100.0%) | $84,893 |
Household Income in Camden
Household Income Brackets in Camden
With 582 households falling in the category, the less than $10,000 income range is the most frequent in Camden, accounting for 15.9% of all households. In contrast, only 99 households (2.7%) fall into the $25,000 to $34,999 income bracket, making it the least populous group.
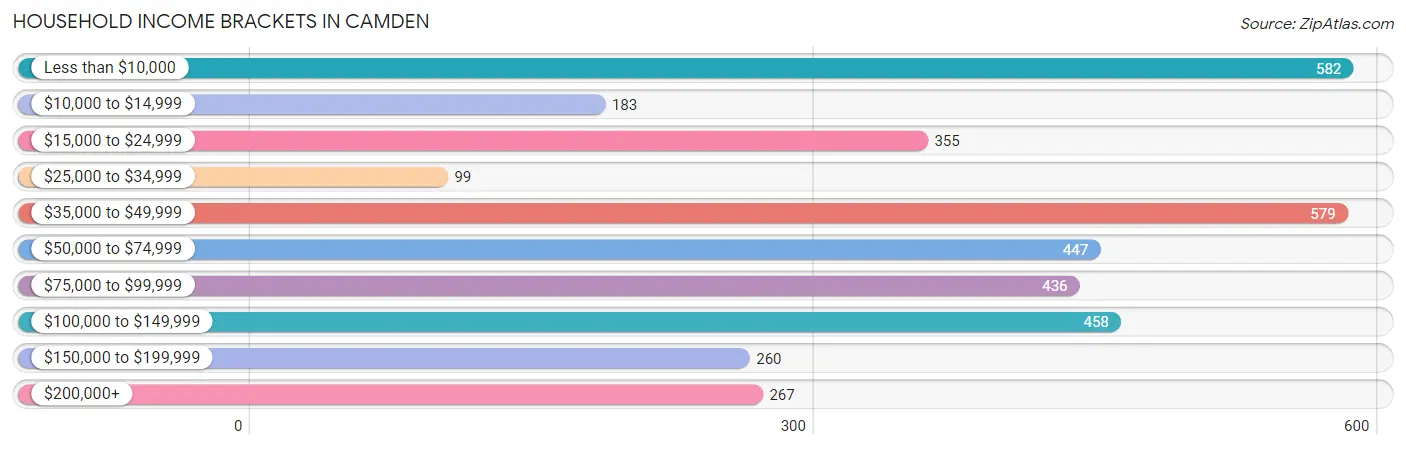
| Income Bracket | # Households | % Households |
| Less than $10,000 | 582 | 15.9% |
| $10,000 to $14,999 | 183 | 5.0% |
| $15,000 to $24,999 | 355 | 9.7% |
| $25,000 to $34,999 | 99 | 2.7% |
| $35,000 to $49,999 | 579 | 15.8% |
| $50,000 to $74,999 | 447 | 12.2% |
| $75,000 to $99,999 | 436 | 11.9% |
| $100,000 to $149,999 | 458 | 12.5% |
| $150,000 to $199,999 | 260 | 7.1% |
| $200,000+ | 267 | 7.3% |
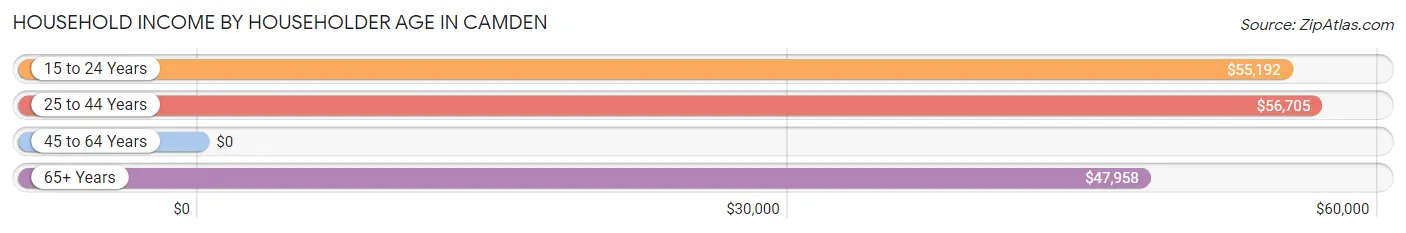
Household Income by Householder Age in Camden
The median household income in Camden is $54,141, with the highest median household income of $56,705 found in the 25 to 44 years age bracket for the primary householder. A total of 1,099 households (30.0%) fall into this category. Meanwhile, the 45 to 64 years age bracket for the primary householder has the lowest median household income of $0, with 1,248 households (34.1%) in this group.
| Income Bracket | # Households | Median Income |
| 15 to 24 Years | 48 (1.3%) | $55,192 |
| 25 to 44 Years | 1,099 (30.0%) | $56,705 |
| 45 to 64 Years | 1,248 (34.1%) | $0 |
| 65+ Years | 1,267 (34.6%) | $47,958 |
| Total | 3,662 (100.0%) | $54,141 |
Poverty in Camden
Income Below Poverty by Sex and Age in Camden
With 15.8% poverty level for males and 19.4% for females among the residents of Camden, 6 to 11 year old males and 5 year old females are the most vulnerable to poverty, with 105 males (67.3%) and 58 females (100.0%) in their respective age groups living below the poverty level.
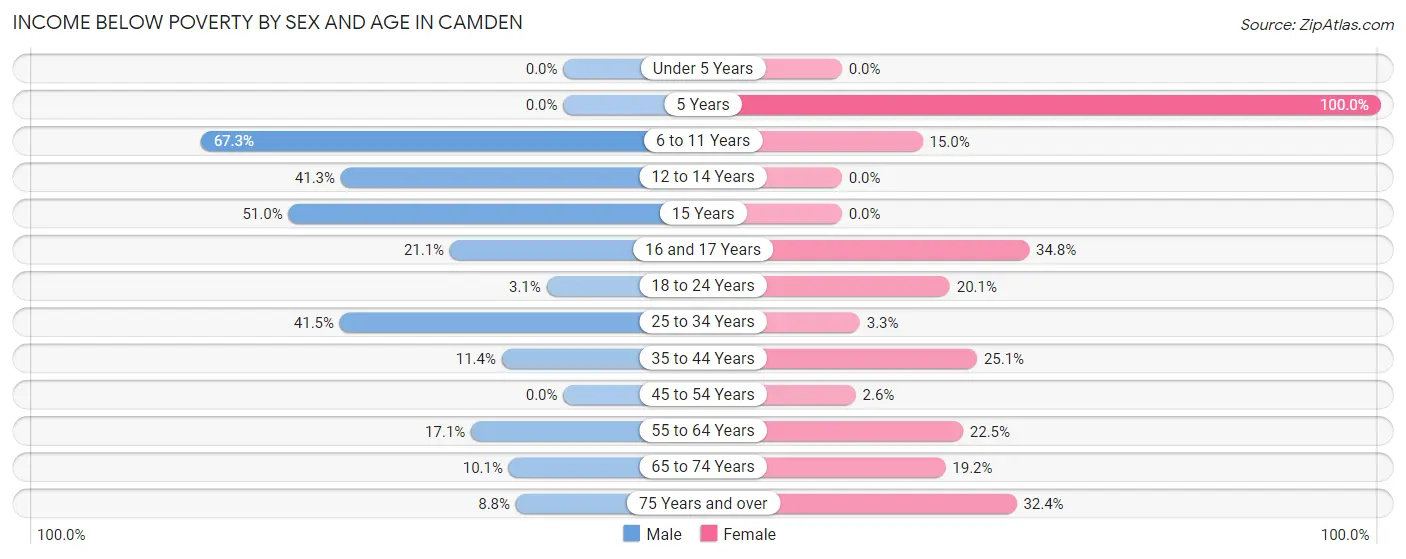
| Age Bracket | Male | Female |
| Under 5 Years | 0 (0.0%) | 0 (0.0%) |
| 5 Years | 0 (0.0%) | 58 (100.0%) |
| 6 to 11 Years | 105 (67.3%) | 31 (15.0%) |
| 12 to 14 Years | 38 (41.3%) | 0 (0.0%) |
| 15 Years | 25 (51.0%) | 0 (0.0%) |
| 16 and 17 Years | 12 (21.0%) | 57 (34.8%) |
| 18 to 24 Years | 6 (3.1%) | 77 (20.1%) |
| 25 to 34 Years | 73 (41.5%) | 13 (3.3%) |
| 35 to 44 Years | 87 (11.4%) | 144 (25.1%) |
| 45 to 54 Years | 0 (0.0%) | 11 (2.6%) |
| 55 to 64 Years | 115 (17.1%) | 162 (22.5%) |
| 65 to 74 Years | 50 (10.1%) | 114 (19.2%) |
| 75 Years and over | 14 (8.8%) | 190 (32.4%) |
| Total | 525 (15.8%) | 857 (19.4%) |
Income Above Poverty by Sex and Age in Camden
According to the poverty statistics in Camden, males aged under 5 years and females aged under 5 years are the age groups that are most secure financially, with 100.0% of males and 100.0% of females in these age groups living above the poverty line.
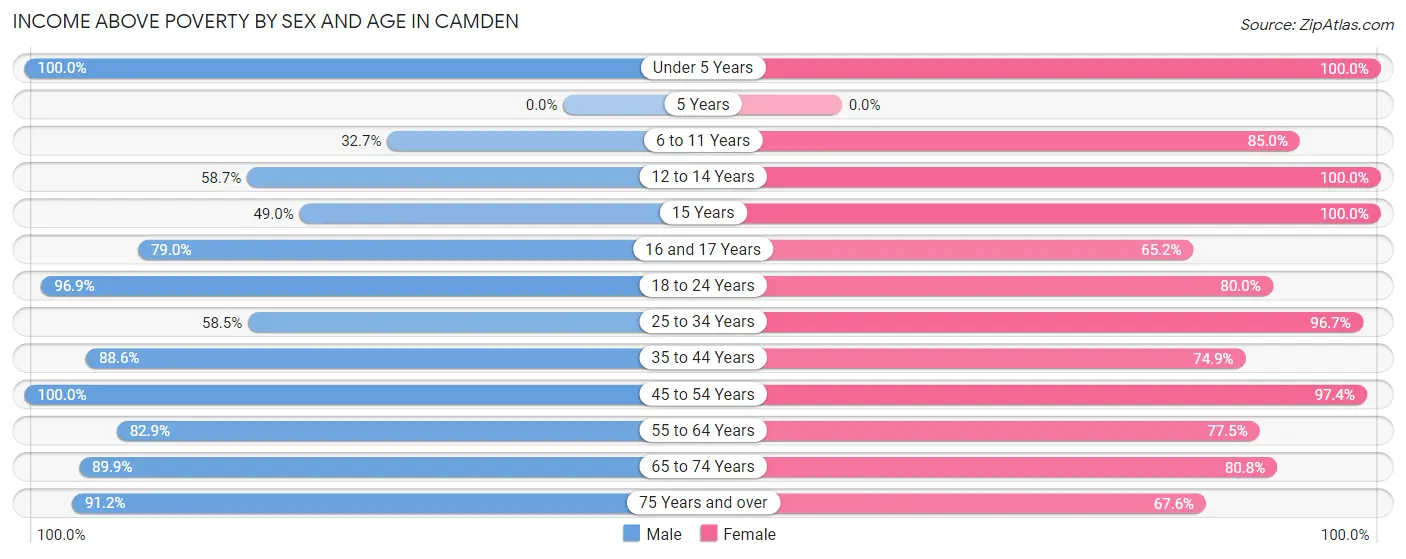
| Age Bracket | Male | Female |
| Under 5 Years | 233 (100.0%) | 220 (100.0%) |
| 5 Years | 0 (0.0%) | 0 (0.0%) |
| 6 to 11 Years | 51 (32.7%) | 176 (85.0%) |
| 12 to 14 Years | 54 (58.7%) | 49 (100.0%) |
| 15 Years | 24 (49.0%) | 44 (100.0%) |
| 16 and 17 Years | 45 (78.9%) | 107 (65.2%) |
| 18 to 24 Years | 187 (96.9%) | 307 (79.9%) |
| 25 to 34 Years | 103 (58.5%) | 376 (96.7%) |
| 35 to 44 Years | 674 (88.6%) | 430 (74.9%) |
| 45 to 54 Years | 277 (100.0%) | 419 (97.4%) |
| 55 to 64 Years | 557 (82.9%) | 559 (77.5%) |
| 65 to 74 Years | 444 (89.9%) | 479 (80.8%) |
| 75 Years and over | 145 (91.2%) | 396 (67.6%) |
| Total | 2,794 (84.2%) | 3,562 (80.6%) |
Income Below Poverty Among Married-Couple Families in Camden
The poverty statistics for married-couple families in Camden show that 3.5% or 51 of the total 1,446 families live below the poverty line. Families with 1 or 2 children have the highest poverty rate of 3.6%, comprising of 23 families. On the other hand, families with 3 or 4 children have the lowest poverty rate of 0.0%, which includes 0 families.
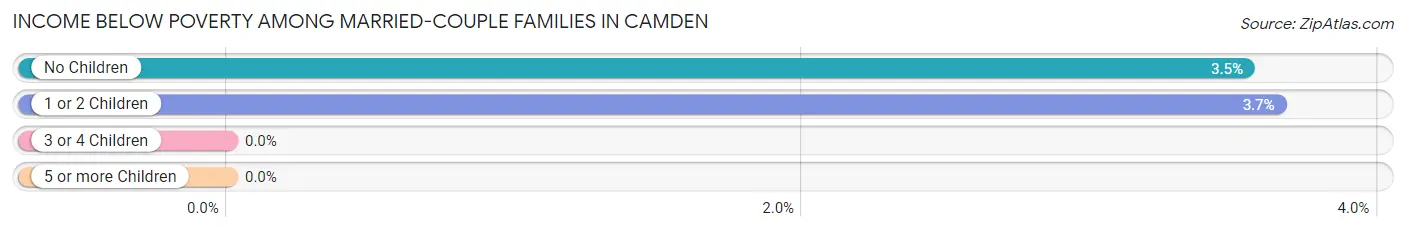
| Children | Above Poverty | Below Poverty |
| No Children | 764 (96.5%) | 28 (3.5%) |
| 1 or 2 Children | 608 (96.4%) | 23 (3.6%) |
| 3 or 4 Children | 23 (100.0%) | 0 (0.0%) |
| 5 or more Children | 0 (0.0%) | 0 (0.0%) |
| Total | 1,395 (96.5%) | 51 (3.5%) |
Income Below Poverty Among Single-Parent Households in Camden
According to the poverty data in Camden, 84.2% or 154 single-father households and 26.5% or 108 single-mother households are living below the poverty line. Among single-father households, those with 1 or 2 children have the highest poverty rate, with 154 households (100.0%) experiencing poverty. Likewise, among single-mother households, those with 1 or 2 children have the highest poverty rate, with 92 households (47.7%) falling below the poverty line.
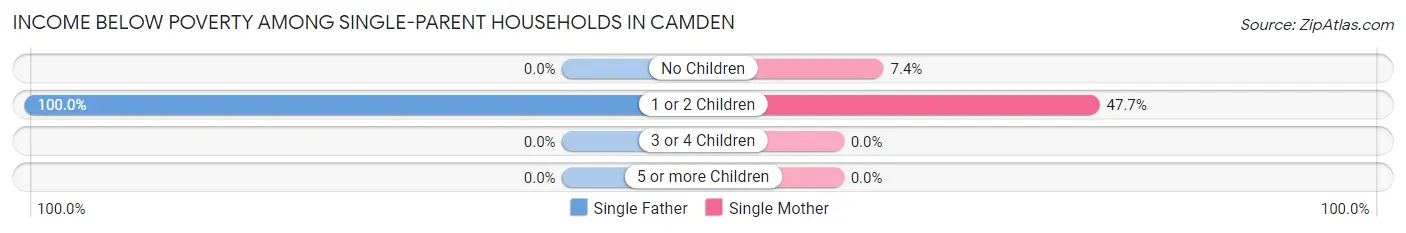
| Children | Single Father | Single Mother |
| No Children | 0 (0.0%) | 16 (7.4%) |
| 1 or 2 Children | 154 (100.0%) | 92 (47.7%) |
| 3 or 4 Children | 0 (0.0%) | 0 (0.0%) |
| 5 or more Children | 0 (0.0%) | 0 (0.0%) |
| Total | 154 (84.2%) | 108 (26.5%) |
Income Below Poverty Among Married-Couple vs Single-Parent Households in Camden
The poverty data for Camden shows that 51 of the married-couple family households (3.5%) and 262 of the single-parent households (44.3%) are living below the poverty level. Within the married-couple family households, those with 1 or 2 children have the highest poverty rate, with 23 households (3.6%) falling below the poverty line. Among the single-parent households, those with 1 or 2 children have the highest poverty rate, with 246 household (70.9%) living below poverty.
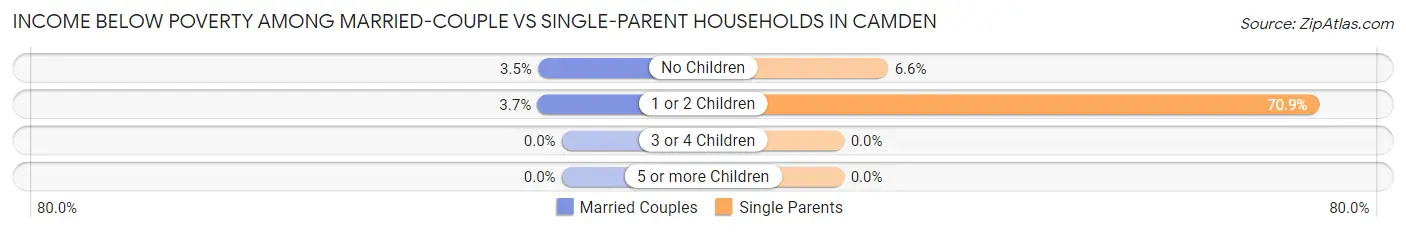
| Children | Married-Couple Families | Single-Parent Households |
| No Children | 28 (3.5%) | 16 (6.6%) |
| 1 or 2 Children | 23 (3.6%) | 246 (70.9%) |
| 3 or 4 Children | 0 (0.0%) | 0 (0.0%) |
| 5 or more Children | 0 (0.0%) | 0 (0.0%) |
| Total | 51 (3.5%) | 262 (44.3%) |
Race in Camden
The most populous races in Camden are White / Caucasian (5,005 | 63.9%), Black / African American (2,518 | 32.1%), and Hispanic or Latino (350 | 4.5%).
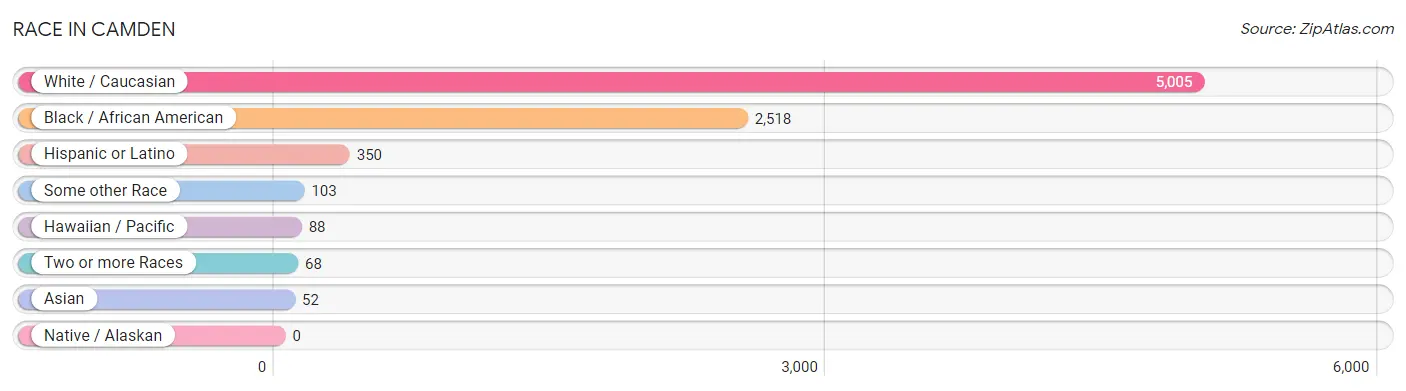
| Race | # Population | % Population |
| Asian | 52 | 0.7% |
| Black / African American | 2,518 | 32.1% |
| Hawaiian / Pacific | 88 | 1.1% |
| Hispanic or Latino | 350 | 4.5% |
| Native / Alaskan | 0 | 0.0% |
| White / Caucasian | 5,005 | 63.9% |
| Two or more Races | 68 | 0.9% |
| Some other Race | 103 | 1.3% |
| Total | 7,834 | 100.0% |
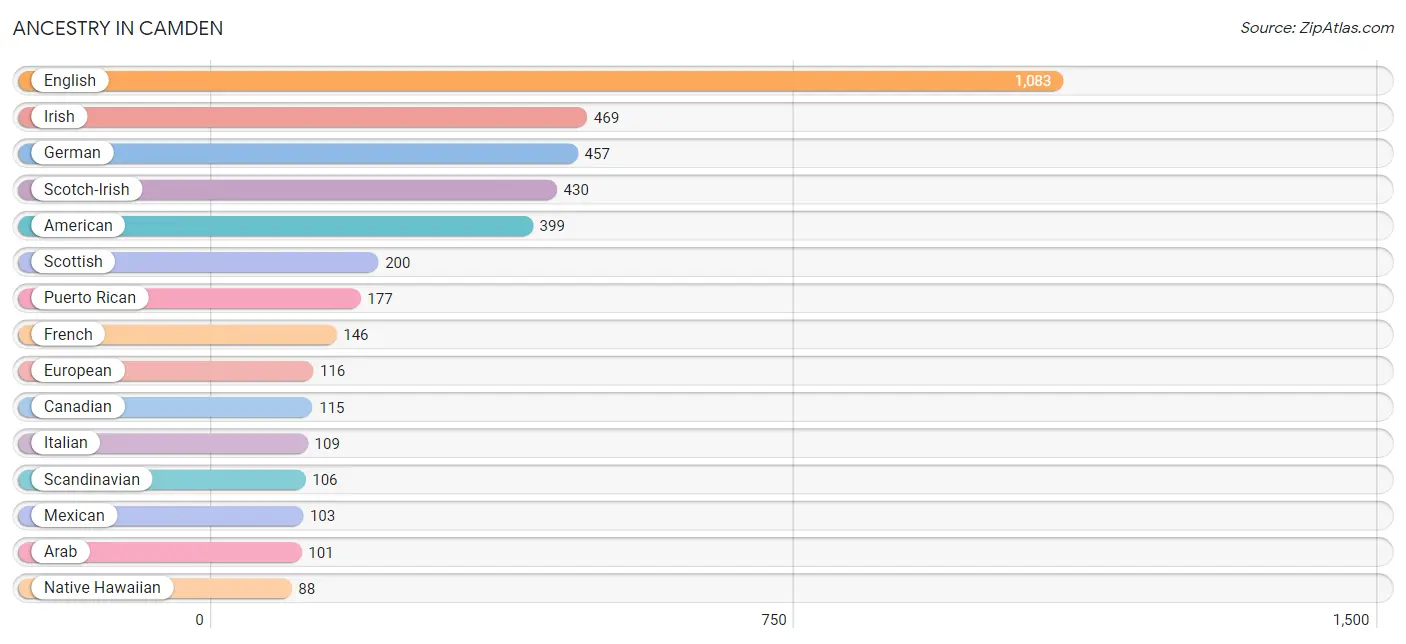
Ancestry in Camden
The most populous ancestries reported in Camden are English (1,083 | 13.8%), Irish (469 | 6.0%), German (457 | 5.8%), Scotch-Irish (430 | 5.5%), and American (399 | 5.1%), together accounting for 36.2% of all Camden residents.
| Ancestry | # Population | % Population |
| African | 3 | 0.0% |
| American | 399 | 5.1% |
| Arab | 101 | 1.3% |
| Austrian | 16 | 0.2% |
| Canadian | 115 | 1.5% |
| Central American | 69 | 0.9% |
| Danish | 17 | 0.2% |
| Dutch | 27 | 0.3% |
| English | 1,083 | 13.8% |
| European | 116 | 1.5% |
| French | 146 | 1.9% |
| French Canadian | 82 | 1.1% |
| German | 457 | 5.8% |
| Greek | 51 | 0.6% |
| Honduran | 29 | 0.4% |
| Irish | 469 | 6.0% |
| Italian | 109 | 1.4% |
| Japanese | 84 | 1.1% |
| Lebanese | 57 | 0.7% |
| Mexican | 103 | 1.3% |
| Native Hawaiian | 88 | 1.1% |
| Northern European | 29 | 0.4% |
| Norwegian | 50 | 0.6% |
| Panamanian | 40 | 0.5% |
| Polish | 75 | 1.0% |
| Portuguese | 13 | 0.2% |
| Puerto Rican | 177 | 2.3% |
| Russian | 12 | 0.2% |
| Scandinavian | 106 | 1.3% |
| Scotch-Irish | 430 | 5.5% |
| Scottish | 200 | 2.5% |
| Spaniard | 1 | 0.0% |
| Subsaharan African | 3 | 0.0% |
| Swedish | 28 | 0.4% |
| Welsh | 32 | 0.4% | View All 35 Rows |
Immigrants in Camden
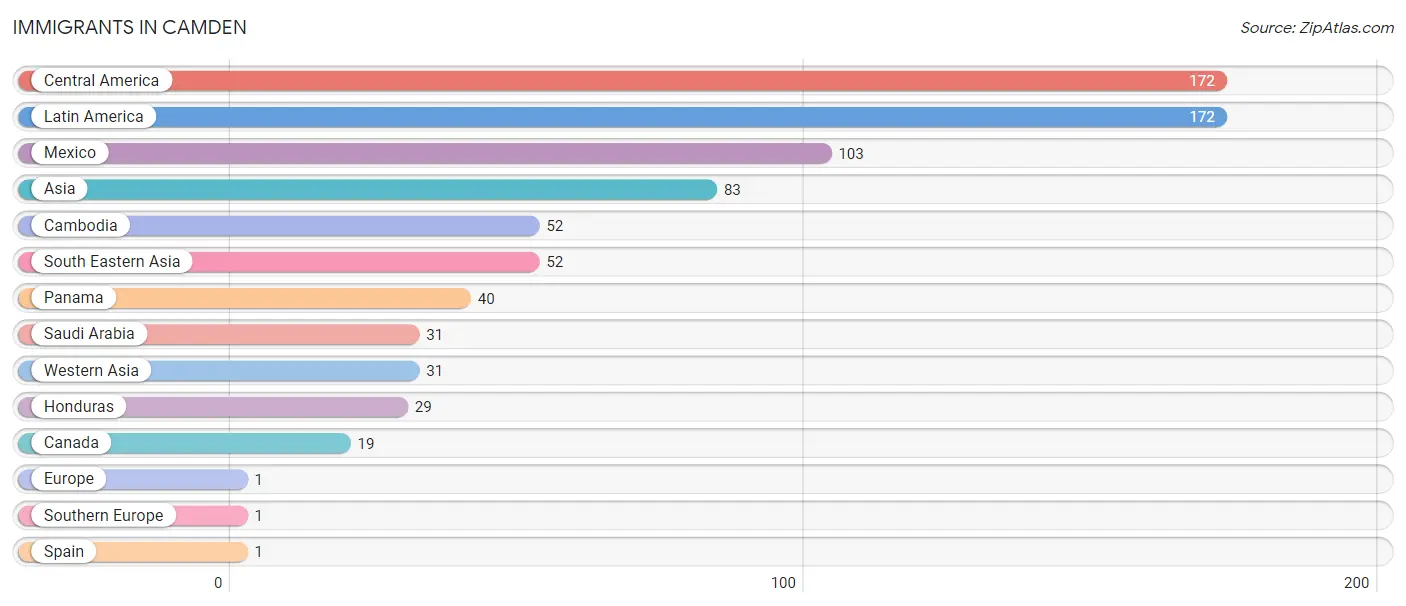
The most numerous immigrant groups reported in Camden came from Central America (172 | 2.2%), Latin America (172 | 2.2%), Mexico (103 | 1.3%), Asia (83 | 1.1%), and Cambodia (52 | 0.7%), together accounting for 7.4% of all Camden residents.
| Immigration Origin | # Population | % Population |
| Asia | 83 | 1.1% |
| Cambodia | 52 | 0.7% |
| Canada | 19 | 0.2% |
| Central America | 172 | 2.2% |
| Europe | 1 | 0.0% |
| Honduras | 29 | 0.4% |
| Latin America | 172 | 2.2% |
| Mexico | 103 | 1.3% |
| Panama | 40 | 0.5% |
| Saudi Arabia | 31 | 0.4% |
| South Eastern Asia | 52 | 0.7% |
| Southern Europe | 1 | 0.0% |
| Spain | 1 | 0.0% |
| Western Asia | 31 | 0.4% | View All 14 Rows |
Sex and Age in Camden
Sex and Age in Camden
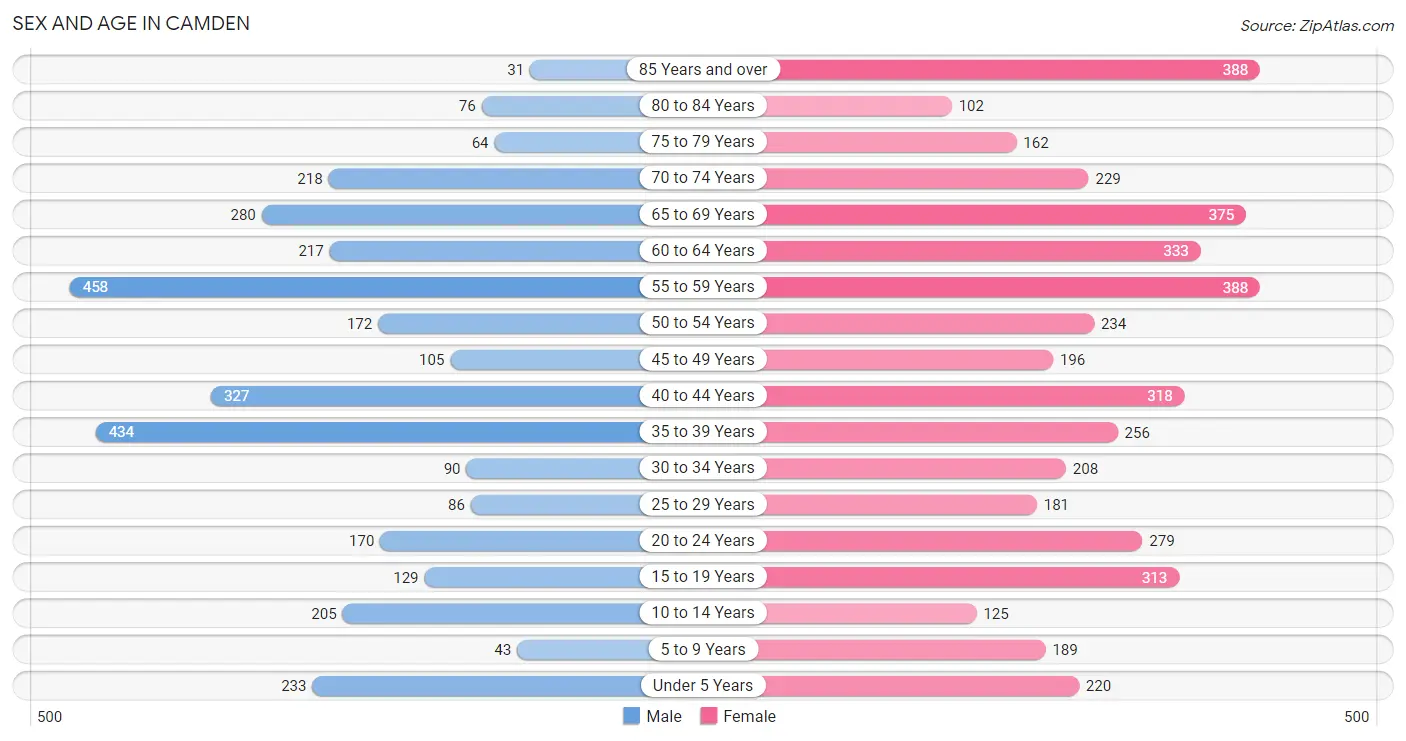
The most populous age groups in Camden are 55 to 59 Years (458 | 13.7%) for men and 55 to 59 Years (388 | 8.6%) for women.
| Age Bracket | Male | Female |
| Under 5 Years | 233 (7.0%) | 220 (4.9%) |
| 5 to 9 Years | 43 (1.3%) | 189 (4.2%) |
| 10 to 14 Years | 205 (6.1%) | 125 (2.8%) |
| 15 to 19 Years | 129 (3.9%) | 313 (7.0%) |
| 20 to 24 Years | 170 (5.1%) | 279 (6.2%) |
| 25 to 29 Years | 86 (2.6%) | 181 (4.0%) |
| 30 to 34 Years | 90 (2.7%) | 208 (4.6%) |
| 35 to 39 Years | 434 (13.0%) | 256 (5.7%) |
| 40 to 44 Years | 327 (9.8%) | 318 (7.1%) |
| 45 to 49 Years | 105 (3.2%) | 196 (4.4%) |
| 50 to 54 Years | 172 (5.1%) | 234 (5.2%) |
| 55 to 59 Years | 458 (13.7%) | 388 (8.6%) |
| 60 to 64 Years | 217 (6.5%) | 333 (7.4%) |
| 65 to 69 Years | 280 (8.4%) | 375 (8.3%) |
| 70 to 74 Years | 218 (6.5%) | 229 (5.1%) |
| 75 to 79 Years | 64 (1.9%) | 162 (3.6%) |
| 80 to 84 Years | 76 (2.3%) | 102 (2.3%) |
| 85 Years and over | 31 (0.9%) | 388 (8.6%) |
| Total | 3,338 (100.0%) | 4,496 (100.0%) |
Families and Households in Camden
Median Family Size in Camden
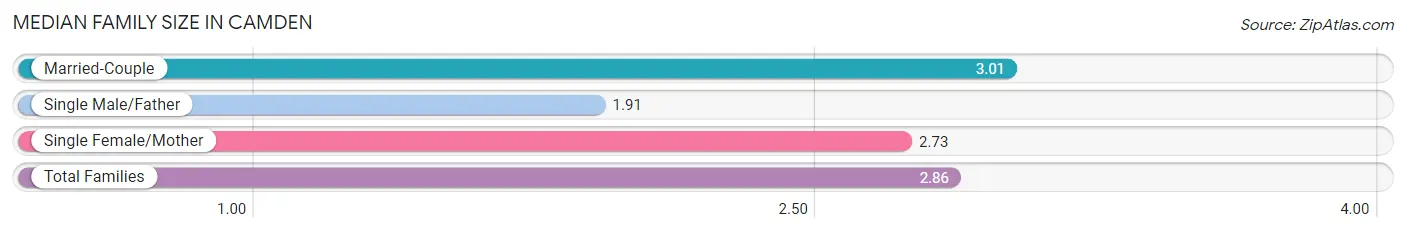
The median family size in Camden is 2.86 persons per family, with married-couple families (1,446 | 71.0%) accounting for the largest median family size of 3.01 persons per family. On the other hand, single male/father families (183 | 9.0%) represent the smallest median family size with 1.91 persons per family.
| Family Type | # Families | Family Size |
| Married-Couple | 1,446 (71.0%) | 3.01 |
| Single Male/Father | 183 (9.0%) | 1.91 |
| Single Female/Mother | 408 (20.0%) | 2.73 |
| Total Families | 2,037 (100.0%) | 2.86 |
Median Household Size in Camden
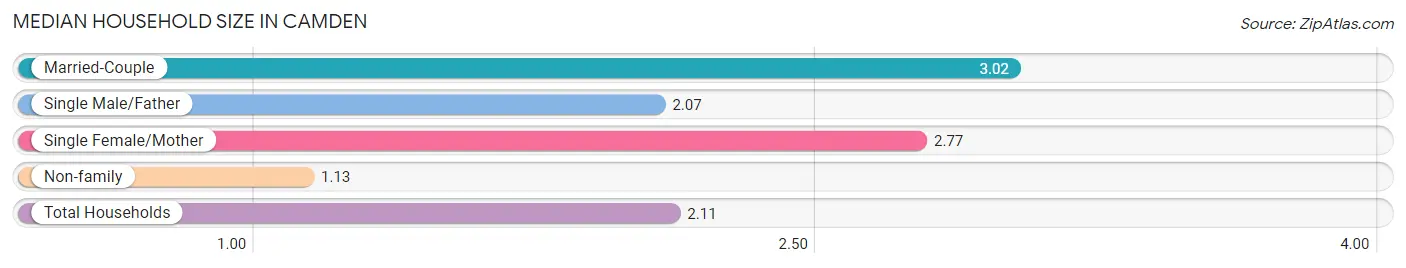
The median household size in Camden is 2.11 persons per household, with married-couple households (1,446 | 39.5%) accounting for the largest median household size of 3.02 persons per household. non-family households (1,625 | 44.4%) represent the smallest median household size with 1.13 persons per household.
| Household Type | # Households | Household Size |
| Married-Couple | 1,446 (39.5%) | 3.02 |
| Single Male/Father | 183 (5.0%) | 2.07 |
| Single Female/Mother | 408 (11.1%) | 2.77 |
| Non-family | 1,625 (44.4%) | 1.13 |
| Total Households | 3,662 (100.0%) | 2.11 |
Household Size by Marriage Status in Camden
Out of a total of 3,662 households in Camden, 2,037 (55.6%) are family households, while 1,625 (44.4%) are nonfamily households. The most numerous type of family households are 2-person households, comprising 1,013, and the most common type of nonfamily households are 1-person households, comprising 1,449.
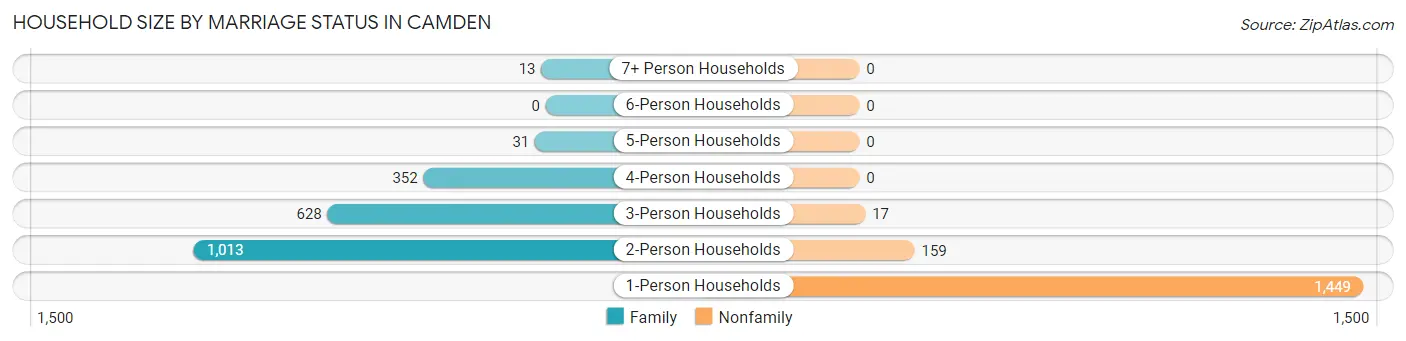
| Household Size | Family Households | Nonfamily Households |
| 1-Person Households | - | 1,449 (39.6%) |
| 2-Person Households | 1,013 (27.7%) | 159 (4.3%) |
| 3-Person Households | 628 (17.2%) | 17 (0.5%) |
| 4-Person Households | 352 (9.6%) | 0 (0.0%) |
| 5-Person Households | 31 (0.9%) | 0 (0.0%) |
| 6-Person Households | 0 (0.0%) | 0 (0.0%) |
| 7+ Person Households | 13 (0.4%) | 0 (0.0%) |
| Total | 2,037 (55.6%) | 1,625 (44.4%) |
Female Fertility in Camden
Fertility by Age in Camden
Average fertility rate in Camden is 59.0 births per 1,000 women. Women in the age bracket of 20 to 34 years have the highest fertility rate with 160.0 births per 1,000 women. Women in the age bracket of 20 to 34 years acount for 100.0% of all women with births.
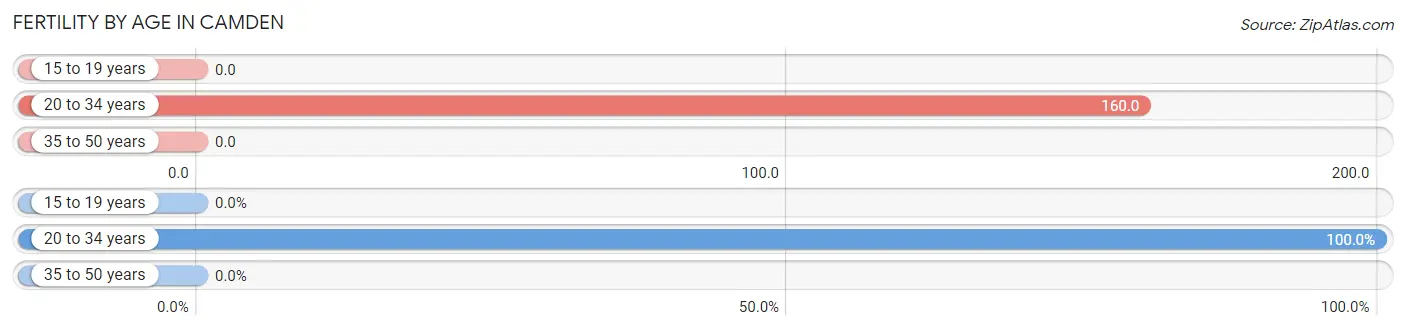
| Age Bracket | Women with Births | Births / 1,000 Women |
| 15 to 19 years | 0 (0.0%) | 0.0 |
| 20 to 34 years | 107 (100.0%) | 160.0 |
| 35 to 50 years | 0 (0.0%) | 0.0 |
| Total | 107 (100.0%) | 59.0 |
Fertility by Age by Marriage Status in Camden
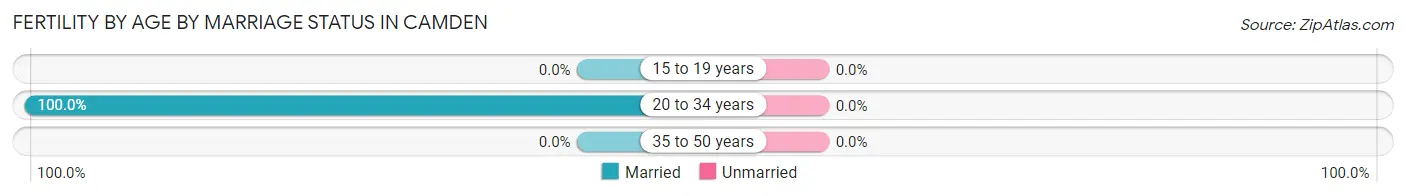
| Age Bracket | Married | Unmarried |
| 15 to 19 years | 0 (0.0%) | 0 (0.0%) |
| 20 to 34 years | 107 (100.0%) | 0 (0.0%) |
| 35 to 50 years | 0 (0.0%) | 0 (0.0%) |
| Total | 107 (100.0%) | 0 (0.0%) |
Fertility by Education in Camden
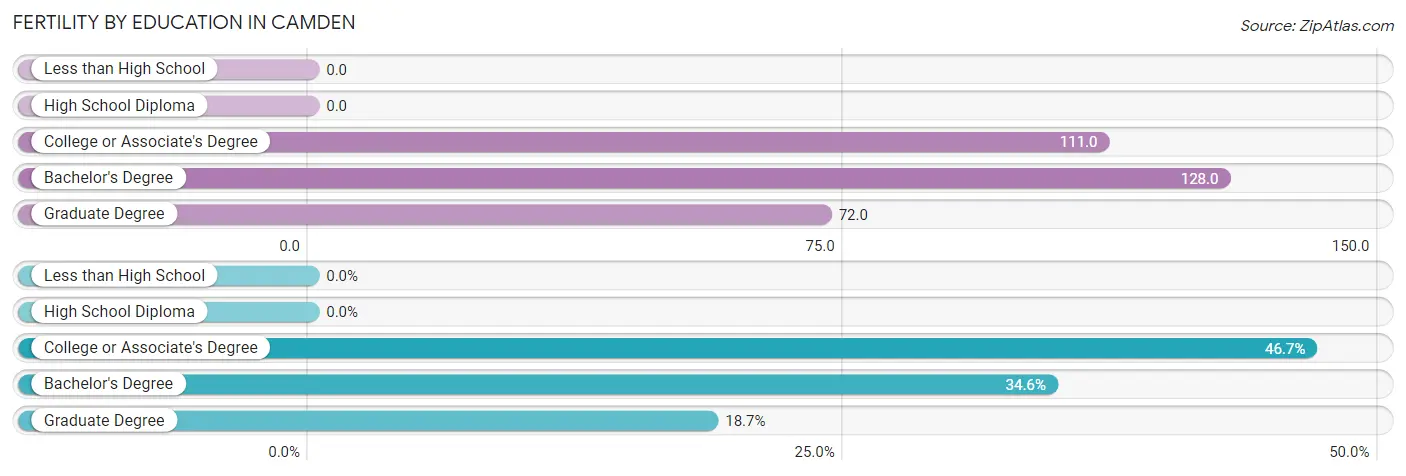
| Educational Attainment | Women with Births | Births / 1,000 Women |
| Less than High School | 0 (0.0%) | 0.0 |
| High School Diploma | 0 (0.0%) | 0.0 |
| College or Associate's Degree | 50 (46.7%) | 111.0 |
| Bachelor's Degree | 37 (34.6%) | 128.0 |
| Graduate Degree | 20 (18.7%) | 72.0 |
| Total | 107 (100.0%) | 59.0 |
Fertility by Education by Marriage Status in Camden
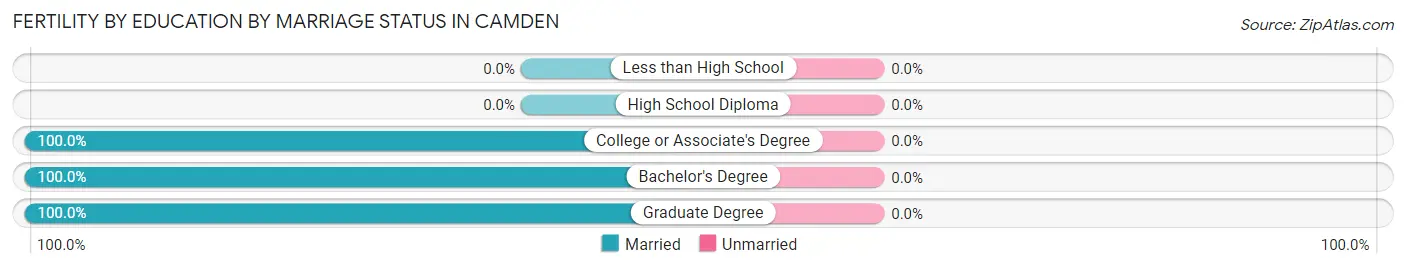
| Educational Attainment | Married | Unmarried |
| Less than High School | 0 (0.0%) | 0 (0.0%) |
| High School Diploma | 0 (0.0%) | 0 (0.0%) |
| College or Associate's Degree | 50 (100.0%) | 0 (0.0%) |
| Bachelor's Degree | 37 (100.0%) | 0 (0.0%) |
| Graduate Degree | 20 (100.0%) | 0 (0.0%) |
| Total | 107 (100.0%) | 0 (0.0%) |
Employment Characteristics in Camden
Employment by Class of Employer in Camden
Among the 3,578 employed individuals in Camden, private company employees (2,110 | 59.0%), local government employees (323 | 9.0%), and self-employed (not incorporated) (306 | 8.6%) make up the most common classes of employment.
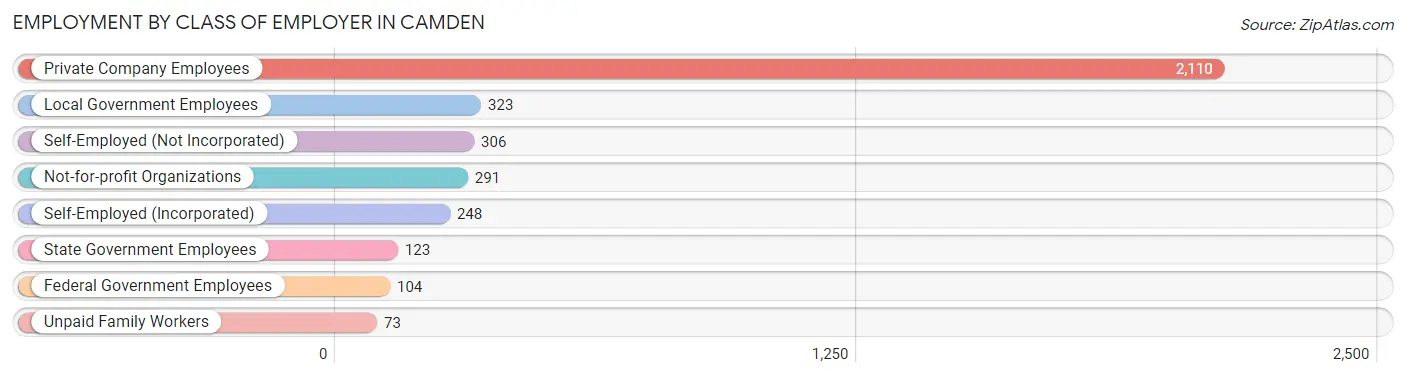
| Employer Class | # Employees | % Employees |
| Private Company Employees | 2,110 | 59.0% |
| Self-Employed (Incorporated) | 248 | 6.9% |
| Self-Employed (Not Incorporated) | 306 | 8.6% |
| Not-for-profit Organizations | 291 | 8.1% |
| Local Government Employees | 323 | 9.0% |
| State Government Employees | 123 | 3.4% |
| Federal Government Employees | 104 | 2.9% |
| Unpaid Family Workers | 73 | 2.0% |
| Total | 3,578 | 100.0% |
Employment Status by Age in Camden
According to the labor force statistics for Camden, out of the total population over 16 years of age (6,726), 55.5% or 3,733 individuals are in the labor force, with 3.0% or 112 of them unemployed. The age group with the highest labor force participation rate is 25 to 29 years, with 86.9% or 232 individuals in the labor force. Within the labor force, the 35 to 44 years age range has the highest percentage of unemployed individuals, with 8.5% or 98 of them being unemployed.
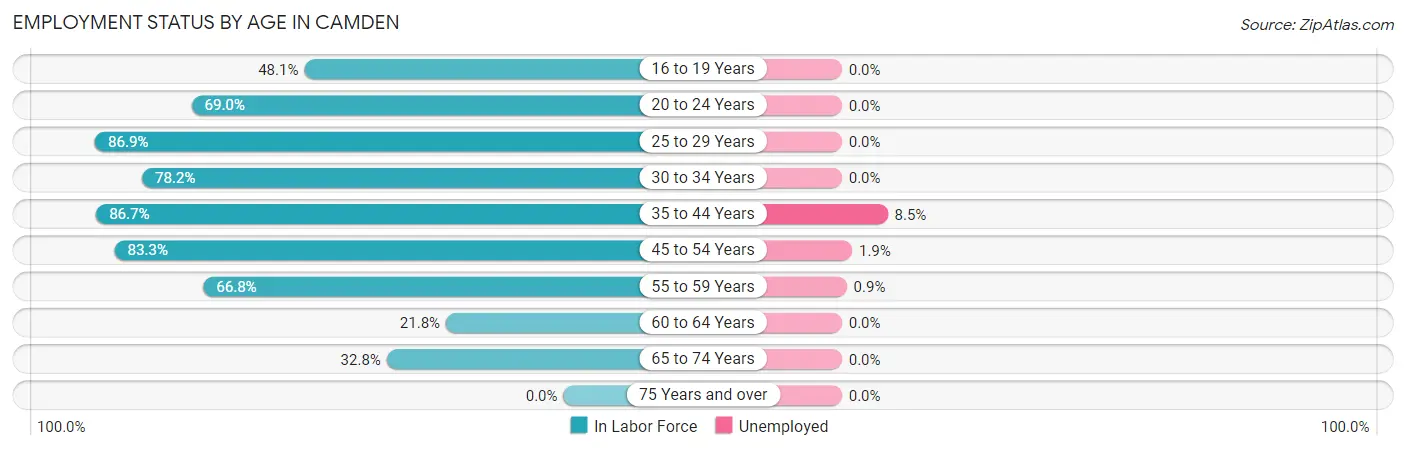
| Age Bracket | In Labor Force | Unemployed |
| 16 to 19 Years | 168 (48.1%) | 0 (0.0%) |
| 20 to 24 Years | 310 (69.0%) | 0 (0.0%) |
| 25 to 29 Years | 232 (86.9%) | 0 (0.0%) |
| 30 to 34 Years | 233 (78.2%) | 0 (0.0%) |
| 35 to 44 Years | 1,157 (86.7%) | 98 (8.5%) |
| 45 to 54 Years | 589 (83.3%) | 11 (1.9%) |
| 55 to 59 Years | 565 (66.8%) | 5 (0.9%) |
| 60 to 64 Years | 120 (21.8%) | 0 (0.0%) |
| 65 to 74 Years | 361 (32.8%) | 0 (0.0%) |
| 75 Years and over | 0 (0.0%) | 0 (0.0%) |
| Total | 3,733 (55.5%) | 112 (3.0%) |
Employment Status by Educational Attainment in Camden
According to labor force statistics for Camden, 72.3% of individuals (2,894) out of the total population between 25 and 64 years of age (4,003) are in the labor force, with 3.9% or 113 of them being unemployed. The group with the highest labor force participation rate are those with the educational attainment of bachelor's degree or higher, with 81.7% or 1,136 individuals in the labor force. Within the labor force, individuals with college / associate degree education have the highest percentage of unemployment, with 6.1% or 70 of them being unemployed.
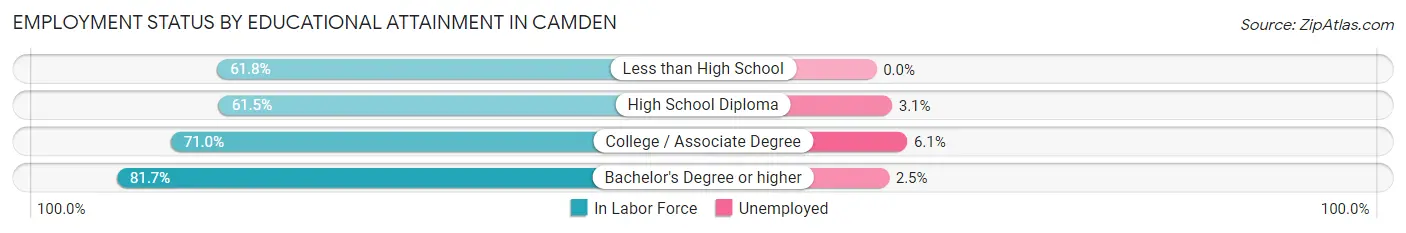
| Educational Attainment | In Labor Force | Unemployed |
| Less than High School | 102 (61.8%) | 0 (0.0%) |
| High School Diploma | 518 (61.5%) | 26 (3.1%) |
| College / Associate Degree | 1,140 (71.0%) | 98 (6.1%) |
| Bachelor's Degree or higher | 1,136 (81.7%) | 35 (2.5%) |
| Total | 2,894 (72.3%) | 156 (3.9%) |
Employment Occupations by Sex in Camden
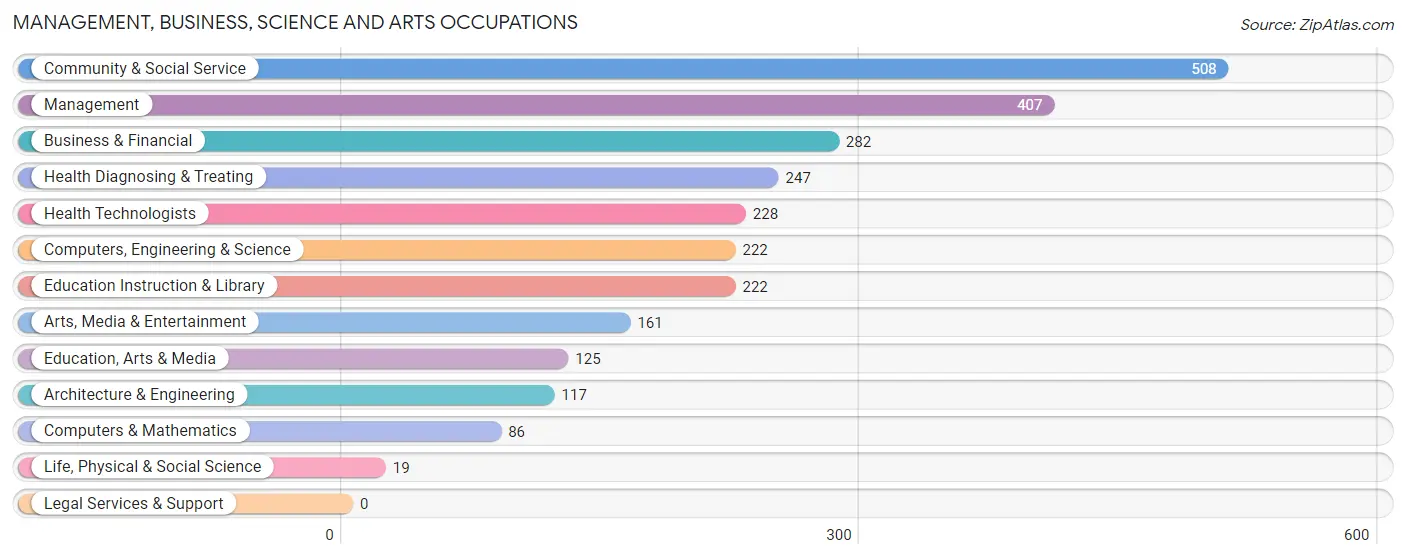
Management, Business, Science and Arts Occupations
The most common Management, Business, Science and Arts occupations in Camden are Community & Social Service (508 | 14.4%), Management (407 | 11.5%), Business & Financial (282 | 8.0%), Health Diagnosing & Treating (247 | 7.0%), and Health Technologists (228 | 6.5%).
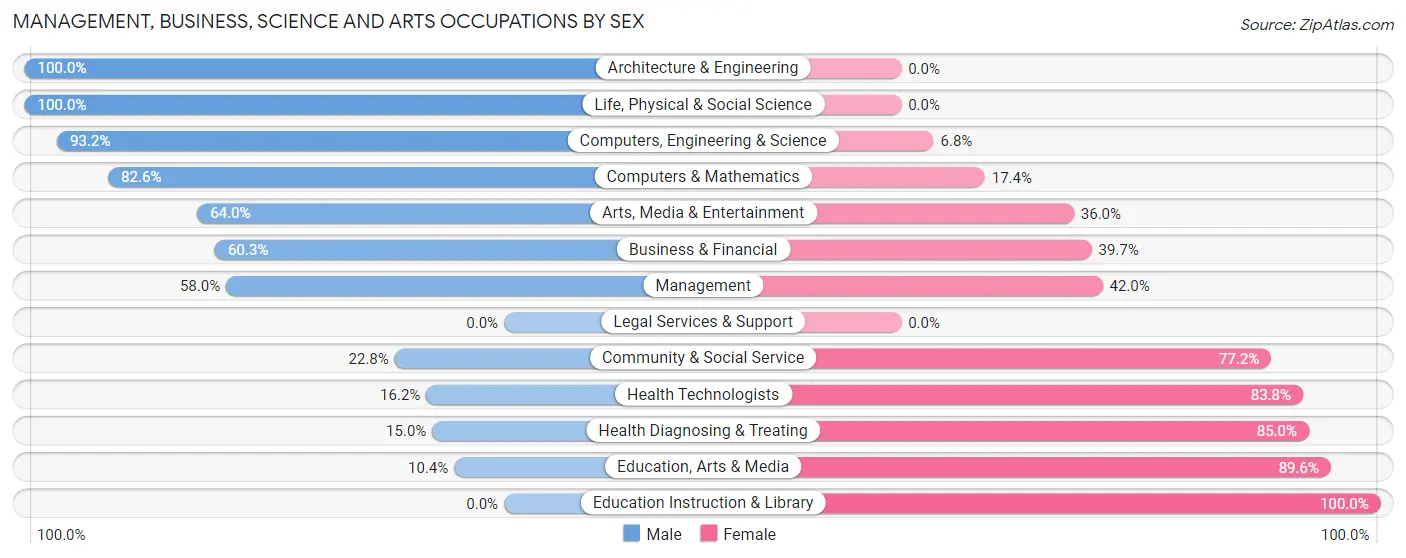
Management, Business, Science and Arts Occupations by Sex
Within the Management, Business, Science and Arts occupations in Camden, the most male-oriented occupations are Architecture & Engineering (100.0%), Life, Physical & Social Science (100.0%), and Computers, Engineering & Science (93.2%), while the most female-oriented occupations are Education Instruction & Library (100.0%), Education, Arts & Media (89.6%), and Health Diagnosing & Treating (85.0%).
| Occupation | Male | Female |
| Management | 236 (58.0%) | 171 (42.0%) |
| Business & Financial | 170 (60.3%) | 112 (39.7%) |
| Computers, Engineering & Science | 207 (93.2%) | 15 (6.8%) |
| Computers & Mathematics | 71 (82.6%) | 15 (17.4%) |
| Architecture & Engineering | 117 (100.0%) | 0 (0.0%) |
| Life, Physical & Social Science | 19 (100.0%) | 0 (0.0%) |
| Community & Social Service | 116 (22.8%) | 392 (77.2%) |
| Education, Arts & Media | 13 (10.4%) | 112 (89.6%) |
| Legal Services & Support | 0 (0.0%) | 0 (0.0%) |
| Education Instruction & Library | 0 (0.0%) | 222 (100.0%) |
| Arts, Media & Entertainment | 103 (64.0%) | 58 (36.0%) |
| Health Diagnosing & Treating | 37 (15.0%) | 210 (85.0%) |
| Health Technologists | 37 (16.2%) | 191 (83.8%) |
| Total (Category) | 766 (46.0%) | 900 (54.0%) |
| Total (Overall) | 1,821 (51.5%) | 1,716 (48.5%) |
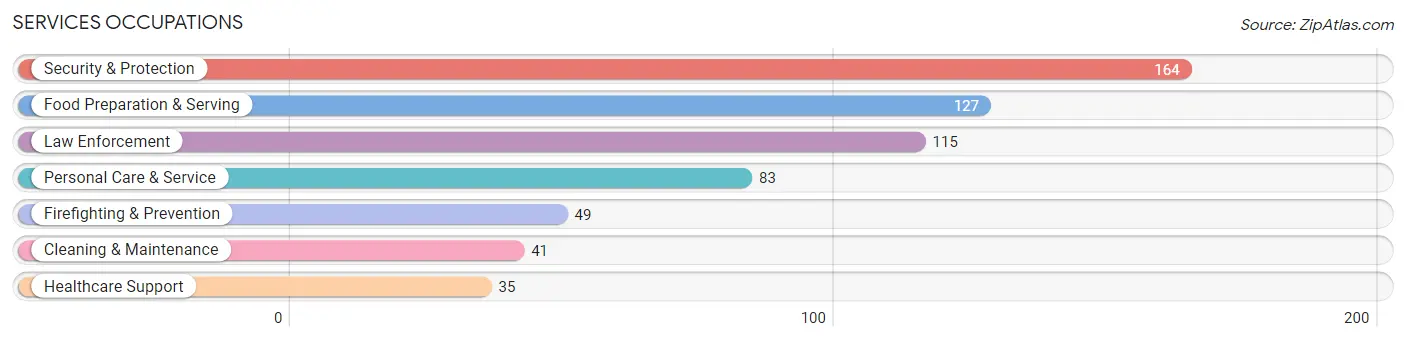
Services Occupations
The most common Services occupations in Camden are Security & Protection (164 | 4.6%), Food Preparation & Serving (127 | 3.6%), Law Enforcement (115 | 3.3%), Personal Care & Service (83 | 2.4%), and Firefighting & Prevention (49 | 1.4%).
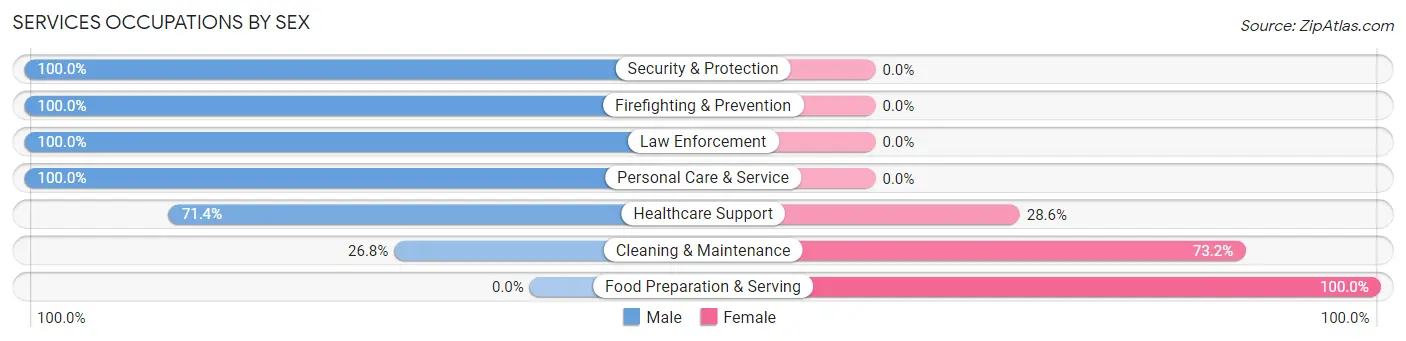
Services Occupations by Sex
Within the Services occupations in Camden, the most male-oriented occupations are Security & Protection (100.0%), Firefighting & Prevention (100.0%), and Law Enforcement (100.0%), while the most female-oriented occupations are Food Preparation & Serving (100.0%), Cleaning & Maintenance (73.2%), and Healthcare Support (28.6%).
| Occupation | Male | Female |
| Healthcare Support | 25 (71.4%) | 10 (28.6%) |
| Security & Protection | 164 (100.0%) | 0 (0.0%) |
| Firefighting & Prevention | 49 (100.0%) | 0 (0.0%) |
| Law Enforcement | 115 (100.0%) | 0 (0.0%) |
| Food Preparation & Serving | 0 (0.0%) | 127 (100.0%) |
| Cleaning & Maintenance | 11 (26.8%) | 30 (73.2%) |
| Personal Care & Service | 83 (100.0%) | 0 (0.0%) |
| Total (Category) | 283 (62.9%) | 167 (37.1%) |
| Total (Overall) | 1,821 (51.5%) | 1,716 (48.5%) |
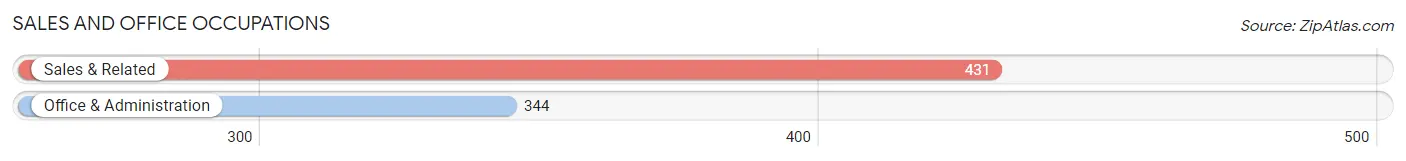
Sales and Office Occupations
The most common Sales and Office occupations in Camden are Sales & Related (431 | 12.2%), and Office & Administration (344 | 9.7%).
Sales and Office Occupations by Sex
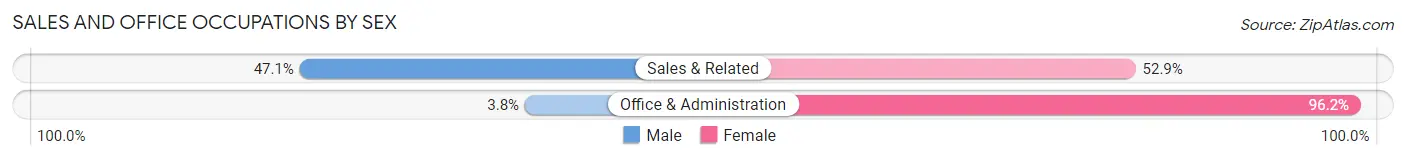
| Occupation | Male | Female |
| Sales & Related | 203 (47.1%) | 228 (52.9%) |
| Office & Administration | 13 (3.8%) | 331 (96.2%) |
| Total (Category) | 216 (27.9%) | 559 (72.1%) |
| Total (Overall) | 1,821 (51.5%) | 1,716 (48.5%) |
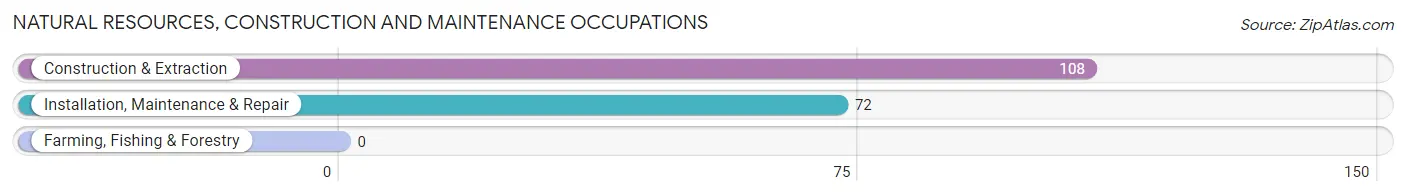
Natural Resources, Construction and Maintenance Occupations
The most common Natural Resources, Construction and Maintenance occupations in Camden are Construction & Extraction (108 | 3.0%), and Installation, Maintenance & Repair (72 | 2.0%).
Natural Resources, Construction and Maintenance Occupations by Sex
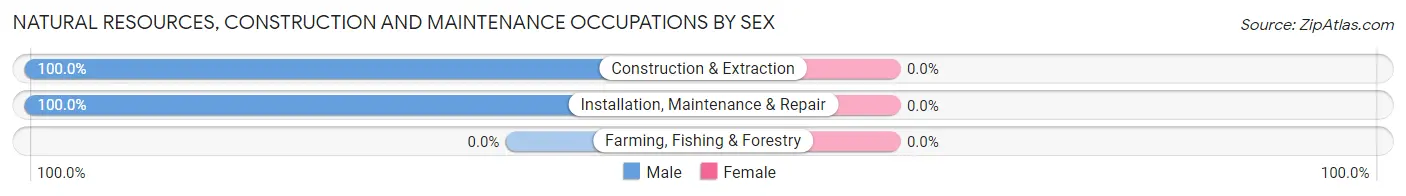
| Occupation | Male | Female |
| Farming, Fishing & Forestry | 0 (0.0%) | 0 (0.0%) |
| Construction & Extraction | 108 (100.0%) | 0 (0.0%) |
| Installation, Maintenance & Repair | 72 (100.0%) | 0 (0.0%) |
| Total (Category) | 180 (100.0%) | 0 (0.0%) |
| Total (Overall) | 1,821 (51.5%) | 1,716 (48.5%) |
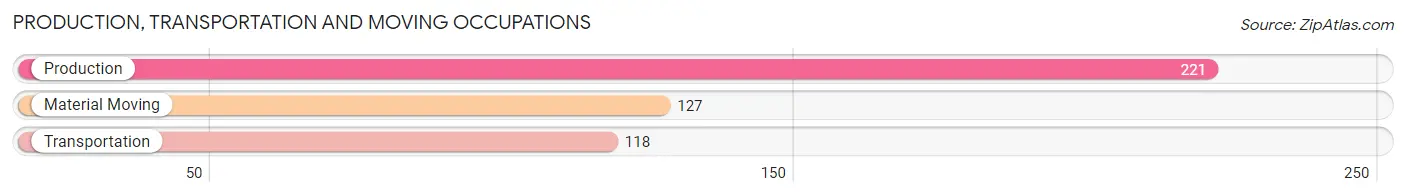
Production, Transportation and Moving Occupations
The most common Production, Transportation and Moving occupations in Camden are Production (221 | 6.2%), Material Moving (127 | 3.6%), and Transportation (118 | 3.3%).
Production, Transportation and Moving Occupations by Sex
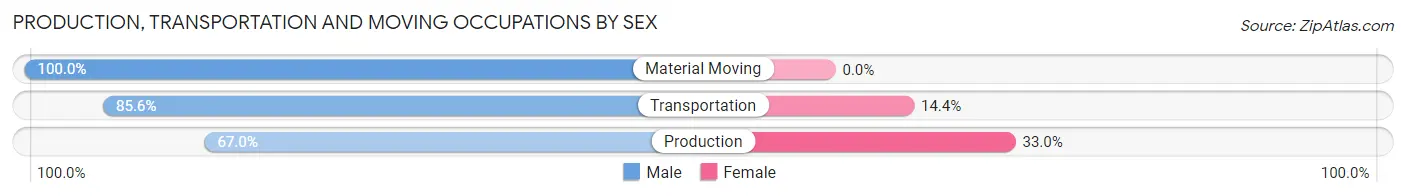
| Occupation | Male | Female |
| Production | 148 (67.0%) | 73 (33.0%) |
| Transportation | 101 (85.6%) | 17 (14.4%) |
| Material Moving | 127 (100.0%) | 0 (0.0%) |
| Total (Category) | 376 (80.7%) | 90 (19.3%) |
| Total (Overall) | 1,821 (51.5%) | 1,716 (48.5%) |
Employment Industries by Sex in Camden
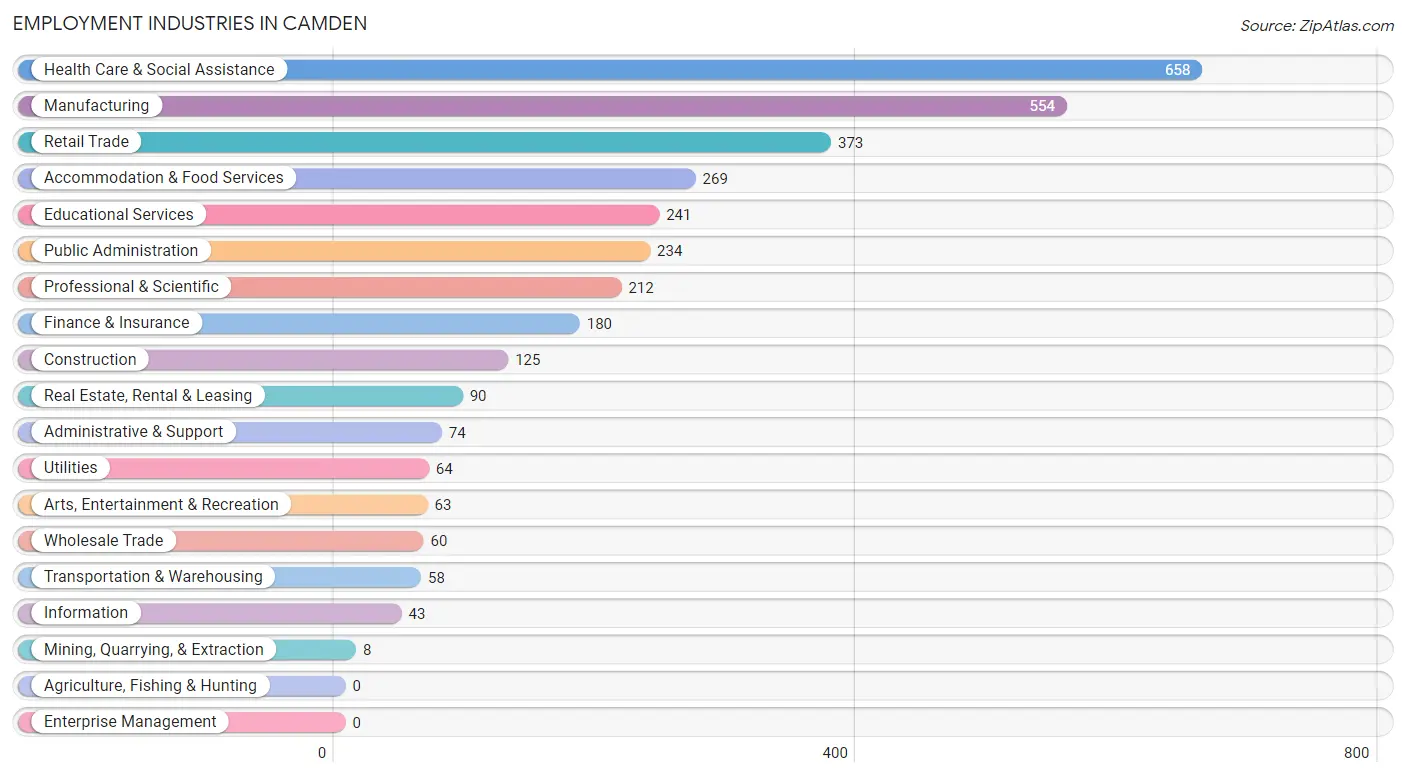
Employment Industries in Camden
The major employment industries in Camden include Health Care & Social Assistance (658 | 18.6%), Manufacturing (554 | 15.7%), Retail Trade (373 | 10.5%), Accommodation & Food Services (269 | 7.6%), and Educational Services (241 | 6.8%).
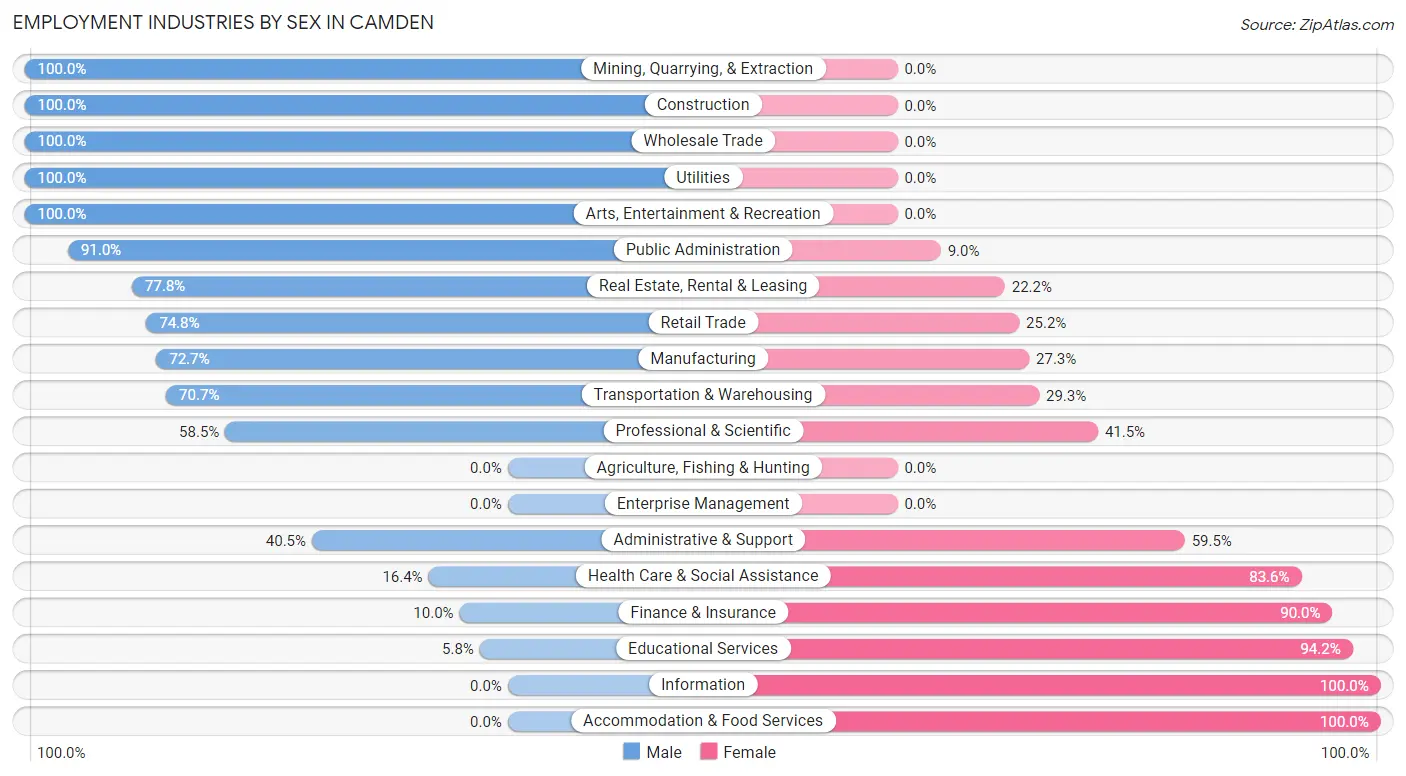
Employment Industries by Sex in Camden
The Camden industries that see more men than women are Mining, Quarrying, & Extraction (100.0%), Construction (100.0%), and Wholesale Trade (100.0%), whereas the industries that tend to have a higher number of women are Information (100.0%), Accommodation & Food Services (100.0%), and Educational Services (94.2%).
| Industry | Male | Female |
| Agriculture, Fishing & Hunting | 0 (0.0%) | 0 (0.0%) |
| Mining, Quarrying, & Extraction | 8 (100.0%) | 0 (0.0%) |
| Construction | 125 (100.0%) | 0 (0.0%) |
| Manufacturing | 403 (72.7%) | 151 (27.3%) |
| Wholesale Trade | 60 (100.0%) | 0 (0.0%) |
| Retail Trade | 279 (74.8%) | 94 (25.2%) |
| Transportation & Warehousing | 41 (70.7%) | 17 (29.3%) |
| Utilities | 64 (100.0%) | 0 (0.0%) |
| Information | 0 (0.0%) | 43 (100.0%) |
| Finance & Insurance | 18 (10.0%) | 162 (90.0%) |
| Real Estate, Rental & Leasing | 70 (77.8%) | 20 (22.2%) |
| Professional & Scientific | 124 (58.5%) | 88 (41.5%) |
| Enterprise Management | 0 (0.0%) | 0 (0.0%) |
| Administrative & Support | 30 (40.5%) | 44 (59.5%) |
| Educational Services | 14 (5.8%) | 227 (94.2%) |
| Health Care & Social Assistance | 108 (16.4%) | 550 (83.6%) |
| Arts, Entertainment & Recreation | 63 (100.0%) | 0 (0.0%) |
| Accommodation & Food Services | 0 (0.0%) | 269 (100.0%) |
| Public Administration | 213 (91.0%) | 21 (9.0%) |
| Total | 1,821 (51.5%) | 1,716 (48.5%) |
Education in Camden
School Enrollment in Camden
The most common levels of schooling among the 1,397 students in Camden are high school (341 | 24.4%), college / undergraduate (297 | 21.3%), and middle school (268 | 19.2%).
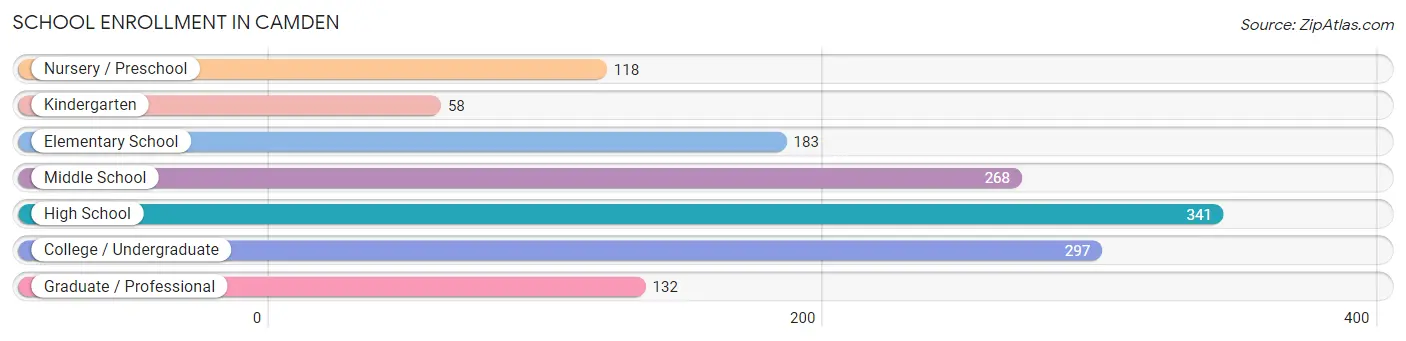
| School Level | # Students | % Students |
| Nursery / Preschool | 118 | 8.5% |
| Kindergarten | 58 | 4.2% |
| Elementary School | 183 | 13.1% |
| Middle School | 268 | 19.2% |
| High School | 341 | 24.4% |
| College / Undergraduate | 297 | 21.3% |
| Graduate / Professional | 132 | 9.5% |
| Total | 1,397 | 100.0% |
School Enrollment by Age by Funding Source in Camden
Out of a total of 1,397 students who are enrolled in schools in Camden, 365 (26.1%) attend a private institution, while the remaining 1,032 (73.9%) are enrolled in public schools. The age group of 3 to 4 year olds has the highest likelihood of being enrolled in private schools, with 118 (100.0% in the age bracket) enrolled. Conversely, the age group of 15 to 17 year olds has the lowest likelihood of being enrolled in a private school, with 291 (92.7% in the age bracket) attending a public institution.
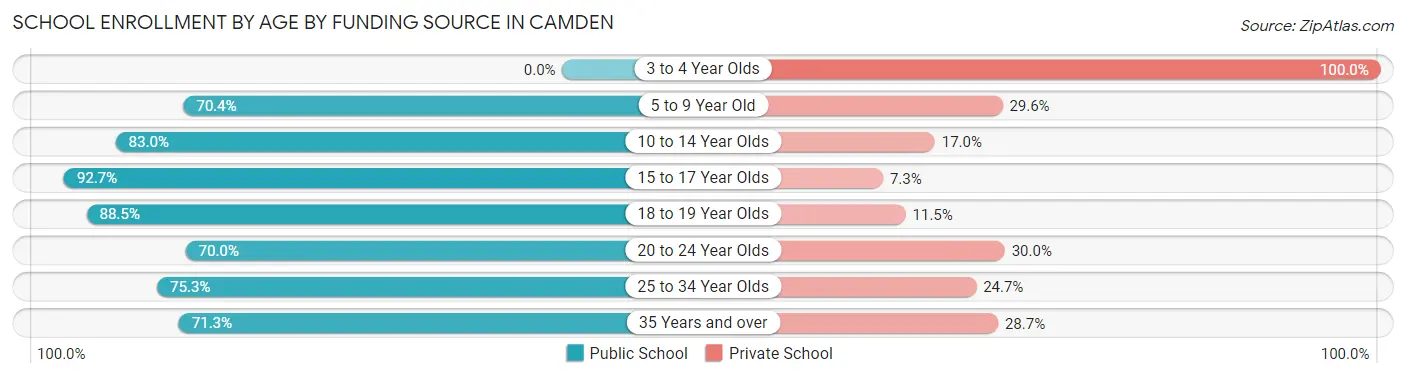
| Age Bracket | Public School | Private School |
| 3 to 4 Year Olds | 0 (0.0%) | 118 (100.0%) |
| 5 to 9 Year Old | 131 (70.4%) | 55 (29.6%) |
| 10 to 14 Year Olds | 274 (83.0%) | 56 (17.0%) |
| 15 to 17 Year Olds | 291 (92.7%) | 23 (7.3%) |
| 18 to 19 Year Olds | 69 (88.5%) | 9 (11.5%) |
| 20 to 24 Year Olds | 28 (70.0%) | 12 (30.0%) |
| 25 to 34 Year Olds | 58 (75.3%) | 19 (24.7%) |
| 35 Years and over | 181 (71.3%) | 73 (28.7%) |
| Total | 1,032 (73.9%) | 365 (26.1%) |
Educational Attainment by Field of Study in Camden
Business (381 | 17.8%), education (276 | 12.9%), science & technology (224 | 10.5%), social sciences (214 | 10.0%), and literature & languages (168 | 7.9%) are the most common fields of study among 2,138 individuals in Camden who have obtained a bachelor's degree or higher.
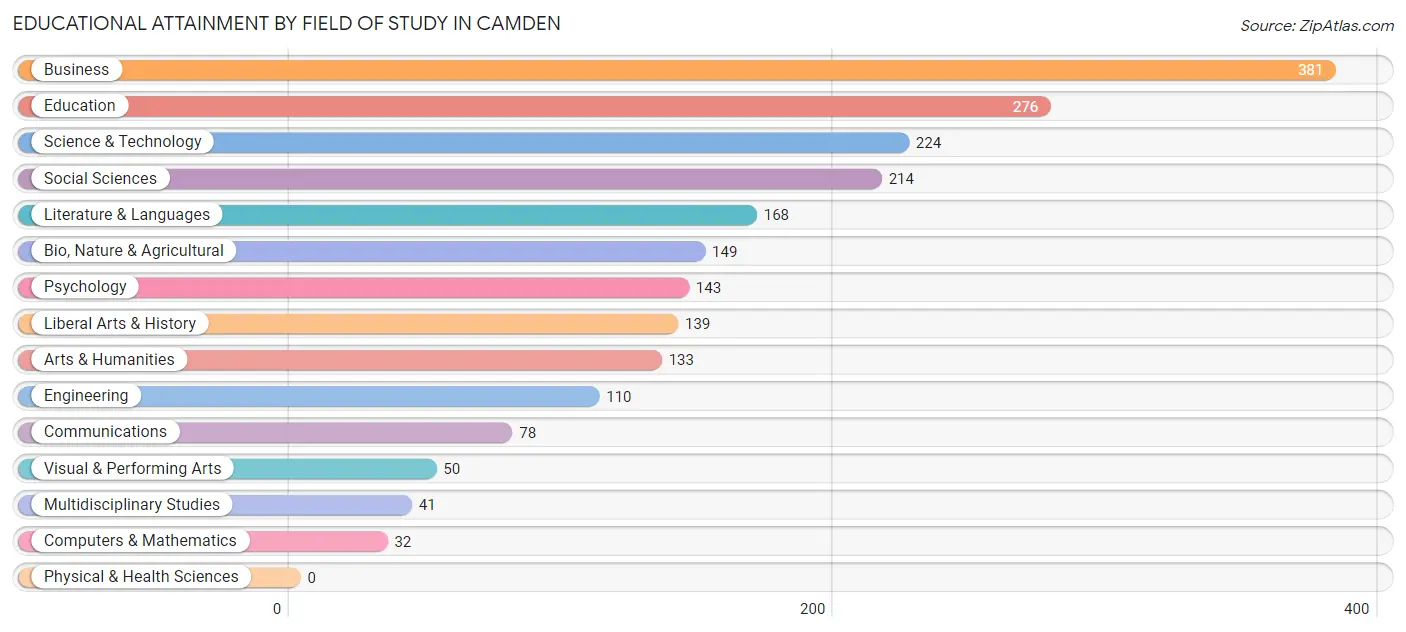
| Field of Study | # Graduates | % Graduates |
| Computers & Mathematics | 32 | 1.5% |
| Bio, Nature & Agricultural | 149 | 7.0% |
| Physical & Health Sciences | 0 | 0.0% |
| Psychology | 143 | 6.7% |
| Social Sciences | 214 | 10.0% |
| Engineering | 110 | 5.1% |
| Multidisciplinary Studies | 41 | 1.9% |
| Science & Technology | 224 | 10.5% |
| Business | 381 | 17.8% |
| Education | 276 | 12.9% |
| Literature & Languages | 168 | 7.9% |
| Liberal Arts & History | 139 | 6.5% |
| Visual & Performing Arts | 50 | 2.3% |
| Communications | 78 | 3.6% |
| Arts & Humanities | 133 | 6.2% |
| Total | 2,138 | 100.0% |
Transportation & Commute in Camden
Vehicle Availability by Sex in Camden
The most prevalent vehicle ownership categories in Camden are males with 2 vehicles (777, accounting for 41.6%) and females with 2 vehicles (517, making up 45.7%).
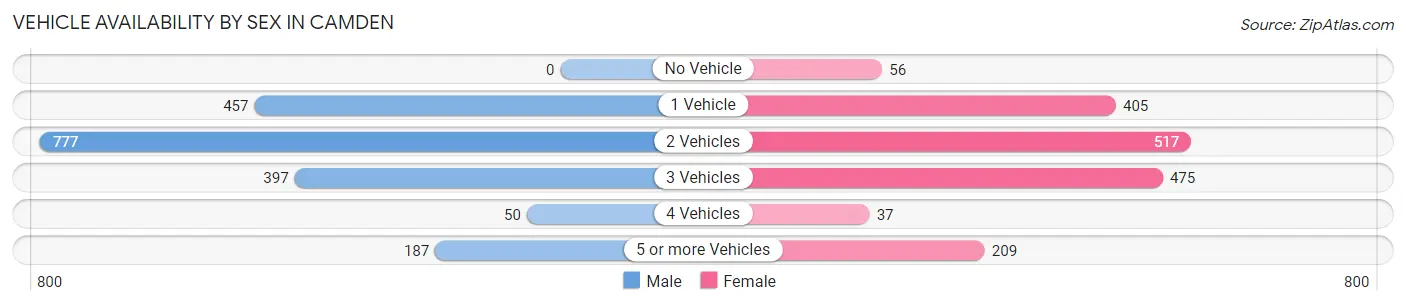
| Vehicles Available | Male | Female |
| No Vehicle | 0 (0.0%) | 56 (3.3%) |
| 1 Vehicle | 457 (24.5%) | 405 (23.8%) |
| 2 Vehicles | 777 (41.6%) | 517 (30.4%) |
| 3 Vehicles | 397 (21.2%) | 475 (28.0%) |
| 4 Vehicles | 50 (2.7%) | 37 (2.2%) |
| 5 or more Vehicles | 187 (10.0%) | 209 (12.3%) |
| Total | 1,868 (100.0%) | 1,699 (100.0%) |
Commute Time in Camden
The most frequently occuring commute durations in Camden are 45 to 59 minutes (671 commuters, 20.3%), 15 to 19 minutes (529 commuters, 16.0%), and 5 to 9 minutes (509 commuters, 15.4%).
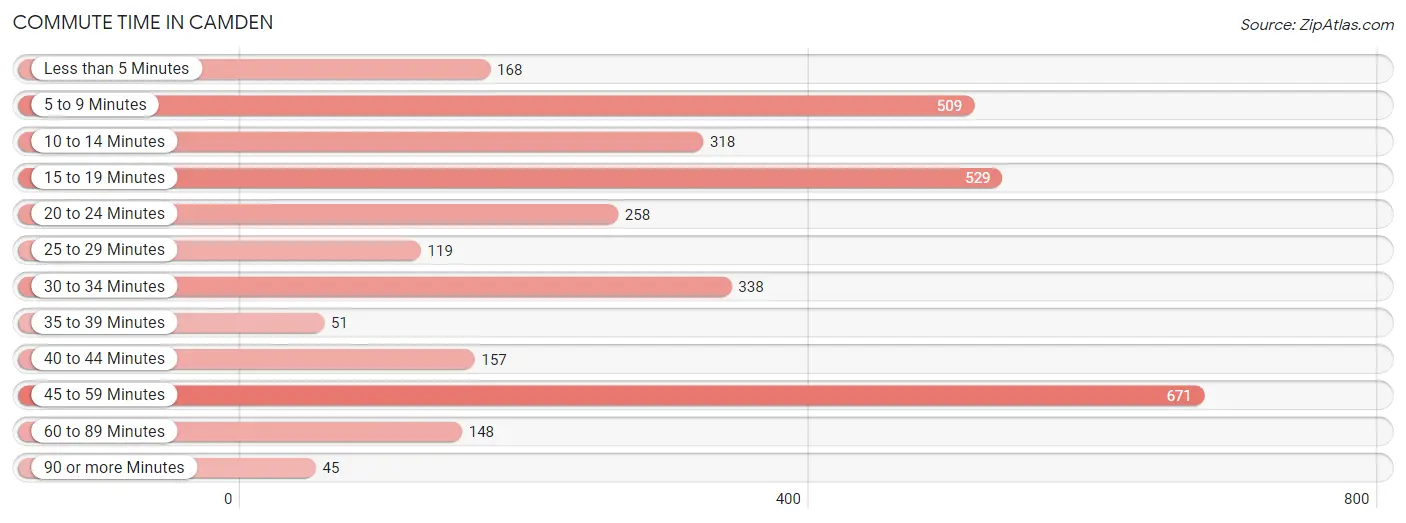
| Commute Time | # Commuters | % Commuters |
| Less than 5 Minutes | 168 | 5.1% |
| 5 to 9 Minutes | 509 | 15.4% |
| 10 to 14 Minutes | 318 | 9.6% |
| 15 to 19 Minutes | 529 | 16.0% |
| 20 to 24 Minutes | 258 | 7.8% |
| 25 to 29 Minutes | 119 | 3.6% |
| 30 to 34 Minutes | 338 | 10.2% |
| 35 to 39 Minutes | 51 | 1.5% |
| 40 to 44 Minutes | 157 | 4.7% |
| 45 to 59 Minutes | 671 | 20.3% |
| 60 to 89 Minutes | 148 | 4.5% |
| 90 or more Minutes | 45 | 1.4% |
Commute Time by Sex in Camden
The most common commute times in Camden are 45 to 59 minutes (477 commuters, 27.7%) for males and 5 to 9 minutes (338 commuters, 21.3%) for females.
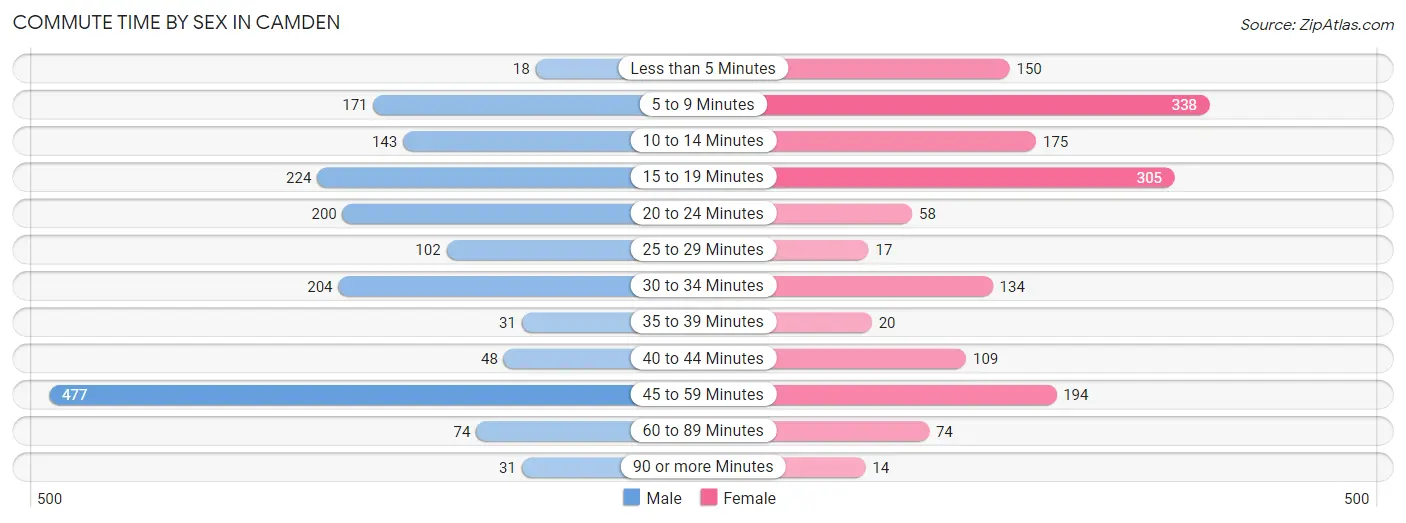
| Commute Time | Male | Female |
| Less than 5 Minutes | 18 (1.0%) | 150 (9.5%) |
| 5 to 9 Minutes | 171 (9.9%) | 338 (21.3%) |
| 10 to 14 Minutes | 143 (8.3%) | 175 (11.0%) |
| 15 to 19 Minutes | 224 (13.0%) | 305 (19.2%) |
| 20 to 24 Minutes | 200 (11.6%) | 58 (3.6%) |
| 25 to 29 Minutes | 102 (5.9%) | 17 (1.1%) |
| 30 to 34 Minutes | 204 (11.8%) | 134 (8.4%) |
| 35 to 39 Minutes | 31 (1.8%) | 20 (1.3%) |
| 40 to 44 Minutes | 48 (2.8%) | 109 (6.9%) |
| 45 to 59 Minutes | 477 (27.7%) | 194 (12.2%) |
| 60 to 89 Minutes | 74 (4.3%) | 74 (4.7%) |
| 90 or more Minutes | 31 (1.8%) | 14 (0.9%) |
Time of Departure to Work by Sex in Camden
The most frequent times of departure to work in Camden are 6:00 AM to 6:29 AM (309, 17.9%) for males and 6:30 AM to 6:59 AM (277, 17.4%) for females.
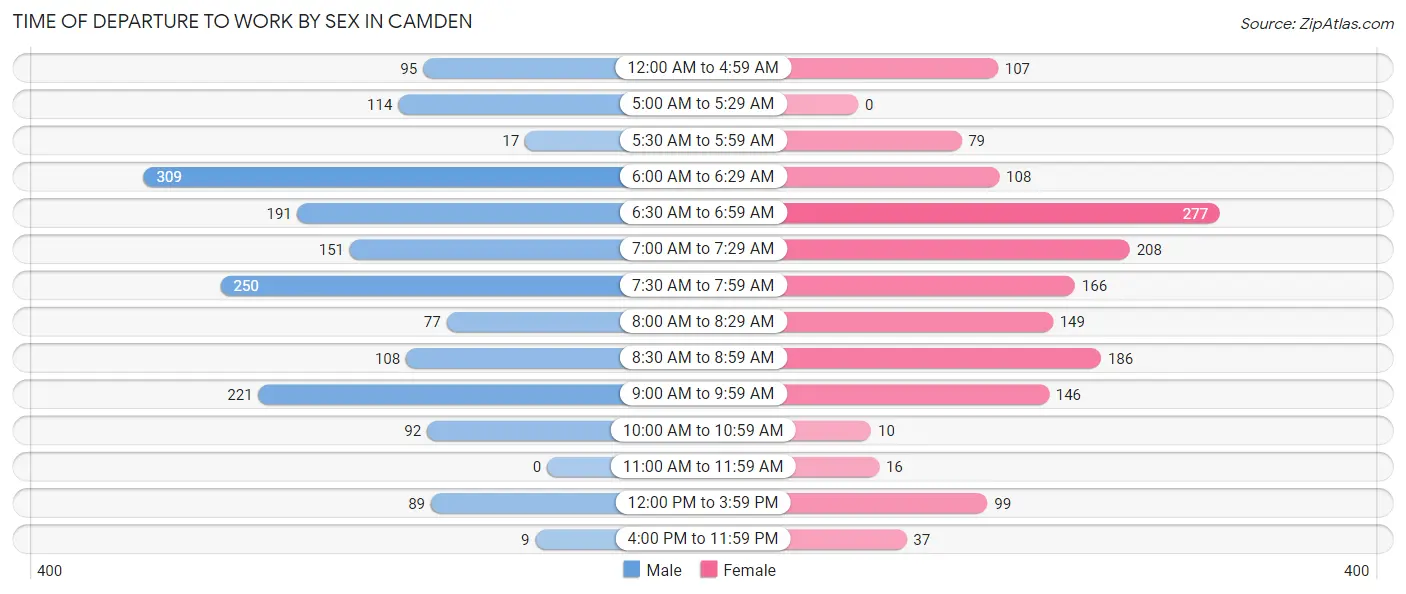
| Time of Departure | Male | Female |
| 12:00 AM to 4:59 AM | 95 (5.5%) | 107 (6.7%) |
| 5:00 AM to 5:29 AM | 114 (6.6%) | 0 (0.0%) |
| 5:30 AM to 5:59 AM | 17 (1.0%) | 79 (5.0%) |
| 6:00 AM to 6:29 AM | 309 (17.9%) | 108 (6.8%) |
| 6:30 AM to 6:59 AM | 191 (11.1%) | 277 (17.4%) |
| 7:00 AM to 7:29 AM | 151 (8.8%) | 208 (13.1%) |
| 7:30 AM to 7:59 AM | 250 (14.5%) | 166 (10.4%) |
| 8:00 AM to 8:29 AM | 77 (4.5%) | 149 (9.4%) |
| 8:30 AM to 8:59 AM | 108 (6.3%) | 186 (11.7%) |
| 9:00 AM to 9:59 AM | 221 (12.8%) | 146 (9.2%) |
| 10:00 AM to 10:59 AM | 92 (5.3%) | 10 (0.6%) |
| 11:00 AM to 11:59 AM | 0 (0.0%) | 16 (1.0%) |
| 12:00 PM to 3:59 PM | 89 (5.2%) | 99 (6.2%) |
| 4:00 PM to 11:59 PM | 9 (0.5%) | 37 (2.3%) |
| Total | 1,723 (100.0%) | 1,588 (100.0%) |
Housing Occupancy in Camden
Occupancy by Ownership in Camden
Of the total 3,662 dwellings in Camden, owner-occupied units account for 2,618 (71.5%), while renter-occupied units make up 1,044 (28.5%).
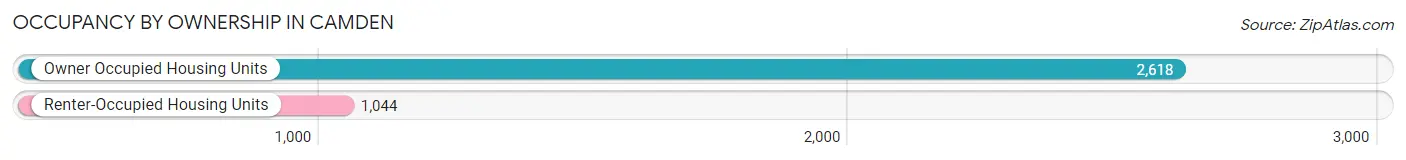
| Occupancy | # Housing Units | % Housing Units |
| Owner Occupied Housing Units | 2,618 | 71.5% |
| Renter-Occupied Housing Units | 1,044 | 28.5% |
| Total Occupied Housing Units | 3,662 | 100.0% |
Occupancy by Household Size in Camden
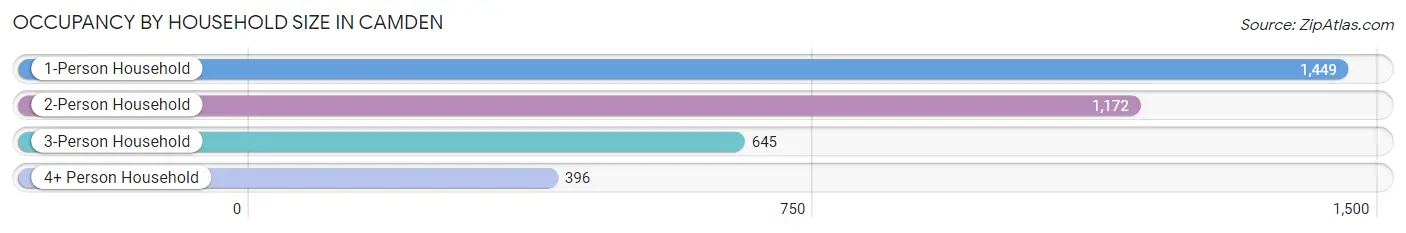
| Household Size | # Housing Units | % Housing Units |
| 1-Person Household | 1,449 | 39.6% |
| 2-Person Household | 1,172 | 32.0% |
| 3-Person Household | 645 | 17.6% |
| 4+ Person Household | 396 | 10.8% |
| Total Housing Units | 3,662 | 100.0% |
Occupancy by Ownership by Household Size in Camden
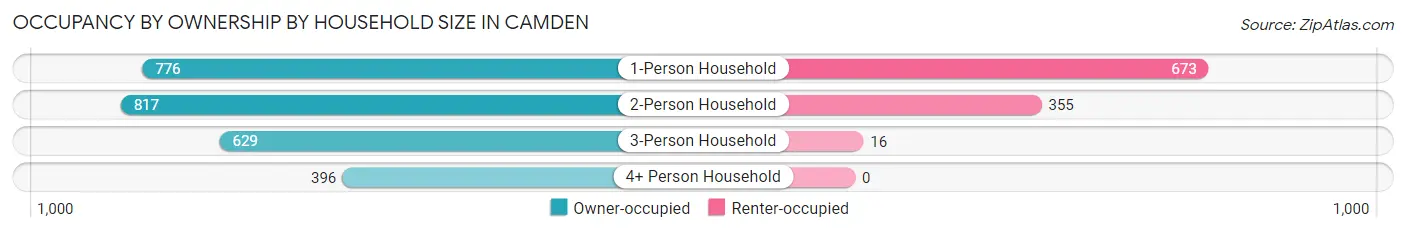
| Household Size | Owner-occupied | Renter-occupied |
| 1-Person Household | 776 (53.5%) | 673 (46.5%) |
| 2-Person Household | 817 (69.7%) | 355 (30.3%) |
| 3-Person Household | 629 (97.5%) | 16 (2.5%) |
| 4+ Person Household | 396 (100.0%) | 0 (0.0%) |
| Total Housing Units | 2,618 (71.5%) | 1,044 (28.5%) |
Occupancy by Educational Attainment in Camden
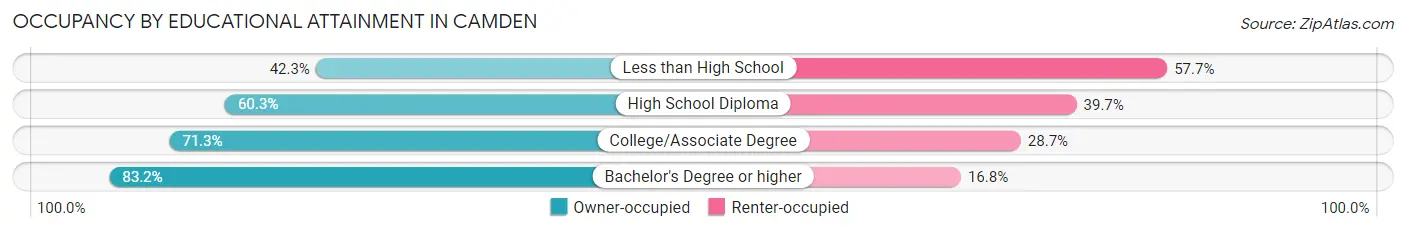
| Household Size | Owner-occupied | Renter-occupied |
| Less than High School | 85 (42.3%) | 116 (57.7%) |
| High School Diploma | 420 (60.3%) | 277 (39.7%) |
| College/Associate Degree | 1,118 (71.3%) | 450 (28.7%) |
| Bachelor's Degree or higher | 995 (83.2%) | 201 (16.8%) |
Occupancy by Age of Householder in Camden
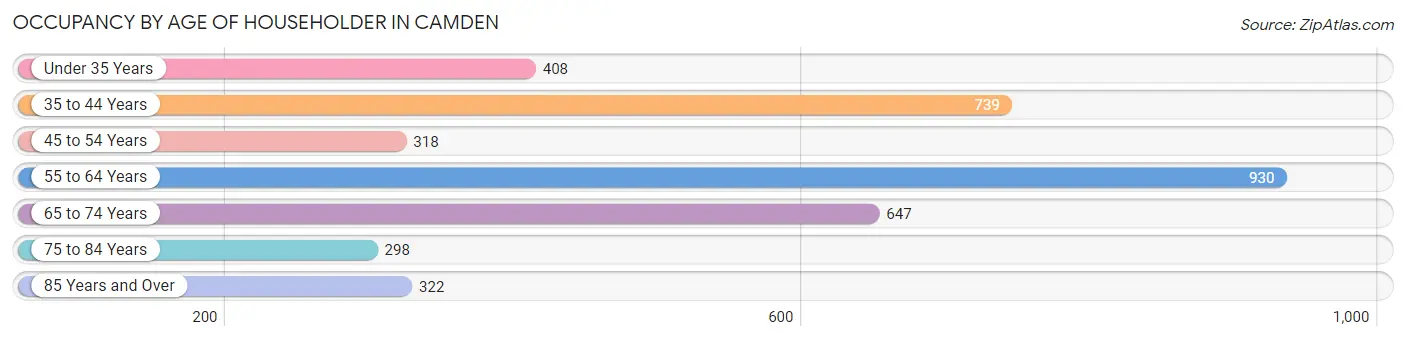
| Age Bracket | # Households | % Households |
| Under 35 Years | 408 | 11.1% |
| 35 to 44 Years | 739 | 20.2% |
| 45 to 54 Years | 318 | 8.7% |
| 55 to 64 Years | 930 | 25.4% |
| 65 to 74 Years | 647 | 17.7% |
| 75 to 84 Years | 298 | 8.1% |
| 85 Years and Over | 322 | 8.8% |
| Total | 3,662 | 100.0% |
Housing Finances in Camden
Median Income by Occupancy in Camden
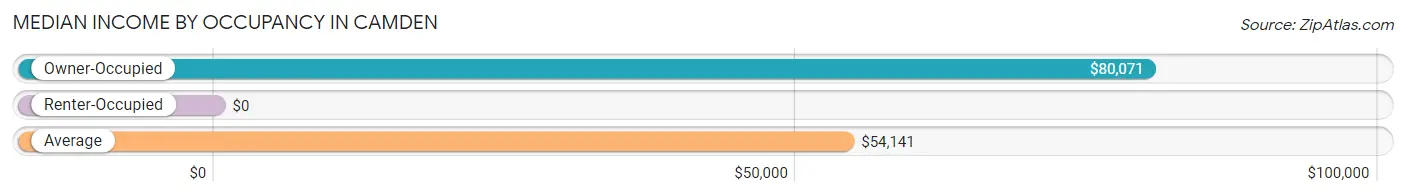
| Occupancy Type | # Households | Median Income |
| Owner-Occupied | 2,618 (71.5%) | $80,071 |
| Renter-Occupied | 1,044 (28.5%) | $0 |
| Average | 3,662 (100.0%) | $54,141 |
Occupancy by Householder Income Bracket in Camden
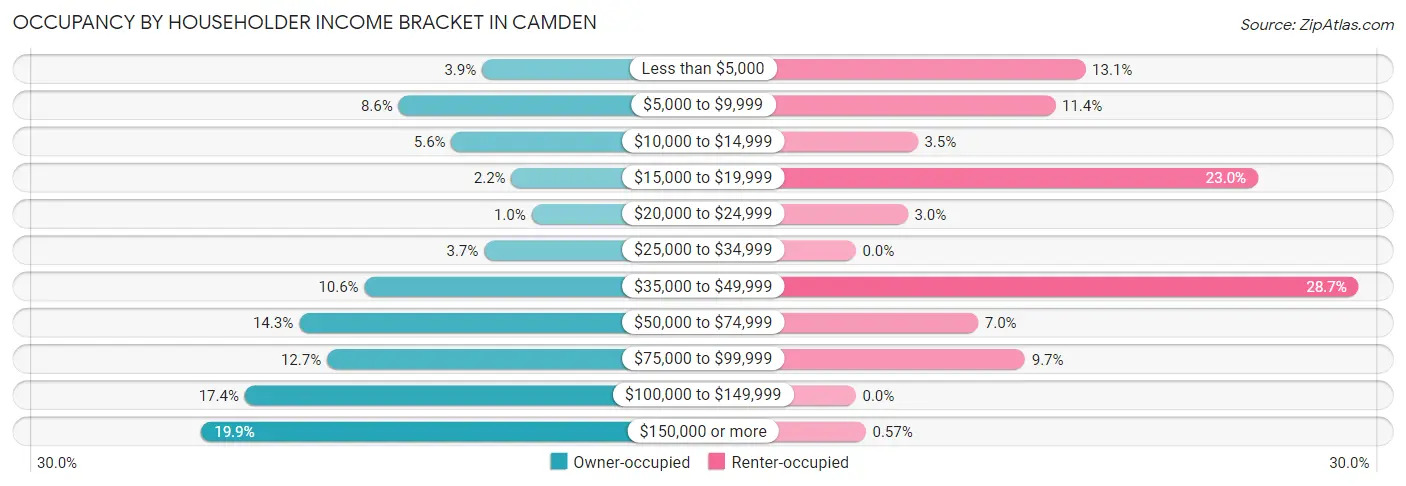
| Income Bracket | Owner-occupied | Renter-occupied |
| Less than $5,000 | 101 (3.9%) | 137 (13.1%) |
| $5,000 to $9,999 | 226 (8.6%) | 119 (11.4%) |
| $10,000 to $14,999 | 147 (5.6%) | 37 (3.5%) |
| $15,000 to $19,999 | 57 (2.2%) | 240 (23.0%) |
| $20,000 to $24,999 | 27 (1.0%) | 31 (3.0%) |
| $25,000 to $34,999 | 98 (3.7%) | 0 (0.0%) |
| $35,000 to $49,999 | 277 (10.6%) | 300 (28.7%) |
| $50,000 to $74,999 | 375 (14.3%) | 73 (7.0%) |
| $75,000 to $99,999 | 333 (12.7%) | 101 (9.7%) |
| $100,000 to $149,999 | 456 (17.4%) | 0 (0.0%) |
| $150,000 or more | 521 (19.9%) | 6 (0.6%) |
| Total | 2,618 (100.0%) | 1,044 (100.0%) |
Monthly Housing Cost Tiers in Camden
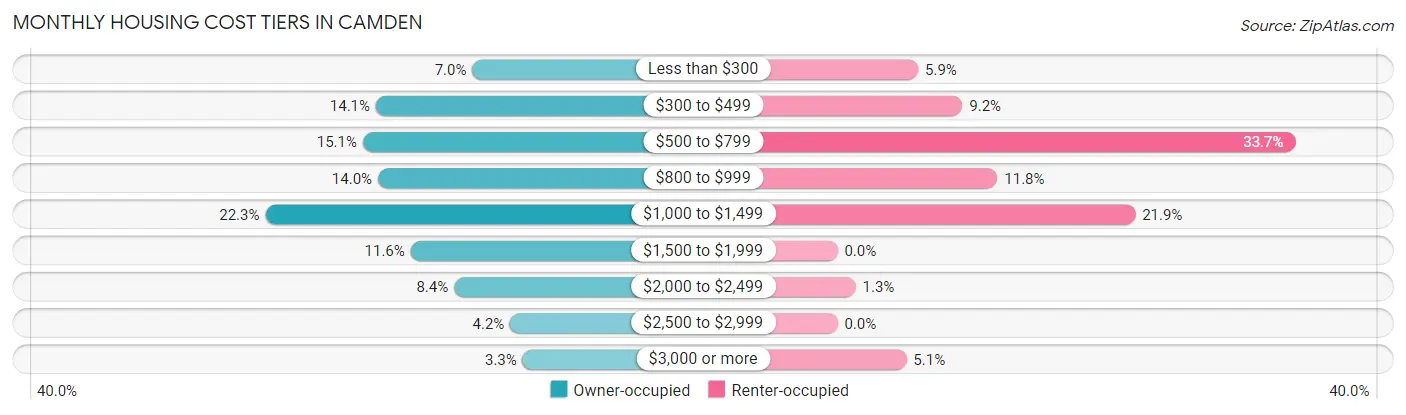
| Monthly Cost | Owner-occupied | Renter-occupied |
| Less than $300 | 184 (7.0%) | 62 (5.9%) |
| $300 to $499 | 370 (14.1%) | 96 (9.2%) |
| $500 to $799 | 395 (15.1%) | 352 (33.7%) |
| $800 to $999 | 366 (14.0%) | 123 (11.8%) |
| $1,000 to $1,499 | 583 (22.3%) | 229 (21.9%) |
| $1,500 to $1,999 | 303 (11.6%) | 0 (0.0%) |
| $2,000 to $2,499 | 219 (8.4%) | 14 (1.3%) |
| $2,500 to $2,999 | 111 (4.2%) | 0 (0.0%) |
| $3,000 or more | 87 (3.3%) | 53 (5.1%) |
| Total | 2,618 (100.0%) | 1,044 (100.0%) |
Physical Housing Characteristics in Camden
Housing Structures in Camden
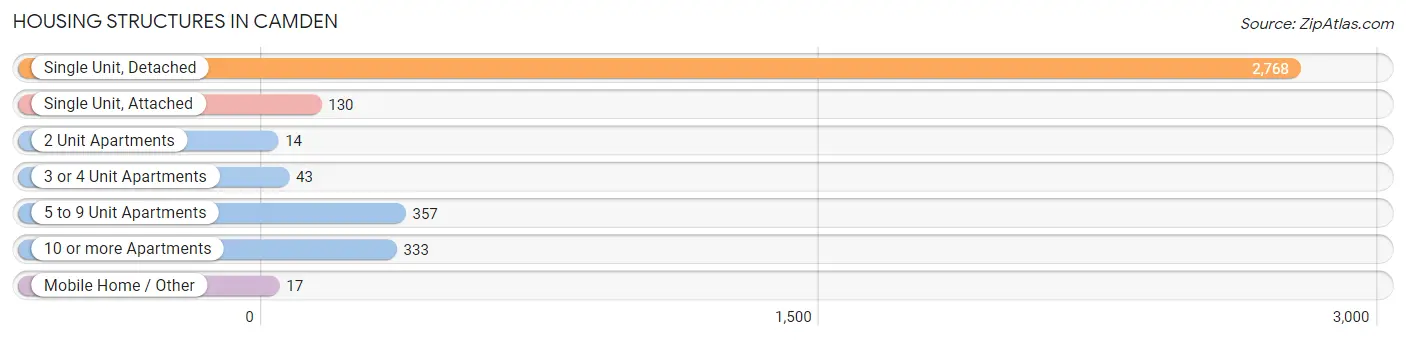
| Structure Type | # Housing Units | % Housing Units |
| Single Unit, Detached | 2,768 | 75.6% |
| Single Unit, Attached | 130 | 3.5% |
| 2 Unit Apartments | 14 | 0.4% |
| 3 or 4 Unit Apartments | 43 | 1.2% |
| 5 to 9 Unit Apartments | 357 | 9.8% |
| 10 or more Apartments | 333 | 9.1% |
| Mobile Home / Other | 17 | 0.5% |
| Total | 3,662 | 100.0% |
Housing Structures by Occupancy in Camden
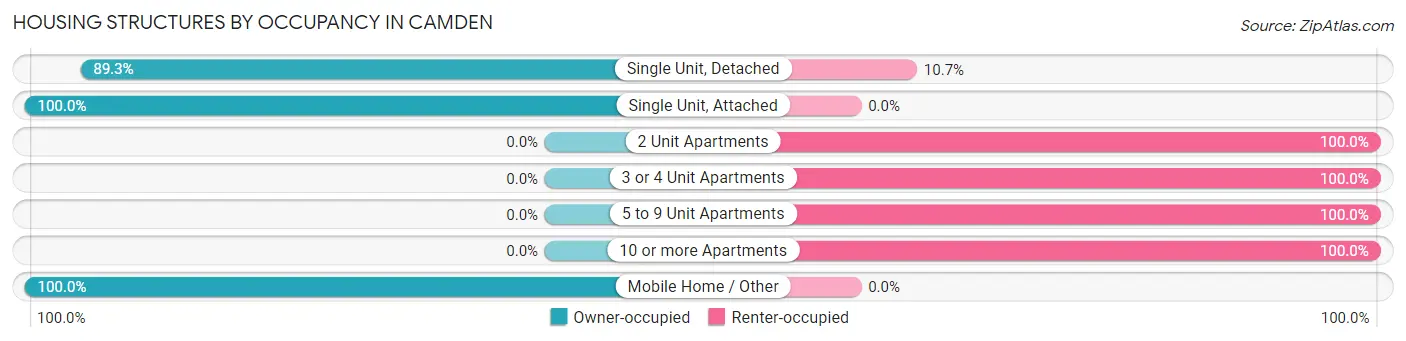
| Structure Type | Owner-occupied | Renter-occupied |
| Single Unit, Detached | 2,471 (89.3%) | 297 (10.7%) |
| Single Unit, Attached | 130 (100.0%) | 0 (0.0%) |
| 2 Unit Apartments | 0 (0.0%) | 14 (100.0%) |
| 3 or 4 Unit Apartments | 0 (0.0%) | 43 (100.0%) |
| 5 to 9 Unit Apartments | 0 (0.0%) | 357 (100.0%) |
| 10 or more Apartments | 0 (0.0%) | 333 (100.0%) |
| Mobile Home / Other | 17 (100.0%) | 0 (0.0%) |
| Total | 2,618 (71.5%) | 1,044 (28.5%) |
Housing Structures by Number of Rooms in Camden
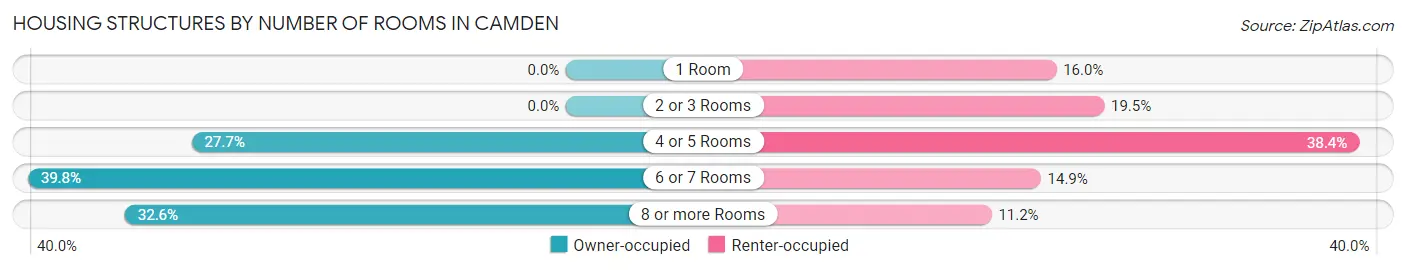
| Number of Rooms | Owner-occupied | Renter-occupied |
| 1 Room | 0 (0.0%) | 167 (16.0%) |
| 2 or 3 Rooms | 0 (0.0%) | 204 (19.5%) |
| 4 or 5 Rooms | 724 (27.7%) | 401 (38.4%) |
| 6 or 7 Rooms | 1,041 (39.8%) | 155 (14.8%) |
| 8 or more Rooms | 853 (32.6%) | 117 (11.2%) |
| Total | 2,618 (100.0%) | 1,044 (100.0%) |
Housing Structure by Heating Type in Camden
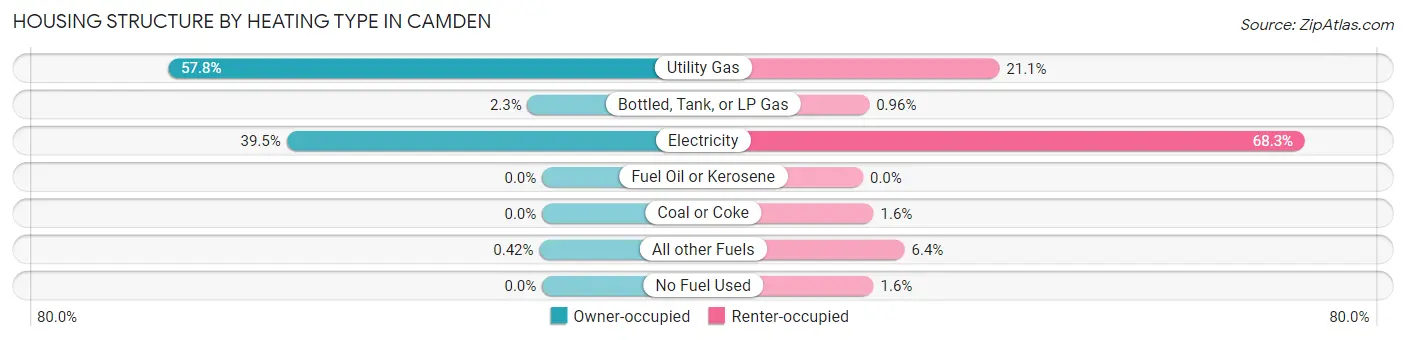
| Heating Type | Owner-occupied | Renter-occupied |
| Utility Gas | 1,514 (57.8%) | 220 (21.1%) |
| Bottled, Tank, or LP Gas | 59 (2.2%) | 10 (1.0%) |
| Electricity | 1,034 (39.5%) | 713 (68.3%) |
| Fuel Oil or Kerosene | 0 (0.0%) | 0 (0.0%) |
| Coal or Coke | 0 (0.0%) | 17 (1.6%) |
| All other Fuels | 11 (0.4%) | 67 (6.4%) |
| No Fuel Used | 0 (0.0%) | 17 (1.6%) |
| Total | 2,618 (100.0%) | 1,044 (100.0%) |
Household Vehicle Usage in Camden
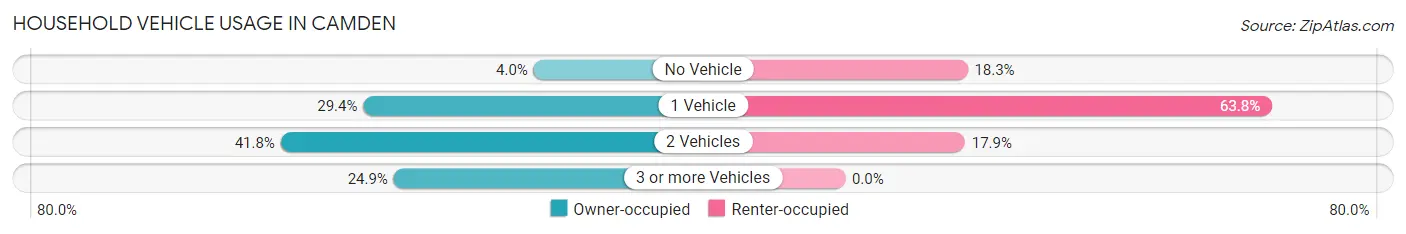
| Vehicles per Household | Owner-occupied | Renter-occupied |
| No Vehicle | 104 (4.0%) | 191 (18.3%) |
| 1 Vehicle | 770 (29.4%) | 666 (63.8%) |
| 2 Vehicles | 1,093 (41.7%) | 187 (17.9%) |
| 3 or more Vehicles | 651 (24.9%) | 0 (0.0%) |
| Total | 2,618 (100.0%) | 1,044 (100.0%) |
Real Estate & Mortgages in Camden
Real Estate and Mortgage Overview in Camden
| Characteristic | Without Mortgage | With Mortgage |
| Housing Units | 1,112 | 1,506 |
| Median Property Value | $172,200 | $231,300 |
| Median Household Income | $66,071 | $335 |
| Monthly Housing Costs | $509 | $87 |
| Real Estate Taxes | $930 | $53 |
Property Value by Mortgage Status in Camden
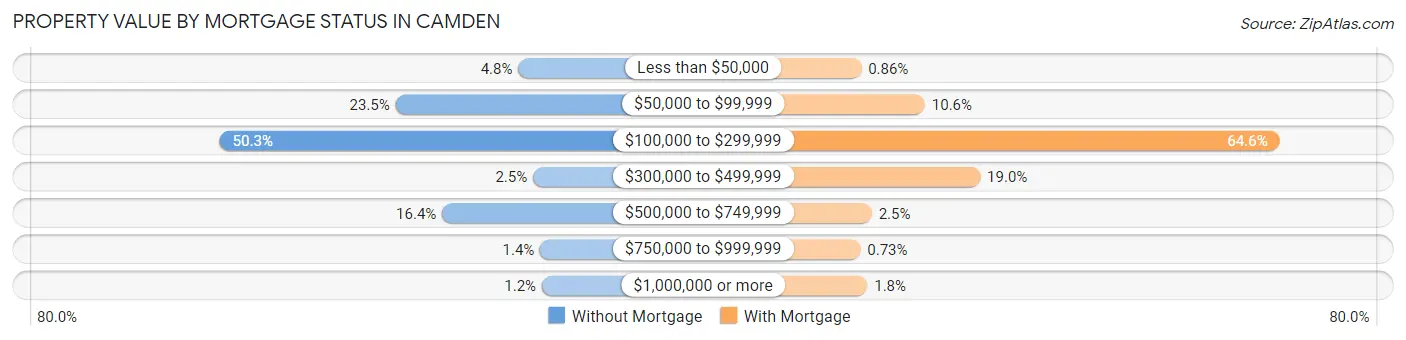
| Property Value | Without Mortgage | With Mortgage |
| Less than $50,000 | 53 (4.8%) | 13 (0.9%) |
| $50,000 to $99,999 | 261 (23.5%) | 159 (10.6%) |
| $100,000 to $299,999 | 559 (50.3%) | 973 (64.6%) |
| $300,000 to $499,999 | 28 (2.5%) | 286 (19.0%) |
| $500,000 to $749,999 | 182 (16.4%) | 37 (2.5%) |
| $750,000 to $999,999 | 16 (1.4%) | 11 (0.7%) |
| $1,000,000 or more | 13 (1.2%) | 27 (1.8%) |
| Total | 1,112 (100.0%) | 1,506 (100.0%) |
Household Income by Mortgage Status in Camden
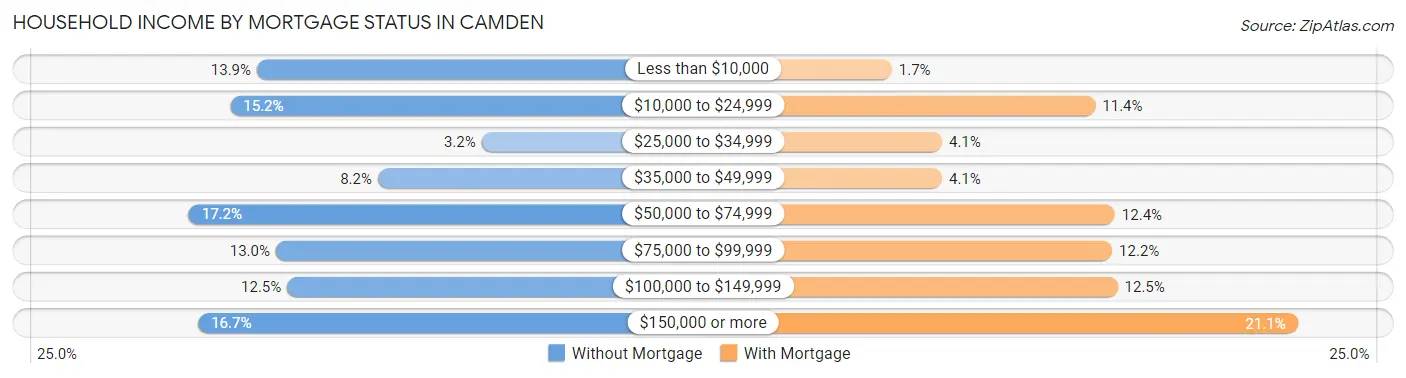
| Household Income | Without Mortgage | With Mortgage |
| Less than $10,000 | 155 (13.9%) | 26 (1.7%) |
| $10,000 to $24,999 | 169 (15.2%) | 172 (11.4%) |
| $25,000 to $34,999 | 36 (3.2%) | 62 (4.1%) |
| $35,000 to $49,999 | 91 (8.2%) | 62 (4.1%) |
| $50,000 to $74,999 | 191 (17.2%) | 186 (12.3%) |
| $75,000 to $99,999 | 145 (13.0%) | 184 (12.2%) |
| $100,000 to $149,999 | 139 (12.5%) | 188 (12.5%) |
| $150,000 or more | 186 (16.7%) | 317 (21.0%) |
| Total | 1,112 (100.0%) | 1,506 (100.0%) |
Property Value to Household Income Ratio in Camden
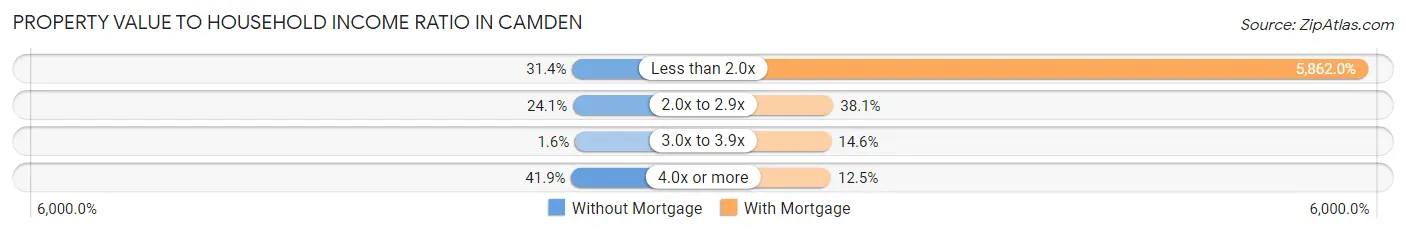
| Value-to-Income Ratio | Without Mortgage | With Mortgage |
| Less than 2.0x | 349 (31.4%) | 88,281 (5,862.0%) |
| 2.0x to 2.9x | 268 (24.1%) | 574 (38.1%) |
| 3.0x to 3.9x | 18 (1.6%) | 220 (14.6%) |
| 4.0x or more | 466 (41.9%) | 188 (12.5%) |
| Total | 1,112 (100.0%) | 1,506 (100.0%) |
Real Estate Taxes by Mortgage Status in Camden
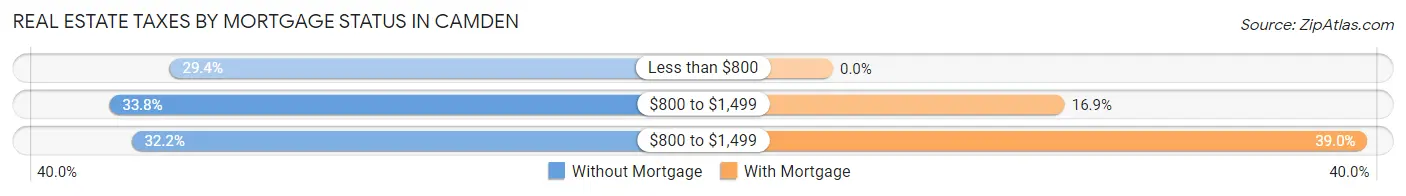
| Property Taxes | Without Mortgage | With Mortgage |
| Less than $800 | 327 (29.4%) | 0 (0.0%) |
| $800 to $1,499 | 376 (33.8%) | 255 (16.9%) |
| $800 to $1,499 | 358 (32.2%) | 588 (39.0%) |
| Total | 1,112 (100.0%) | 1,506 (100.0%) |
Health & Disability in Camden
Health Insurance Coverage by Age in Camden
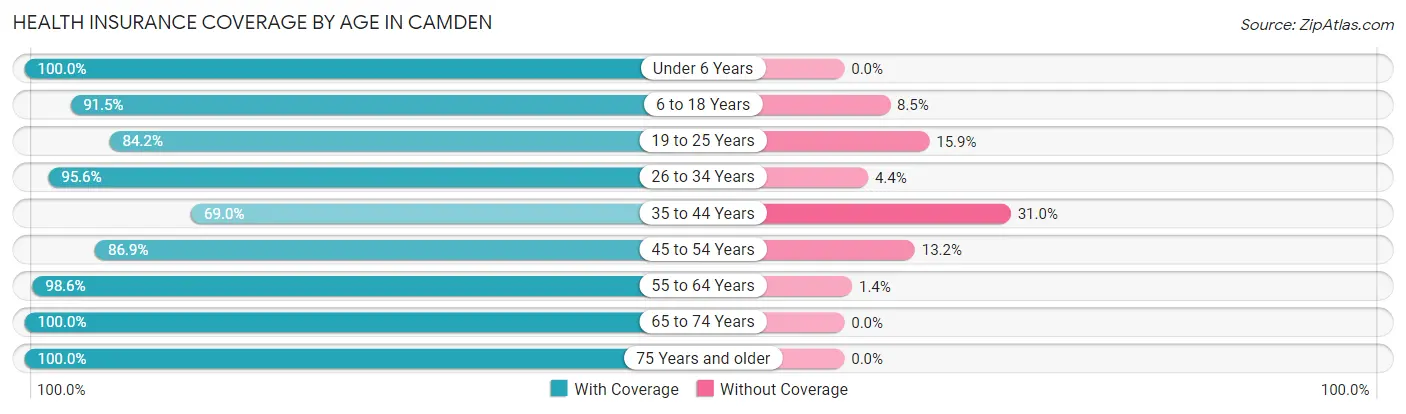
| Age Bracket | With Coverage | Without Coverage |
| Under 6 Years | 511 (100.0%) | 0 (0.0%) |
| 6 to 18 Years | 796 (91.5%) | 74 (8.5%) |
| 19 to 25 Years | 499 (84.2%) | 94 (15.9%) |
| 26 to 34 Years | 432 (95.6%) | 20 (4.4%) |
| 35 to 44 Years | 891 (69.0%) | 401 (31.0%) |
| 45 to 54 Years | 614 (86.9%) | 93 (13.2%) |
| 55 to 64 Years | 1,373 (98.6%) | 20 (1.4%) |
| 65 to 74 Years | 1,087 (100.0%) | 0 (0.0%) |
| 75 Years and older | 745 (100.0%) | 0 (0.0%) |
| Total | 6,948 (90.8%) | 702 (9.2%) |
Health Insurance Coverage by Citizenship Status in Camden

| Citizenship Status | With Coverage | Without Coverage |
| Native Born | 511 (100.0%) | 0 (0.0%) |
| Foreign Born, Citizen | 796 (91.5%) | 74 (8.5%) |
| Foreign Born, not a Citizen | 499 (84.2%) | 94 (15.9%) |
Health Insurance Coverage by Household Income in Camden
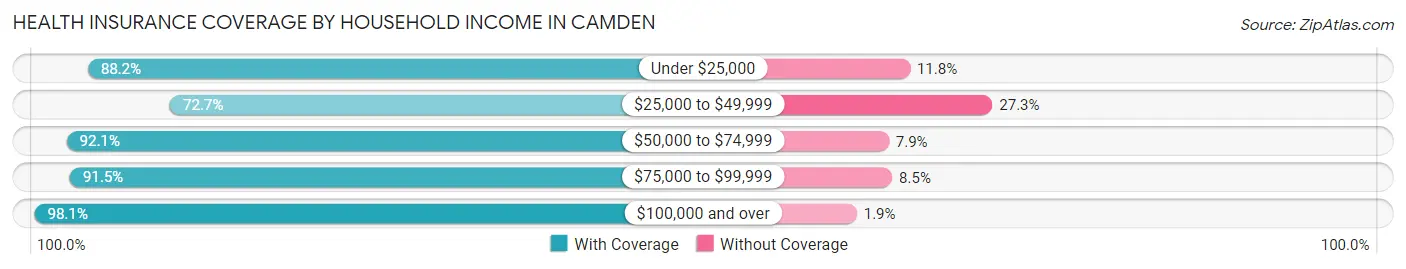
| Household Income | With Coverage | Without Coverage |
| Under $25,000 | 1,377 (88.2%) | 185 (11.8%) |
| $25,000 to $49,999 | 816 (72.7%) | 306 (27.3%) |
| $50,000 to $74,999 | 923 (92.1%) | 79 (7.9%) |
| $75,000 to $99,999 | 807 (91.5%) | 75 (8.5%) |
| $100,000 and over | 2,996 (98.1%) | 57 (1.9%) |
Public vs Private Health Insurance Coverage by Age in Camden
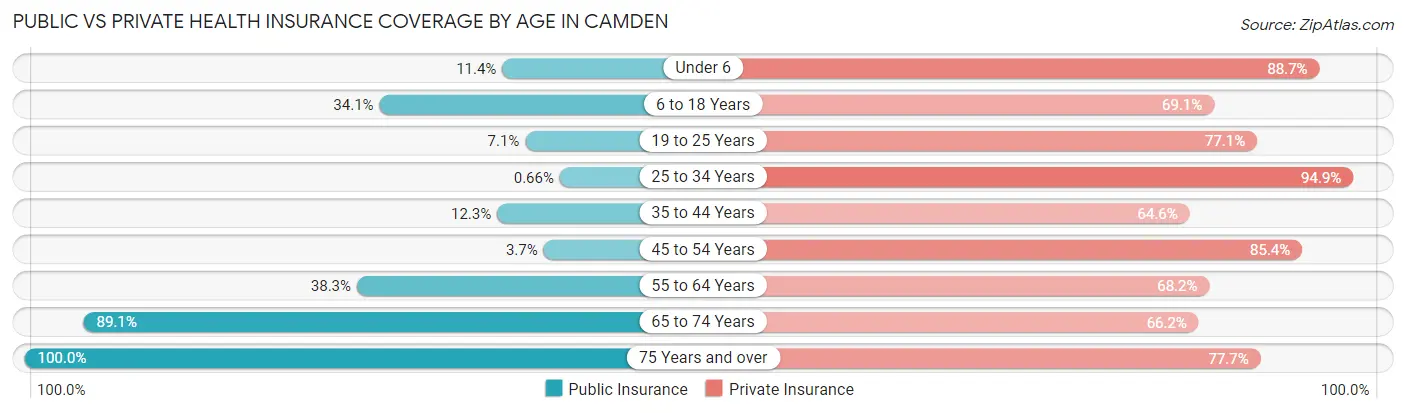
| Age Bracket | Public Insurance | Private Insurance |
| Under 6 | 58 (11.4%) | 453 (88.6%) |
| 6 to 18 Years | 297 (34.1%) | 601 (69.1%) |
| 19 to 25 Years | 42 (7.1%) | 457 (77.1%) |
| 25 to 34 Years | 3 (0.7%) | 429 (94.9%) |
| 35 to 44 Years | 159 (12.3%) | 834 (64.5%) |
| 45 to 54 Years | 26 (3.7%) | 604 (85.4%) |
| 55 to 64 Years | 534 (38.3%) | 950 (68.2%) |
| 65 to 74 Years | 968 (89.0%) | 720 (66.2%) |
| 75 Years and over | 745 (100.0%) | 579 (77.7%) |
| Total | 2,832 (37.0%) | 5,627 (73.6%) |
Disability Status by Sex by Age in Camden
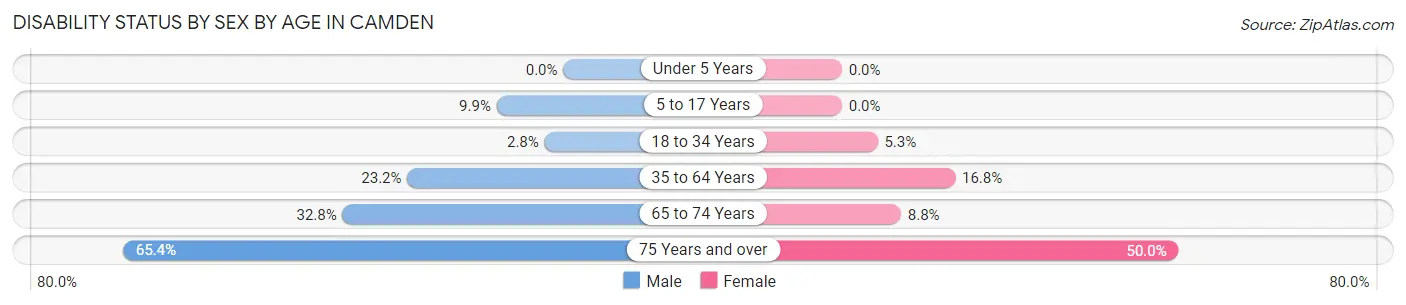
| Age Bracket | Male | Female |
| Under 5 Years | 0 (0.0%) | 0 (0.0%) |
| 5 to 17 Years | 35 (9.9%) | 0 (0.0%) |
| 18 to 34 Years | 9 (2.8%) | 41 (5.3%) |
| 35 to 64 Years | 386 (23.2%) | 290 (16.8%) |
| 65 to 74 Years | 162 (32.8%) | 52 (8.8%) |
| 75 Years and over | 104 (65.4%) | 293 (50.0%) |
Disability Class by Sex by Age in Camden
Disability Class: Hearing Difficulty
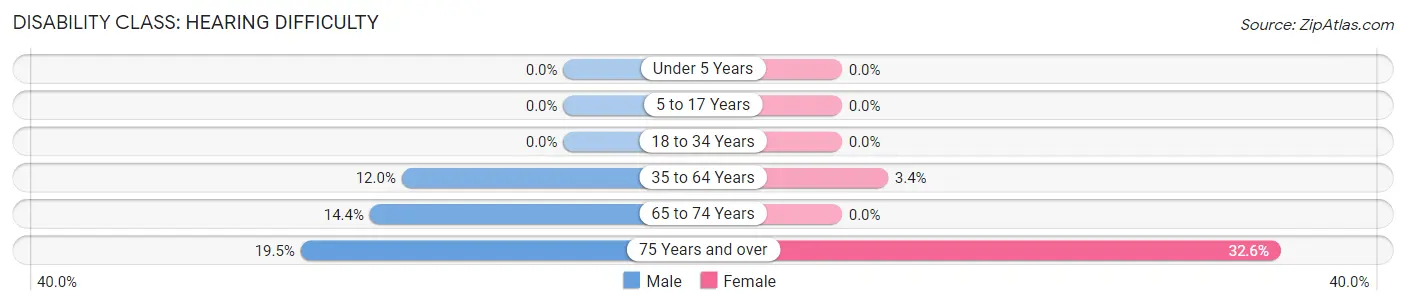
| Age Bracket | Male | Female |
| Under 5 Years | 0 (0.0%) | 0 (0.0%) |
| 5 to 17 Years | 0 (0.0%) | 0 (0.0%) |
| 18 to 34 Years | 0 (0.0%) | 0 (0.0%) |
| 35 to 64 Years | 200 (12.0%) | 59 (3.4%) |
| 65 to 74 Years | 71 (14.4%) | 0 (0.0%) |
| 75 Years and over | 31 (19.5%) | 191 (32.6%) |
Disability Class: Vision Difficulty
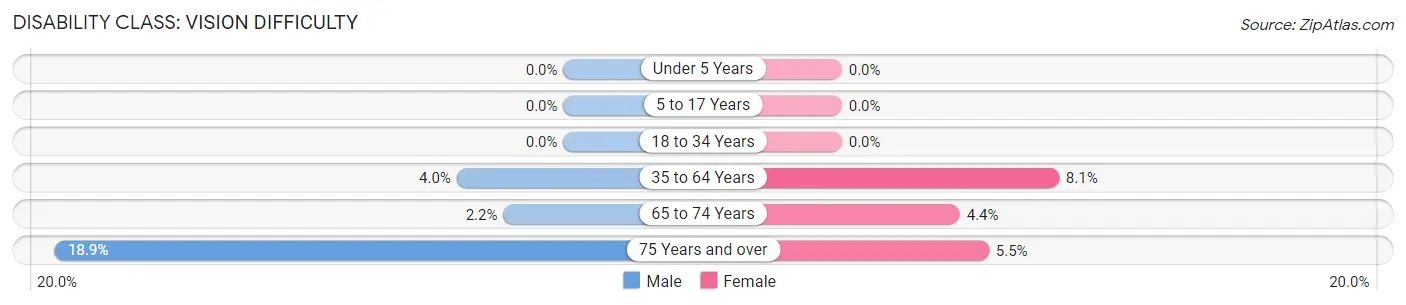
| Age Bracket | Male | Female |
| Under 5 Years | 0 (0.0%) | 0 (0.0%) |
| 5 to 17 Years | 0 (0.0%) | 0 (0.0%) |
| 18 to 34 Years | 0 (0.0%) | 0 (0.0%) |
| 35 to 64 Years | 66 (4.0%) | 139 (8.1%) |
| 65 to 74 Years | 11 (2.2%) | 26 (4.4%) |
| 75 Years and over | 30 (18.9%) | 32 (5.5%) |
Disability Class: Cognitive Difficulty
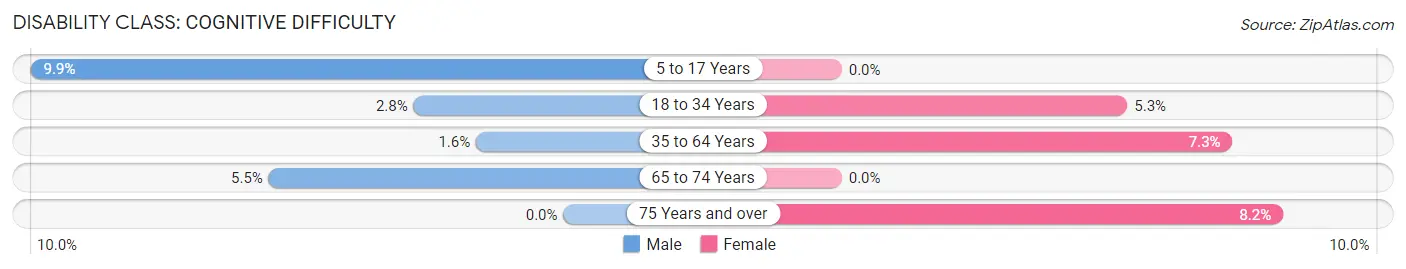
| Age Bracket | Male | Female |
| 5 to 17 Years | 35 (9.9%) | 0 (0.0%) |
| 18 to 34 Years | 9 (2.8%) | 41 (5.3%) |
| 35 to 64 Years | 27 (1.6%) | 125 (7.2%) |
| 65 to 74 Years | 27 (5.5%) | 0 (0.0%) |
| 75 Years and over | 0 (0.0%) | 48 (8.2%) |
Disability Class: Ambulatory Difficulty
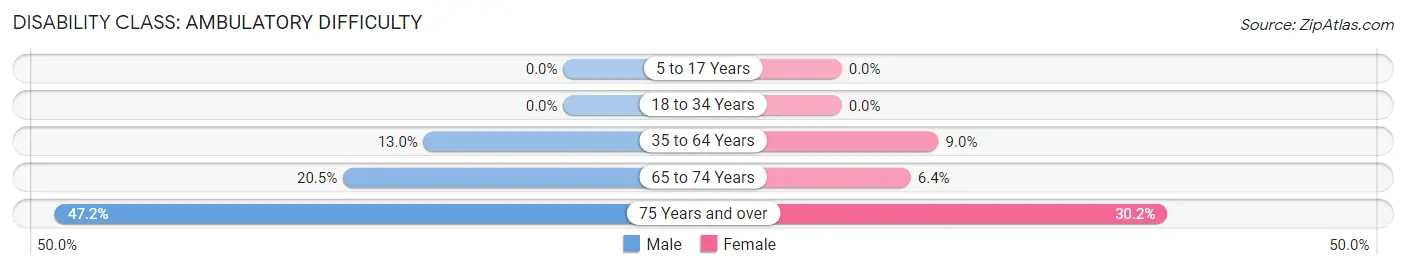
| Age Bracket | Male | Female |
| 5 to 17 Years | 0 (0.0%) | 0 (0.0%) |
| 18 to 34 Years | 0 (0.0%) | 0 (0.0%) |
| 35 to 64 Years | 216 (13.0%) | 155 (9.0%) |
| 65 to 74 Years | 101 (20.4%) | 38 (6.4%) |
| 75 Years and over | 75 (47.2%) | 177 (30.2%) |
Disability Class: Self-Care Difficulty
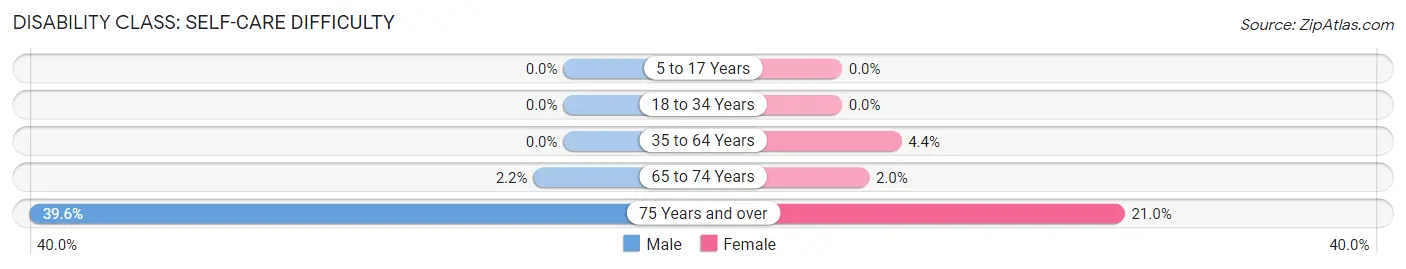
| Age Bracket | Male | Female |
| 5 to 17 Years | 0 (0.0%) | 0 (0.0%) |
| 18 to 34 Years | 0 (0.0%) | 0 (0.0%) |
| 35 to 64 Years | 0 (0.0%) | 76 (4.4%) |
| 65 to 74 Years | 11 (2.2%) | 12 (2.0%) |
| 75 Years and over | 63 (39.6%) | 123 (21.0%) |
Technology Access in Camden
Computing Device Access in Camden
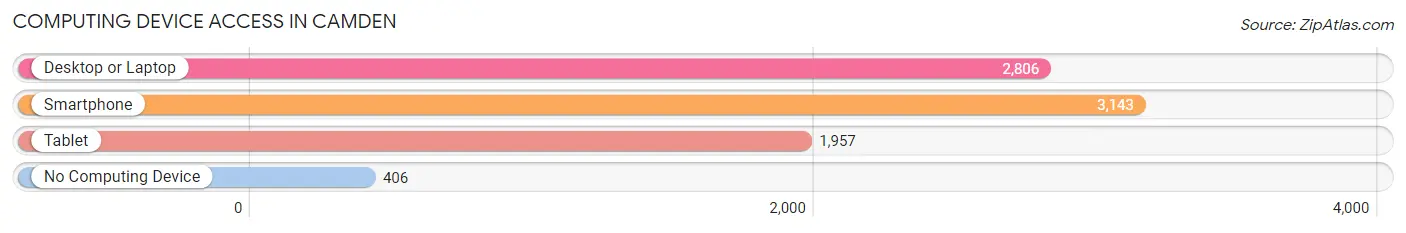
| Device Type | # Households | % Households |
| Desktop or Laptop | 2,806 | 76.6% |
| Smartphone | 3,143 | 85.8% |
| Tablet | 1,957 | 53.4% |
| No Computing Device | 406 | 11.1% |
| Total | 3,662 | 100.0% |
Internet Access in Camden
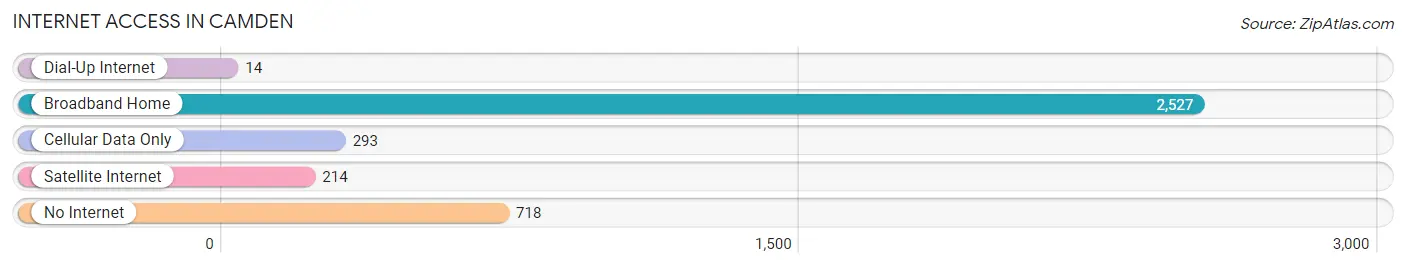
| Internet Type | # Households | % Households |
| Dial-Up Internet | 14 | 0.4% |
| Broadband Home | 2,527 | 69.0% |
| Cellular Data Only | 293 | 8.0% |
| Satellite Internet | 214 | 5.8% |
| No Internet | 718 | 19.6% |
| Total | 3,662 | 100.0% |
Camden Summary
Camden, South Carolina is a small city located in Kershaw County, South Carolina. It is the county seat of Kershaw County and is located in the Midlands region of the state. The city has a population of approximately 7,000 people and is located approximately 40 miles northeast of Columbia, the state capital.
Geography
Camden is located in the Midlands region of South Carolina, approximately 40 miles northeast of Columbia. The city is situated on the banks of the Wateree River, which is a tributary of the Santee River. The city is located in a rural area and is surrounded by farmland and forests. The terrain is mostly flat, with some rolling hills in the area. The climate is humid subtropical, with hot, humid summers and mild winters.
History
Camden was founded in 1732 by Joseph Kershaw, a planter and surveyor from England. The city was named after Charles Pratt, the Earl of Camden, who was a British politician and supporter of the American Revolution. The city was an important trading center during the Revolutionary War and was the site of several battles. After the war, the city became an important agricultural center and was home to several cotton plantations.
Economy
The economy of Camden is largely based on agriculture and manufacturing. The city is home to several large agricultural operations, including poultry farms, cotton farms, and timber operations. The city is also home to several manufacturing companies, including a paper mill, a furniture factory, and a textile mill. The city is also home to several retail stores and restaurants.
Demographics
As of the 2010 census, Camden had a population of 7,000 people. The racial makeup of the city was 73.3% White, 22.2% African American, 0.3% Native American, 0.7% Asian, 0.1% Pacific Islander, and 3.4% from other races. The median household income was $31,945, and the median family income was $41,945. The per capita income was $17,945.
Conclusion
Camden, South Carolina is a small city located in Kershaw County, South Carolina. It is the county seat of Kershaw County and is located in the Midlands region of the state. The city has a population of approximately 7,000 people and is located approximately 40 miles northeast of Columbia, the state capital. The economy of Camden is largely based on agriculture and manufacturing, and the city is home to several large agricultural operations and manufacturing companies. The racial makeup of the city is 73.3% White, 22.2% African American, 0.3% Native American, 0.7% Asian, 0.1% Pacific Islander, and 3.4% from other races. The median household income was $31,945, and the median family income was $41,945. The per capita income was $17,945.
Common Questions
What is Per Capita Income in Camden?
Per Capita income in Camden is $38,569.
What is the Median Family Income in Camden?
Median Family Income in Camden is $84,893.
What is the Median Household income in Camden?
Median Household Income in Camden is $54,141.
What is Income or Wage Gap in Camden?
Income or Wage Gap in Camden is 30.3%.
Women in Camden earn 69.7 cents for every dollar earned by a man.
What is Family Income Deficit in Camden?
Family Income Deficit in Camden is $10,908.
Families that are below poverty line in Camden earn $10,908 less on average than the poverty threshold level.
What is Inequality or Gini Index in Camden?
Inequality or Gini Index in Camden is 0.53.
What is the Total Population of Camden?
Total Population of Camden is 7,834.
What is the Total Male Population of Camden?
Total Male Population of Camden is 3,338.
What is the Total Female Population of Camden?
Total Female Population of Camden is 4,496.
What is the Ratio of Males per 100 Females in Camden?
There are 74.24 Males per 100 Females in Camden.
What is the Ratio of Females per 100 Males in Camden?
There are 134.69 Females per 100 Males in Camden.
What is the Median Population Age in Camden?
Median Population Age in Camden is 47.9 Years.
What is the Average Family Size in Camden
Average Family Size in Camden is 2.9 People.
What is the Average Household Size in Camden
Average Household Size in Camden is 2.1 People.
How Large is the Labor Force in Camden?
There are 3,733 People in the Labor Forcein in Camden.
What is the Percentage of People in the Labor Force in Camden?
55.5% of People are in the Labor Force in Camden.
What is the Unemployment Rate in Camden?
Unemployment Rate in Camden is 3.0%.