Enoree, SC Map & Demographics
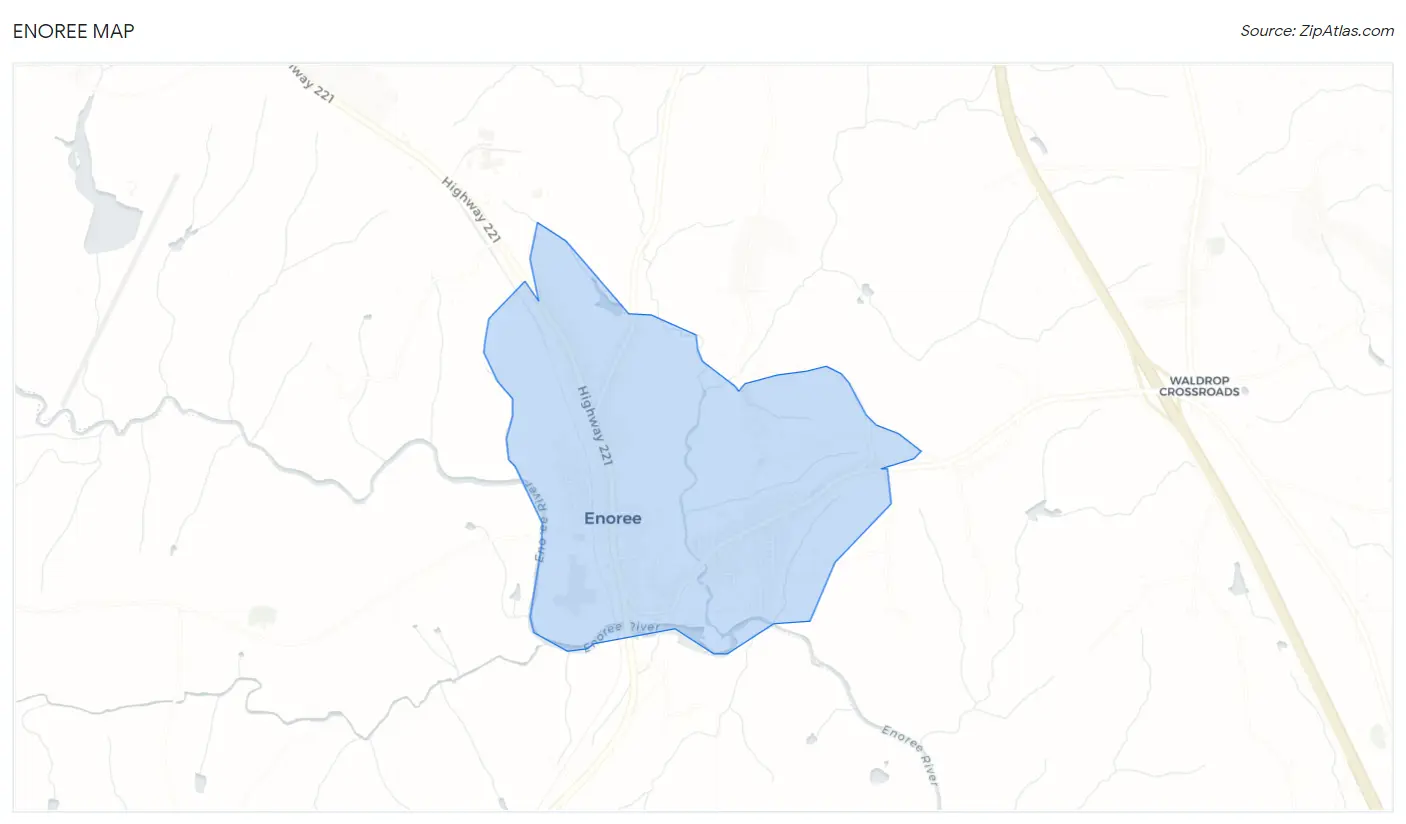
Enoree Map
Enoree Overview
$21,078
PER CAPITA INCOME
$27,019
AVG FAMILY INCOME
12.2%
WAGE / INCOME GAP [ % ]
87.8¢/ $1
WAGE / INCOME GAP [ $ ]
0.36
INEQUALITY / GINI INDEX
441
TOTAL POPULATION
215
MALE POPULATION
226
FEMALE POPULATION
95.13
MALES / 100 FEMALES
105.12
FEMALES / 100 MALES
43.8
MEDIAN AGE
2.9
AVG FAMILY SIZE
2.3
AVG HOUSEHOLD SIZE
227
LABOR FORCE [ PEOPLE ]
56.6%
PERCENT IN LABOR FORCE
12.3%
UNEMPLOYMENT RATE
Enoree Zip Codes
Enoree Area Codes
Income in Enoree
Income Overview in Enoree
| Characteristic | Number | Measure |
| Per Capita Income | 441 | $21,078 |
| Median Family Income | 113 | $27,019 |
| Mean Family Income | 113 | $40,174 |
| Median Household Income | 193 | $0 |
| Mean Household Income | 193 | $46,999 |
| Income Deficit | 113 | $0 |
| Wage / Income Gap (%) | 441 | 12.23% |
| Wage / Income Gap ($) | 441 | 87.77¢ per $1 |
| Gini / Inequality Index | 441 | 0.36 |
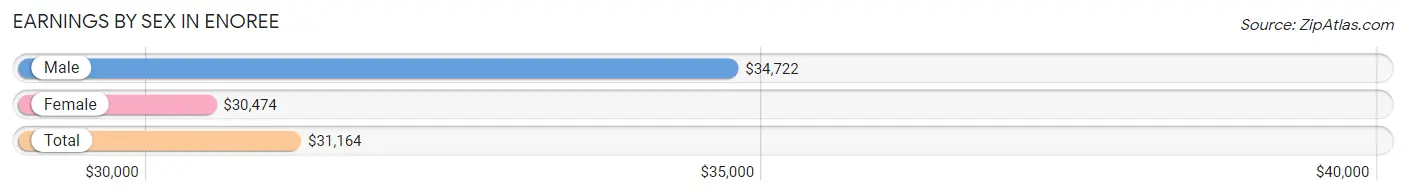
Earnings by Sex in Enoree
Average Earnings in Enoree are $31,164, $34,722 for men and $30,474 for women, a difference of 12.2%.
| Sex | Number | Average Earnings |
| Male | 142 (62.6%) | $34,722 |
| Female | 85 (37.4%) | $30,474 |
| Total | 227 (100.0%) | $31,164 |
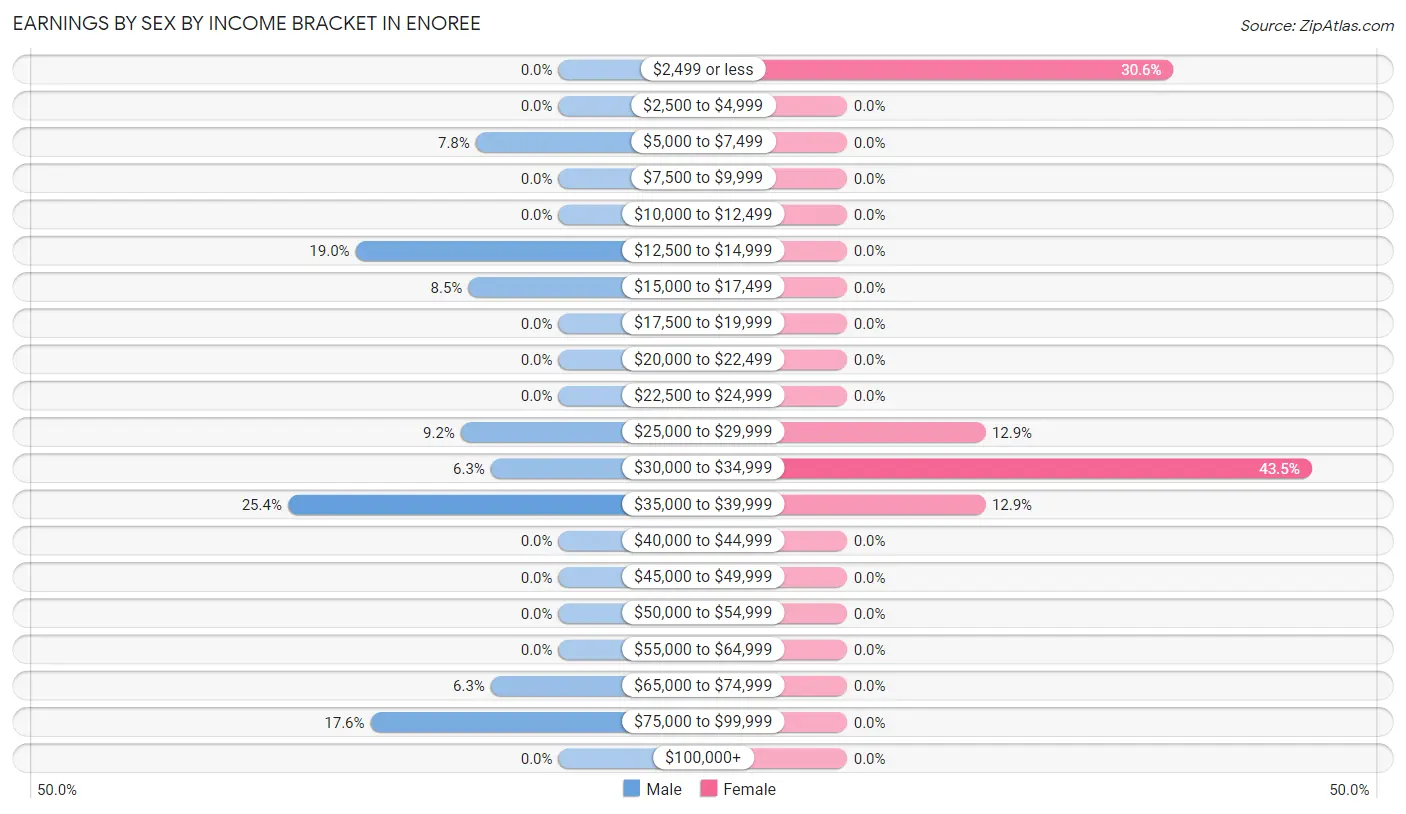
Earnings by Sex by Income Bracket in Enoree
The most common earnings brackets in Enoree are $35,000 to $39,999 for men (36 | 25.4%) and $30,000 to $34,999 for women (37 | 43.5%).
| Income | Male | Female |
| $2,499 or less | 0 (0.0%) | 26 (30.6%) |
| $2,500 to $4,999 | 0 (0.0%) | 0 (0.0%) |
| $5,000 to $7,499 | 11 (7.7%) | 0 (0.0%) |
| $7,500 to $9,999 | 0 (0.0%) | 0 (0.0%) |
| $10,000 to $12,499 | 0 (0.0%) | 0 (0.0%) |
| $12,500 to $14,999 | 27 (19.0%) | 0 (0.0%) |
| $15,000 to $17,499 | 12 (8.5%) | 0 (0.0%) |
| $17,500 to $19,999 | 0 (0.0%) | 0 (0.0%) |
| $20,000 to $22,499 | 0 (0.0%) | 0 (0.0%) |
| $22,500 to $24,999 | 0 (0.0%) | 0 (0.0%) |
| $25,000 to $29,999 | 13 (9.1%) | 11 (12.9%) |
| $30,000 to $34,999 | 9 (6.3%) | 37 (43.5%) |
| $35,000 to $39,999 | 36 (25.4%) | 11 (12.9%) |
| $40,000 to $44,999 | 0 (0.0%) | 0 (0.0%) |
| $45,000 to $49,999 | 0 (0.0%) | 0 (0.0%) |
| $50,000 to $54,999 | 0 (0.0%) | 0 (0.0%) |
| $55,000 to $64,999 | 0 (0.0%) | 0 (0.0%) |
| $65,000 to $74,999 | 9 (6.3%) | 0 (0.0%) |
| $75,000 to $99,999 | 25 (17.6%) | 0 (0.0%) |
| $100,000+ | 0 (0.0%) | 0 (0.0%) |
| Total | 142 (100.0%) | 85 (100.0%) |
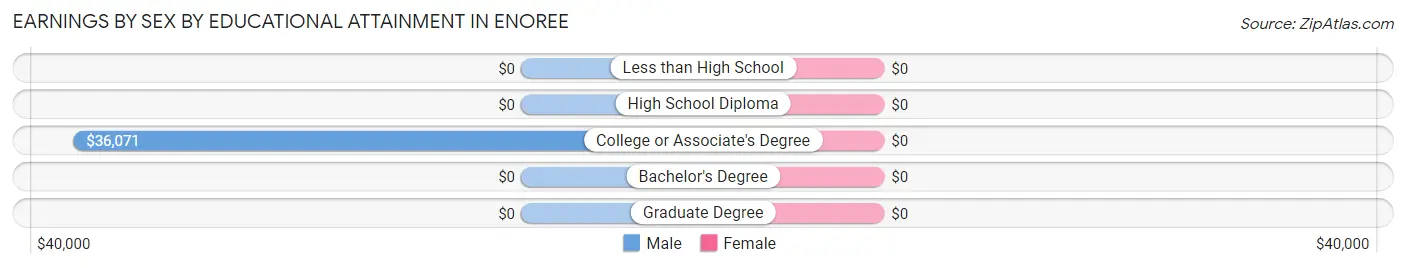
Earnings by Sex by Educational Attainment in Enoree
| Educational Attainment | Male Income | Female Income |
| Less than High School | - | - |
| High School Diploma | - | - |
| College or Associate's Degree | $36,071 | $0 |
| Bachelor's Degree | - | - |
| Graduate Degree | - | - |
| Total | $34,722 | $30,474 |
Family Income in Enoree
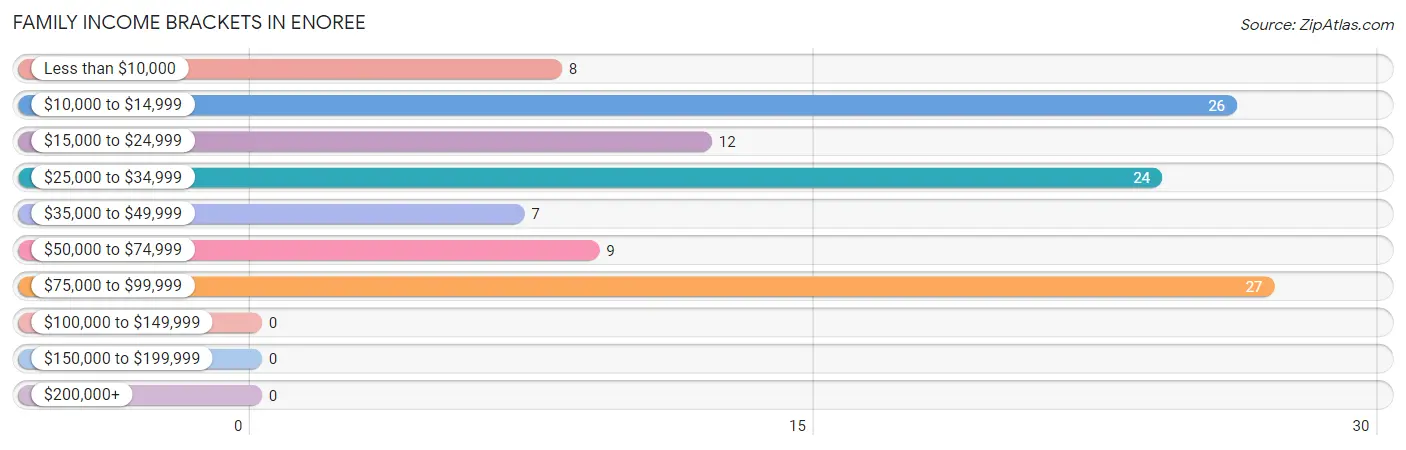
Family Income Brackets in Enoree
According to the Enoree family income data, there are 27 families falling into the $75,000 to $99,999 income range, which is the most common income bracket and makes up 23.9% of all families.
| Income Bracket | # Families | % Families |
| Less than $10,000 | 8 | 7.1% |
| $10,000 to $14,999 | 26 | 23.0% |
| $15,000 to $24,999 | 12 | 10.6% |
| $25,000 to $34,999 | 24 | 21.2% |
| $35,000 to $49,999 | 7 | 6.2% |
| $50,000 to $74,999 | 9 | 8.0% |
| $75,000 to $99,999 | 27 | 23.9% |
| $100,000 to $149,999 | 0 | 0.0% |
| $150,000 to $199,999 | 0 | 0.0% |
| $200,000+ | 0 | 0.0% |
Family Income by Famaliy Size in Enoree
| Income Bracket | # Families | Median Income |
| 2-Person Families | 56 (49.6%) | $0 |
| 3-Person Families | 31 (27.4%) | $0 |
| 4-Person Families | 26 (23.0%) | $0 |
| 5-Person Families | 0 (0.0%) | $0 |
| 6-Person Families | 0 (0.0%) | $0 |
| 7+ Person Families | 0 (0.0%) | $0 |
| Total | 113 (100.0%) | $27,019 |
Family Income by Number of Earners in Enoree
| Number of Earners | # Families | Median Income |
| No Earners | 18 (15.9%) | $0 |
| 1 Earner | 52 (46.0%) | $0 |
| 2 Earners | 43 (38.1%) | $0 |
| 3+ Earners | 0 (0.0%) | $0 |
| Total | 113 (100.0%) | $27,019 |
Household Income in Enoree
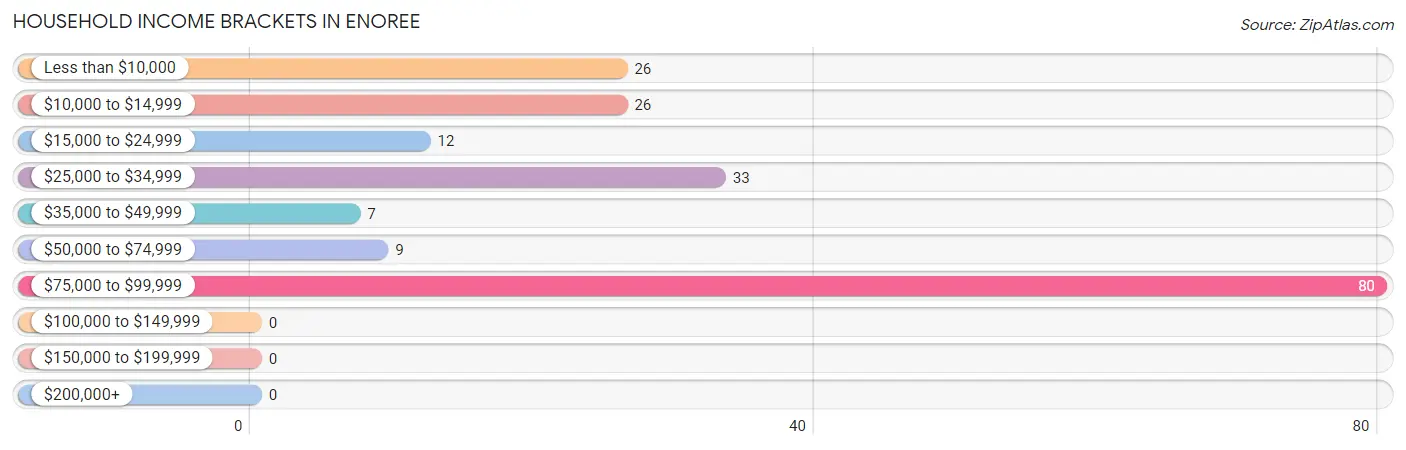
Household Income Brackets in Enoree
With 80 households falling in the category, the $75,000 to $99,999 income range is the most frequent in Enoree, accounting for 41.4% of all households.
| Income Bracket | # Households | % Households |
| Less than $10,000 | 26 | 13.5% |
| $10,000 to $14,999 | 26 | 13.5% |
| $15,000 to $24,999 | 12 | 6.2% |
| $25,000 to $34,999 | 33 | 17.1% |
| $35,000 to $49,999 | 7 | 3.6% |
| $50,000 to $74,999 | 9 | 4.7% |
| $75,000 to $99,999 | 80 | 41.5% |
| $100,000 to $149,999 | 0 | 0.0% |
| $150,000 to $199,999 | 0 | 0.0% |
| $200,000+ | 0 | 0.0% |
Household Income by Householder Age in Enoree
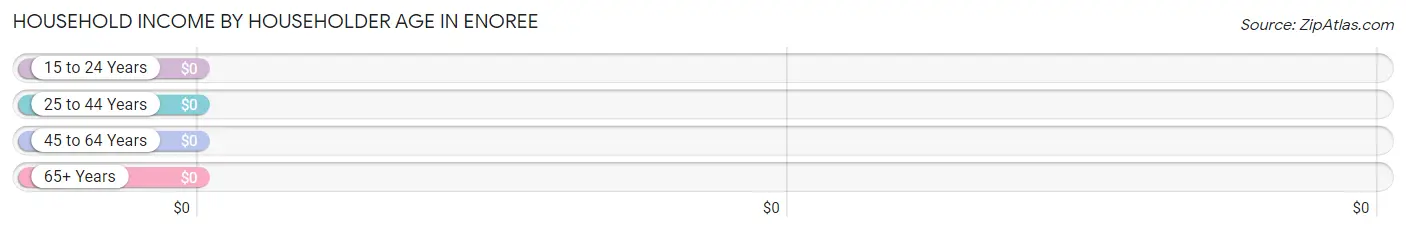
| Income Bracket | # Households | Median Income |
| 15 to 24 Years | 0 (0.0%) | $0 |
| 25 to 44 Years | 92 (47.7%) | $0 |
| 45 to 64 Years | 49 (25.4%) | $0 |
| 65+ Years | 52 (26.9%) | $0 |
| Total | 193 (100.0%) | $0 |
Poverty in Enoree
Income Below Poverty by Sex and Age in Enoree
With 44.7% poverty level for males and 38.5% for females among the residents of Enoree, 6 to 11 year old males and 18 to 24 year old females are the most vulnerable to poverty, with 28 males (100.0%) and 24 females (75.0%) in their respective age groups living below the poverty level.
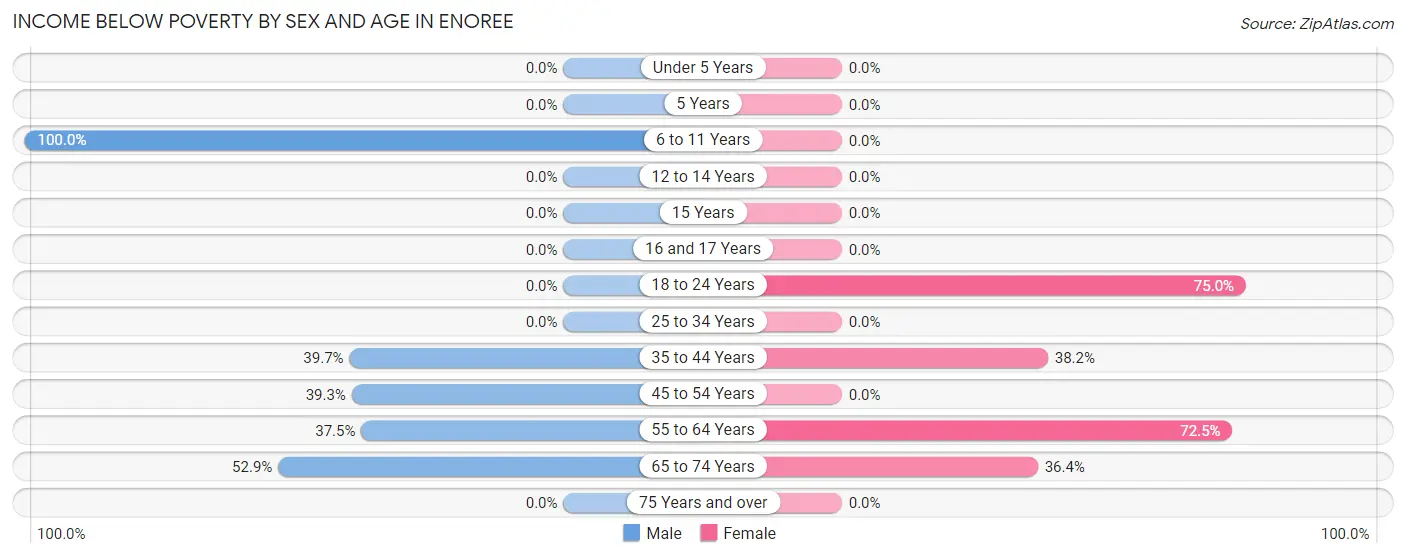
| Age Bracket | Male | Female |
| Under 5 Years | 0 (0.0%) | 0 (0.0%) |
| 5 Years | 0 (0.0%) | 0 (0.0%) |
| 6 to 11 Years | 28 (100.0%) | 0 (0.0%) |
| 12 to 14 Years | 0 (0.0%) | 0 (0.0%) |
| 15 Years | 0 (0.0%) | 0 (0.0%) |
| 16 and 17 Years | 0 (0.0%) | 0 (0.0%) |
| 18 to 24 Years | 0 (0.0%) | 24 (75.0%) |
| 25 to 34 Years | 0 (0.0%) | 0 (0.0%) |
| 35 to 44 Years | 27 (39.7%) | 26 (38.2%) |
| 45 to 54 Years | 11 (39.3%) | 0 (0.0%) |
| 55 to 64 Years | 12 (37.5%) | 29 (72.5%) |
| 65 to 74 Years | 18 (52.9%) | 8 (36.4%) |
| 75 Years and over | 0 (0.0%) | 0 (0.0%) |
| Total | 96 (44.7%) | 87 (38.5%) |
Income Above Poverty by Sex and Age in Enoree
According to the poverty statistics in Enoree, males aged 25 to 34 years and females aged 6 to 11 years are the age groups that are most secure financially, with 100.0% of males and 100.0% of females in these age groups living above the poverty line.
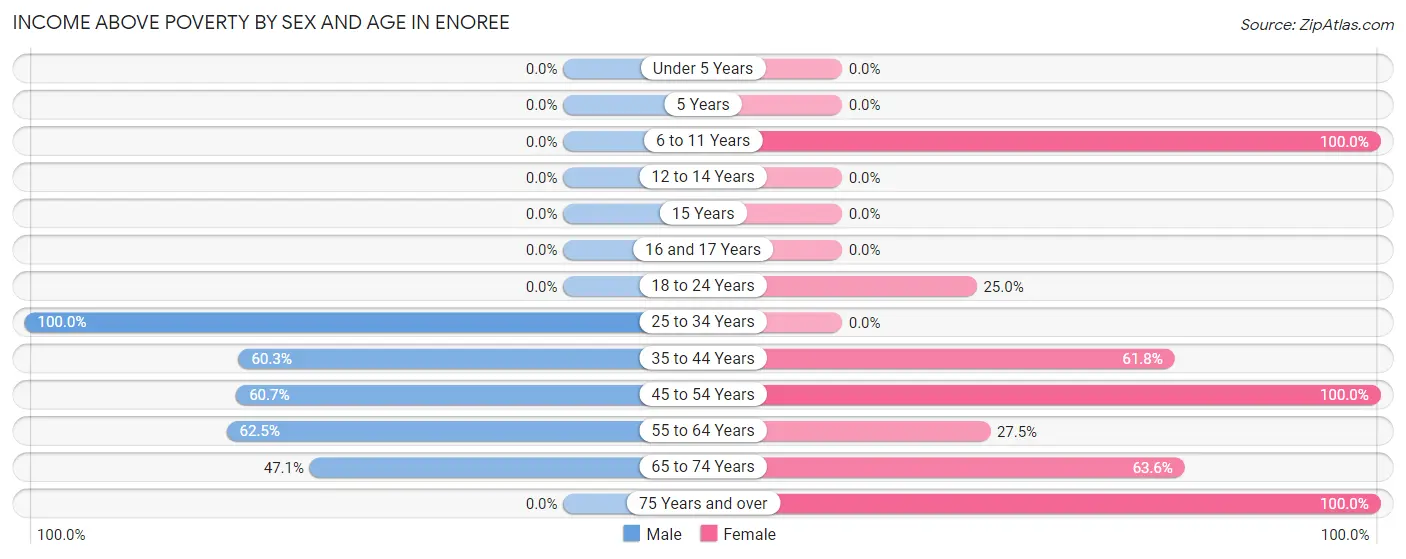
| Age Bracket | Male | Female |
| Under 5 Years | 0 (0.0%) | 0 (0.0%) |
| 5 Years | 0 (0.0%) | 0 (0.0%) |
| 6 to 11 Years | 0 (0.0%) | 12 (100.0%) |
| 12 to 14 Years | 0 (0.0%) | 0 (0.0%) |
| 15 Years | 0 (0.0%) | 0 (0.0%) |
| 16 and 17 Years | 0 (0.0%) | 0 (0.0%) |
| 18 to 24 Years | 0 (0.0%) | 8 (25.0%) |
| 25 to 34 Years | 25 (100.0%) | 0 (0.0%) |
| 35 to 44 Years | 41 (60.3%) | 42 (61.8%) |
| 45 to 54 Years | 17 (60.7%) | 31 (100.0%) |
| 55 to 64 Years | 20 (62.5%) | 11 (27.5%) |
| 65 to 74 Years | 16 (47.1%) | 14 (63.6%) |
| 75 Years and over | 0 (0.0%) | 21 (100.0%) |
| Total | 119 (55.3%) | 139 (61.5%) |
Income Below Poverty Among Married-Couple Families in Enoree
The poverty statistics for married-couple families in Enoree show that 40.0% or 38 of the total 95 families live below the poverty line. Families with 1 or 2 children have the highest poverty rate of 66.7%, comprising of 26 families. On the other hand, families with no children have the lowest poverty rate of 21.4%, which includes 12 families.
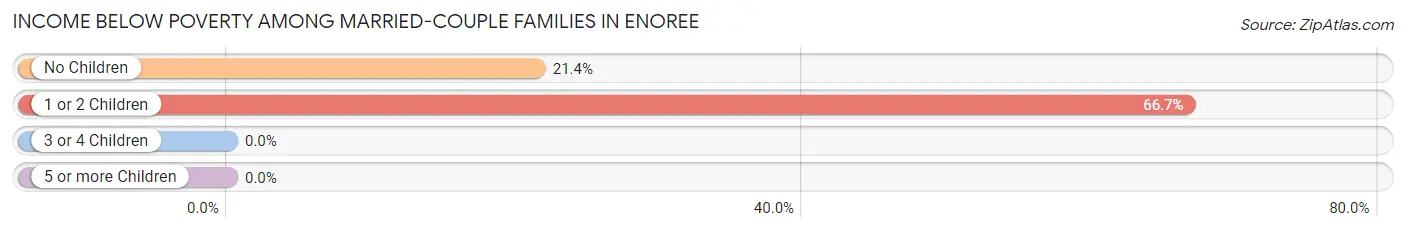
| Children | Above Poverty | Below Poverty |
| No Children | 44 (78.6%) | 12 (21.4%) |
| 1 or 2 Children | 13 (33.3%) | 26 (66.7%) |
| 3 or 4 Children | 0 (0.0%) | 0 (0.0%) |
| 5 or more Children | 0 (0.0%) | 0 (0.0%) |
| Total | 57 (60.0%) | 38 (40.0%) |
Income Below Poverty Among Single-Parent Households in Enoree
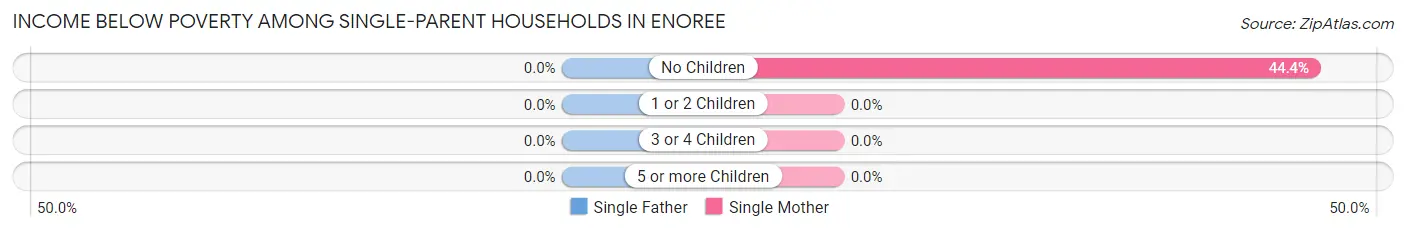
| Children | Single Father | Single Mother |
| No Children | 0 (0.0%) | 8 (44.4%) |
| 1 or 2 Children | 0 (0.0%) | 0 (0.0%) |
| 3 or 4 Children | 0 (0.0%) | 0 (0.0%) |
| 5 or more Children | 0 (0.0%) | 0 (0.0%) |
| Total | 0 (0.0%) | 8 (44.4%) |
Income Below Poverty Among Married-Couple vs Single-Parent Households in Enoree
The poverty data for Enoree shows that 38 of the married-couple family households (40.0%) and 8 of the single-parent households (44.4%) are living below the poverty level. Within the married-couple family households, those with 1 or 2 children have the highest poverty rate, with 26 households (66.7%) falling below the poverty line. Among the single-parent households, those with no children have the highest poverty rate, with 8 household (44.4%) living below poverty.
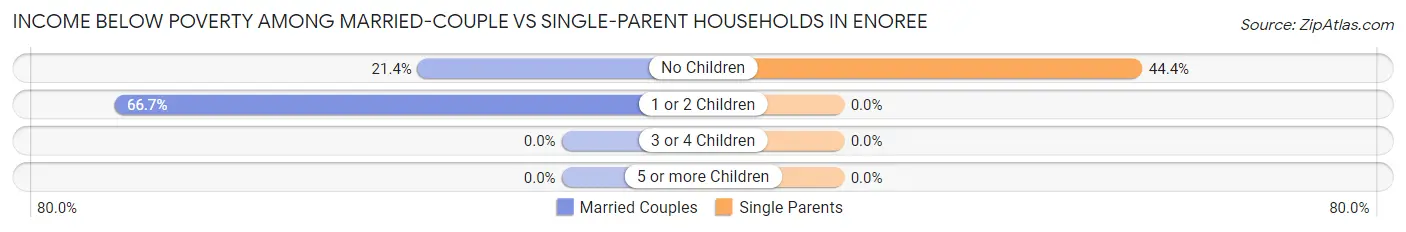
| Children | Married-Couple Families | Single-Parent Households |
| No Children | 12 (21.4%) | 8 (44.4%) |
| 1 or 2 Children | 26 (66.7%) | 0 (0.0%) |
| 3 or 4 Children | 0 (0.0%) | 0 (0.0%) |
| 5 or more Children | 0 (0.0%) | 0 (0.0%) |
| Total | 38 (40.0%) | 8 (44.4%) |
Race in Enoree
The most populous races in Enoree are White / Caucasian (271 | 61.5%), Hispanic or Latino (162 | 36.7%), and Some other Race (133 | 30.2%).
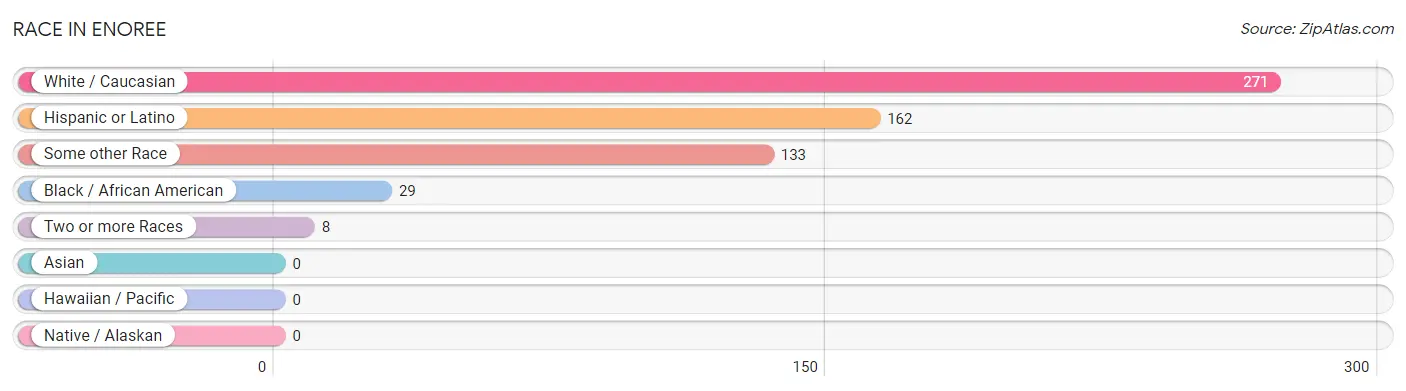
| Race | # Population | % Population |
| Asian | 0 | 0.0% |
| Black / African American | 29 | 6.6% |
| Hawaiian / Pacific | 0 | 0.0% |
| Hispanic or Latino | 162 | 36.7% |
| Native / Alaskan | 0 | 0.0% |
| White / Caucasian | 271 | 61.5% |
| Two or more Races | 8 | 1.8% |
| Some other Race | 133 | 30.2% |
| Total | 441 | 100.0% |
Ancestry in Enoree
The most populous ancestries reported in Enoree are Mexican (78 | 17.7%), Irish (51 | 11.6%), English (43 | 9.8%), German (31 | 7.0%), and Puerto Rican (28 | 6.4%), together accounting for 52.4% of all Enoree residents.
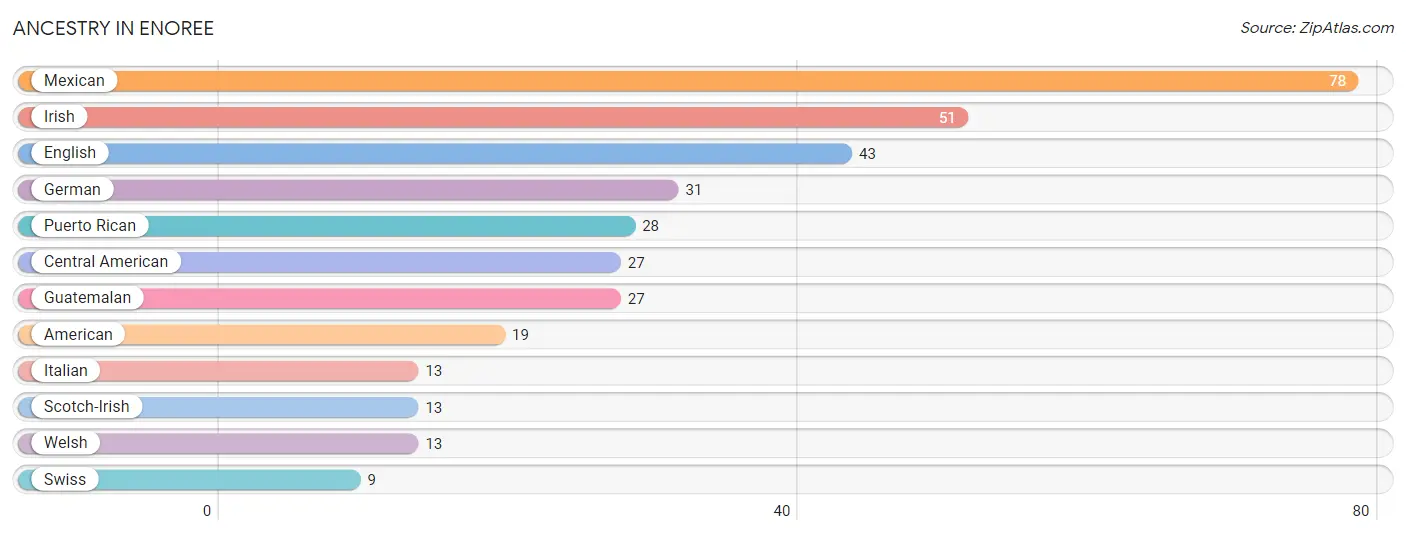
| Ancestry | # Population | % Population |
| American | 19 | 4.3% |
| Central American | 27 | 6.1% |
| English | 43 | 9.8% |
| German | 31 | 7.0% |
| Guatemalan | 27 | 6.1% |
| Irish | 51 | 11.6% |
| Italian | 13 | 2.9% |
| Mexican | 78 | 17.7% |
| Puerto Rican | 28 | 6.4% |
| Scotch-Irish | 13 | 2.9% |
| Swiss | 9 | 2.0% |
| Welsh | 13 | 2.9% | View All 12 Rows |
Immigrants in Enoree
The most numerous immigrant groups reported in Enoree came from Latin America (82 | 18.6%), Central America (53 | 12.0%), Colombia (29 | 6.6%), South America (29 | 6.6%), and Guatemala (27 | 6.1%), together accounting for 49.9% of all Enoree residents.
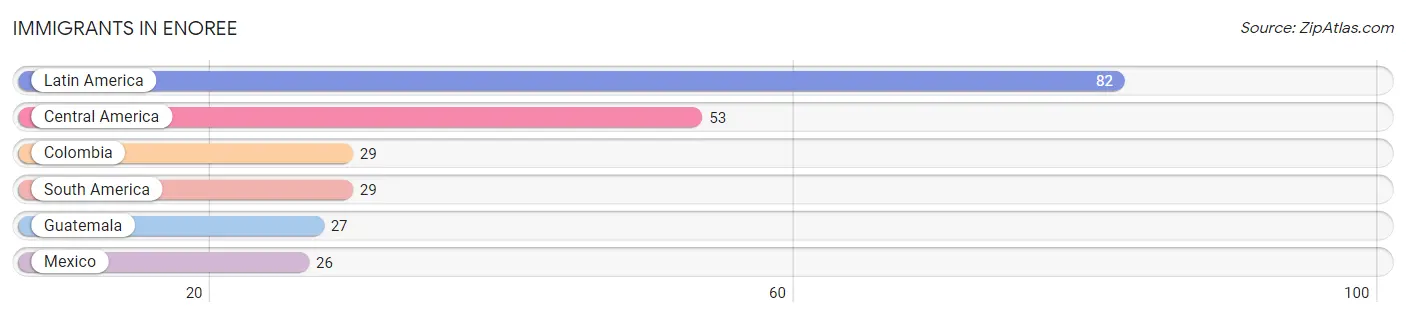
| Immigration Origin | # Population | % Population |
| Central America | 53 | 12.0% |
| Colombia | 29 | 6.6% |
| Guatemala | 27 | 6.1% |
| Latin America | 82 | 18.6% |
| Mexico | 26 | 5.9% |
| South America | 29 | 6.6% | View All 6 Rows |
Sex and Age in Enoree
Sex and Age in Enoree
The most populous age groups in Enoree are 40 to 44 Years (68 | 31.6%) for men and 40 to 44 Years (55 | 24.3%) for women.
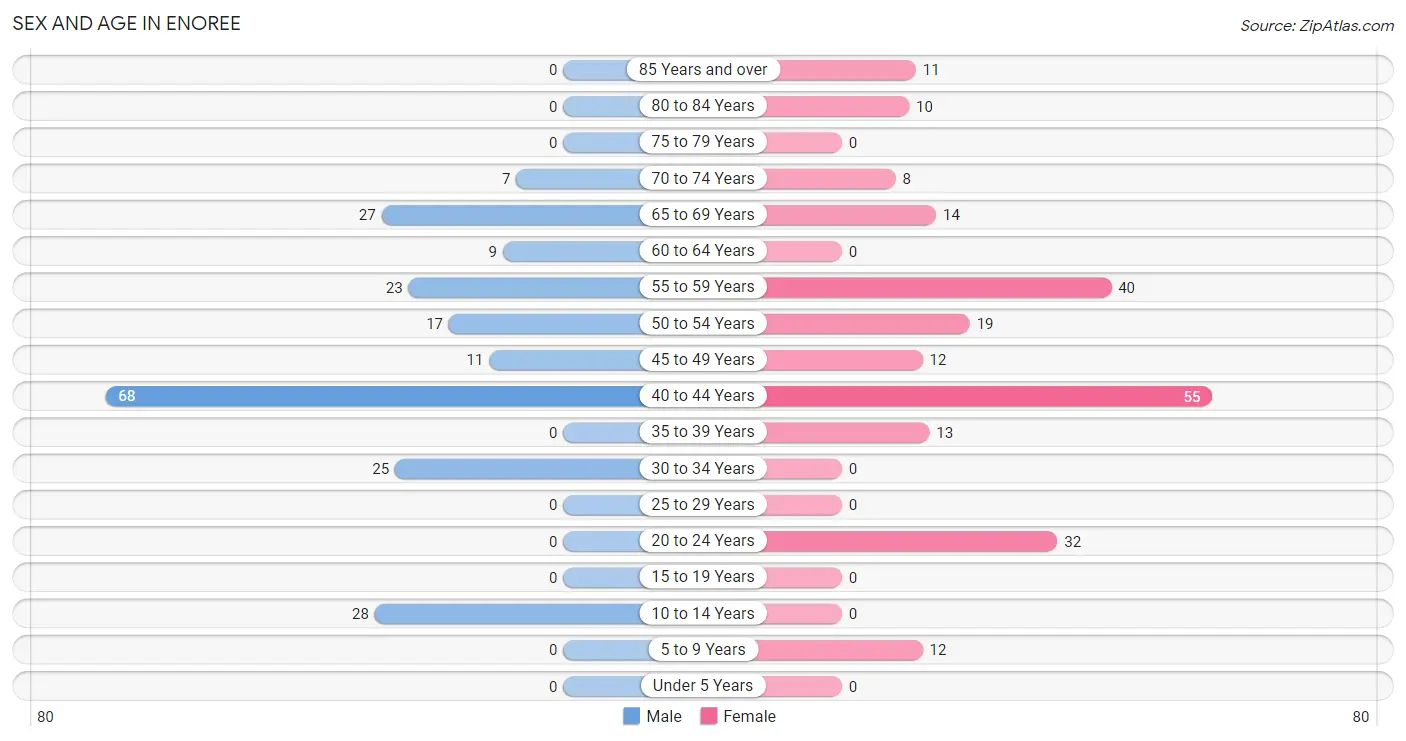
| Age Bracket | Male | Female |
| Under 5 Years | 0 (0.0%) | 0 (0.0%) |
| 5 to 9 Years | 0 (0.0%) | 12 (5.3%) |
| 10 to 14 Years | 28 (13.0%) | 0 (0.0%) |
| 15 to 19 Years | 0 (0.0%) | 0 (0.0%) |
| 20 to 24 Years | 0 (0.0%) | 32 (14.2%) |
| 25 to 29 Years | 0 (0.0%) | 0 (0.0%) |
| 30 to 34 Years | 25 (11.6%) | 0 (0.0%) |
| 35 to 39 Years | 0 (0.0%) | 13 (5.8%) |
| 40 to 44 Years | 68 (31.6%) | 55 (24.3%) |
| 45 to 49 Years | 11 (5.1%) | 12 (5.3%) |
| 50 to 54 Years | 17 (7.9%) | 19 (8.4%) |
| 55 to 59 Years | 23 (10.7%) | 40 (17.7%) |
| 60 to 64 Years | 9 (4.2%) | 0 (0.0%) |
| 65 to 69 Years | 27 (12.6%) | 14 (6.2%) |
| 70 to 74 Years | 7 (3.3%) | 8 (3.5%) |
| 75 to 79 Years | 0 (0.0%) | 0 (0.0%) |
| 80 to 84 Years | 0 (0.0%) | 10 (4.4%) |
| 85 Years and over | 0 (0.0%) | 11 (4.9%) |
| Total | 215 (100.0%) | 226 (100.0%) |
Families and Households in Enoree
Median Family Size in Enoree
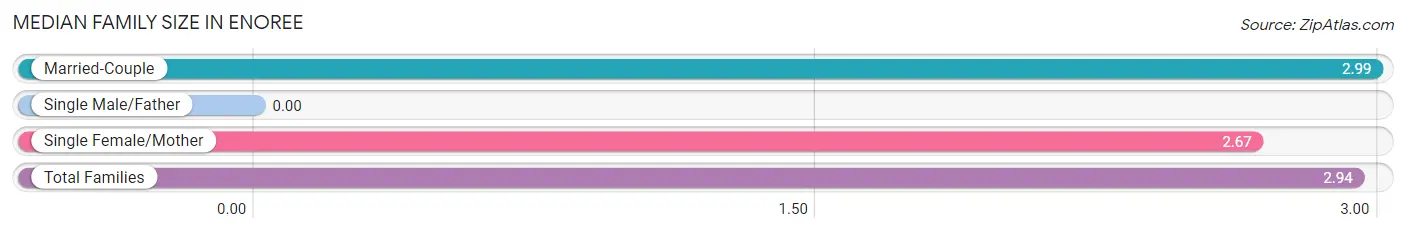
| Family Type | # Families | Family Size |
| Married-Couple | 95 (84.1%) | 2.99 |
| Single Male/Father | 0 (0.0%) | - |
| Single Female/Mother | 18 (15.9%) | 2.67 |
| Total Families | 113 (100.0%) | 2.94 |
Median Household Size in Enoree
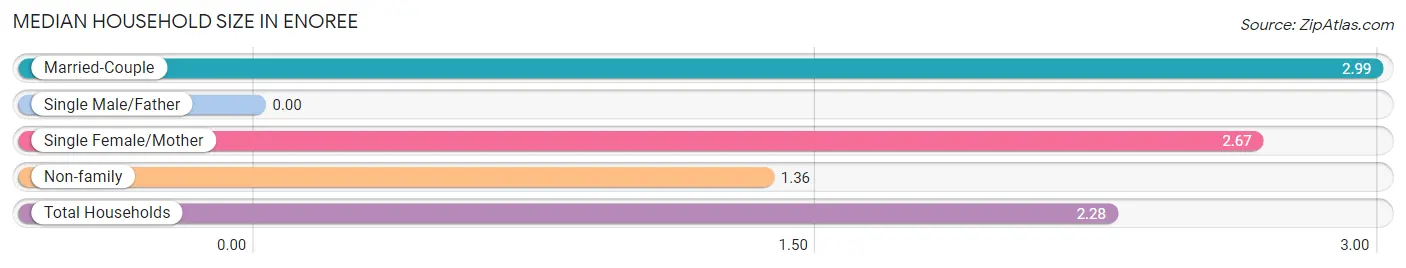
| Household Type | # Households | Household Size |
| Married-Couple | 95 (49.2%) | 2.99 |
| Single Male/Father | 0 (0.0%) | - |
| Single Female/Mother | 18 (9.3%) | 2.67 |
| Non-family | 80 (41.4%) | 1.36 |
| Total Households | 193 (100.0%) | 2.28 |
Household Size by Marriage Status in Enoree
Out of a total of 193 households in Enoree, 113 (58.6%) are family households, while 80 (41.4%) are nonfamily households. The most numerous type of family households are 2-person households, comprising 56, and the most common type of nonfamily households are 1-person households, comprising 52.
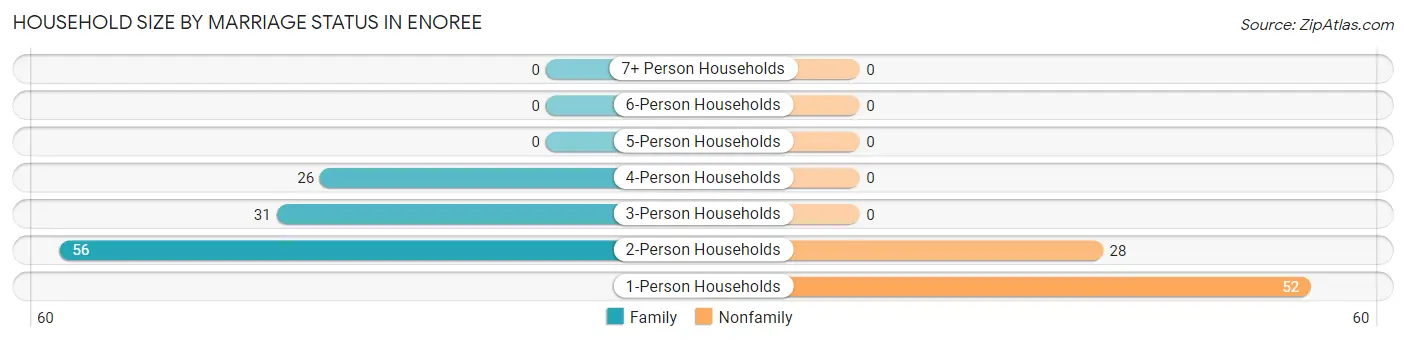
| Household Size | Family Households | Nonfamily Households |
| 1-Person Households | - | 52 (26.9%) |
| 2-Person Households | 56 (29.0%) | 28 (14.5%) |
| 3-Person Households | 31 (16.1%) | 0 (0.0%) |
| 4-Person Households | 26 (13.5%) | 0 (0.0%) |
| 5-Person Households | 0 (0.0%) | 0 (0.0%) |
| 6-Person Households | 0 (0.0%) | 0 (0.0%) |
| 7+ Person Households | 0 (0.0%) | 0 (0.0%) |
| Total | 113 (58.6%) | 80 (41.4%) |
Female Fertility in Enoree
Fertility by Age in Enoree
| Age Bracket | Women with Births | Births / 1,000 Women |
| 15 to 19 years | 0 (0.0%) | 0.0 |
| 20 to 34 years | 0 (0.0%) | 0.0 |
| 35 to 50 years | 0 (0.0%) | 0.0 |
| Total | 0 (0.0%) | 0.0 |
Fertility by Age by Marriage Status in Enoree
| Age Bracket | Married | Unmarried |
| 15 to 19 years | 0 (0.0%) | 0 (0.0%) |
| 20 to 34 years | 0 (0.0%) | 0 (0.0%) |
| 35 to 50 years | 0 (0.0%) | 0 (0.0%) |
| Total | 0 (0.0%) | 0 (0.0%) |
Fertility by Education in Enoree
| Educational Attainment | Women with Births | Births / 1,000 Women |
| Less than High School | 0 (0.0%) | 0.0 |
| High School Diploma | 0 (0.0%) | 0.0 |
| College or Associate's Degree | 0 (0.0%) | 0.0 |
| Bachelor's Degree | 0 (0.0%) | 0.0 |
| Graduate Degree | 0 (0.0%) | 0.0 |
| Total | 0 (0.0%) | 0.0 |
Fertility by Education by Marriage Status in Enoree
| Educational Attainment | Married | Unmarried |
| Less than High School | 0 (0.0%) | 0 (0.0%) |
| High School Diploma | 0 (0.0%) | 0 (0.0%) |
| College or Associate's Degree | 0 (0.0%) | 0 (0.0%) |
| Bachelor's Degree | 0 (0.0%) | 0 (0.0%) |
| Graduate Degree | 0 (0.0%) | 0 (0.0%) |
| Total | 0 (0.0%) | 0 (0.0%) |
Employment Characteristics in Enoree
Employment by Class of Employer in Enoree
Among the 199 employed individuals in Enoree, private company employees (95 | 47.7%), self-employed (not incorporated) (87 | 43.7%), and local government employees (17 | 8.5%) make up the most common classes of employment.
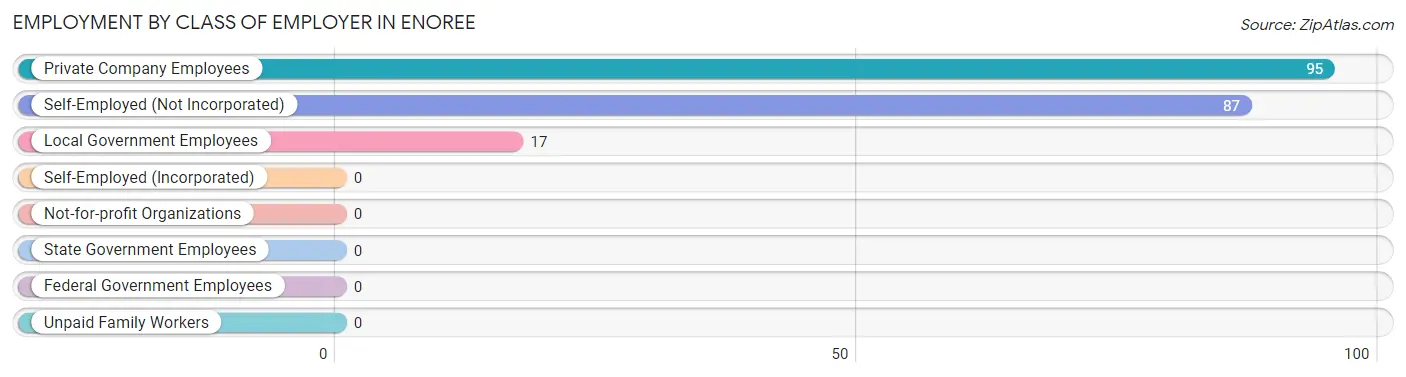
| Employer Class | # Employees | % Employees |
| Private Company Employees | 95 | 47.7% |
| Self-Employed (Incorporated) | 0 | 0.0% |
| Self-Employed (Not Incorporated) | 87 | 43.7% |
| Not-for-profit Organizations | 0 | 0.0% |
| Local Government Employees | 17 | 8.5% |
| State Government Employees | 0 | 0.0% |
| Federal Government Employees | 0 | 0.0% |
| Unpaid Family Workers | 0 | 0.0% |
| Total | 199 | 100.0% |
Employment Status by Age in Enoree
According to the labor force statistics for Enoree, out of the total population over 16 years of age (401), 56.6% or 227 individuals are in the labor force, with 12.3% or 28 of them unemployed. The age group with the highest labor force participation rate is 30 to 34 years, with 100.0% or 25 individuals in the labor force. Within the labor force, the 35 to 44 years age range has the highest percentage of unemployed individuals, with 22.8% or 28 of them being unemployed.
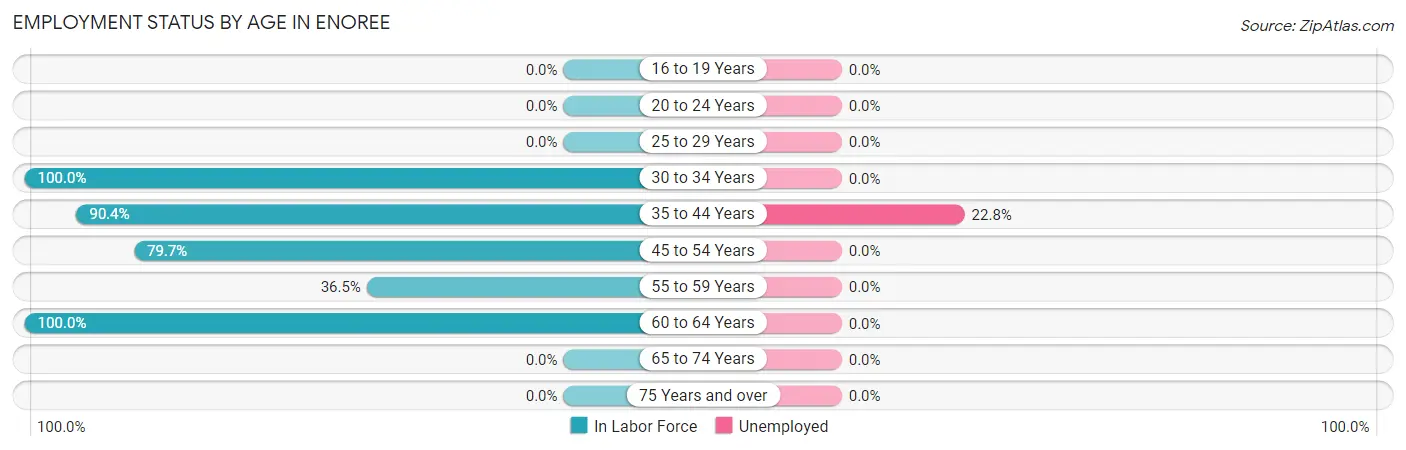
| Age Bracket | In Labor Force | Unemployed |
| 16 to 19 Years | 0 (0.0%) | 0 (0.0%) |
| 20 to 24 Years | 0 (0.0%) | 0 (0.0%) |
| 25 to 29 Years | 0 (0.0%) | 0 (0.0%) |
| 30 to 34 Years | 25 (100.0%) | 0 (0.0%) |
| 35 to 44 Years | 123 (90.4%) | 28 (22.8%) |
| 45 to 54 Years | 47 (79.7%) | 0 (0.0%) |
| 55 to 59 Years | 23 (36.5%) | 0 (0.0%) |
| 60 to 64 Years | 9 (100.0%) | 0 (0.0%) |
| 65 to 74 Years | 0 (0.0%) | 0 (0.0%) |
| 75 Years and over | 0 (0.0%) | 0 (0.0%) |
| Total | 227 (56.6%) | 28 (12.3%) |
Employment Status by Educational Attainment in Enoree
According to labor force statistics for Enoree, 77.7% of individuals (227) out of the total population between 25 and 64 years of age (292) are in the labor force, with 12.3% or 28 of them being unemployed. The group with the highest labor force participation rate are those with the educational attainment of college / associate degree, with 84.7% or 72 individuals in the labor force. Within the labor force, individuals with college / associate degree education have the highest percentage of unemployment, with 38.9% or 28 of them being unemployed.
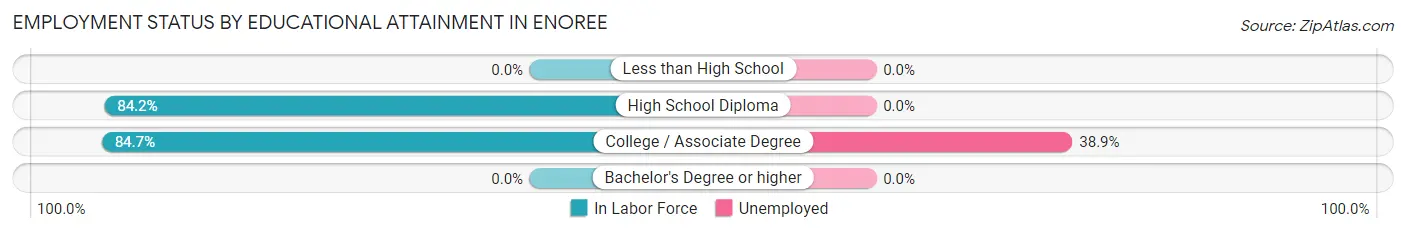
| Educational Attainment | In Labor Force | Unemployed |
| Less than High School | 0 (0.0%) | 0 (0.0%) |
| High School Diploma | 155 (84.2%) | 0 (0.0%) |
| College / Associate Degree | 72 (84.7%) | 33 (38.9%) |
| Bachelor's Degree or higher | 0 (0.0%) | 0 (0.0%) |
| Total | 227 (77.7%) | 36 (12.3%) |
Employment Occupations by Sex in Enoree
Management, Business, Science and Arts Occupations
The most common Management, Business, Science and Arts occupations in Enoree are Management (13 | 6.5%), Computers, Engineering & Science (9 | 4.5%), and Architecture & Engineering (9 | 4.5%).
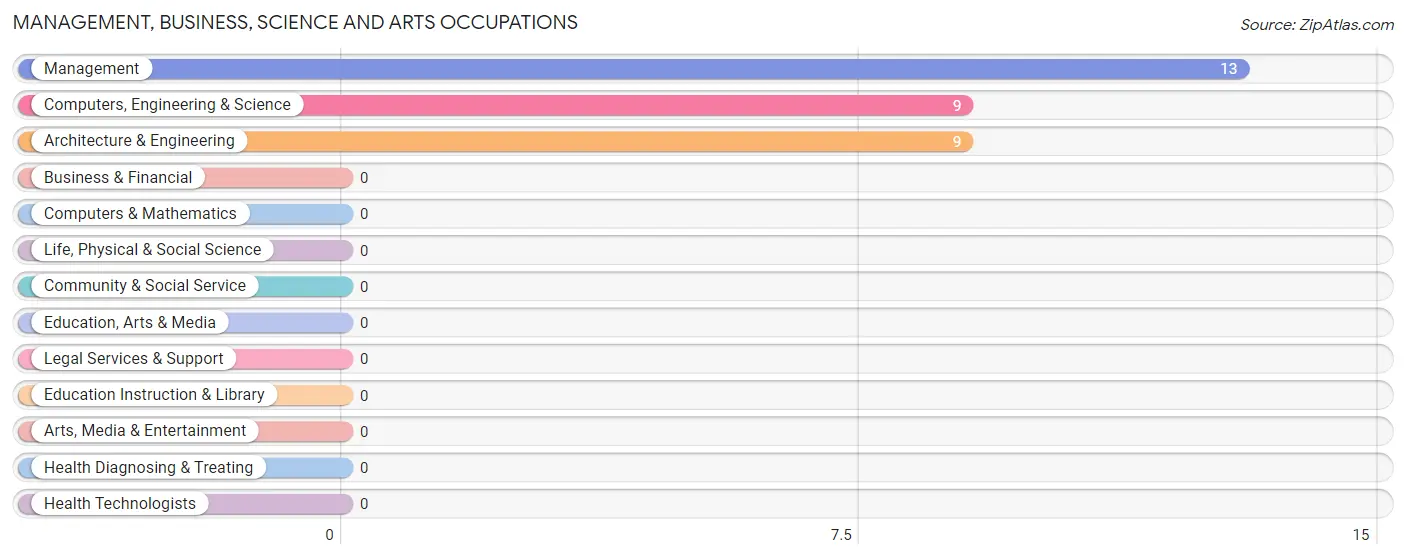
Management, Business, Science and Arts Occupations by Sex
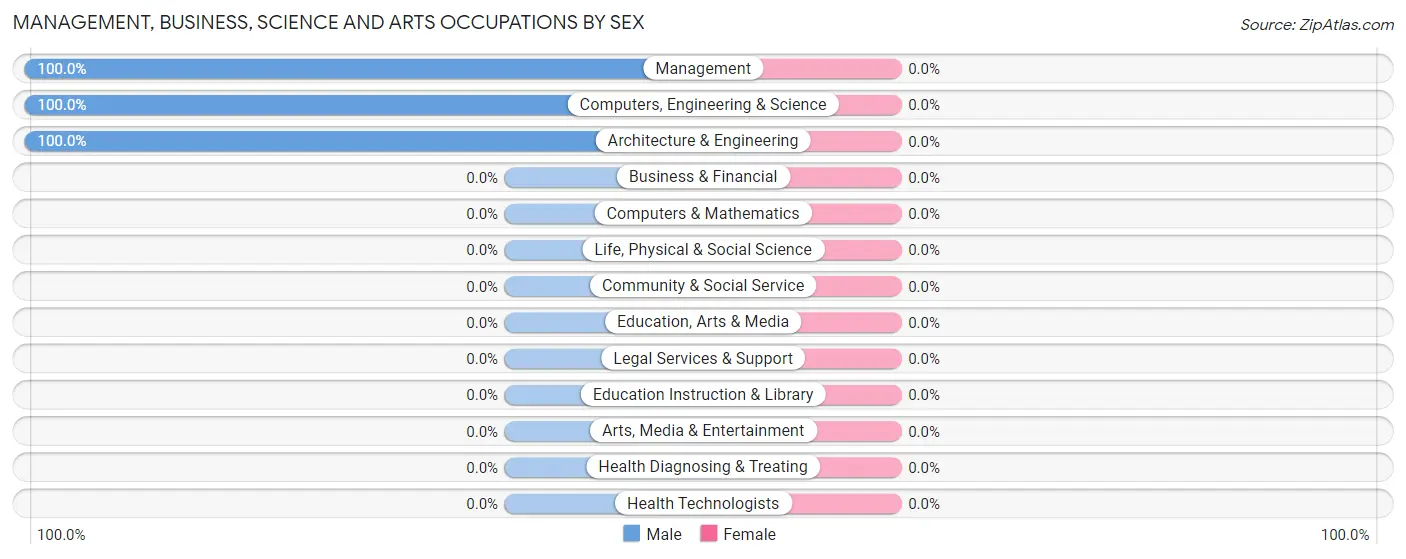
| Occupation | Male | Female |
| Management | 13 (100.0%) | 0 (0.0%) |
| Business & Financial | 0 (0.0%) | 0 (0.0%) |
| Computers, Engineering & Science | 9 (100.0%) | 0 (0.0%) |
| Computers & Mathematics | 0 (0.0%) | 0 (0.0%) |
| Architecture & Engineering | 9 (100.0%) | 0 (0.0%) |
| Life, Physical & Social Science | 0 (0.0%) | 0 (0.0%) |
| Community & Social Service | 0 (0.0%) | 0 (0.0%) |
| Education, Arts & Media | 0 (0.0%) | 0 (0.0%) |
| Legal Services & Support | 0 (0.0%) | 0 (0.0%) |
| Education Instruction & Library | 0 (0.0%) | 0 (0.0%) |
| Arts, Media & Entertainment | 0 (0.0%) | 0 (0.0%) |
| Health Diagnosing & Treating | 0 (0.0%) | 0 (0.0%) |
| Health Technologists | 0 (0.0%) | 0 (0.0%) |
| Total (Category) | 22 (100.0%) | 0 (0.0%) |
| Total (Overall) | 114 (57.3%) | 85 (42.7%) |
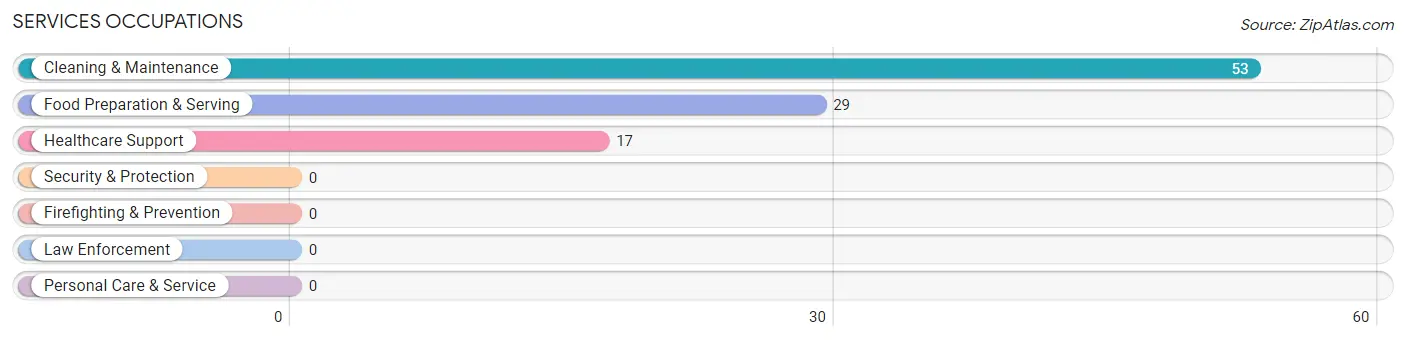
Services Occupations
The most common Services occupations in Enoree are Cleaning & Maintenance (53 | 26.6%), Food Preparation & Serving (29 | 14.6%), and Healthcare Support (17 | 8.5%).
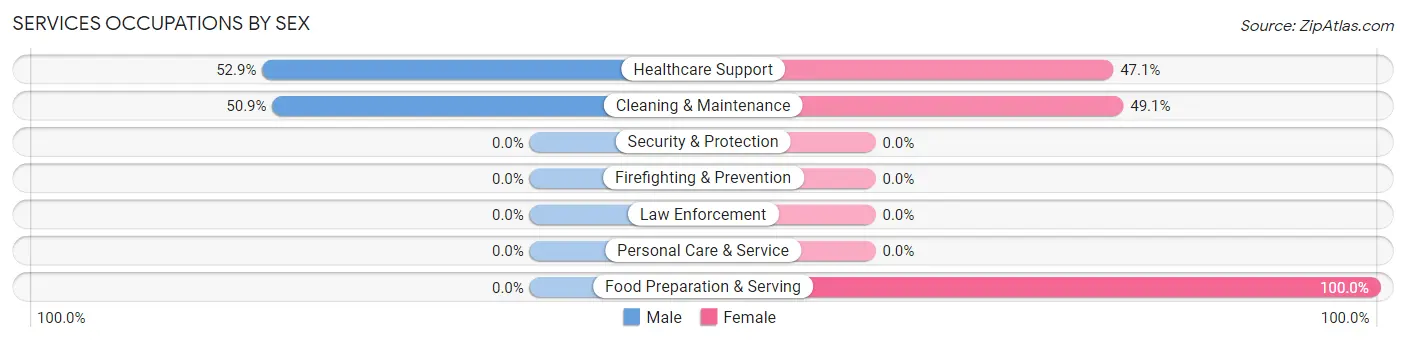
Services Occupations by Sex
Within the Services occupations in Enoree, the most male-oriented occupations are Healthcare Support (52.9%), and Cleaning & Maintenance (50.9%), while the most female-oriented occupations are Food Preparation & Serving (100.0%), Cleaning & Maintenance (49.1%), and Healthcare Support (47.1%).
| Occupation | Male | Female |
| Healthcare Support | 9 (52.9%) | 8 (47.1%) |
| Security & Protection | 0 (0.0%) | 0 (0.0%) |
| Firefighting & Prevention | 0 (0.0%) | 0 (0.0%) |
| Law Enforcement | 0 (0.0%) | 0 (0.0%) |
| Food Preparation & Serving | 0 (0.0%) | 29 (100.0%) |
| Cleaning & Maintenance | 27 (50.9%) | 26 (49.1%) |
| Personal Care & Service | 0 (0.0%) | 0 (0.0%) |
| Total (Category) | 36 (36.4%) | 63 (63.6%) |
| Total (Overall) | 114 (57.3%) | 85 (42.7%) |
Sales and Office Occupations
The most common Sales and Office occupations in Enoree are Sales & Related (11 | 5.5%), and Office & Administration (11 | 5.5%).
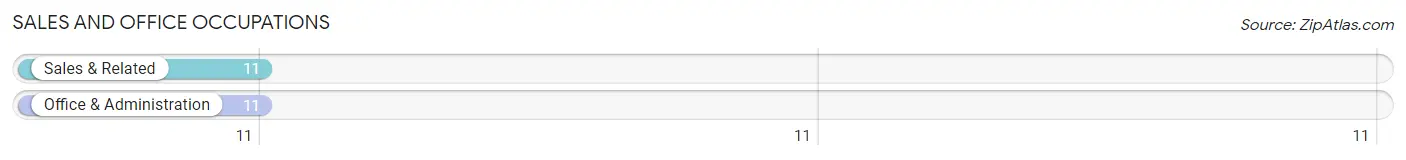
Sales and Office Occupations by Sex
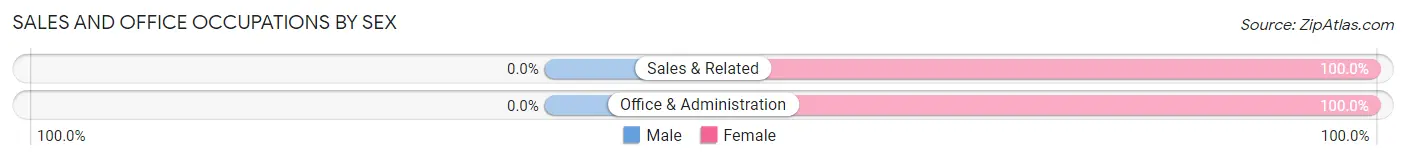
| Occupation | Male | Female |
| Sales & Related | 0 (0.0%) | 11 (100.0%) |
| Office & Administration | 0 (0.0%) | 11 (100.0%) |
| Total (Category) | 0 (0.0%) | 22 (100.0%) |
| Total (Overall) | 114 (57.3%) | 85 (42.7%) |
Natural Resources, Construction and Maintenance Occupations
The most common Natural Resources, Construction and Maintenance occupations in Enoree are Installation, Maintenance & Repair (25 | 12.6%), and Construction & Extraction (12 | 6.0%).
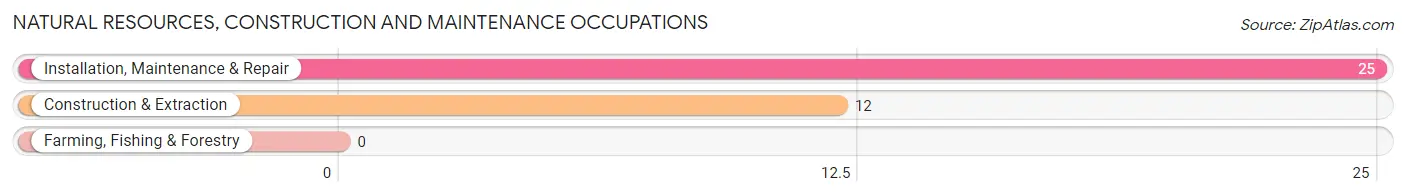
Natural Resources, Construction and Maintenance Occupations by Sex
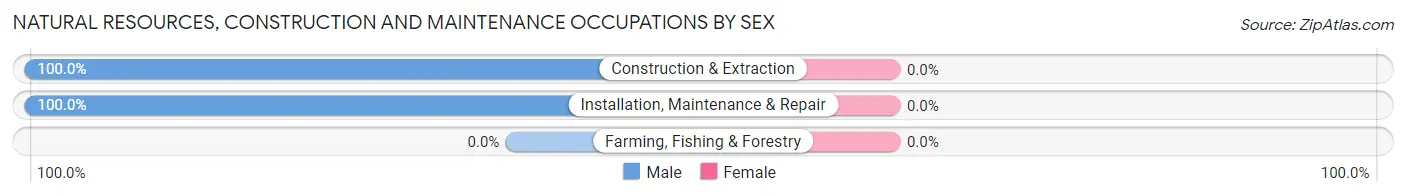
| Occupation | Male | Female |
| Farming, Fishing & Forestry | 0 (0.0%) | 0 (0.0%) |
| Construction & Extraction | 12 (100.0%) | 0 (0.0%) |
| Installation, Maintenance & Repair | 25 (100.0%) | 0 (0.0%) |
| Total (Category) | 37 (100.0%) | 0 (0.0%) |
| Total (Overall) | 114 (57.3%) | 85 (42.7%) |
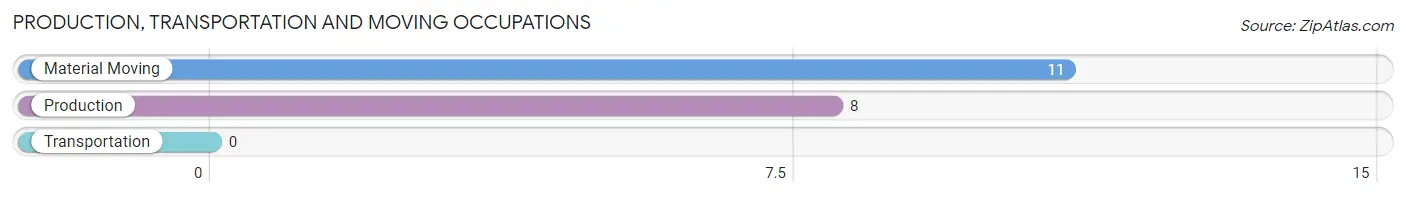
Production, Transportation and Moving Occupations
The most common Production, Transportation and Moving occupations in Enoree are Material Moving (11 | 5.5%), and Production (8 | 4.0%).
Production, Transportation and Moving Occupations by Sex
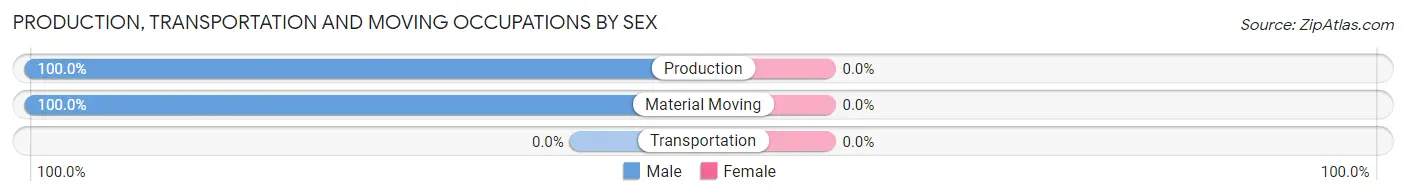
| Occupation | Male | Female |
| Production | 8 (100.0%) | 0 (0.0%) |
| Transportation | 0 (0.0%) | 0 (0.0%) |
| Material Moving | 11 (100.0%) | 0 (0.0%) |
| Total (Category) | 19 (100.0%) | 0 (0.0%) |
| Total (Overall) | 114 (57.3%) | 85 (42.7%) |
Employment Industries by Sex in Enoree
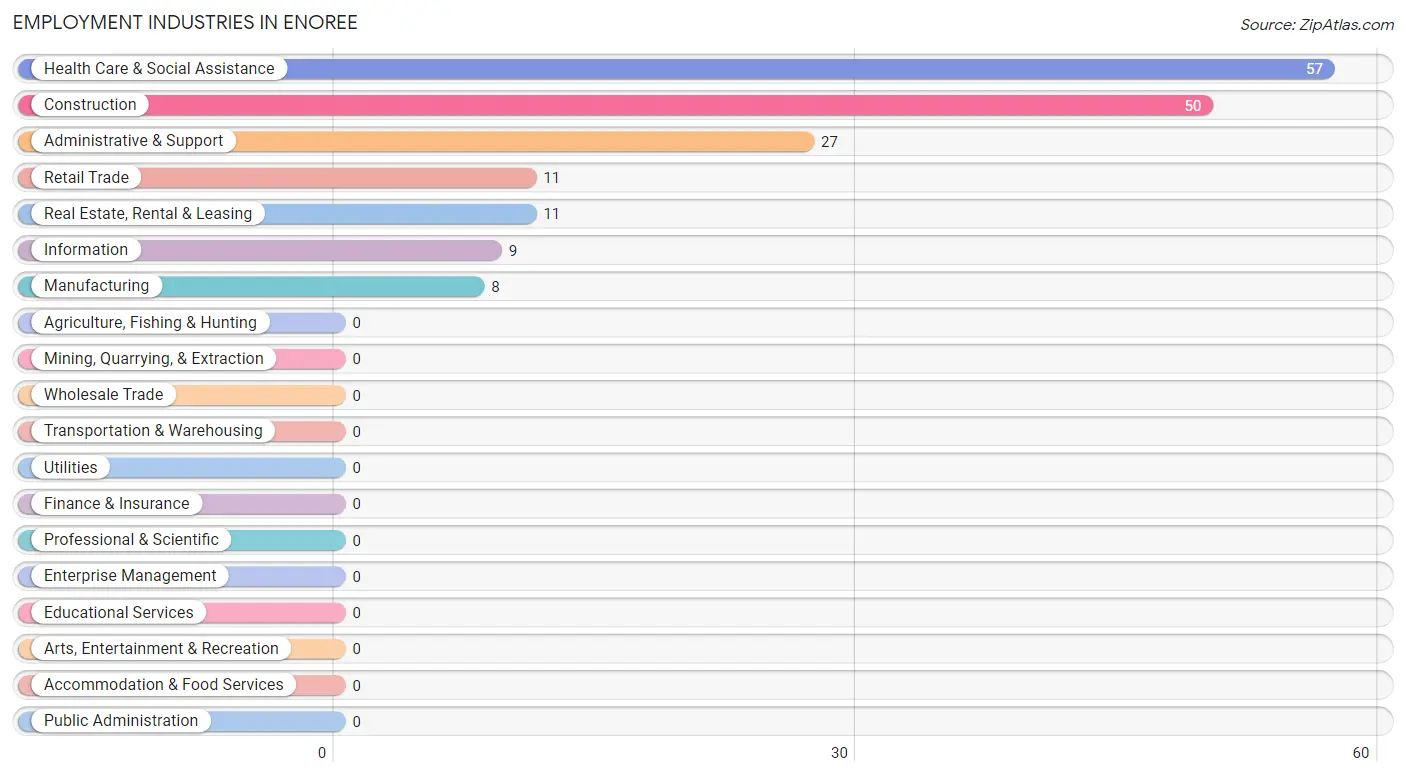
Employment Industries in Enoree
The major employment industries in Enoree include Health Care & Social Assistance (57 | 28.6%), Construction (50 | 25.1%), Administrative & Support (27 | 13.6%), Retail Trade (11 | 5.5%), and Real Estate, Rental & Leasing (11 | 5.5%).
Employment Industries by Sex in Enoree
The Enoree industries that see more men than women are Construction (100.0%), Manufacturing (100.0%), and Retail Trade (100.0%), whereas the industries that tend to have a higher number of women are Real Estate, Rental & Leasing (100.0%), and Health Care & Social Assistance (84.2%).
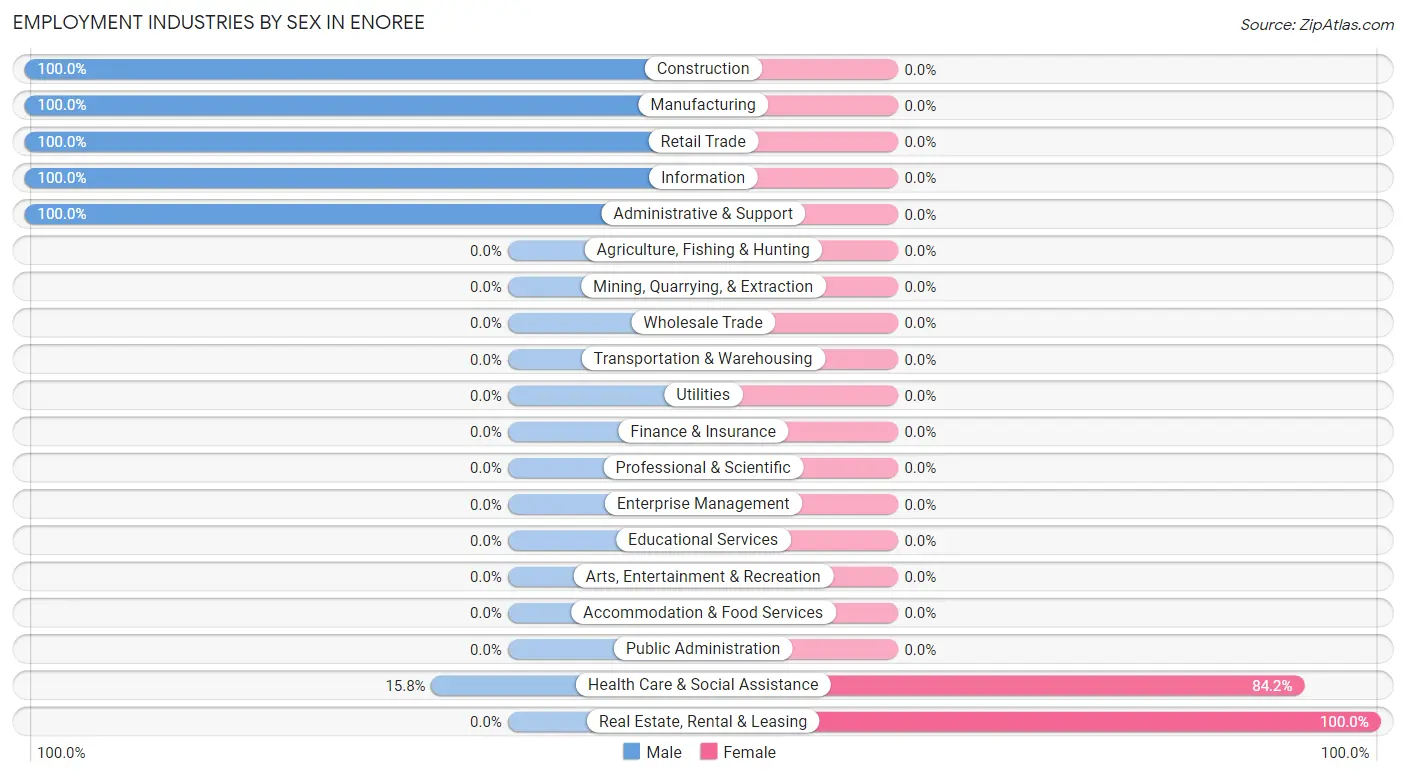
| Industry | Male | Female |
| Agriculture, Fishing & Hunting | 0 (0.0%) | 0 (0.0%) |
| Mining, Quarrying, & Extraction | 0 (0.0%) | 0 (0.0%) |
| Construction | 50 (100.0%) | 0 (0.0%) |
| Manufacturing | 8 (100.0%) | 0 (0.0%) |
| Wholesale Trade | 0 (0.0%) | 0 (0.0%) |
| Retail Trade | 11 (100.0%) | 0 (0.0%) |
| Transportation & Warehousing | 0 (0.0%) | 0 (0.0%) |
| Utilities | 0 (0.0%) | 0 (0.0%) |
| Information | 9 (100.0%) | 0 (0.0%) |
| Finance & Insurance | 0 (0.0%) | 0 (0.0%) |
| Real Estate, Rental & Leasing | 0 (0.0%) | 11 (100.0%) |
| Professional & Scientific | 0 (0.0%) | 0 (0.0%) |
| Enterprise Management | 0 (0.0%) | 0 (0.0%) |
| Administrative & Support | 27 (100.0%) | 0 (0.0%) |
| Educational Services | 0 (0.0%) | 0 (0.0%) |
| Health Care & Social Assistance | 9 (15.8%) | 48 (84.2%) |
| Arts, Entertainment & Recreation | 0 (0.0%) | 0 (0.0%) |
| Accommodation & Food Services | 0 (0.0%) | 0 (0.0%) |
| Public Administration | 0 (0.0%) | 0 (0.0%) |
| Total | 114 (57.3%) | 85 (42.7%) |
Education in Enoree
School Enrollment in Enoree
The most common levels of schooling among the 64 students in Enoree are middle school (28 | 43.8%), college / undergraduate (24 | 37.5%), and kindergarten (12 | 18.8%).
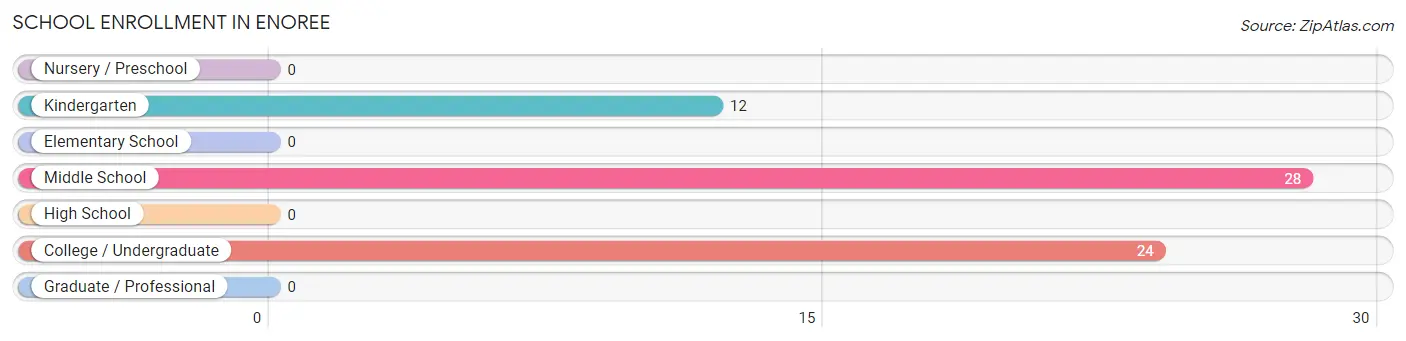
| School Level | # Students | % Students |
| Nursery / Preschool | 0 | 0.0% |
| Kindergarten | 12 | 18.8% |
| Elementary School | 0 | 0.0% |
| Middle School | 28 | 43.8% |
| High School | 0 | 0.0% |
| College / Undergraduate | 24 | 37.5% |
| Graduate / Professional | 0 | 0.0% |
| Total | 64 | 100.0% |
School Enrollment by Age by Funding Source in Enoree
Out of a total of 64 students who are enrolled in schools in Enoree, 24 (37.5%) attend a private institution, while the remaining 40 (62.5%) are enrolled in public schools. The age group of 20 to 24 year olds has the highest likelihood of being enrolled in private schools, with 24 (100.0% in the age bracket) enrolled. Conversely, the age group of 5 to 9 year old has the lowest likelihood of being enrolled in a private school, with 12 (100.0% in the age bracket) attending a public institution.
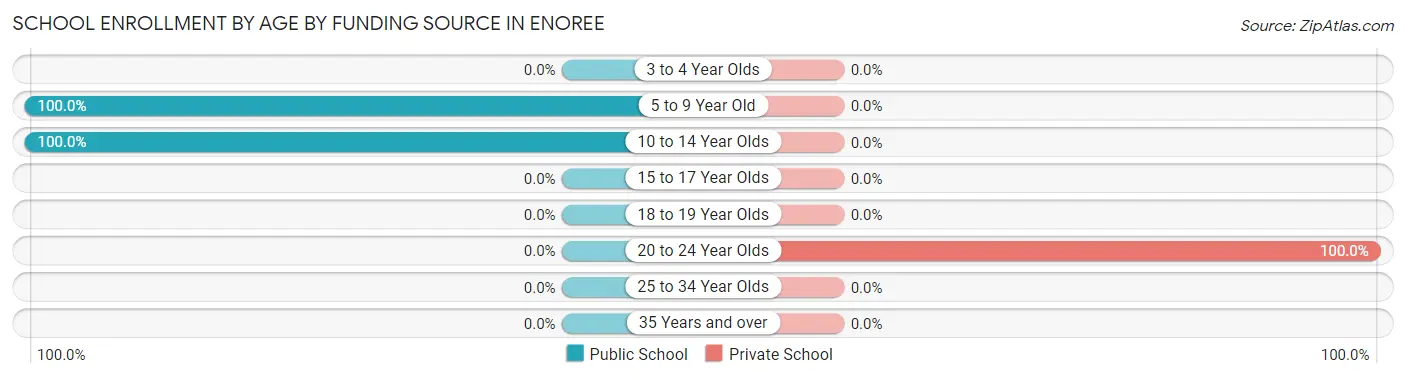
| Age Bracket | Public School | Private School |
| 3 to 4 Year Olds | 0 (0.0%) | 0 (0.0%) |
| 5 to 9 Year Old | 12 (100.0%) | 0 (0.0%) |
| 10 to 14 Year Olds | 28 (100.0%) | 0 (0.0%) |
| 15 to 17 Year Olds | 0 (0.0%) | 0 (0.0%) |
| 18 to 19 Year Olds | 0 (0.0%) | 0 (0.0%) |
| 20 to 24 Year Olds | 0 (0.0%) | 24 (100.0%) |
| 25 to 34 Year Olds | 0 (0.0%) | 0 (0.0%) |
| 35 Years and over | 0 (0.0%) | 0 (0.0%) |
| Total | 40 (62.5%) | 24 (37.5%) |
Educational Attainment by Field of Study in Enoree
, and education (10 | 100.0%) are the most common fields of study among 10 individuals in Enoree who have obtained a bachelor's degree or higher.
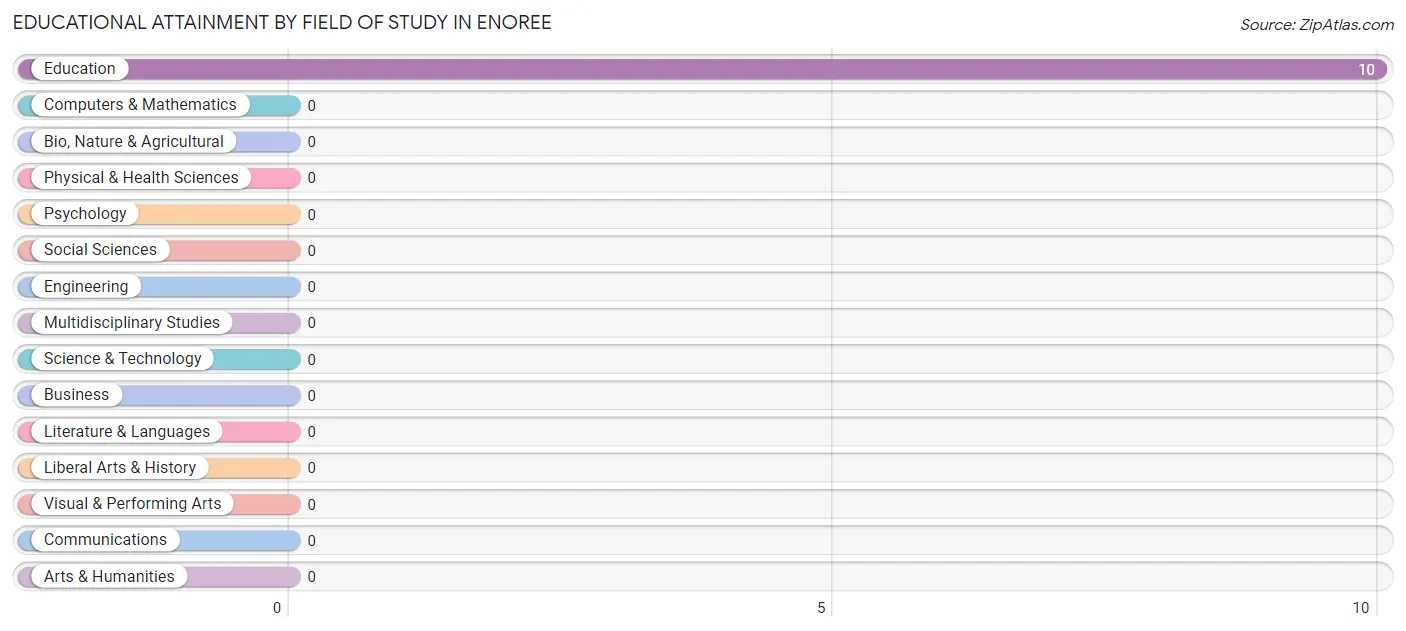
| Field of Study | # Graduates | % Graduates |
| Computers & Mathematics | 0 | 0.0% |
| Bio, Nature & Agricultural | 0 | 0.0% |
| Physical & Health Sciences | 0 | 0.0% |
| Psychology | 0 | 0.0% |
| Social Sciences | 0 | 0.0% |
| Engineering | 0 | 0.0% |
| Multidisciplinary Studies | 0 | 0.0% |
| Science & Technology | 0 | 0.0% |
| Business | 0 | 0.0% |
| Education | 10 | 100.0% |
| Literature & Languages | 0 | 0.0% |
| Liberal Arts & History | 0 | 0.0% |
| Visual & Performing Arts | 0 | 0.0% |
| Communications | 0 | 0.0% |
| Arts & Humanities | 0 | 0.0% |
| Total | 10 | 100.0% |
Transportation & Commute in Enoree
Vehicle Availability by Sex in Enoree
The most prevalent vehicle ownership categories in Enoree are males with 2 vehicles (69, accounting for 60.5%) and females with 2 vehicles (66, making up 81.2%).
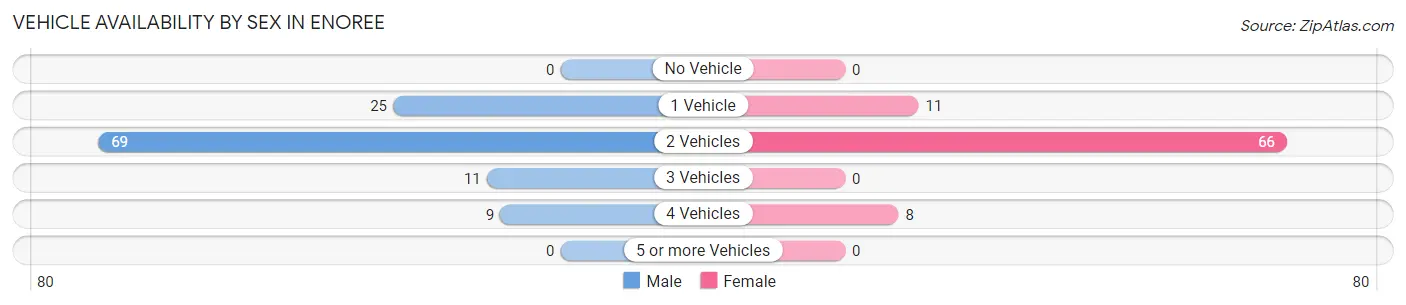
| Vehicles Available | Male | Female |
| No Vehicle | 0 (0.0%) | 0 (0.0%) |
| 1 Vehicle | 25 (21.9%) | 11 (12.9%) |
| 2 Vehicles | 69 (60.5%) | 66 (77.6%) |
| 3 Vehicles | 11 (9.7%) | 0 (0.0%) |
| 4 Vehicles | 9 (7.9%) | 8 (9.4%) |
| 5 or more Vehicles | 0 (0.0%) | 0 (0.0%) |
| Total | 114 (100.0%) | 85 (100.0%) |
Commute Time in Enoree
The most frequently occuring commute durations in Enoree are 15 to 19 minutes (83 commuters, 50.9%), 45 to 59 minutes (41 commuters, 25.2%), and 20 to 24 minutes (18 commuters, 11.0%).
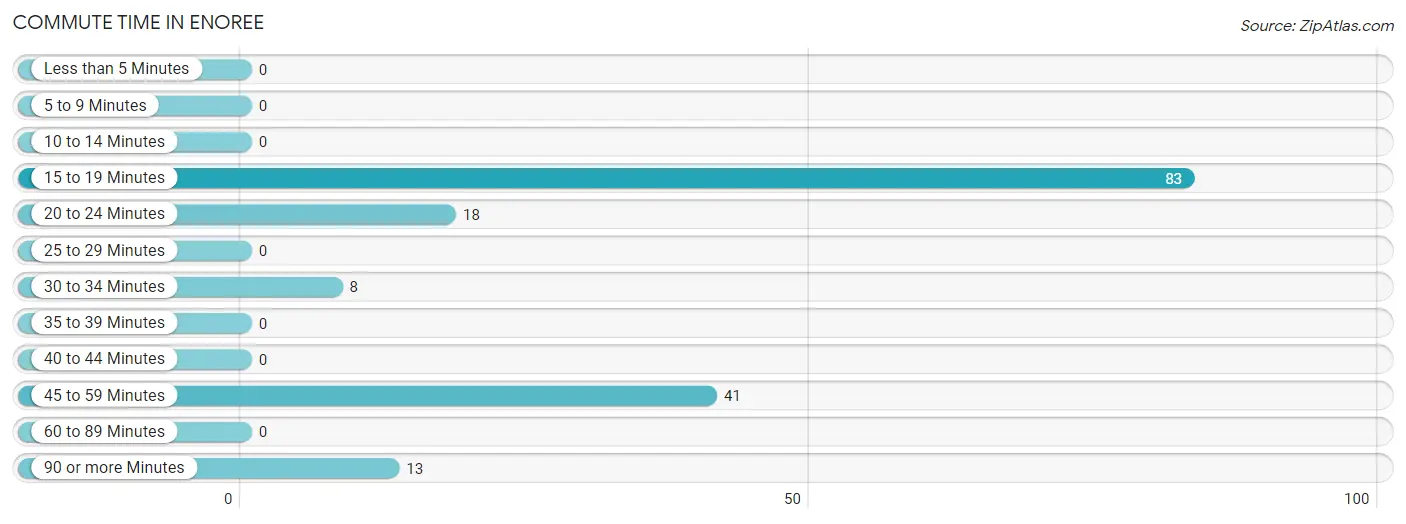
| Commute Time | # Commuters | % Commuters |
| Less than 5 Minutes | 0 | 0.0% |
| 5 to 9 Minutes | 0 | 0.0% |
| 10 to 14 Minutes | 0 | 0.0% |
| 15 to 19 Minutes | 83 | 50.9% |
| 20 to 24 Minutes | 18 | 11.0% |
| 25 to 29 Minutes | 0 | 0.0% |
| 30 to 34 Minutes | 8 | 4.9% |
| 35 to 39 Minutes | 0 | 0.0% |
| 40 to 44 Minutes | 0 | 0.0% |
| 45 to 59 Minutes | 41 | 25.2% |
| 60 to 89 Minutes | 0 | 0.0% |
| 90 or more Minutes | 13 | 8.0% |
Commute Time by Sex in Enoree
The most common commute times in Enoree are 15 to 19 minutes (38 commuters, 42.7%) for males and 15 to 19 minutes (45 commuters, 60.8%) for females.
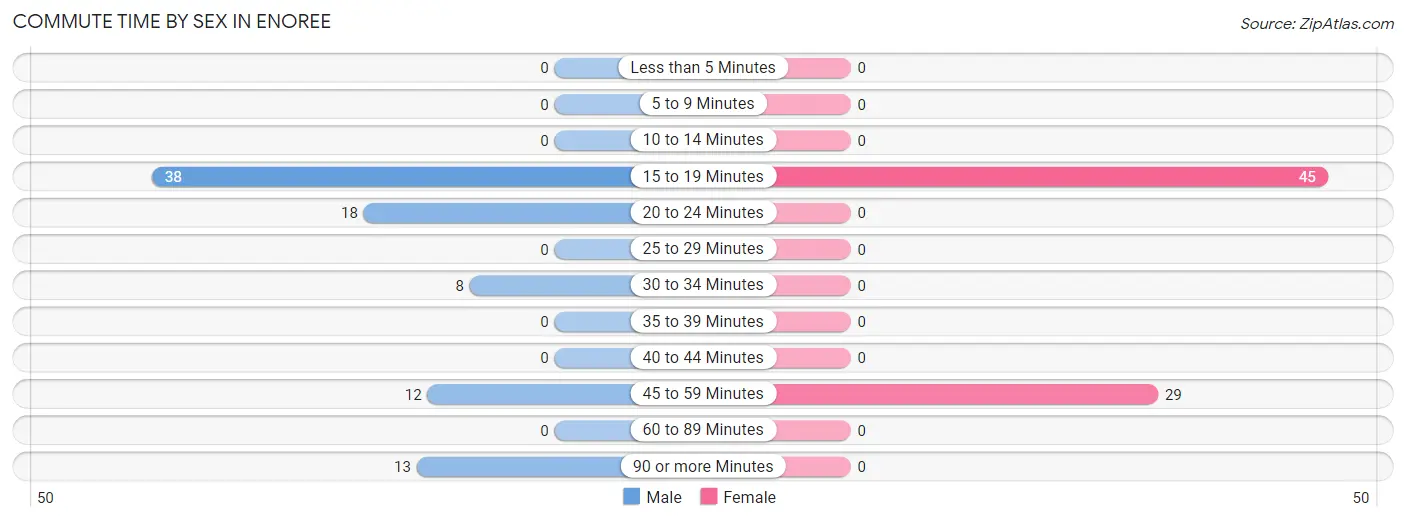
| Commute Time | Male | Female |
| Less than 5 Minutes | 0 (0.0%) | 0 (0.0%) |
| 5 to 9 Minutes | 0 (0.0%) | 0 (0.0%) |
| 10 to 14 Minutes | 0 (0.0%) | 0 (0.0%) |
| 15 to 19 Minutes | 38 (42.7%) | 45 (60.8%) |
| 20 to 24 Minutes | 18 (20.2%) | 0 (0.0%) |
| 25 to 29 Minutes | 0 (0.0%) | 0 (0.0%) |
| 30 to 34 Minutes | 8 (9.0%) | 0 (0.0%) |
| 35 to 39 Minutes | 0 (0.0%) | 0 (0.0%) |
| 40 to 44 Minutes | 0 (0.0%) | 0 (0.0%) |
| 45 to 59 Minutes | 12 (13.5%) | 29 (39.2%) |
| 60 to 89 Minutes | 0 (0.0%) | 0 (0.0%) |
| 90 or more Minutes | 13 (14.6%) | 0 (0.0%) |
Time of Departure to Work by Sex in Enoree
The most frequent times of departure to work in Enoree are 7:30 AM to 7:59 AM (36, 40.5%) for males and 8:30 AM to 8:59 AM (29, 39.2%) for females.
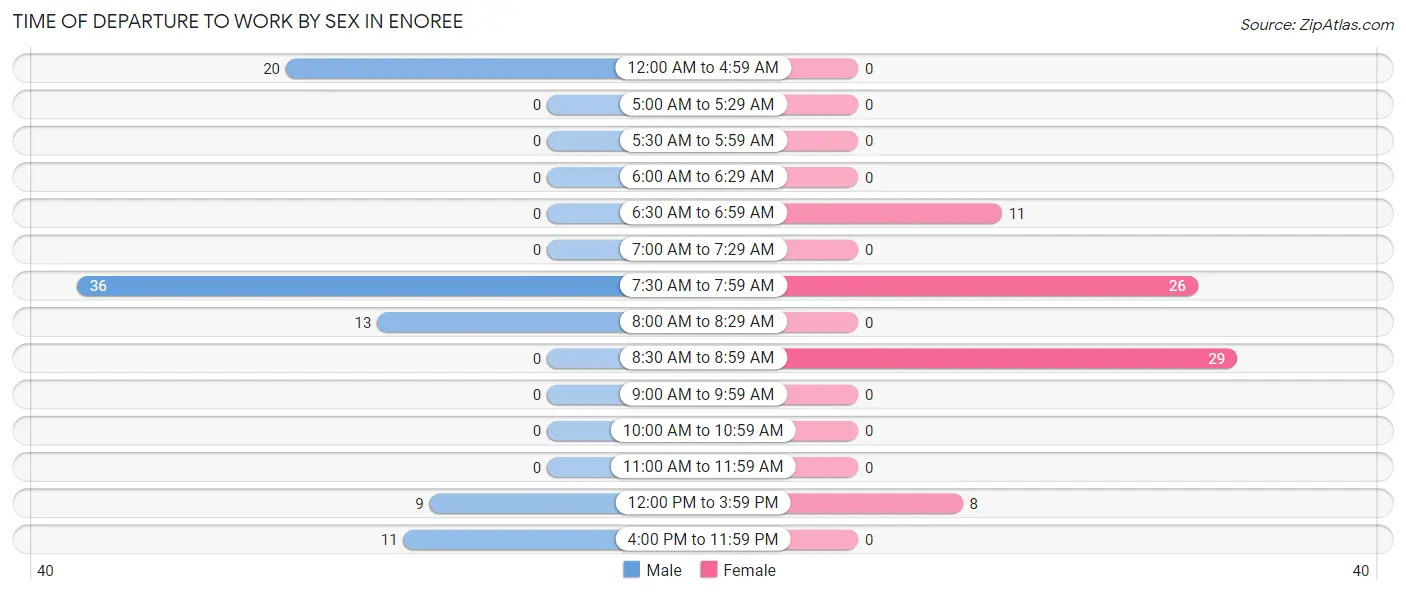
| Time of Departure | Male | Female |
| 12:00 AM to 4:59 AM | 20 (22.5%) | 0 (0.0%) |
| 5:00 AM to 5:29 AM | 0 (0.0%) | 0 (0.0%) |
| 5:30 AM to 5:59 AM | 0 (0.0%) | 0 (0.0%) |
| 6:00 AM to 6:29 AM | 0 (0.0%) | 0 (0.0%) |
| 6:30 AM to 6:59 AM | 0 (0.0%) | 11 (14.9%) |
| 7:00 AM to 7:29 AM | 0 (0.0%) | 0 (0.0%) |
| 7:30 AM to 7:59 AM | 36 (40.5%) | 26 (35.1%) |
| 8:00 AM to 8:29 AM | 13 (14.6%) | 0 (0.0%) |
| 8:30 AM to 8:59 AM | 0 (0.0%) | 29 (39.2%) |
| 9:00 AM to 9:59 AM | 0 (0.0%) | 0 (0.0%) |
| 10:00 AM to 10:59 AM | 0 (0.0%) | 0 (0.0%) |
| 11:00 AM to 11:59 AM | 0 (0.0%) | 0 (0.0%) |
| 12:00 PM to 3:59 PM | 9 (10.1%) | 8 (10.8%) |
| 4:00 PM to 11:59 PM | 11 (12.4%) | 0 (0.0%) |
| Total | 89 (100.0%) | 74 (100.0%) |
Housing Occupancy in Enoree
Occupancy by Ownership in Enoree
Of the total 193 dwellings in Enoree, owner-occupied units account for 140 (72.5%), while renter-occupied units make up 53 (27.5%).
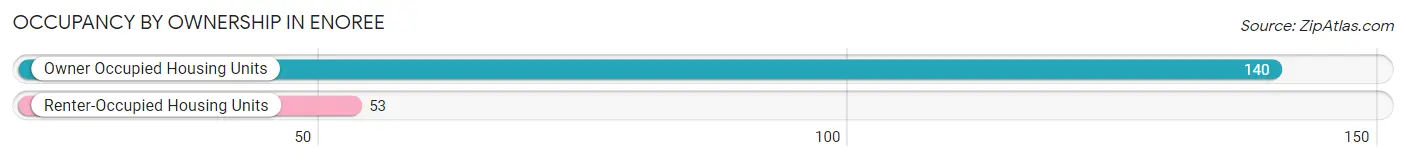
| Occupancy | # Housing Units | % Housing Units |
| Owner Occupied Housing Units | 140 | 72.5% |
| Renter-Occupied Housing Units | 53 | 27.5% |
| Total Occupied Housing Units | 193 | 100.0% |
Occupancy by Household Size in Enoree
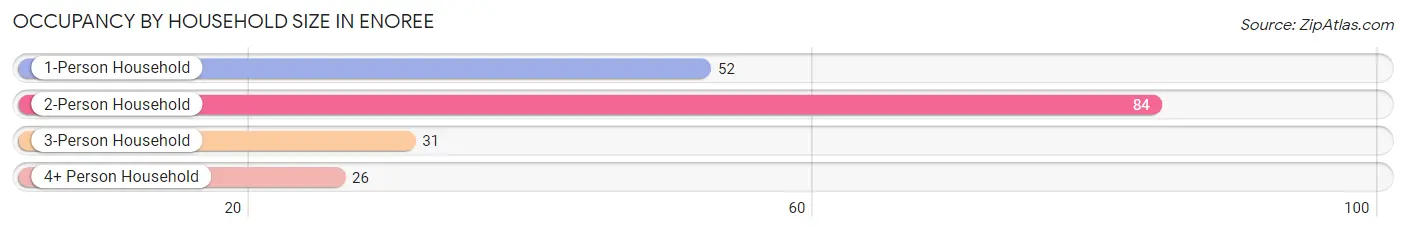
| Household Size | # Housing Units | % Housing Units |
| 1-Person Household | 52 | 26.9% |
| 2-Person Household | 84 | 43.5% |
| 3-Person Household | 31 | 16.1% |
| 4+ Person Household | 26 | 13.5% |
| Total Housing Units | 193 | 100.0% |
Occupancy by Ownership by Household Size in Enoree
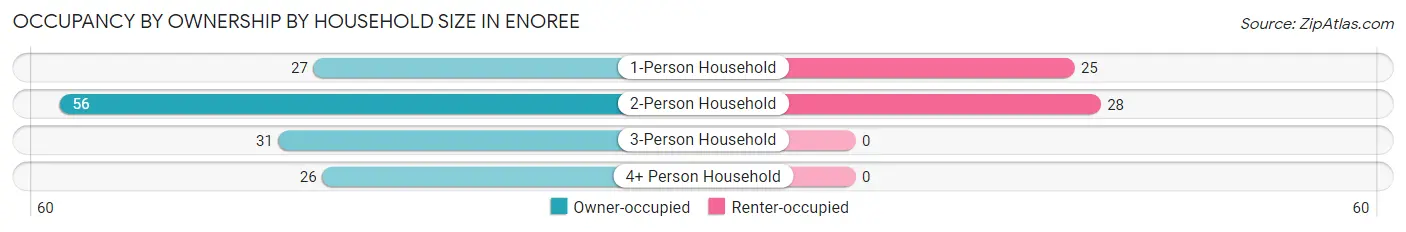
| Household Size | Owner-occupied | Renter-occupied |
| 1-Person Household | 27 (51.9%) | 25 (48.1%) |
| 2-Person Household | 56 (66.7%) | 28 (33.3%) |
| 3-Person Household | 31 (100.0%) | 0 (0.0%) |
| 4+ Person Household | 26 (100.0%) | 0 (0.0%) |
| Total Housing Units | 140 (72.5%) | 53 (27.5%) |
Occupancy by Educational Attainment in Enoree
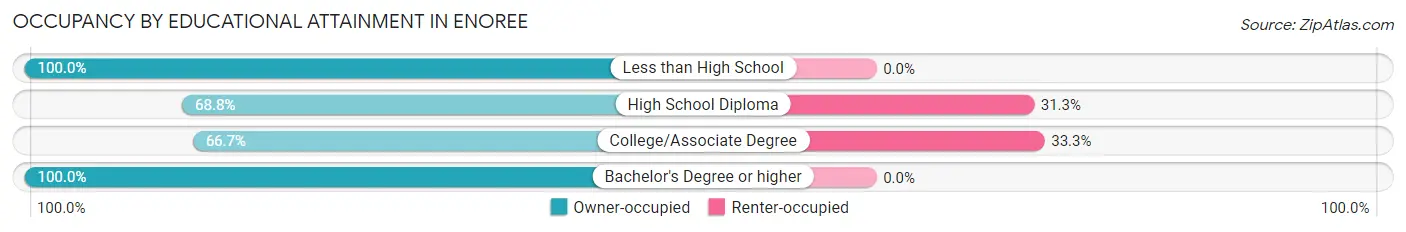
| Household Size | Owner-occupied | Renter-occupied |
| Less than High School | 19 (100.0%) | 0 (0.0%) |
| High School Diploma | 55 (68.8%) | 25 (31.2%) |
| College/Associate Degree | 56 (66.7%) | 28 (33.3%) |
| Bachelor's Degree or higher | 10 (100.0%) | 0 (0.0%) |
Occupancy by Age of Householder in Enoree
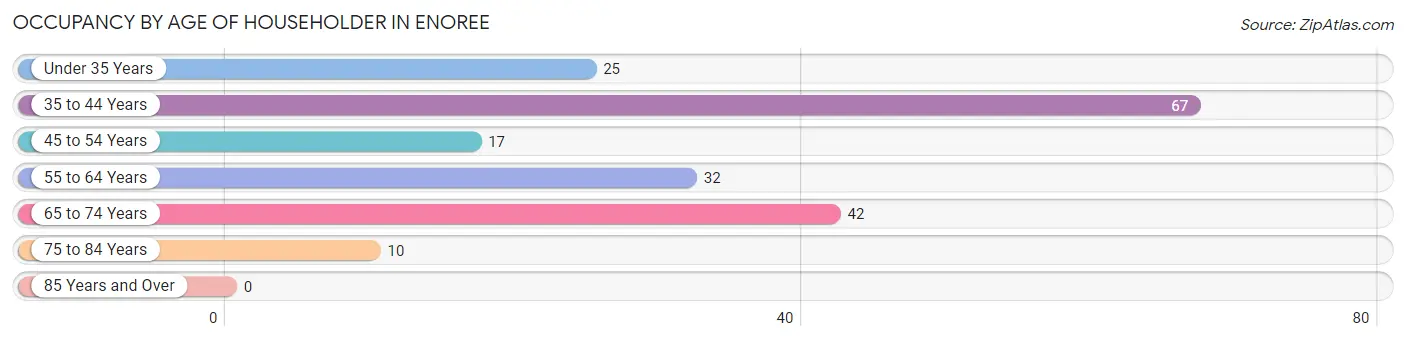
| Age Bracket | # Households | % Households |
| Under 35 Years | 25 | 13.0% |
| 35 to 44 Years | 67 | 34.7% |
| 45 to 54 Years | 17 | 8.8% |
| 55 to 64 Years | 32 | 16.6% |
| 65 to 74 Years | 42 | 21.8% |
| 75 to 84 Years | 10 | 5.2% |
| 85 Years and Over | 0 | 0.0% |
| Total | 193 | 100.0% |
Housing Finances in Enoree
Median Income by Occupancy in Enoree
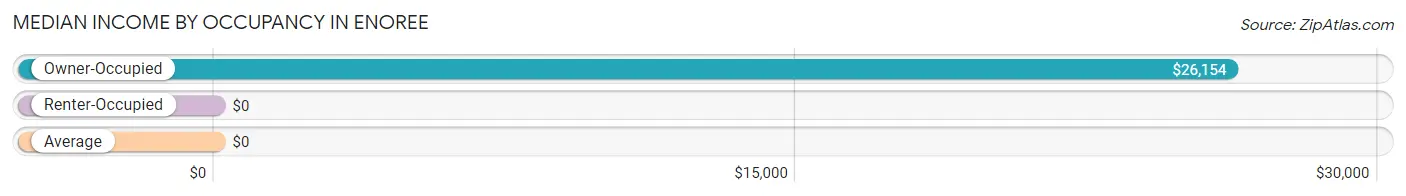
| Occupancy Type | # Households | Median Income |
| Owner-Occupied | 140 (72.5%) | $26,154 |
| Renter-Occupied | 53 (27.5%) | $0 |
| Average | 193 (100.0%) | $0 |
Occupancy by Householder Income Bracket in Enoree
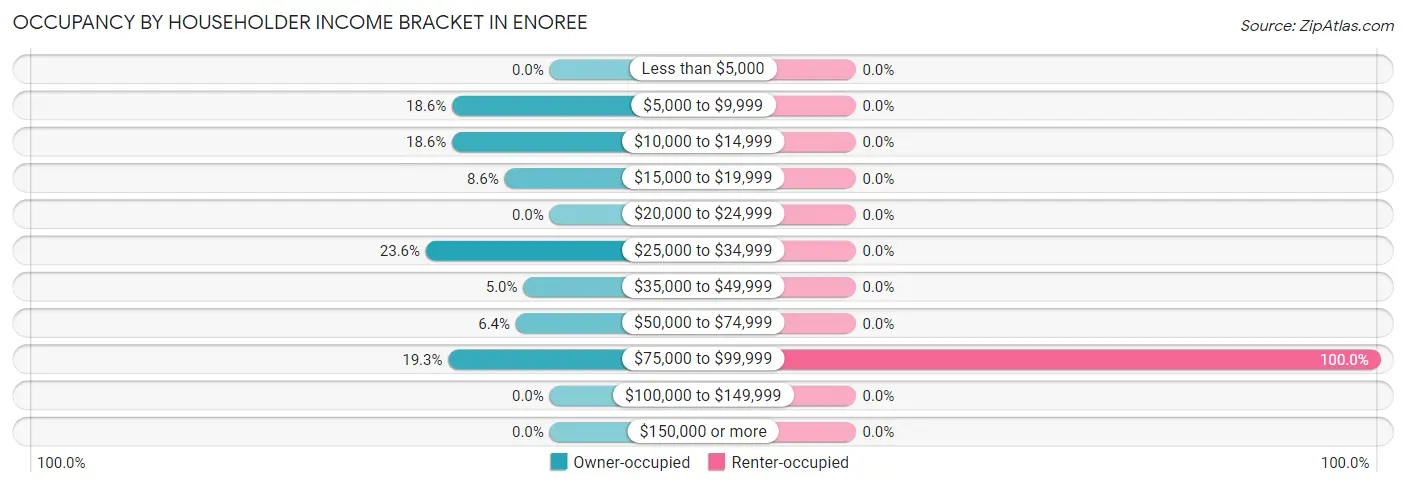
| Income Bracket | Owner-occupied | Renter-occupied |
| Less than $5,000 | 0 (0.0%) | 0 (0.0%) |
| $5,000 to $9,999 | 26 (18.6%) | 0 (0.0%) |
| $10,000 to $14,999 | 26 (18.6%) | 0 (0.0%) |
| $15,000 to $19,999 | 12 (8.6%) | 0 (0.0%) |
| $20,000 to $24,999 | 0 (0.0%) | 0 (0.0%) |
| $25,000 to $34,999 | 33 (23.6%) | 0 (0.0%) |
| $35,000 to $49,999 | 7 (5.0%) | 0 (0.0%) |
| $50,000 to $74,999 | 9 (6.4%) | 0 (0.0%) |
| $75,000 to $99,999 | 27 (19.3%) | 53 (100.0%) |
| $100,000 to $149,999 | 0 (0.0%) | 0 (0.0%) |
| $150,000 or more | 0 (0.0%) | 0 (0.0%) |
| Total | 140 (100.0%) | 53 (100.0%) |
Monthly Housing Cost Tiers in Enoree
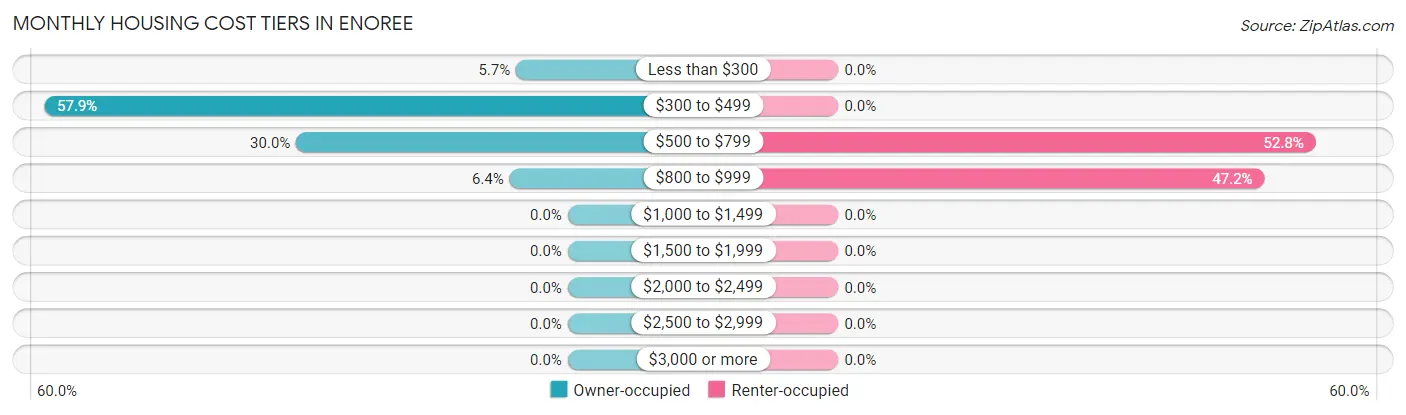
| Monthly Cost | Owner-occupied | Renter-occupied |
| Less than $300 | 8 (5.7%) | 0 (0.0%) |
| $300 to $499 | 81 (57.9%) | 0 (0.0%) |
| $500 to $799 | 42 (30.0%) | 28 (52.8%) |
| $800 to $999 | 9 (6.4%) | 25 (47.2%) |
| $1,000 to $1,499 | 0 (0.0%) | 0 (0.0%) |
| $1,500 to $1,999 | 0 (0.0%) | 0 (0.0%) |
| $2,000 to $2,499 | 0 (0.0%) | 0 (0.0%) |
| $2,500 to $2,999 | 0 (0.0%) | 0 (0.0%) |
| $3,000 or more | 0 (0.0%) | 0 (0.0%) |
| Total | 140 (100.0%) | 53 (100.0%) |
Physical Housing Characteristics in Enoree
Housing Structures in Enoree
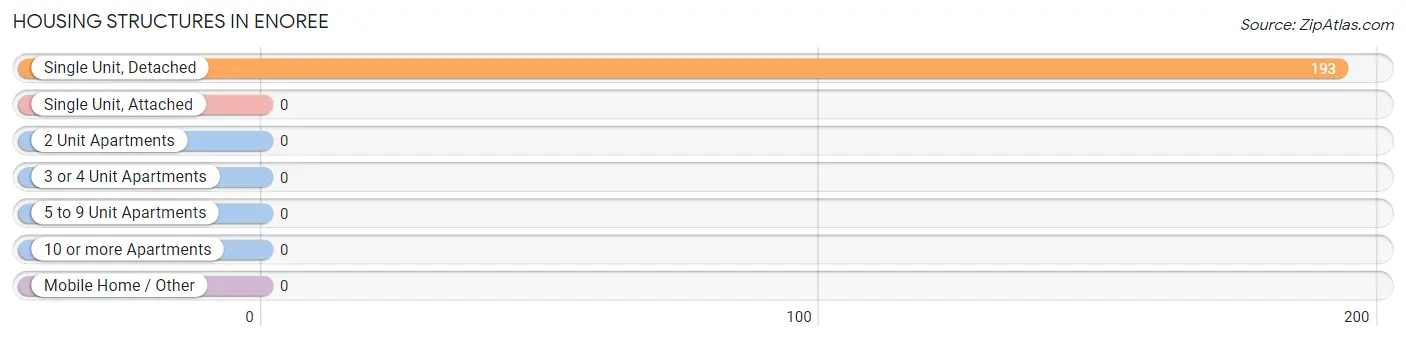
| Structure Type | # Housing Units | % Housing Units |
| Single Unit, Detached | 193 | 100.0% |
| Single Unit, Attached | 0 | 0.0% |
| 2 Unit Apartments | 0 | 0.0% |
| 3 or 4 Unit Apartments | 0 | 0.0% |
| 5 to 9 Unit Apartments | 0 | 0.0% |
| 10 or more Apartments | 0 | 0.0% |
| Mobile Home / Other | 0 | 0.0% |
| Total | 193 | 100.0% |
Housing Structures by Occupancy in Enoree
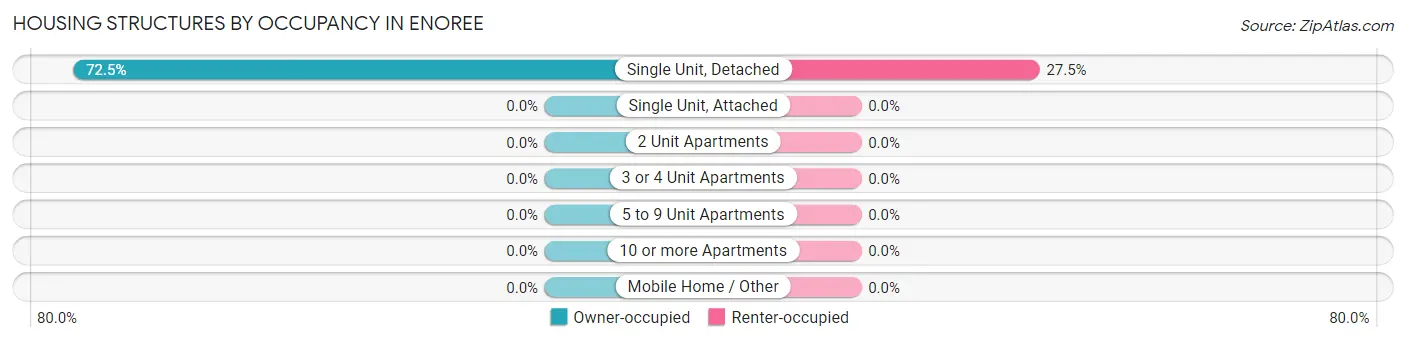
| Structure Type | Owner-occupied | Renter-occupied |
| Single Unit, Detached | 140 (72.5%) | 53 (27.5%) |
| Single Unit, Attached | 0 (0.0%) | 0 (0.0%) |
| 2 Unit Apartments | 0 (0.0%) | 0 (0.0%) |
| 3 or 4 Unit Apartments | 0 (0.0%) | 0 (0.0%) |
| 5 to 9 Unit Apartments | 0 (0.0%) | 0 (0.0%) |
| 10 or more Apartments | 0 (0.0%) | 0 (0.0%) |
| Mobile Home / Other | 0 (0.0%) | 0 (0.0%) |
| Total | 140 (72.5%) | 53 (27.5%) |
Housing Structures by Number of Rooms in Enoree
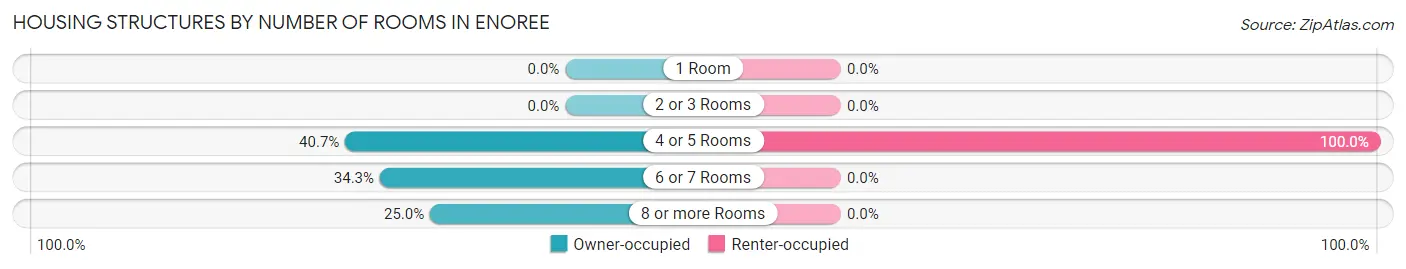
| Number of Rooms | Owner-occupied | Renter-occupied |
| 1 Room | 0 (0.0%) | 0 (0.0%) |
| 2 or 3 Rooms | 0 (0.0%) | 0 (0.0%) |
| 4 or 5 Rooms | 57 (40.7%) | 53 (100.0%) |
| 6 or 7 Rooms | 48 (34.3%) | 0 (0.0%) |
| 8 or more Rooms | 35 (25.0%) | 0 (0.0%) |
| Total | 140 (100.0%) | 53 (100.0%) |
Housing Structure by Heating Type in Enoree
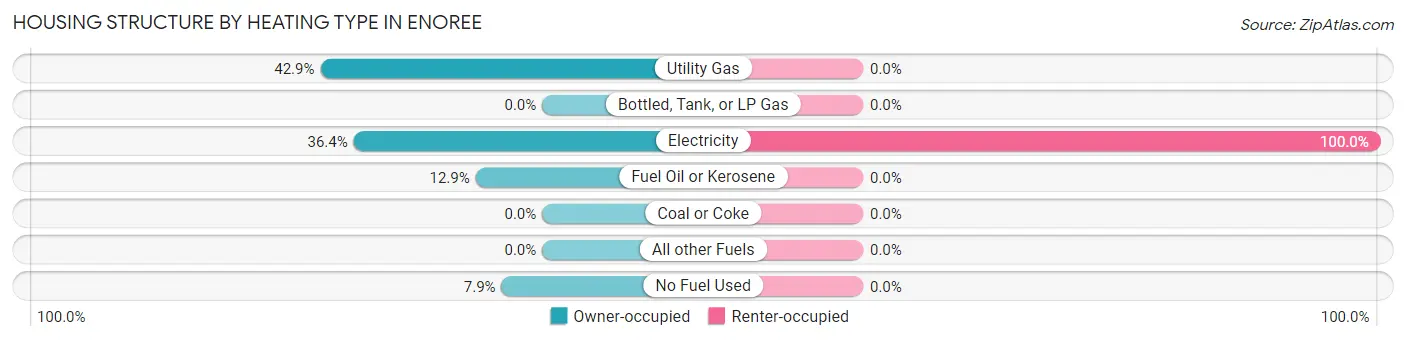
| Heating Type | Owner-occupied | Renter-occupied |
| Utility Gas | 60 (42.9%) | 0 (0.0%) |
| Bottled, Tank, or LP Gas | 0 (0.0%) | 0 (0.0%) |
| Electricity | 51 (36.4%) | 53 (100.0%) |
| Fuel Oil or Kerosene | 18 (12.9%) | 0 (0.0%) |
| Coal or Coke | 0 (0.0%) | 0 (0.0%) |
| All other Fuels | 0 (0.0%) | 0 (0.0%) |
| No Fuel Used | 11 (7.9%) | 0 (0.0%) |
| Total | 140 (100.0%) | 53 (100.0%) |
Household Vehicle Usage in Enoree
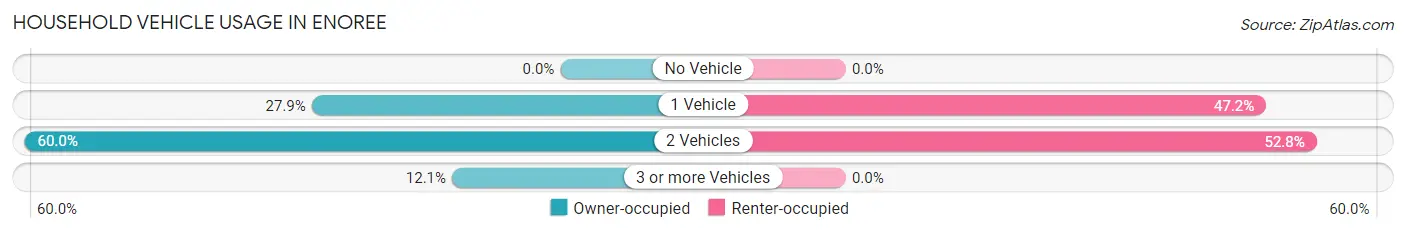
| Vehicles per Household | Owner-occupied | Renter-occupied |
| No Vehicle | 0 (0.0%) | 0 (0.0%) |
| 1 Vehicle | 39 (27.9%) | 25 (47.2%) |
| 2 Vehicles | 84 (60.0%) | 28 (52.8%) |
| 3 or more Vehicles | 17 (12.1%) | 0 (0.0%) |
| Total | 140 (100.0%) | 53 (100.0%) |
Real Estate & Mortgages in Enoree
Real Estate and Mortgage Overview in Enoree
| Characteristic | Without Mortgage | With Mortgage |
| Housing Units | 124 | 16 |
| Median Property Value | $97,000 | $0 |
| Median Household Income | - | - |
| Monthly Housing Costs | $400 | $0 |
| Real Estate Taxes | $558 | $0 |
Property Value by Mortgage Status in Enoree
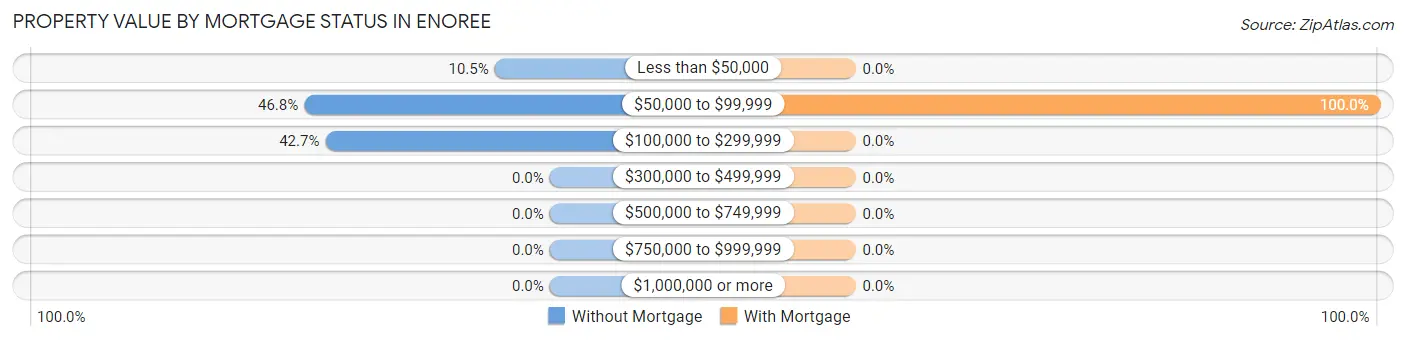
| Property Value | Without Mortgage | With Mortgage |
| Less than $50,000 | 13 (10.5%) | 0 (0.0%) |
| $50,000 to $99,999 | 58 (46.8%) | 16 (100.0%) |
| $100,000 to $299,999 | 53 (42.7%) | 0 (0.0%) |
| $300,000 to $499,999 | 0 (0.0%) | 0 (0.0%) |
| $500,000 to $749,999 | 0 (0.0%) | 0 (0.0%) |
| $750,000 to $999,999 | 0 (0.0%) | 0 (0.0%) |
| $1,000,000 or more | 0 (0.0%) | 0 (0.0%) |
| Total | 124 (100.0%) | 16 (100.0%) |
Household Income by Mortgage Status in Enoree
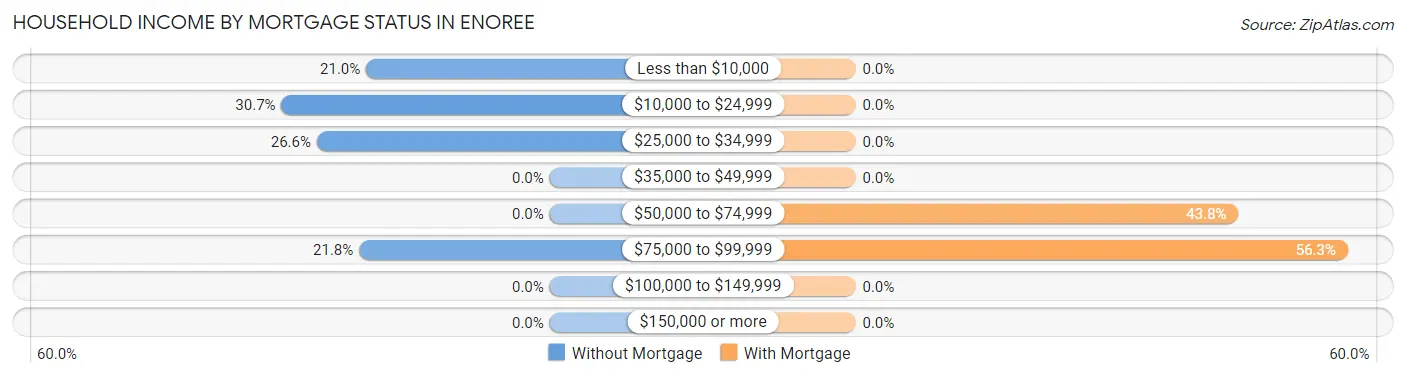
| Household Income | Without Mortgage | With Mortgage |
| Less than $10,000 | 26 (21.0%) | 0 (0.0%) |
| $10,000 to $24,999 | 38 (30.6%) | 0 (0.0%) |
| $25,000 to $34,999 | 33 (26.6%) | 0 (0.0%) |
| $35,000 to $49,999 | 0 (0.0%) | 0 (0.0%) |
| $50,000 to $74,999 | 0 (0.0%) | 7 (43.8%) |
| $75,000 to $99,999 | 27 (21.8%) | 9 (56.2%) |
| $100,000 to $149,999 | 0 (0.0%) | 0 (0.0%) |
| $150,000 or more | 0 (0.0%) | 0 (0.0%) |
| Total | 124 (100.0%) | 16 (100.0%) |
Property Value to Household Income Ratio in Enoree
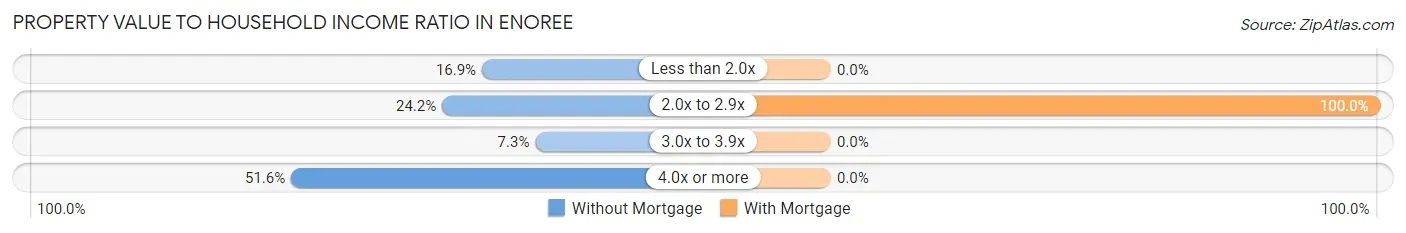
| Value-to-Income Ratio | Without Mortgage | With Mortgage |
| Less than 2.0x | 21 (16.9%) | 0 (0.0%) |
| 2.0x to 2.9x | 30 (24.2%) | 16 (100.0%) |
| 3.0x to 3.9x | 9 (7.3%) | 0 (0.0%) |
| 4.0x or more | 64 (51.6%) | 0 (0.0%) |
| Total | 124 (100.0%) | 16 (100.0%) |
Real Estate Taxes by Mortgage Status in Enoree
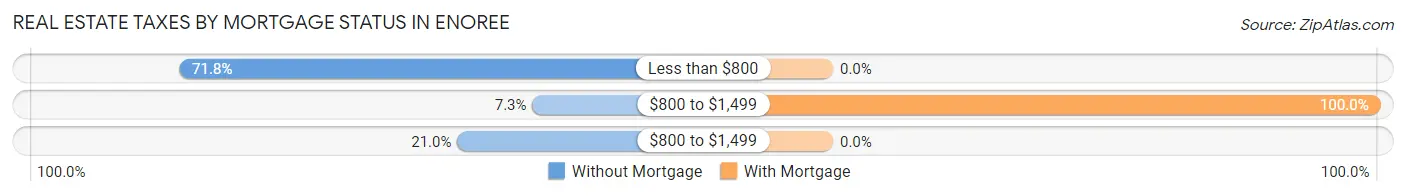
| Property Taxes | Without Mortgage | With Mortgage |
| Less than $800 | 89 (71.8%) | 0 (0.0%) |
| $800 to $1,499 | 9 (7.3%) | 16 (100.0%) |
| $800 to $1,499 | 26 (21.0%) | 0 (0.0%) |
| Total | 124 (100.0%) | 16 (100.0%) |
Health & Disability in Enoree
Health Insurance Coverage by Age in Enoree
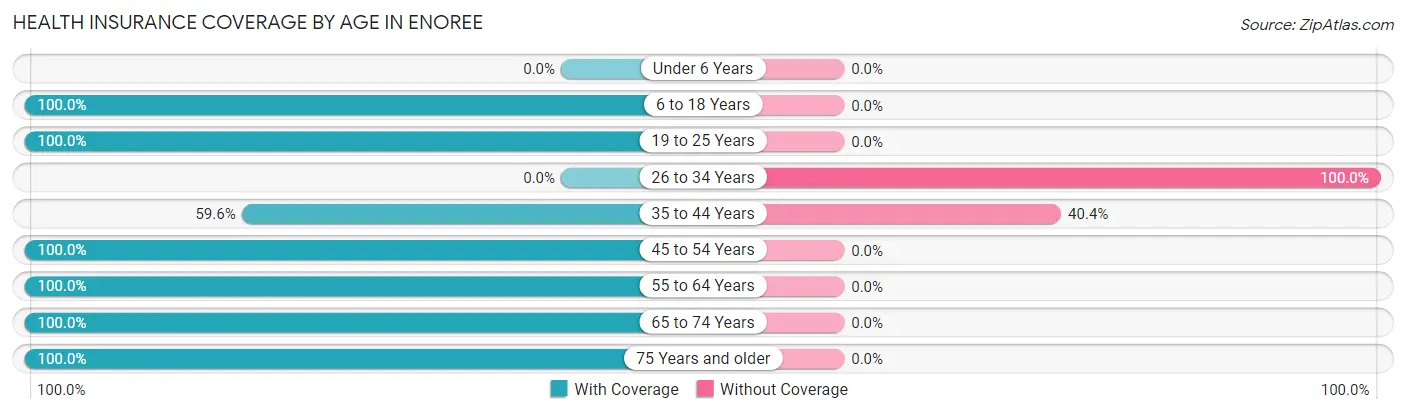
| Age Bracket | With Coverage | Without Coverage |
| Under 6 Years | 0 (0.0%) | 0 (0.0%) |
| 6 to 18 Years | 40 (100.0%) | 0 (0.0%) |
| 19 to 25 Years | 32 (100.0%) | 0 (0.0%) |
| 26 to 34 Years | 0 (0.0%) | 25 (100.0%) |
| 35 to 44 Years | 81 (59.6%) | 55 (40.4%) |
| 45 to 54 Years | 59 (100.0%) | 0 (0.0%) |
| 55 to 64 Years | 72 (100.0%) | 0 (0.0%) |
| 65 to 74 Years | 56 (100.0%) | 0 (0.0%) |
| 75 Years and older | 21 (100.0%) | 0 (0.0%) |
| Total | 361 (81.9%) | 80 (18.1%) |
Health Insurance Coverage by Citizenship Status in Enoree
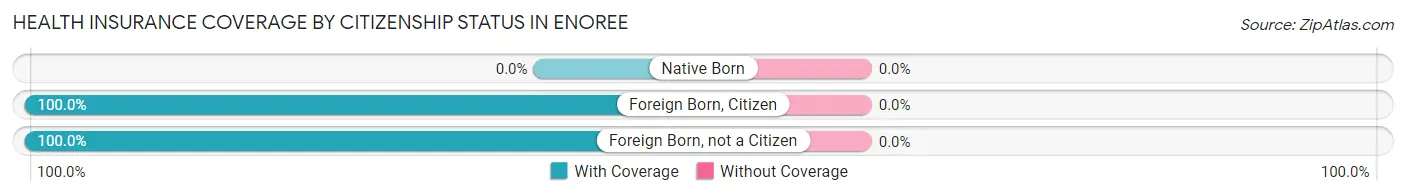
| Citizenship Status | With Coverage | Without Coverage |
| Native Born | 0 (0.0%) | 0 (0.0%) |
| Foreign Born, Citizen | 40 (100.0%) | 0 (0.0%) |
| Foreign Born, not a Citizen | 32 (100.0%) | 0 (0.0%) |
Health Insurance Coverage by Household Income in Enoree
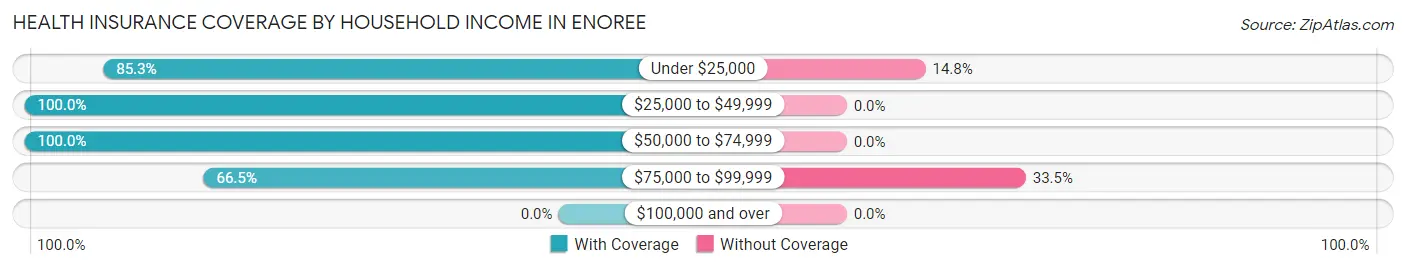
| Household Income | With Coverage | Without Coverage |
| Under $25,000 | 156 (85.3%) | 27 (14.7%) |
| $25,000 to $49,999 | 83 (100.0%) | 0 (0.0%) |
| $50,000 to $74,999 | 17 (100.0%) | 0 (0.0%) |
| $75,000 to $99,999 | 105 (66.5%) | 53 (33.5%) |
| $100,000 and over | 0 (0.0%) | 0 (0.0%) |
Public vs Private Health Insurance Coverage by Age in Enoree
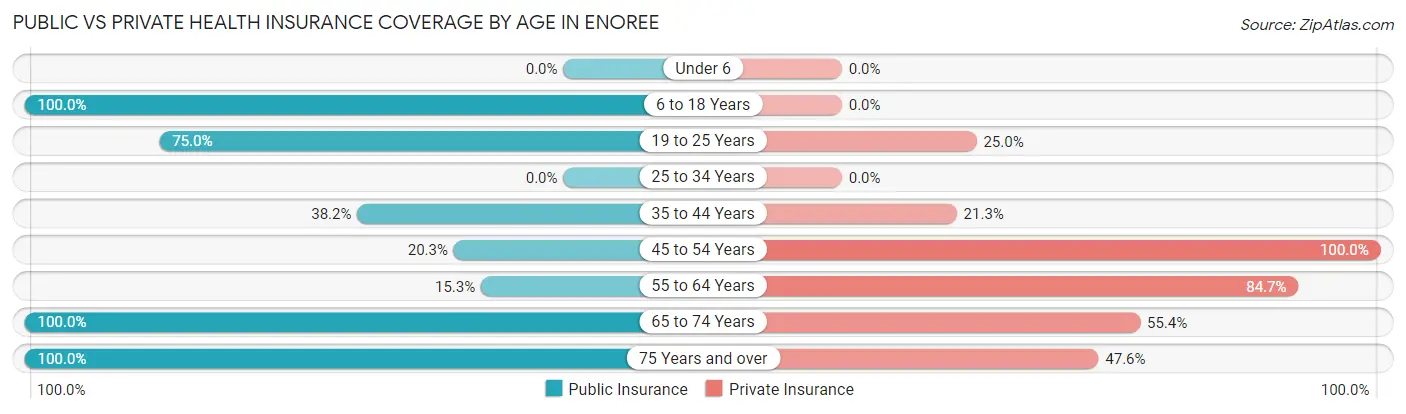
| Age Bracket | Public Insurance | Private Insurance |
| Under 6 | 0 (0.0%) | 0 (0.0%) |
| 6 to 18 Years | 40 (100.0%) | 0 (0.0%) |
| 19 to 25 Years | 24 (75.0%) | 8 (25.0%) |
| 25 to 34 Years | 0 (0.0%) | 0 (0.0%) |
| 35 to 44 Years | 52 (38.2%) | 29 (21.3%) |
| 45 to 54 Years | 12 (20.3%) | 59 (100.0%) |
| 55 to 64 Years | 11 (15.3%) | 61 (84.7%) |
| 65 to 74 Years | 56 (100.0%) | 31 (55.4%) |
| 75 Years and over | 21 (100.0%) | 10 (47.6%) |
| Total | 216 (49.0%) | 198 (44.9%) |
Disability Status by Sex by Age in Enoree
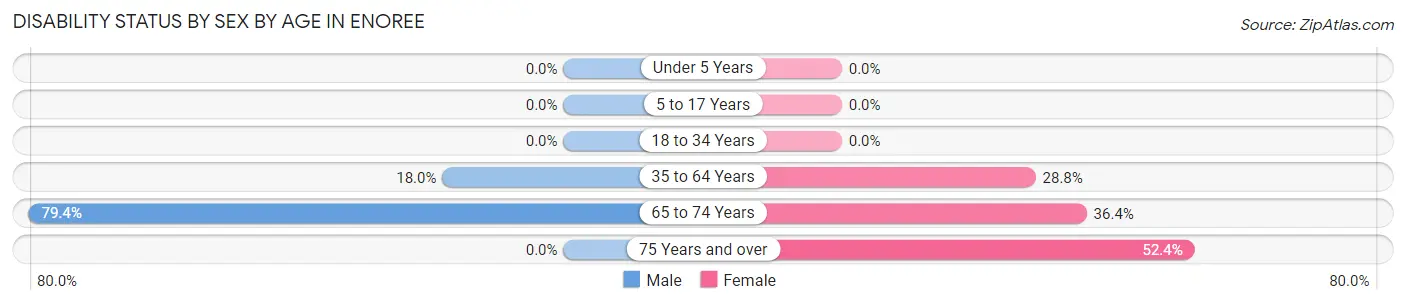
| Age Bracket | Male | Female |
| Under 5 Years | 0 (0.0%) | 0 (0.0%) |
| 5 to 17 Years | 0 (0.0%) | 0 (0.0%) |
| 18 to 34 Years | 0 (0.0%) | 0 (0.0%) |
| 35 to 64 Years | 23 (18.0%) | 40 (28.8%) |
| 65 to 74 Years | 27 (79.4%) | 8 (36.4%) |
| 75 Years and over | 0 (0.0%) | 11 (52.4%) |
Disability Class by Sex by Age in Enoree
Disability Class: Hearing Difficulty
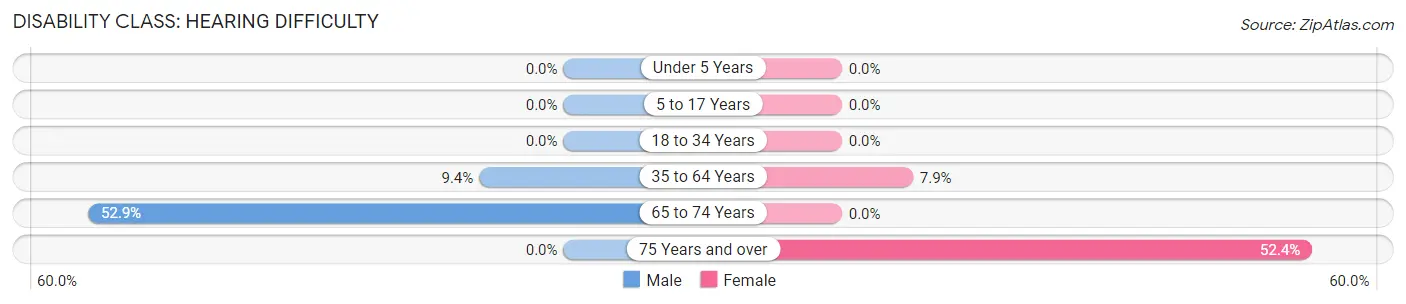
| Age Bracket | Male | Female |
| Under 5 Years | 0 (0.0%) | 0 (0.0%) |
| 5 to 17 Years | 0 (0.0%) | 0 (0.0%) |
| 18 to 34 Years | 0 (0.0%) | 0 (0.0%) |
| 35 to 64 Years | 12 (9.4%) | 11 (7.9%) |
| 65 to 74 Years | 18 (52.9%) | 0 (0.0%) |
| 75 Years and over | 0 (0.0%) | 11 (52.4%) |
Disability Class: Vision Difficulty
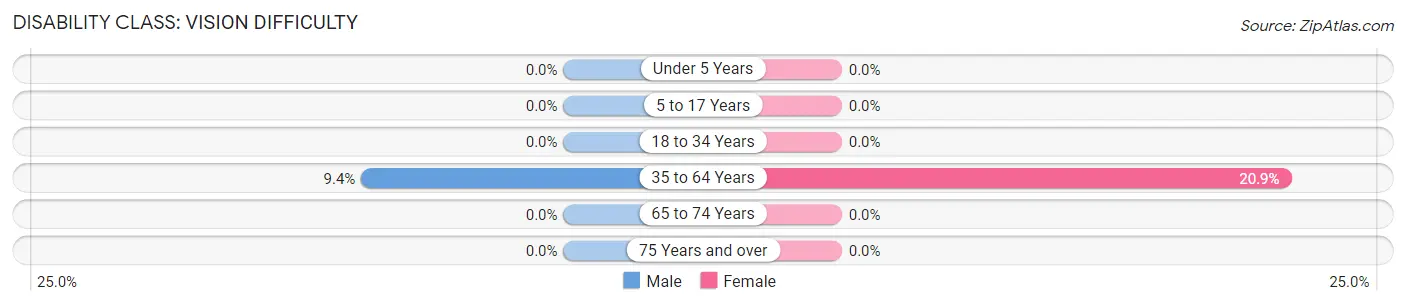
| Age Bracket | Male | Female |
| Under 5 Years | 0 (0.0%) | 0 (0.0%) |
| 5 to 17 Years | 0 (0.0%) | 0 (0.0%) |
| 18 to 34 Years | 0 (0.0%) | 0 (0.0%) |
| 35 to 64 Years | 12 (9.4%) | 29 (20.9%) |
| 65 to 74 Years | 0 (0.0%) | 0 (0.0%) |
| 75 Years and over | 0 (0.0%) | 0 (0.0%) |
Disability Class: Cognitive Difficulty
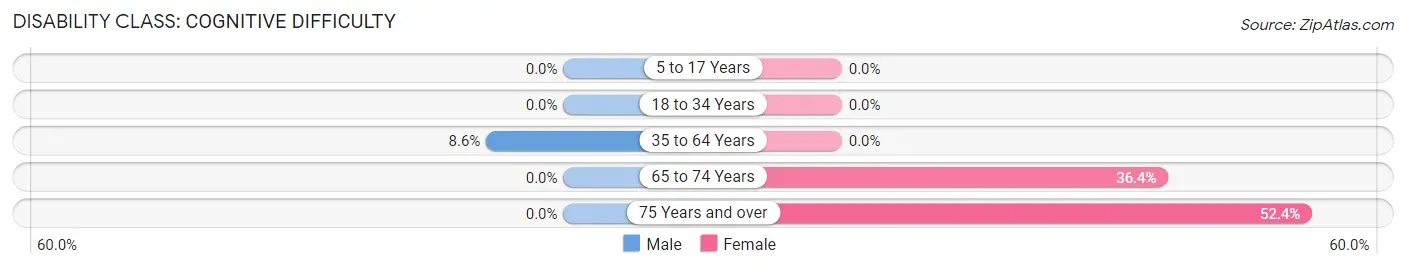
| Age Bracket | Male | Female |
| 5 to 17 Years | 0 (0.0%) | 0 (0.0%) |
| 18 to 34 Years | 0 (0.0%) | 0 (0.0%) |
| 35 to 64 Years | 11 (8.6%) | 0 (0.0%) |
| 65 to 74 Years | 0 (0.0%) | 8 (36.4%) |
| 75 Years and over | 0 (0.0%) | 11 (52.4%) |
Disability Class: Ambulatory Difficulty
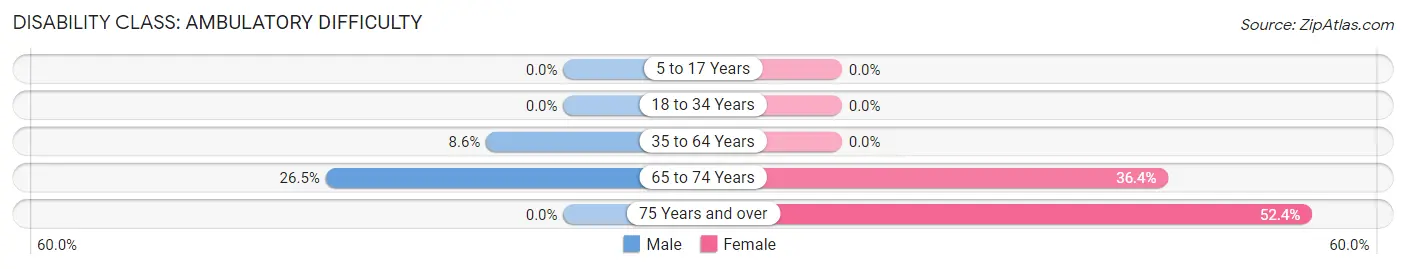
| Age Bracket | Male | Female |
| 5 to 17 Years | 0 (0.0%) | 0 (0.0%) |
| 18 to 34 Years | 0 (0.0%) | 0 (0.0%) |
| 35 to 64 Years | 11 (8.6%) | 0 (0.0%) |
| 65 to 74 Years | 9 (26.5%) | 8 (36.4%) |
| 75 Years and over | 0 (0.0%) | 11 (52.4%) |
Disability Class: Self-Care Difficulty
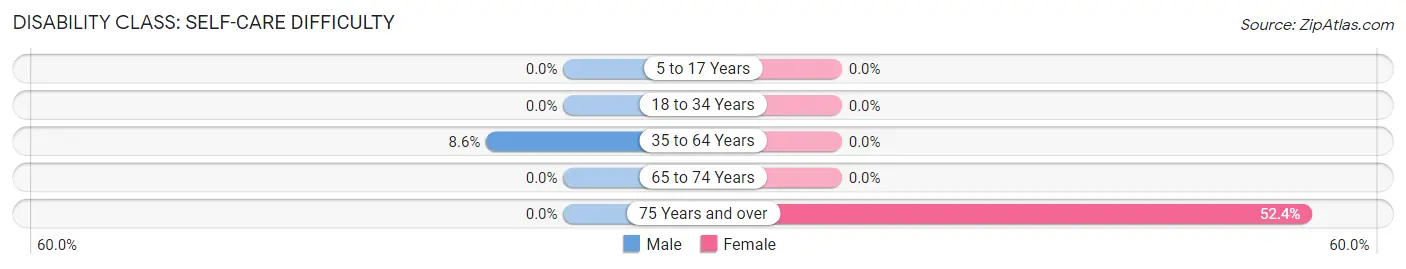
| Age Bracket | Male | Female |
| 5 to 17 Years | 0 (0.0%) | 0 (0.0%) |
| 18 to 34 Years | 0 (0.0%) | 0 (0.0%) |
| 35 to 64 Years | 11 (8.6%) | 0 (0.0%) |
| 65 to 74 Years | 0 (0.0%) | 0 (0.0%) |
| 75 Years and over | 0 (0.0%) | 11 (52.4%) |
Technology Access in Enoree
Computing Device Access in Enoree

| Device Type | # Households | % Households |
| Desktop or Laptop | 169 | 87.6% |
| Smartphone | 185 | 95.9% |
| Tablet | 96 | 49.7% |
| No Computing Device | 0 | 0.0% |
| Total | 193 | 100.0% |
Internet Access in Enoree
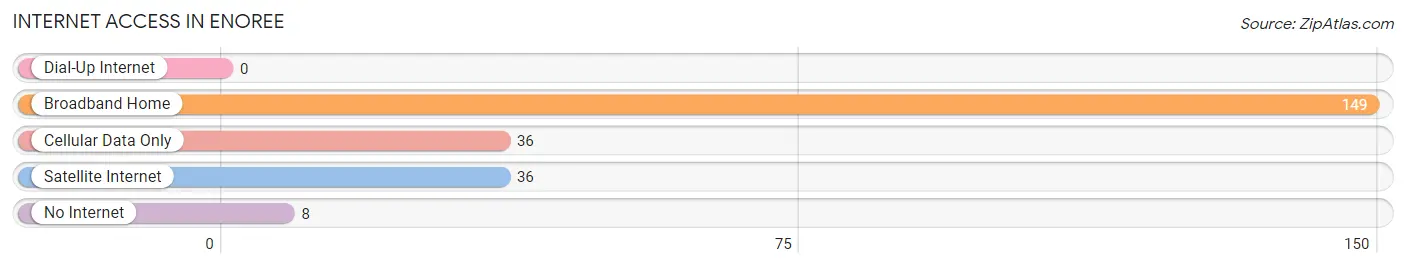
| Internet Type | # Households | % Households |
| Dial-Up Internet | 0 | 0.0% |
| Broadband Home | 149 | 77.2% |
| Cellular Data Only | 36 | 18.6% |
| Satellite Internet | 36 | 18.6% |
| No Internet | 8 | 4.2% |
| Total | 193 | 100.0% |
Enoree Summary
Enoree is a small town located in Spartanburg County, South Carolina. It is situated along the Enoree River, which is a tributary of the Broad River. The town is located approximately 20 miles northwest of Spartanburg and is part of the Greenville-Spartanburg-Anderson Combined Statistical Area. The population of Enoree was 1,845 as of the 2010 census.
History
Enoree was first settled in the late 1700s by a group of settlers from Virginia. The town was originally known as “Enoree Crossroads” and was located at the intersection of two major roads. The town was officially incorporated in 1891 and was named after the Enoree River.
The town was a major center for the textile industry in the early 1900s. The town was home to several cotton mills, including the Enoree Manufacturing Company, which was established in 1891. The town also had a number of other businesses, including a general store, a blacksmith shop, and a grist mill.
Geography
Enoree is located in the foothills of the Blue Ridge Mountains. The town is situated along the Enoree River, which is a tributary of the Broad River. The town is located approximately 20 miles northwest of Spartanburg and is part of the Greenville-Spartanburg-Anderson Combined Statistical Area.
The town has a total area of 1.3 square miles, all of which is land. The town is located at an elevation of 845 feet above sea level.
Economy
The economy of Enoree is largely based on agriculture. The town is home to several farms, including a dairy farm, a beef cattle farm, and a poultry farm. The town is also home to several small businesses, including a general store, a hardware store, and a restaurant.
The town is also home to several manufacturing companies, including a textile mill and a furniture factory. The town is also home to a number of small businesses, including a gas station, a grocery store, and a barber shop.
Demographics
As of the 2010 census, the population of Enoree was 1,845. The racial makeup of the town was 94.3% White, 3.2% African American, 0.3% Native American, 0.2% Asian, 0.1% Pacific Islander, 0.7% from other races, and 1.3% from two or more races. Hispanic or Latino of any race were 1.7% of the population.
The median household income in Enoree was $35,938, and the median family income was $41,250. The per capita income for the town was $17,845. About 15.3% of the population was below the poverty line.
Common Questions
What is Per Capita Income in Enoree?
Per Capita income in Enoree is $21,078.
What is the Median Family Income in Enoree?
Median Family Income in Enoree is $27,019.
What is Income or Wage Gap in Enoree?
Income or Wage Gap in Enoree is 12.2%.
Women in Enoree earn 87.8 cents for every dollar earned by a man.
What is Inequality or Gini Index in Enoree?
Inequality or Gini Index in Enoree is 0.36.
What is the Total Population of Enoree?
Total Population of Enoree is 441.
What is the Total Male Population of Enoree?
Total Male Population of Enoree is 215.
What is the Total Female Population of Enoree?
Total Female Population of Enoree is 226.
What is the Ratio of Males per 100 Females in Enoree?
There are 95.13 Males per 100 Females in Enoree.
What is the Ratio of Females per 100 Males in Enoree?
There are 105.12 Females per 100 Males in Enoree.
What is the Median Population Age in Enoree?
Median Population Age in Enoree is 43.8 Years.
What is the Average Family Size in Enoree
Average Family Size in Enoree is 2.9 People.
What is the Average Household Size in Enoree
Average Household Size in Enoree is 2.3 People.
How Large is the Labor Force in Enoree?
There are 227 People in the Labor Forcein in Enoree.
What is the Percentage of People in the Labor Force in Enoree?
56.6% of People are in the Labor Force in Enoree.
What is the Unemployment Rate in Enoree?
Unemployment Rate in Enoree is 12.3%.