Zip Codes with the Highest Percentage of Households with Income Below $10,000 in Summerville, SC
RELATED REPORTS & OPTIONS
Household Income | $0-10k
Summerville
Compare Zip Codes
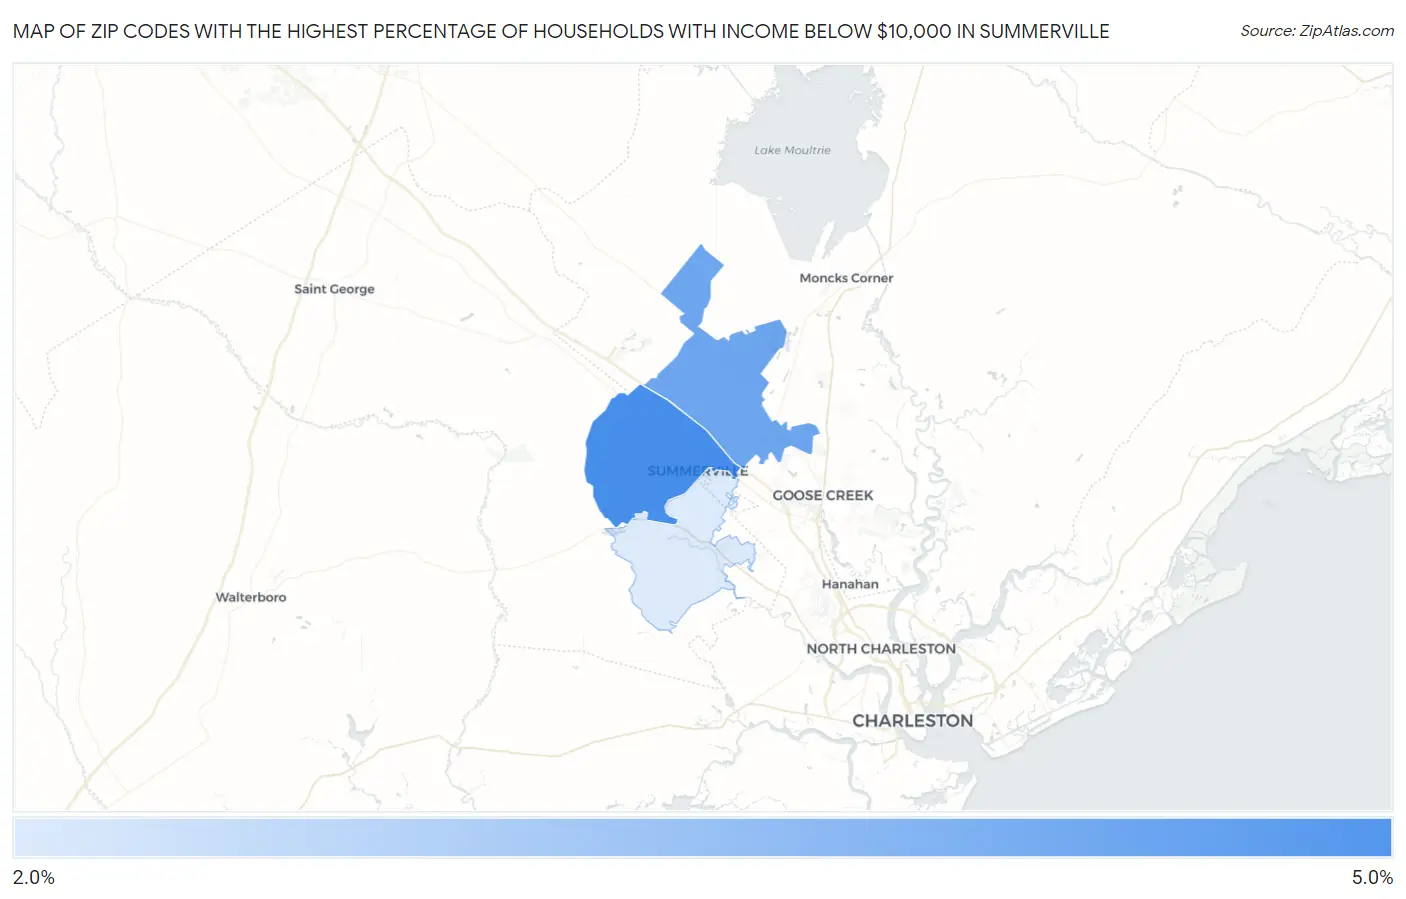
Map of Zip Codes with the Highest Percentage of Households with Income Below $10,000 in Summerville
2.7%
4.6%
Zip Codes with the Highest Percentage of Households with Income Below $10,000 in Summerville, SC
| Zip Code | Households with Income < $10k | vs State | vs National | |
| 1. | 29483 | 4.6% | 6.1%(-1.50)#260 | 4.9%(-0.300)#12,959 |
| 2. | 29486 | 4.1% | 6.1%(-2.00)#284 | 4.9%(-0.800)#14,811 |
| 3. | 29485 | 2.7% | 6.1%(-3.40)#336 | 4.9%(-2.20)#20,644 |
1
Common Questions
What are the Top Zip Codes with the Highest Percentage of Households with Income Below $10,000 in Summerville, SC?
Top Zip Codes with the Highest Percentage of Households with Income Below $10,000 in Summerville, SC are:
What zip code has the Highest Percentage of Households with Income Below $10,000 in Summerville, SC?
29483 has the Highest Percentage of Households with Income Below $10,000 in Summerville, SC with 4.6%.
What is the Percentage of Households with Income Below $10,000 in Summerville, SC?
Percentage of Households with Income Below $10,000 in Summerville is 2.8%.
What is the Percentage of Households with Income Below $10,000 in South Carolina?
Percentage of Households with Income Below $10,000 in South Carolina is 6.1%.
What is the Percentage of Households with Income Below $10,000 in the United States?
Percentage of Households with Income Below $10,000 in the United States is 4.9%.