Williston, SC Map & Demographics
Williston Map
Williston Overview
$28,930
PER CAPITA INCOME
$53,672
AVG FAMILY INCOME
$37,398
AVG HOUSEHOLD INCOME
35.8%
WAGE / INCOME GAP [ % ]
64.2¢/ $1
WAGE / INCOME GAP [ $ ]
0.43
INEQUALITY / GINI INDEX
2,877
TOTAL POPULATION
1,437
MALE POPULATION
1,440
FEMALE POPULATION
99.79
MALES / 100 FEMALES
100.21
FEMALES / 100 MALES
47.7
MEDIAN AGE
2.9
AVG FAMILY SIZE
2.0
AVG HOUSEHOLD SIZE
1,558
LABOR FORCE [ PEOPLE ]
63.3%
PERCENT IN LABOR FORCE
3.7%
UNEMPLOYMENT RATE
Williston Zip Codes
Williston Area Codes
Income in Williston
Income Overview in Williston
Per Capita Income in Williston is $28,930, while median incomes of families and households are $53,672 and $37,398 respectively.
| Characteristic | Number | Measure |
| Per Capita Income | 2,877 | $28,930 |
| Median Family Income | 706 | $53,672 |
| Mean Family Income | 706 | $70,913 |
| Median Household Income | 1,384 | $37,398 |
| Mean Household Income | 1,384 | $57,167 |
| Income Deficit | 706 | $0 |
| Wage / Income Gap (%) | 2,877 | 35.79% |
| Wage / Income Gap ($) | 2,877 | 64.21¢ per $1 |
| Gini / Inequality Index | 2,877 | 0.43 |
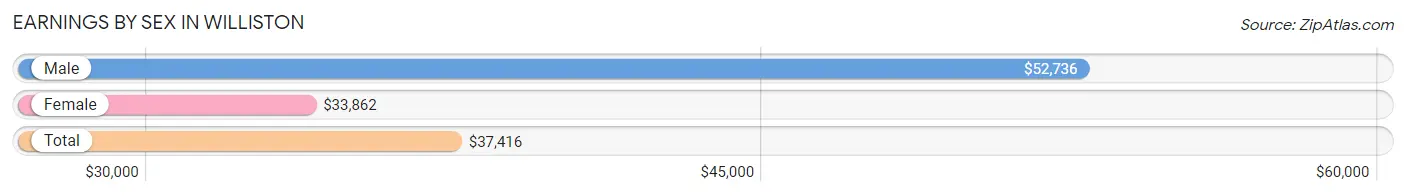
Earnings by Sex in Williston
Average Earnings in Williston are $37,416, $52,736 for men and $33,862 for women, a difference of 35.8%.
| Sex | Number | Average Earnings |
| Male | 796 (52.1%) | $52,736 |
| Female | 733 (47.9%) | $33,862 |
| Total | 1,529 (100.0%) | $37,416 |
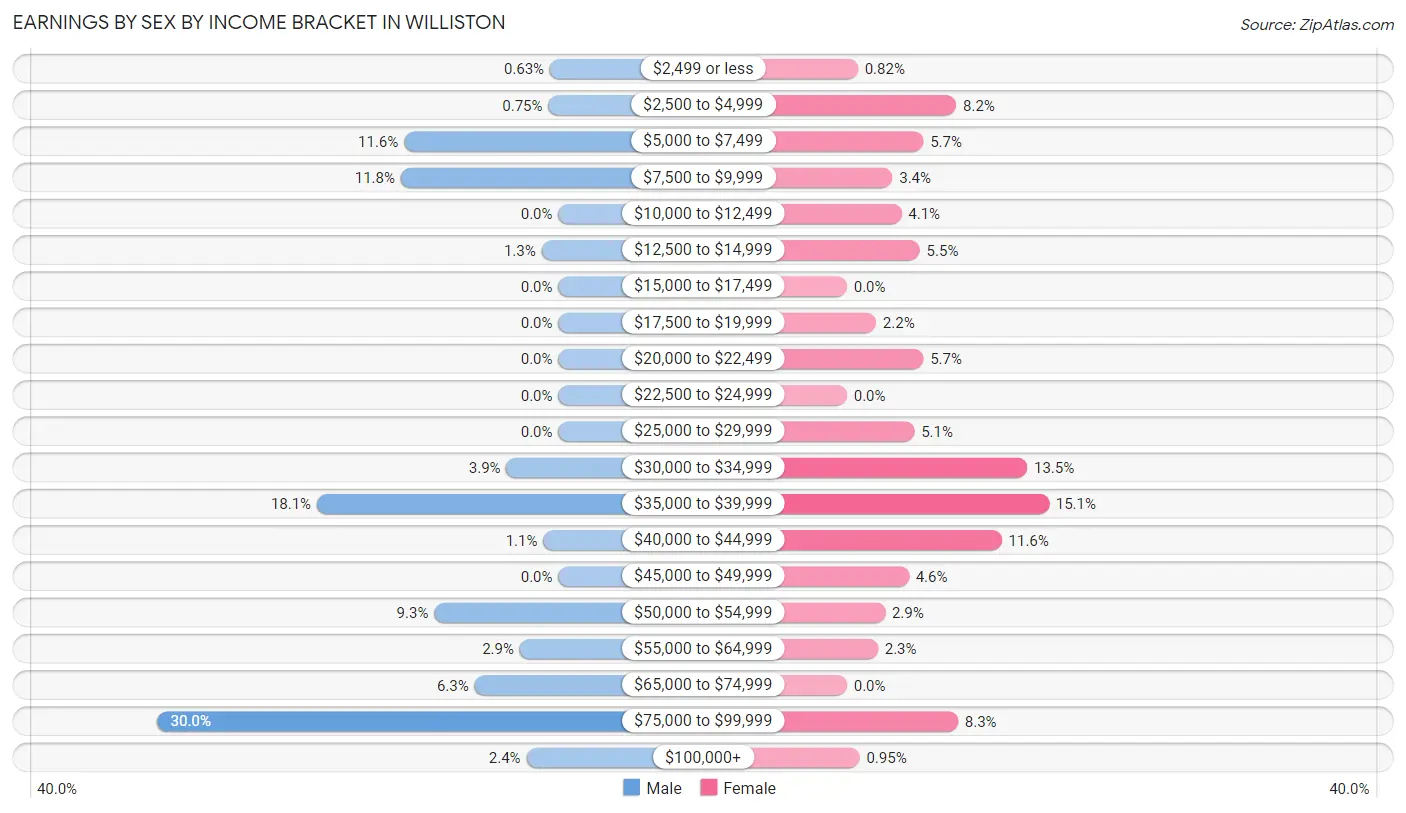
Earnings by Sex by Income Bracket in Williston
The most common earnings brackets in Williston are $75,000 to $99,999 for men (239 | 30.0%) and $35,000 to $39,999 for women (111 | 15.1%).
| Income | Male | Female |
| $2,499 or less | 5 (0.6%) | 6 (0.8%) |
| $2,500 to $4,999 | 6 (0.7%) | 60 (8.2%) |
| $5,000 to $7,499 | 92 (11.6%) | 42 (5.7%) |
| $7,500 to $9,999 | 94 (11.8%) | 25 (3.4%) |
| $10,000 to $12,499 | 0 (0.0%) | 30 (4.1%) |
| $12,500 to $14,999 | 10 (1.3%) | 40 (5.5%) |
| $15,000 to $17,499 | 0 (0.0%) | 0 (0.0%) |
| $17,500 to $19,999 | 0 (0.0%) | 16 (2.2%) |
| $20,000 to $22,499 | 0 (0.0%) | 42 (5.7%) |
| $22,500 to $24,999 | 0 (0.0%) | 0 (0.0%) |
| $25,000 to $29,999 | 0 (0.0%) | 37 (5.1%) |
| $30,000 to $34,999 | 31 (3.9%) | 99 (13.5%) |
| $35,000 to $39,999 | 144 (18.1%) | 111 (15.1%) |
| $40,000 to $44,999 | 9 (1.1%) | 85 (11.6%) |
| $45,000 to $49,999 | 0 (0.0%) | 34 (4.6%) |
| $50,000 to $54,999 | 74 (9.3%) | 21 (2.9%) |
| $55,000 to $64,999 | 23 (2.9%) | 17 (2.3%) |
| $65,000 to $74,999 | 50 (6.3%) | 0 (0.0%) |
| $75,000 to $99,999 | 239 (30.0%) | 61 (8.3%) |
| $100,000+ | 19 (2.4%) | 7 (0.9%) |
| Total | 796 (100.0%) | 733 (100.0%) |
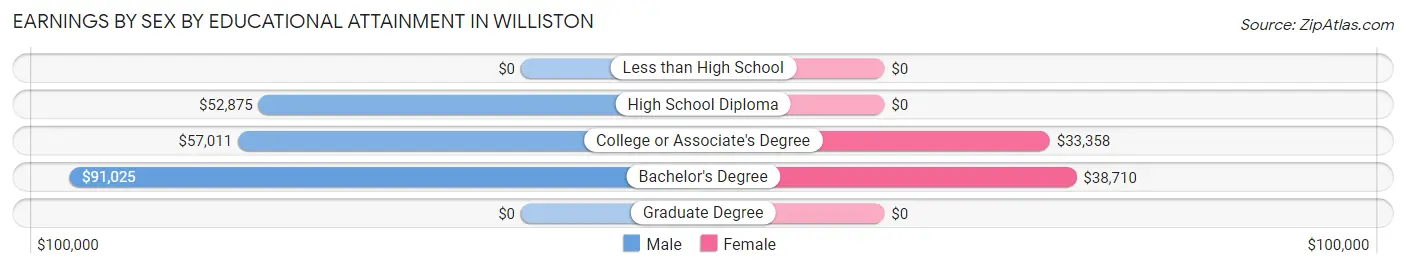
Earnings by Sex by Educational Attainment in Williston
Average earnings in Williston are $67,847 for men and $34,646 for women, a difference of 48.9%. Men with an educational attainment of bachelor's degree enjoy the highest average annual earnings of $91,025, while those with high school diploma education earn the least with $52,875. Women with an educational attainment of bachelor's degree earn the most with the average annual earnings of $38,710, while those with college or associate's degree education have the smallest earnings of $33,358.
| Educational Attainment | Male Income | Female Income |
| Less than High School | - | - |
| High School Diploma | $52,875 | $0 |
| College or Associate's Degree | $57,011 | $33,358 |
| Bachelor's Degree | $91,025 | $38,710 |
| Graduate Degree | - | - |
| Total | $67,847 | $34,646 |
Family Income in Williston
Family Income Brackets in Williston
According to the Williston family income data, there are 189 families falling into the $100,000 to $149,999 income range, which is the most common income bracket and makes up 26.8% of all families.
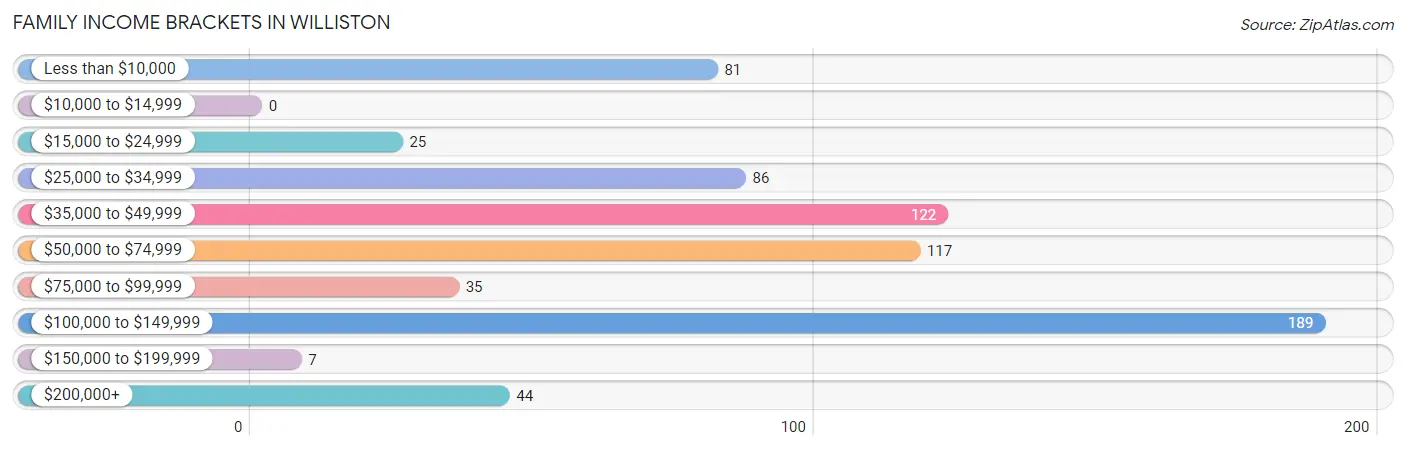
| Income Bracket | # Families | % Families |
| Less than $10,000 | 81 | 11.5% |
| $10,000 to $14,999 | 0 | 0.0% |
| $15,000 to $24,999 | 25 | 3.5% |
| $25,000 to $34,999 | 86 | 12.2% |
| $35,000 to $49,999 | 122 | 17.3% |
| $50,000 to $74,999 | 117 | 16.6% |
| $75,000 to $99,999 | 35 | 5.0% |
| $100,000 to $149,999 | 189 | 26.8% |
| $150,000 to $199,999 | 7 | 1.0% |
| $200,000+ | 44 | 6.2% |
Family Income by Famaliy Size in Williston
2-person families (432 | 61.2%) account for the highest median family income in Williston with $51,667 per family, while 2-person families (432 | 61.2%) have the highest median income of $25,834 per family member.
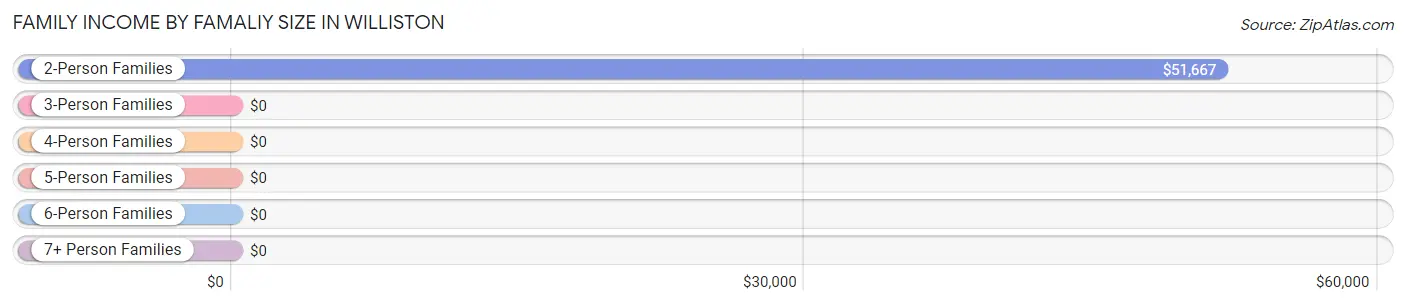
| Income Bracket | # Families | Median Income |
| 2-Person Families | 432 (61.2%) | $51,667 |
| 3-Person Families | 199 (28.2%) | $0 |
| 4-Person Families | 61 (8.6%) | $0 |
| 5-Person Families | 0 (0.0%) | $0 |
| 6-Person Families | 14 (2.0%) | $0 |
| 7+ Person Families | 0 (0.0%) | $0 |
| Total | 706 (100.0%) | $53,672 |
Family Income by Number of Earners in Williston
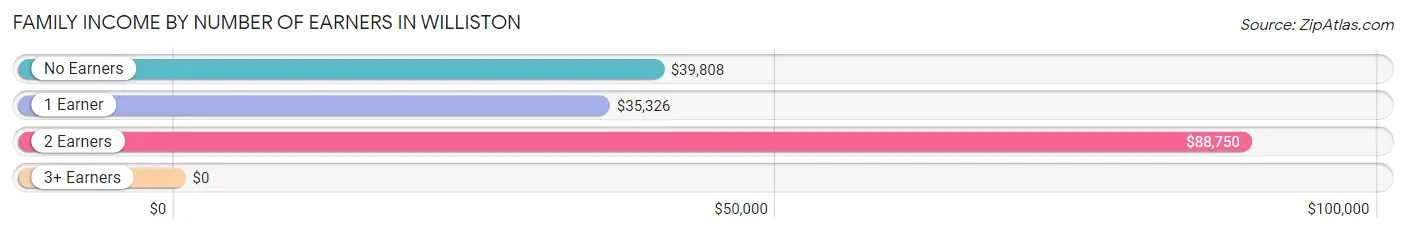
| Number of Earners | # Families | Median Income |
| No Earners | 114 (16.2%) | $39,808 |
| 1 Earner | 248 (35.1%) | $35,326 |
| 2 Earners | 344 (48.7%) | $88,750 |
| 3+ Earners | 0 (0.0%) | $0 |
| Total | 706 (100.0%) | $53,672 |
Household Income in Williston
Household Income Brackets in Williston
With 227 households falling in the category, the $35,000 to $49,999 income range is the most frequent in Williston, accounting for 16.4% of all households. In contrast, only 7 households (0.5%) fall into the $150,000 to $199,999 income bracket, making it the least populous group.
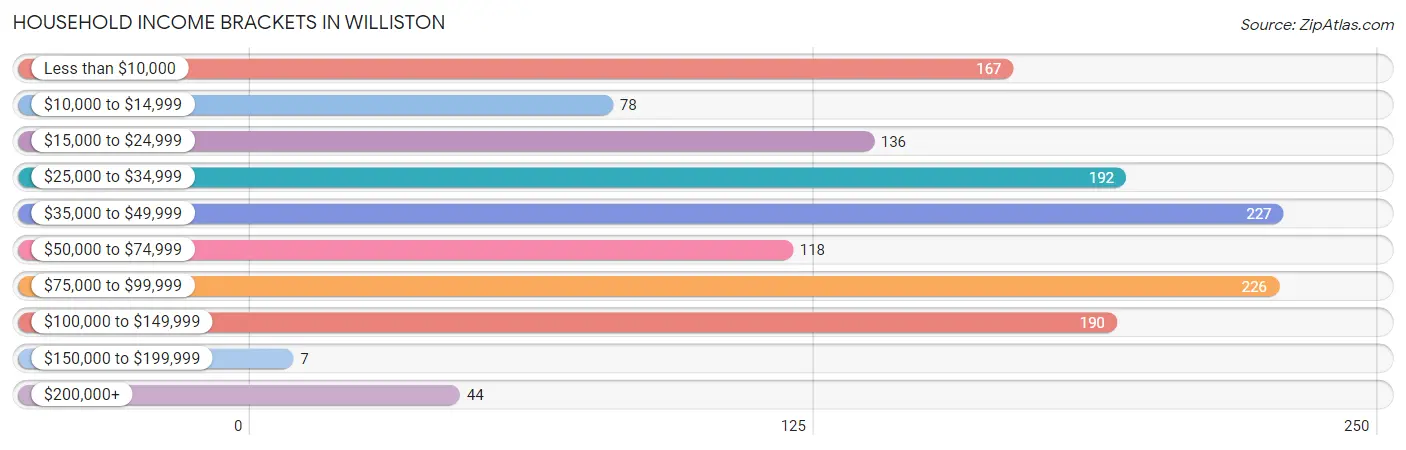
| Income Bracket | # Households | % Households |
| Less than $10,000 | 167 | 12.1% |
| $10,000 to $14,999 | 78 | 5.6% |
| $15,000 to $24,999 | 136 | 9.8% |
| $25,000 to $34,999 | 192 | 13.9% |
| $35,000 to $49,999 | 227 | 16.4% |
| $50,000 to $74,999 | 118 | 8.5% |
| $75,000 to $99,999 | 226 | 16.3% |
| $100,000 to $149,999 | 190 | 13.7% |
| $150,000 to $199,999 | 7 | 0.5% |
| $200,000+ | 44 | 3.2% |
Household Income by Householder Age in Williston
The median household income in Williston is $37,398, with the highest median household income of $58,867 found in the 25 to 44 years age bracket for the primary householder. A total of 405 households (29.3%) fall into this category. Meanwhile, the 15 to 24 years age bracket for the primary householder has the lowest median household income of $2,499, with 52 households (3.8%) in this group.
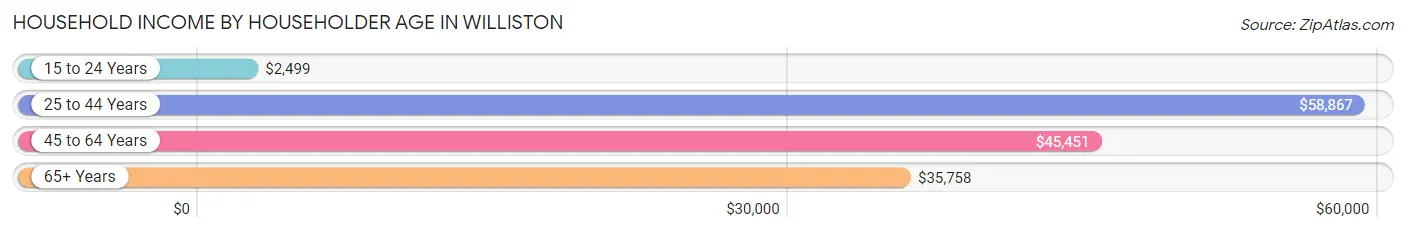
| Income Bracket | # Households | Median Income |
| 15 to 24 Years | 52 (3.8%) | $2,499 |
| 25 to 44 Years | 405 (29.3%) | $58,867 |
| 45 to 64 Years | 524 (37.9%) | $45,451 |
| 65+ Years | 403 (29.1%) | $35,758 |
| Total | 1,384 (100.0%) | $37,398 |
Poverty in Williston
Income Below Poverty by Sex and Age in Williston
With 17.6% poverty level for males and 33.0% for females among the residents of Williston, 12 to 14 year old males and 12 to 14 year old females are the most vulnerable to poverty, with 12 males (100.0%) and 12 females (100.0%) in their respective age groups living below the poverty level.
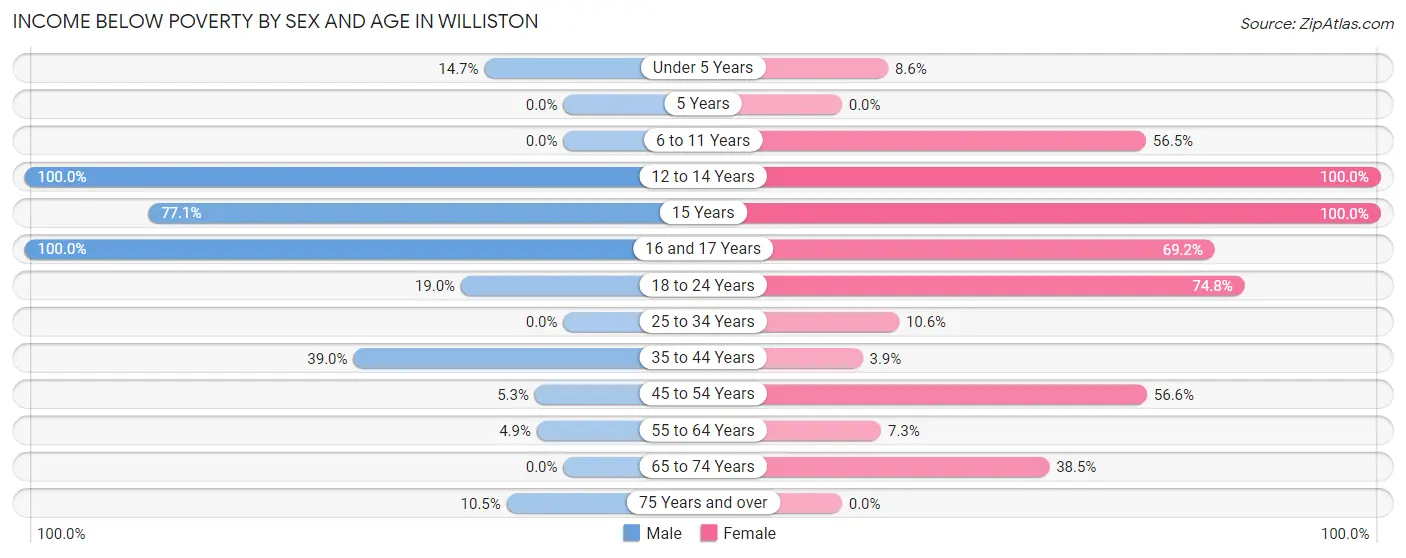
| Age Bracket | Male | Female |
| Under 5 Years | 17 (14.7%) | 6 (8.6%) |
| 5 Years | 0 (0.0%) | 0 (0.0%) |
| 6 to 11 Years | 0 (0.0%) | 35 (56.5%) |
| 12 to 14 Years | 12 (100.0%) | 12 (100.0%) |
| 15 Years | 47 (77.0%) | 10 (100.0%) |
| 16 and 17 Years | 92 (100.0%) | 45 (69.2%) |
| 18 to 24 Years | 23 (19.0%) | 83 (74.8%) |
| 25 to 34 Years | 0 (0.0%) | 14 (10.6%) |
| 35 to 44 Years | 23 (39.0%) | 6 (3.8%) |
| 45 to 54 Years | 8 (5.3%) | 158 (56.6%) |
| 55 to 64 Years | 10 (4.9%) | 15 (7.3%) |
| 65 to 74 Years | 0 (0.0%) | 77 (38.5%) |
| 75 Years and over | 16 (10.5%) | 0 (0.0%) |
| Total | 248 (17.6%) | 461 (33.0%) |
Income Above Poverty by Sex and Age in Williston
According to the poverty statistics in Williston, males aged 5 years and females aged 75 years and over are the age groups that are most secure financially, with 100.0% of males and 100.0% of females in these age groups living above the poverty line.
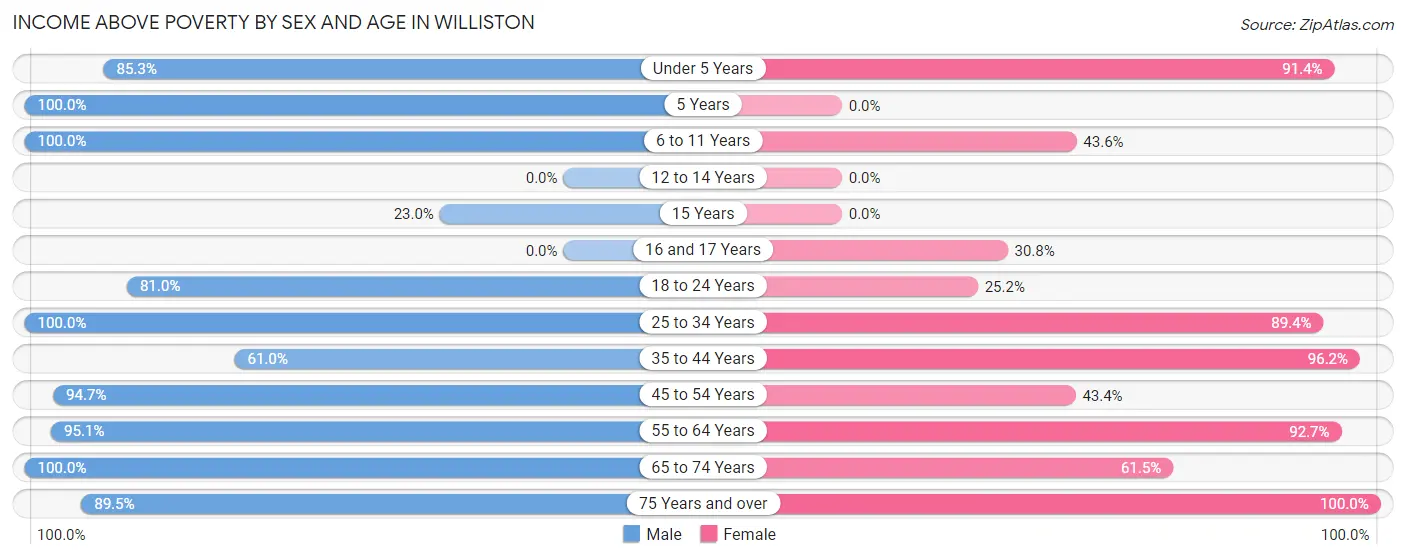
| Age Bracket | Male | Female |
| Under 5 Years | 99 (85.3%) | 64 (91.4%) |
| 5 Years | 11 (100.0%) | 0 (0.0%) |
| 6 to 11 Years | 62 (100.0%) | 27 (43.5%) |
| 12 to 14 Years | 0 (0.0%) | 0 (0.0%) |
| 15 Years | 14 (23.0%) | 0 (0.0%) |
| 16 and 17 Years | 0 (0.0%) | 20 (30.8%) |
| 18 to 24 Years | 98 (81.0%) | 28 (25.2%) |
| 25 to 34 Years | 229 (100.0%) | 118 (89.4%) |
| 35 to 44 Years | 36 (61.0%) | 150 (96.2%) |
| 45 to 54 Years | 143 (94.7%) | 121 (43.4%) |
| 55 to 64 Years | 193 (95.1%) | 191 (92.7%) |
| 65 to 74 Years | 143 (100.0%) | 123 (61.5%) |
| 75 Years and over | 136 (89.5%) | 96 (100.0%) |
| Total | 1,164 (82.4%) | 938 (67.0%) |
Income Below Poverty Among Married-Couple Families in Williston
The poverty statistics for married-couple families in Williston show that 6.1% or 20 of the total 330 families live below the poverty line. Families with 3 or 4 children have the highest poverty rate of 100.0%, comprising of 14 families. On the other hand, families with no children have the lowest poverty rate of 0.0%, which includes 0 families.
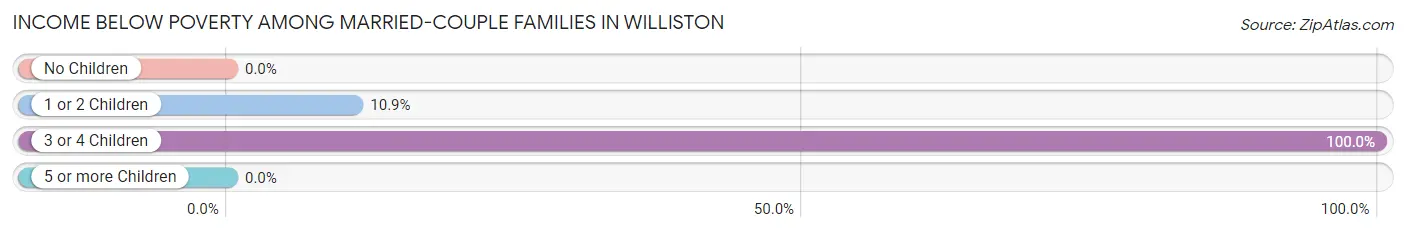
| Children | Above Poverty | Below Poverty |
| No Children | 261 (100.0%) | 0 (0.0%) |
| 1 or 2 Children | 49 (89.1%) | 6 (10.9%) |
| 3 or 4 Children | 0 (0.0%) | 14 (100.0%) |
| 5 or more Children | 0 (0.0%) | 0 (0.0%) |
| Total | 310 (93.9%) | 20 (6.1%) |
Income Below Poverty Among Single-Parent Households in Williston
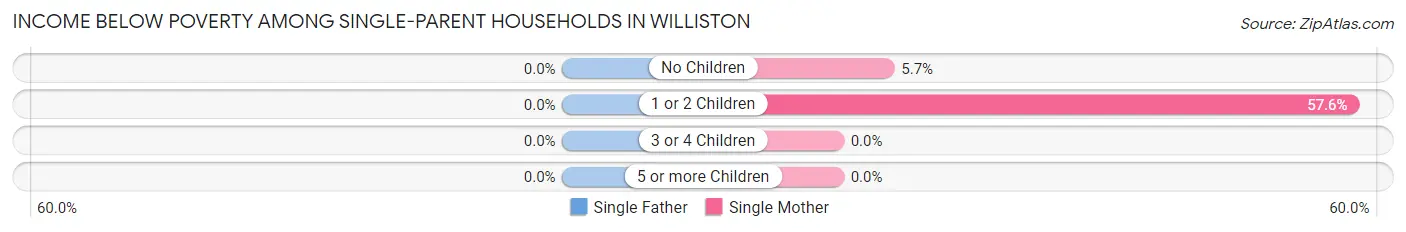
| Children | Single Father | Single Mother |
| No Children | 0 (0.0%) | 9 (5.7%) |
| 1 or 2 Children | 0 (0.0%) | 102 (57.6%) |
| 3 or 4 Children | 0 (0.0%) | 0 (0.0%) |
| 5 or more Children | 0 (0.0%) | 0 (0.0%) |
| Total | 0 (0.0%) | 111 (33.0%) |
Income Below Poverty Among Married-Couple vs Single-Parent Households in Williston
The poverty data for Williston shows that 20 of the married-couple family households (6.1%) and 111 of the single-parent households (29.5%) are living below the poverty level. Within the married-couple family households, those with 3 or 4 children have the highest poverty rate, with 14 households (100.0%) falling below the poverty line. Among the single-parent households, those with 1 or 2 children have the highest poverty rate, with 102 household (47.0%) living below poverty.
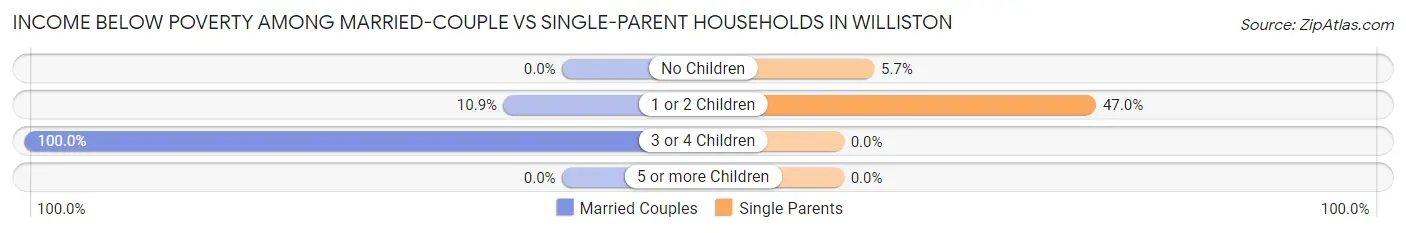
| Children | Married-Couple Families | Single-Parent Households |
| No Children | 0 (0.0%) | 9 (5.7%) |
| 1 or 2 Children | 6 (10.9%) | 102 (47.0%) |
| 3 or 4 Children | 14 (100.0%) | 0 (0.0%) |
| 5 or more Children | 0 (0.0%) | 0 (0.0%) |
| Total | 20 (6.1%) | 111 (29.5%) |
Race in Williston
The most populous races in Williston are Black / African American (1,449 | 50.4%), White / Caucasian (1,415 | 49.2%), and Two or more Races (13 | 0.4%).
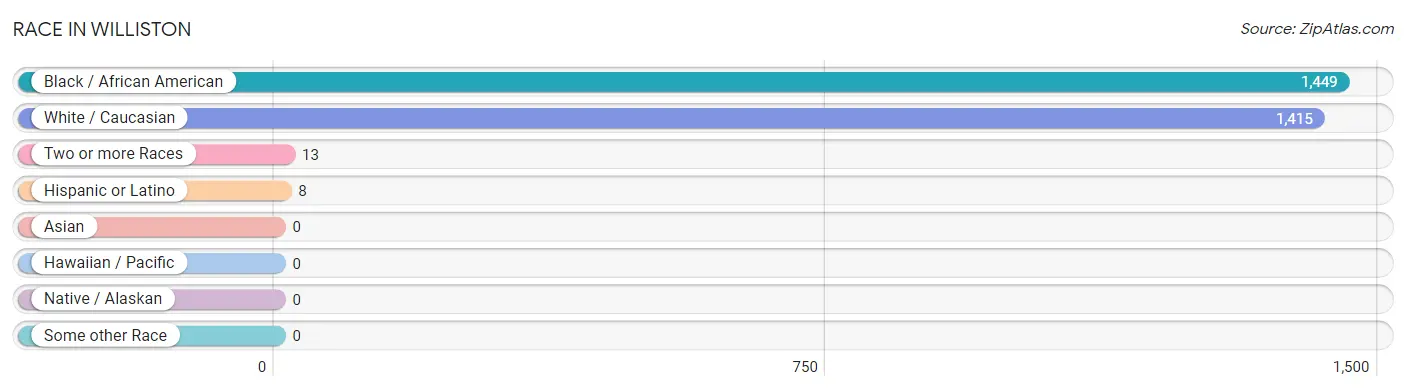
| Race | # Population | % Population |
| Asian | 0 | 0.0% |
| Black / African American | 1,449 | 50.4% |
| Hawaiian / Pacific | 0 | 0.0% |
| Hispanic or Latino | 8 | 0.3% |
| Native / Alaskan | 0 | 0.0% |
| White / Caucasian | 1,415 | 49.2% |
| Two or more Races | 13 | 0.4% |
| Some other Race | 0 | 0.0% |
| Total | 2,877 | 100.0% |
Ancestry in Williston
The most populous ancestries reported in Williston are American (399 | 13.9%), English (183 | 6.4%), Maltese (139 | 4.8%), Irish (124 | 4.3%), and German (100 | 3.5%), together accounting for 32.8% of all Williston residents.
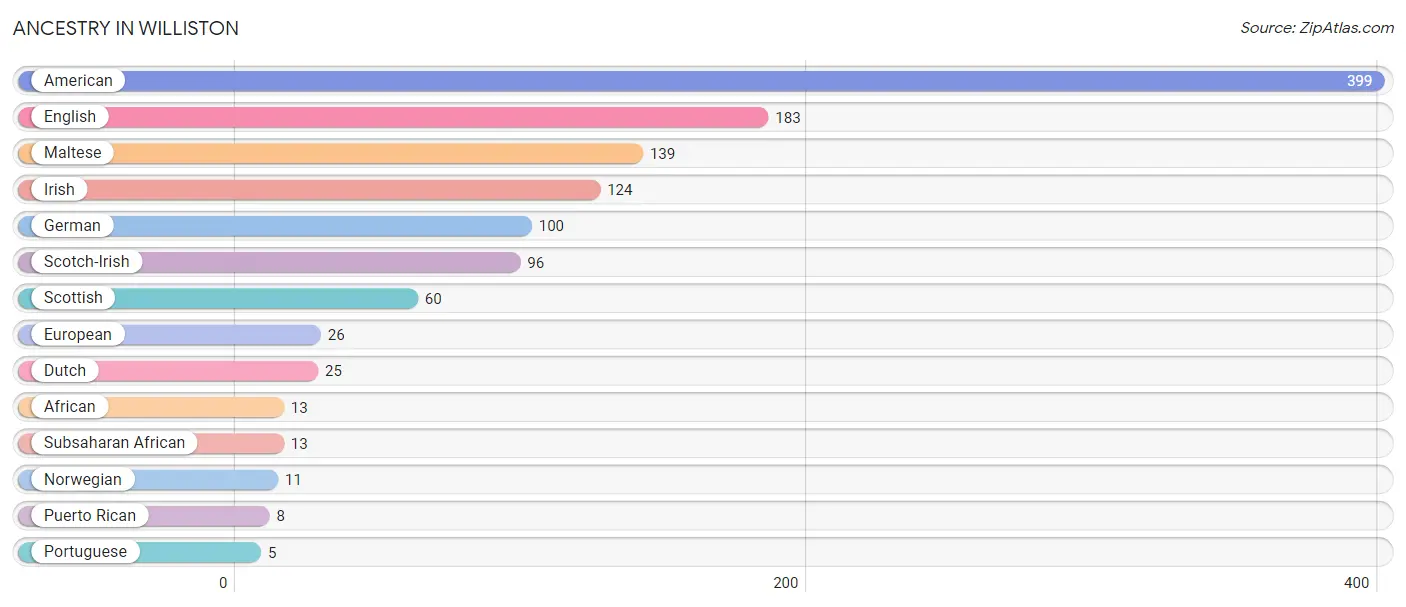
| Ancestry | # Population | % Population |
| African | 13 | 0.4% |
| American | 399 | 13.9% |
| Dutch | 25 | 0.9% |
| English | 183 | 6.4% |
| European | 26 | 0.9% |
| German | 100 | 3.5% |
| Irish | 124 | 4.3% |
| Maltese | 139 | 4.8% |
| Norwegian | 11 | 0.4% |
| Portuguese | 5 | 0.2% |
| Puerto Rican | 8 | 0.3% |
| Scotch-Irish | 96 | 3.3% |
| Scottish | 60 | 2.1% |
| Subsaharan African | 13 | 0.4% | View All 14 Rows |
Immigrants in Williston

| Immigration Origin | # Population | % Population | View All 0 Rows |
Sex and Age in Williston
Sex and Age in Williston
The most populous age groups in Williston are 25 to 29 Years (197 | 13.7%) for men and 50 to 54 Years (206 | 14.3%) for women.
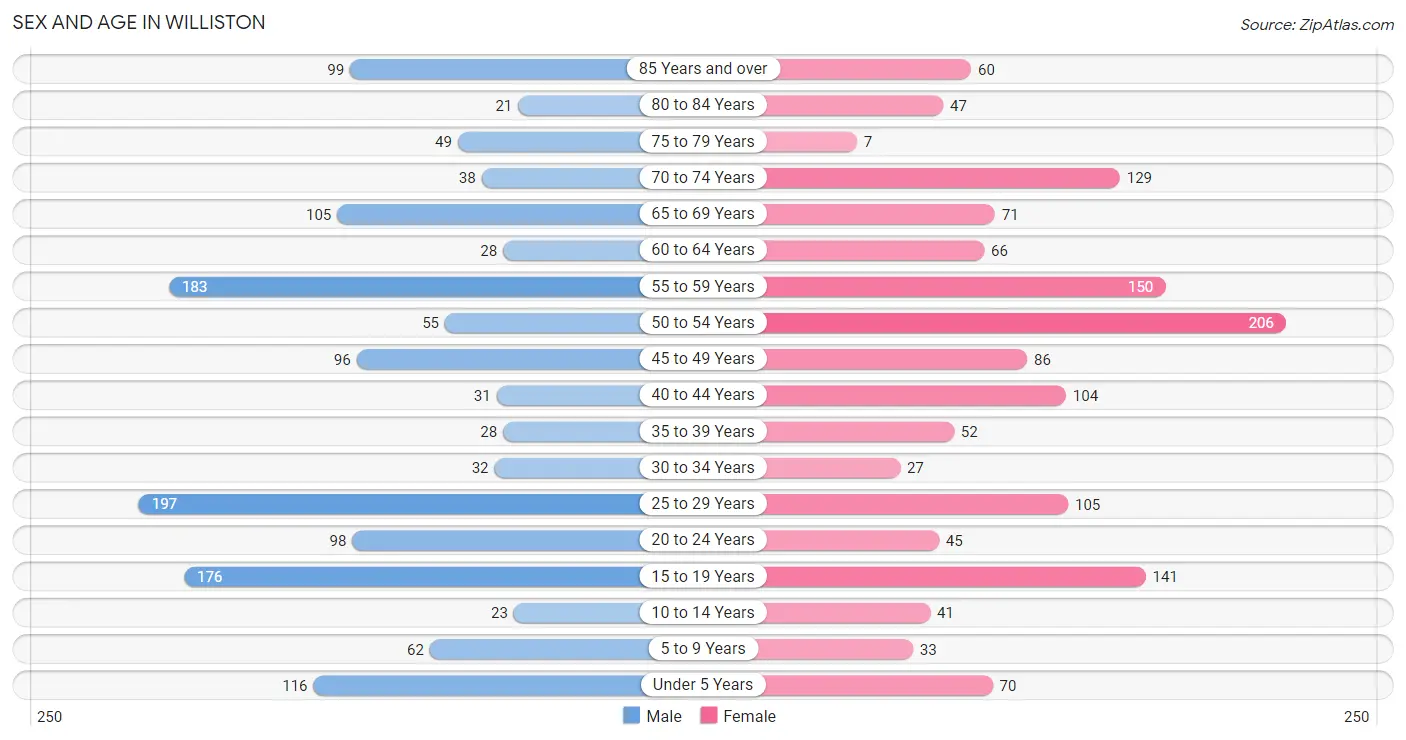
| Age Bracket | Male | Female |
| Under 5 Years | 116 (8.1%) | 70 (4.9%) |
| 5 to 9 Years | 62 (4.3%) | 33 (2.3%) |
| 10 to 14 Years | 23 (1.6%) | 41 (2.9%) |
| 15 to 19 Years | 176 (12.2%) | 141 (9.8%) |
| 20 to 24 Years | 98 (6.8%) | 45 (3.1%) |
| 25 to 29 Years | 197 (13.7%) | 105 (7.3%) |
| 30 to 34 Years | 32 (2.2%) | 27 (1.9%) |
| 35 to 39 Years | 28 (1.9%) | 52 (3.6%) |
| 40 to 44 Years | 31 (2.2%) | 104 (7.2%) |
| 45 to 49 Years | 96 (6.7%) | 86 (6.0%) |
| 50 to 54 Years | 55 (3.8%) | 206 (14.3%) |
| 55 to 59 Years | 183 (12.7%) | 150 (10.4%) |
| 60 to 64 Years | 28 (1.9%) | 66 (4.6%) |
| 65 to 69 Years | 105 (7.3%) | 71 (4.9%) |
| 70 to 74 Years | 38 (2.6%) | 129 (9.0%) |
| 75 to 79 Years | 49 (3.4%) | 7 (0.5%) |
| 80 to 84 Years | 21 (1.5%) | 47 (3.3%) |
| 85 Years and over | 99 (6.9%) | 60 (4.2%) |
| Total | 1,437 (100.0%) | 1,440 (100.0%) |
Families and Households in Williston
Median Family Size in Williston
The median family size in Williston is 2.85 persons per family, with single male/father families (40 | 5.7%) accounting for the largest median family size of 4.48 persons per family. On the other hand, married-couple families (330 | 46.7%) represent the smallest median family size with 2.51 persons per family.
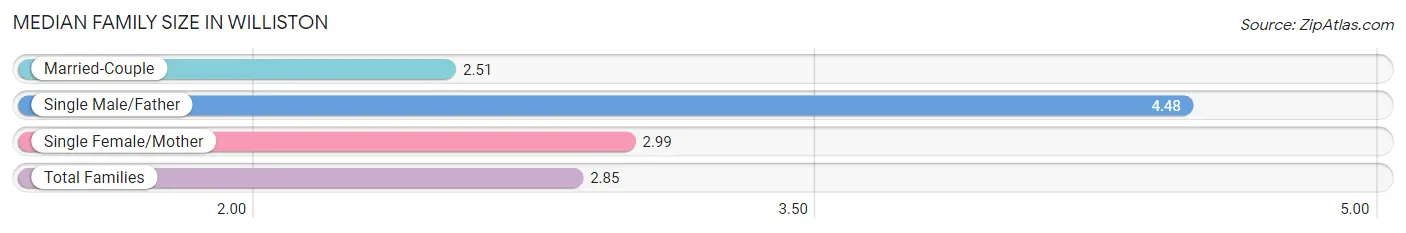
| Family Type | # Families | Family Size |
| Married-Couple | 330 (46.7%) | 2.51 |
| Single Male/Father | 40 (5.7%) | 4.48 |
| Single Female/Mother | 336 (47.6%) | 2.99 |
| Total Families | 706 (100.0%) | 2.85 |
Median Household Size in Williston
The median household size in Williston is 2.01 persons per household, with single male/father households (40 | 2.9%) accounting for the largest median household size of 5.53 persons per household. non-family households (678 | 49.0%) represent the smallest median household size with 1.02 persons per household.
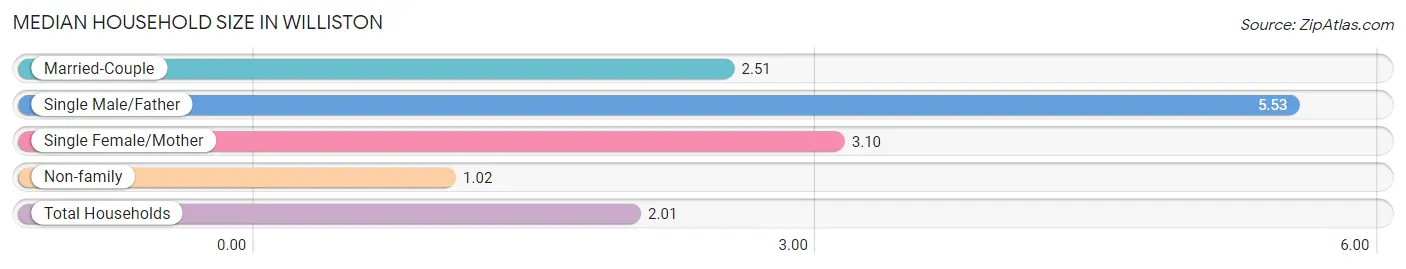
| Household Type | # Households | Household Size |
| Married-Couple | 330 (23.8%) | 2.51 |
| Single Male/Father | 40 (2.9%) | 5.53 |
| Single Female/Mother | 336 (24.3%) | 3.10 |
| Non-family | 678 (49.0%) | 1.02 |
| Total Households | 1,384 (100.0%) | 2.01 |
Household Size by Marriage Status in Williston
Out of a total of 1,384 households in Williston, 706 (51.0%) are family households, while 678 (49.0%) are nonfamily households. The most numerous type of family households are 2-person households, comprising 432, and the most common type of nonfamily households are 1-person households, comprising 664.
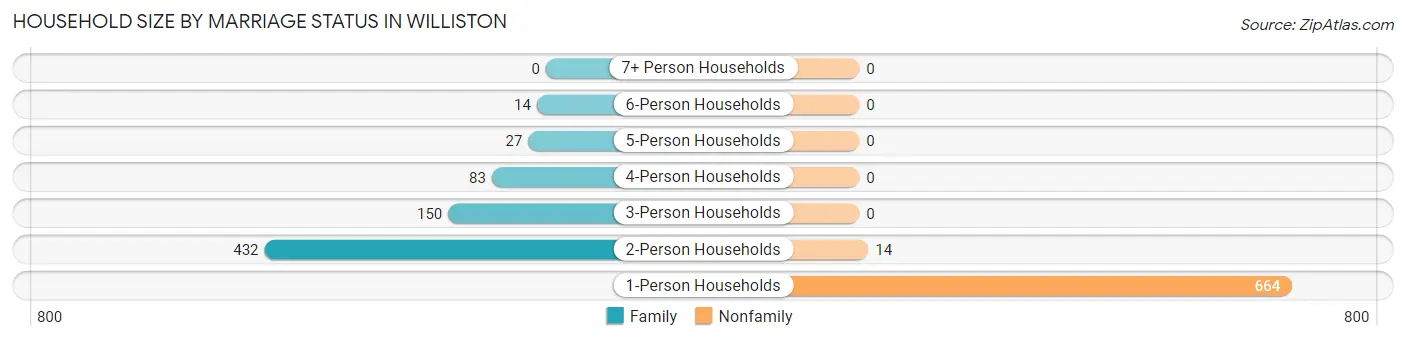
| Household Size | Family Households | Nonfamily Households |
| 1-Person Households | - | 664 (48.0%) |
| 2-Person Households | 432 (31.2%) | 14 (1.0%) |
| 3-Person Households | 150 (10.8%) | 0 (0.0%) |
| 4-Person Households | 83 (6.0%) | 0 (0.0%) |
| 5-Person Households | 27 (1.9%) | 0 (0.0%) |
| 6-Person Households | 14 (1.0%) | 0 (0.0%) |
| 7+ Person Households | 0 (0.0%) | 0 (0.0%) |
| Total | 706 (51.0%) | 678 (49.0%) |
Female Fertility in Williston
Fertility by Age in Williston
Average fertility rate in Williston is 174.0 births per 1,000 women. Women in the age bracket of 20 to 34 years have the highest fertility rate with 593.0 births per 1,000 women. Women in the age bracket of 20 to 34 years acount for 100.0% of all women with births.
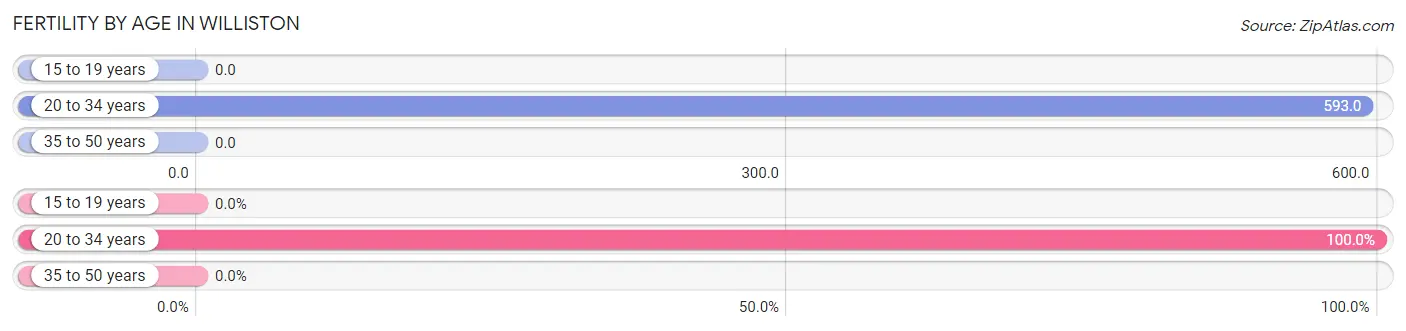
| Age Bracket | Women with Births | Births / 1,000 Women |
| 15 to 19 years | 0 (0.0%) | 0.0 |
| 20 to 34 years | 105 (100.0%) | 593.0 |
| 35 to 50 years | 0 (0.0%) | 0.0 |
| Total | 105 (100.0%) | 174.0 |
Fertility by Age by Marriage Status in Williston
15.2% of women with births (105) in Williston are married. The highest percentage of unmarried women with births falls into 20 to 34 years age bracket with 84.8% of them unmarried at the time of birth, while the lowest percentage of unmarried women with births belong to 20 to 34 years age bracket with 84.8% of them unmarried.
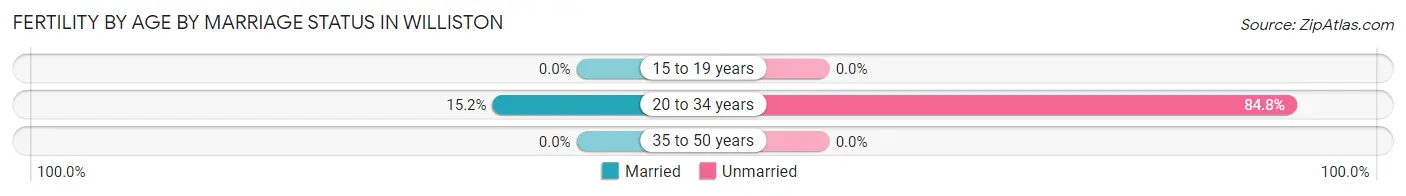
| Age Bracket | Married | Unmarried |
| 15 to 19 years | 0 (0.0%) | 0 (0.0%) |
| 20 to 34 years | 16 (15.2%) | 89 (84.8%) |
| 35 to 50 years | 0 (0.0%) | 0 (0.0%) |
| Total | 16 (15.2%) | 89 (84.8%) |
Fertility by Education in Williston
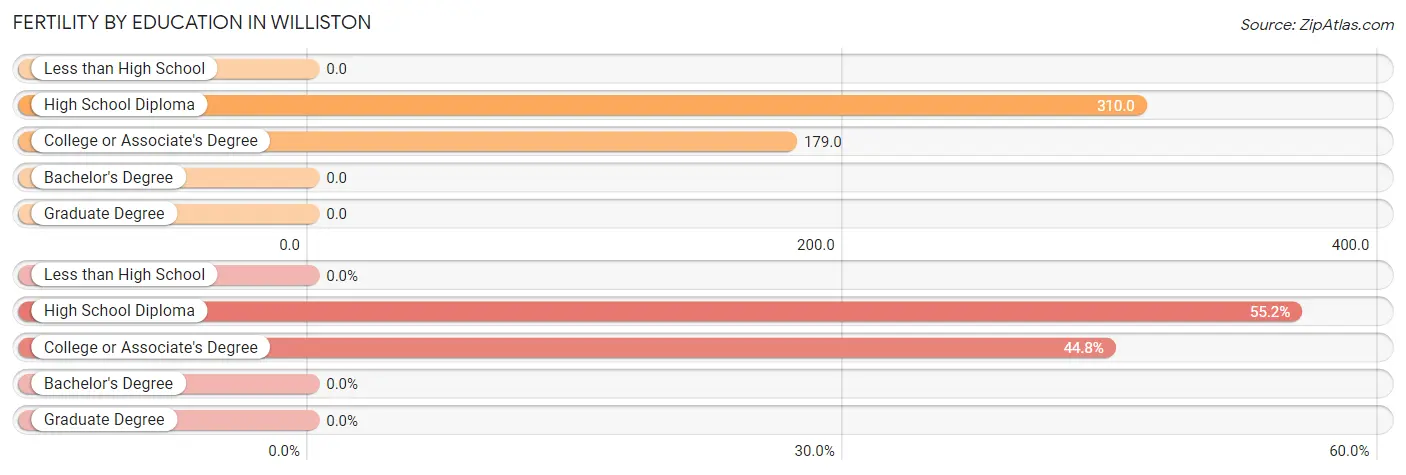
| Educational Attainment | Women with Births | Births / 1,000 Women |
| Less than High School | 0 (0.0%) | 0.0 |
| High School Diploma | 58 (55.2%) | 310.0 |
| College or Associate's Degree | 47 (44.8%) | 179.0 |
| Bachelor's Degree | 0 (0.0%) | 0.0 |
| Graduate Degree | 0 (0.0%) | 0.0 |
| Total | 105 (100.0%) | 174.0 |
Fertility by Education by Marriage Status in Williston
84.8% of women with births in Williston are unmarried. Women with the educational attainment of high school diploma are most likely to be married with 27.6% of them married at childbirth, while women with the educational attainment of college or associate's degree are least likely to be married with 100.0% of them unmarried at childbirth.
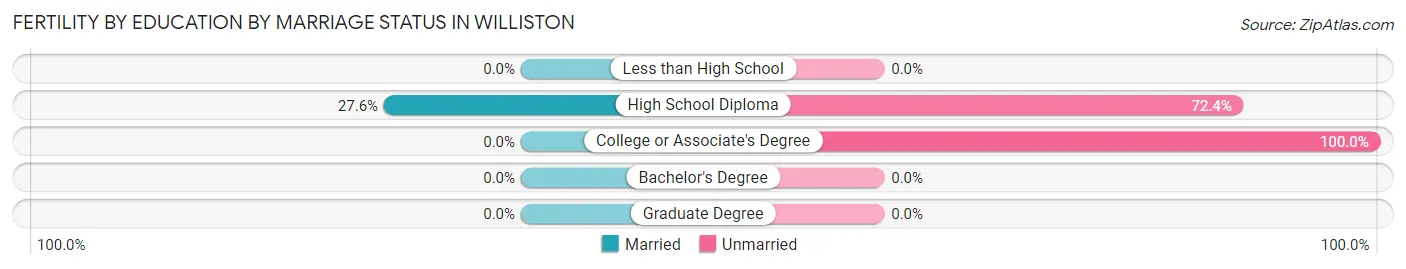
| Educational Attainment | Married | Unmarried |
| Less than High School | 0 (0.0%) | 0 (0.0%) |
| High School Diploma | 16 (27.6%) | 42 (72.4%) |
| College or Associate's Degree | 0 (0.0%) | 47 (100.0%) |
| Bachelor's Degree | 0 (0.0%) | 0 (0.0%) |
| Graduate Degree | 0 (0.0%) | 0 (0.0%) |
| Total | 16 (15.2%) | 89 (84.8%) |
Employment Characteristics in Williston
Employment by Class of Employer in Williston
Among the 1,471 employed individuals in Williston, private company employees (1,007 | 68.5%), local government employees (176 | 12.0%), and state government employees (127 | 8.6%) make up the most common classes of employment.
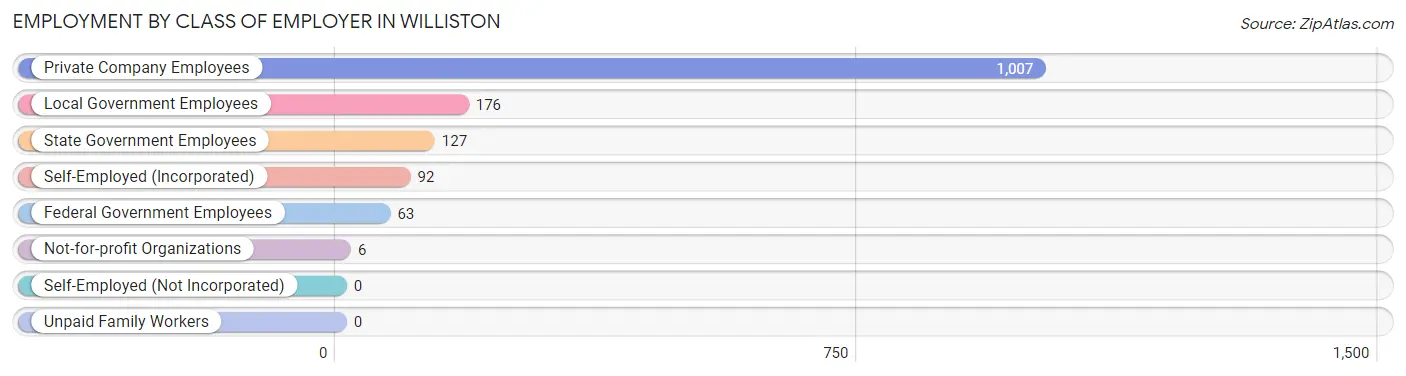
| Employer Class | # Employees | % Employees |
| Private Company Employees | 1,007 | 68.5% |
| Self-Employed (Incorporated) | 92 | 6.2% |
| Self-Employed (Not Incorporated) | 0 | 0.0% |
| Not-for-profit Organizations | 6 | 0.4% |
| Local Government Employees | 176 | 12.0% |
| State Government Employees | 127 | 8.6% |
| Federal Government Employees | 63 | 4.3% |
| Unpaid Family Workers | 0 | 0.0% |
| Total | 1,471 | 100.0% |
Employment Status by Age in Williston
According to the labor force statistics for Williston, out of the total population over 16 years of age (2,461), 63.3% or 1,558 individuals are in the labor force, with 3.7% or 58 of them unemployed. The age group with the highest labor force participation rate is 35 to 44 years, with 100.0% or 215 individuals in the labor force. Within the labor force, the 45 to 54 years age range has the highest percentage of unemployed individuals, with 16.6% or 58 of them being unemployed.
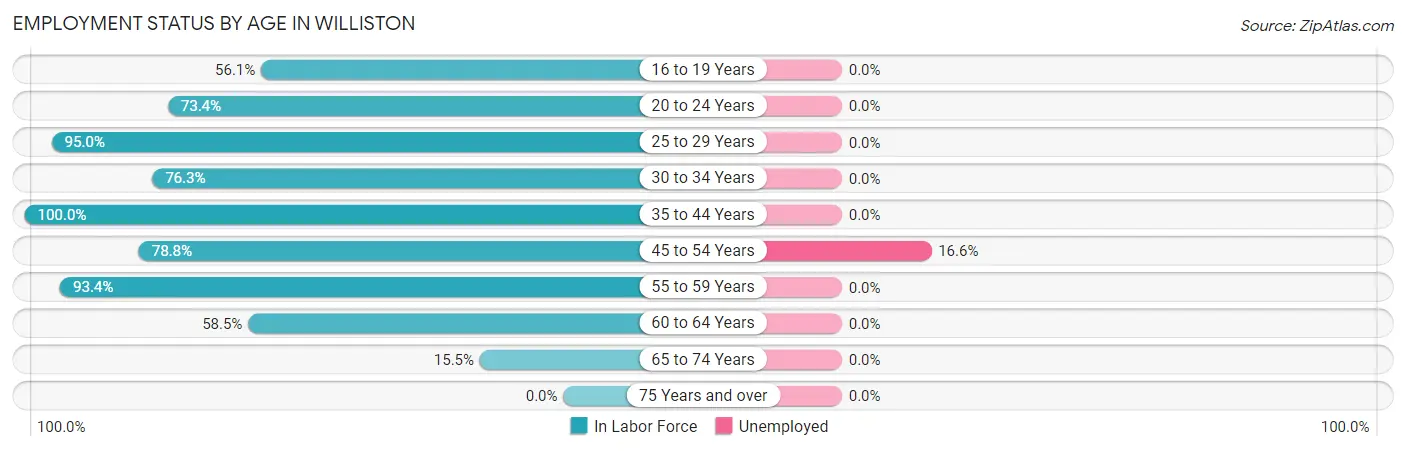
| Age Bracket | In Labor Force | Unemployed |
| 16 to 19 Years | 138 (56.1%) | 0 (0.0%) |
| 20 to 24 Years | 105 (73.4%) | 0 (0.0%) |
| 25 to 29 Years | 287 (95.0%) | 0 (0.0%) |
| 30 to 34 Years | 45 (76.3%) | 0 (0.0%) |
| 35 to 44 Years | 215 (100.0%) | 0 (0.0%) |
| 45 to 54 Years | 349 (78.8%) | 58 (16.6%) |
| 55 to 59 Years | 311 (93.4%) | 0 (0.0%) |
| 60 to 64 Years | 55 (58.5%) | 0 (0.0%) |
| 65 to 74 Years | 53 (15.5%) | 0 (0.0%) |
| 75 Years and over | 0 (0.0%) | 0 (0.0%) |
| Total | 1,558 (63.3%) | 58 (3.7%) |
Employment Status by Educational Attainment in Williston
According to labor force statistics for Williston, 87.3% of individuals (1,262) out of the total population between 25 and 64 years of age (1,446) are in the labor force, with 4.6% or 58 of them being unemployed. The group with the highest labor force participation rate are those with the educational attainment of bachelor's degree or higher, with 100.0% or 304 individuals in the labor force. Within the labor force, individuals with college / associate degree education have the highest percentage of unemployment, with 12.8% or 53 of them being unemployed.
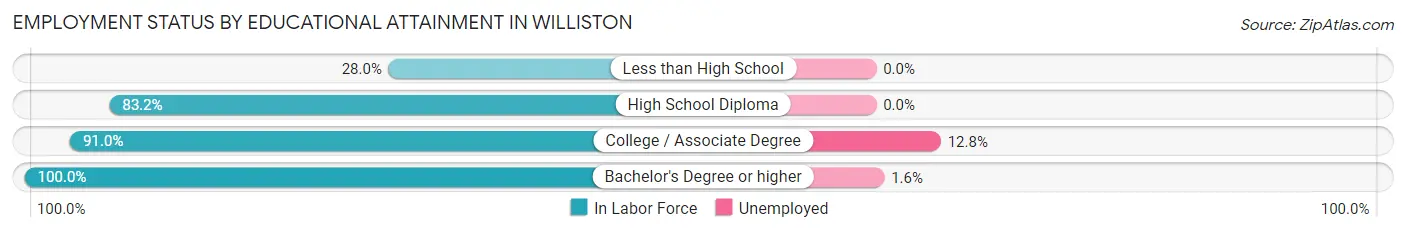
| Educational Attainment | In Labor Force | Unemployed |
| Less than High School | 14 (28.0%) | 0 (0.0%) |
| High School Diploma | 531 (83.2%) | 0 (0.0%) |
| College / Associate Degree | 413 (91.0%) | 58 (12.8%) |
| Bachelor's Degree or higher | 304 (100.0%) | 5 (1.6%) |
| Total | 1,262 (87.3%) | 67 (4.6%) |
Employment Occupations by Sex in Williston
Management, Business, Science and Arts Occupations
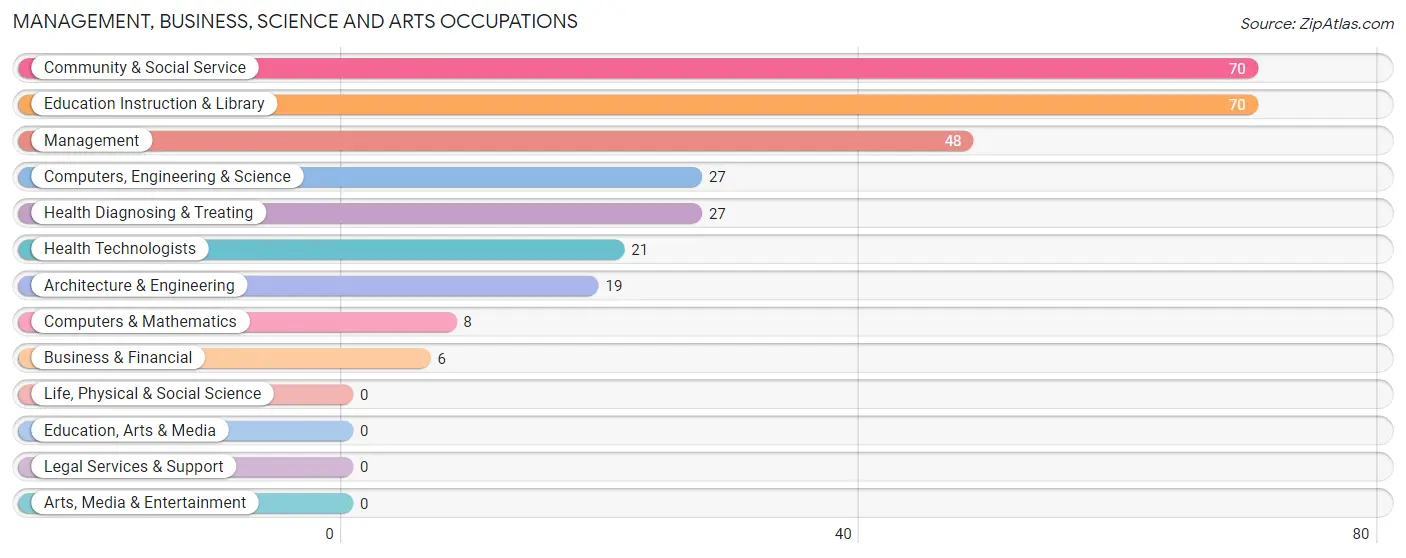
The most common Management, Business, Science and Arts occupations in Williston are Community & Social Service (70 | 4.7%), Education Instruction & Library (70 | 4.7%), Management (48 | 3.2%), Computers, Engineering & Science (27 | 1.8%), and Health Diagnosing & Treating (27 | 1.8%).
Management, Business, Science and Arts Occupations by Sex
Within the Management, Business, Science and Arts occupations in Williston, the most male-oriented occupations are Business & Financial (100.0%), Computers, Engineering & Science (100.0%), and Computers & Mathematics (100.0%), while the most female-oriented occupations are Health Diagnosing & Treating (100.0%), Health Technologists (100.0%), and Community & Social Service (72.9%).
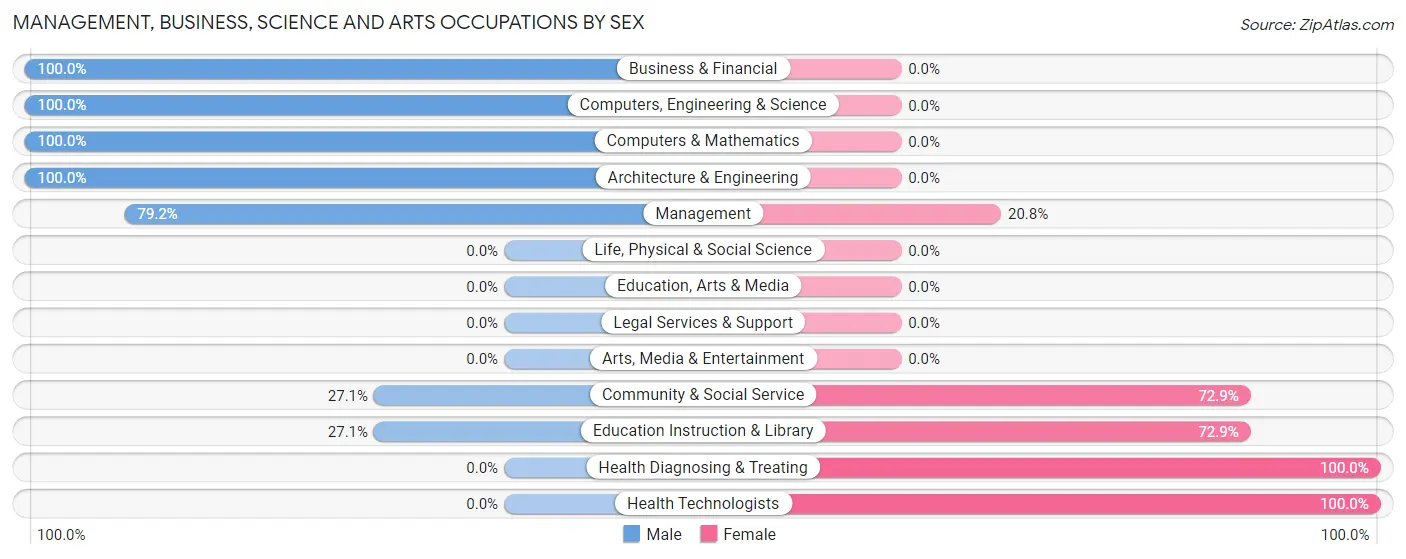
| Occupation | Male | Female |
| Management | 38 (79.2%) | 10 (20.8%) |
| Business & Financial | 6 (100.0%) | 0 (0.0%) |
| Computers, Engineering & Science | 27 (100.0%) | 0 (0.0%) |
| Computers & Mathematics | 8 (100.0%) | 0 (0.0%) |
| Architecture & Engineering | 19 (100.0%) | 0 (0.0%) |
| Life, Physical & Social Science | 0 (0.0%) | 0 (0.0%) |
| Community & Social Service | 19 (27.1%) | 51 (72.9%) |
| Education, Arts & Media | 0 (0.0%) | 0 (0.0%) |
| Legal Services & Support | 0 (0.0%) | 0 (0.0%) |
| Education Instruction & Library | 19 (27.1%) | 51 (72.9%) |
| Arts, Media & Entertainment | 0 (0.0%) | 0 (0.0%) |
| Health Diagnosing & Treating | 0 (0.0%) | 27 (100.0%) |
| Health Technologists | 0 (0.0%) | 21 (100.0%) |
| Total (Category) | 90 (50.6%) | 88 (49.4%) |
| Total (Overall) | 787 (52.5%) | 713 (47.5%) |
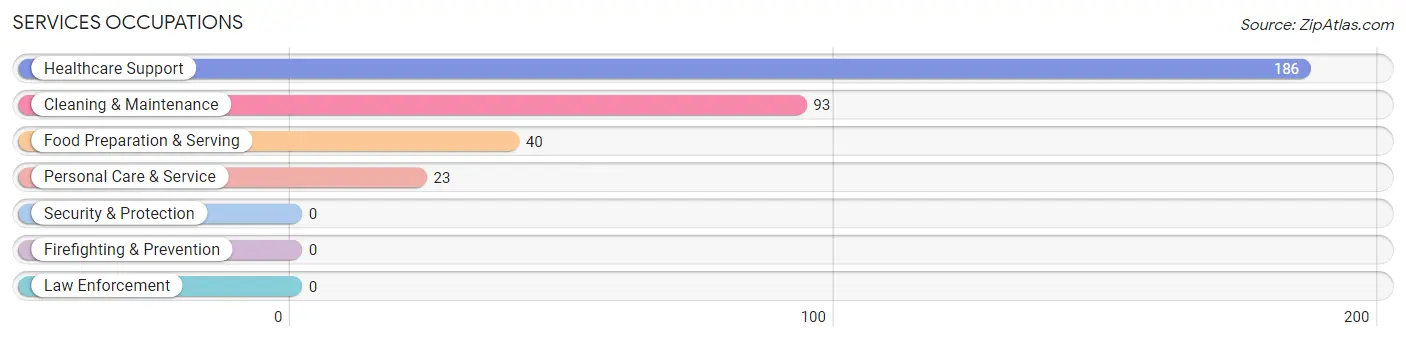
Services Occupations
The most common Services occupations in Williston are Healthcare Support (186 | 12.4%), Cleaning & Maintenance (93 | 6.2%), Food Preparation & Serving (40 | 2.7%), and Personal Care & Service (23 | 1.5%).
Services Occupations by Sex
Within the Services occupations in Williston, the most male-oriented occupations are Cleaning & Maintenance (100.0%), Personal Care & Service (100.0%), and Food Preparation & Serving (25.0%), while the most female-oriented occupations are Healthcare Support (85.0%), and Food Preparation & Serving (75.0%).
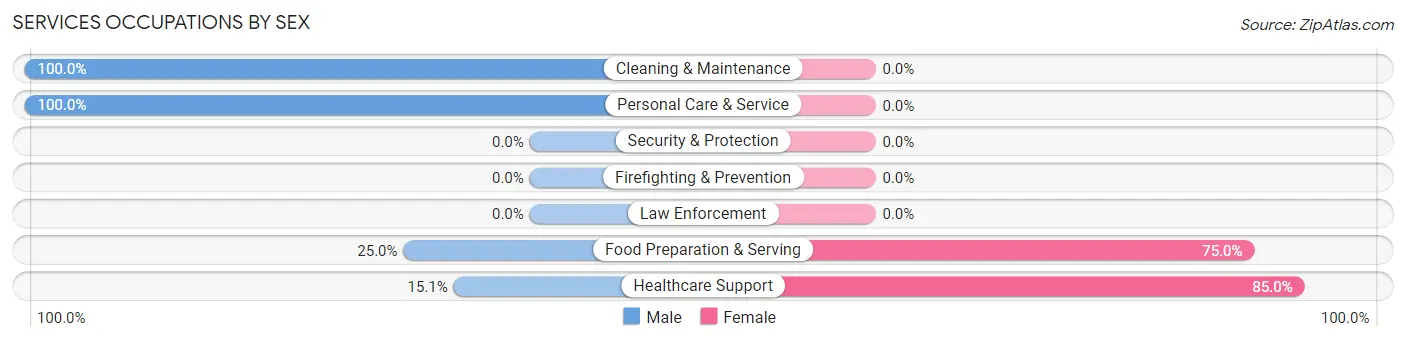
| Occupation | Male | Female |
| Healthcare Support | 28 (15.0%) | 158 (85.0%) |
| Security & Protection | 0 (0.0%) | 0 (0.0%) |
| Firefighting & Prevention | 0 (0.0%) | 0 (0.0%) |
| Law Enforcement | 0 (0.0%) | 0 (0.0%) |
| Food Preparation & Serving | 10 (25.0%) | 30 (75.0%) |
| Cleaning & Maintenance | 93 (100.0%) | 0 (0.0%) |
| Personal Care & Service | 23 (100.0%) | 0 (0.0%) |
| Total (Category) | 154 (45.0%) | 188 (55.0%) |
| Total (Overall) | 787 (52.5%) | 713 (47.5%) |
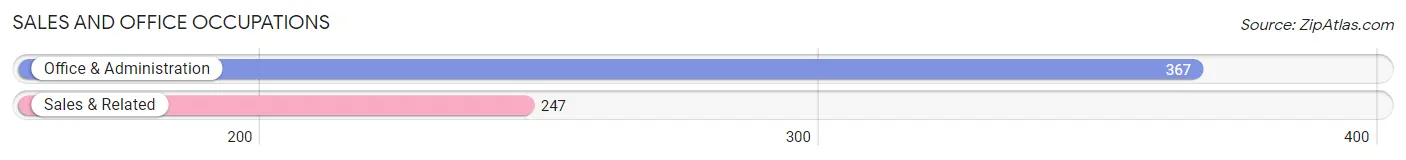
Sales and Office Occupations
The most common Sales and Office occupations in Williston are Office & Administration (367 | 24.5%), and Sales & Related (247 | 16.5%).
Sales and Office Occupations by Sex
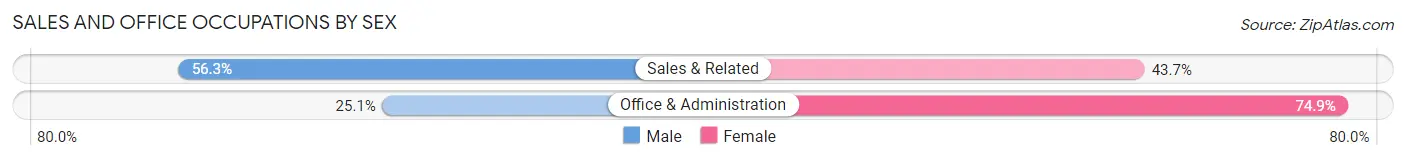
| Occupation | Male | Female |
| Sales & Related | 139 (56.3%) | 108 (43.7%) |
| Office & Administration | 92 (25.1%) | 275 (74.9%) |
| Total (Category) | 231 (37.6%) | 383 (62.4%) |
| Total (Overall) | 787 (52.5%) | 713 (47.5%) |
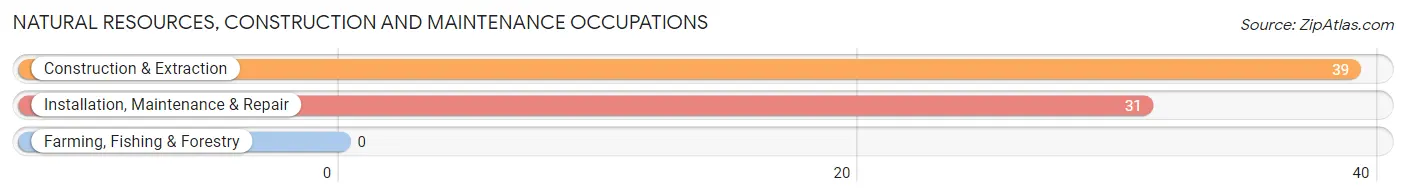
Natural Resources, Construction and Maintenance Occupations
The most common Natural Resources, Construction and Maintenance occupations in Williston are Construction & Extraction (39 | 2.6%), and Installation, Maintenance & Repair (31 | 2.1%).
Natural Resources, Construction and Maintenance Occupations by Sex
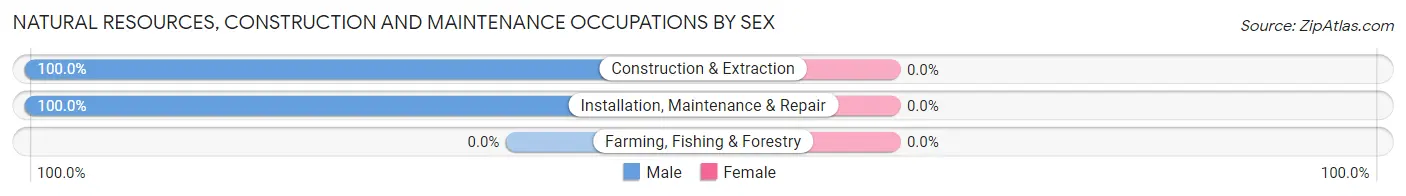
| Occupation | Male | Female |
| Farming, Fishing & Forestry | 0 (0.0%) | 0 (0.0%) |
| Construction & Extraction | 39 (100.0%) | 0 (0.0%) |
| Installation, Maintenance & Repair | 31 (100.0%) | 0 (0.0%) |
| Total (Category) | 70 (100.0%) | 0 (0.0%) |
| Total (Overall) | 787 (52.5%) | 713 (47.5%) |
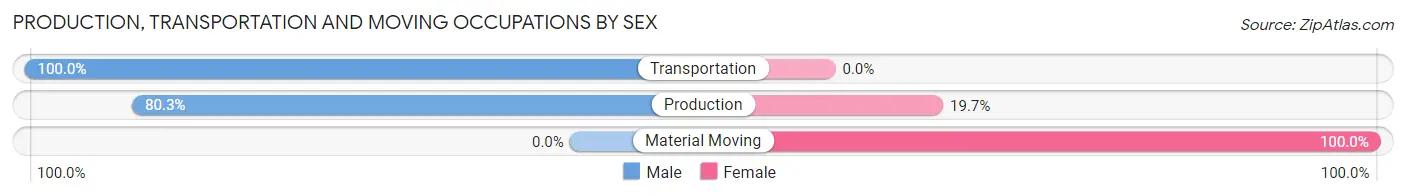
Production, Transportation and Moving Occupations
The most common Production, Transportation and Moving occupations in Williston are Production (228 | 15.2%), Transportation (59 | 3.9%), and Material Moving (9 | 0.6%).
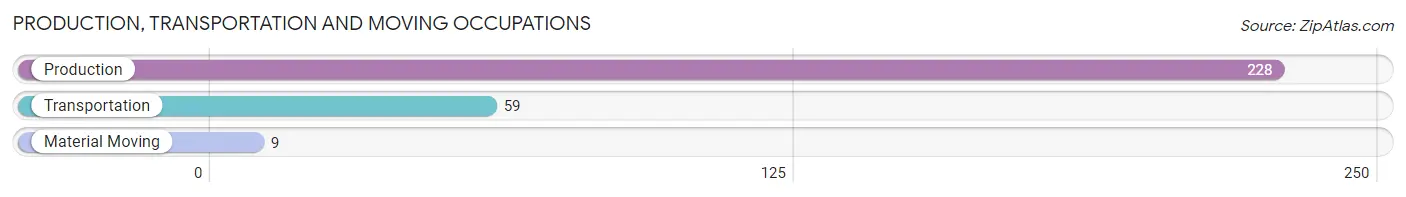
Production, Transportation and Moving Occupations by Sex
| Occupation | Male | Female |
| Production | 183 (80.3%) | 45 (19.7%) |
| Transportation | 59 (100.0%) | 0 (0.0%) |
| Material Moving | 0 (0.0%) | 9 (100.0%) |
| Total (Category) | 242 (81.8%) | 54 (18.2%) |
| Total (Overall) | 787 (52.5%) | 713 (47.5%) |
Employment Industries by Sex in Williston
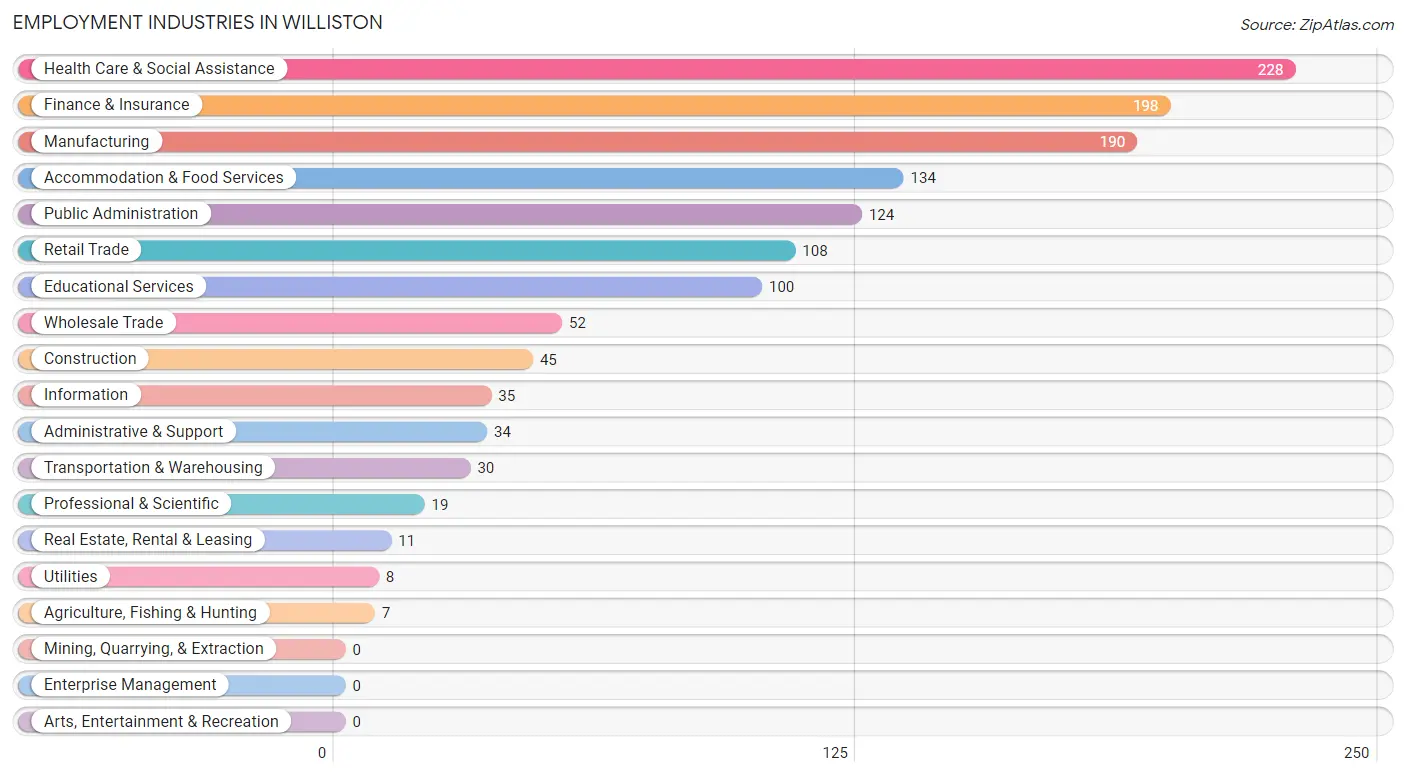
Employment Industries in Williston
The major employment industries in Williston include Health Care & Social Assistance (228 | 15.2%), Finance & Insurance (198 | 13.2%), Manufacturing (190 | 12.7%), Accommodation & Food Services (134 | 8.9%), and Public Administration (124 | 8.3%).
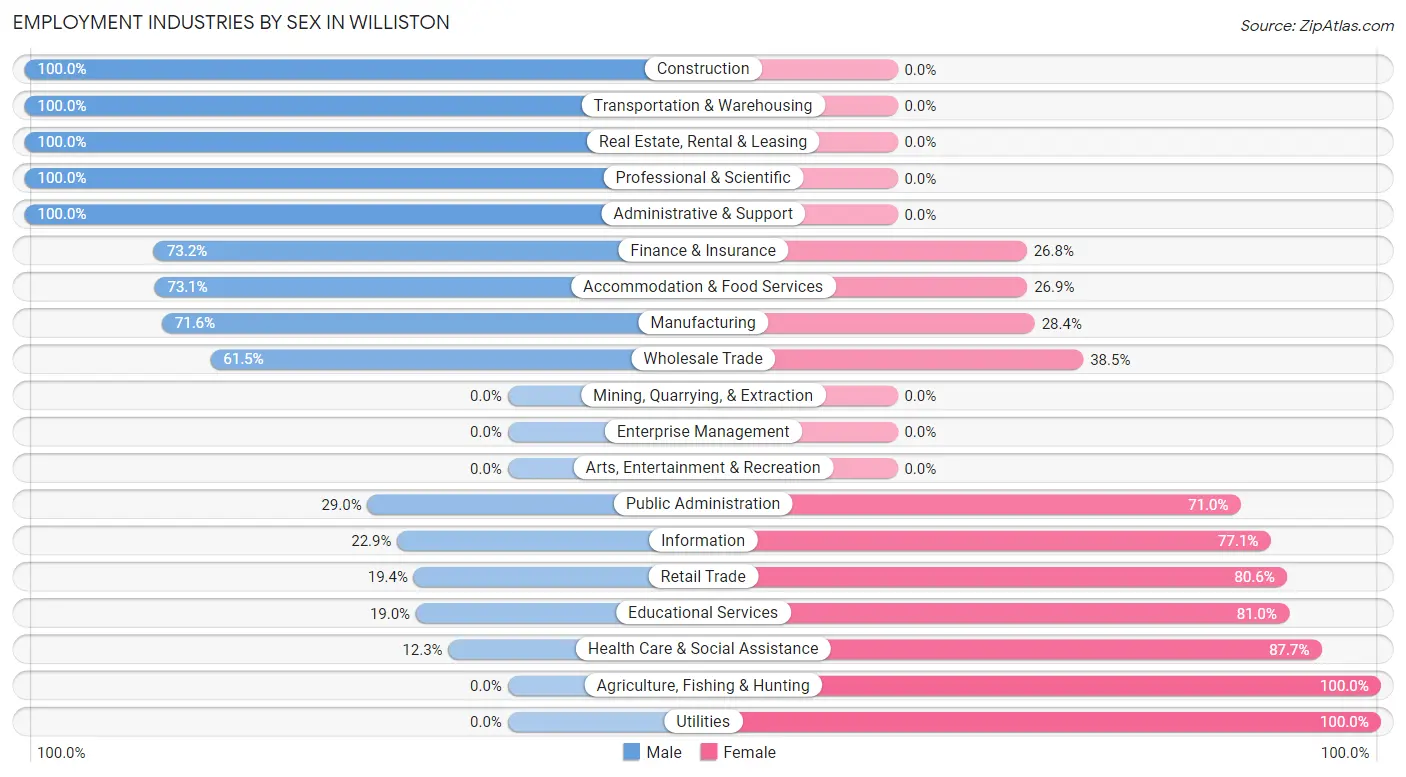
Employment Industries by Sex in Williston
The Williston industries that see more men than women are Construction (100.0%), Transportation & Warehousing (100.0%), and Real Estate, Rental & Leasing (100.0%), whereas the industries that tend to have a higher number of women are Agriculture, Fishing & Hunting (100.0%), Utilities (100.0%), and Health Care & Social Assistance (87.7%).
| Industry | Male | Female |
| Agriculture, Fishing & Hunting | 0 (0.0%) | 7 (100.0%) |
| Mining, Quarrying, & Extraction | 0 (0.0%) | 0 (0.0%) |
| Construction | 45 (100.0%) | 0 (0.0%) |
| Manufacturing | 136 (71.6%) | 54 (28.4%) |
| Wholesale Trade | 32 (61.5%) | 20 (38.5%) |
| Retail Trade | 21 (19.4%) | 87 (80.6%) |
| Transportation & Warehousing | 30 (100.0%) | 0 (0.0%) |
| Utilities | 0 (0.0%) | 8 (100.0%) |
| Information | 8 (22.9%) | 27 (77.1%) |
| Finance & Insurance | 145 (73.2%) | 53 (26.8%) |
| Real Estate, Rental & Leasing | 11 (100.0%) | 0 (0.0%) |
| Professional & Scientific | 19 (100.0%) | 0 (0.0%) |
| Enterprise Management | 0 (0.0%) | 0 (0.0%) |
| Administrative & Support | 34 (100.0%) | 0 (0.0%) |
| Educational Services | 19 (19.0%) | 81 (81.0%) |
| Health Care & Social Assistance | 28 (12.3%) | 200 (87.7%) |
| Arts, Entertainment & Recreation | 0 (0.0%) | 0 (0.0%) |
| Accommodation & Food Services | 98 (73.1%) | 36 (26.9%) |
| Public Administration | 36 (29.0%) | 88 (71.0%) |
| Total | 787 (52.5%) | 713 (47.5%) |
Education in Williston
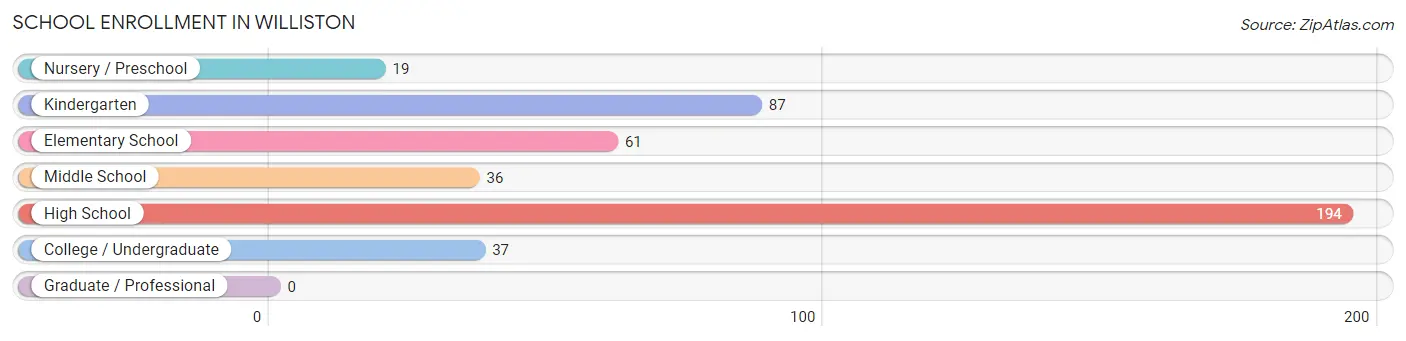
School Enrollment in Williston
The most common levels of schooling among the 434 students in Williston are high school (194 | 44.7%), kindergarten (87 | 20.1%), and elementary school (61 | 14.1%).
| School Level | # Students | % Students |
| Nursery / Preschool | 19 | 4.4% |
| Kindergarten | 87 | 20.1% |
| Elementary School | 61 | 14.1% |
| Middle School | 36 | 8.3% |
| High School | 194 | 44.7% |
| College / Undergraduate | 37 | 8.5% |
| Graduate / Professional | 0 | 0.0% |
| Total | 434 | 100.0% |
School Enrollment by Age by Funding Source in Williston
Out of a total of 434 students who are enrolled in schools in Williston, 64 (14.7%) attend a private institution, while the remaining 370 (85.3%) are enrolled in public schools. The age group of 10 to 14 year olds has the highest likelihood of being enrolled in private schools, with 36 (56.2% in the age bracket) enrolled. Conversely, the age group of 5 to 9 year old has the lowest likelihood of being enrolled in a private school, with 95 (100.0% in the age bracket) attending a public institution.
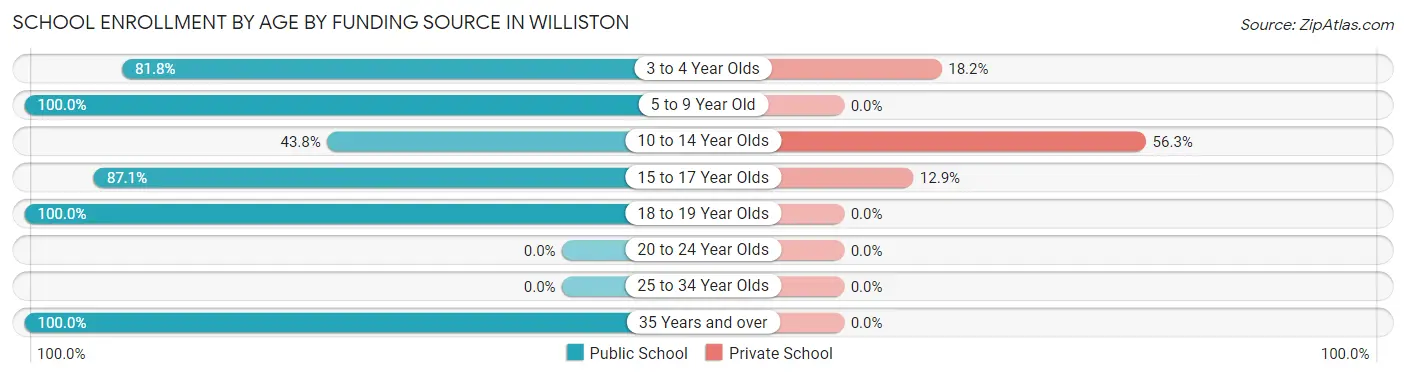
| Age Bracket | Public School | Private School |
| 3 to 4 Year Olds | 36 (81.8%) | 8 (18.2%) |
| 5 to 9 Year Old | 95 (100.0%) | 0 (0.0%) |
| 10 to 14 Year Olds | 28 (43.8%) | 36 (56.2%) |
| 15 to 17 Year Olds | 135 (87.1%) | 20 (12.9%) |
| 18 to 19 Year Olds | 70 (100.0%) | 0 (0.0%) |
| 20 to 24 Year Olds | 0 (0.0%) | 0 (0.0%) |
| 25 to 34 Year Olds | 0 (0.0%) | 0 (0.0%) |
| 35 Years and over | 6 (100.0%) | 0 (0.0%) |
| Total | 370 (85.3%) | 64 (14.7%) |
Educational Attainment by Field of Study in Williston
Business (221 | 47.1%), education (72 | 15.3%), bio, nature & agricultural (71 | 15.1%), science & technology (63 | 13.4%), and engineering (36 | 7.7%) are the most common fields of study among 469 individuals in Williston who have obtained a bachelor's degree or higher.
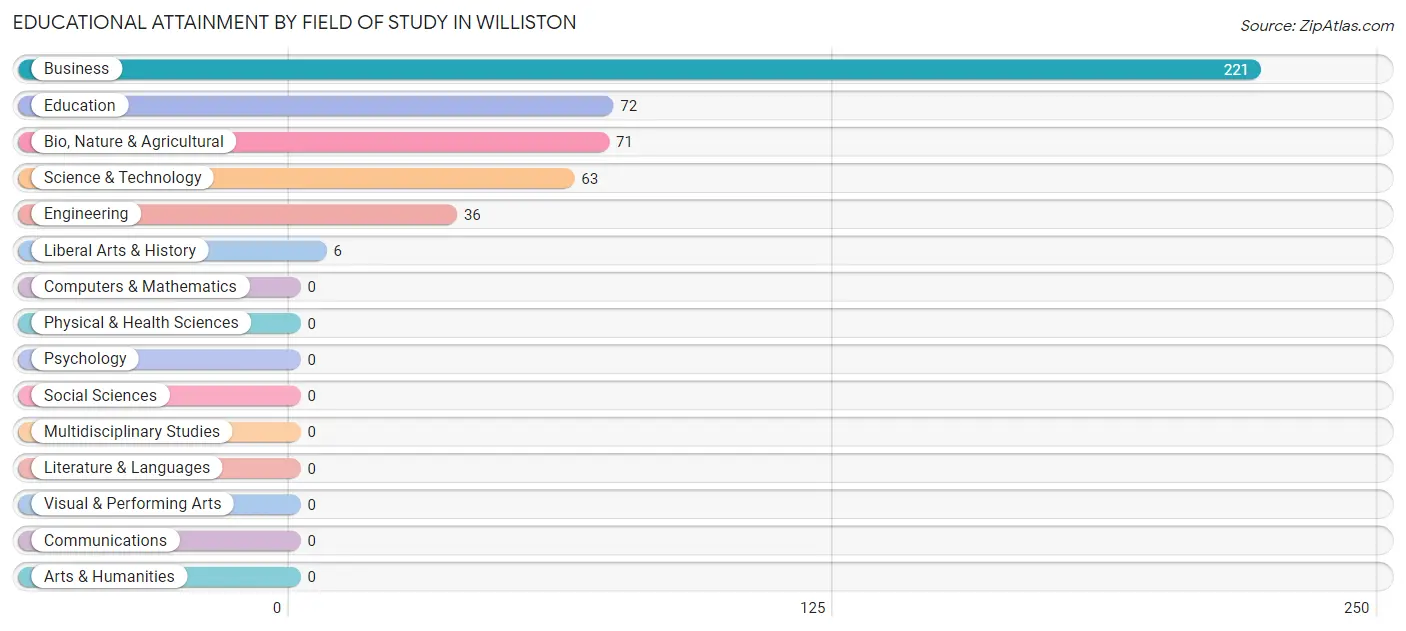
| Field of Study | # Graduates | % Graduates |
| Computers & Mathematics | 0 | 0.0% |
| Bio, Nature & Agricultural | 71 | 15.1% |
| Physical & Health Sciences | 0 | 0.0% |
| Psychology | 0 | 0.0% |
| Social Sciences | 0 | 0.0% |
| Engineering | 36 | 7.7% |
| Multidisciplinary Studies | 0 | 0.0% |
| Science & Technology | 63 | 13.4% |
| Business | 221 | 47.1% |
| Education | 72 | 15.3% |
| Literature & Languages | 0 | 0.0% |
| Liberal Arts & History | 6 | 1.3% |
| Visual & Performing Arts | 0 | 0.0% |
| Communications | 0 | 0.0% |
| Arts & Humanities | 0 | 0.0% |
| Total | 469 | 100.0% |
Transportation & Commute in Williston
Vehicle Availability by Sex in Williston
The most prevalent vehicle ownership categories in Williston are males with 1 vehicle (262, accounting for 33.8%) and females with 1 vehicle (152, making up 38.3%).
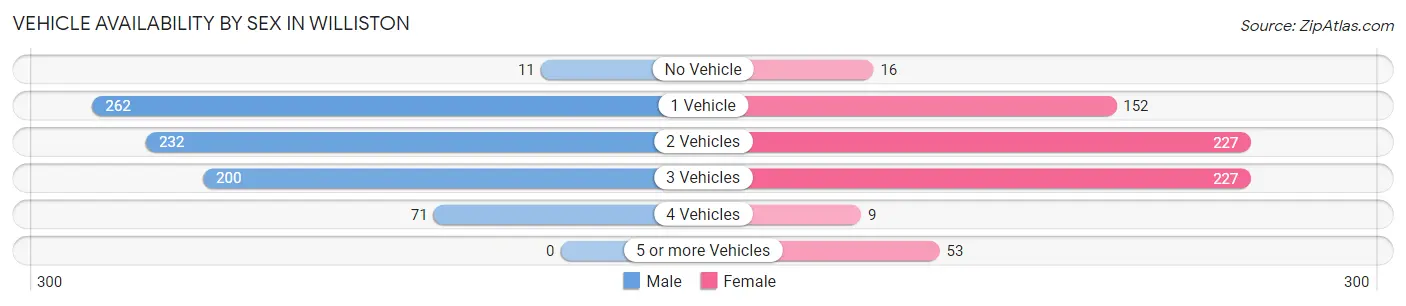
| Vehicles Available | Male | Female |
| No Vehicle | 11 (1.4%) | 16 (2.3%) |
| 1 Vehicle | 262 (33.8%) | 152 (22.2%) |
| 2 Vehicles | 232 (29.9%) | 227 (33.2%) |
| 3 Vehicles | 200 (25.8%) | 227 (33.2%) |
| 4 Vehicles | 71 (9.1%) | 9 (1.3%) |
| 5 or more Vehicles | 0 (0.0%) | 53 (7.7%) |
| Total | 776 (100.0%) | 684 (100.0%) |
Commute Time in Williston
The most frequently occuring commute durations in Williston are 5 to 9 minutes (295 commuters, 20.2%), 30 to 34 minutes (295 commuters, 20.2%), and less than 5 minutes (180 commuters, 12.3%).
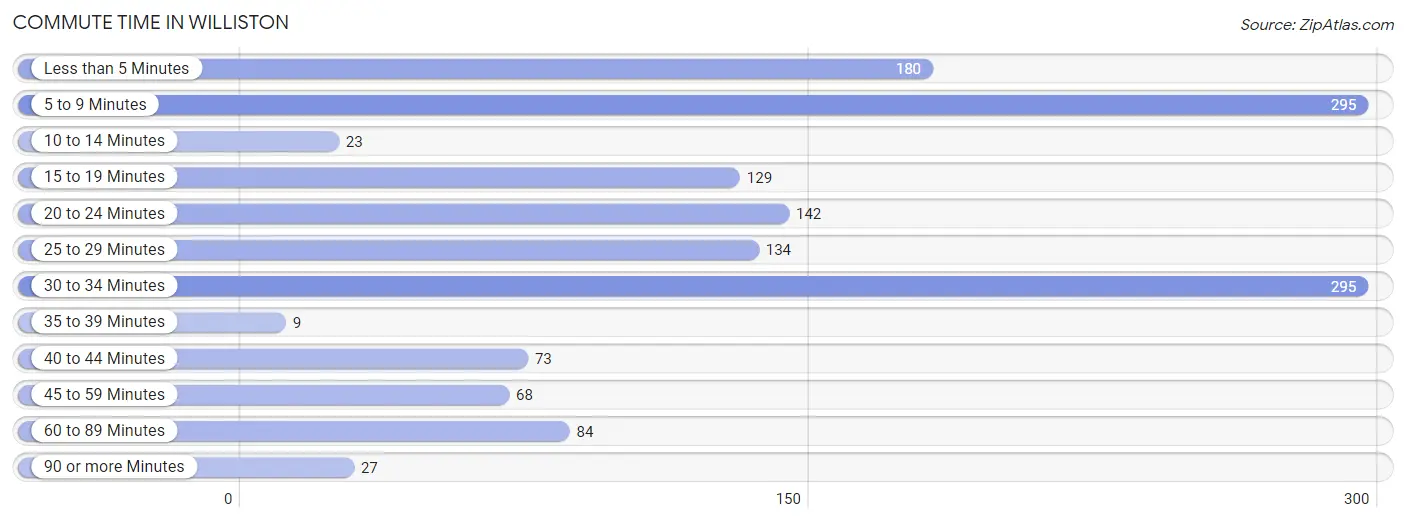
| Commute Time | # Commuters | % Commuters |
| Less than 5 Minutes | 180 | 12.3% |
| 5 to 9 Minutes | 295 | 20.2% |
| 10 to 14 Minutes | 23 | 1.6% |
| 15 to 19 Minutes | 129 | 8.8% |
| 20 to 24 Minutes | 142 | 9.7% |
| 25 to 29 Minutes | 134 | 9.2% |
| 30 to 34 Minutes | 295 | 20.2% |
| 35 to 39 Minutes | 9 | 0.6% |
| 40 to 44 Minutes | 73 | 5.0% |
| 45 to 59 Minutes | 68 | 4.7% |
| 60 to 89 Minutes | 84 | 5.8% |
| 90 or more Minutes | 27 | 1.8% |
Commute Time by Sex in Williston
The most common commute times in Williston are less than 5 minutes (180 commuters, 23.1%) for males and 30 to 34 minutes (174 commuters, 25.7%) for females.
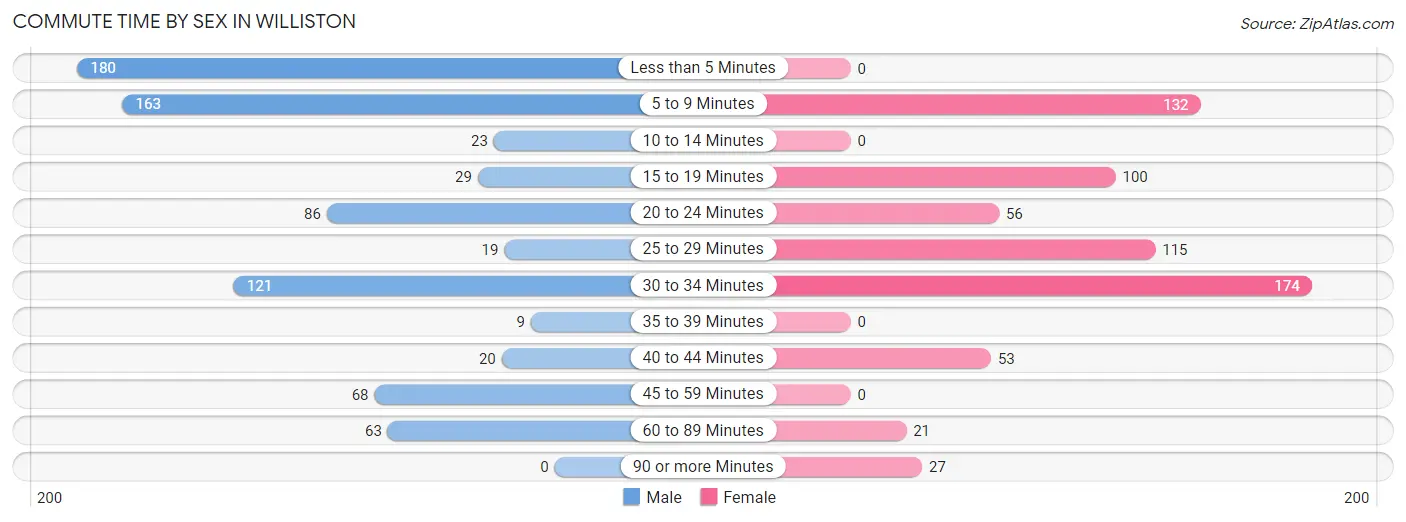
| Commute Time | Male | Female |
| Less than 5 Minutes | 180 (23.1%) | 0 (0.0%) |
| 5 to 9 Minutes | 163 (20.9%) | 132 (19.5%) |
| 10 to 14 Minutes | 23 (2.9%) | 0 (0.0%) |
| 15 to 19 Minutes | 29 (3.7%) | 100 (14.7%) |
| 20 to 24 Minutes | 86 (11.0%) | 56 (8.3%) |
| 25 to 29 Minutes | 19 (2.4%) | 115 (17.0%) |
| 30 to 34 Minutes | 121 (15.5%) | 174 (25.7%) |
| 35 to 39 Minutes | 9 (1.1%) | 0 (0.0%) |
| 40 to 44 Minutes | 20 (2.6%) | 53 (7.8%) |
| 45 to 59 Minutes | 68 (8.7%) | 0 (0.0%) |
| 60 to 89 Minutes | 63 (8.1%) | 21 (3.1%) |
| 90 or more Minutes | 0 (0.0%) | 27 (4.0%) |
Time of Departure to Work by Sex in Williston
The most frequent times of departure to work in Williston are 6:30 AM to 6:59 AM (169, 21.6%) for males and 7:00 AM to 7:29 AM (146, 21.5%) for females.
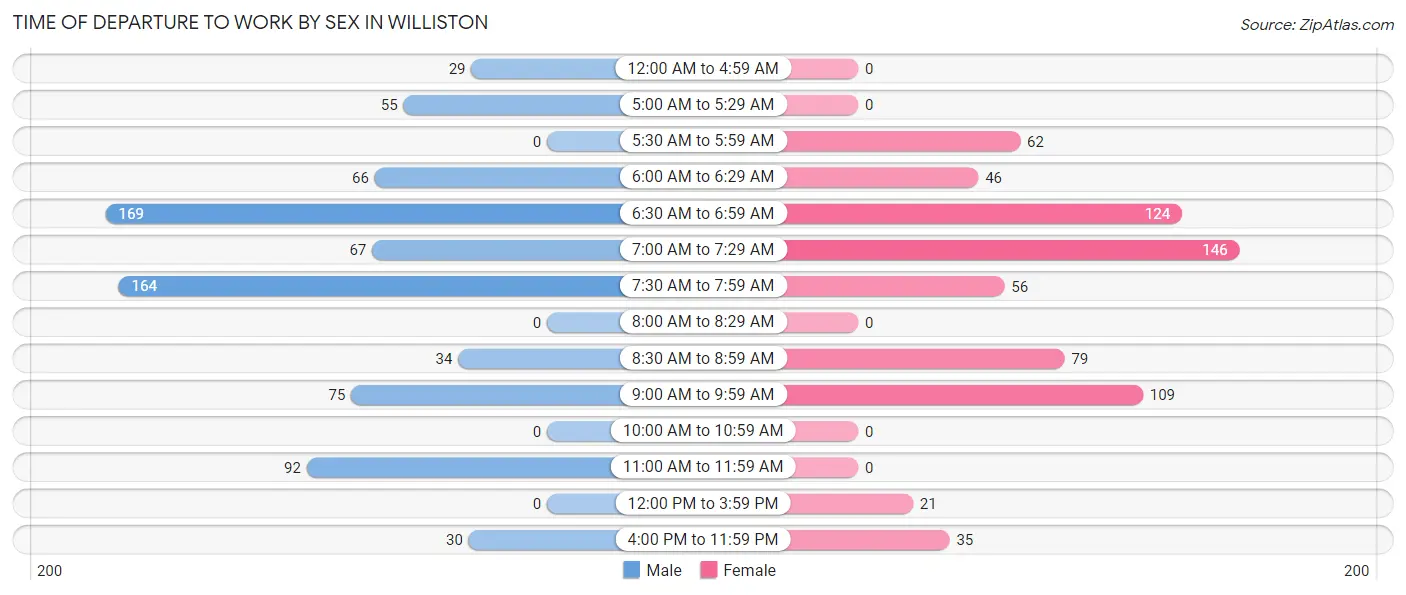
| Time of Departure | Male | Female |
| 12:00 AM to 4:59 AM | 29 (3.7%) | 0 (0.0%) |
| 5:00 AM to 5:29 AM | 55 (7.0%) | 0 (0.0%) |
| 5:30 AM to 5:59 AM | 0 (0.0%) | 62 (9.1%) |
| 6:00 AM to 6:29 AM | 66 (8.5%) | 46 (6.8%) |
| 6:30 AM to 6:59 AM | 169 (21.6%) | 124 (18.3%) |
| 7:00 AM to 7:29 AM | 67 (8.6%) | 146 (21.5%) |
| 7:30 AM to 7:59 AM | 164 (21.0%) | 56 (8.3%) |
| 8:00 AM to 8:29 AM | 0 (0.0%) | 0 (0.0%) |
| 8:30 AM to 8:59 AM | 34 (4.3%) | 79 (11.7%) |
| 9:00 AM to 9:59 AM | 75 (9.6%) | 109 (16.1%) |
| 10:00 AM to 10:59 AM | 0 (0.0%) | 0 (0.0%) |
| 11:00 AM to 11:59 AM | 92 (11.8%) | 0 (0.0%) |
| 12:00 PM to 3:59 PM | 0 (0.0%) | 21 (3.1%) |
| 4:00 PM to 11:59 PM | 30 (3.8%) | 35 (5.2%) |
| Total | 781 (100.0%) | 678 (100.0%) |
Housing Occupancy in Williston
Occupancy by Ownership in Williston
Of the total 1,384 dwellings in Williston, owner-occupied units account for 794 (57.4%), while renter-occupied units make up 590 (42.6%).
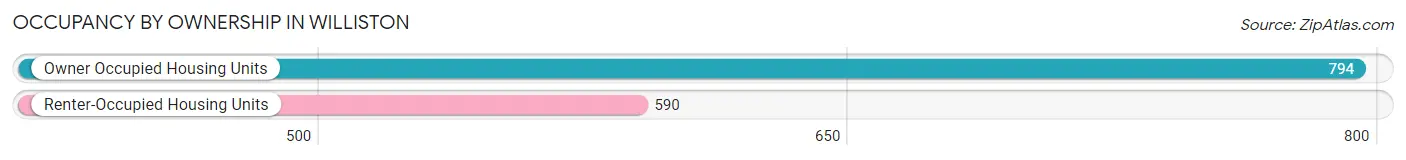
| Occupancy | # Housing Units | % Housing Units |
| Owner Occupied Housing Units | 794 | 57.4% |
| Renter-Occupied Housing Units | 590 | 42.6% |
| Total Occupied Housing Units | 1,384 | 100.0% |
Occupancy by Household Size in Williston
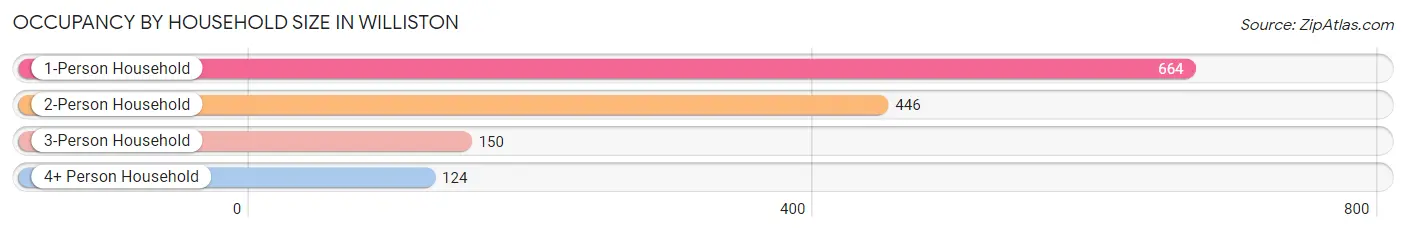
| Household Size | # Housing Units | % Housing Units |
| 1-Person Household | 664 | 48.0% |
| 2-Person Household | 446 | 32.2% |
| 3-Person Household | 150 | 10.8% |
| 4+ Person Household | 124 | 9.0% |
| Total Housing Units | 1,384 | 100.0% |
Occupancy by Ownership by Household Size in Williston
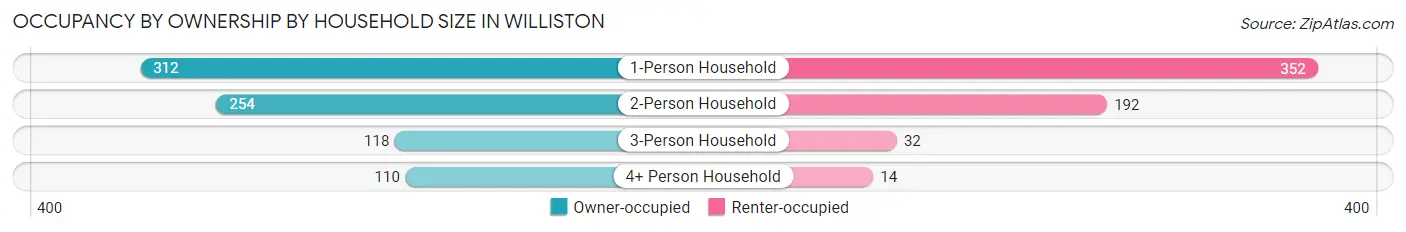
| Household Size | Owner-occupied | Renter-occupied |
| 1-Person Household | 312 (47.0%) | 352 (53.0%) |
| 2-Person Household | 254 (57.0%) | 192 (43.0%) |
| 3-Person Household | 118 (78.7%) | 32 (21.3%) |
| 4+ Person Household | 110 (88.7%) | 14 (11.3%) |
| Total Housing Units | 794 (57.4%) | 590 (42.6%) |
Occupancy by Educational Attainment in Williston
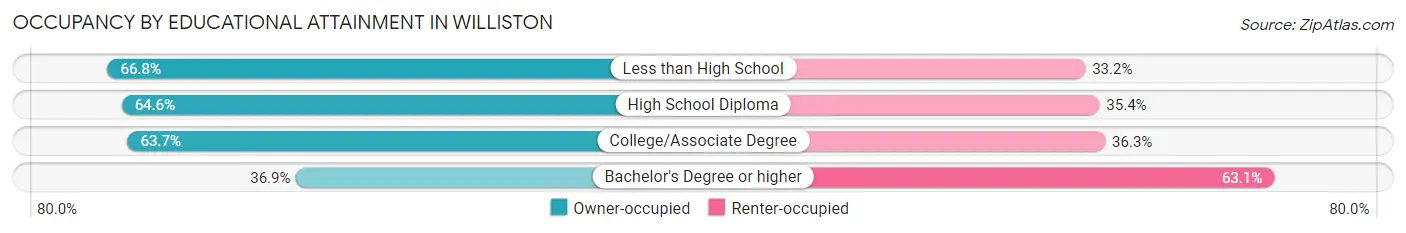
| Household Size | Owner-occupied | Renter-occupied |
| Less than High School | 131 (66.8%) | 65 (33.2%) |
| High School Diploma | 259 (64.6%) | 142 (35.4%) |
| College/Associate Degree | 270 (63.7%) | 154 (36.3%) |
| Bachelor's Degree or higher | 134 (36.9%) | 229 (63.1%) |
Occupancy by Age of Householder in Williston
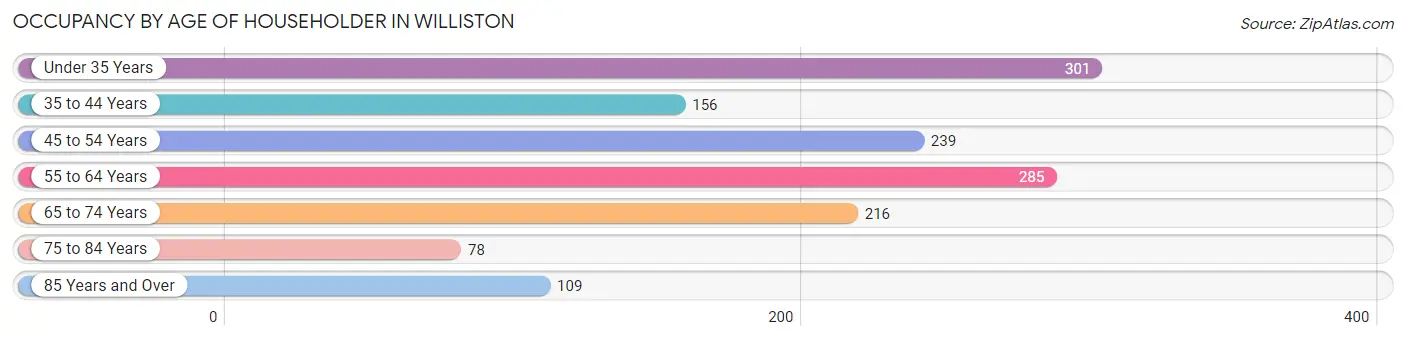
| Age Bracket | # Households | % Households |
| Under 35 Years | 301 | 21.7% |
| 35 to 44 Years | 156 | 11.3% |
| 45 to 54 Years | 239 | 17.3% |
| 55 to 64 Years | 285 | 20.6% |
| 65 to 74 Years | 216 | 15.6% |
| 75 to 84 Years | 78 | 5.6% |
| 85 Years and Over | 109 | 7.9% |
| Total | 1,384 | 100.0% |
Housing Finances in Williston
Median Income by Occupancy in Williston
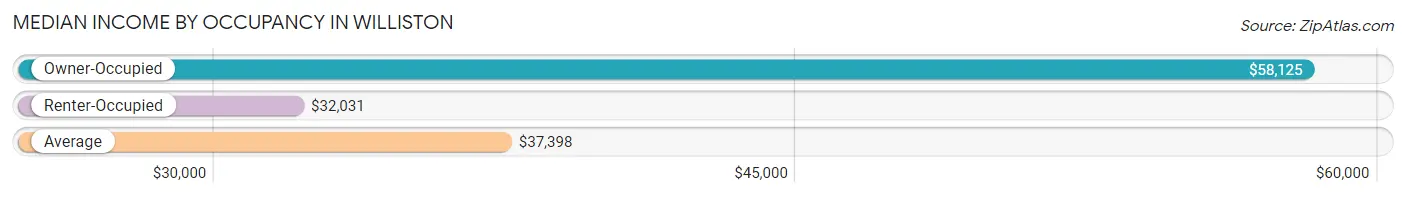
| Occupancy Type | # Households | Median Income |
| Owner-Occupied | 794 (57.4%) | $58,125 |
| Renter-Occupied | 590 (42.6%) | $32,031 |
| Average | 1,384 (100.0%) | $37,398 |
Occupancy by Householder Income Bracket in Williston
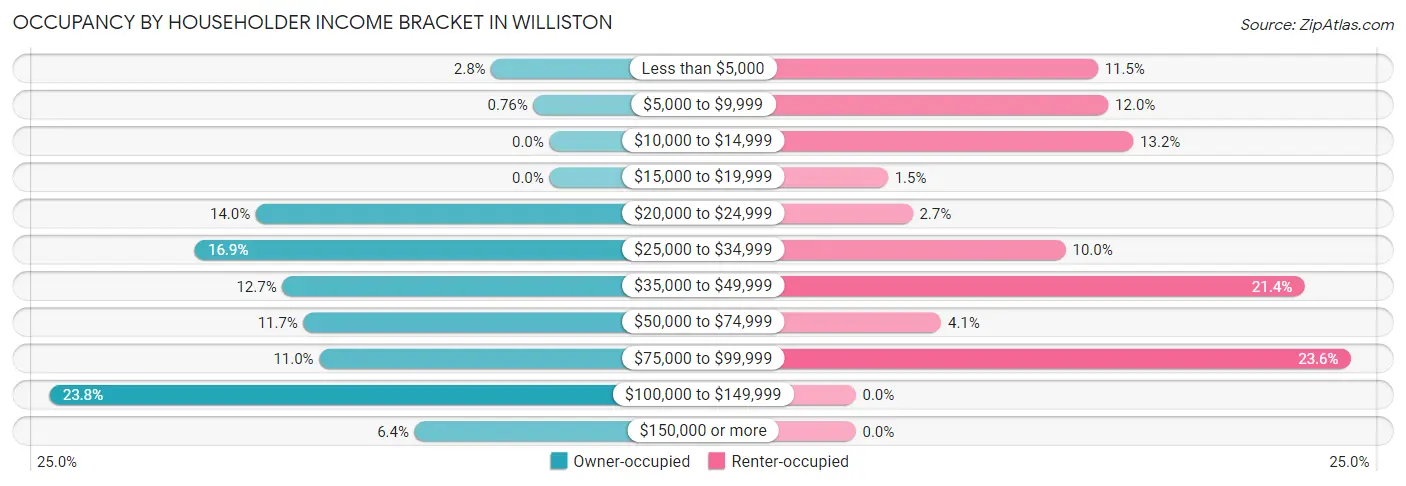
| Income Bracket | Owner-occupied | Renter-occupied |
| Less than $5,000 | 22 (2.8%) | 68 (11.5%) |
| $5,000 to $9,999 | 6 (0.8%) | 71 (12.0%) |
| $10,000 to $14,999 | 0 (0.0%) | 78 (13.2%) |
| $15,000 to $19,999 | 0 (0.0%) | 9 (1.5%) |
| $20,000 to $24,999 | 111 (14.0%) | 16 (2.7%) |
| $25,000 to $34,999 | 134 (16.9%) | 59 (10.0%) |
| $35,000 to $49,999 | 101 (12.7%) | 126 (21.4%) |
| $50,000 to $74,999 | 93 (11.7%) | 24 (4.1%) |
| $75,000 to $99,999 | 87 (11.0%) | 139 (23.6%) |
| $100,000 to $149,999 | 189 (23.8%) | 0 (0.0%) |
| $150,000 or more | 51 (6.4%) | 0 (0.0%) |
| Total | 794 (100.0%) | 590 (100.0%) |
Monthly Housing Cost Tiers in Williston
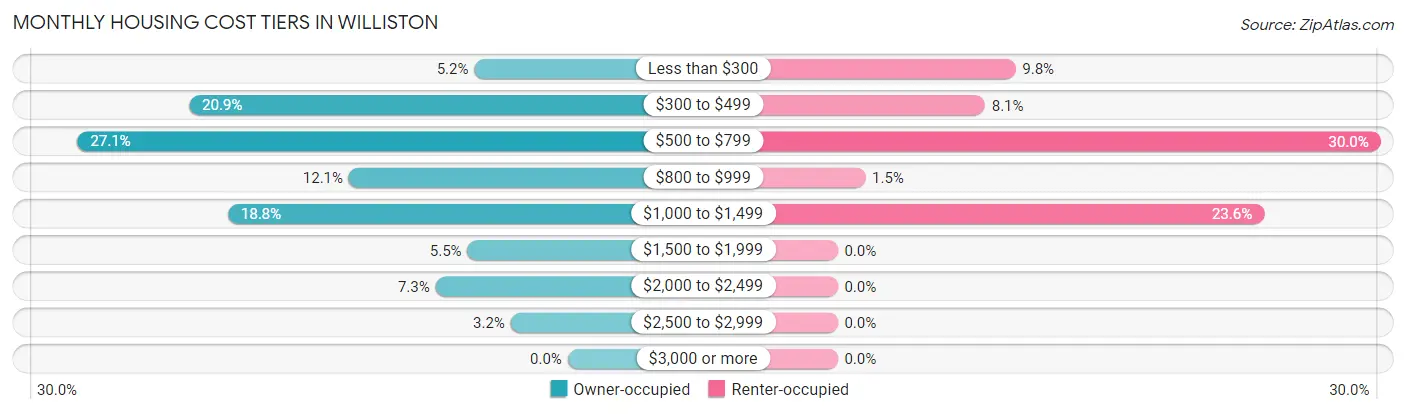
| Monthly Cost | Owner-occupied | Renter-occupied |
| Less than $300 | 41 (5.2%) | 58 (9.8%) |
| $300 to $499 | 166 (20.9%) | 48 (8.1%) |
| $500 to $799 | 215 (27.1%) | 177 (30.0%) |
| $800 to $999 | 96 (12.1%) | 9 (1.5%) |
| $1,000 to $1,499 | 149 (18.8%) | 139 (23.6%) |
| $1,500 to $1,999 | 44 (5.5%) | 0 (0.0%) |
| $2,000 to $2,499 | 58 (7.3%) | 0 (0.0%) |
| $2,500 to $2,999 | 25 (3.2%) | 0 (0.0%) |
| $3,000 or more | 0 (0.0%) | 0 (0.0%) |
| Total | 794 (100.0%) | 590 (100.0%) |
Physical Housing Characteristics in Williston
Housing Structures in Williston
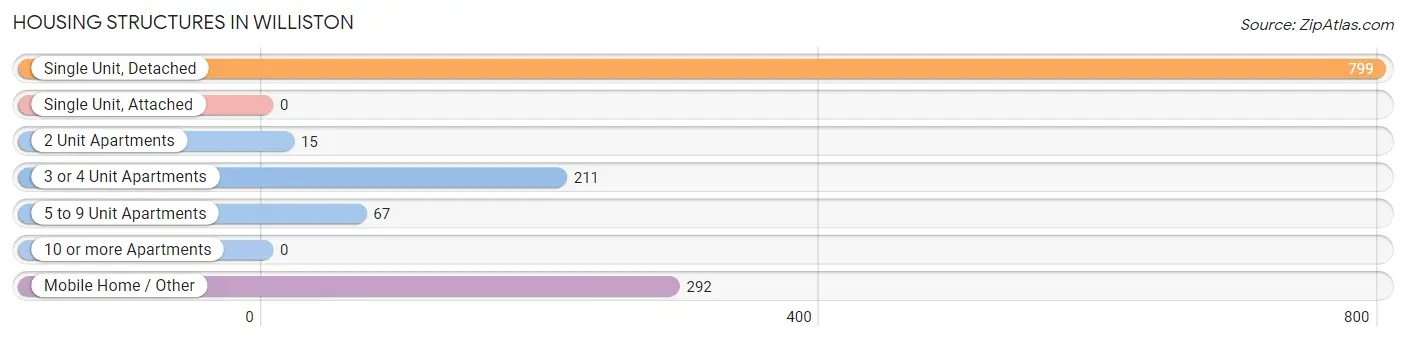
| Structure Type | # Housing Units | % Housing Units |
| Single Unit, Detached | 799 | 57.7% |
| Single Unit, Attached | 0 | 0.0% |
| 2 Unit Apartments | 15 | 1.1% |
| 3 or 4 Unit Apartments | 211 | 15.2% |
| 5 to 9 Unit Apartments | 67 | 4.8% |
| 10 or more Apartments | 0 | 0.0% |
| Mobile Home / Other | 292 | 21.1% |
| Total | 1,384 | 100.0% |
Housing Structures by Occupancy in Williston
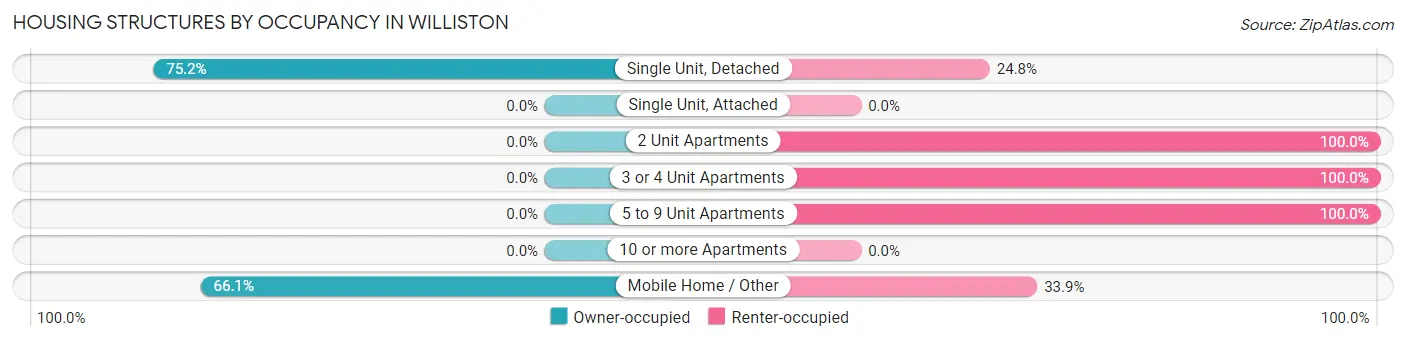
| Structure Type | Owner-occupied | Renter-occupied |
| Single Unit, Detached | 601 (75.2%) | 198 (24.8%) |
| Single Unit, Attached | 0 (0.0%) | 0 (0.0%) |
| 2 Unit Apartments | 0 (0.0%) | 15 (100.0%) |
| 3 or 4 Unit Apartments | 0 (0.0%) | 211 (100.0%) |
| 5 to 9 Unit Apartments | 0 (0.0%) | 67 (100.0%) |
| 10 or more Apartments | 0 (0.0%) | 0 (0.0%) |
| Mobile Home / Other | 193 (66.1%) | 99 (33.9%) |
| Total | 794 (57.4%) | 590 (42.6%) |
Housing Structures by Number of Rooms in Williston
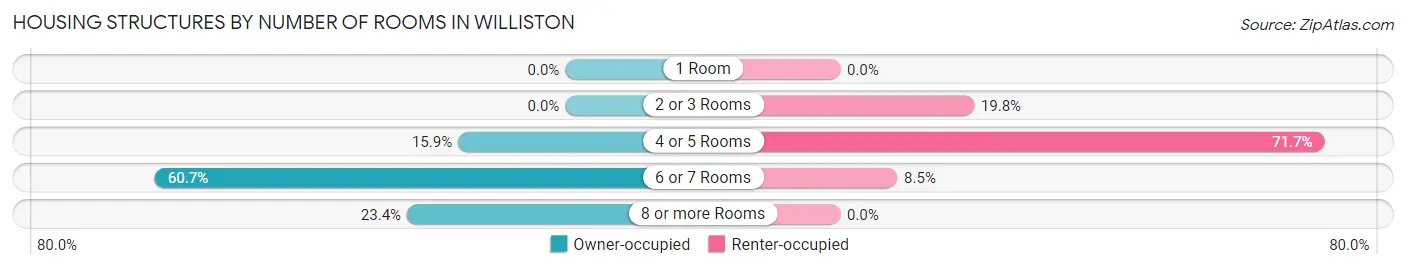
| Number of Rooms | Owner-occupied | Renter-occupied |
| 1 Room | 0 (0.0%) | 0 (0.0%) |
| 2 or 3 Rooms | 0 (0.0%) | 117 (19.8%) |
| 4 or 5 Rooms | 126 (15.9%) | 423 (71.7%) |
| 6 or 7 Rooms | 482 (60.7%) | 50 (8.5%) |
| 8 or more Rooms | 186 (23.4%) | 0 (0.0%) |
| Total | 794 (100.0%) | 590 (100.0%) |
Housing Structure by Heating Type in Williston
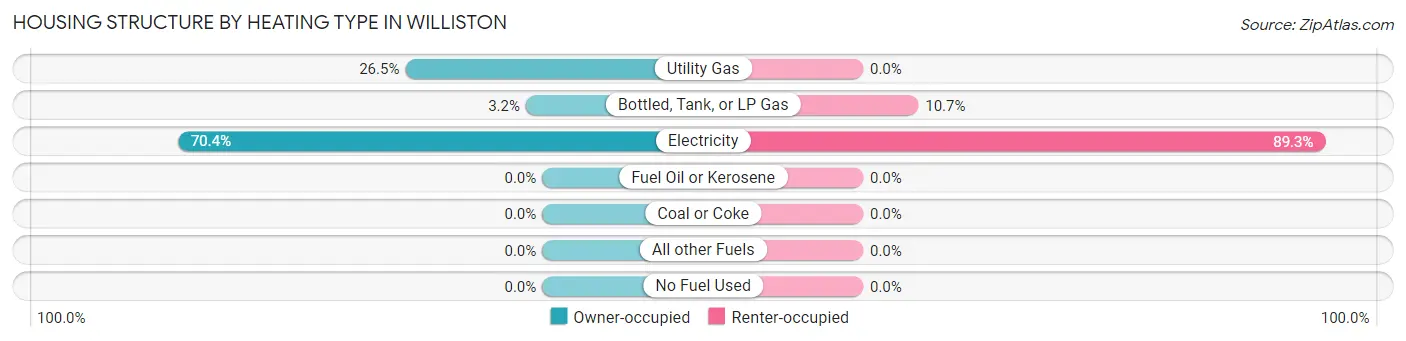
| Heating Type | Owner-occupied | Renter-occupied |
| Utility Gas | 210 (26.5%) | 0 (0.0%) |
| Bottled, Tank, or LP Gas | 25 (3.2%) | 63 (10.7%) |
| Electricity | 559 (70.4%) | 527 (89.3%) |
| Fuel Oil or Kerosene | 0 (0.0%) | 0 (0.0%) |
| Coal or Coke | 0 (0.0%) | 0 (0.0%) |
| All other Fuels | 0 (0.0%) | 0 (0.0%) |
| No Fuel Used | 0 (0.0%) | 0 (0.0%) |
| Total | 794 (100.0%) | 590 (100.0%) |
Household Vehicle Usage in Williston
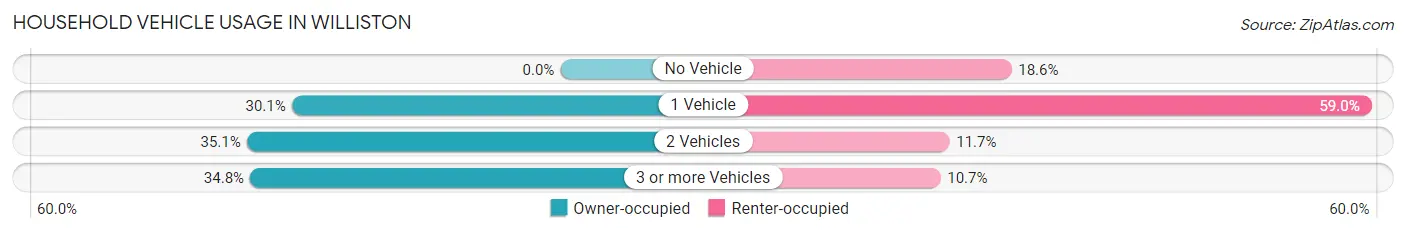
| Vehicles per Household | Owner-occupied | Renter-occupied |
| No Vehicle | 0 (0.0%) | 110 (18.6%) |
| 1 Vehicle | 239 (30.1%) | 348 (59.0%) |
| 2 Vehicles | 279 (35.1%) | 69 (11.7%) |
| 3 or more Vehicles | 276 (34.8%) | 63 (10.7%) |
| Total | 794 (100.0%) | 590 (100.0%) |
Real Estate & Mortgages in Williston
Real Estate and Mortgage Overview in Williston
| Characteristic | Without Mortgage | With Mortgage |
| Housing Units | 349 | 445 |
| Median Property Value | $100,500 | $138,700 |
| Median Household Income | $57,083 | $51 |
| Monthly Housing Costs | $480 | $0 |
| Real Estate Taxes | - | - |
Property Value by Mortgage Status in Williston
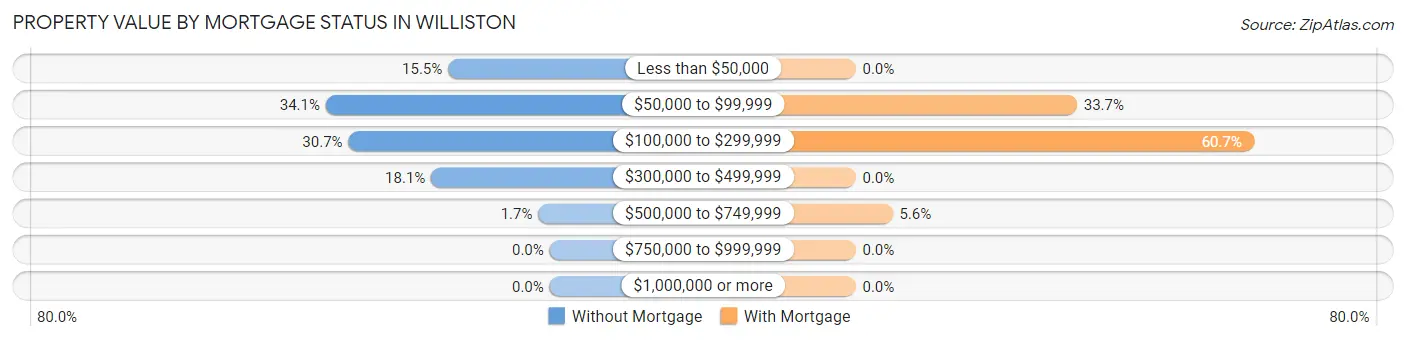
| Property Value | Without Mortgage | With Mortgage |
| Less than $50,000 | 54 (15.5%) | 0 (0.0%) |
| $50,000 to $99,999 | 119 (34.1%) | 150 (33.7%) |
| $100,000 to $299,999 | 107 (30.7%) | 270 (60.7%) |
| $300,000 to $499,999 | 63 (18.0%) | 0 (0.0%) |
| $500,000 to $749,999 | 6 (1.7%) | 25 (5.6%) |
| $750,000 to $999,999 | 0 (0.0%) | 0 (0.0%) |
| $1,000,000 or more | 0 (0.0%) | 0 (0.0%) |
| Total | 349 (100.0%) | 445 (100.0%) |
Household Income by Mortgage Status in Williston
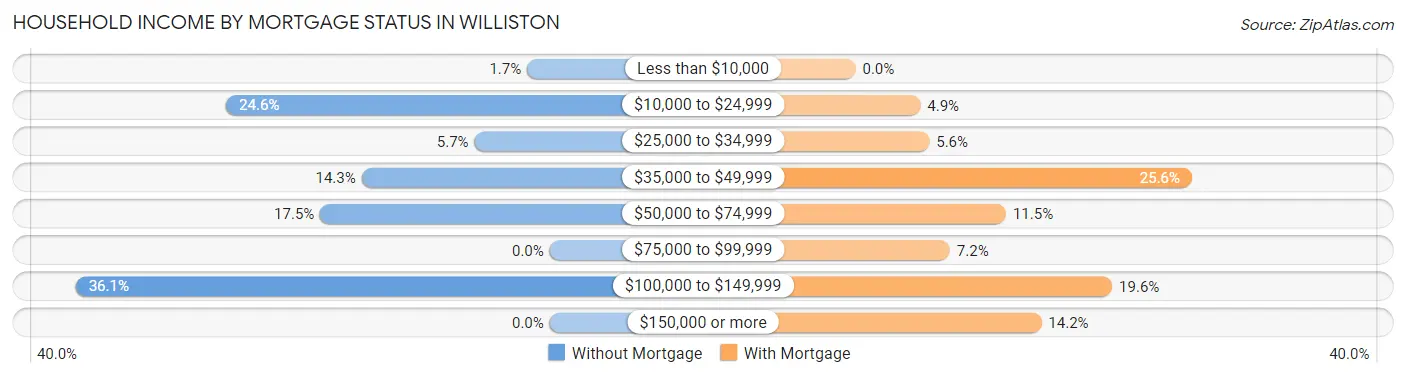
| Household Income | Without Mortgage | With Mortgage |
| Less than $10,000 | 6 (1.7%) | 0 (0.0%) |
| $10,000 to $24,999 | 86 (24.6%) | 22 (4.9%) |
| $25,000 to $34,999 | 20 (5.7%) | 25 (5.6%) |
| $35,000 to $49,999 | 50 (14.3%) | 114 (25.6%) |
| $50,000 to $74,999 | 61 (17.5%) | 51 (11.5%) |
| $75,000 to $99,999 | 0 (0.0%) | 32 (7.2%) |
| $100,000 to $149,999 | 126 (36.1%) | 87 (19.6%) |
| $150,000 or more | 0 (0.0%) | 63 (14.2%) |
| Total | 349 (100.0%) | 445 (100.0%) |
Property Value to Household Income Ratio in Williston
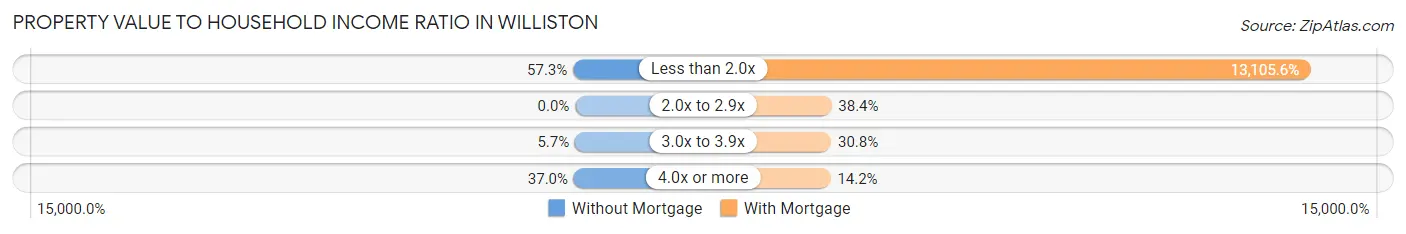
| Value-to-Income Ratio | Without Mortgage | With Mortgage |
| Less than 2.0x | 200 (57.3%) | 58,320 (13,105.6%) |
| 2.0x to 2.9x | 0 (0.0%) | 171 (38.4%) |
| 3.0x to 3.9x | 20 (5.7%) | 137 (30.8%) |
| 4.0x or more | 129 (37.0%) | 63 (14.2%) |
| Total | 349 (100.0%) | 445 (100.0%) |
Real Estate Taxes by Mortgage Status in Williston
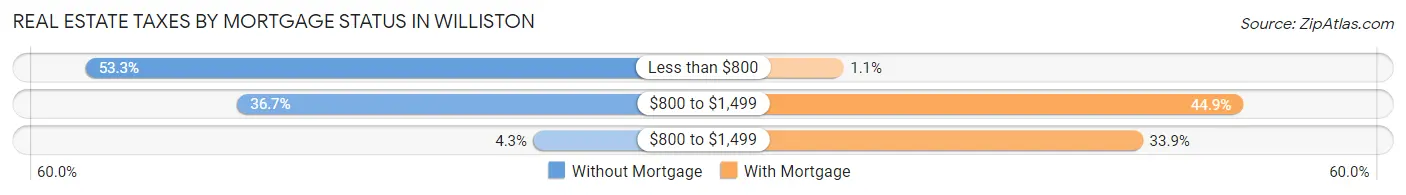
| Property Taxes | Without Mortgage | With Mortgage |
| Less than $800 | 186 (53.3%) | 5 (1.1%) |
| $800 to $1,499 | 128 (36.7%) | 200 (44.9%) |
| $800 to $1,499 | 15 (4.3%) | 151 (33.9%) |
| Total | 349 (100.0%) | 445 (100.0%) |
Health & Disability in Williston
Health Insurance Coverage by Age in Williston
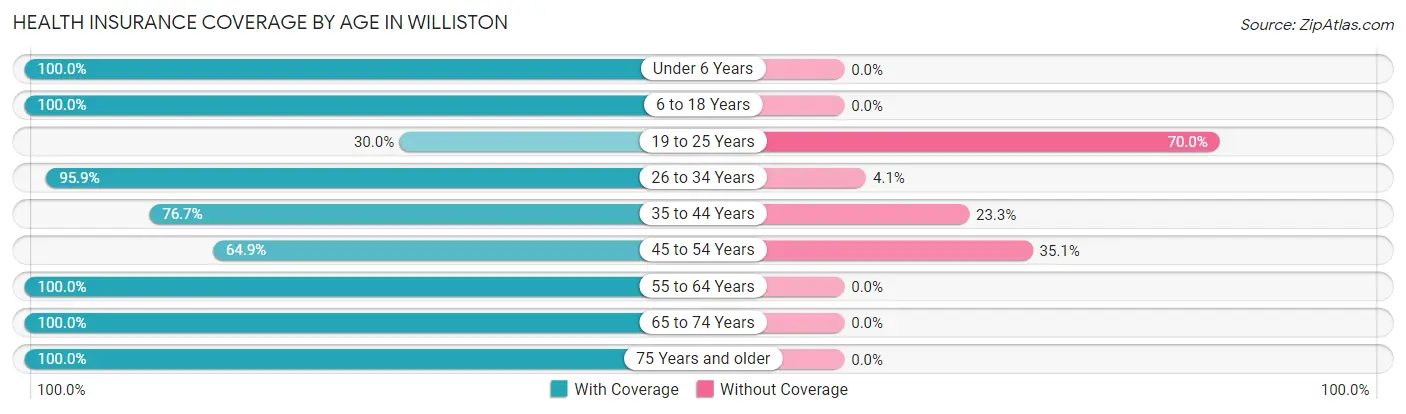
| Age Bracket | With Coverage | Without Coverage |
| Under 6 Years | 197 (100.0%) | 0 (0.0%) |
| 6 to 18 Years | 434 (100.0%) | 0 (0.0%) |
| 19 to 25 Years | 57 (30.0%) | 133 (70.0%) |
| 26 to 34 Years | 331 (95.9%) | 14 (4.1%) |
| 35 to 44 Years | 165 (76.7%) | 50 (23.3%) |
| 45 to 54 Years | 279 (64.9%) | 151 (35.1%) |
| 55 to 64 Years | 409 (100.0%) | 0 (0.0%) |
| 65 to 74 Years | 343 (100.0%) | 0 (0.0%) |
| 75 Years and older | 248 (100.0%) | 0 (0.0%) |
| Total | 2,463 (87.6%) | 348 (12.4%) |
Health Insurance Coverage by Citizenship Status in Williston
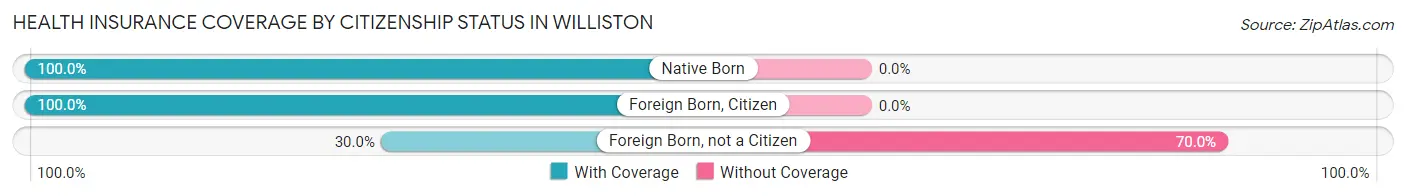
| Citizenship Status | With Coverage | Without Coverage |
| Native Born | 197 (100.0%) | 0 (0.0%) |
| Foreign Born, Citizen | 434 (100.0%) | 0 (0.0%) |
| Foreign Born, not a Citizen | 57 (30.0%) | 133 (70.0%) |
Health Insurance Coverage by Household Income in Williston
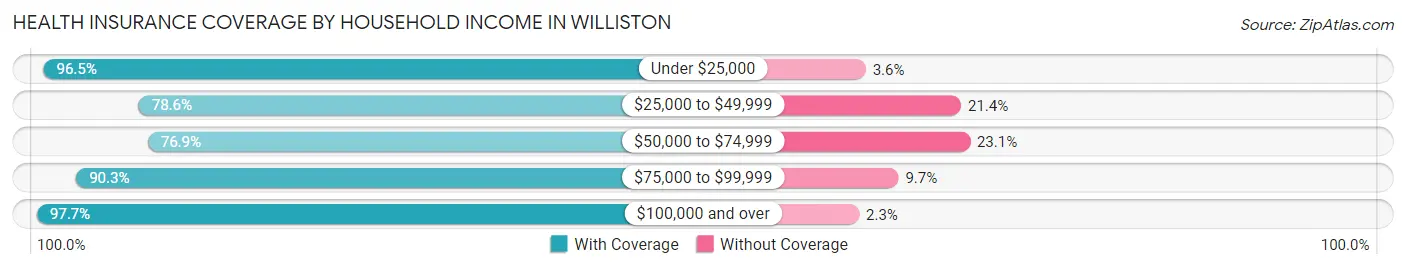
| Household Income | With Coverage | Without Coverage |
| Under $25,000 | 597 (96.5%) | 22 (3.5%) |
| $25,000 to $49,999 | 676 (78.6%) | 184 (21.4%) |
| $50,000 to $74,999 | 330 (76.9%) | 99 (23.1%) |
| $75,000 to $99,999 | 280 (90.3%) | 30 (9.7%) |
| $100,000 and over | 552 (97.7%) | 13 (2.3%) |
Public vs Private Health Insurance Coverage by Age in Williston
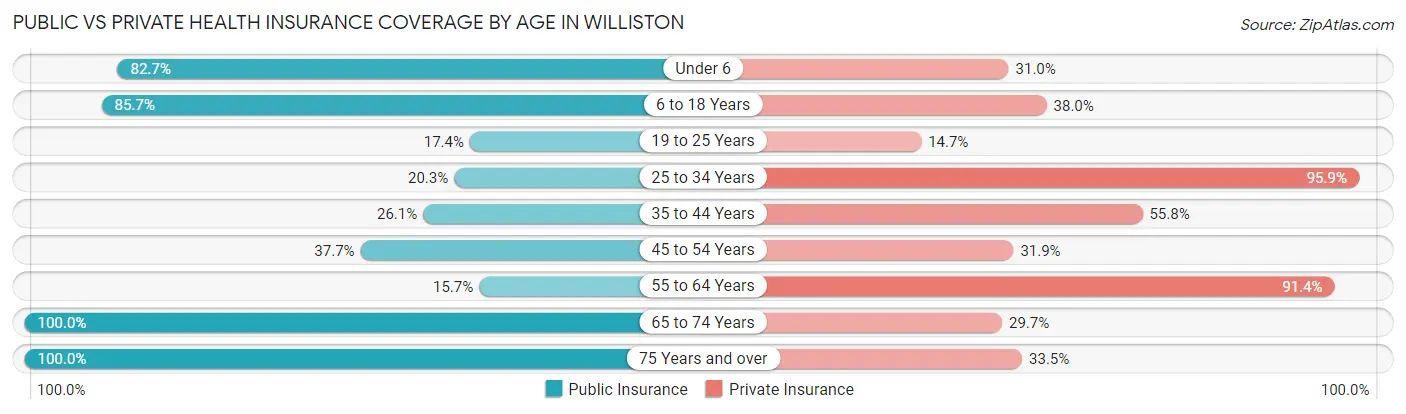
| Age Bracket | Public Insurance | Private Insurance |
| Under 6 | 163 (82.7%) | 61 (31.0%) |
| 6 to 18 Years | 372 (85.7%) | 165 (38.0%) |
| 19 to 25 Years | 33 (17.4%) | 28 (14.7%) |
| 25 to 34 Years | 70 (20.3%) | 331 (95.9%) |
| 35 to 44 Years | 56 (26.1%) | 120 (55.8%) |
| 45 to 54 Years | 162 (37.7%) | 137 (31.9%) |
| 55 to 64 Years | 64 (15.7%) | 374 (91.4%) |
| 65 to 74 Years | 343 (100.0%) | 102 (29.7%) |
| 75 Years and over | 248 (100.0%) | 83 (33.5%) |
| Total | 1,511 (53.7%) | 1,401 (49.8%) |
Disability Status by Sex by Age in Williston
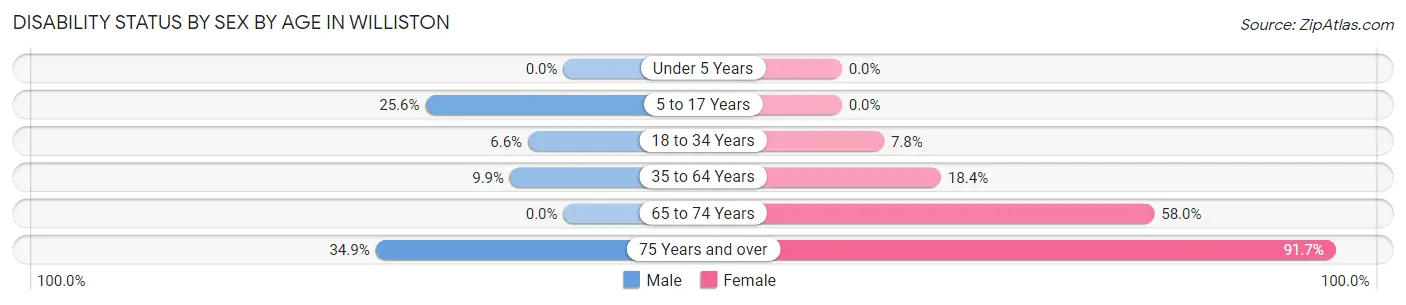
| Age Bracket | Male | Female |
| Under 5 Years | 0 (0.0%) | 0 (0.0%) |
| 5 to 17 Years | 61 (25.6%) | 0 (0.0%) |
| 18 to 34 Years | 23 (6.6%) | 19 (7.8%) |
| 35 to 64 Years | 41 (9.9%) | 118 (18.4%) |
| 65 to 74 Years | 0 (0.0%) | 116 (58.0%) |
| 75 Years and over | 53 (34.9%) | 88 (91.7%) |
Disability Class by Sex by Age in Williston
Disability Class: Hearing Difficulty
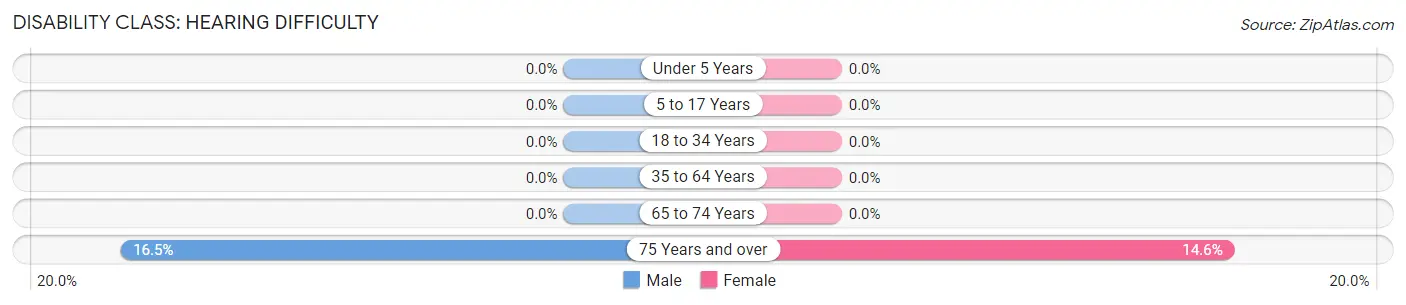
| Age Bracket | Male | Female |
| Under 5 Years | 0 (0.0%) | 0 (0.0%) |
| 5 to 17 Years | 0 (0.0%) | 0 (0.0%) |
| 18 to 34 Years | 0 (0.0%) | 0 (0.0%) |
| 35 to 64 Years | 0 (0.0%) | 0 (0.0%) |
| 65 to 74 Years | 0 (0.0%) | 0 (0.0%) |
| 75 Years and over | 25 (16.5%) | 14 (14.6%) |
Disability Class: Vision Difficulty
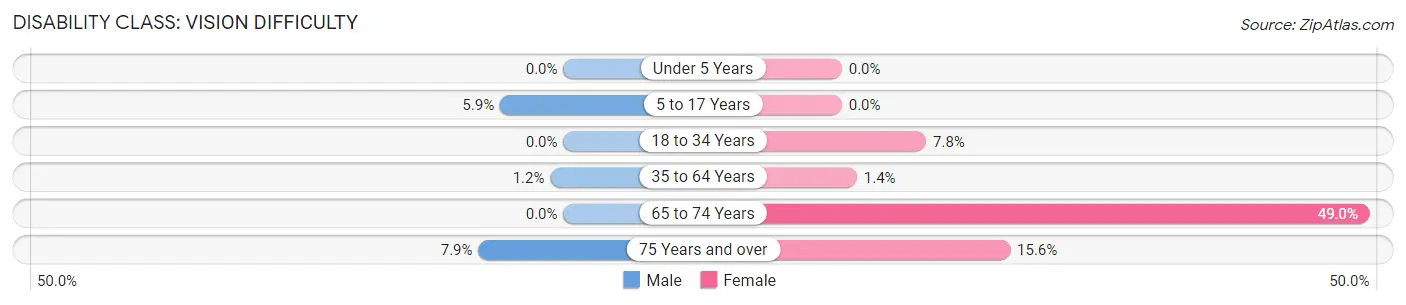
| Age Bracket | Male | Female |
| Under 5 Years | 0 (0.0%) | 0 (0.0%) |
| 5 to 17 Years | 14 (5.9%) | 0 (0.0%) |
| 18 to 34 Years | 0 (0.0%) | 19 (7.8%) |
| 35 to 64 Years | 5 (1.2%) | 9 (1.4%) |
| 65 to 74 Years | 0 (0.0%) | 98 (49.0%) |
| 75 Years and over | 12 (7.9%) | 15 (15.6%) |
Disability Class: Cognitive Difficulty
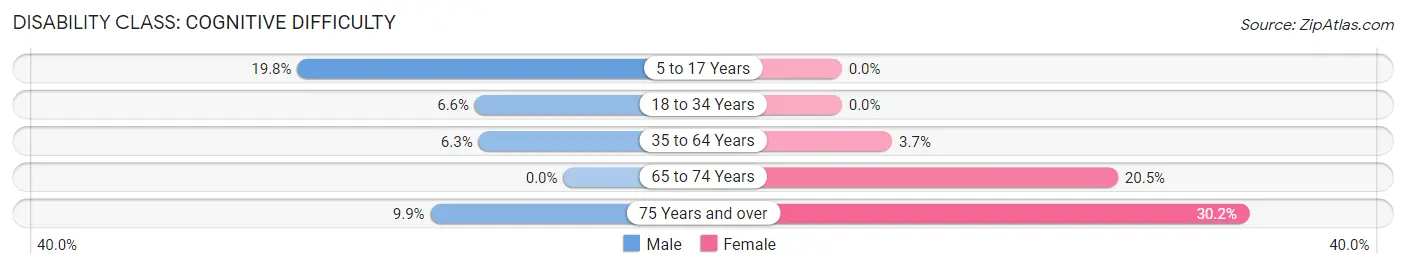
| Age Bracket | Male | Female |
| 5 to 17 Years | 47 (19.8%) | 0 (0.0%) |
| 18 to 34 Years | 23 (6.6%) | 0 (0.0%) |
| 35 to 64 Years | 26 (6.3%) | 24 (3.7%) |
| 65 to 74 Years | 0 (0.0%) | 41 (20.5%) |
| 75 Years and over | 15 (9.9%) | 29 (30.2%) |
Disability Class: Ambulatory Difficulty
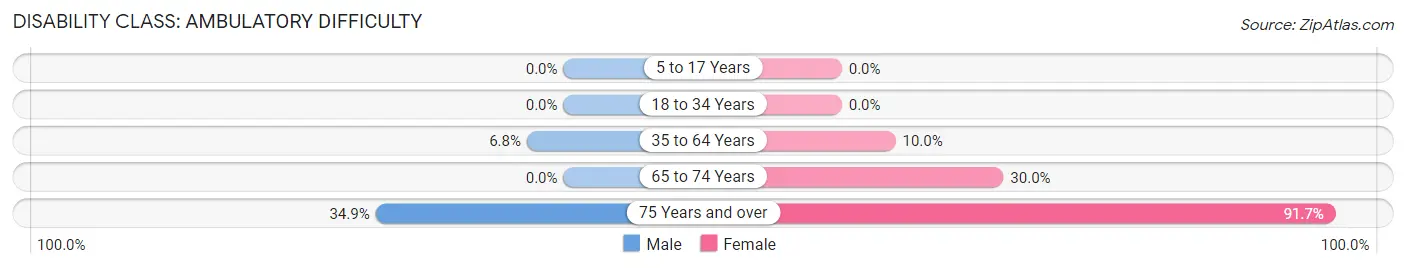
| Age Bracket | Male | Female |
| 5 to 17 Years | 0 (0.0%) | 0 (0.0%) |
| 18 to 34 Years | 0 (0.0%) | 0 (0.0%) |
| 35 to 64 Years | 28 (6.8%) | 64 (10.0%) |
| 65 to 74 Years | 0 (0.0%) | 60 (30.0%) |
| 75 Years and over | 53 (34.9%) | 88 (91.7%) |
Disability Class: Self-Care Difficulty
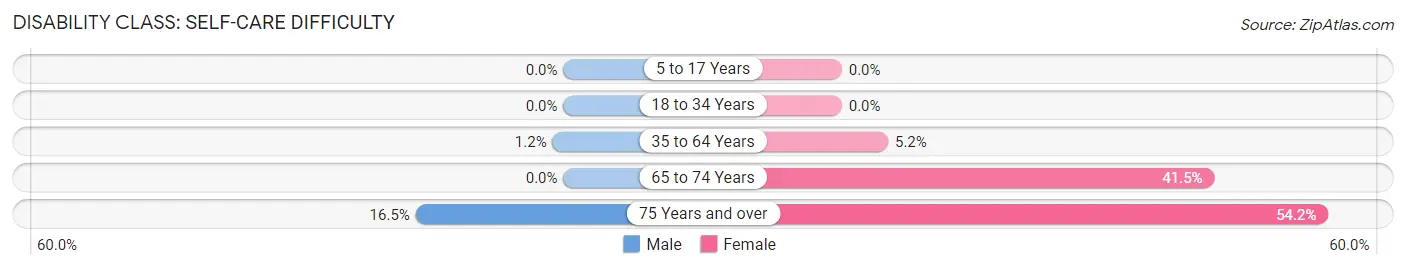
| Age Bracket | Male | Female |
| 5 to 17 Years | 0 (0.0%) | 0 (0.0%) |
| 18 to 34 Years | 0 (0.0%) | 0 (0.0%) |
| 35 to 64 Years | 5 (1.2%) | 33 (5.1%) |
| 65 to 74 Years | 0 (0.0%) | 83 (41.5%) |
| 75 Years and over | 25 (16.5%) | 52 (54.2%) |
Technology Access in Williston
Computing Device Access in Williston
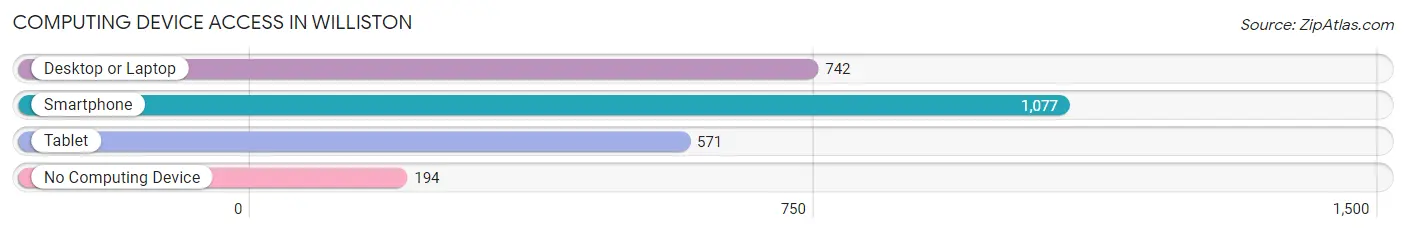
| Device Type | # Households | % Households |
| Desktop or Laptop | 742 | 53.6% |
| Smartphone | 1,077 | 77.8% |
| Tablet | 571 | 41.3% |
| No Computing Device | 194 | 14.0% |
| Total | 1,384 | 100.0% |
Internet Access in Williston
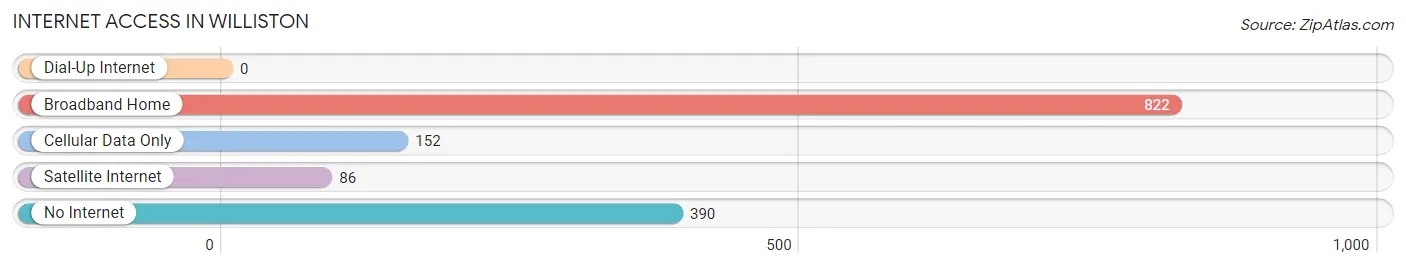
| Internet Type | # Households | % Households |
| Dial-Up Internet | 0 | 0.0% |
| Broadband Home | 822 | 59.4% |
| Cellular Data Only | 152 | 11.0% |
| Satellite Internet | 86 | 6.2% |
| No Internet | 390 | 28.2% |
| Total | 1,384 | 100.0% |
Williston Summary
Williston is a small town located in Barnwell County, South Carolina. It is situated in the heart of the South Carolina Lowcountry, approximately 30 miles northwest of the state capital of Columbia. The town is home to a population of approximately 2,500 people, and is the county seat of Barnwell County.
History
Williston was founded in 1852 by a group of settlers from the nearby town of Barnwell. The town was named after the prominent local family of William Williston, who had been among the first settlers in the area. The town was incorporated in 1872, and the first post office was established in 1873.
Williston was a thriving agricultural community in the late 19th and early 20th centuries, with cotton, corn, and tobacco being the primary crops. The town was also home to several sawmills and gristmills, which provided lumber and grain for the local population.
In the early 20th century, Williston began to experience a period of economic decline. The Great Depression of the 1930s hit the town particularly hard, and many of the local businesses closed. The town’s population decreased significantly during this time, and the local economy did not begin to recover until the 1950s.
Geography
Williston is located in the South Carolina Lowcountry, approximately 30 miles northwest of the state capital of Columbia. The town is situated on the banks of the Salkehatchie River, and is surrounded by a number of small lakes and ponds. The town is located in a predominantly rural area, with the nearest major city being Augusta, Georgia, which is approximately 50 miles away.
The climate in Williston is humid subtropical, with hot, humid summers and mild winters. The average annual temperature is around 70 degrees Fahrenheit, and the average annual precipitation is around 50 inches.
Economy
The economy of Williston is largely based on agriculture, with cotton, corn, and tobacco being the primary crops. The town is also home to several small businesses, including a few restaurants, a grocery store, and a few retail stores.
The town is also home to a number of manufacturing companies, including a furniture factory, a textile mill, and a plastics factory. The town is also home to a number of small service-based businesses, including a few auto repair shops, a few beauty salons, and a few law offices.
Demographics
As of the 2010 census, the population of Williston was 2,500. The racial makeup of the town was 79.2% White, 17.2% African American, 0.8% Native American, 0.4% Asian, and 2.4% from other races. The median household income was $30,000, and the median family income was $35,000.
The town is home to a number of churches, including Baptist, Methodist, and Presbyterian. The town is also home to a number of schools, including a public elementary school, a public middle school, and a public high school. The town is served by the Barnwell County School District.
Common Questions
What is Per Capita Income in Williston?
Per Capita income in Williston is $28,930.
What is the Median Family Income in Williston?
Median Family Income in Williston is $53,672.
What is the Median Household income in Williston?
Median Household Income in Williston is $37,398.
What is Income or Wage Gap in Williston?
Income or Wage Gap in Williston is 35.8%.
Women in Williston earn 64.2 cents for every dollar earned by a man.
What is Inequality or Gini Index in Williston?
Inequality or Gini Index in Williston is 0.43.
What is the Total Population of Williston?
Total Population of Williston is 2,877.
What is the Total Male Population of Williston?
Total Male Population of Williston is 1,437.
What is the Total Female Population of Williston?
Total Female Population of Williston is 1,440.
What is the Ratio of Males per 100 Females in Williston?
There are 99.79 Males per 100 Females in Williston.
What is the Ratio of Females per 100 Males in Williston?
There are 100.21 Females per 100 Males in Williston.
What is the Median Population Age in Williston?
Median Population Age in Williston is 47.7 Years.
What is the Average Family Size in Williston
Average Family Size in Williston is 2.9 People.
What is the Average Household Size in Williston
Average Household Size in Williston is 2.0 People.
How Large is the Labor Force in Williston?
There are 1,558 People in the Labor Forcein in Williston.
What is the Percentage of People in the Labor Force in Williston?
63.3% of People are in the Labor Force in Williston.
What is the Unemployment Rate in Williston?
Unemployment Rate in Williston is 3.7%.