Orangeburg, SC Map & Demographics
Orangeburg Map
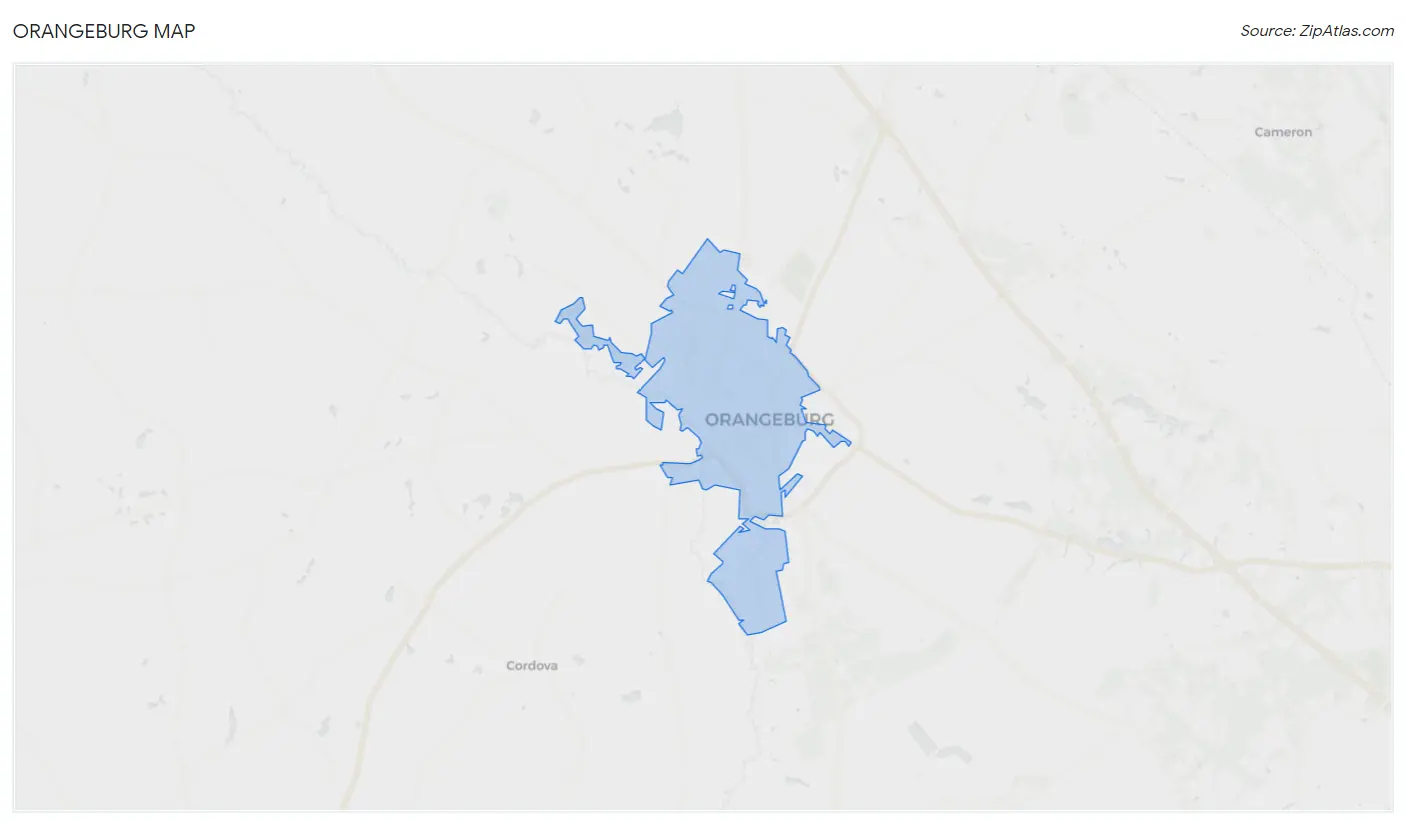
Orangeburg Overview
$19,944
PER CAPITA INCOME
$47,094
AVG FAMILY INCOME
$29,340
AVG HOUSEHOLD INCOME
25.7%
WAGE / INCOME GAP [ % ]
74.3¢/ $1
WAGE / INCOME GAP [ $ ]
0.54
INEQUALITY / GINI INDEX
13,220
TOTAL POPULATION
6,382
MALE POPULATION
6,838
FEMALE POPULATION
93.33
MALES / 100 FEMALES
107.15
FEMALES / 100 MALES
36.4
MEDIAN AGE
3.0
AVG FAMILY SIZE
2.1
AVG HOUSEHOLD SIZE
5,712
LABOR FORCE [ PEOPLE ]
50.0%
PERCENT IN LABOR FORCE
12.5%
UNEMPLOYMENT RATE
Orangeburg Area Codes
Income in Orangeburg
Income Overview in Orangeburg
Per Capita Income in Orangeburg is $19,944, while median incomes of families and households are $47,094 and $29,340 respectively.
| Characteristic | Number | Measure |
| Per Capita Income | 13,220 | $19,944 |
| Median Family Income | 2,412 | $47,094 |
| Mean Family Income | 2,412 | $65,708 |
| Median Household Income | 4,978 | $29,340 |
| Mean Household Income | 4,978 | $45,851 |
| Income Deficit | 2,412 | $0 |
| Wage / Income Gap (%) | 13,220 | 25.72% |
| Wage / Income Gap ($) | 13,220 | 74.28¢ per $1 |
| Gini / Inequality Index | 13,220 | 0.54 |
Earnings by Sex in Orangeburg
Average Earnings in Orangeburg are $17,098, $13,828 for men and $18,617 for women, a difference of 25.7%.
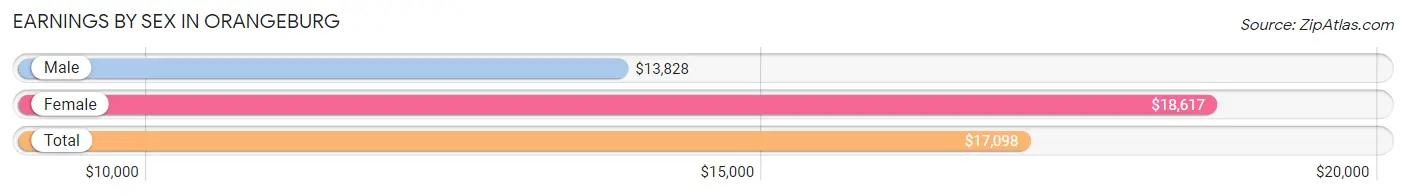
| Sex | Number | Average Earnings |
| Male | 3,476 (52.1%) | $13,828 |
| Female | 3,200 (47.9%) | $18,617 |
| Total | 6,676 (100.0%) | $17,098 |
Earnings by Sex by Income Bracket in Orangeburg
The most common earnings brackets in Orangeburg are $5,000 to $7,499 for men (425 | 12.2%) and $2,500 to $4,999 for women (346 | 10.8%).
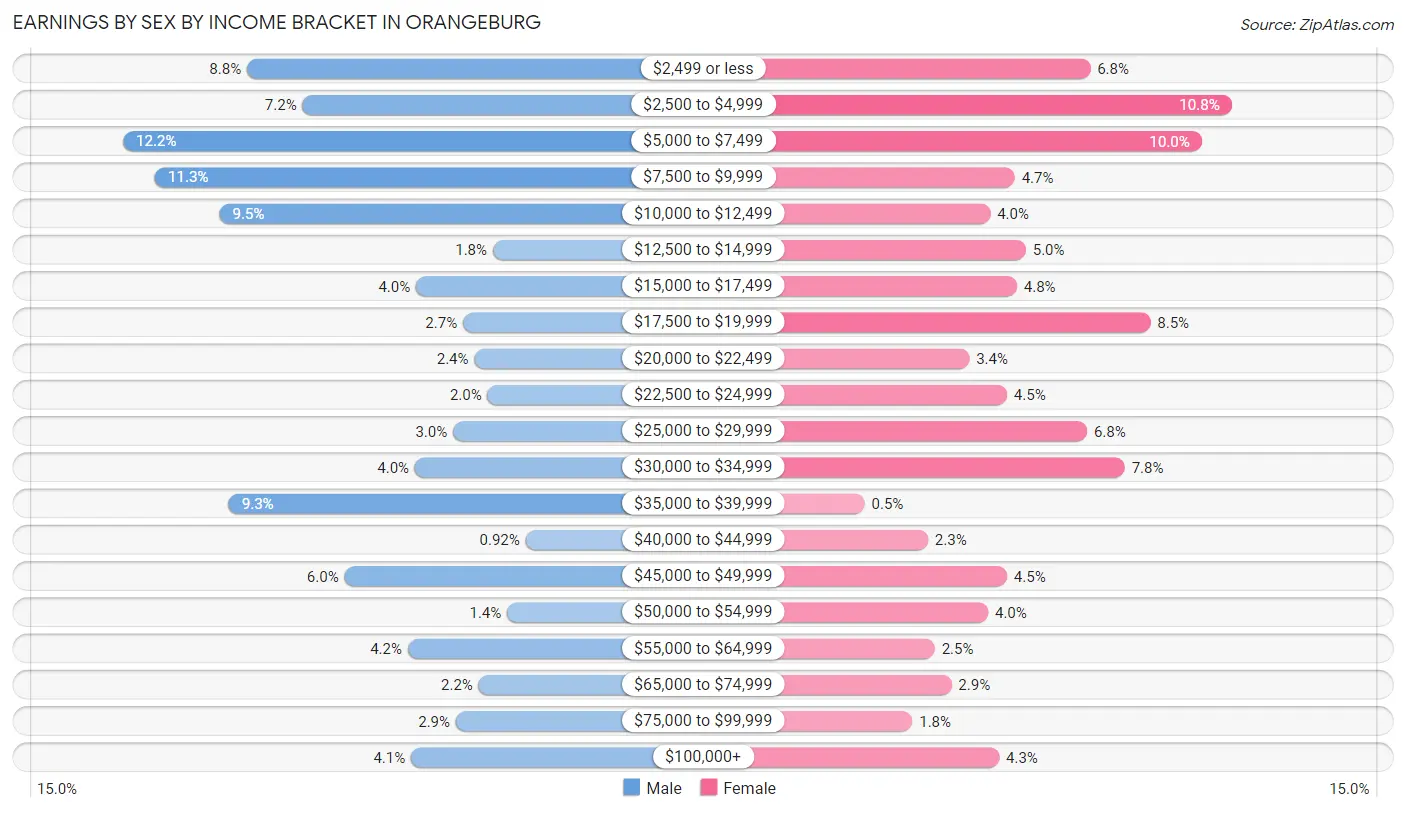
| Income | Male | Female |
| $2,499 or less | 304 (8.7%) | 219 (6.8%) |
| $2,500 to $4,999 | 250 (7.2%) | 346 (10.8%) |
| $5,000 to $7,499 | 425 (12.2%) | 319 (10.0%) |
| $7,500 to $9,999 | 394 (11.3%) | 151 (4.7%) |
| $10,000 to $12,499 | 331 (9.5%) | 129 (4.0%) |
| $12,500 to $14,999 | 64 (1.8%) | 161 (5.0%) |
| $15,000 to $17,499 | 139 (4.0%) | 153 (4.8%) |
| $17,500 to $19,999 | 93 (2.7%) | 273 (8.5%) |
| $20,000 to $22,499 | 82 (2.4%) | 110 (3.4%) |
| $22,500 to $24,999 | 69 (2.0%) | 144 (4.5%) |
| $25,000 to $29,999 | 103 (3.0%) | 216 (6.8%) |
| $30,000 to $34,999 | 140 (4.0%) | 250 (7.8%) |
| $35,000 to $39,999 | 322 (9.3%) | 16 (0.5%) |
| $40,000 to $44,999 | 32 (0.9%) | 73 (2.3%) |
| $45,000 to $49,999 | 209 (6.0%) | 144 (4.5%) |
| $50,000 to $54,999 | 50 (1.4%) | 127 (4.0%) |
| $55,000 to $64,999 | 147 (4.2%) | 79 (2.5%) |
| $65,000 to $74,999 | 78 (2.2%) | 94 (2.9%) |
| $75,000 to $99,999 | 100 (2.9%) | 59 (1.8%) |
| $100,000+ | 144 (4.1%) | 137 (4.3%) |
| Total | 3,476 (100.0%) | 3,200 (100.0%) |
Earnings by Sex by Educational Attainment in Orangeburg
Average earnings in Orangeburg are $31,061 for men and $26,117 for women, a difference of 15.9%. Men with an educational attainment of bachelor's degree enjoy the highest average annual earnings of $48,140, while those with less than high school education earn the least with $9,851. Women with an educational attainment of graduate degree earn the most with the average annual earnings of $50,531, while those with college or associate's degree education have the smallest earnings of $20,607.
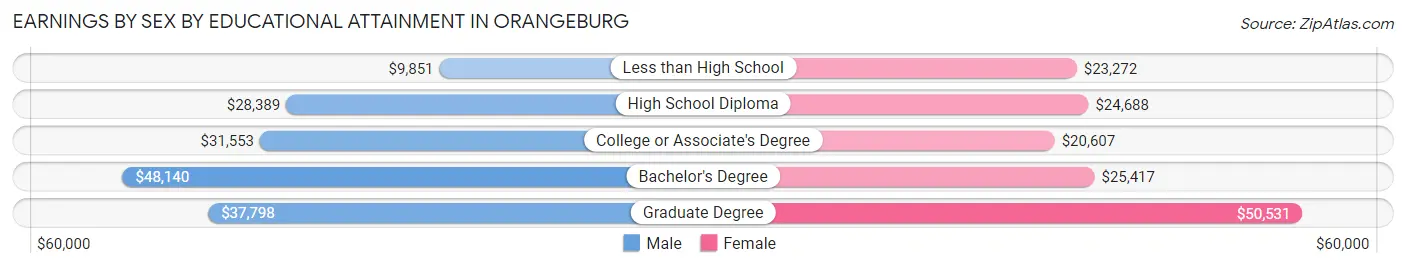
| Educational Attainment | Male Income | Female Income |
| Less than High School | $9,851 | $23,272 |
| High School Diploma | $28,389 | $24,688 |
| College or Associate's Degree | $31,553 | $20,607 |
| Bachelor's Degree | $48,140 | $25,417 |
| Graduate Degree | $37,798 | $50,531 |
| Total | $31,061 | $26,117 |
Family Income in Orangeburg
Family Income Brackets in Orangeburg
According to the Orangeburg family income data, there are 451 families falling into the less than $10,000 income range, which is the most common income bracket and makes up 18.7% of all families. Conversely, the $10,000 to $14,999 income bracket is the least frequent group with only 63 families (2.6%) belonging to this category.
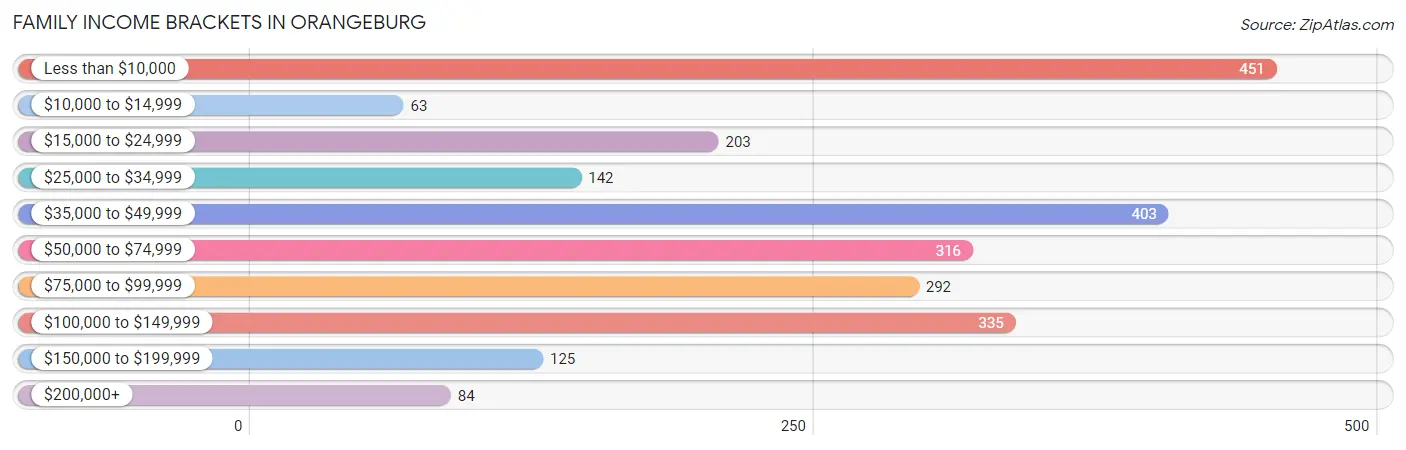
| Income Bracket | # Families | % Families |
| Less than $10,000 | 451 | 18.7% |
| $10,000 to $14,999 | 63 | 2.6% |
| $15,000 to $24,999 | 203 | 8.4% |
| $25,000 to $34,999 | 142 | 5.9% |
| $35,000 to $49,999 | 403 | 16.7% |
| $50,000 to $74,999 | 316 | 13.1% |
| $75,000 to $99,999 | 292 | 12.1% |
| $100,000 to $149,999 | 335 | 13.9% |
| $150,000 to $199,999 | 125 | 5.2% |
| $200,000+ | 84 | 3.5% |
Family Income by Famaliy Size in Orangeburg
3-person families (420 | 17.4%) account for the highest median family income in Orangeburg with $64,750 per family, while 2-person families (1,541 | 63.9%) have the highest median income of $22,600 per family member.
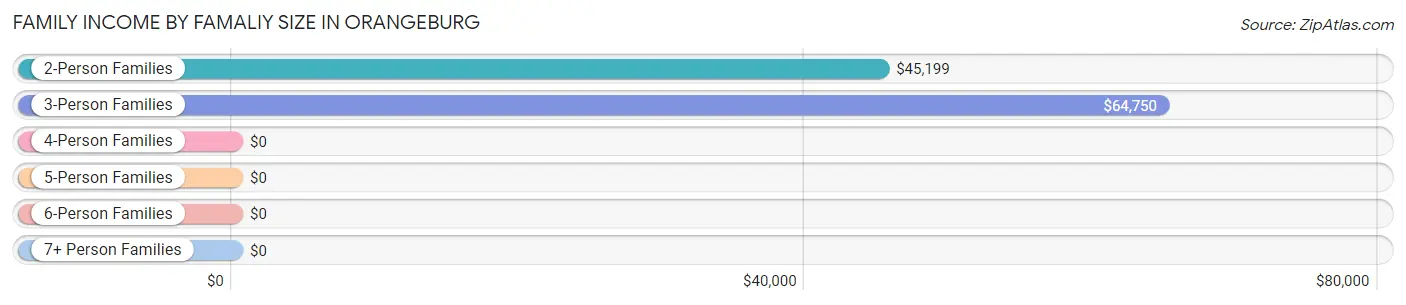
| Income Bracket | # Families | Median Income |
| 2-Person Families | 1,541 (63.9%) | $45,199 |
| 3-Person Families | 420 (17.4%) | $64,750 |
| 4-Person Families | 373 (15.5%) | $0 |
| 5-Person Families | 27 (1.1%) | $0 |
| 6-Person Families | 29 (1.2%) | $0 |
| 7+ Person Families | 22 (0.9%) | $0 |
| Total | 2,412 (100.0%) | $47,094 |
Family Income by Number of Earners in Orangeburg
The median family income in Orangeburg is $47,094, with families comprising 3+ earners (156) having the highest median family income of $95,854, while families with no earners (565) have the lowest median family income of $29,453, accounting for 6.5% and 23.4% of families, respectively.
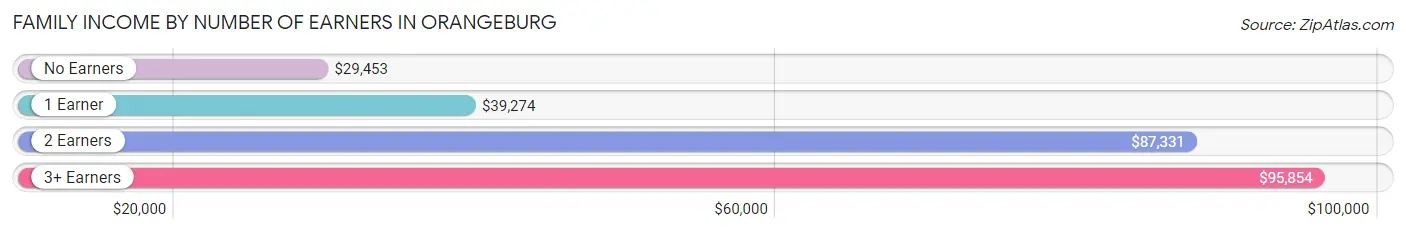
| Number of Earners | # Families | Median Income |
| No Earners | 565 (23.4%) | $29,453 |
| 1 Earner | 994 (41.2%) | $39,274 |
| 2 Earners | 697 (28.9%) | $87,331 |
| 3+ Earners | 156 (6.5%) | $95,854 |
| Total | 2,412 (100.0%) | $47,094 |
Household Income in Orangeburg
Household Income Brackets in Orangeburg
With 1,065 households falling in the category, the less than $10,000 income range is the most frequent in Orangeburg, accounting for 21.4% of all households. In contrast, only 85 households (1.7%) fall into the $200,000+ income bracket, making it the least populous group.
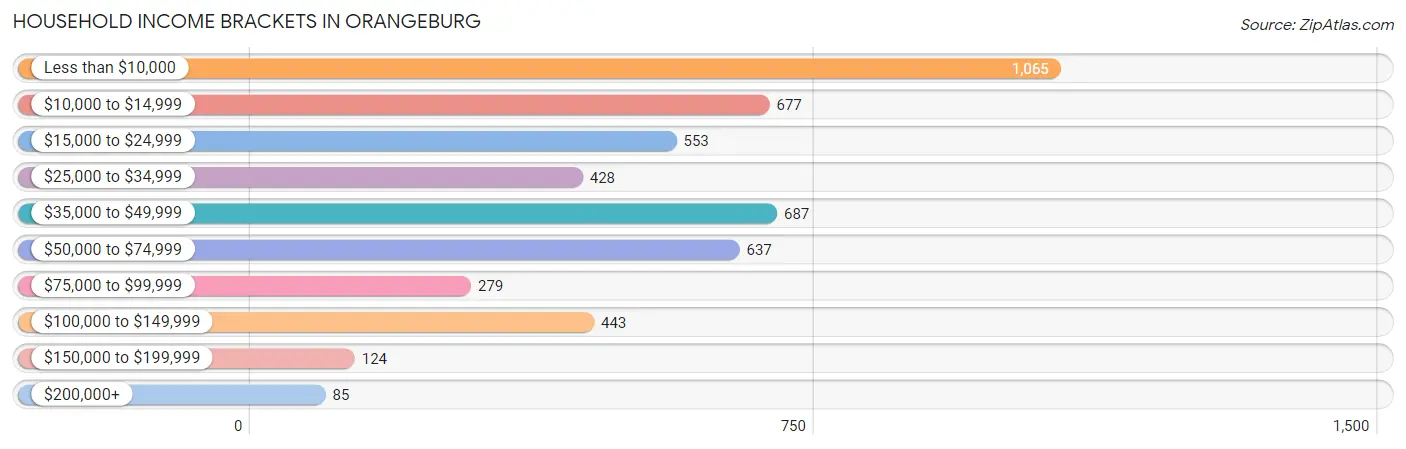
| Income Bracket | # Households | % Households |
| Less than $10,000 | 1,065 | 21.4% |
| $10,000 to $14,999 | 677 | 13.6% |
| $15,000 to $24,999 | 553 | 11.1% |
| $25,000 to $34,999 | 428 | 8.6% |
| $35,000 to $49,999 | 687 | 13.8% |
| $50,000 to $74,999 | 637 | 12.8% |
| $75,000 to $99,999 | 279 | 5.6% |
| $100,000 to $149,999 | 443 | 8.9% |
| $150,000 to $199,999 | 124 | 2.5% |
| $200,000+ | 85 | 1.7% |
Household Income by Householder Age in Orangeburg
The median household income in Orangeburg is $29,340, with the highest median household income of $35,190 found in the 65+ years age bracket for the primary householder. A total of 1,532 households (30.8%) fall into this category. Meanwhile, the 15 to 24 years age bracket for the primary householder has the lowest median household income of $0, with 262 households (5.3%) in this group.
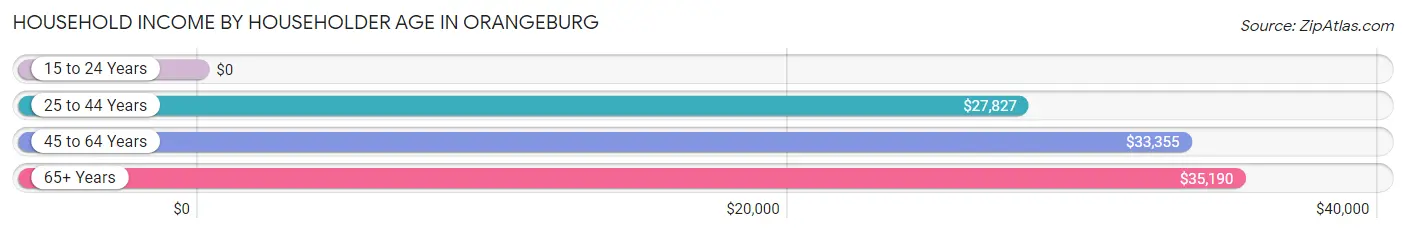
| Income Bracket | # Households | Median Income |
| 15 to 24 Years | 262 (5.3%) | $0 |
| 25 to 44 Years | 1,525 (30.6%) | $27,827 |
| 45 to 64 Years | 1,659 (33.3%) | $33,355 |
| 65+ Years | 1,532 (30.8%) | $35,190 |
| Total | 4,978 (100.0%) | $29,340 |
Poverty in Orangeburg
Income Below Poverty by Sex and Age in Orangeburg
With 35.4% poverty level for males and 32.8% for females among the residents of Orangeburg, under 5 year old males and 15 year old females are the most vulnerable to poverty, with 165 males (63.9%) and 12 females (100.0%) in their respective age groups living below the poverty level.
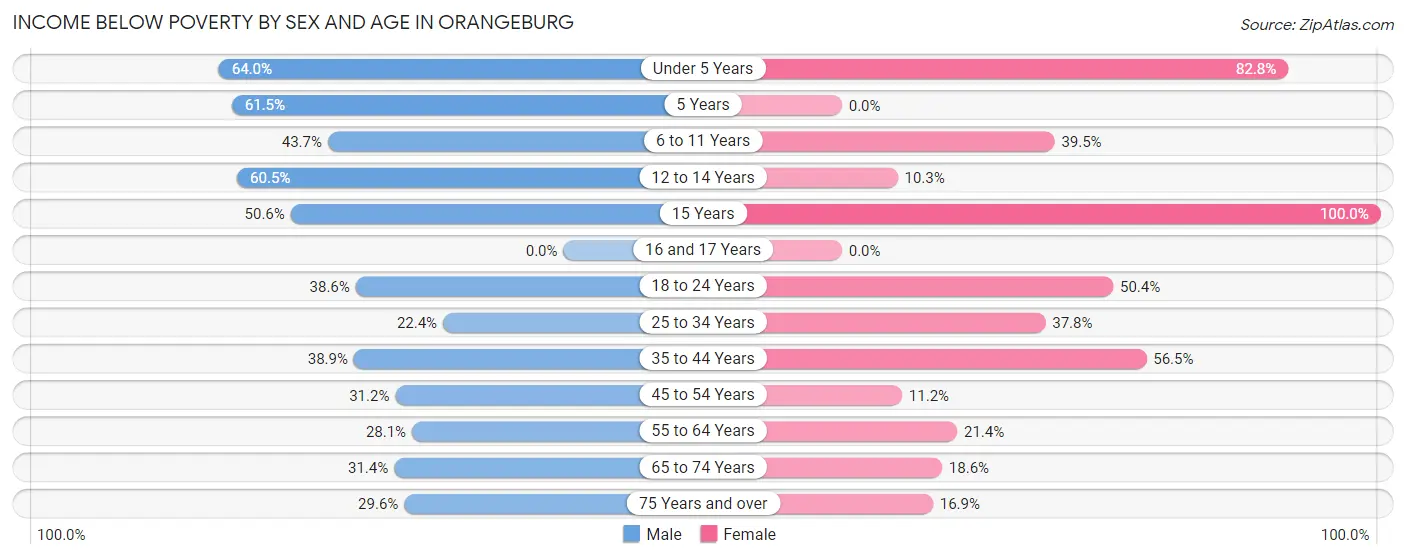
| Age Bracket | Male | Female |
| Under 5 Years | 165 (63.9%) | 193 (82.8%) |
| 5 Years | 24 (61.5%) | 0 (0.0%) |
| 6 to 11 Years | 160 (43.7%) | 195 (39.5%) |
| 12 to 14 Years | 112 (60.5%) | 12 (10.3%) |
| 15 Years | 41 (50.6%) | 12 (100.0%) |
| 16 and 17 Years | 0 (0.0%) | 0 (0.0%) |
| 18 to 24 Years | 204 (38.6%) | 216 (50.3%) |
| 25 to 34 Years | 135 (22.4%) | 301 (37.8%) |
| 35 to 44 Years | 210 (38.9%) | 429 (56.5%) |
| 45 to 54 Years | 211 (31.2%) | 73 (11.2%) |
| 55 to 64 Years | 197 (28.1%) | 160 (21.4%) |
| 65 to 74 Years | 186 (31.4%) | 128 (18.6%) |
| 75 Years and over | 117 (29.5%) | 89 (16.9%) |
| Total | 1,762 (35.4%) | 1,808 (32.8%) |
Income Above Poverty by Sex and Age in Orangeburg
According to the poverty statistics in Orangeburg, males aged 16 and 17 years and females aged 16 and 17 years are the age groups that are most secure financially, with 100.0% of males and 100.0% of females in these age groups living above the poverty line.
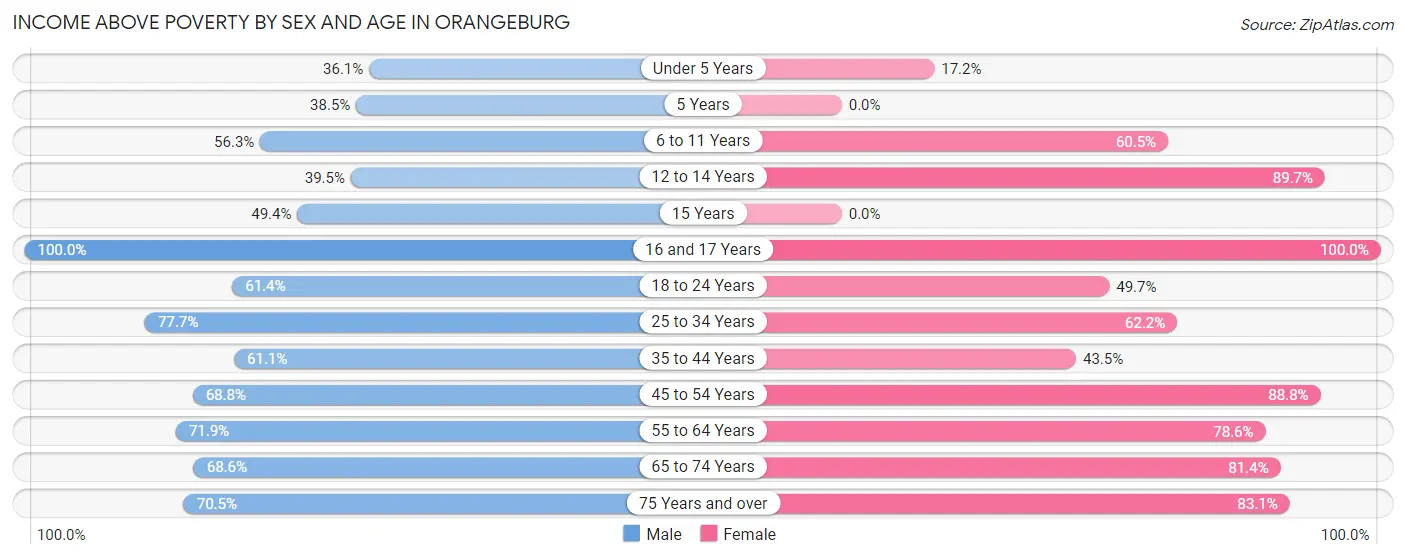
| Age Bracket | Male | Female |
| Under 5 Years | 93 (36.0%) | 40 (17.2%) |
| 5 Years | 15 (38.5%) | 0 (0.0%) |
| 6 to 11 Years | 206 (56.3%) | 299 (60.5%) |
| 12 to 14 Years | 73 (39.5%) | 104 (89.7%) |
| 15 Years | 40 (49.4%) | 0 (0.0%) |
| 16 and 17 Years | 13 (100.0%) | 61 (100.0%) |
| 18 to 24 Years | 325 (61.4%) | 213 (49.6%) |
| 25 to 34 Years | 469 (77.6%) | 496 (62.2%) |
| 35 to 44 Years | 330 (61.1%) | 330 (43.5%) |
| 45 to 54 Years | 465 (68.8%) | 581 (88.8%) |
| 55 to 64 Years | 504 (71.9%) | 588 (78.6%) |
| 65 to 74 Years | 406 (68.6%) | 561 (81.4%) |
| 75 Years and over | 279 (70.5%) | 438 (83.1%) |
| Total | 3,218 (64.6%) | 3,711 (67.2%) |
Income Below Poverty Among Married-Couple Families in Orangeburg
The poverty statistics for married-couple families in Orangeburg show that 7.6% or 100 of the total 1,317 families live below the poverty line. Families with 1 or 2 children have the highest poverty rate of 25.5%, comprising of 56 families. On the other hand, families with no children have the lowest poverty rate of 4.0%, which includes 44 families.
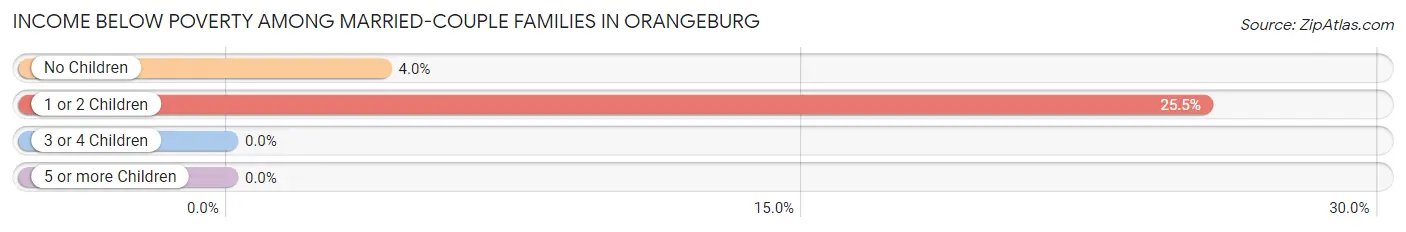
| Children | Above Poverty | Below Poverty |
| No Children | 1,053 (96.0%) | 44 (4.0%) |
| 1 or 2 Children | 164 (74.6%) | 56 (25.5%) |
| 3 or 4 Children | 0 (0.0%) | 0 (0.0%) |
| 5 or more Children | 0 (0.0%) | 0 (0.0%) |
| Total | 1,217 (92.4%) | 100 (7.6%) |
Income Below Poverty Among Single-Parent Households in Orangeburg
According to the poverty data in Orangeburg, 54.8% or 137 single-father households and 51.9% or 439 single-mother households are living below the poverty line. Among single-father households, those with no children have the highest poverty rate, with 123 households (60.3%) experiencing poverty. Likewise, among single-mother households, those with 3 or 4 children have the highest poverty rate, with 122 households (100.0%) falling below the poverty line.
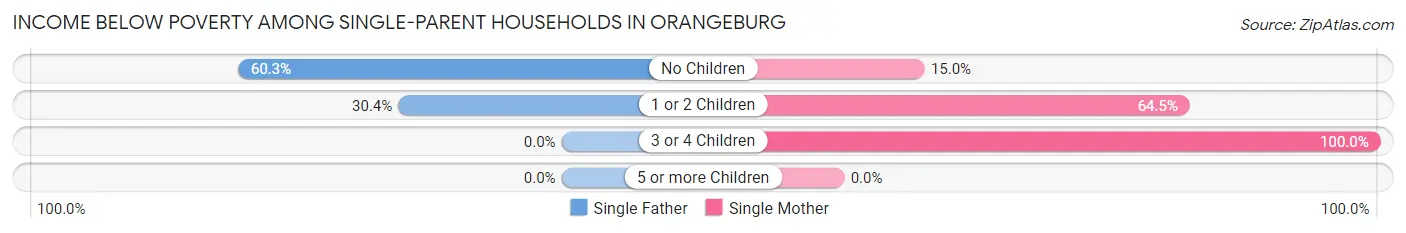
| Children | Single Father | Single Mother |
| No Children | 123 (60.3%) | 45 (14.9%) |
| 1 or 2 Children | 14 (30.4%) | 272 (64.4%) |
| 3 or 4 Children | 0 (0.0%) | 122 (100.0%) |
| 5 or more Children | 0 (0.0%) | 0 (0.0%) |
| Total | 137 (54.8%) | 439 (51.9%) |
Income Below Poverty Among Married-Couple vs Single-Parent Households in Orangeburg
The poverty data for Orangeburg shows that 100 of the married-couple family households (7.6%) and 576 of the single-parent households (52.6%) are living below the poverty level. Within the married-couple family households, those with 1 or 2 children have the highest poverty rate, with 56 households (25.5%) falling below the poverty line. Among the single-parent households, those with 3 or 4 children have the highest poverty rate, with 122 household (100.0%) living below poverty.
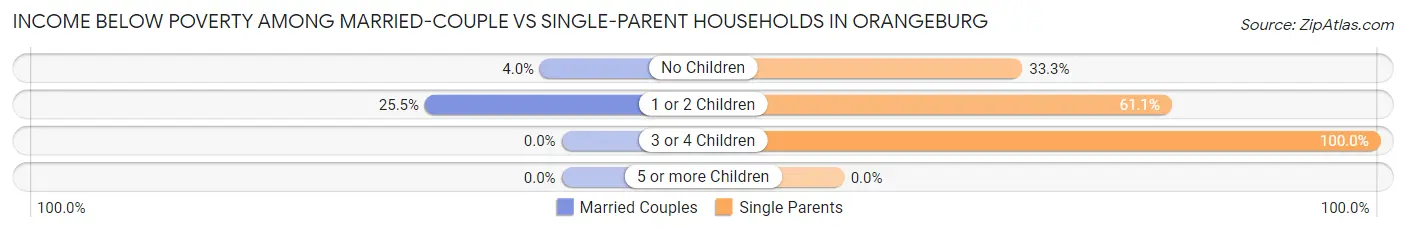
| Children | Married-Couple Families | Single-Parent Households |
| No Children | 44 (4.0%) | 168 (33.3%) |
| 1 or 2 Children | 56 (25.5%) | 286 (61.1%) |
| 3 or 4 Children | 0 (0.0%) | 122 (100.0%) |
| 5 or more Children | 0 (0.0%) | 0 (0.0%) |
| Total | 100 (7.6%) | 576 (52.6%) |
Race in Orangeburg
The most populous races in Orangeburg are Black / African American (9,661 | 73.1%), White / Caucasian (3,077 | 23.3%), and Two or more Races (181 | 1.4%).
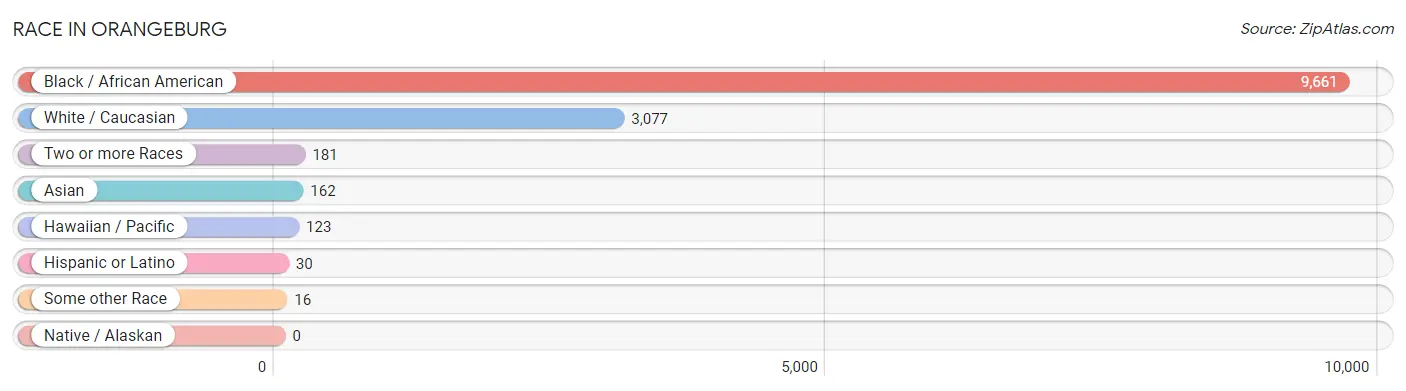
| Race | # Population | % Population |
| Asian | 162 | 1.2% |
| Black / African American | 9,661 | 73.1% |
| Hawaiian / Pacific | 123 | 0.9% |
| Hispanic or Latino | 30 | 0.2% |
| Native / Alaskan | 0 | 0.0% |
| White / Caucasian | 3,077 | 23.3% |
| Two or more Races | 181 | 1.4% |
| Some other Race | 16 | 0.1% |
| Total | 13,220 | 100.0% |
Ancestry in Orangeburg
The most populous ancestries reported in Orangeburg are American (380 | 2.9%), Irish (276 | 2.1%), English (248 | 1.9%), Arab (167 | 1.3%), and Moroccan (159 | 1.2%), together accounting for 9.3% of all Orangeburg residents.
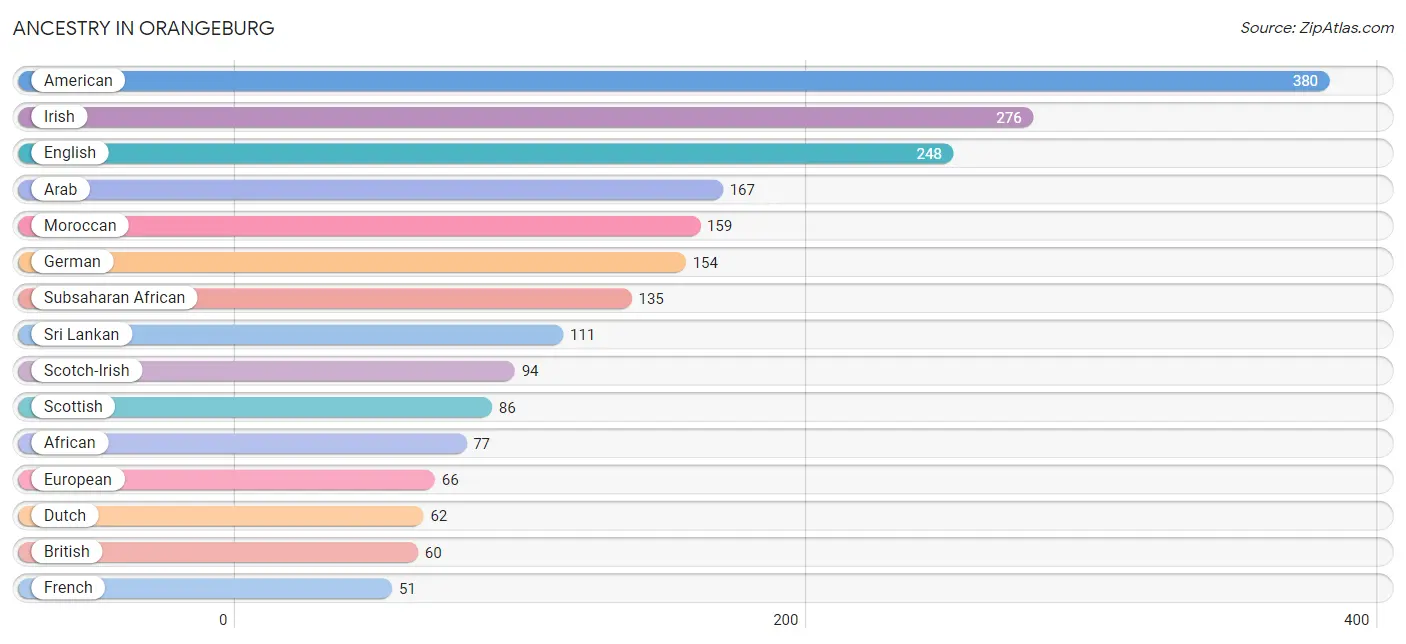
| Ancestry | # Population | % Population |
| African | 77 | 0.6% |
| American | 380 | 2.9% |
| Arab | 167 | 1.3% |
| Barbadian | 21 | 0.2% |
| British | 60 | 0.4% |
| Burmese | 44 | 0.3% |
| Central American | 6 | 0.1% |
| Cherokee | 47 | 0.4% |
| Danish | 6 | 0.1% |
| Dutch | 62 | 0.5% |
| English | 248 | 1.9% |
| European | 66 | 0.5% |
| French | 51 | 0.4% |
| French Canadian | 14 | 0.1% |
| German | 154 | 1.2% |
| Ghanaian | 25 | 0.2% |
| Haitian | 14 | 0.1% |
| Hungarian | 22 | 0.2% |
| Irish | 276 | 2.1% |
| Israeli | 24 | 0.2% |
| Italian | 31 | 0.2% |
| Jamaican | 21 | 0.2% |
| Japanese | 7 | 0.1% |
| Latvian | 7 | 0.1% |
| Lithuanian | 4 | 0.0% |
| Moroccan | 159 | 1.2% |
| Nigerian | 33 | 0.3% |
| Norwegian | 12 | 0.1% |
| Palestinian | 8 | 0.1% |
| Polish | 29 | 0.2% |
| Puerto Rican | 19 | 0.1% |
| Russian | 1 | 0.0% |
| Salvadoran | 6 | 0.1% |
| Scandinavian | 18 | 0.1% |
| Scotch-Irish | 94 | 0.7% |
| Scottish | 86 | 0.6% |
| Slavic | 6 | 0.1% |
| Slovak | 24 | 0.2% |
| Sri Lankan | 111 | 0.8% |
| Subsaharan African | 135 | 1.0% |
| Ukrainian | 6 | 0.1% |
| Welsh | 8 | 0.1% |
| West Indian | 44 | 0.3% | View All 43 Rows |
Immigrants in Orangeburg
The most numerous immigrant groups reported in Orangeburg came from Asia (155 | 1.2%), South Eastern Asia (97 | 0.7%), Vietnam (90 | 0.7%), Africa (71 | 0.5%), and Western Africa (58 | 0.4%), together accounting for 3.6% of all Orangeburg residents.
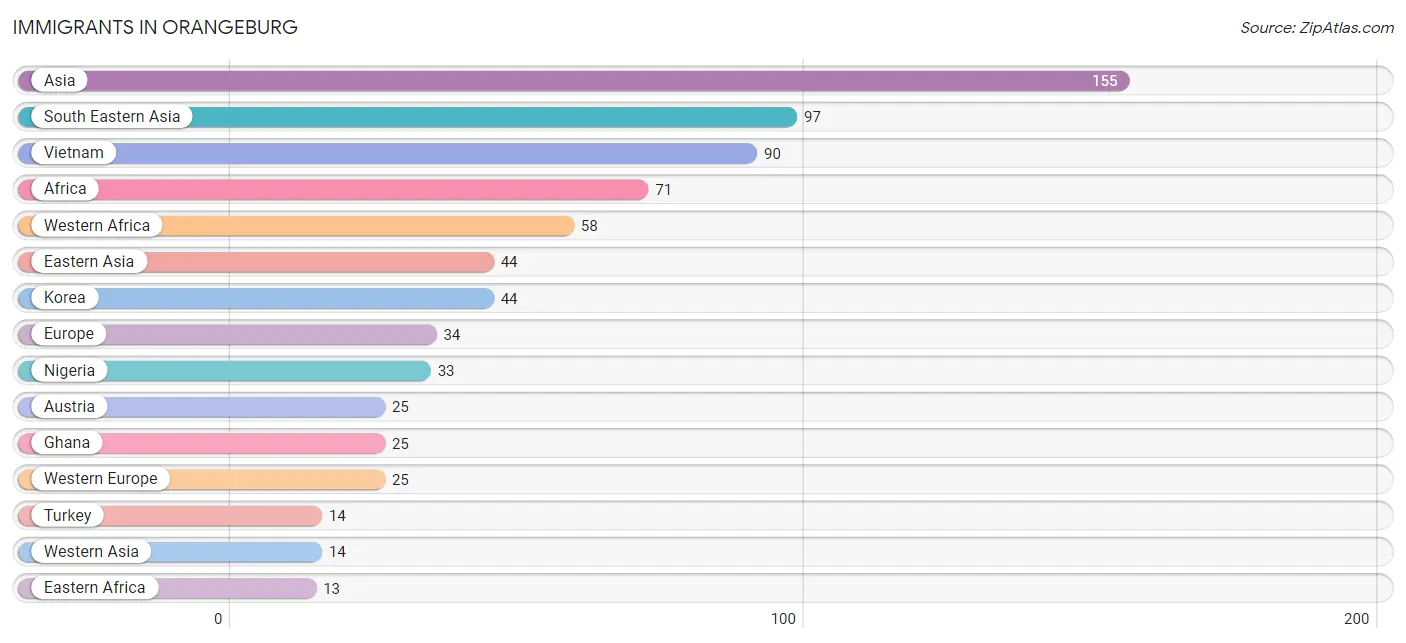
| Immigration Origin | # Population | % Population |
| Africa | 71 | 0.5% |
| Asia | 155 | 1.2% |
| Austria | 25 | 0.2% |
| Canada | 5 | 0.0% |
| Caribbean | 8 | 0.1% |
| Eastern Africa | 13 | 0.1% |
| Eastern Asia | 44 | 0.3% |
| Eastern Europe | 9 | 0.1% |
| Europe | 34 | 0.3% |
| Ghana | 25 | 0.2% |
| Hungary | 8 | 0.1% |
| Jamaica | 8 | 0.1% |
| Korea | 44 | 0.3% |
| Latin America | 8 | 0.1% |
| Nigeria | 33 | 0.3% |
| Russia | 1 | 0.0% |
| South Eastern Asia | 97 | 0.7% |
| Thailand | 7 | 0.1% |
| Turkey | 14 | 0.1% |
| Vietnam | 90 | 0.7% |
| Western Africa | 58 | 0.4% |
| Western Asia | 14 | 0.1% |
| Western Europe | 25 | 0.2% | View All 23 Rows |
Sex and Age in Orangeburg
Sex and Age in Orangeburg
The most populous age groups in Orangeburg are 20 to 24 Years (1,097 | 17.2%) for men and 20 to 24 Years (795 | 11.6%) for women.
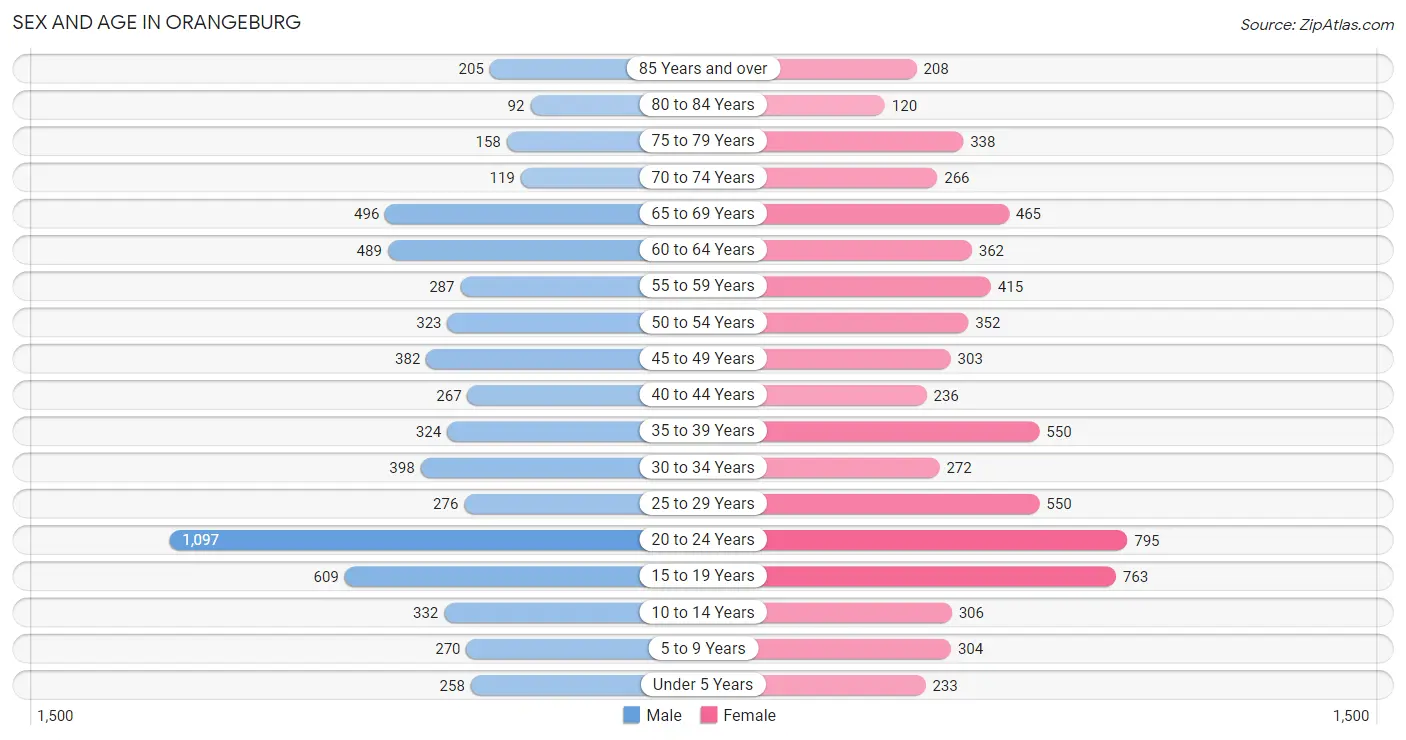
| Age Bracket | Male | Female |
| Under 5 Years | 258 (4.0%) | 233 (3.4%) |
| 5 to 9 Years | 270 (4.2%) | 304 (4.4%) |
| 10 to 14 Years | 332 (5.2%) | 306 (4.5%) |
| 15 to 19 Years | 609 (9.5%) | 763 (11.2%) |
| 20 to 24 Years | 1,097 (17.2%) | 795 (11.6%) |
| 25 to 29 Years | 276 (4.3%) | 550 (8.0%) |
| 30 to 34 Years | 398 (6.2%) | 272 (4.0%) |
| 35 to 39 Years | 324 (5.1%) | 550 (8.0%) |
| 40 to 44 Years | 267 (4.2%) | 236 (3.5%) |
| 45 to 49 Years | 382 (6.0%) | 303 (4.4%) |
| 50 to 54 Years | 323 (5.1%) | 352 (5.1%) |
| 55 to 59 Years | 287 (4.5%) | 415 (6.1%) |
| 60 to 64 Years | 489 (7.7%) | 362 (5.3%) |
| 65 to 69 Years | 496 (7.8%) | 465 (6.8%) |
| 70 to 74 Years | 119 (1.9%) | 266 (3.9%) |
| 75 to 79 Years | 158 (2.5%) | 338 (4.9%) |
| 80 to 84 Years | 92 (1.4%) | 120 (1.8%) |
| 85 Years and over | 205 (3.2%) | 208 (3.0%) |
| Total | 6,382 (100.0%) | 6,838 (100.0%) |
Families and Households in Orangeburg
Median Family Size in Orangeburg
The median family size in Orangeburg is 3.01 persons per family, with single female/mother families (845 | 35.0%) accounting for the largest median family size of 3.28 persons per family. On the other hand, single male/father families (250 | 10.4%) represent the smallest median family size with 2.57 persons per family.
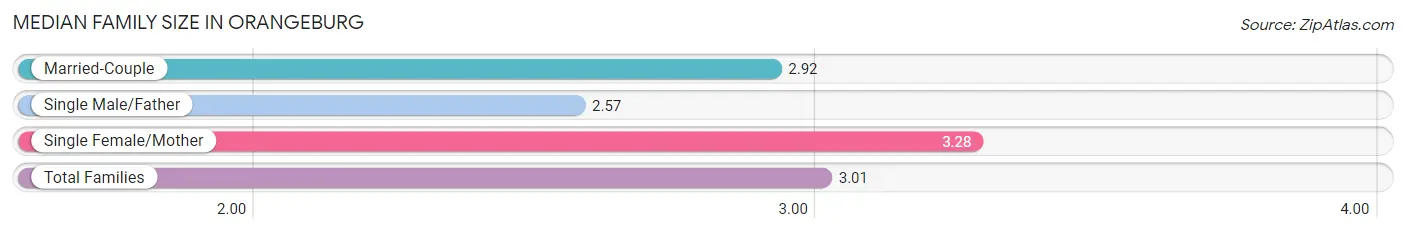
| Family Type | # Families | Family Size |
| Married-Couple | 1,317 (54.6%) | 2.92 |
| Single Male/Father | 250 (10.4%) | 2.57 |
| Single Female/Mother | 845 (35.0%) | 3.28 |
| Total Families | 2,412 (100.0%) | 3.01 |
Median Household Size in Orangeburg
The median household size in Orangeburg is 2.08 persons per household, with single female/mother households (845 | 17.0%) accounting for the largest median household size of 3.45 persons per household. non-family households (2,566 | 51.5%) represent the smallest median household size with 1.09 persons per household.
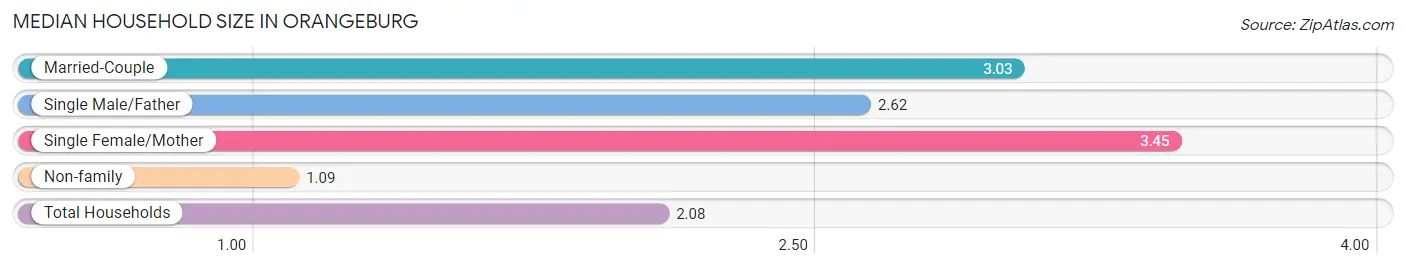
| Household Type | # Households | Household Size |
| Married-Couple | 1,317 (26.5%) | 3.03 |
| Single Male/Father | 250 (5.0%) | 2.62 |
| Single Female/Mother | 845 (17.0%) | 3.45 |
| Non-family | 2,566 (51.5%) | 1.09 |
| Total Households | 4,978 (100.0%) | 2.08 |
Household Size by Marriage Status in Orangeburg
Out of a total of 4,978 households in Orangeburg, 2,412 (48.4%) are family households, while 2,566 (51.5%) are nonfamily households. The most numerous type of family households are 2-person households, comprising 1,350, and the most common type of nonfamily households are 1-person households, comprising 2,373.
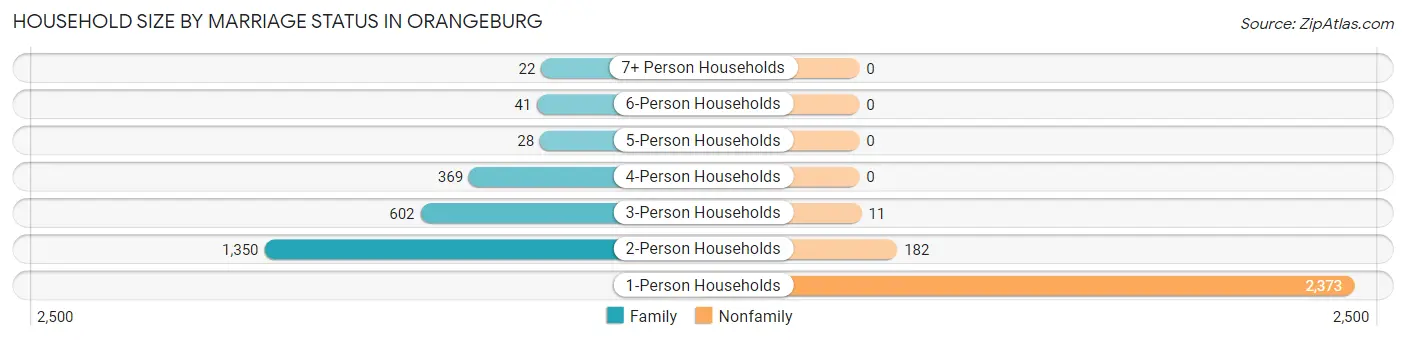
| Household Size | Family Households | Nonfamily Households |
| 1-Person Households | - | 2,373 (47.7%) |
| 2-Person Households | 1,350 (27.1%) | 182 (3.7%) |
| 3-Person Households | 602 (12.1%) | 11 (0.2%) |
| 4-Person Households | 369 (7.4%) | 0 (0.0%) |
| 5-Person Households | 28 (0.6%) | 0 (0.0%) |
| 6-Person Households | 41 (0.8%) | 0 (0.0%) |
| 7+ Person Households | 22 (0.4%) | 0 (0.0%) |
| Total | 2,412 (48.4%) | 2,566 (51.5%) |
Female Fertility in Orangeburg
Fertility by Age in Orangeburg
Average fertility rate in Orangeburg is 36.0 births per 1,000 women. Women in the age bracket of 20 to 34 years have the highest fertility rate with 39.0 births per 1,000 women. Women in the age bracket of 20 to 34 years acount for 50.0% of all women with births.
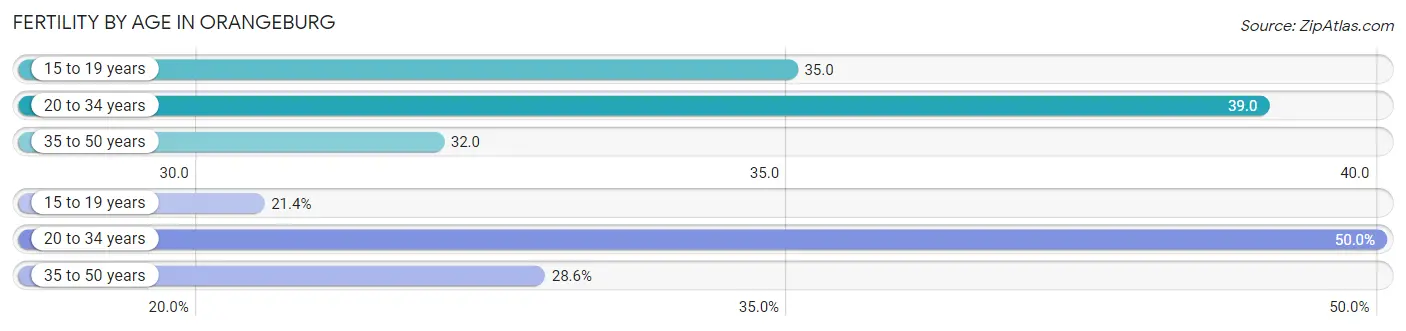
| Age Bracket | Women with Births | Births / 1,000 Women |
| 15 to 19 years | 27 (21.4%) | 35.0 |
| 20 to 34 years | 63 (50.0%) | 39.0 |
| 35 to 50 years | 36 (28.6%) | 32.0 |
| Total | 126 (100.0%) | 36.0 |
Fertility by Age by Marriage Status in Orangeburg
50.8% of women with births (126) in Orangeburg are married. The highest percentage of unmarried women with births falls into 15 to 19 years age bracket with 100.0% of them unmarried at the time of birth, while the lowest percentage of unmarried women with births belong to 35 to 50 years age bracket with 0.0% of them unmarried.
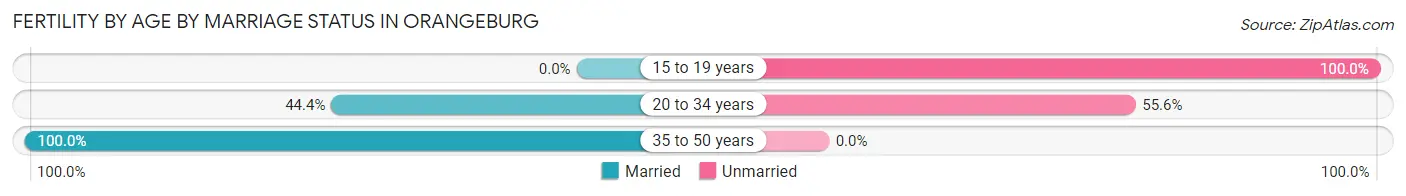
| Age Bracket | Married | Unmarried |
| 15 to 19 years | 0 (0.0%) | 27 (100.0%) |
| 20 to 34 years | 28 (44.4%) | 35 (55.6%) |
| 35 to 50 years | 36 (100.0%) | 0 (0.0%) |
| Total | 64 (50.8%) | 62 (49.2%) |
Fertility by Education in Orangeburg
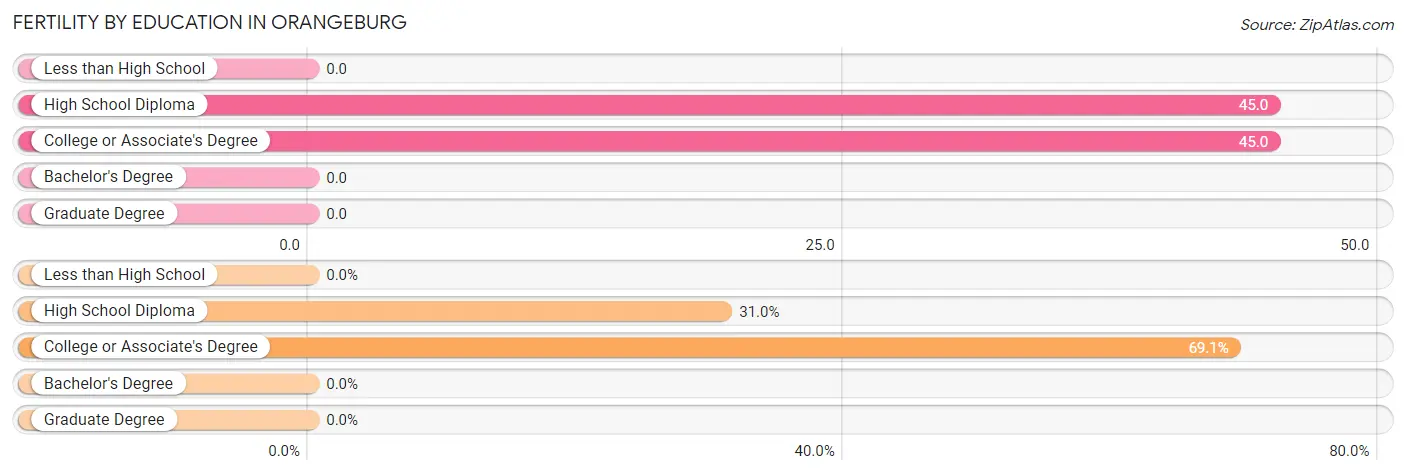
| Educational Attainment | Women with Births | Births / 1,000 Women |
| Less than High School | 0 (0.0%) | 0.0 |
| High School Diploma | 39 (30.9%) | 45.0 |
| College or Associate's Degree | 87 (69.1%) | 45.0 |
| Bachelor's Degree | 0 (0.0%) | 0.0 |
| Graduate Degree | 0 (0.0%) | 0.0 |
| Total | 126 (100.0%) | 36.0 |
Fertility by Education by Marriage Status in Orangeburg
49.2% of women with births in Orangeburg are unmarried. Women with the educational attainment of college or associate's degree are most likely to be married with 73.6% of them married at childbirth, while women with the educational attainment of high school diploma are least likely to be married with 100.0% of them unmarried at childbirth.
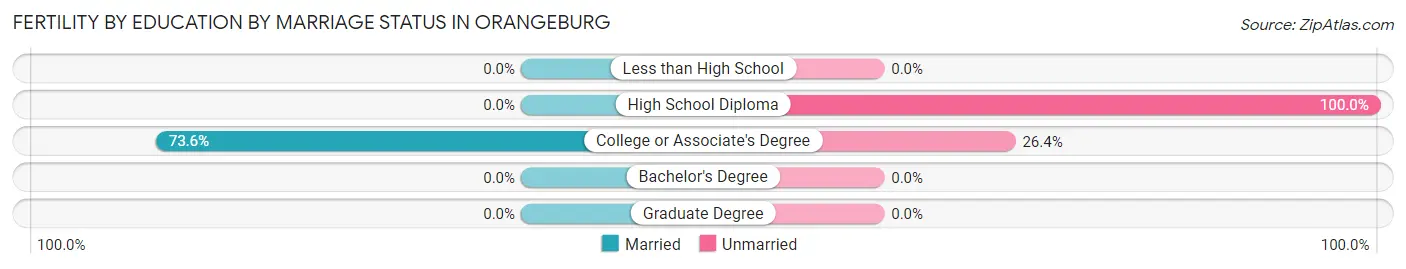
| Educational Attainment | Married | Unmarried |
| Less than High School | 0 (0.0%) | 0 (0.0%) |
| High School Diploma | 0 (0.0%) | 39 (100.0%) |
| College or Associate's Degree | 64 (73.6%) | 23 (26.4%) |
| Bachelor's Degree | 0 (0.0%) | 0 (0.0%) |
| Graduate Degree | 0 (0.0%) | 0 (0.0%) |
| Total | 64 (50.8%) | 62 (49.2%) |
Employment Characteristics in Orangeburg
Employment by Class of Employer in Orangeburg
Among the 4,857 employed individuals in Orangeburg, private company employees (3,001 | 61.8%), state government employees (590 | 12.1%), and self-employed (not incorporated) (398 | 8.2%) make up the most common classes of employment.
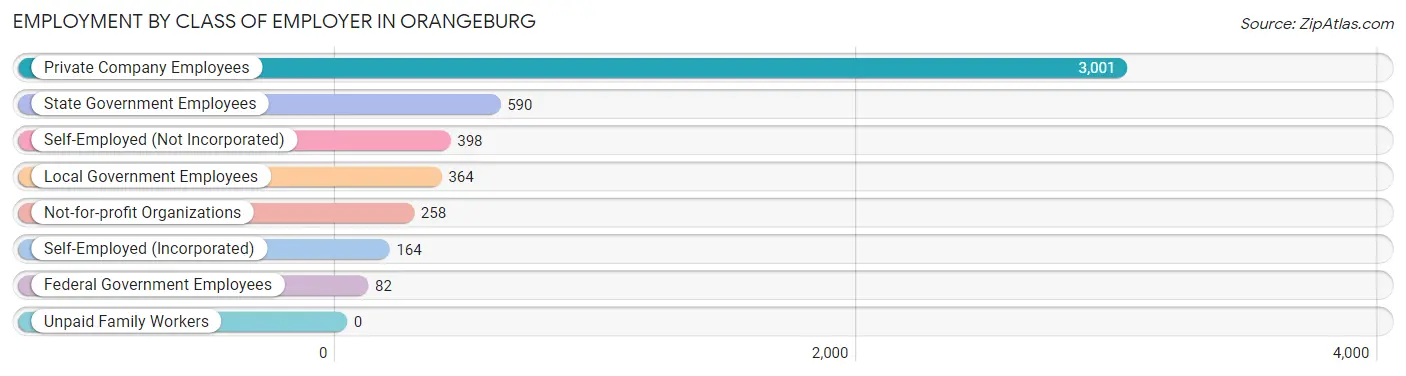
| Employer Class | # Employees | % Employees |
| Private Company Employees | 3,001 | 61.8% |
| Self-Employed (Incorporated) | 164 | 3.4% |
| Self-Employed (Not Incorporated) | 398 | 8.2% |
| Not-for-profit Organizations | 258 | 5.3% |
| Local Government Employees | 364 | 7.5% |
| State Government Employees | 590 | 12.1% |
| Federal Government Employees | 82 | 1.7% |
| Unpaid Family Workers | 0 | 0.0% |
| Total | 4,857 | 100.0% |
Employment Status by Age in Orangeburg
According to the labor force statistics for Orangeburg, out of the total population over 16 years of age (11,424), 50.0% or 5,712 individuals are in the labor force, with 12.5% or 714 of them unemployed. The age group with the highest labor force participation rate is 30 to 34 years, with 86.9% or 582 individuals in the labor force. Within the labor force, the 25 to 29 years age range has the highest percentage of unemployed individuals, with 23.9% or 127 of them being unemployed.
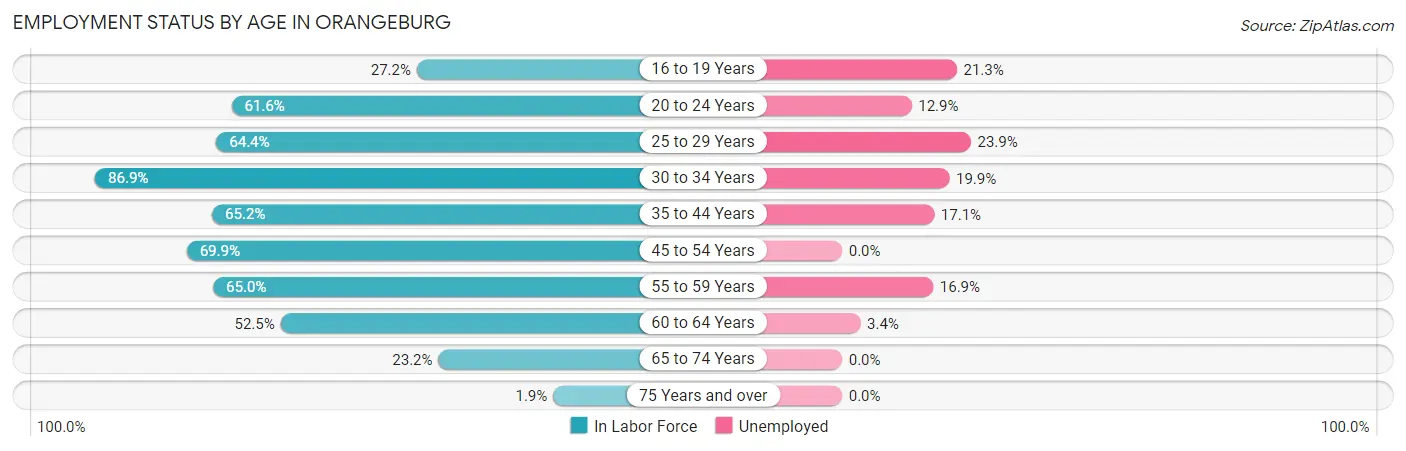
| Age Bracket | In Labor Force | Unemployed |
| 16 to 19 Years | 348 (27.2%) | 74 (21.3%) |
| 20 to 24 Years | 1,165 (61.6%) | 150 (12.9%) |
| 25 to 29 Years | 532 (64.4%) | 127 (23.9%) |
| 30 to 34 Years | 582 (86.9%) | 116 (19.9%) |
| 35 to 44 Years | 898 (65.2%) | 154 (17.1%) |
| 45 to 54 Years | 951 (69.9%) | 0 (0.0%) |
| 55 to 59 Years | 456 (65.0%) | 77 (16.9%) |
| 60 to 64 Years | 447 (52.5%) | 15 (3.4%) |
| 65 to 74 Years | 312 (23.2%) | 0 (0.0%) |
| 75 Years and over | 21 (1.9%) | 0 (0.0%) |
| Total | 5,712 (50.0%) | 714 (12.5%) |
Employment Status by Educational Attainment in Orangeburg
According to labor force statistics for Orangeburg, 66.8% of individuals (3,865) out of the total population between 25 and 64 years of age (5,786) are in the labor force, with 12.6% or 487 of them being unemployed. The group with the highest labor force participation rate are those with the educational attainment of college / associate degree, with 81.6% or 1,636 individuals in the labor force. Within the labor force, individuals with less than high school education have the highest percentage of unemployment, with 27.3% or 90 of them being unemployed.
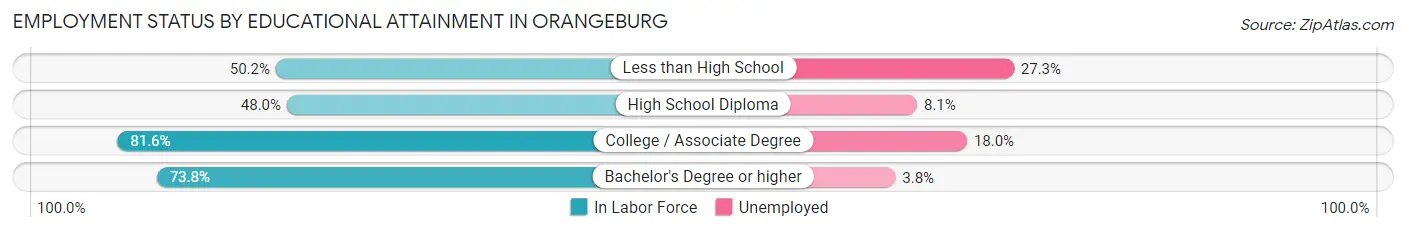
| Educational Attainment | In Labor Force | Unemployed |
| Less than High School | 330 (50.2%) | 179 (27.3%) |
| High School Diploma | 754 (48.0%) | 127 (8.1%) |
| College / Associate Degree | 1,636 (81.6%) | 361 (18.0%) |
| Bachelor's Degree or higher | 1,147 (73.8%) | 59 (3.8%) |
| Total | 3,865 (66.8%) | 729 (12.6%) |
Employment Occupations by Sex in Orangeburg
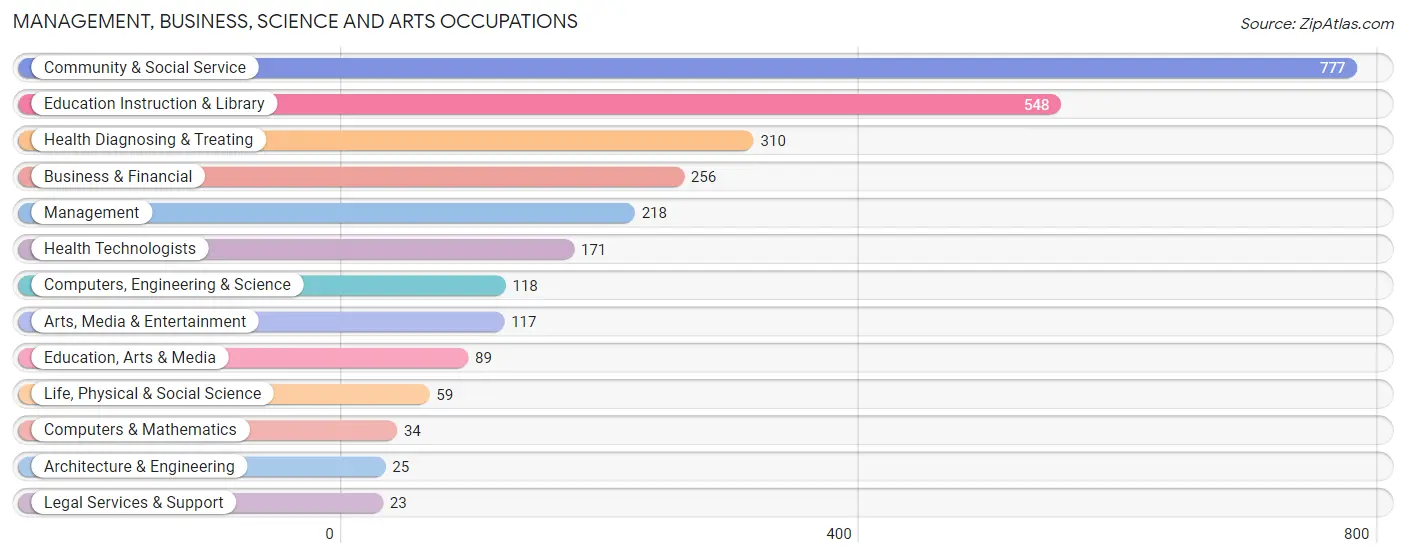
Management, Business, Science and Arts Occupations
The most common Management, Business, Science and Arts occupations in Orangeburg are Community & Social Service (777 | 15.5%), Education Instruction & Library (548 | 11.0%), Health Diagnosing & Treating (310 | 6.2%), Business & Financial (256 | 5.1%), and Management (218 | 4.4%).
Management, Business, Science and Arts Occupations by Sex
Within the Management, Business, Science and Arts occupations in Orangeburg, the most male-oriented occupations are Architecture & Engineering (100.0%), Legal Services & Support (100.0%), and Life, Physical & Social Science (76.3%), while the most female-oriented occupations are Computers & Mathematics (100.0%), Education Instruction & Library (81.0%), and Community & Social Service (72.1%).
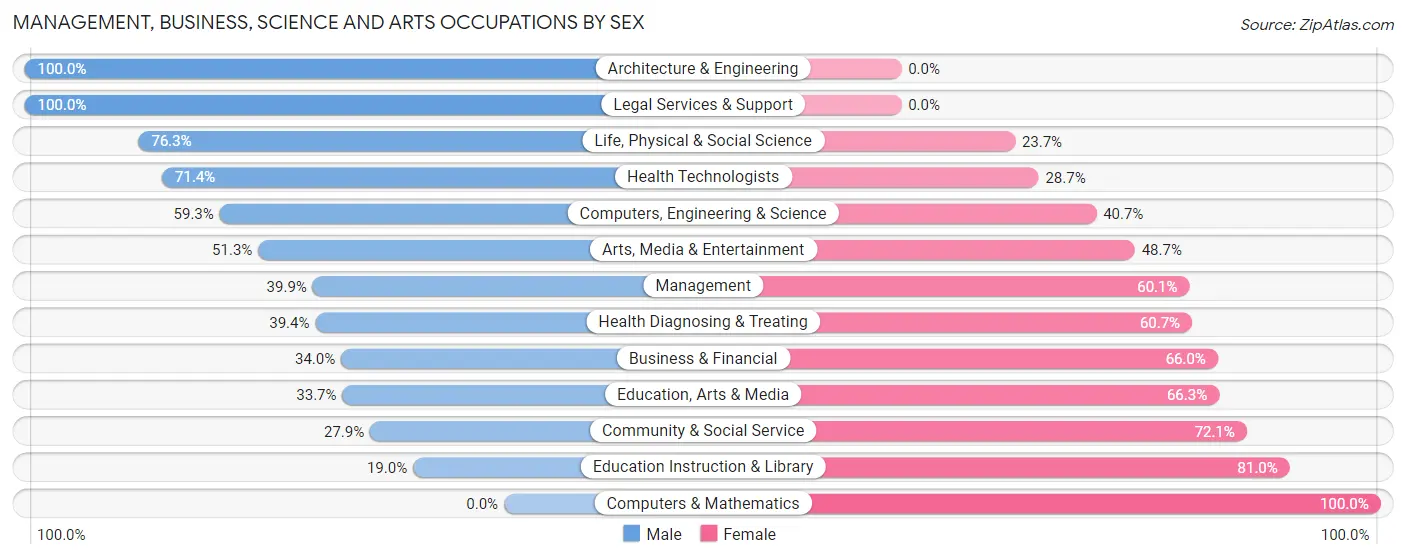
| Occupation | Male | Female |
| Management | 87 (39.9%) | 131 (60.1%) |
| Business & Financial | 87 (34.0%) | 169 (66.0%) |
| Computers, Engineering & Science | 70 (59.3%) | 48 (40.7%) |
| Computers & Mathematics | 0 (0.0%) | 34 (100.0%) |
| Architecture & Engineering | 25 (100.0%) | 0 (0.0%) |
| Life, Physical & Social Science | 45 (76.3%) | 14 (23.7%) |
| Community & Social Service | 217 (27.9%) | 560 (72.1%) |
| Education, Arts & Media | 30 (33.7%) | 59 (66.3%) |
| Legal Services & Support | 23 (100.0%) | 0 (0.0%) |
| Education Instruction & Library | 104 (19.0%) | 444 (81.0%) |
| Arts, Media & Entertainment | 60 (51.3%) | 57 (48.7%) |
| Health Diagnosing & Treating | 122 (39.4%) | 188 (60.7%) |
| Health Technologists | 122 (71.4%) | 49 (28.6%) |
| Total (Category) | 583 (34.7%) | 1,096 (65.3%) |
| Total (Overall) | 2,399 (48.0%) | 2,601 (52.0%) |
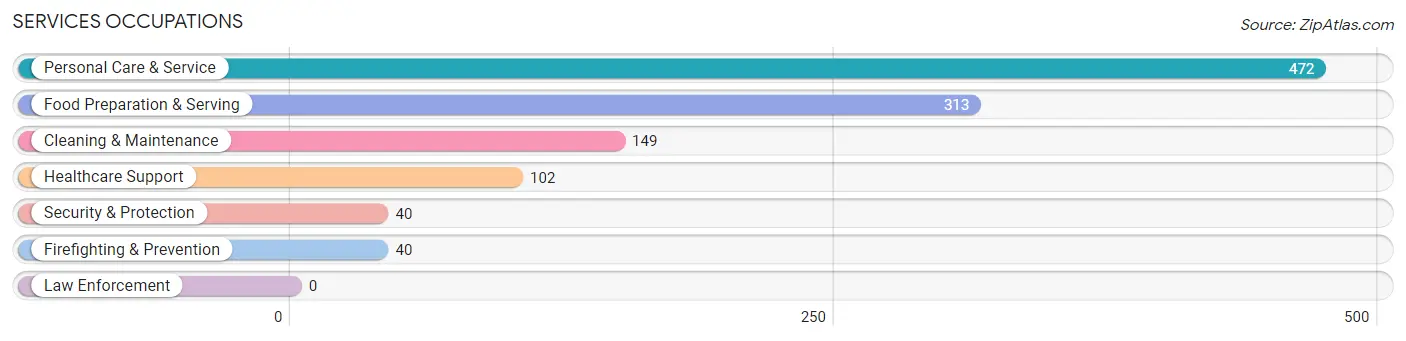
Services Occupations
The most common Services occupations in Orangeburg are Personal Care & Service (472 | 9.4%), Food Preparation & Serving (313 | 6.3%), Cleaning & Maintenance (149 | 3.0%), Healthcare Support (102 | 2.0%), and Security & Protection (40 | 0.8%).
Services Occupations by Sex
Within the Services occupations in Orangeburg, the most male-oriented occupations are Security & Protection (72.5%), Firefighting & Prevention (72.5%), and Cleaning & Maintenance (60.4%), while the most female-oriented occupations are Healthcare Support (100.0%), Food Preparation & Serving (80.8%), and Personal Care & Service (53.6%).
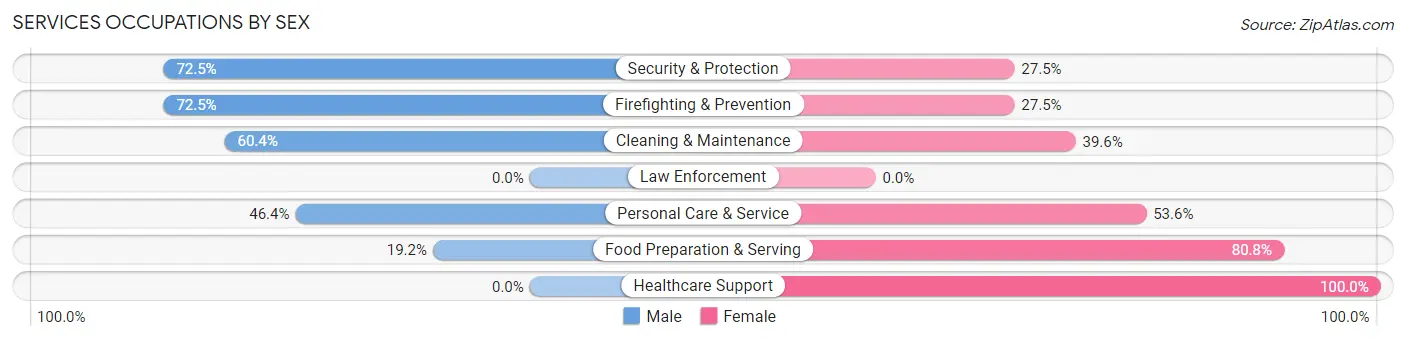
| Occupation | Male | Female |
| Healthcare Support | 0 (0.0%) | 102 (100.0%) |
| Security & Protection | 29 (72.5%) | 11 (27.5%) |
| Firefighting & Prevention | 29 (72.5%) | 11 (27.5%) |
| Law Enforcement | 0 (0.0%) | 0 (0.0%) |
| Food Preparation & Serving | 60 (19.2%) | 253 (80.8%) |
| Cleaning & Maintenance | 90 (60.4%) | 59 (39.6%) |
| Personal Care & Service | 219 (46.4%) | 253 (53.6%) |
| Total (Category) | 398 (37.0%) | 678 (63.0%) |
| Total (Overall) | 2,399 (48.0%) | 2,601 (52.0%) |
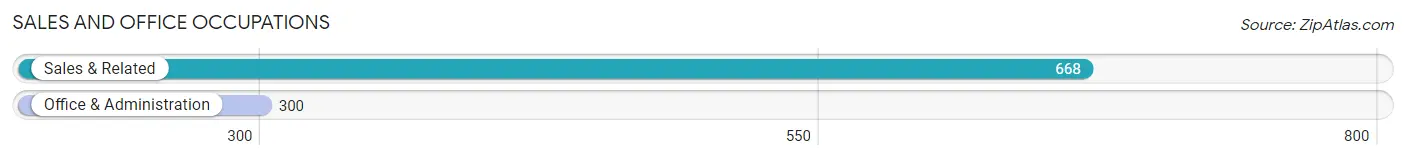
Sales and Office Occupations
The most common Sales and Office occupations in Orangeburg are Sales & Related (668 | 13.4%), and Office & Administration (300 | 6.0%).
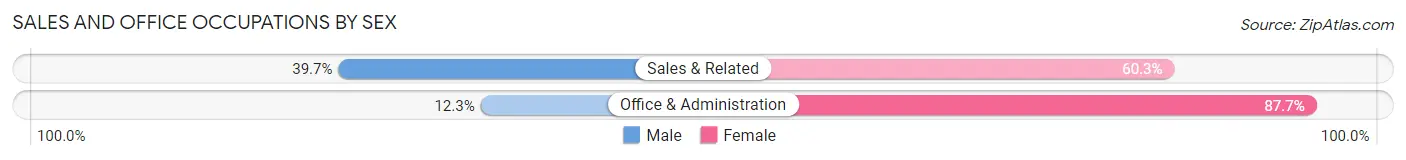
Sales and Office Occupations by Sex
| Occupation | Male | Female |
| Sales & Related | 265 (39.7%) | 403 (60.3%) |
| Office & Administration | 37 (12.3%) | 263 (87.7%) |
| Total (Category) | 302 (31.2%) | 666 (68.8%) |
| Total (Overall) | 2,399 (48.0%) | 2,601 (52.0%) |
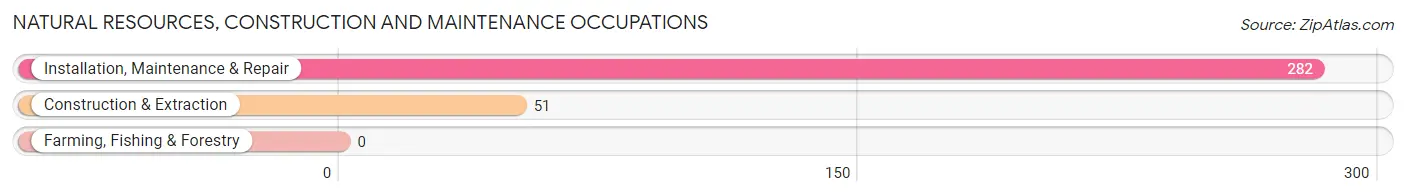
Natural Resources, Construction and Maintenance Occupations
The most common Natural Resources, Construction and Maintenance occupations in Orangeburg are Installation, Maintenance & Repair (282 | 5.6%), and Construction & Extraction (51 | 1.0%).
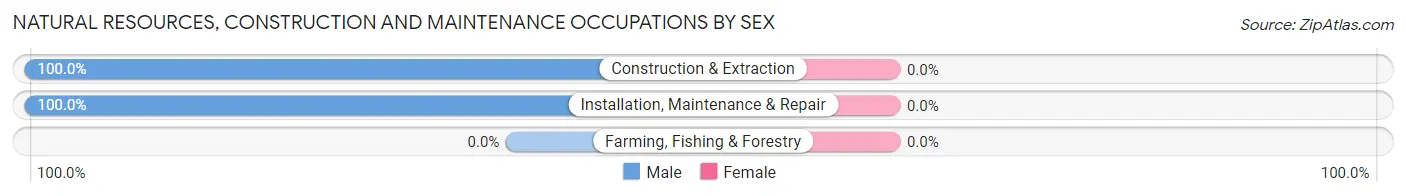
Natural Resources, Construction and Maintenance Occupations by Sex
| Occupation | Male | Female |
| Farming, Fishing & Forestry | 0 (0.0%) | 0 (0.0%) |
| Construction & Extraction | 51 (100.0%) | 0 (0.0%) |
| Installation, Maintenance & Repair | 282 (100.0%) | 0 (0.0%) |
| Total (Category) | 333 (100.0%) | 0 (0.0%) |
| Total (Overall) | 2,399 (48.0%) | 2,601 (52.0%) |
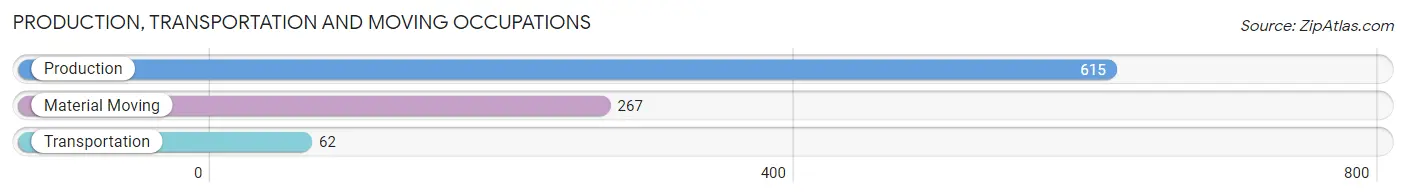
Production, Transportation and Moving Occupations
The most common Production, Transportation and Moving occupations in Orangeburg are Production (615 | 12.3%), Material Moving (267 | 5.3%), and Transportation (62 | 1.2%).
Production, Transportation and Moving Occupations by Sex
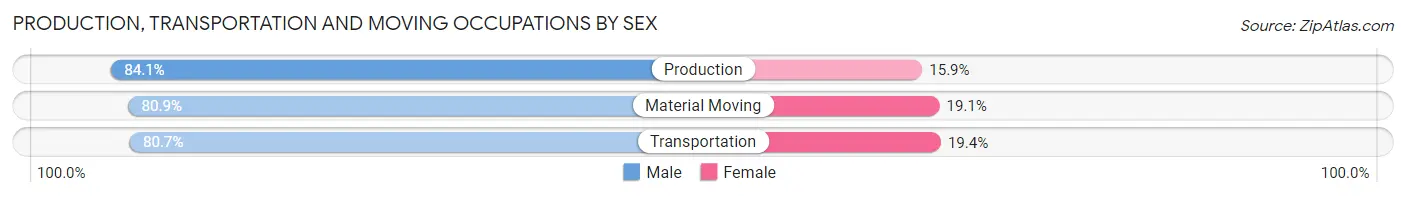
| Occupation | Male | Female |
| Production | 517 (84.1%) | 98 (15.9%) |
| Transportation | 50 (80.6%) | 12 (19.4%) |
| Material Moving | 216 (80.9%) | 51 (19.1%) |
| Total (Category) | 783 (82.9%) | 161 (17.1%) |
| Total (Overall) | 2,399 (48.0%) | 2,601 (52.0%) |
Employment Industries by Sex in Orangeburg
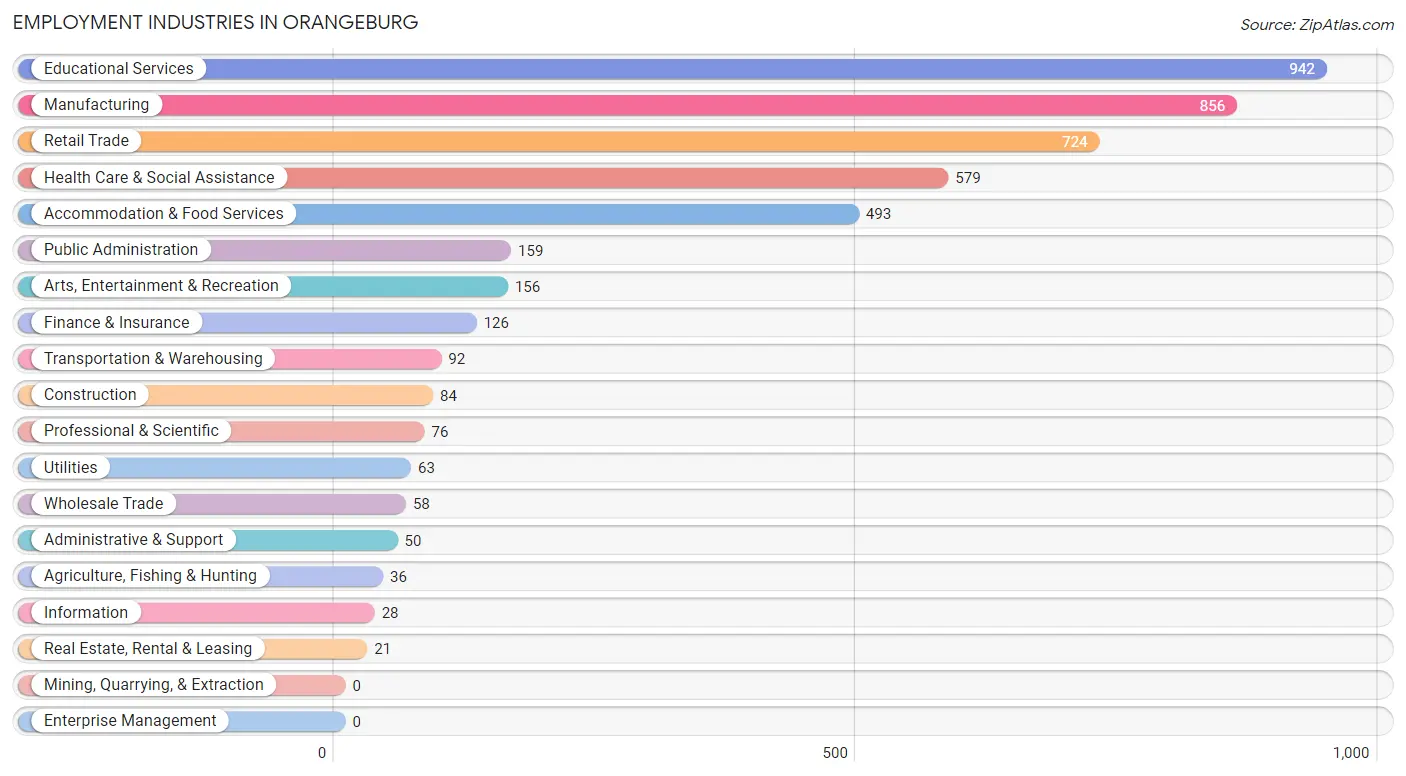
Employment Industries in Orangeburg
The major employment industries in Orangeburg include Educational Services (942 | 18.8%), Manufacturing (856 | 17.1%), Retail Trade (724 | 14.5%), Health Care & Social Assistance (579 | 11.6%), and Accommodation & Food Services (493 | 9.9%).
Employment Industries by Sex in Orangeburg
The Orangeburg industries that see more men than women are Agriculture, Fishing & Hunting (100.0%), Construction (100.0%), and Information (100.0%), whereas the industries that tend to have a higher number of women are Accommodation & Food Services (80.9%), Health Care & Social Assistance (77.7%), and Utilities (69.8%).
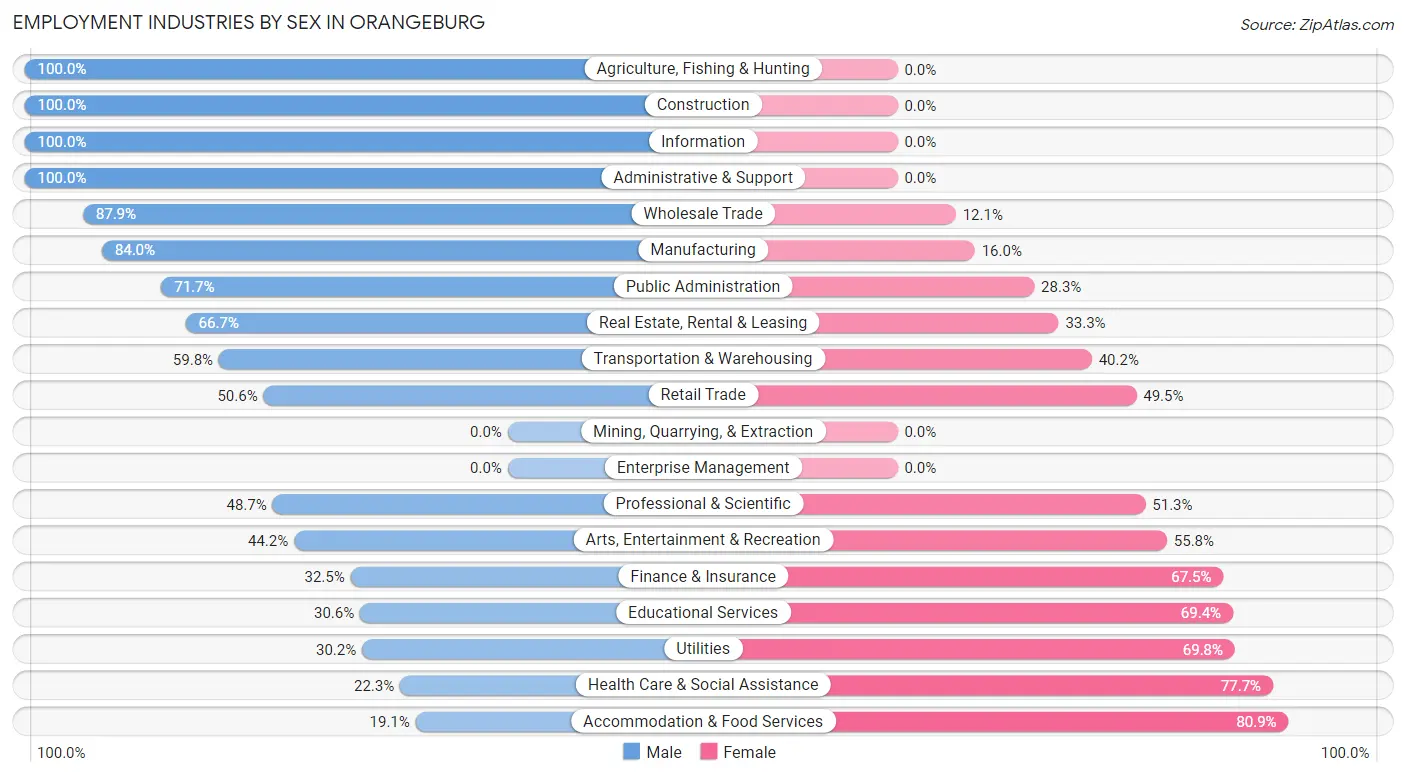
| Industry | Male | Female |
| Agriculture, Fishing & Hunting | 36 (100.0%) | 0 (0.0%) |
| Mining, Quarrying, & Extraction | 0 (0.0%) | 0 (0.0%) |
| Construction | 84 (100.0%) | 0 (0.0%) |
| Manufacturing | 719 (84.0%) | 137 (16.0%) |
| Wholesale Trade | 51 (87.9%) | 7 (12.1%) |
| Retail Trade | 366 (50.5%) | 358 (49.4%) |
| Transportation & Warehousing | 55 (59.8%) | 37 (40.2%) |
| Utilities | 19 (30.2%) | 44 (69.8%) |
| Information | 28 (100.0%) | 0 (0.0%) |
| Finance & Insurance | 41 (32.5%) | 85 (67.5%) |
| Real Estate, Rental & Leasing | 14 (66.7%) | 7 (33.3%) |
| Professional & Scientific | 37 (48.7%) | 39 (51.3%) |
| Enterprise Management | 0 (0.0%) | 0 (0.0%) |
| Administrative & Support | 50 (100.0%) | 0 (0.0%) |
| Educational Services | 288 (30.6%) | 654 (69.4%) |
| Health Care & Social Assistance | 129 (22.3%) | 450 (77.7%) |
| Arts, Entertainment & Recreation | 69 (44.2%) | 87 (55.8%) |
| Accommodation & Food Services | 94 (19.1%) | 399 (80.9%) |
| Public Administration | 114 (71.7%) | 45 (28.3%) |
| Total | 2,399 (48.0%) | 2,601 (52.0%) |
Education in Orangeburg
School Enrollment in Orangeburg
The most common levels of schooling among the 4,177 students in Orangeburg are college / undergraduate (2,607 | 62.4%), elementary school (565 | 13.5%), and middle school (510 | 12.2%).
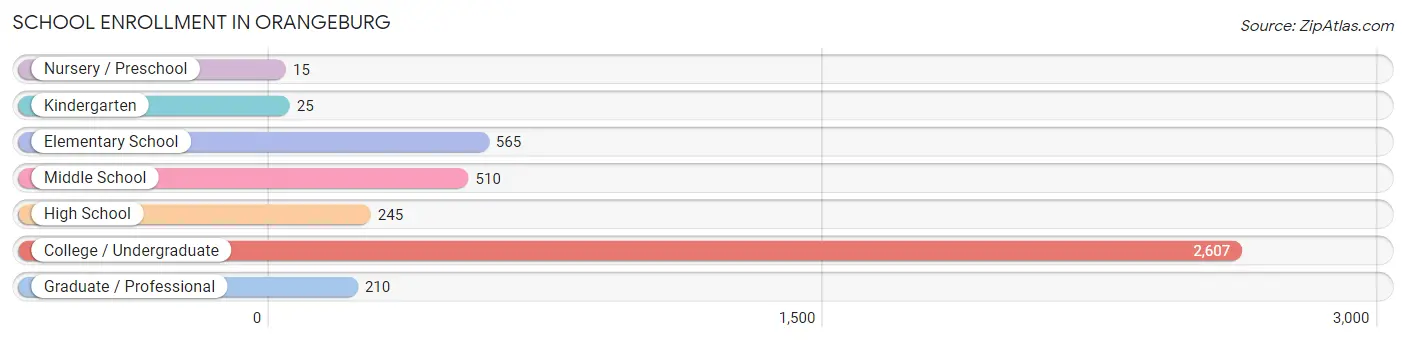
| School Level | # Students | % Students |
| Nursery / Preschool | 15 | 0.4% |
| Kindergarten | 25 | 0.6% |
| Elementary School | 565 | 13.5% |
| Middle School | 510 | 12.2% |
| High School | 245 | 5.9% |
| College / Undergraduate | 2,607 | 62.4% |
| Graduate / Professional | 210 | 5.0% |
| Total | 4,177 | 100.0% |
School Enrollment by Age by Funding Source in Orangeburg
Out of a total of 4,177 students who are enrolled in schools in Orangeburg, 1,345 (32.2%) attend a private institution, while the remaining 2,832 (67.8%) are enrolled in public schools. The age group of 35 years and over has the highest likelihood of being enrolled in private schools, with 96 (81.4% in the age bracket) enrolled. Conversely, the age group of 3 to 4 year olds has the lowest likelihood of being enrolled in a private school, with 25 (100.0% in the age bracket) attending a public institution.
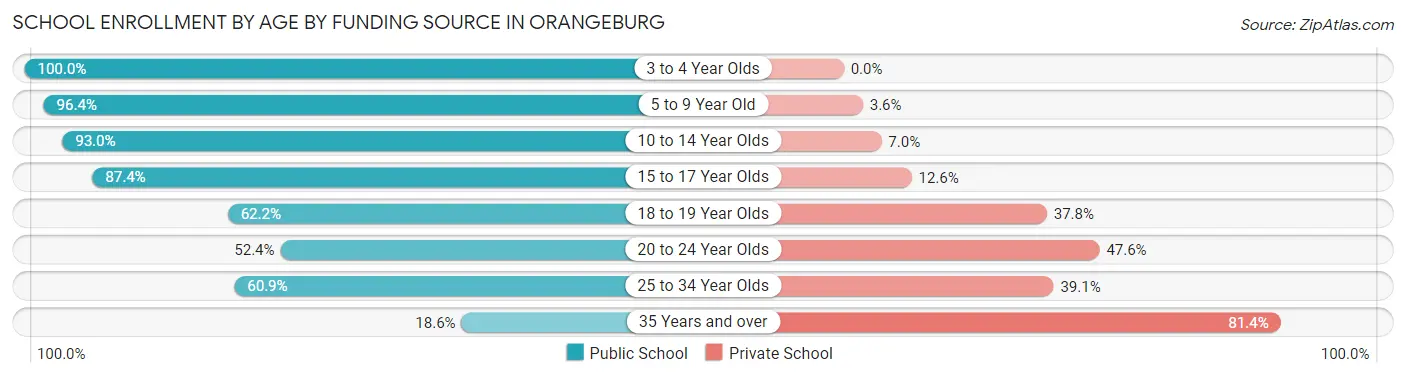
| Age Bracket | Public School | Private School |
| 3 to 4 Year Olds | 25 (100.0%) | 0 (0.0%) |
| 5 to 9 Year Old | 514 (96.4%) | 19 (3.6%) |
| 10 to 14 Year Olds | 582 (93.0%) | 44 (7.0%) |
| 15 to 17 Year Olds | 152 (87.4%) | 22 (12.6%) |
| 18 to 19 Year Olds | 718 (62.2%) | 437 (37.8%) |
| 20 to 24 Year Olds | 764 (52.4%) | 695 (47.6%) |
| 25 to 34 Year Olds | 53 (60.9%) | 34 (39.1%) |
| 35 Years and over | 22 (18.6%) | 96 (81.4%) |
| Total | 2,832 (67.8%) | 1,345 (32.2%) |
Educational Attainment by Field of Study in Orangeburg
Education (773 | 31.3%), business (421 | 17.0%), science & technology (241 | 9.8%), arts & humanities (162 | 6.6%), and visual & performing arts (159 | 6.4%) are the most common fields of study among 2,473 individuals in Orangeburg who have obtained a bachelor's degree or higher.
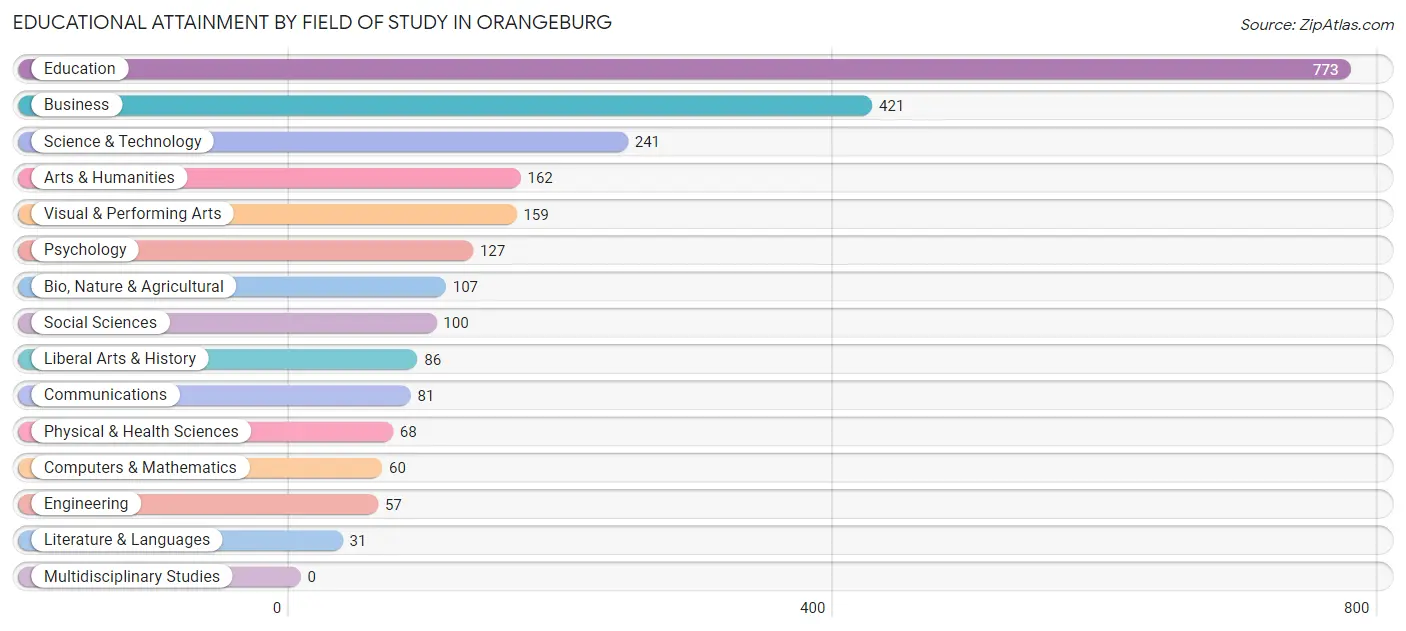
| Field of Study | # Graduates | % Graduates |
| Computers & Mathematics | 60 | 2.4% |
| Bio, Nature & Agricultural | 107 | 4.3% |
| Physical & Health Sciences | 68 | 2.8% |
| Psychology | 127 | 5.1% |
| Social Sciences | 100 | 4.0% |
| Engineering | 57 | 2.3% |
| Multidisciplinary Studies | 0 | 0.0% |
| Science & Technology | 241 | 9.8% |
| Business | 421 | 17.0% |
| Education | 773 | 31.3% |
| Literature & Languages | 31 | 1.3% |
| Liberal Arts & History | 86 | 3.5% |
| Visual & Performing Arts | 159 | 6.4% |
| Communications | 81 | 3.3% |
| Arts & Humanities | 162 | 6.6% |
| Total | 2,473 | 100.0% |
Transportation & Commute in Orangeburg
Vehicle Availability by Sex in Orangeburg
The most prevalent vehicle ownership categories in Orangeburg are males with 2 vehicles (696, accounting for 34.8%) and females with 2 vehicles (850, making up 32.9%).
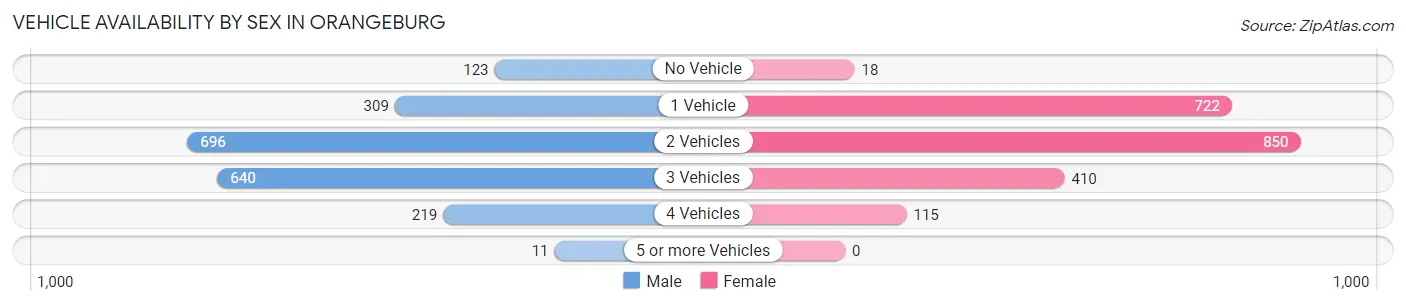
| Vehicles Available | Male | Female |
| No Vehicle | 123 (6.2%) | 18 (0.9%) |
| 1 Vehicle | 309 (15.5%) | 722 (34.1%) |
| 2 Vehicles | 696 (34.8%) | 850 (40.2%) |
| 3 Vehicles | 640 (32.0%) | 410 (19.4%) |
| 4 Vehicles | 219 (11.0%) | 115 (5.4%) |
| 5 or more Vehicles | 11 (0.5%) | 0 (0.0%) |
| Total | 1,998 (100.0%) | 2,115 (100.0%) |
Commute Time in Orangeburg
The most frequently occuring commute durations in Orangeburg are 10 to 14 minutes (1,121 commuters, 25.4%), 5 to 9 minutes (841 commuters, 19.0%), and 15 to 19 minutes (758 commuters, 17.2%).
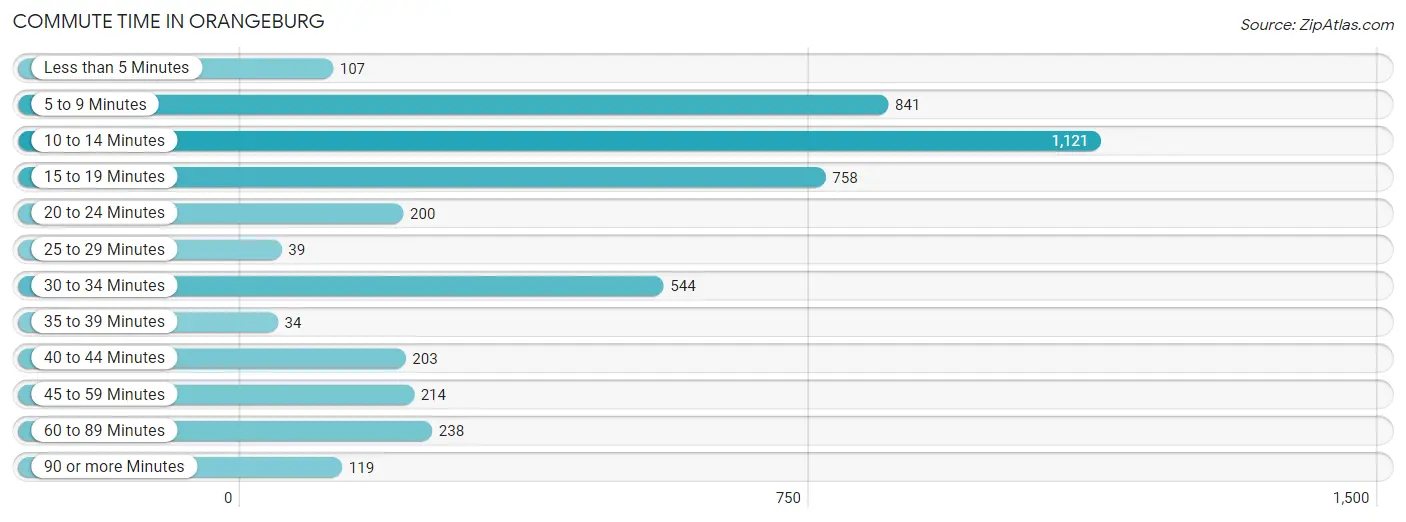
| Commute Time | # Commuters | % Commuters |
| Less than 5 Minutes | 107 | 2.4% |
| 5 to 9 Minutes | 841 | 19.0% |
| 10 to 14 Minutes | 1,121 | 25.4% |
| 15 to 19 Minutes | 758 | 17.2% |
| 20 to 24 Minutes | 200 | 4.5% |
| 25 to 29 Minutes | 39 | 0.9% |
| 30 to 34 Minutes | 544 | 12.3% |
| 35 to 39 Minutes | 34 | 0.8% |
| 40 to 44 Minutes | 203 | 4.6% |
| 45 to 59 Minutes | 214 | 4.8% |
| 60 to 89 Minutes | 238 | 5.4% |
| 90 or more Minutes | 119 | 2.7% |
Commute Time by Sex in Orangeburg
The most common commute times in Orangeburg are 5 to 9 minutes (474 commuters, 21.5%) for males and 10 to 14 minutes (698 commuters, 31.5%) for females.
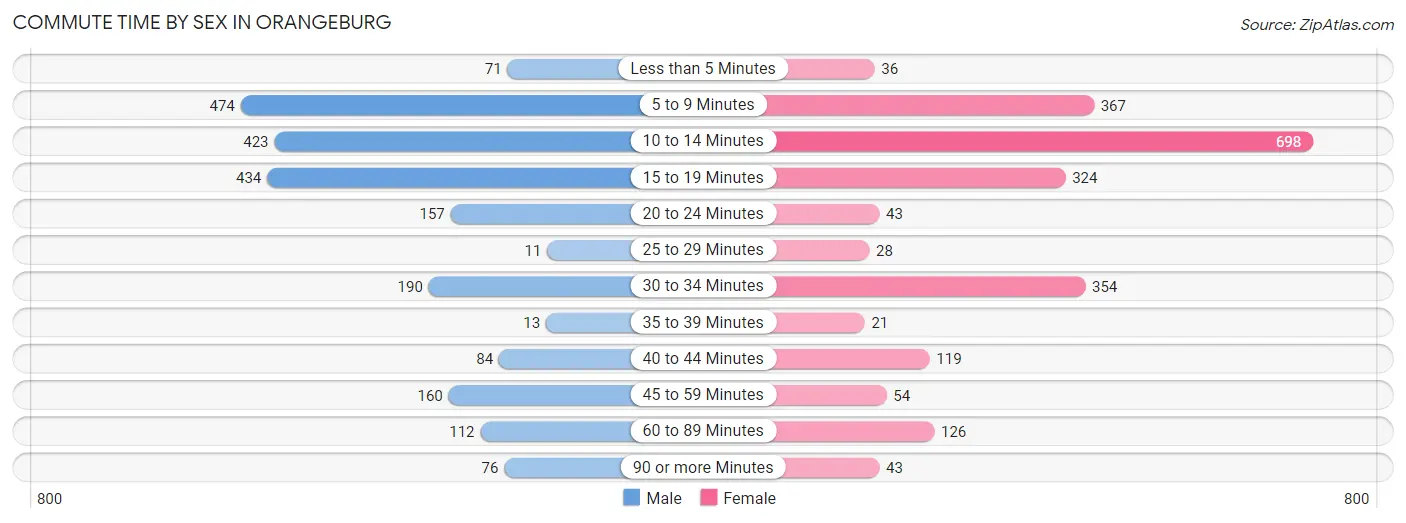
| Commute Time | Male | Female |
| Less than 5 Minutes | 71 (3.2%) | 36 (1.6%) |
| 5 to 9 Minutes | 474 (21.5%) | 367 (16.6%) |
| 10 to 14 Minutes | 423 (19.2%) | 698 (31.5%) |
| 15 to 19 Minutes | 434 (19.7%) | 324 (14.6%) |
| 20 to 24 Minutes | 157 (7.1%) | 43 (1.9%) |
| 25 to 29 Minutes | 11 (0.5%) | 28 (1.3%) |
| 30 to 34 Minutes | 190 (8.6%) | 354 (16.0%) |
| 35 to 39 Minutes | 13 (0.6%) | 21 (0.9%) |
| 40 to 44 Minutes | 84 (3.8%) | 119 (5.4%) |
| 45 to 59 Minutes | 160 (7.3%) | 54 (2.4%) |
| 60 to 89 Minutes | 112 (5.1%) | 126 (5.7%) |
| 90 or more Minutes | 76 (3.5%) | 43 (1.9%) |
Time of Departure to Work by Sex in Orangeburg
The most frequent times of departure to work in Orangeburg are 6:30 AM to 6:59 AM (301, 13.7%) for males and 7:00 AM to 7:29 AM (414, 18.7%) for females.
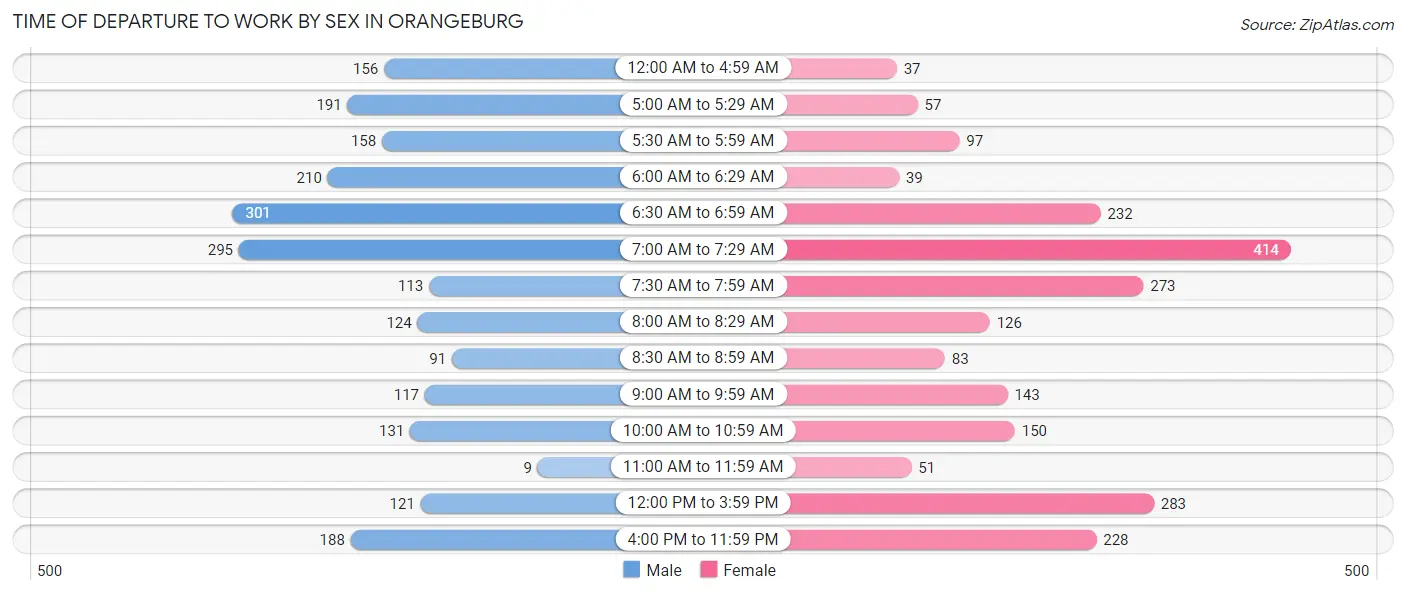
| Time of Departure | Male | Female |
| 12:00 AM to 4:59 AM | 156 (7.1%) | 37 (1.7%) |
| 5:00 AM to 5:29 AM | 191 (8.7%) | 57 (2.6%) |
| 5:30 AM to 5:59 AM | 158 (7.2%) | 97 (4.4%) |
| 6:00 AM to 6:29 AM | 210 (9.5%) | 39 (1.8%) |
| 6:30 AM to 6:59 AM | 301 (13.7%) | 232 (10.5%) |
| 7:00 AM to 7:29 AM | 295 (13.4%) | 414 (18.7%) |
| 7:30 AM to 7:59 AM | 113 (5.1%) | 273 (12.3%) |
| 8:00 AM to 8:29 AM | 124 (5.6%) | 126 (5.7%) |
| 8:30 AM to 8:59 AM | 91 (4.1%) | 83 (3.7%) |
| 9:00 AM to 9:59 AM | 117 (5.3%) | 143 (6.5%) |
| 10:00 AM to 10:59 AM | 131 (5.9%) | 150 (6.8%) |
| 11:00 AM to 11:59 AM | 9 (0.4%) | 51 (2.3%) |
| 12:00 PM to 3:59 PM | 121 (5.5%) | 283 (12.8%) |
| 4:00 PM to 11:59 PM | 188 (8.5%) | 228 (10.3%) |
| Total | 2,205 (100.0%) | 2,213 (100.0%) |
Housing Occupancy in Orangeburg
Occupancy by Ownership in Orangeburg
Of the total 4,978 dwellings in Orangeburg, owner-occupied units account for 2,259 (45.4%), while renter-occupied units make up 2,719 (54.6%).
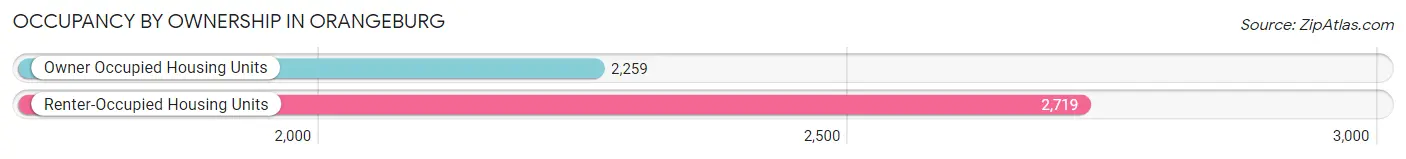
| Occupancy | # Housing Units | % Housing Units |
| Owner Occupied Housing Units | 2,259 | 45.4% |
| Renter-Occupied Housing Units | 2,719 | 54.6% |
| Total Occupied Housing Units | 4,978 | 100.0% |
Occupancy by Household Size in Orangeburg
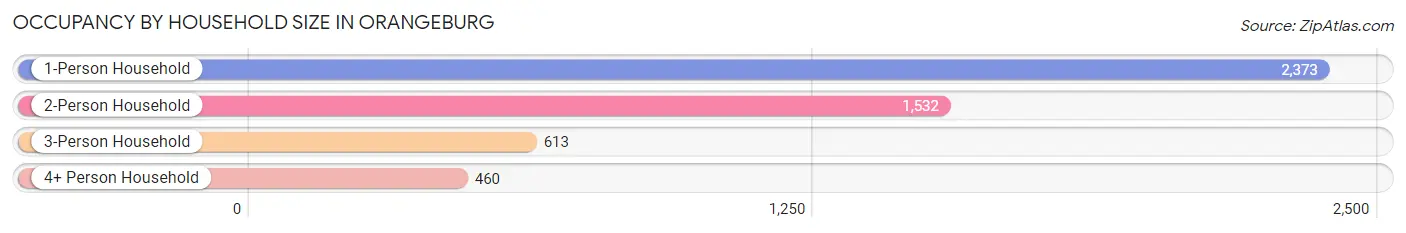
| Household Size | # Housing Units | % Housing Units |
| 1-Person Household | 2,373 | 47.7% |
| 2-Person Household | 1,532 | 30.8% |
| 3-Person Household | 613 | 12.3% |
| 4+ Person Household | 460 | 9.2% |
| Total Housing Units | 4,978 | 100.0% |
Occupancy by Ownership by Household Size in Orangeburg
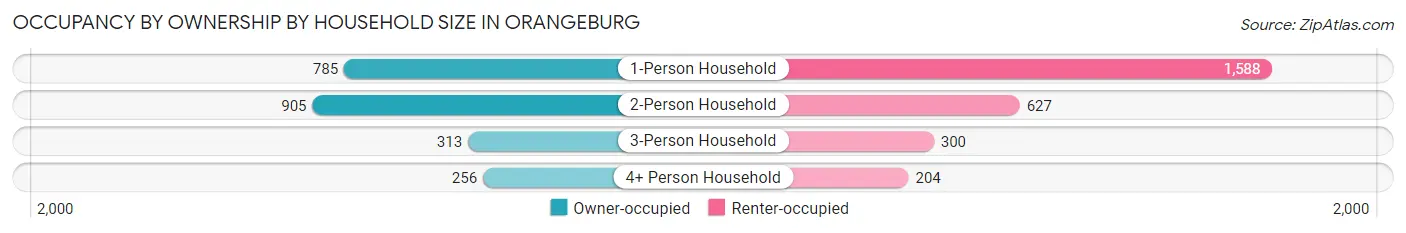
| Household Size | Owner-occupied | Renter-occupied |
| 1-Person Household | 785 (33.1%) | 1,588 (66.9%) |
| 2-Person Household | 905 (59.1%) | 627 (40.9%) |
| 3-Person Household | 313 (51.1%) | 300 (48.9%) |
| 4+ Person Household | 256 (55.6%) | 204 (44.4%) |
| Total Housing Units | 2,259 (45.4%) | 2,719 (54.6%) |
Occupancy by Educational Attainment in Orangeburg
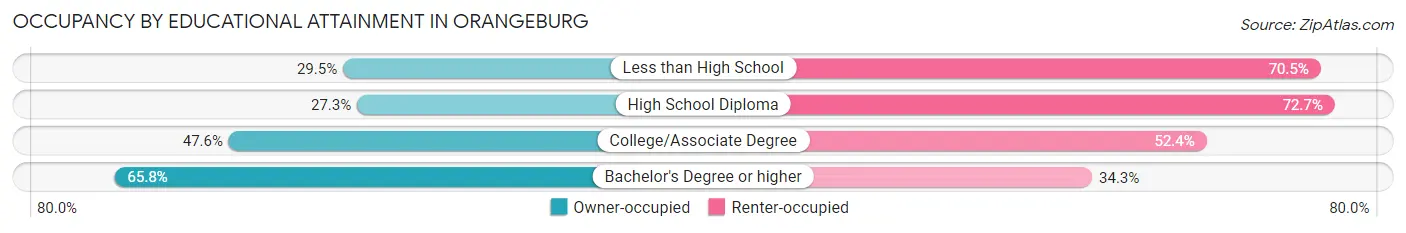
| Household Size | Owner-occupied | Renter-occupied |
| Less than High School | 195 (29.5%) | 466 (70.5%) |
| High School Diploma | 342 (27.3%) | 912 (72.7%) |
| College/Associate Degree | 766 (47.6%) | 843 (52.4%) |
| Bachelor's Degree or higher | 956 (65.7%) | 498 (34.3%) |
Occupancy by Age of Householder in Orangeburg
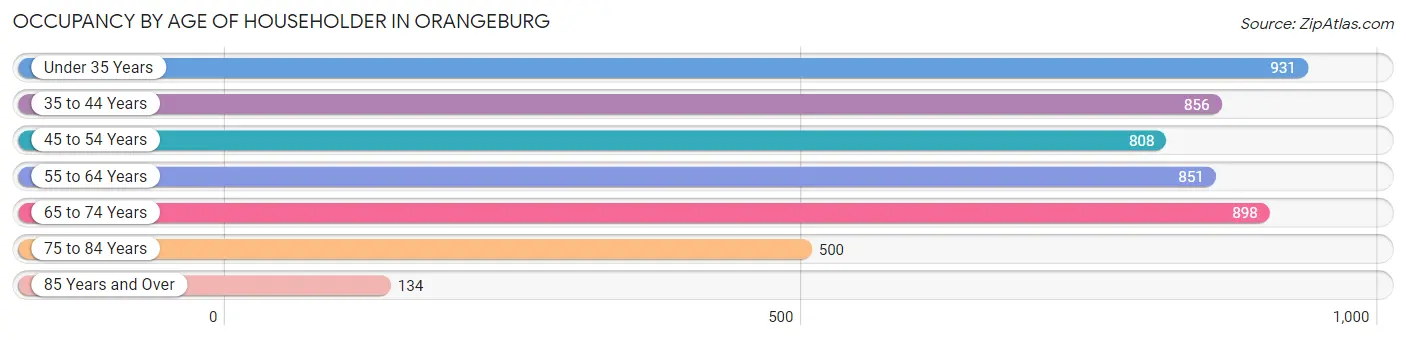
| Age Bracket | # Households | % Households |
| Under 35 Years | 931 | 18.7% |
| 35 to 44 Years | 856 | 17.2% |
| 45 to 54 Years | 808 | 16.2% |
| 55 to 64 Years | 851 | 17.1% |
| 65 to 74 Years | 898 | 18.0% |
| 75 to 84 Years | 500 | 10.0% |
| 85 Years and Over | 134 | 2.7% |
| Total | 4,978 | 100.0% |
Housing Finances in Orangeburg
Median Income by Occupancy in Orangeburg
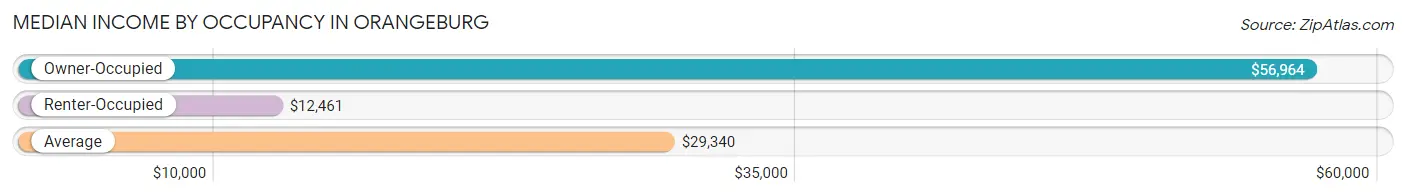
| Occupancy Type | # Households | Median Income |
| Owner-Occupied | 2,259 (45.4%) | $56,964 |
| Renter-Occupied | 2,719 (54.6%) | $12,461 |
| Average | 4,978 (100.0%) | $29,340 |
Occupancy by Householder Income Bracket in Orangeburg
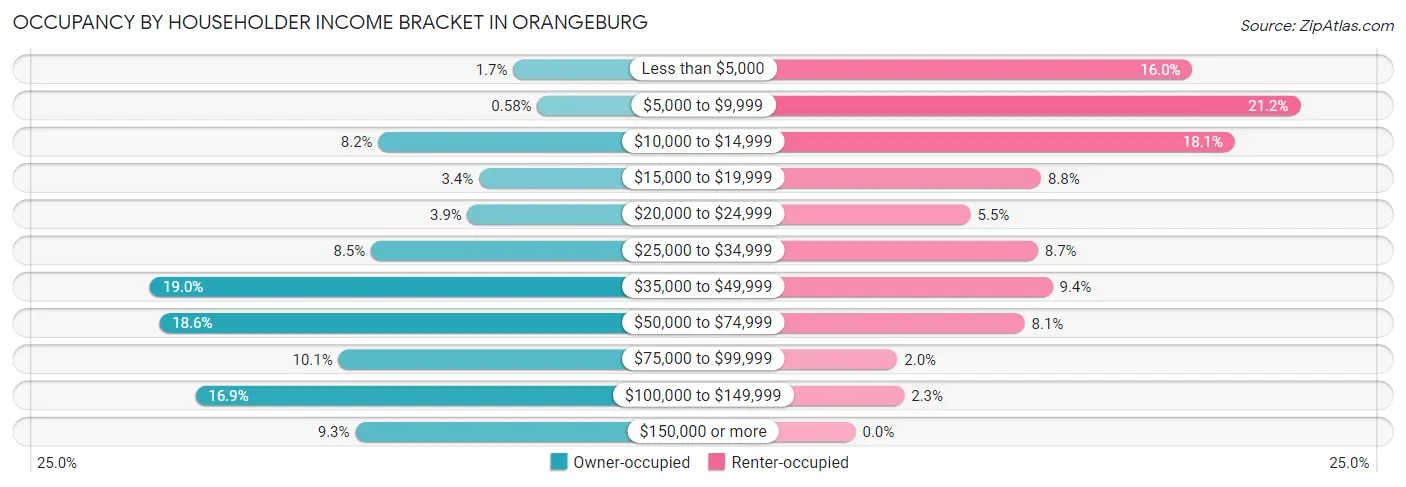
| Income Bracket | Owner-occupied | Renter-occupied |
| Less than $5,000 | 39 (1.7%) | 436 (16.0%) |
| $5,000 to $9,999 | 13 (0.6%) | 576 (21.2%) |
| $10,000 to $14,999 | 184 (8.2%) | 491 (18.1%) |
| $15,000 to $19,999 | 76 (3.4%) | 240 (8.8%) |
| $20,000 to $24,999 | 88 (3.9%) | 149 (5.5%) |
| $25,000 to $34,999 | 192 (8.5%) | 236 (8.7%) |
| $35,000 to $49,999 | 430 (19.0%) | 255 (9.4%) |
| $50,000 to $74,999 | 420 (18.6%) | 219 (8.1%) |
| $75,000 to $99,999 | 227 (10.1%) | 54 (2.0%) |
| $100,000 to $149,999 | 381 (16.9%) | 63 (2.3%) |
| $150,000 or more | 209 (9.2%) | 0 (0.0%) |
| Total | 2,259 (100.0%) | 2,719 (100.0%) |
Monthly Housing Cost Tiers in Orangeburg
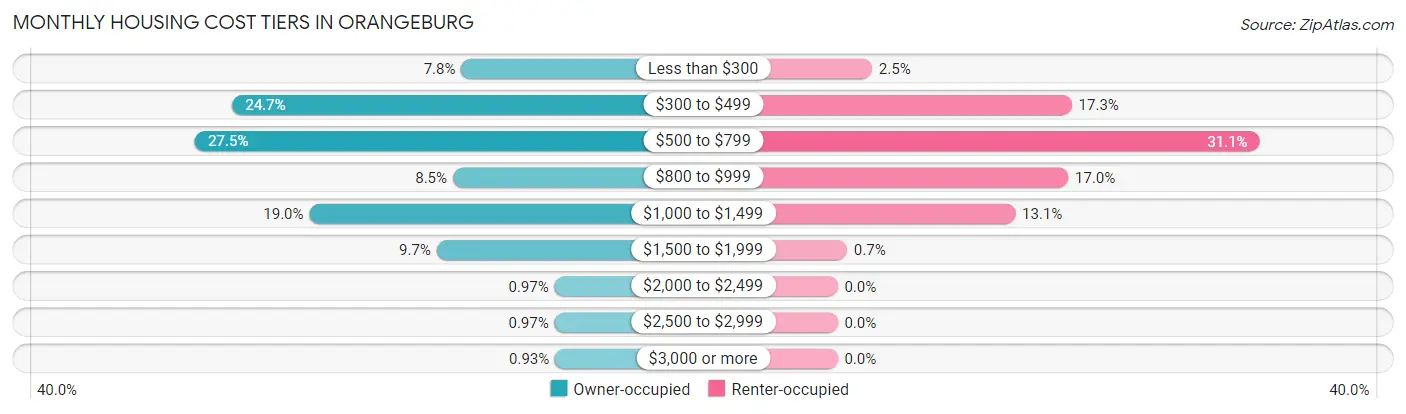
| Monthly Cost | Owner-occupied | Renter-occupied |
| Less than $300 | 177 (7.8%) | 69 (2.5%) |
| $300 to $499 | 558 (24.7%) | 469 (17.2%) |
| $500 to $799 | 620 (27.5%) | 845 (31.1%) |
| $800 to $999 | 191 (8.5%) | 462 (17.0%) |
| $1,000 to $1,499 | 430 (19.0%) | 356 (13.1%) |
| $1,500 to $1,999 | 218 (9.7%) | 19 (0.7%) |
| $2,000 to $2,499 | 22 (1.0%) | 0 (0.0%) |
| $2,500 to $2,999 | 22 (1.0%) | 0 (0.0%) |
| $3,000 or more | 21 (0.9%) | 0 (0.0%) |
| Total | 2,259 (100.0%) | 2,719 (100.0%) |
Physical Housing Characteristics in Orangeburg
Housing Structures in Orangeburg
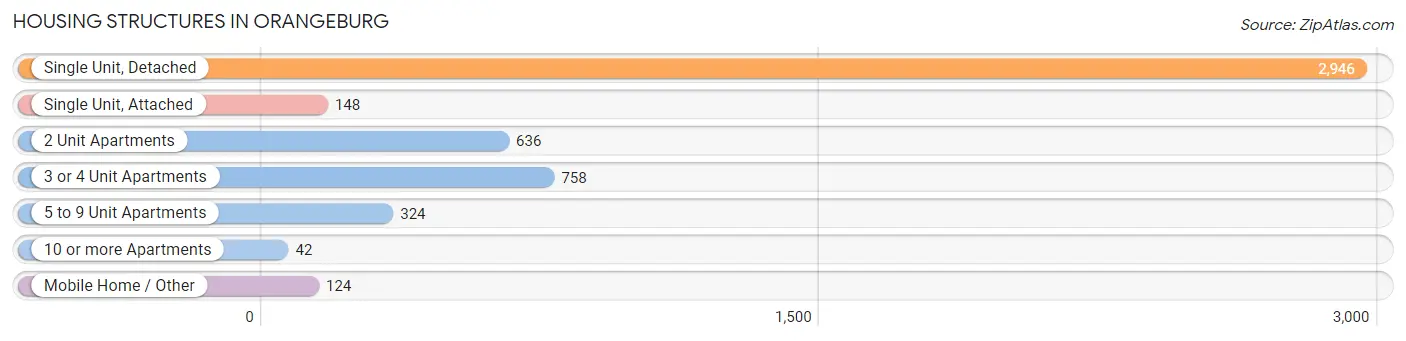
| Structure Type | # Housing Units | % Housing Units |
| Single Unit, Detached | 2,946 | 59.2% |
| Single Unit, Attached | 148 | 3.0% |
| 2 Unit Apartments | 636 | 12.8% |
| 3 or 4 Unit Apartments | 758 | 15.2% |
| 5 to 9 Unit Apartments | 324 | 6.5% |
| 10 or more Apartments | 42 | 0.8% |
| Mobile Home / Other | 124 | 2.5% |
| Total | 4,978 | 100.0% |
Housing Structures by Occupancy in Orangeburg
| Structure Type | Owner-occupied | Renter-occupied |
| Single Unit, Detached | 2,163 (73.4%) | 783 (26.6%) |
| Single Unit, Attached | 28 (18.9%) | 120 (81.1%) |
| 2 Unit Apartments | 0 (0.0%) | 636 (100.0%) |
| 3 or 4 Unit Apartments | 0 (0.0%) | 758 (100.0%) |
| 5 to 9 Unit Apartments | 26 (8.0%) | 298 (92.0%) |
| 10 or more Apartments | 0 (0.0%) | 42 (100.0%) |
| Mobile Home / Other | 42 (33.9%) | 82 (66.1%) |
| Total | 2,259 (45.4%) | 2,719 (54.6%) |
Housing Structures by Number of Rooms in Orangeburg
| Number of Rooms | Owner-occupied | Renter-occupied |
| 1 Room | 0 (0.0%) | 48 (1.8%) |
| 2 or 3 Rooms | 61 (2.7%) | 899 (33.1%) |
| 4 or 5 Rooms | 633 (28.0%) | 1,374 (50.5%) |
| 6 or 7 Rooms | 1,138 (50.4%) | 207 (7.6%) |
| 8 or more Rooms | 427 (18.9%) | 191 (7.0%) |
| Total | 2,259 (100.0%) | 2,719 (100.0%) |
Housing Structure by Heating Type in Orangeburg
| Heating Type | Owner-occupied | Renter-occupied |
| Utility Gas | 622 (27.5%) | 268 (9.9%) |
| Bottled, Tank, or LP Gas | 48 (2.1%) | 17 (0.6%) |
| Electricity | 1,574 (69.7%) | 2,373 (87.3%) |
| Fuel Oil or Kerosene | 0 (0.0%) | 0 (0.0%) |
| Coal or Coke | 0 (0.0%) | 0 (0.0%) |
| All other Fuels | 0 (0.0%) | 44 (1.6%) |
| No Fuel Used | 15 (0.7%) | 17 (0.6%) |
| Total | 2,259 (100.0%) | 2,719 (100.0%) |
Household Vehicle Usage in Orangeburg
| Vehicles per Household | Owner-occupied | Renter-occupied |
| No Vehicle | 65 (2.9%) | 657 (24.2%) |
| 1 Vehicle | 797 (35.3%) | 1,241 (45.6%) |
| 2 Vehicles | 806 (35.7%) | 547 (20.1%) |
| 3 or more Vehicles | 591 (26.2%) | 274 (10.1%) |
| Total | 2,259 (100.0%) | 2,719 (100.0%) |
Real Estate & Mortgages in Orangeburg
Real Estate and Mortgage Overview in Orangeburg
| Characteristic | Without Mortgage | With Mortgage |
| Housing Units | 1,253 | 1,006 |
| Median Property Value | $122,600 | $147,100 |
| Median Household Income | $58,221 | $123 |
| Monthly Housing Costs | $451 | $21 |
| Real Estate Taxes | $912 | $59 |
Property Value by Mortgage Status in Orangeburg
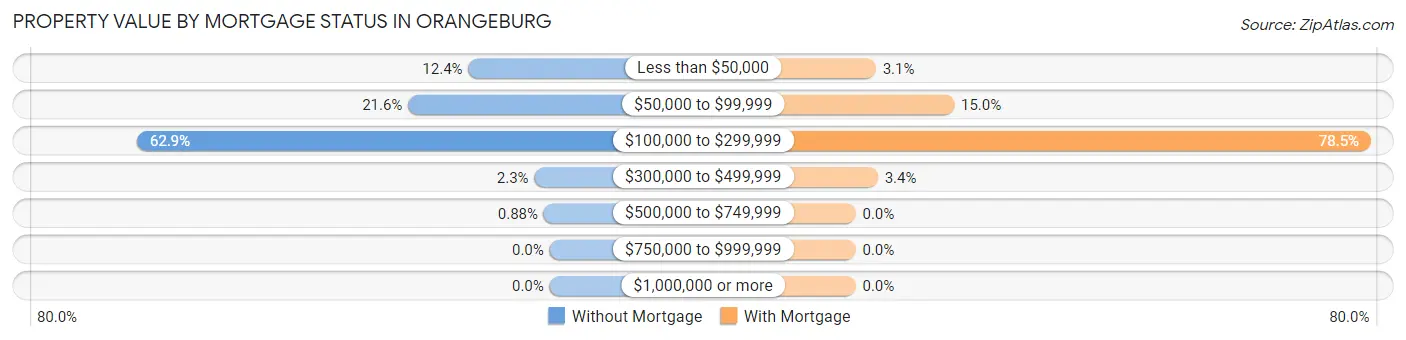
| Property Value | Without Mortgage | With Mortgage |
| Less than $50,000 | 155 (12.4%) | 31 (3.1%) |
| $50,000 to $99,999 | 270 (21.5%) | 151 (15.0%) |
| $100,000 to $299,999 | 788 (62.9%) | 790 (78.5%) |
| $300,000 to $499,999 | 29 (2.3%) | 34 (3.4%) |
| $500,000 to $749,999 | 11 (0.9%) | 0 (0.0%) |
| $750,000 to $999,999 | 0 (0.0%) | 0 (0.0%) |
| $1,000,000 or more | 0 (0.0%) | 0 (0.0%) |
| Total | 1,253 (100.0%) | 1,006 (100.0%) |
Household Income by Mortgage Status in Orangeburg
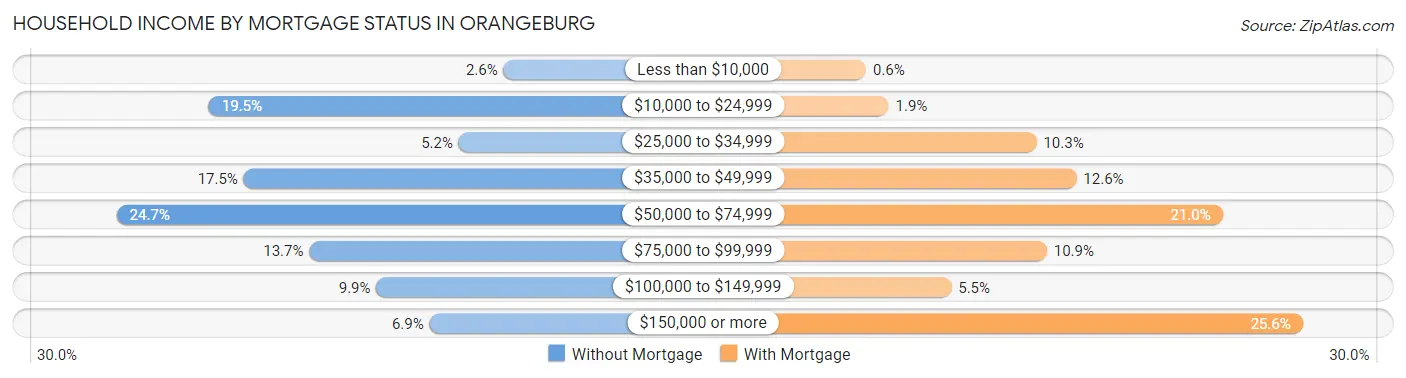
| Household Income | Without Mortgage | With Mortgage |
| Less than $10,000 | 33 (2.6%) | 6 (0.6%) |
| $10,000 to $24,999 | 244 (19.5%) | 19 (1.9%) |
| $25,000 to $34,999 | 65 (5.2%) | 104 (10.3%) |
| $35,000 to $49,999 | 219 (17.5%) | 127 (12.6%) |
| $50,000 to $74,999 | 310 (24.7%) | 211 (21.0%) |
| $75,000 to $99,999 | 172 (13.7%) | 110 (10.9%) |
| $100,000 to $149,999 | 124 (9.9%) | 55 (5.5%) |
| $150,000 or more | 86 (6.9%) | 257 (25.6%) |
| Total | 1,253 (100.0%) | 1,006 (100.0%) |
Property Value to Household Income Ratio in Orangeburg
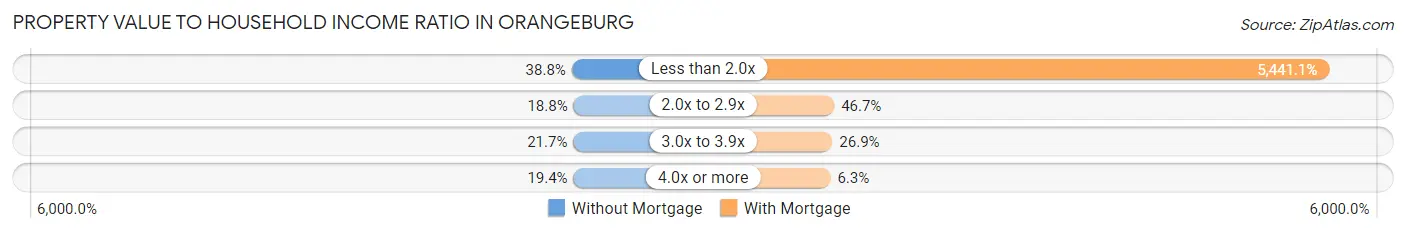
| Value-to-Income Ratio | Without Mortgage | With Mortgage |
| Less than 2.0x | 486 (38.8%) | 54,737 (5,441.0%) |
| 2.0x to 2.9x | 235 (18.8%) | 470 (46.7%) |
| 3.0x to 3.9x | 272 (21.7%) | 271 (26.9%) |
| 4.0x or more | 243 (19.4%) | 63 (6.3%) |
| Total | 1,253 (100.0%) | 1,006 (100.0%) |
Real Estate Taxes by Mortgage Status in Orangeburg
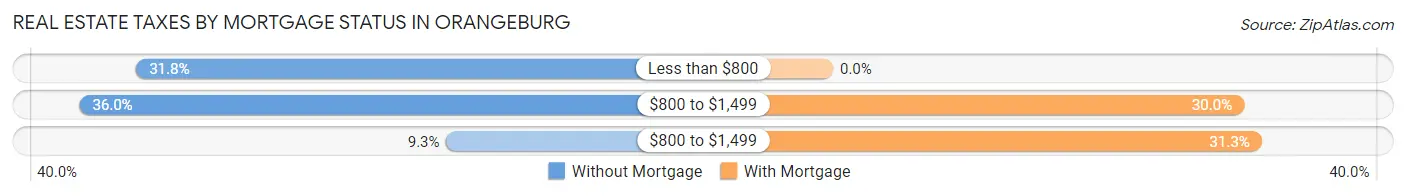
| Property Taxes | Without Mortgage | With Mortgage |
| Less than $800 | 399 (31.8%) | 0 (0.0%) |
| $800 to $1,499 | 451 (36.0%) | 302 (30.0%) |
| $800 to $1,499 | 116 (9.3%) | 315 (31.3%) |
| Total | 1,253 (100.0%) | 1,006 (100.0%) |
Health & Disability in Orangeburg
Health Insurance Coverage by Age in Orangeburg
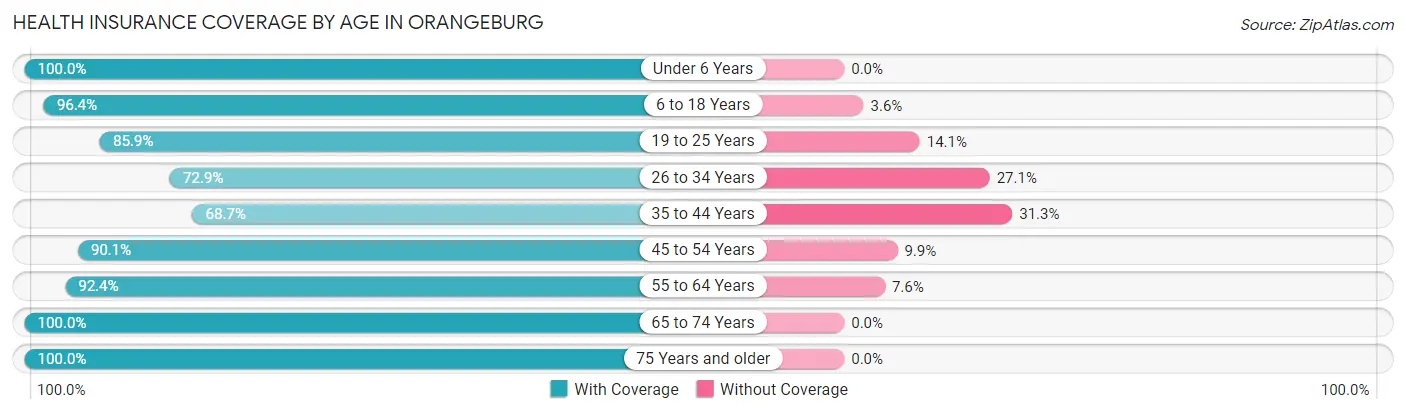
| Age Bracket | With Coverage | Without Coverage |
| Under 6 Years | 530 (100.0%) | 0 (0.0%) |
| 6 to 18 Years | 1,689 (96.4%) | 63 (3.6%) |
| 19 to 25 Years | 2,392 (85.9%) | 392 (14.1%) |
| 26 to 34 Years | 930 (72.9%) | 346 (27.1%) |
| 35 to 44 Years | 892 (68.7%) | 407 (31.3%) |
| 45 to 54 Years | 1,198 (90.1%) | 132 (9.9%) |
| 55 to 64 Years | 1,339 (92.4%) | 110 (7.6%) |
| 65 to 74 Years | 1,281 (100.0%) | 0 (0.0%) |
| 75 Years and older | 923 (100.0%) | 0 (0.0%) |
| Total | 11,174 (88.5%) | 1,450 (11.5%) |
Health Insurance Coverage by Citizenship Status in Orangeburg
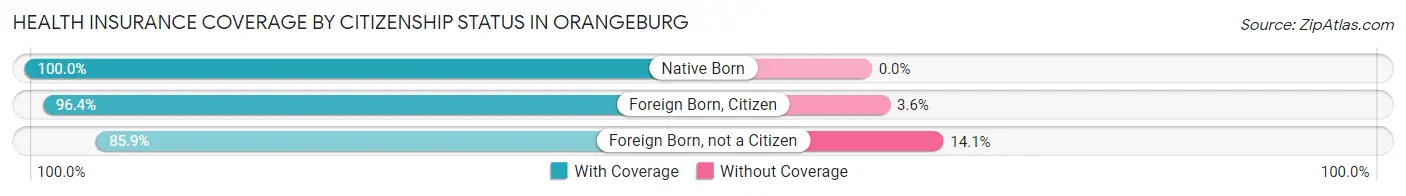
| Citizenship Status | With Coverage | Without Coverage |
| Native Born | 530 (100.0%) | 0 (0.0%) |
| Foreign Born, Citizen | 1,689 (96.4%) | 63 (3.6%) |
| Foreign Born, not a Citizen | 2,392 (85.9%) | 392 (14.1%) |
Health Insurance Coverage by Household Income in Orangeburg
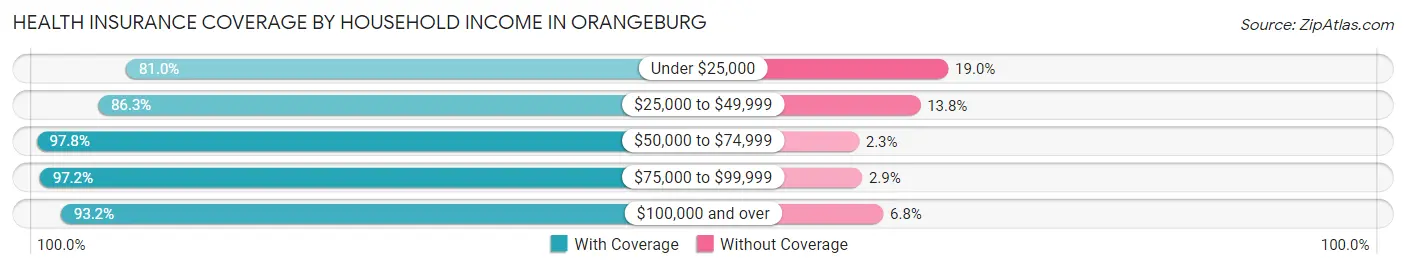
| Household Income | With Coverage | Without Coverage |
| Under $25,000 | 3,062 (81.0%) | 718 (19.0%) |
| $25,000 to $49,999 | 1,593 (86.3%) | 254 (13.8%) |
| $50,000 to $74,999 | 1,520 (97.8%) | 35 (2.2%) |
| $75,000 to $99,999 | 1,125 (97.2%) | 33 (2.9%) |
| $100,000 and over | 1,877 (93.2%) | 137 (6.8%) |
Public vs Private Health Insurance Coverage by Age in Orangeburg
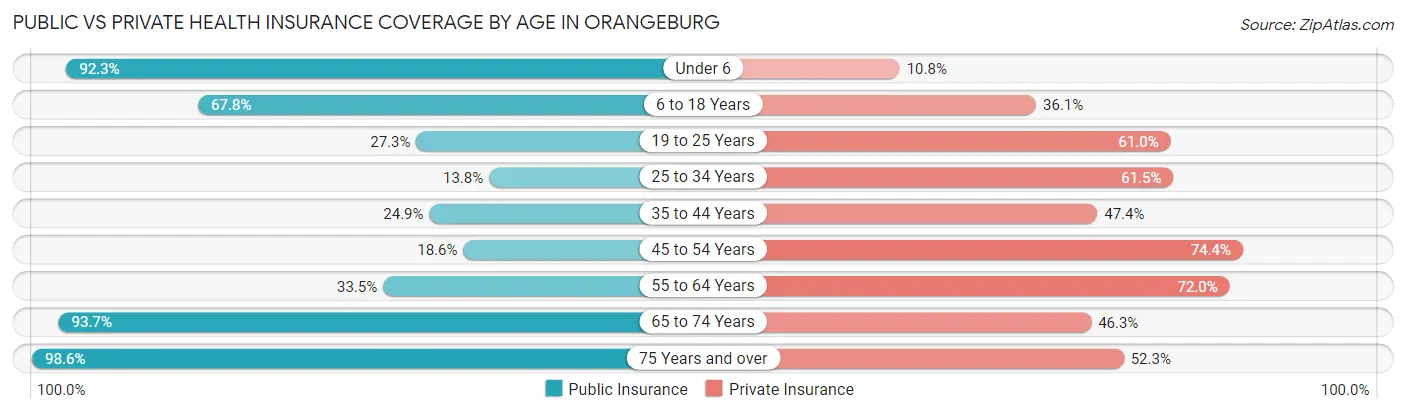
| Age Bracket | Public Insurance | Private Insurance |
| Under 6 | 489 (92.3%) | 57 (10.7%) |
| 6 to 18 Years | 1,188 (67.8%) | 632 (36.1%) |
| 19 to 25 Years | 760 (27.3%) | 1,699 (61.0%) |
| 25 to 34 Years | 176 (13.8%) | 785 (61.5%) |
| 35 to 44 Years | 323 (24.9%) | 616 (47.4%) |
| 45 to 54 Years | 247 (18.6%) | 990 (74.4%) |
| 55 to 64 Years | 485 (33.5%) | 1,043 (72.0%) |
| 65 to 74 Years | 1,200 (93.7%) | 593 (46.3%) |
| 75 Years and over | 910 (98.6%) | 483 (52.3%) |
| Total | 5,778 (45.8%) | 6,898 (54.6%) |
Disability Status by Sex by Age in Orangeburg
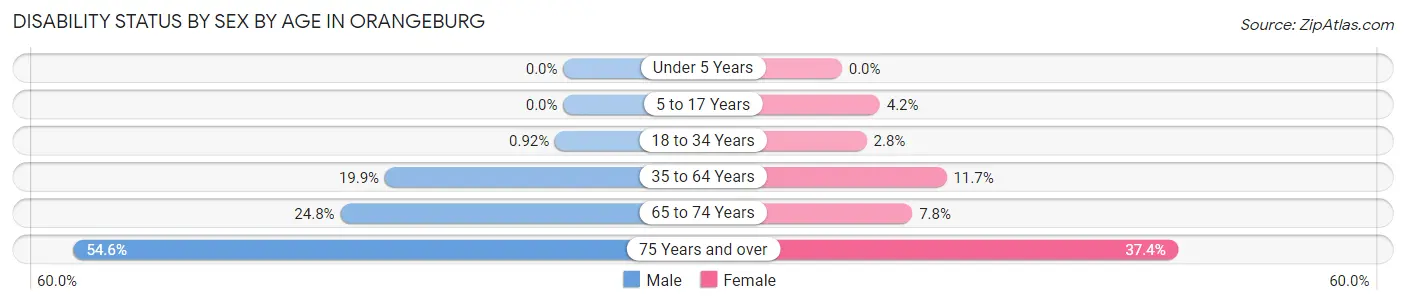
| Age Bracket | Male | Female |
| Under 5 Years | 0 (0.0%) | 0 (0.0%) |
| 5 to 17 Years | 0 (0.0%) | 29 (4.2%) |
| 18 to 34 Years | 20 (0.9%) | 63 (2.8%) |
| 35 to 64 Years | 381 (19.9%) | 252 (11.7%) |
| 65 to 74 Years | 147 (24.8%) | 54 (7.8%) |
| 75 Years and over | 216 (54.5%) | 197 (37.4%) |
Disability Class by Sex by Age in Orangeburg
Disability Class: Hearing Difficulty
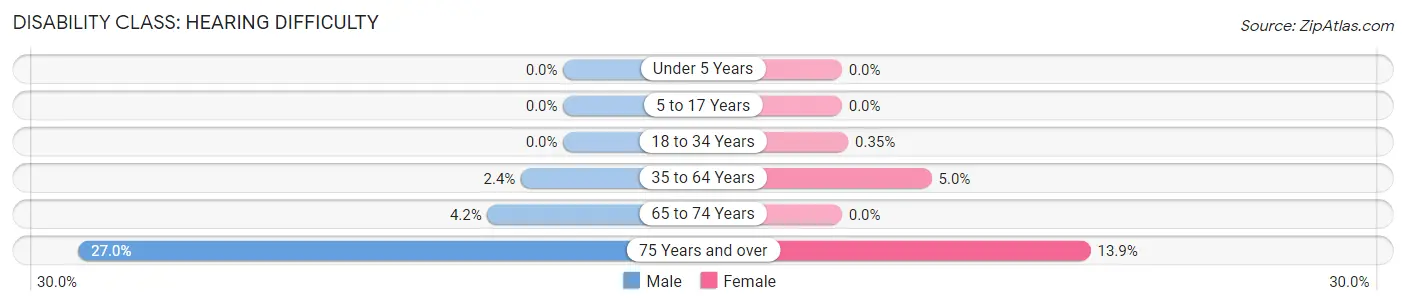
| Age Bracket | Male | Female |
| Under 5 Years | 0 (0.0%) | 0 (0.0%) |
| 5 to 17 Years | 0 (0.0%) | 0 (0.0%) |
| 18 to 34 Years | 0 (0.0%) | 8 (0.4%) |
| 35 to 64 Years | 45 (2.4%) | 108 (5.0%) |
| 65 to 74 Years | 25 (4.2%) | 0 (0.0%) |
| 75 Years and over | 107 (27.0%) | 73 (13.9%) |
Disability Class: Vision Difficulty
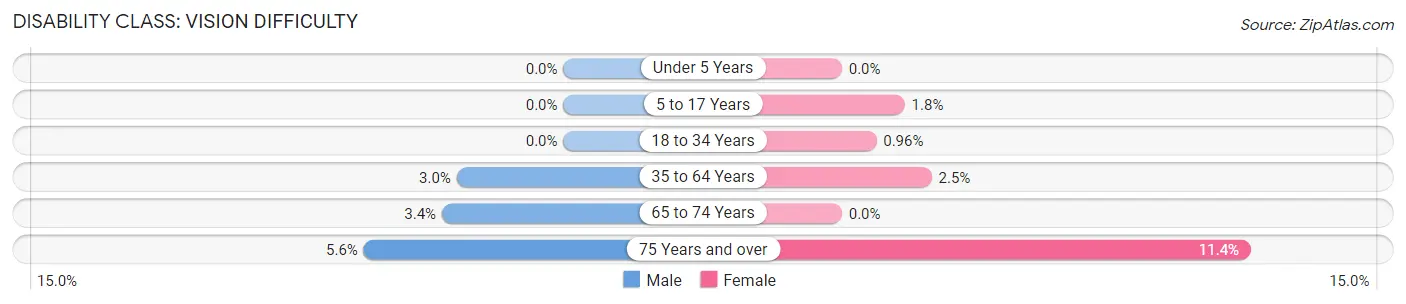
| Age Bracket | Male | Female |
| Under 5 Years | 0 (0.0%) | 0 (0.0%) |
| 5 to 17 Years | 0 (0.0%) | 12 (1.8%) |
| 18 to 34 Years | 0 (0.0%) | 22 (1.0%) |
| 35 to 64 Years | 57 (3.0%) | 54 (2.5%) |
| 65 to 74 Years | 20 (3.4%) | 0 (0.0%) |
| 75 Years and over | 22 (5.6%) | 60 (11.4%) |
Disability Class: Cognitive Difficulty
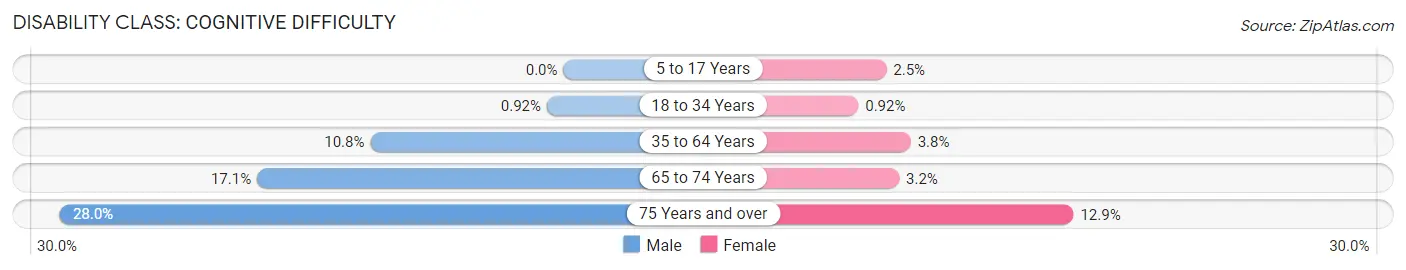
| Age Bracket | Male | Female |
| 5 to 17 Years | 0 (0.0%) | 17 (2.5%) |
| 18 to 34 Years | 20 (0.9%) | 21 (0.9%) |
| 35 to 64 Years | 206 (10.7%) | 83 (3.8%) |
| 65 to 74 Years | 101 (17.1%) | 22 (3.2%) |
| 75 Years and over | 111 (28.0%) | 68 (12.9%) |
Disability Class: Ambulatory Difficulty
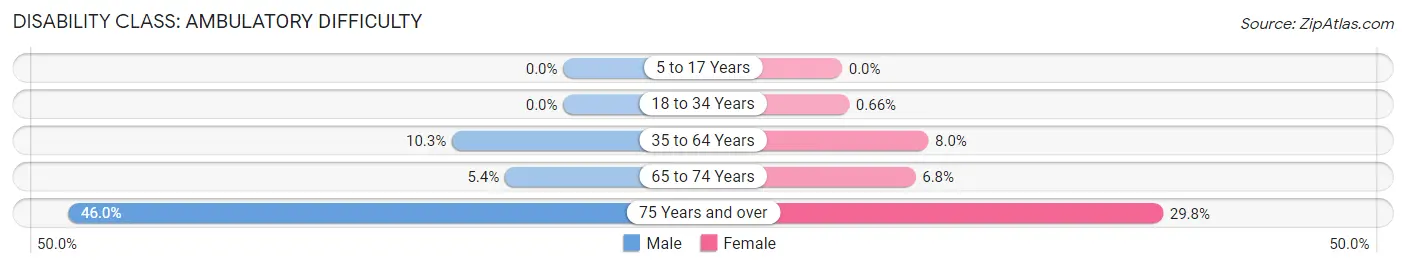
| Age Bracket | Male | Female |
| 5 to 17 Years | 0 (0.0%) | 0 (0.0%) |
| 18 to 34 Years | 0 (0.0%) | 15 (0.7%) |
| 35 to 64 Years | 198 (10.3%) | 173 (8.0%) |
| 65 to 74 Years | 32 (5.4%) | 47 (6.8%) |
| 75 Years and over | 182 (46.0%) | 157 (29.8%) |
Disability Class: Self-Care Difficulty
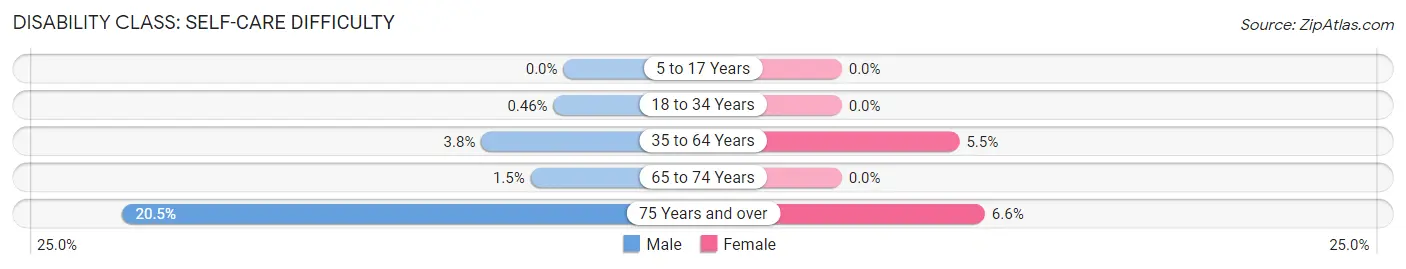
| Age Bracket | Male | Female |
| 5 to 17 Years | 0 (0.0%) | 0 (0.0%) |
| 18 to 34 Years | 10 (0.5%) | 0 (0.0%) |
| 35 to 64 Years | 73 (3.8%) | 118 (5.5%) |
| 65 to 74 Years | 9 (1.5%) | 0 (0.0%) |
| 75 Years and over | 81 (20.4%) | 35 (6.6%) |
Technology Access in Orangeburg
Computing Device Access in Orangeburg
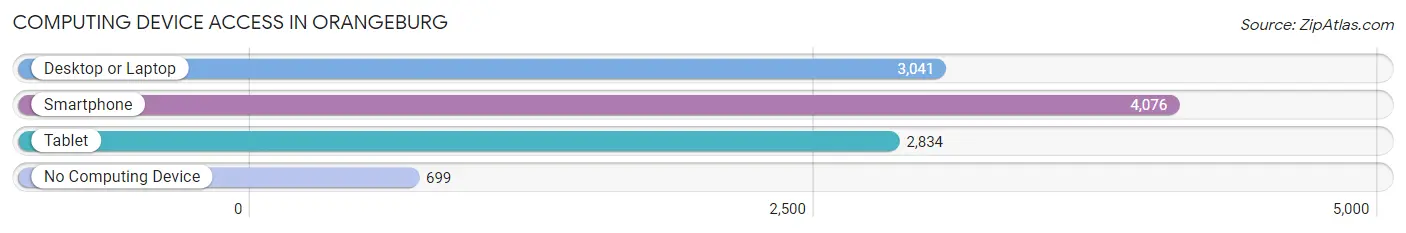
| Device Type | # Households | % Households |
| Desktop or Laptop | 3,041 | 61.1% |
| Smartphone | 4,076 | 81.9% |
| Tablet | 2,834 | 56.9% |
| No Computing Device | 699 | 14.0% |
| Total | 4,978 | 100.0% |
Internet Access in Orangeburg
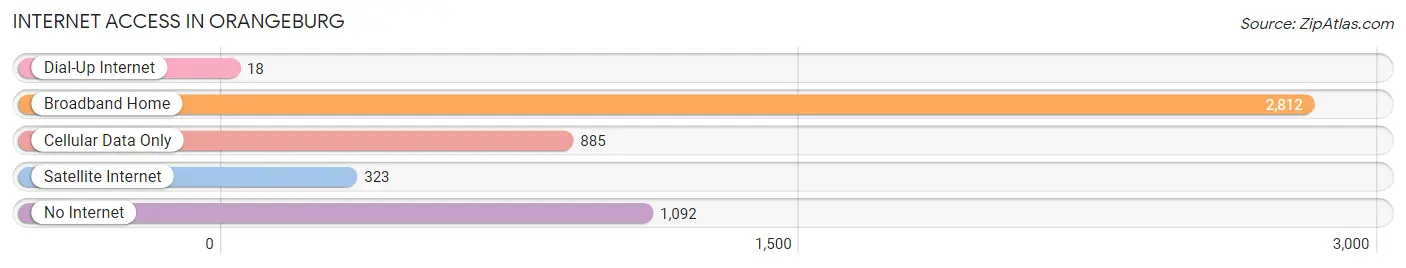
| Internet Type | # Households | % Households |
| Dial-Up Internet | 18 | 0.4% |
| Broadband Home | 2,812 | 56.5% |
| Cellular Data Only | 885 | 17.8% |
| Satellite Internet | 323 | 6.5% |
| No Internet | 1,092 | 21.9% |
| Total | 4,978 | 100.0% |
Orangeburg Summary
History
The area now known as Orangeburg, South Carolina was originally inhabited by the Edisto Indians, a branch of the larger Muscogee tribe. The Edisto Indians were a peaceful people who lived off the land, hunting, fishing, and gathering wild plants. The first European settlers arrived in the area in the early 1700s, and the town of Orangeburg was officially established in 1735. The town was named after William IV, Prince of Orange, who was the Dutch stadtholder at the time.
Orangeburg was an important trading center during the colonial period, and it was the site of several battles during the Revolutionary War. After the war, the town grew rapidly, and by the mid-1800s it was a thriving commercial center. The town was also home to several educational institutions, including Claflin University, the first historically black college in South Carolina.
In the late 1800s, Orangeburg became a major railroad hub, and the town’s economy was further bolstered by the arrival of several large manufacturing companies. The town continued to grow throughout the 20th century, and today it is a vibrant and diverse community.
Geography
Orangeburg is located in the central part of South Carolina, about halfway between Columbia and Charleston. The town is situated on the banks of the Edisto River, and it is surrounded by several small towns and rural communities. The town covers an area of approximately 10 square miles, and it has a population of around 13,000 people.
The terrain around Orangeburg is mostly flat, with some rolling hills in the surrounding area. The climate is humid subtropical, with hot, humid summers and mild winters. The average annual temperature is around 70 degrees Fahrenheit, and the average annual precipitation is around 50 inches.
Economy
Orangeburg’s economy is largely based on manufacturing, healthcare, and education. The town is home to several large manufacturing companies, including Sonoco Products Company, which produces paper and packaging products. Other major employers in the area include Orangeburg Regional Medical Center, Claflin University, and Orangeburg-Calhoun Technical College.
The town also has a thriving retail sector, with several shopping centers and malls. The town is also home to several restaurants, bars, and other entertainment venues.
Demographics
As of the 2010 census, the population of Orangeburg was 13,964. The racial makeup of the town was 57.3% African American, 37.2% White, 1.2% Asian, 0.3% Native American, and 4.0% from other races. The median household income was $30,912, and the median family income was $37,912.
The town is home to several religious denominations, including Baptist, Methodist, Presbyterian, and Catholic. The town also has a large number of public and private schools, including Claflin University, Orangeburg-Calhoun Technical College, and Orangeburg Preparatory School.
Conclusion
Orangeburg, South Carolina is a vibrant and diverse community with a rich history and a strong economy. The town is home to several large manufacturing companies, healthcare facilities, and educational institutions, and it has a thriving retail sector. The town is also home to several religious denominations, and it has a large number of public and private schools. The population of Orangeburg is mostly African American, and the median household income is around $30,912.
Common Questions
What is Per Capita Income in Orangeburg?
Per Capita income in Orangeburg is $19,944.
What is the Median Family Income in Orangeburg?
Median Family Income in Orangeburg is $47,094.
What is the Median Household income in Orangeburg?
Median Household Income in Orangeburg is $29,340.
What is Income or Wage Gap in Orangeburg?
Income or Wage Gap in Orangeburg is 25.7%.
Women in Orangeburg earn 74.3 cents for every dollar earned by a man.
What is Inequality or Gini Index in Orangeburg?
Inequality or Gini Index in Orangeburg is 0.54.
What is the Total Population of Orangeburg?
Total Population of Orangeburg is 13,220.
What is the Total Male Population of Orangeburg?
Total Male Population of Orangeburg is 6,382.
What is the Total Female Population of Orangeburg?
Total Female Population of Orangeburg is 6,838.
What is the Ratio of Males per 100 Females in Orangeburg?
There are 93.33 Males per 100 Females in Orangeburg.
What is the Ratio of Females per 100 Males in Orangeburg?
There are 107.15 Females per 100 Males in Orangeburg.
What is the Median Population Age in Orangeburg?
Median Population Age in Orangeburg is 36.4 Years.
What is the Average Family Size in Orangeburg
Average Family Size in Orangeburg is 3.0 People.
What is the Average Household Size in Orangeburg
Average Household Size in Orangeburg is 2.1 People.
How Large is the Labor Force in Orangeburg?
There are 5,712 People in the Labor Forcein in Orangeburg.
What is the Percentage of People in the Labor Force in Orangeburg?
50.0% of People are in the Labor Force in Orangeburg.
What is the Unemployment Rate in Orangeburg?
Unemployment Rate in Orangeburg is 12.5%.