Timmonsville, SC Map & Demographics
Timmonsville Map
Timmonsville Overview
$18,816
PER CAPITA INCOME
$35,909
AVG FAMILY INCOME
$24,758
AVG HOUSEHOLD INCOME
25.8%
WAGE / INCOME GAP [ % ]
74.2¢/ $1
WAGE / INCOME GAP [ $ ]
0.54
INEQUALITY / GINI INDEX
2,119
TOTAL POPULATION
1,145
MALE POPULATION
974
FEMALE POPULATION
117.56
MALES / 100 FEMALES
85.07
FEMALES / 100 MALES
37.8
MEDIAN AGE
3.3
AVG FAMILY SIZE
2.3
AVG HOUSEHOLD SIZE
933
LABOR FORCE [ PEOPLE ]
54.1%
PERCENT IN LABOR FORCE
7.8%
UNEMPLOYMENT RATE
Timmonsville Zip Codes
Timmonsville Area Codes
Income in Timmonsville
Income Overview in Timmonsville
Per Capita Income in Timmonsville is $18,816, while median incomes of families and households are $35,909 and $24,758 respectively.
| Characteristic | Number | Measure |
| Per Capita Income | 2,119 | $18,816 |
| Median Family Income | 444 | $35,909 |
| Mean Family Income | 444 | $47,536 |
| Median Household Income | 922 | $24,758 |
| Mean Household Income | 922 | $41,261 |
| Income Deficit | 444 | $0 |
| Wage / Income Gap (%) | 2,119 | 25.77% |
| Wage / Income Gap ($) | 2,119 | 74.23¢ per $1 |
| Gini / Inequality Index | 2,119 | 0.54 |
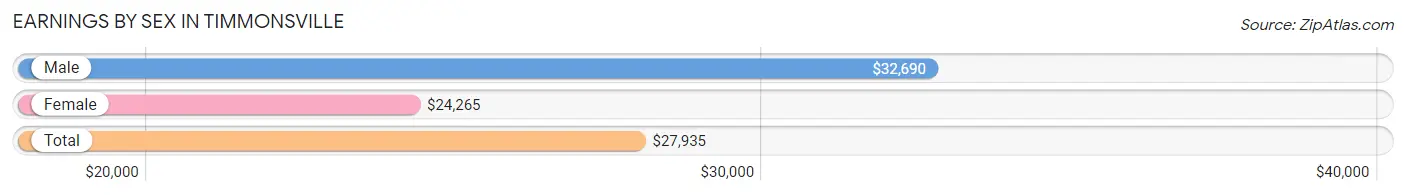
Earnings by Sex in Timmonsville
Average Earnings in Timmonsville are $27,935, $32,690 for men and $24,265 for women, a difference of 25.8%.
| Sex | Number | Average Earnings |
| Male | 502 (54.7%) | $32,690 |
| Female | 416 (45.3%) | $24,265 |
| Total | 918 (100.0%) | $27,935 |
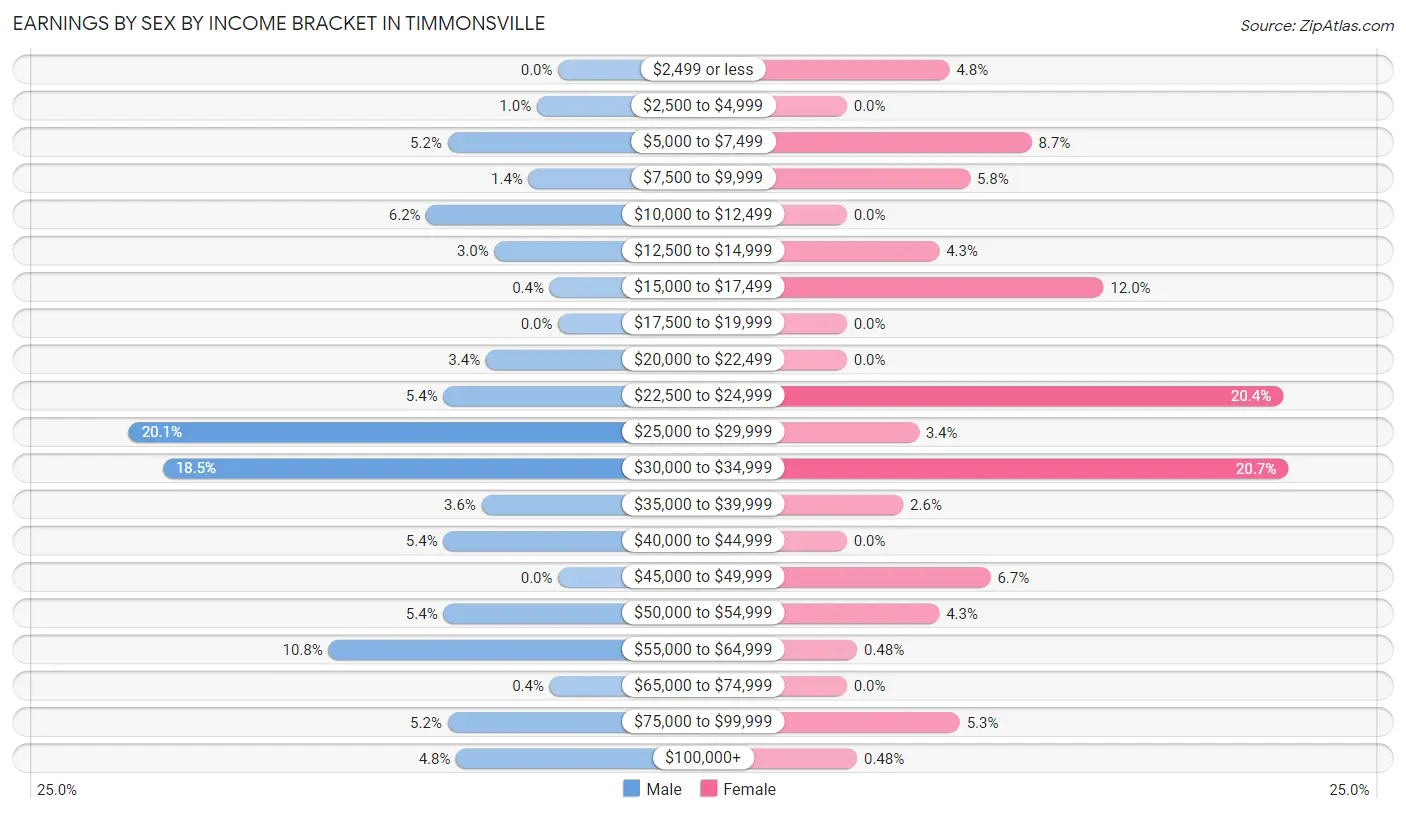
Earnings by Sex by Income Bracket in Timmonsville
The most common earnings brackets in Timmonsville are $25,000 to $29,999 for men (101 | 20.1%) and $30,000 to $34,999 for women (86 | 20.7%).
| Income | Male | Female |
| $2,499 or less | 0 (0.0%) | 20 (4.8%) |
| $2,500 to $4,999 | 5 (1.0%) | 0 (0.0%) |
| $5,000 to $7,499 | 26 (5.2%) | 36 (8.6%) |
| $7,500 to $9,999 | 7 (1.4%) | 24 (5.8%) |
| $10,000 to $12,499 | 31 (6.2%) | 0 (0.0%) |
| $12,500 to $14,999 | 15 (3.0%) | 18 (4.3%) |
| $15,000 to $17,499 | 2 (0.4%) | 50 (12.0%) |
| $17,500 to $19,999 | 0 (0.0%) | 0 (0.0%) |
| $20,000 to $22,499 | 17 (3.4%) | 0 (0.0%) |
| $22,500 to $24,999 | 27 (5.4%) | 85 (20.4%) |
| $25,000 to $29,999 | 101 (20.1%) | 14 (3.4%) |
| $30,000 to $34,999 | 93 (18.5%) | 86 (20.7%) |
| $35,000 to $39,999 | 18 (3.6%) | 11 (2.6%) |
| $40,000 to $44,999 | 27 (5.4%) | 0 (0.0%) |
| $45,000 to $49,999 | 0 (0.0%) | 28 (6.7%) |
| $50,000 to $54,999 | 27 (5.4%) | 18 (4.3%) |
| $55,000 to $64,999 | 54 (10.8%) | 2 (0.5%) |
| $65,000 to $74,999 | 2 (0.4%) | 0 (0.0%) |
| $75,000 to $99,999 | 26 (5.2%) | 22 (5.3%) |
| $100,000+ | 24 (4.8%) | 2 (0.5%) |
| Total | 502 (100.0%) | 416 (100.0%) |
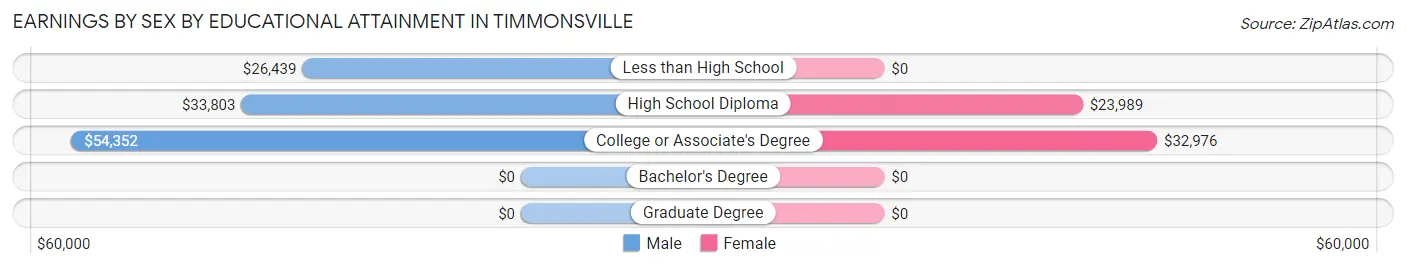
Earnings by Sex by Educational Attainment in Timmonsville
Average earnings in Timmonsville are $33,511 for men and $29,821 for women, a difference of 11.0%. Men with an educational attainment of college or associate's degree enjoy the highest average annual earnings of $54,352, while those with less than high school education earn the least with $26,439. Women with an educational attainment of college or associate's degree earn the most with the average annual earnings of $32,976, while those with high school diploma education have the smallest earnings of $23,989.
| Educational Attainment | Male Income | Female Income |
| Less than High School | $26,439 | $0 |
| High School Diploma | $33,803 | $23,989 |
| College or Associate's Degree | $54,352 | $32,976 |
| Bachelor's Degree | - | - |
| Graduate Degree | - | - |
| Total | $33,511 | $29,821 |
Family Income in Timmonsville
Family Income Brackets in Timmonsville
According to the Timmonsville family income data, there are 103 families falling into the less than $10,000 income range, which is the most common income bracket and makes up 23.2% of all families.
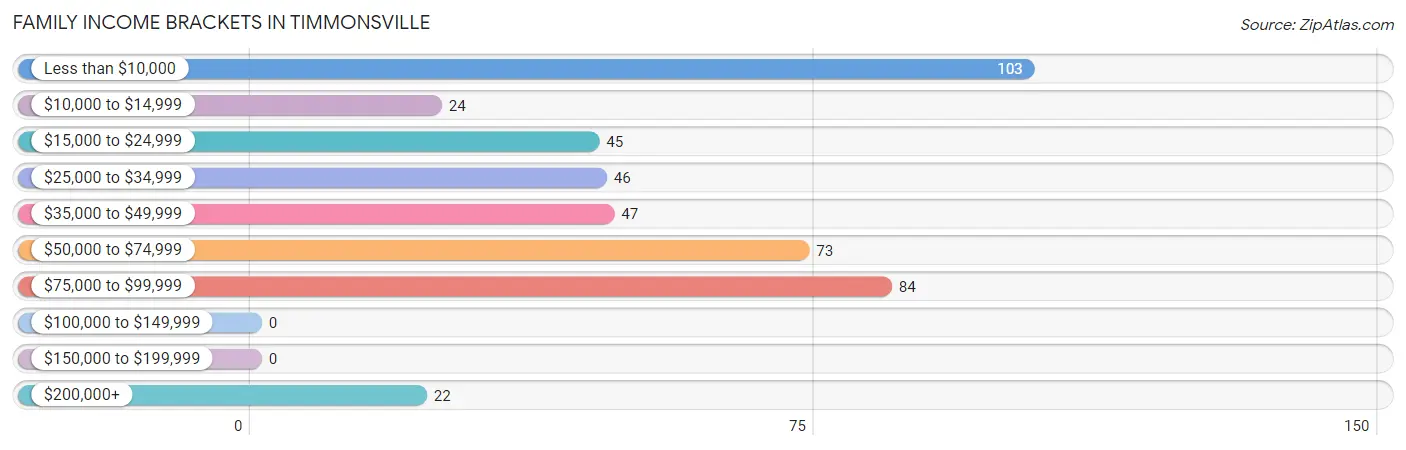
| Income Bracket | # Families | % Families |
| Less than $10,000 | 103 | 23.2% |
| $10,000 to $14,999 | 24 | 5.4% |
| $15,000 to $24,999 | 45 | 10.1% |
| $25,000 to $34,999 | 46 | 10.4% |
| $35,000 to $49,999 | 47 | 10.6% |
| $50,000 to $74,999 | 73 | 16.4% |
| $75,000 to $99,999 | 84 | 18.9% |
| $100,000 to $149,999 | 0 | 0.0% |
| $150,000 to $199,999 | 0 | 0.0% |
| $200,000+ | 22 | 5.0% |
Family Income by Famaliy Size in Timmonsville
5-person families (53 | 11.9%) account for the highest median family income in Timmonsville with $80,046 per family, while 2-person families (258 | 58.1%) have the highest median income of $18,750 per family member.
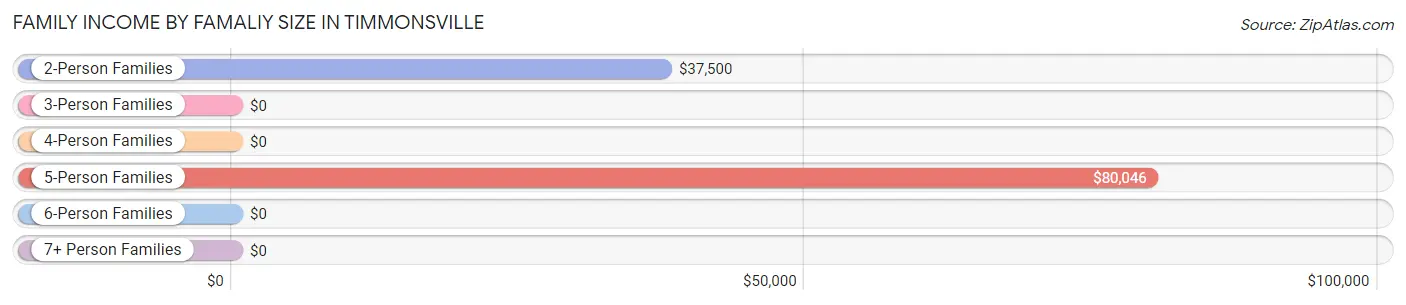
| Income Bracket | # Families | Median Income |
| 2-Person Families | 258 (58.1%) | $37,500 |
| 3-Person Families | 56 (12.6%) | $0 |
| 4-Person Families | 77 (17.3%) | $0 |
| 5-Person Families | 53 (11.9%) | $80,046 |
| 6-Person Families | 0 (0.0%) | $0 |
| 7+ Person Families | 0 (0.0%) | $0 |
| Total | 444 (100.0%) | $35,909 |
Family Income by Number of Earners in Timmonsville
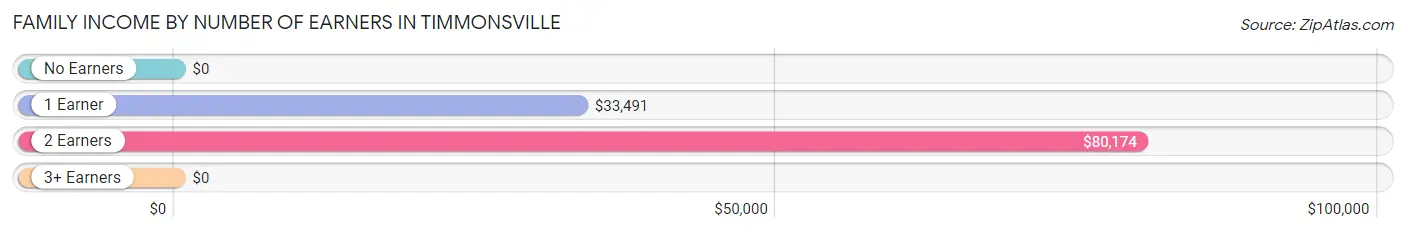
| Number of Earners | # Families | Median Income |
| No Earners | 106 (23.9%) | $0 |
| 1 Earner | 211 (47.5%) | $33,491 |
| 2 Earners | 111 (25.0%) | $80,174 |
| 3+ Earners | 16 (3.6%) | $0 |
| Total | 444 (100.0%) | $35,909 |
Household Income in Timmonsville
Household Income Brackets in Timmonsville
With 227 households falling in the category, the less than $10,000 income range is the most frequent in Timmonsville, accounting for 24.6% of all households.
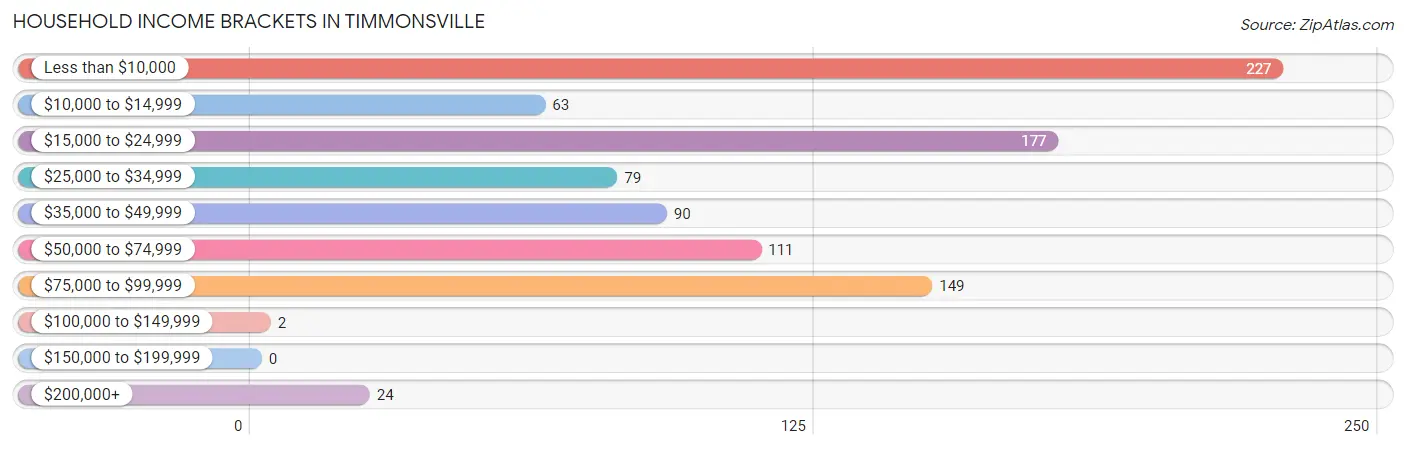
| Income Bracket | # Households | % Households |
| Less than $10,000 | 227 | 24.6% |
| $10,000 to $14,999 | 63 | 6.8% |
| $15,000 to $24,999 | 177 | 19.2% |
| $25,000 to $34,999 | 79 | 8.6% |
| $35,000 to $49,999 | 90 | 9.8% |
| $50,000 to $74,999 | 111 | 12.0% |
| $75,000 to $99,999 | 149 | 16.2% |
| $100,000 to $149,999 | 2 | 0.2% |
| $150,000 to $199,999 | 0 | 0.0% |
| $200,000+ | 24 | 2.6% |
Household Income by Householder Age in Timmonsville
The median household income in Timmonsville is $24,758, with the highest median household income of $63,547 found in the 25 to 44 years age bracket for the primary householder. A total of 279 households (30.3%) fall into this category. Meanwhile, the 45 to 64 years age bracket for the primary householder has the lowest median household income of $0, with 275 households (29.8%) in this group.
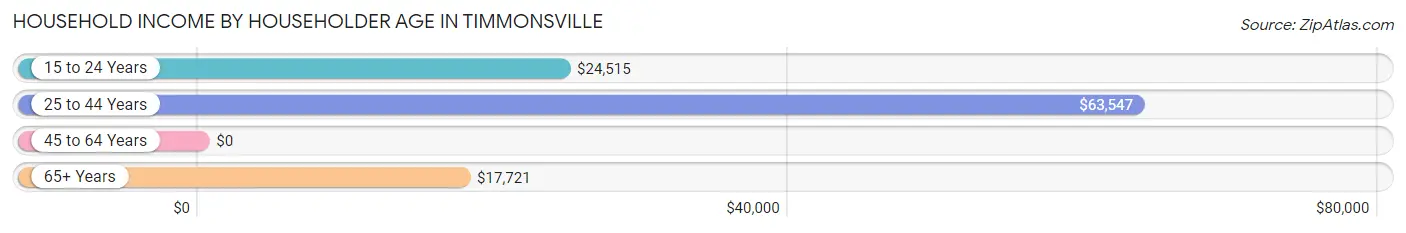
| Income Bracket | # Households | Median Income |
| 15 to 24 Years | 139 (15.1%) | $24,515 |
| 25 to 44 Years | 279 (30.3%) | $63,547 |
| 45 to 64 Years | 275 (29.8%) | $0 |
| 65+ Years | 229 (24.8%) | $17,721 |
| Total | 922 (100.0%) | $24,758 |
Poverty in Timmonsville
Income Below Poverty by Sex and Age in Timmonsville
With 33.5% poverty level for males and 45.3% for females among the residents of Timmonsville, 6 to 11 year old males and under 5 year old females are the most vulnerable to poverty, with 36 males (78.3%) and 72 females (100.0%) in their respective age groups living below the poverty level.
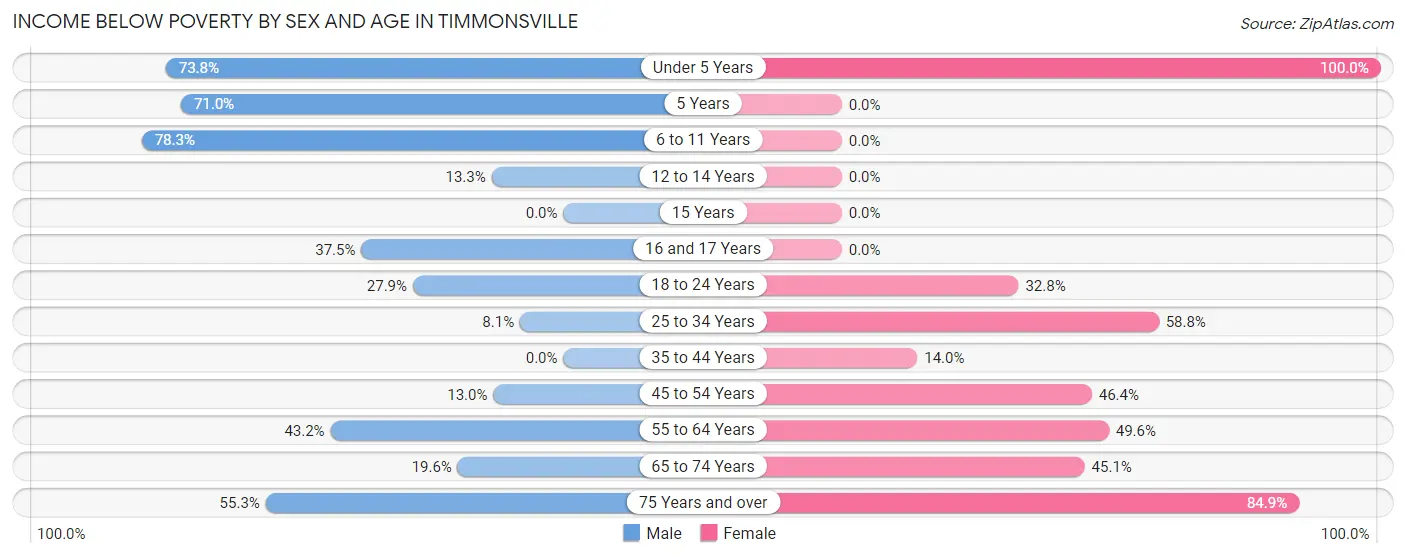
| Age Bracket | Male | Female |
| Under 5 Years | 76 (73.8%) | 72 (100.0%) |
| 5 Years | 66 (71.0%) | 0 (0.0%) |
| 6 to 11 Years | 36 (78.3%) | 0 (0.0%) |
| 12 to 14 Years | 4 (13.3%) | 0 (0.0%) |
| 15 Years | 0 (0.0%) | 0 (0.0%) |
| 16 and 17 Years | 18 (37.5%) | 0 (0.0%) |
| 18 to 24 Years | 50 (27.9%) | 41 (32.8%) |
| 25 to 34 Years | 12 (8.1%) | 80 (58.8%) |
| 35 to 44 Years | 0 (0.0%) | 23 (14.0%) |
| 45 to 54 Years | 13 (13.0%) | 58 (46.4%) |
| 55 to 64 Years | 67 (43.2%) | 56 (49.6%) |
| 65 to 74 Years | 20 (19.6%) | 55 (45.1%) |
| 75 Years and over | 21 (55.3%) | 56 (84.9%) |
| Total | 383 (33.5%) | 441 (45.3%) |
Income Above Poverty by Sex and Age in Timmonsville
According to the poverty statistics in Timmonsville, males aged 35 to 44 years and females aged 15 years are the age groups that are most secure financially, with 100.0% of males and 100.0% of females in these age groups living above the poverty line.
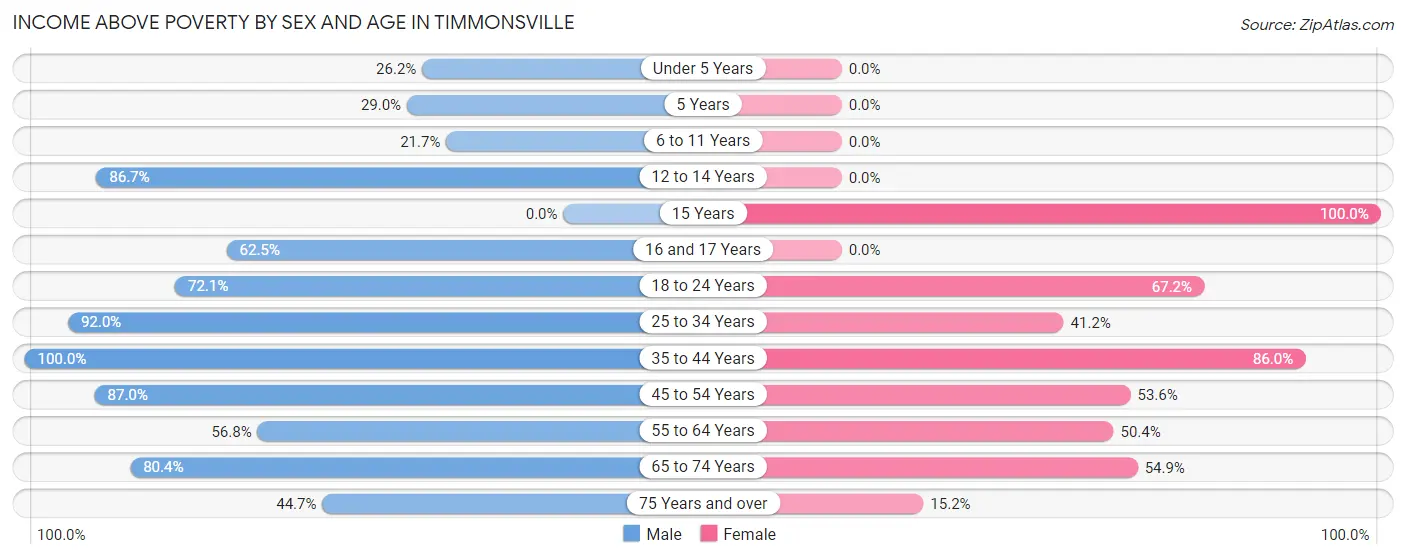
| Age Bracket | Male | Female |
| Under 5 Years | 27 (26.2%) | 0 (0.0%) |
| 5 Years | 27 (29.0%) | 0 (0.0%) |
| 6 to 11 Years | 10 (21.7%) | 0 (0.0%) |
| 12 to 14 Years | 26 (86.7%) | 0 (0.0%) |
| 15 Years | 0 (0.0%) | 51 (100.0%) |
| 16 and 17 Years | 30 (62.5%) | 0 (0.0%) |
| 18 to 24 Years | 129 (72.1%) | 84 (67.2%) |
| 25 to 34 Years | 137 (91.9%) | 56 (41.2%) |
| 35 to 44 Years | 102 (100.0%) | 141 (86.0%) |
| 45 to 54 Years | 87 (87.0%) | 67 (53.6%) |
| 55 to 64 Years | 88 (56.8%) | 57 (50.4%) |
| 65 to 74 Years | 82 (80.4%) | 67 (54.9%) |
| 75 Years and over | 17 (44.7%) | 10 (15.1%) |
| Total | 762 (66.5%) | 533 (54.7%) |
Income Below Poverty Among Married-Couple Families in Timmonsville
The poverty statistics for married-couple families in Timmonsville show that 11.8% or 26 of the total 220 families live below the poverty line. Families with no children have the highest poverty rate of 16.8%, comprising of 26 families. On the other hand, families with 1 or 2 children have the lowest poverty rate of 0.0%, which includes 0 families.
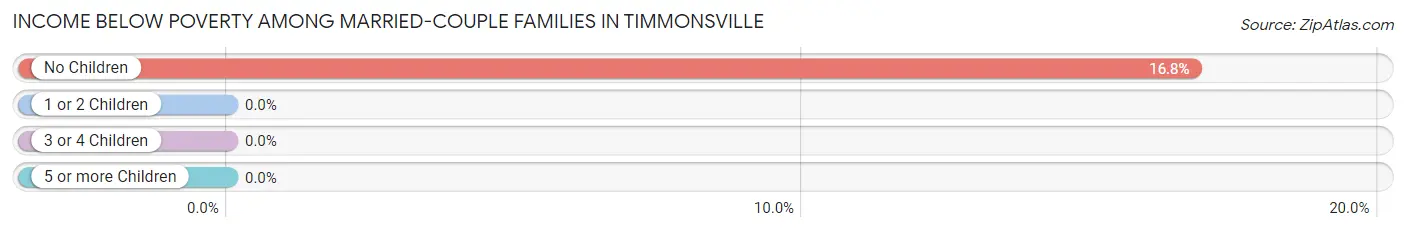
| Children | Above Poverty | Below Poverty |
| No Children | 129 (83.2%) | 26 (16.8%) |
| 1 or 2 Children | 38 (100.0%) | 0 (0.0%) |
| 3 or 4 Children | 27 (100.0%) | 0 (0.0%) |
| 5 or more Children | 0 (0.0%) | 0 (0.0%) |
| Total | 194 (88.2%) | 26 (11.8%) |
Income Below Poverty Among Single-Parent Households in Timmonsville
According to the poverty data in Timmonsville, 41.9% or 26 single-father households and 68.5% or 111 single-mother households are living below the poverty line. Among single-father households, those with 1 or 2 children have the highest poverty rate, with 26 households (57.8%) experiencing poverty. Likewise, among single-mother households, those with 3 or 4 children have the highest poverty rate, with 24 households (100.0%) falling below the poverty line.
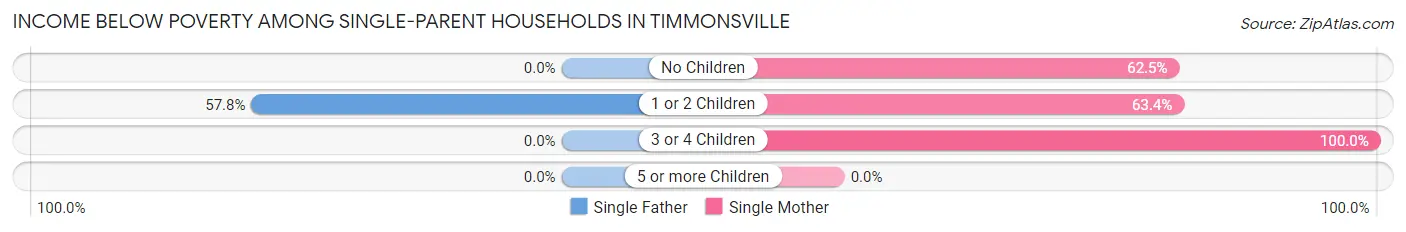
| Children | Single Father | Single Mother |
| No Children | 0 (0.0%) | 35 (62.5%) |
| 1 or 2 Children | 26 (57.8%) | 52 (63.4%) |
| 3 or 4 Children | 0 (0.0%) | 24 (100.0%) |
| 5 or more Children | 0 (0.0%) | 0 (0.0%) |
| Total | 26 (41.9%) | 111 (68.5%) |
Income Below Poverty Among Married-Couple vs Single-Parent Households in Timmonsville
The poverty data for Timmonsville shows that 26 of the married-couple family households (11.8%) and 137 of the single-parent households (61.2%) are living below the poverty level. Within the married-couple family households, those with no children have the highest poverty rate, with 26 households (16.8%) falling below the poverty line. Among the single-parent households, those with 3 or 4 children have the highest poverty rate, with 24 household (100.0%) living below poverty.
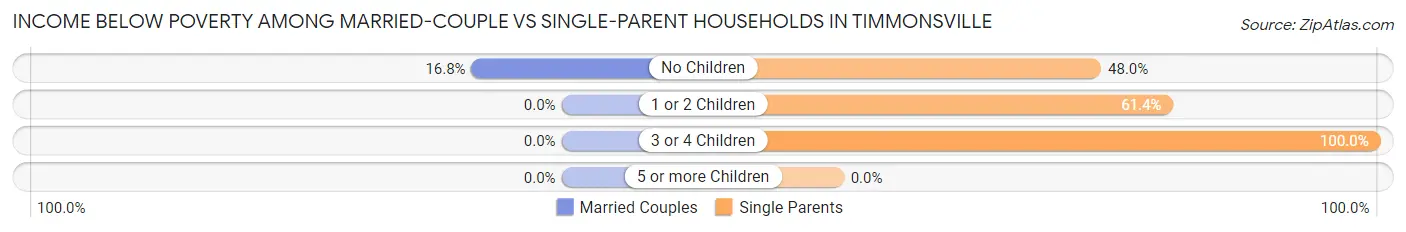
| Children | Married-Couple Families | Single-Parent Households |
| No Children | 26 (16.8%) | 35 (47.9%) |
| 1 or 2 Children | 0 (0.0%) | 78 (61.4%) |
| 3 or 4 Children | 0 (0.0%) | 24 (100.0%) |
| 5 or more Children | 0 (0.0%) | 0 (0.0%) |
| Total | 26 (11.8%) | 137 (61.2%) |
Race in Timmonsville
The most populous races in Timmonsville are Black / African American (1,746 | 82.4%), White / Caucasian (283 | 13.4%), and Two or more Races (88 | 4.2%).
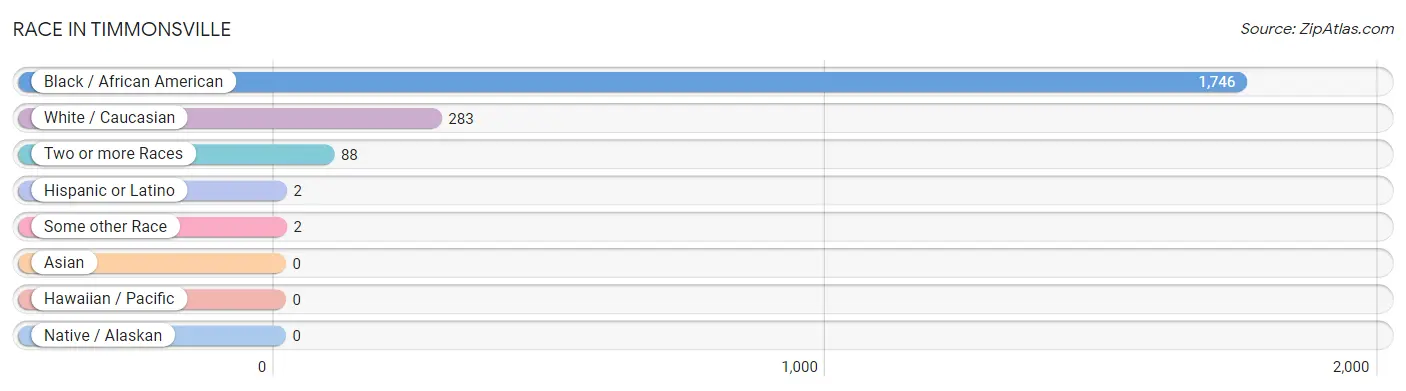
| Race | # Population | % Population |
| Asian | 0 | 0.0% |
| Black / African American | 1,746 | 82.4% |
| Hawaiian / Pacific | 0 | 0.0% |
| Hispanic or Latino | 2 | 0.1% |
| Native / Alaskan | 0 | 0.0% |
| White / Caucasian | 283 | 13.4% |
| Two or more Races | 88 | 4.2% |
| Some other Race | 2 | 0.1% |
| Total | 2,119 | 100.0% |
Ancestry in Timmonsville
The most populous ancestries reported in Timmonsville are English (176 | 8.3%), Irish (76 | 3.6%), Scottish (57 | 2.7%), American (50 | 2.4%), and German (41 | 1.9%), together accounting for 18.9% of all Timmonsville residents.
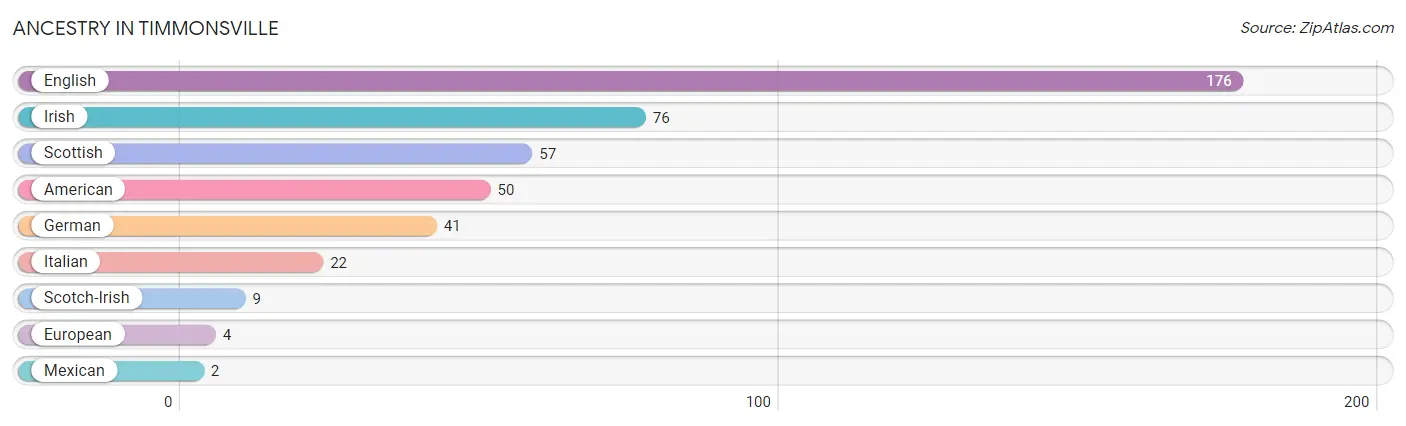
| Ancestry | # Population | % Population |
| American | 50 | 2.4% |
| English | 176 | 8.3% |
| European | 4 | 0.2% |
| German | 41 | 1.9% |
| Irish | 76 | 3.6% |
| Italian | 22 | 1.0% |
| Mexican | 2 | 0.1% |
| Scotch-Irish | 9 | 0.4% |
| Scottish | 57 | 2.7% | View All 9 Rows |
Immigrants in Timmonsville

| Immigration Origin | # Population | % Population | View All 0 Rows |
Sex and Age in Timmonsville
Sex and Age in Timmonsville
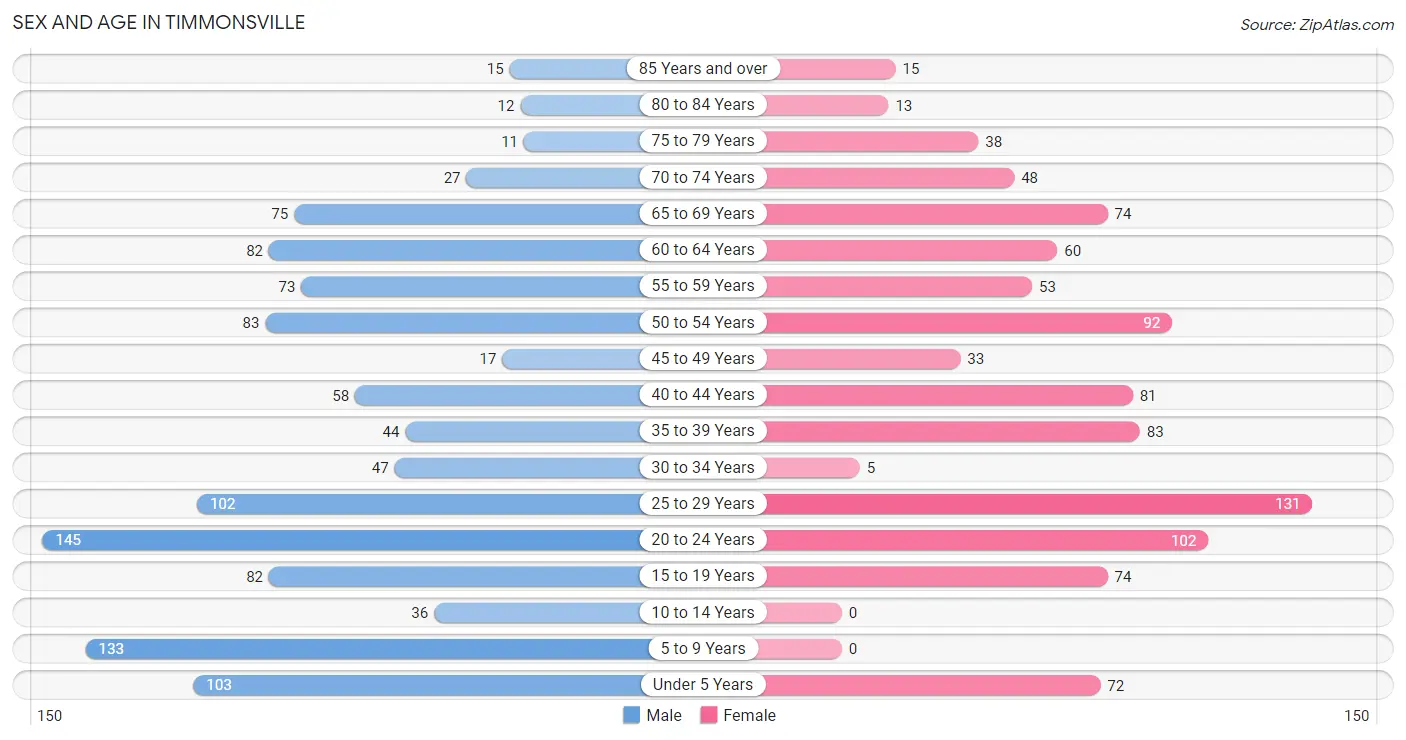
The most populous age groups in Timmonsville are 20 to 24 Years (145 | 12.7%) for men and 25 to 29 Years (131 | 13.5%) for women.
| Age Bracket | Male | Female |
| Under 5 Years | 103 (9.0%) | 72 (7.4%) |
| 5 to 9 Years | 133 (11.6%) | 0 (0.0%) |
| 10 to 14 Years | 36 (3.1%) | 0 (0.0%) |
| 15 to 19 Years | 82 (7.2%) | 74 (7.6%) |
| 20 to 24 Years | 145 (12.7%) | 102 (10.5%) |
| 25 to 29 Years | 102 (8.9%) | 131 (13.5%) |
| 30 to 34 Years | 47 (4.1%) | 5 (0.5%) |
| 35 to 39 Years | 44 (3.8%) | 83 (8.5%) |
| 40 to 44 Years | 58 (5.1%) | 81 (8.3%) |
| 45 to 49 Years | 17 (1.5%) | 33 (3.4%) |
| 50 to 54 Years | 83 (7.2%) | 92 (9.5%) |
| 55 to 59 Years | 73 (6.4%) | 53 (5.4%) |
| 60 to 64 Years | 82 (7.2%) | 60 (6.2%) |
| 65 to 69 Years | 75 (6.6%) | 74 (7.6%) |
| 70 to 74 Years | 27 (2.4%) | 48 (4.9%) |
| 75 to 79 Years | 11 (1.0%) | 38 (3.9%) |
| 80 to 84 Years | 12 (1.1%) | 13 (1.3%) |
| 85 Years and over | 15 (1.3%) | 15 (1.5%) |
| Total | 1,145 (100.0%) | 974 (100.0%) |
Families and Households in Timmonsville
Median Family Size in Timmonsville
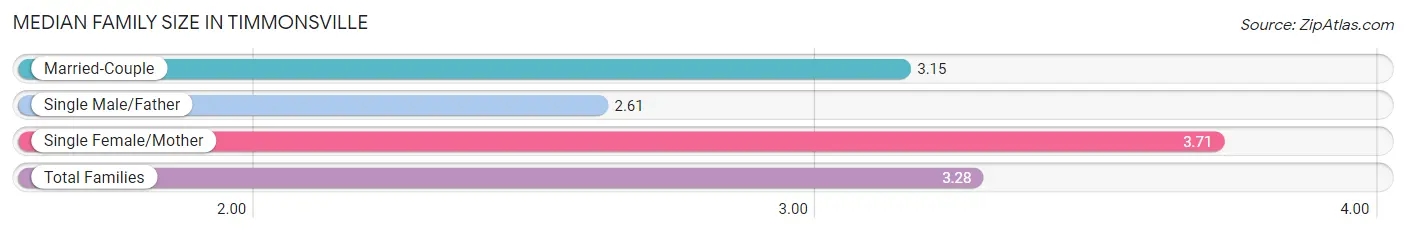
The median family size in Timmonsville is 3.28 persons per family, with single female/mother families (162 | 36.5%) accounting for the largest median family size of 3.71 persons per family. On the other hand, single male/father families (62 | 14.0%) represent the smallest median family size with 2.61 persons per family.
| Family Type | # Families | Family Size |
| Married-Couple | 220 (49.5%) | 3.15 |
| Single Male/Father | 62 (14.0%) | 2.61 |
| Single Female/Mother | 162 (36.5%) | 3.71 |
| Total Families | 444 (100.0%) | 3.28 |
Median Household Size in Timmonsville
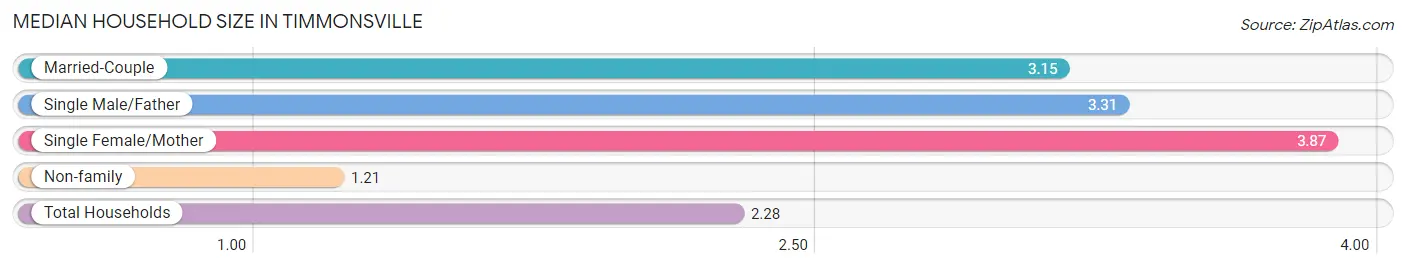
The median household size in Timmonsville is 2.28 persons per household, with single female/mother households (162 | 17.6%) accounting for the largest median household size of 3.87 persons per household. non-family households (478 | 51.8%) represent the smallest median household size with 1.21 persons per household.
| Household Type | # Households | Household Size |
| Married-Couple | 220 (23.9%) | 3.15 |
| Single Male/Father | 62 (6.7%) | 3.31 |
| Single Female/Mother | 162 (17.6%) | 3.87 |
| Non-family | 478 (51.8%) | 1.21 |
| Total Households | 922 (100.0%) | 2.28 |
Household Size by Marriage Status in Timmonsville
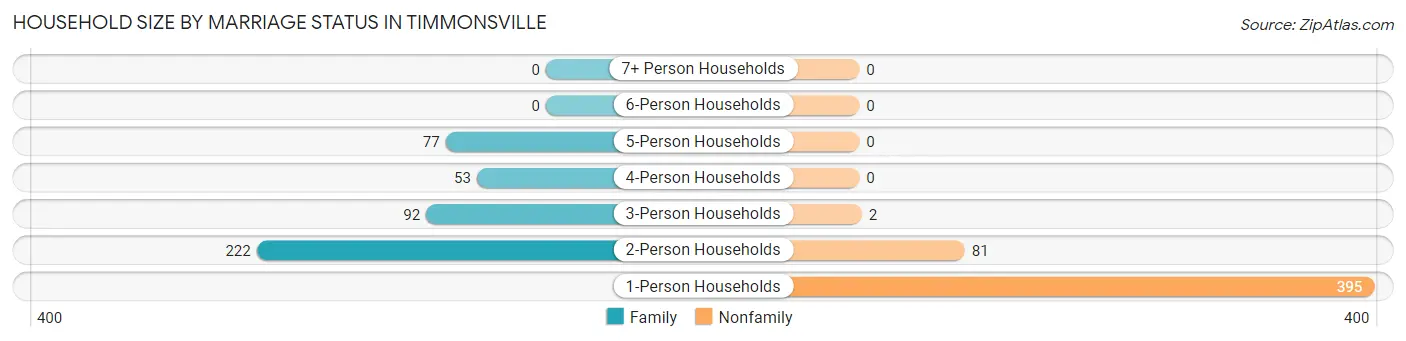
Out of a total of 922 households in Timmonsville, 444 (48.2%) are family households, while 478 (51.8%) are nonfamily households. The most numerous type of family households are 2-person households, comprising 222, and the most common type of nonfamily households are 1-person households, comprising 395.
| Household Size | Family Households | Nonfamily Households |
| 1-Person Households | - | 395 (42.8%) |
| 2-Person Households | 222 (24.1%) | 81 (8.8%) |
| 3-Person Households | 92 (10.0%) | 2 (0.2%) |
| 4-Person Households | 53 (5.8%) | 0 (0.0%) |
| 5-Person Households | 77 (8.4%) | 0 (0.0%) |
| 6-Person Households | 0 (0.0%) | 0 (0.0%) |
| 7+ Person Households | 0 (0.0%) | 0 (0.0%) |
| Total | 444 (48.2%) | 478 (51.8%) |
Female Fertility in Timmonsville
Fertility by Age in Timmonsville
Average fertility rate in Timmonsville is 86.0 births per 1,000 women. Women in the age bracket of 20 to 34 years have the highest fertility rate with 185.0 births per 1,000 women. Women in the age bracket of 20 to 34 years acount for 100.0% of all women with births.
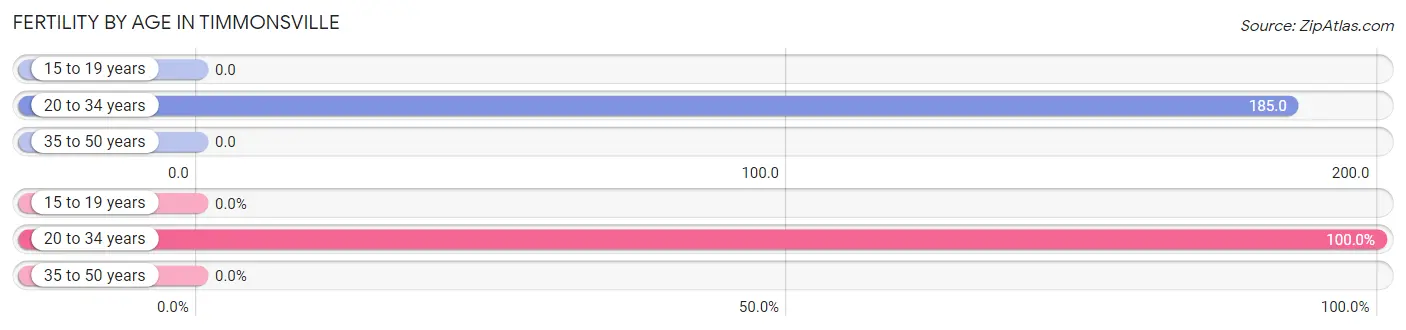
| Age Bracket | Women with Births | Births / 1,000 Women |
| 15 to 19 years | 0 (0.0%) | 0.0 |
| 20 to 34 years | 44 (100.0%) | 185.0 |
| 35 to 50 years | 0 (0.0%) | 0.0 |
| Total | 44 (100.0%) | 86.0 |
Fertility by Age by Marriage Status in Timmonsville
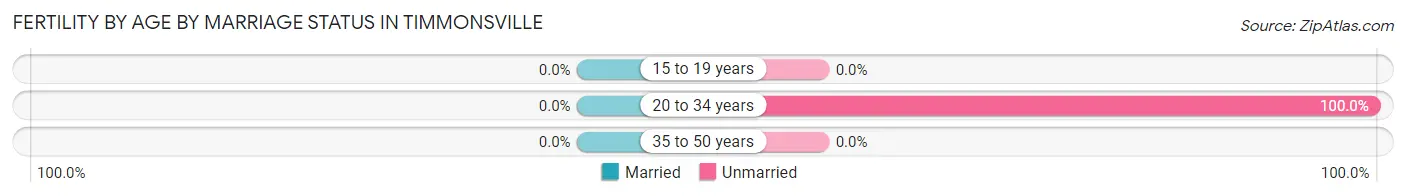
| Age Bracket | Married | Unmarried |
| 15 to 19 years | 0 (0.0%) | 0 (0.0%) |
| 20 to 34 years | 0 (0.0%) | 44 (100.0%) |
| 35 to 50 years | 0 (0.0%) | 0 (0.0%) |
| Total | 0 (0.0%) | 44 (100.0%) |
Fertility by Education in Timmonsville
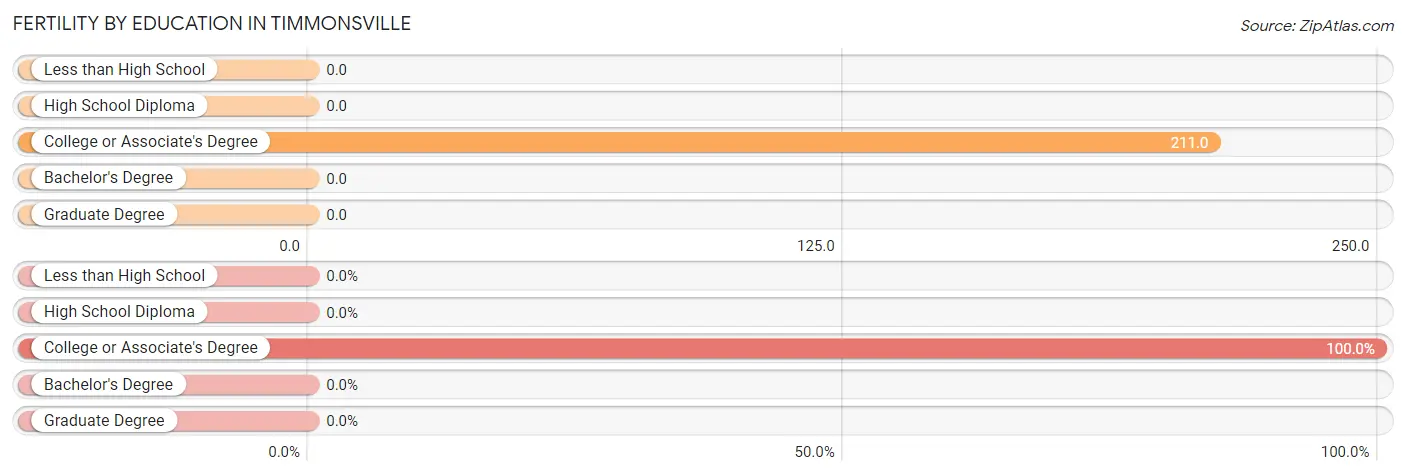
| Educational Attainment | Women with Births | Births / 1,000 Women |
| Less than High School | 0 (0.0%) | 0.0 |
| High School Diploma | 0 (0.0%) | 0.0 |
| College or Associate's Degree | 44 (100.0%) | 211.0 |
| Bachelor's Degree | 0 (0.0%) | 0.0 |
| Graduate Degree | 0 (0.0%) | 0.0 |
| Total | 44 (100.0%) | 86.0 |
Fertility by Education by Marriage Status in Timmonsville
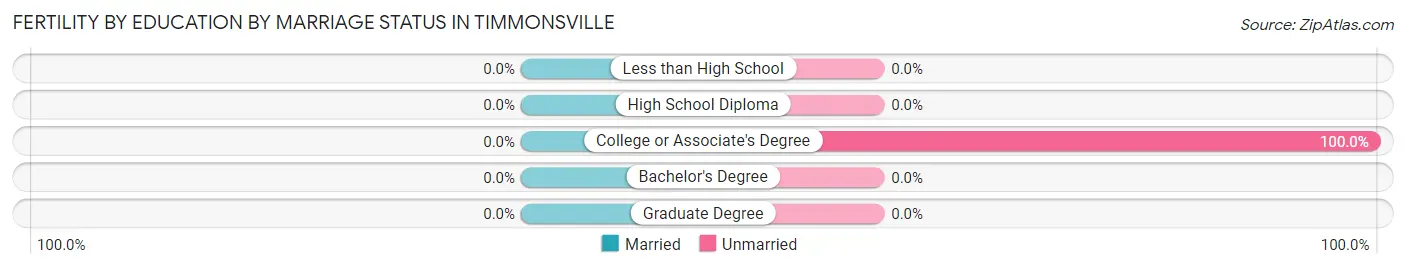
| Educational Attainment | Married | Unmarried |
| Less than High School | 0 (0.0%) | 0 (0.0%) |
| High School Diploma | 0 (0.0%) | 0 (0.0%) |
| College or Associate's Degree | 0 (0.0%) | 44 (100.0%) |
| Bachelor's Degree | 0 (0.0%) | 0 (0.0%) |
| Graduate Degree | 0 (0.0%) | 0 (0.0%) |
| Total | 0 (0.0%) | 44 (100.0%) |
Employment Characteristics in Timmonsville
Employment by Class of Employer in Timmonsville
Among the 860 employed individuals in Timmonsville, private company employees (616 | 71.6%), not-for-profit organizations (96 | 11.2%), and local government employees (79 | 9.2%) make up the most common classes of employment.
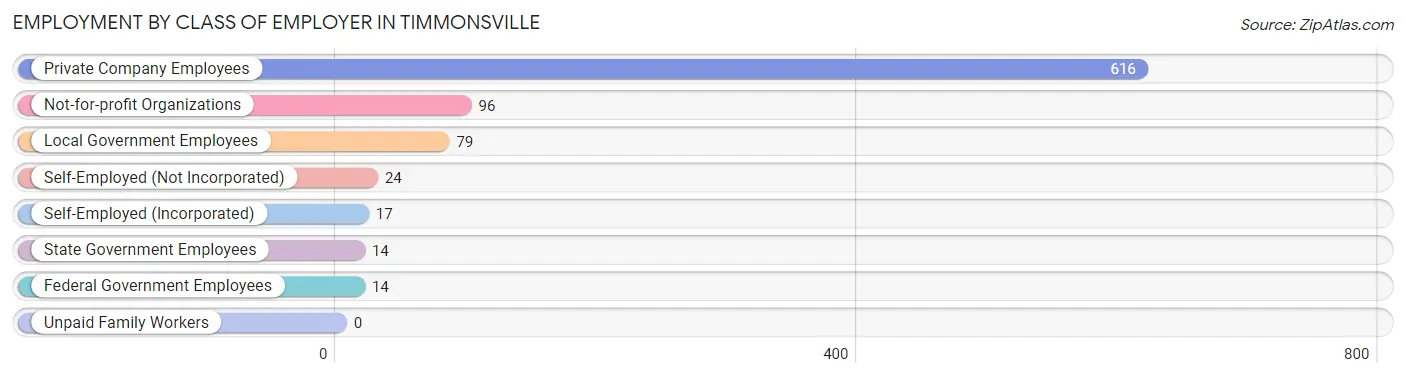
| Employer Class | # Employees | % Employees |
| Private Company Employees | 616 | 71.6% |
| Self-Employed (Incorporated) | 17 | 2.0% |
| Self-Employed (Not Incorporated) | 24 | 2.8% |
| Not-for-profit Organizations | 96 | 11.2% |
| Local Government Employees | 79 | 9.2% |
| State Government Employees | 14 | 1.6% |
| Federal Government Employees | 14 | 1.6% |
| Unpaid Family Workers | 0 | 0.0% |
| Total | 860 | 100.0% |
Employment Status by Age in Timmonsville
According to the labor force statistics for Timmonsville, out of the total population over 16 years of age (1,724), 54.1% or 933 individuals are in the labor force, with 7.8% or 73 of them unemployed. The age group with the highest labor force participation rate is 35 to 44 years, with 77.4% or 206 individuals in the labor force. Within the labor force, the 30 to 34 years age range has the highest percentage of unemployed individuals, with 40.0% or 14 of them being unemployed.
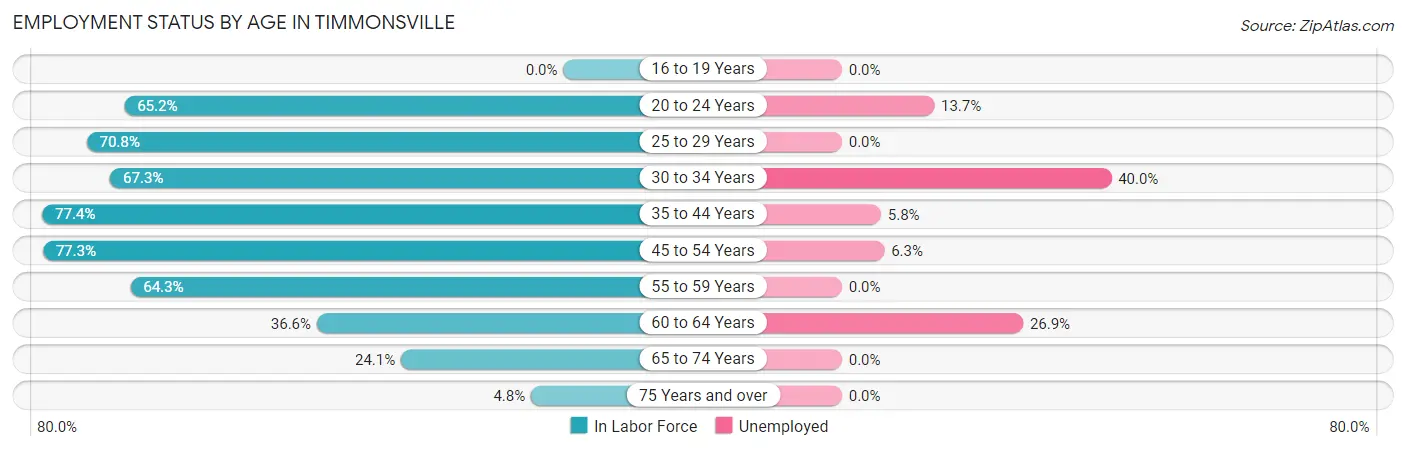
| Age Bracket | In Labor Force | Unemployed |
| 16 to 19 Years | 0 (0.0%) | 0 (0.0%) |
| 20 to 24 Years | 161 (65.2%) | 22 (13.7%) |
| 25 to 29 Years | 165 (70.8%) | 0 (0.0%) |
| 30 to 34 Years | 35 (67.3%) | 14 (40.0%) |
| 35 to 44 Years | 206 (77.4%) | 12 (5.8%) |
| 45 to 54 Years | 174 (77.3%) | 11 (6.3%) |
| 55 to 59 Years | 81 (64.3%) | 0 (0.0%) |
| 60 to 64 Years | 52 (36.6%) | 14 (26.9%) |
| 65 to 74 Years | 54 (24.1%) | 0 (0.0%) |
| 75 Years and over | 5 (4.8%) | 0 (0.0%) |
| Total | 933 (54.1%) | 73 (7.8%) |
Employment Status by Educational Attainment in Timmonsville
According to labor force statistics for Timmonsville, 68.3% of individuals (713) out of the total population between 25 and 64 years of age (1,044) are in the labor force, with 7.2% or 51 of them being unemployed. The group with the highest labor force participation rate are those with the educational attainment of college / associate degree, with 81.1% or 330 individuals in the labor force. Within the labor force, individuals with less than high school education have the highest percentage of unemployment, with 33.3% or 23 of them being unemployed.
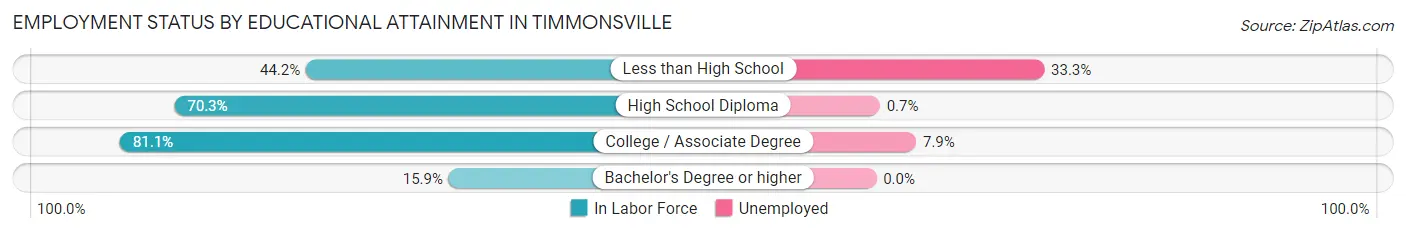
| Educational Attainment | In Labor Force | Unemployed |
| Less than High School | 69 (44.2%) | 52 (33.3%) |
| High School Diploma | 307 (70.3%) | 3 (0.7%) |
| College / Associate Degree | 330 (81.1%) | 32 (7.9%) |
| Bachelor's Degree or higher | 7 (15.9%) | 0 (0.0%) |
| Total | 713 (68.3%) | 75 (7.2%) |
Employment Occupations by Sex in Timmonsville
Management, Business, Science and Arts Occupations
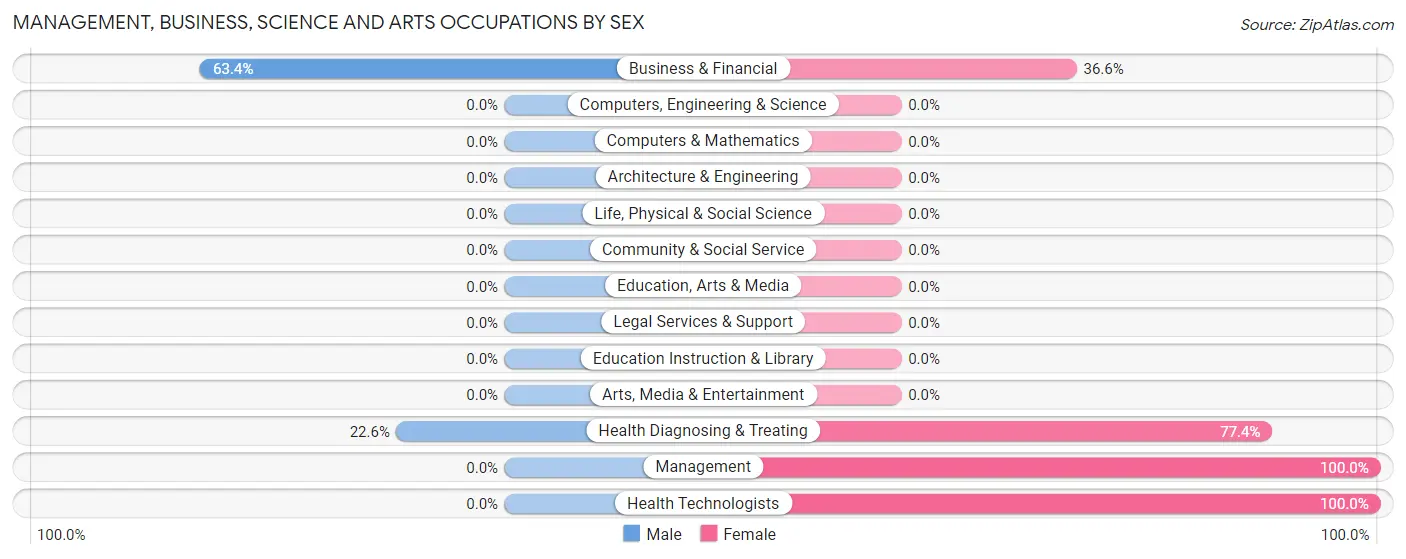
The most common Management, Business, Science and Arts occupations in Timmonsville are Health Diagnosing & Treating (93 | 10.8%), Health Technologists (50 | 5.8%), Business & Financial (41 | 4.8%), and Management (7 | 0.8%).
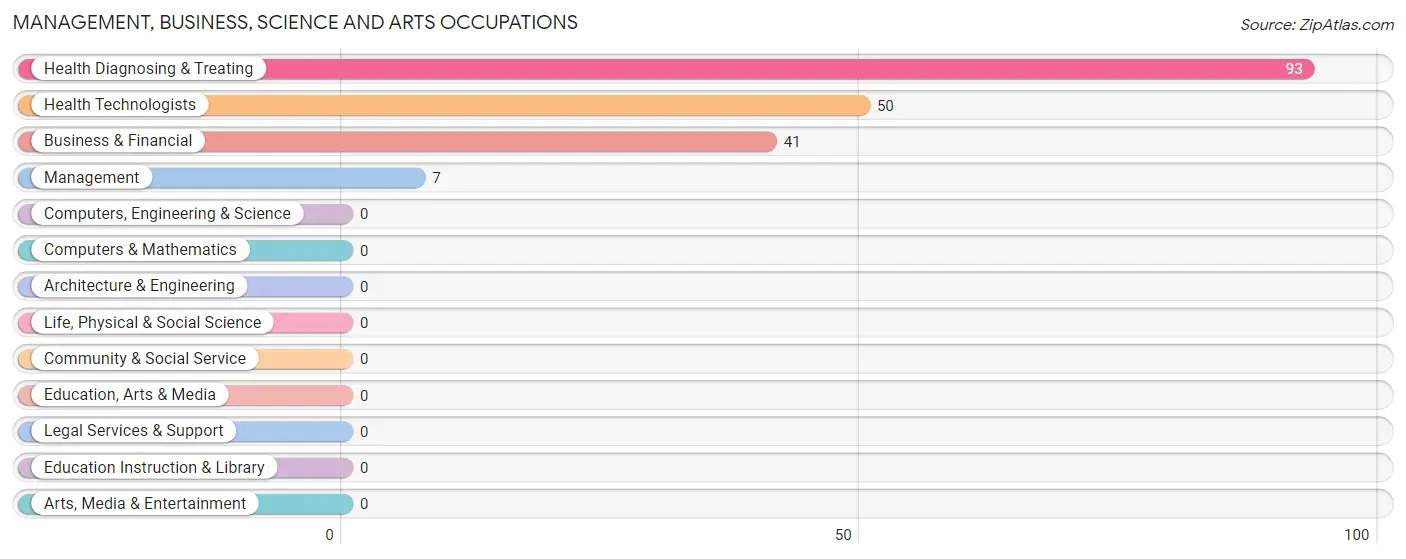
Management, Business, Science and Arts Occupations by Sex
Within the Management, Business, Science and Arts occupations in Timmonsville, the most male-oriented occupations are Business & Financial (63.4%), and Health Diagnosing & Treating (22.6%), while the most female-oriented occupations are Management (100.0%), Health Technologists (100.0%), and Health Diagnosing & Treating (77.4%).
| Occupation | Male | Female |
| Management | 0 (0.0%) | 7 (100.0%) |
| Business & Financial | 26 (63.4%) | 15 (36.6%) |
| Computers, Engineering & Science | 0 (0.0%) | 0 (0.0%) |
| Computers & Mathematics | 0 (0.0%) | 0 (0.0%) |
| Architecture & Engineering | 0 (0.0%) | 0 (0.0%) |
| Life, Physical & Social Science | 0 (0.0%) | 0 (0.0%) |
| Community & Social Service | 0 (0.0%) | 0 (0.0%) |
| Education, Arts & Media | 0 (0.0%) | 0 (0.0%) |
| Legal Services & Support | 0 (0.0%) | 0 (0.0%) |
| Education Instruction & Library | 0 (0.0%) | 0 (0.0%) |
| Arts, Media & Entertainment | 0 (0.0%) | 0 (0.0%) |
| Health Diagnosing & Treating | 21 (22.6%) | 72 (77.4%) |
| Health Technologists | 0 (0.0%) | 50 (100.0%) |
| Total (Category) | 47 (33.3%) | 94 (66.7%) |
| Total (Overall) | 466 (54.2%) | 394 (45.8%) |
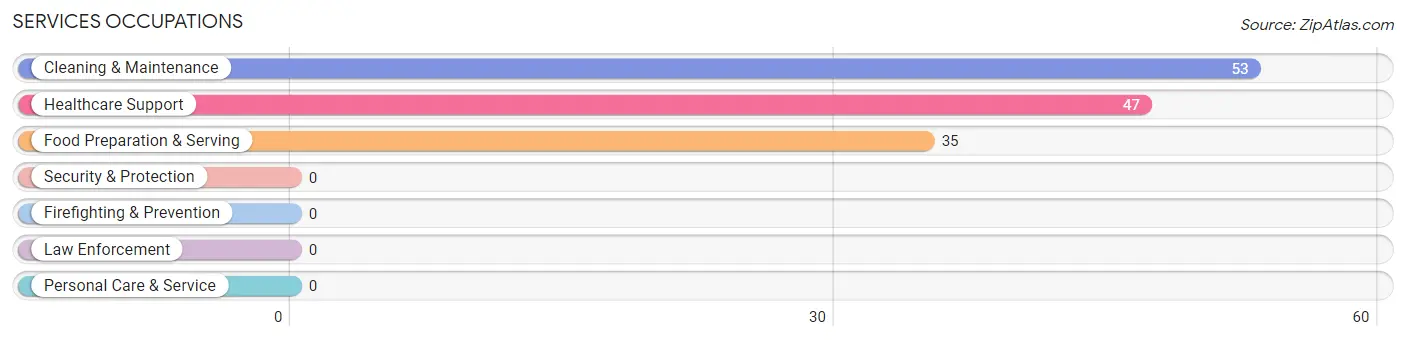
Services Occupations
The most common Services occupations in Timmonsville are Cleaning & Maintenance (53 | 6.2%), Healthcare Support (47 | 5.5%), and Food Preparation & Serving (35 | 4.1%).
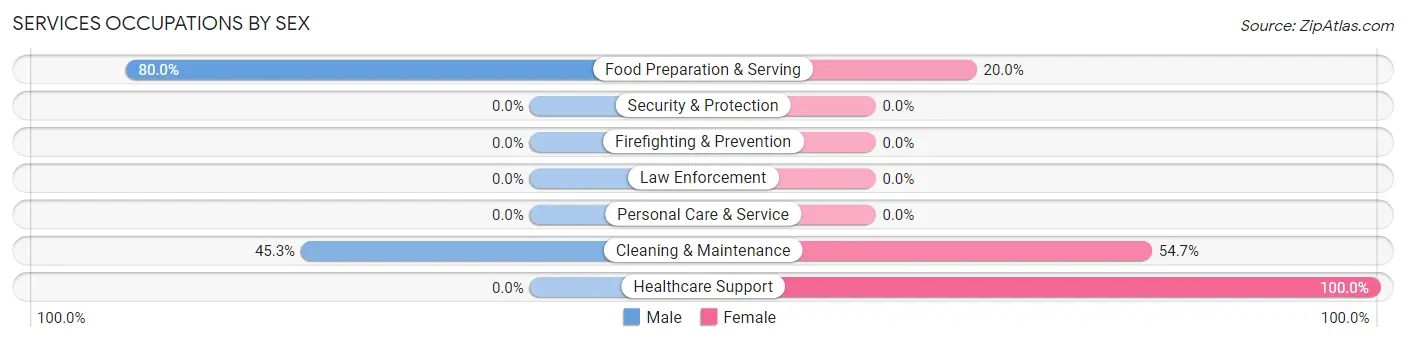
Services Occupations by Sex
Within the Services occupations in Timmonsville, the most male-oriented occupations are Food Preparation & Serving (80.0%), and Cleaning & Maintenance (45.3%), while the most female-oriented occupations are Healthcare Support (100.0%), Cleaning & Maintenance (54.7%), and Food Preparation & Serving (20.0%).
| Occupation | Male | Female |
| Healthcare Support | 0 (0.0%) | 47 (100.0%) |
| Security & Protection | 0 (0.0%) | 0 (0.0%) |
| Firefighting & Prevention | 0 (0.0%) | 0 (0.0%) |
| Law Enforcement | 0 (0.0%) | 0 (0.0%) |
| Food Preparation & Serving | 28 (80.0%) | 7 (20.0%) |
| Cleaning & Maintenance | 24 (45.3%) | 29 (54.7%) |
| Personal Care & Service | 0 (0.0%) | 0 (0.0%) |
| Total (Category) | 52 (38.5%) | 83 (61.5%) |
| Total (Overall) | 466 (54.2%) | 394 (45.8%) |
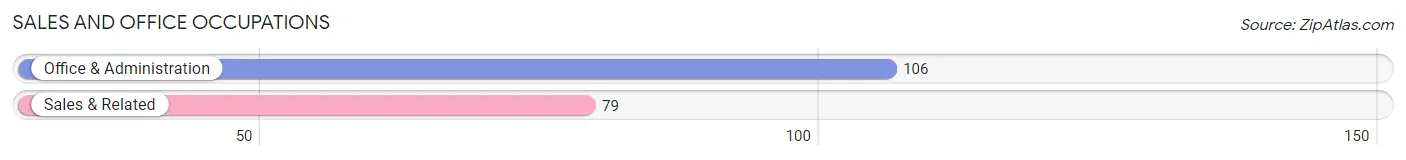
Sales and Office Occupations
The most common Sales and Office occupations in Timmonsville are Office & Administration (106 | 12.3%), and Sales & Related (79 | 9.2%).
Sales and Office Occupations by Sex
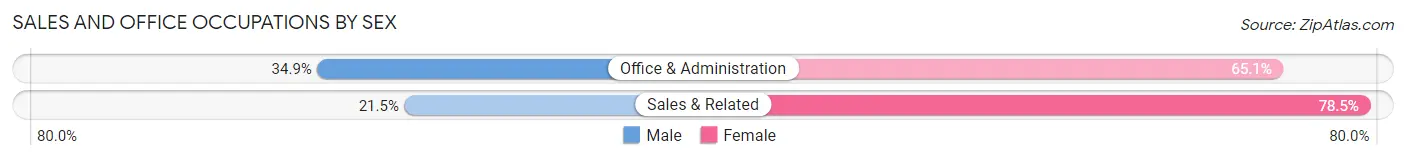
| Occupation | Male | Female |
| Sales & Related | 17 (21.5%) | 62 (78.5%) |
| Office & Administration | 37 (34.9%) | 69 (65.1%) |
| Total (Category) | 54 (29.2%) | 131 (70.8%) |
| Total (Overall) | 466 (54.2%) | 394 (45.8%) |
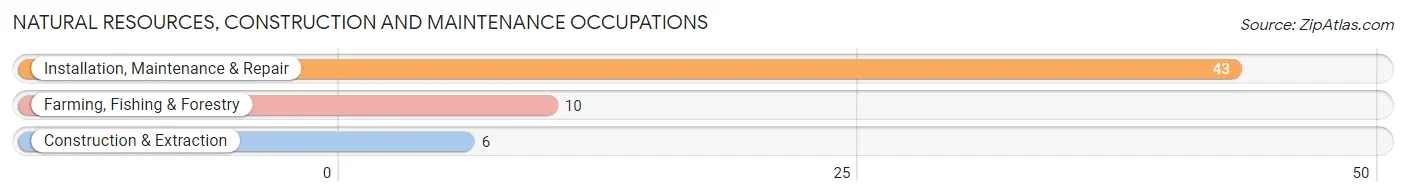
Natural Resources, Construction and Maintenance Occupations
The most common Natural Resources, Construction and Maintenance occupations in Timmonsville are Installation, Maintenance & Repair (43 | 5.0%), Farming, Fishing & Forestry (10 | 1.2%), and Construction & Extraction (6 | 0.7%).
Natural Resources, Construction and Maintenance Occupations by Sex
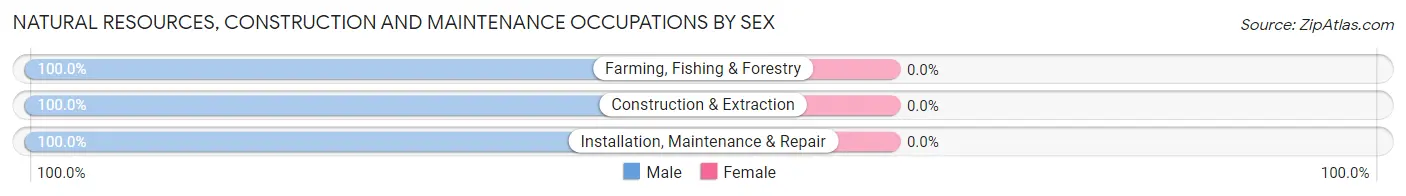
| Occupation | Male | Female |
| Farming, Fishing & Forestry | 10 (100.0%) | 0 (0.0%) |
| Construction & Extraction | 6 (100.0%) | 0 (0.0%) |
| Installation, Maintenance & Repair | 43 (100.0%) | 0 (0.0%) |
| Total (Category) | 59 (100.0%) | 0 (0.0%) |
| Total (Overall) | 466 (54.2%) | 394 (45.8%) |
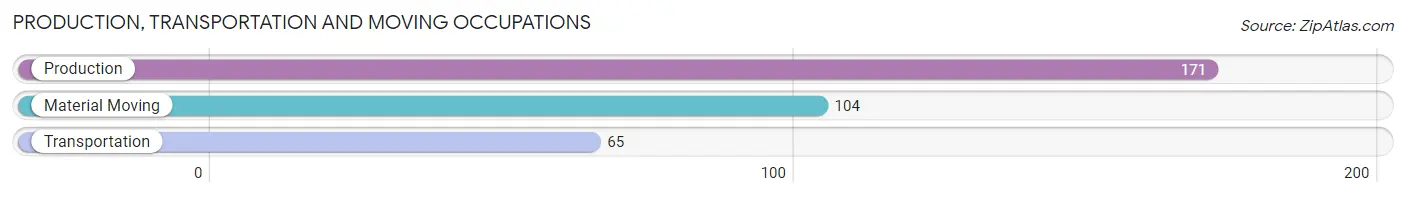
Production, Transportation and Moving Occupations
The most common Production, Transportation and Moving occupations in Timmonsville are Production (171 | 19.9%), Material Moving (104 | 12.1%), and Transportation (65 | 7.6%).
Production, Transportation and Moving Occupations by Sex
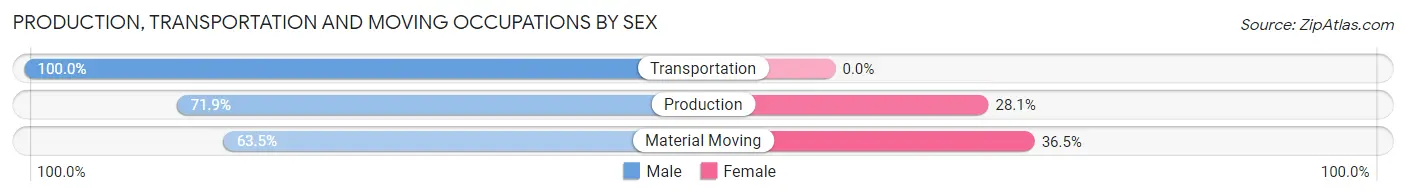
| Occupation | Male | Female |
| Production | 123 (71.9%) | 48 (28.1%) |
| Transportation | 65 (100.0%) | 0 (0.0%) |
| Material Moving | 66 (63.5%) | 38 (36.5%) |
| Total (Category) | 254 (74.7%) | 86 (25.3%) |
| Total (Overall) | 466 (54.2%) | 394 (45.8%) |
Employment Industries by Sex in Timmonsville
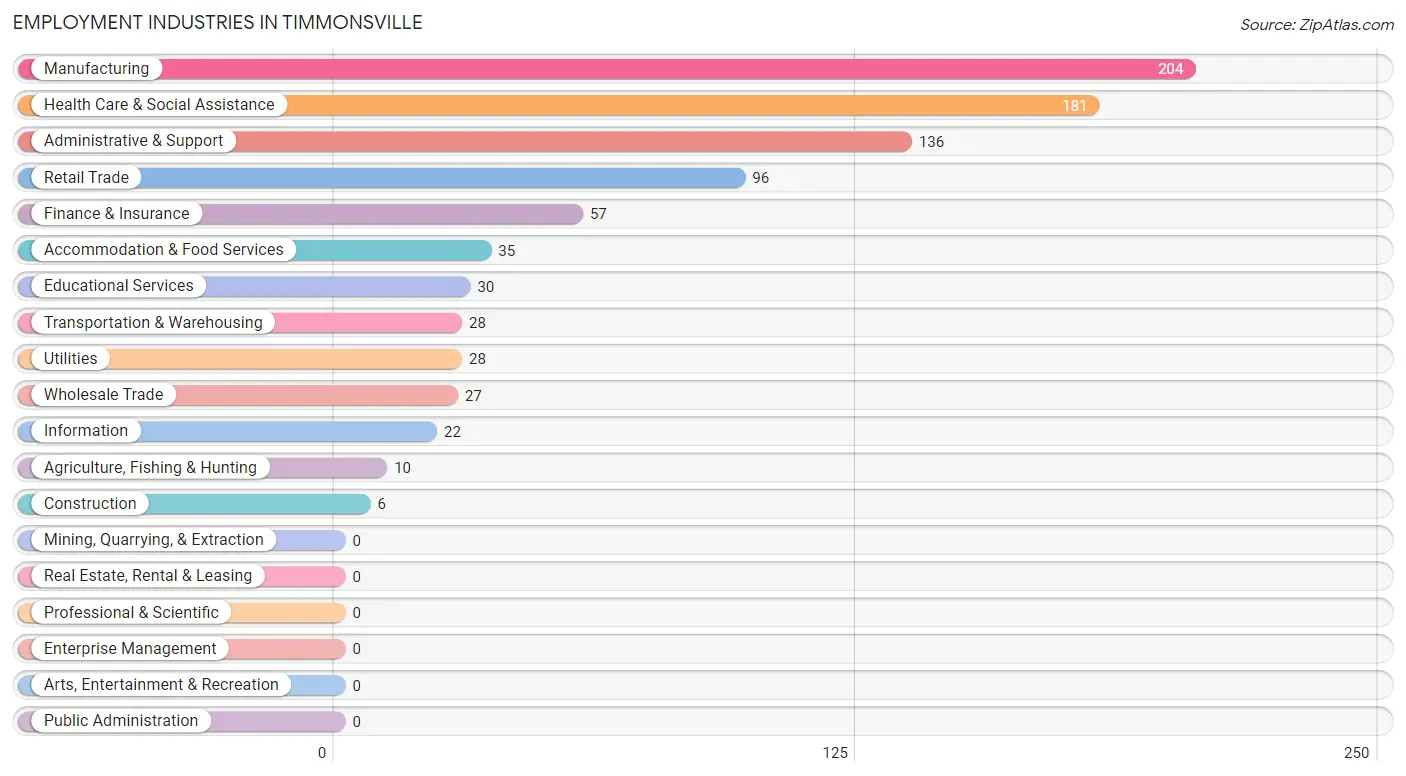
Employment Industries in Timmonsville
The major employment industries in Timmonsville include Manufacturing (204 | 23.7%), Health Care & Social Assistance (181 | 21.0%), Administrative & Support (136 | 15.8%), Retail Trade (96 | 11.2%), and Finance & Insurance (57 | 6.6%).
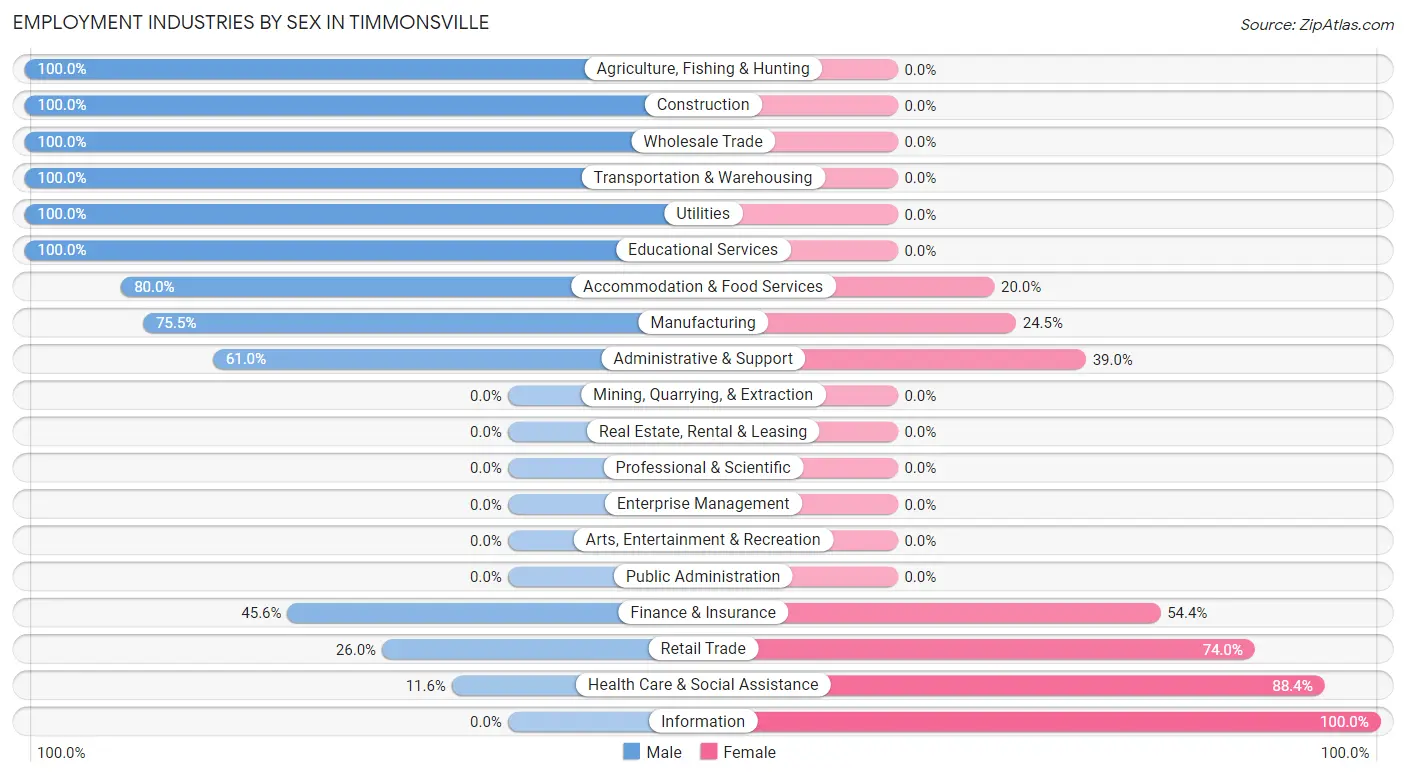
Employment Industries by Sex in Timmonsville
The Timmonsville industries that see more men than women are Agriculture, Fishing & Hunting (100.0%), Construction (100.0%), and Wholesale Trade (100.0%), whereas the industries that tend to have a higher number of women are Information (100.0%), Health Care & Social Assistance (88.4%), and Retail Trade (74.0%).
| Industry | Male | Female |
| Agriculture, Fishing & Hunting | 10 (100.0%) | 0 (0.0%) |
| Mining, Quarrying, & Extraction | 0 (0.0%) | 0 (0.0%) |
| Construction | 6 (100.0%) | 0 (0.0%) |
| Manufacturing | 154 (75.5%) | 50 (24.5%) |
| Wholesale Trade | 27 (100.0%) | 0 (0.0%) |
| Retail Trade | 25 (26.0%) | 71 (74.0%) |
| Transportation & Warehousing | 28 (100.0%) | 0 (0.0%) |
| Utilities | 28 (100.0%) | 0 (0.0%) |
| Information | 0 (0.0%) | 22 (100.0%) |
| Finance & Insurance | 26 (45.6%) | 31 (54.4%) |
| Real Estate, Rental & Leasing | 0 (0.0%) | 0 (0.0%) |
| Professional & Scientific | 0 (0.0%) | 0 (0.0%) |
| Enterprise Management | 0 (0.0%) | 0 (0.0%) |
| Administrative & Support | 83 (61.0%) | 53 (39.0%) |
| Educational Services | 30 (100.0%) | 0 (0.0%) |
| Health Care & Social Assistance | 21 (11.6%) | 160 (88.4%) |
| Arts, Entertainment & Recreation | 0 (0.0%) | 0 (0.0%) |
| Accommodation & Food Services | 28 (80.0%) | 7 (20.0%) |
| Public Administration | 0 (0.0%) | 0 (0.0%) |
| Total | 466 (54.2%) | 394 (45.8%) |
Education in Timmonsville
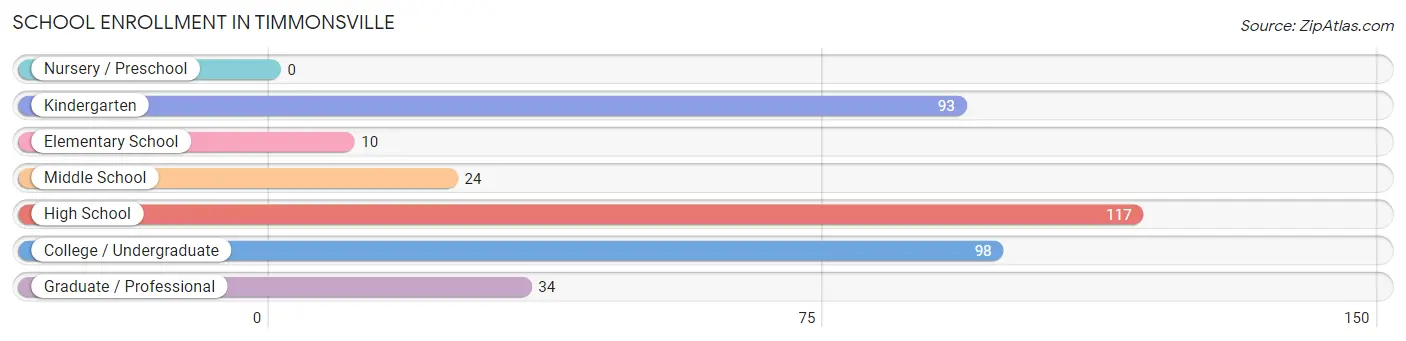
School Enrollment in Timmonsville
The most common levels of schooling among the 376 students in Timmonsville are high school (117 | 31.1%), college / undergraduate (98 | 26.1%), and kindergarten (93 | 24.7%).
| School Level | # Students | % Students |
| Nursery / Preschool | 0 | 0.0% |
| Kindergarten | 93 | 24.7% |
| Elementary School | 10 | 2.7% |
| Middle School | 24 | 6.4% |
| High School | 117 | 31.1% |
| College / Undergraduate | 98 | 26.1% |
| Graduate / Professional | 34 | 9.0% |
| Total | 376 | 100.0% |
School Enrollment by Age by Funding Source in Timmonsville
Out of a total of 376 students who are enrolled in schools in Timmonsville, 16 (4.3%) attend a private institution, while the remaining 360 (95.7%) are enrolled in public schools. The age group of 35 years and over has the highest likelihood of being enrolled in private schools, with 7 (46.7% in the age bracket) enrolled. Conversely, the age group of 10 to 14 year olds has the lowest likelihood of being enrolled in a private school, with 36 (100.0% in the age bracket) attending a public institution.
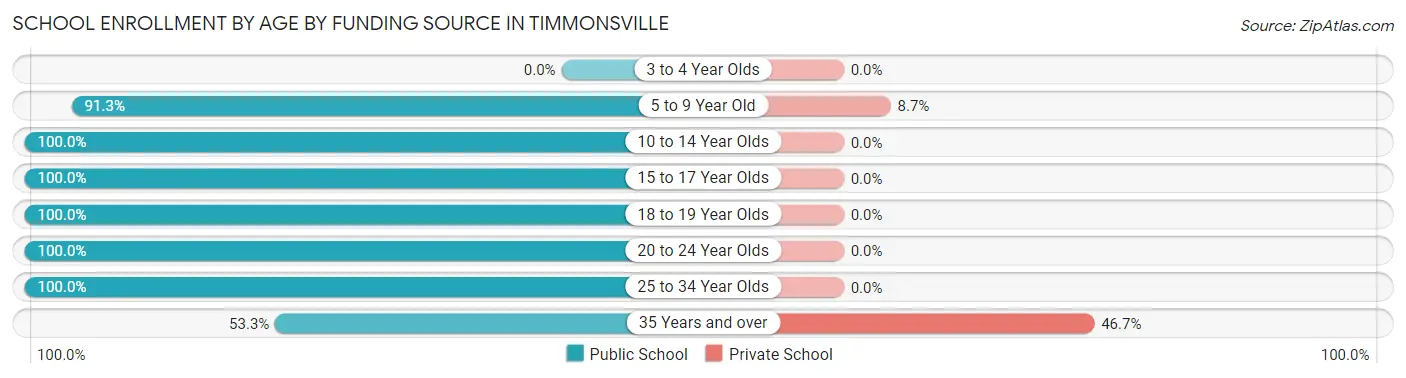
| Age Bracket | Public School | Private School |
| 3 to 4 Year Olds | 0 (0.0%) | 0 (0.0%) |
| 5 to 9 Year Old | 94 (91.3%) | 9 (8.7%) |
| 10 to 14 Year Olds | 36 (100.0%) | 0 (0.0%) |
| 15 to 17 Year Olds | 74 (100.0%) | 0 (0.0%) |
| 18 to 19 Year Olds | 35 (100.0%) | 0 (0.0%) |
| 20 to 24 Year Olds | 92 (100.0%) | 0 (0.0%) |
| 25 to 34 Year Olds | 21 (100.0%) | 0 (0.0%) |
| 35 Years and over | 8 (53.3%) | 7 (46.7%) |
| Total | 360 (95.7%) | 16 (4.3%) |
Educational Attainment by Field of Study in Timmonsville
Business (75 | 56.8%), computers & mathematics (37 | 28.0%), literature & languages (8 | 6.1%), education (6 | 4.5%), and arts & humanities (6 | 4.5%) are the most common fields of study among 132 individuals in Timmonsville who have obtained a bachelor's degree or higher.
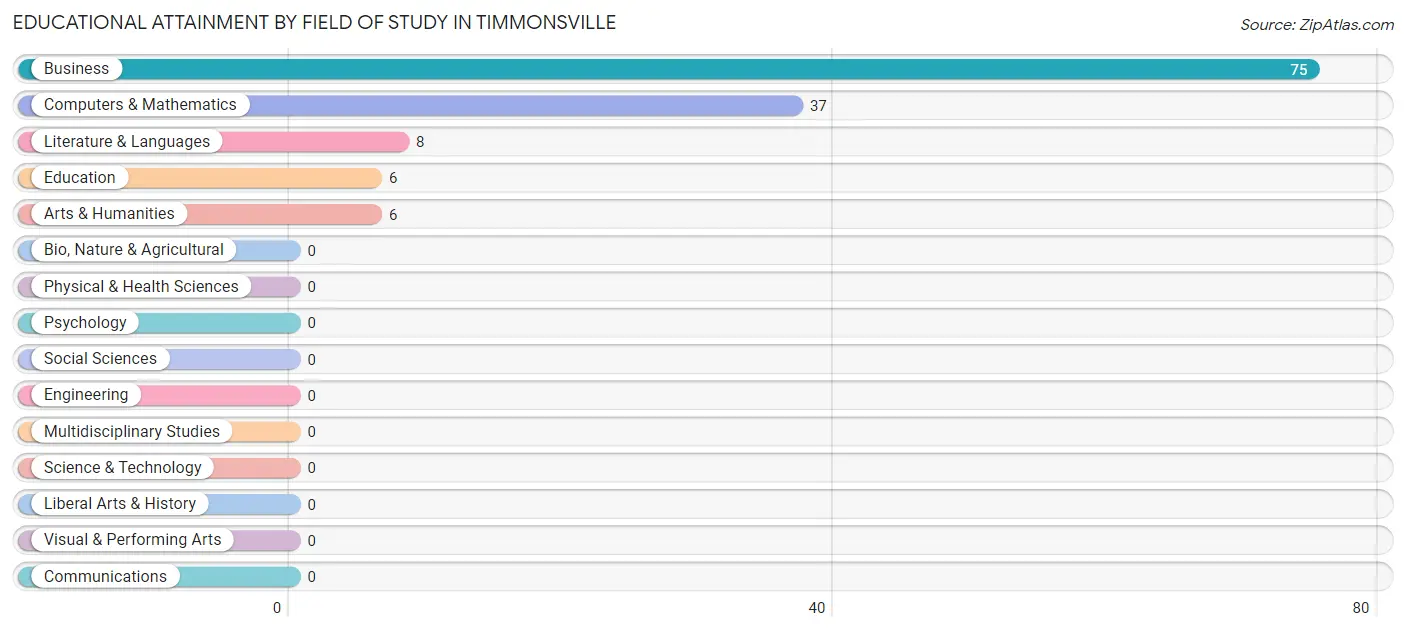
| Field of Study | # Graduates | % Graduates |
| Computers & Mathematics | 37 | 28.0% |
| Bio, Nature & Agricultural | 0 | 0.0% |
| Physical & Health Sciences | 0 | 0.0% |
| Psychology | 0 | 0.0% |
| Social Sciences | 0 | 0.0% |
| Engineering | 0 | 0.0% |
| Multidisciplinary Studies | 0 | 0.0% |
| Science & Technology | 0 | 0.0% |
| Business | 75 | 56.8% |
| Education | 6 | 4.5% |
| Literature & Languages | 8 | 6.1% |
| Liberal Arts & History | 0 | 0.0% |
| Visual & Performing Arts | 0 | 0.0% |
| Communications | 0 | 0.0% |
| Arts & Humanities | 6 | 4.5% |
| Total | 132 | 100.0% |
Transportation & Commute in Timmonsville
Vehicle Availability by Sex in Timmonsville
The most prevalent vehicle ownership categories in Timmonsville are males with 2 vehicles (186, accounting for 39.9%) and females with 2 vehicles (186, making up 47.2%).
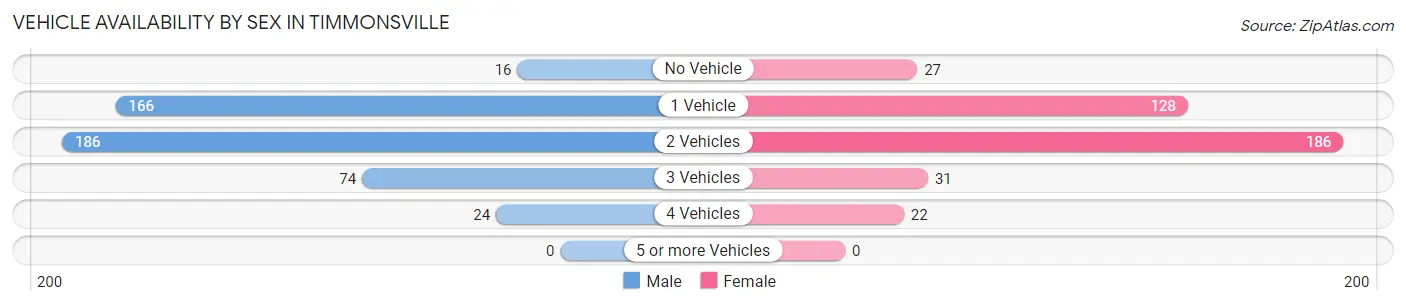
| Vehicles Available | Male | Female |
| No Vehicle | 16 (3.4%) | 27 (6.9%) |
| 1 Vehicle | 166 (35.6%) | 128 (32.5%) |
| 2 Vehicles | 186 (39.9%) | 186 (47.2%) |
| 3 Vehicles | 74 (15.9%) | 31 (7.9%) |
| 4 Vehicles | 24 (5.1%) | 22 (5.6%) |
| 5 or more Vehicles | 0 (0.0%) | 0 (0.0%) |
| Total | 466 (100.0%) | 394 (100.0%) |
Commute Time in Timmonsville
The most frequently occuring commute durations in Timmonsville are 20 to 24 minutes (254 commuters, 32.2%), 15 to 19 minutes (141 commuters, 17.8%), and 25 to 29 minutes (135 commuters, 17.1%).
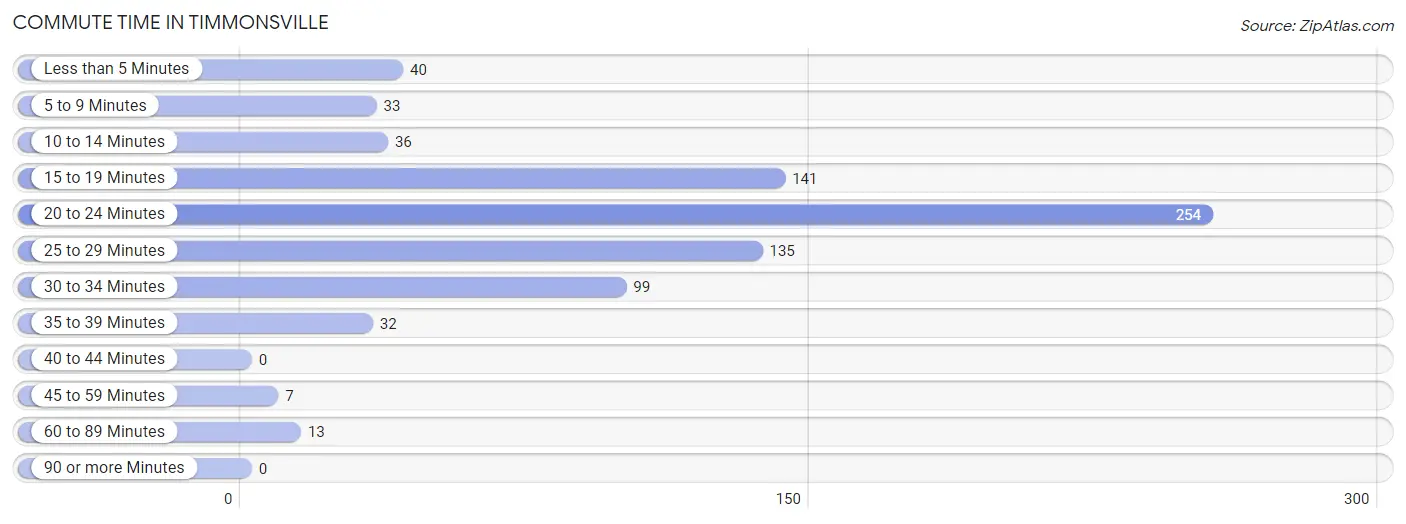
| Commute Time | # Commuters | % Commuters |
| Less than 5 Minutes | 40 | 5.1% |
| 5 to 9 Minutes | 33 | 4.2% |
| 10 to 14 Minutes | 36 | 4.6% |
| 15 to 19 Minutes | 141 | 17.8% |
| 20 to 24 Minutes | 254 | 32.2% |
| 25 to 29 Minutes | 135 | 17.1% |
| 30 to 34 Minutes | 99 | 12.5% |
| 35 to 39 Minutes | 32 | 4.1% |
| 40 to 44 Minutes | 0 | 0.0% |
| 45 to 59 Minutes | 7 | 0.9% |
| 60 to 89 Minutes | 13 | 1.7% |
| 90 or more Minutes | 0 | 0.0% |
Commute Time by Sex in Timmonsville
The most common commute times in Timmonsville are 20 to 24 minutes (127 commuters, 29.6%) for males and 20 to 24 minutes (127 commuters, 35.2%) for females.
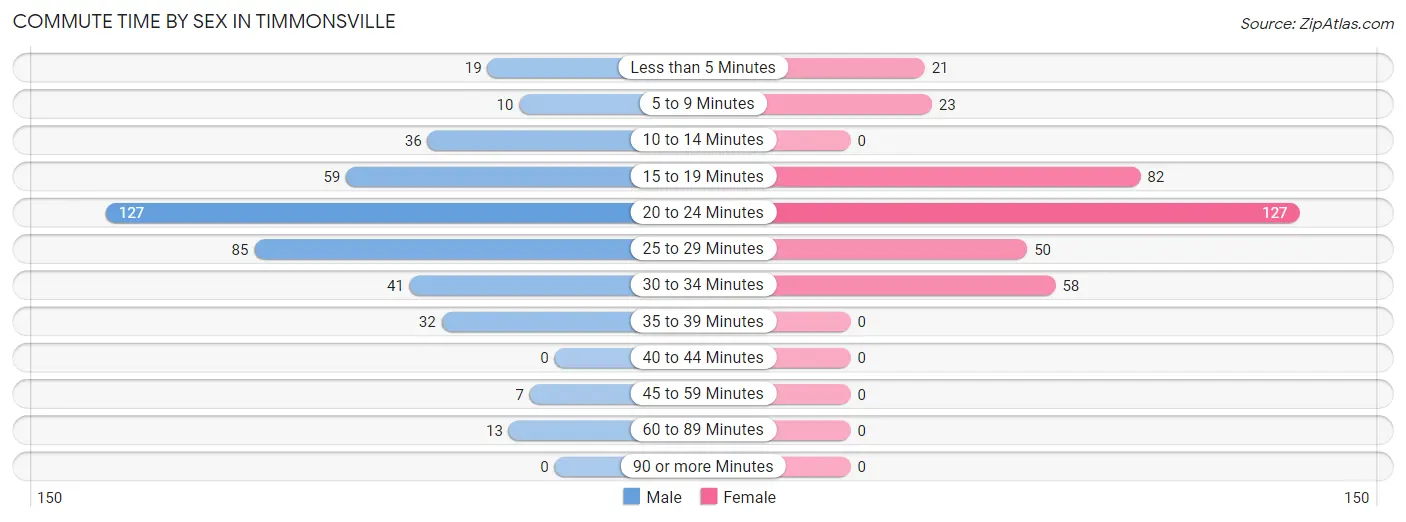
| Commute Time | Male | Female |
| Less than 5 Minutes | 19 (4.4%) | 21 (5.8%) |
| 5 to 9 Minutes | 10 (2.3%) | 23 (6.4%) |
| 10 to 14 Minutes | 36 (8.4%) | 0 (0.0%) |
| 15 to 19 Minutes | 59 (13.8%) | 82 (22.7%) |
| 20 to 24 Minutes | 127 (29.6%) | 127 (35.2%) |
| 25 to 29 Minutes | 85 (19.8%) | 50 (13.9%) |
| 30 to 34 Minutes | 41 (9.6%) | 58 (16.1%) |
| 35 to 39 Minutes | 32 (7.5%) | 0 (0.0%) |
| 40 to 44 Minutes | 0 (0.0%) | 0 (0.0%) |
| 45 to 59 Minutes | 7 (1.6%) | 0 (0.0%) |
| 60 to 89 Minutes | 13 (3.0%) | 0 (0.0%) |
| 90 or more Minutes | 0 (0.0%) | 0 (0.0%) |
Time of Departure to Work by Sex in Timmonsville
The most frequent times of departure to work in Timmonsville are 12:00 PM to 3:59 PM (87, 20.3%) for males and 6:30 AM to 6:59 AM (84, 23.3%) for females.
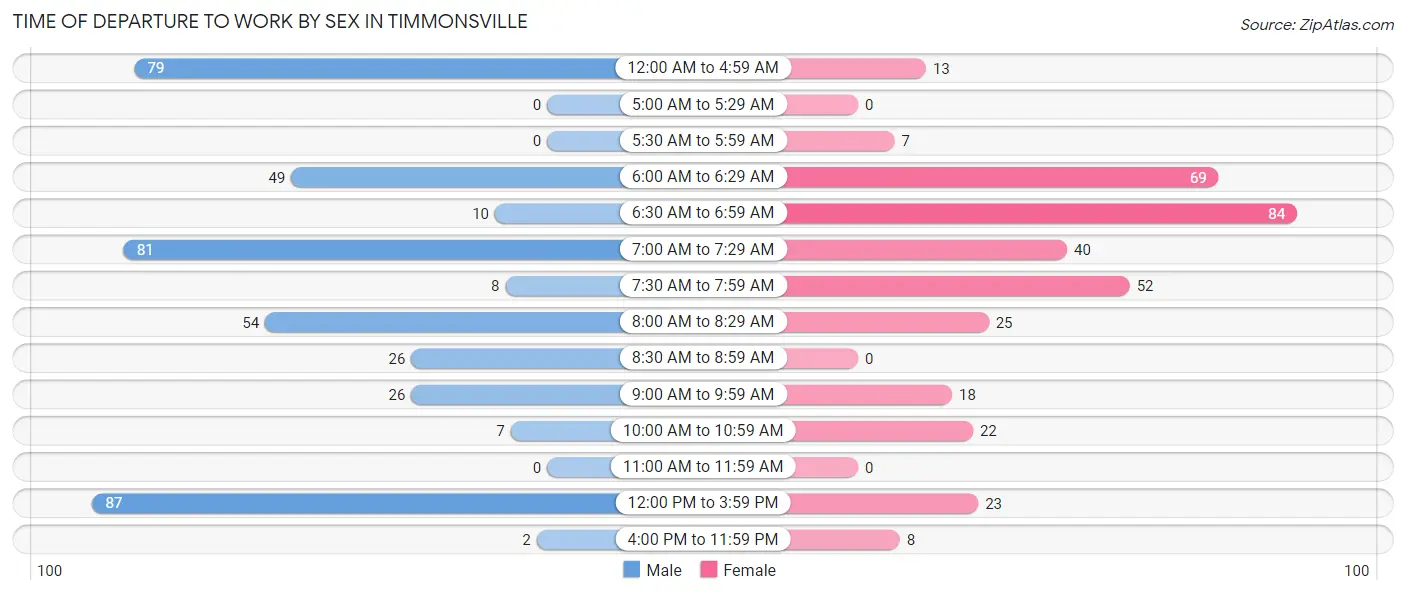
| Time of Departure | Male | Female |
| 12:00 AM to 4:59 AM | 79 (18.4%) | 13 (3.6%) |
| 5:00 AM to 5:29 AM | 0 (0.0%) | 0 (0.0%) |
| 5:30 AM to 5:59 AM | 0 (0.0%) | 7 (1.9%) |
| 6:00 AM to 6:29 AM | 49 (11.4%) | 69 (19.1%) |
| 6:30 AM to 6:59 AM | 10 (2.3%) | 84 (23.3%) |
| 7:00 AM to 7:29 AM | 81 (18.9%) | 40 (11.1%) |
| 7:30 AM to 7:59 AM | 8 (1.9%) | 52 (14.4%) |
| 8:00 AM to 8:29 AM | 54 (12.6%) | 25 (6.9%) |
| 8:30 AM to 8:59 AM | 26 (6.1%) | 0 (0.0%) |
| 9:00 AM to 9:59 AM | 26 (6.1%) | 18 (5.0%) |
| 10:00 AM to 10:59 AM | 7 (1.6%) | 22 (6.1%) |
| 11:00 AM to 11:59 AM | 0 (0.0%) | 0 (0.0%) |
| 12:00 PM to 3:59 PM | 87 (20.3%) | 23 (6.4%) |
| 4:00 PM to 11:59 PM | 2 (0.5%) | 8 (2.2%) |
| Total | 429 (100.0%) | 361 (100.0%) |
Housing Occupancy in Timmonsville
Occupancy by Ownership in Timmonsville
Of the total 922 dwellings in Timmonsville, owner-occupied units account for 425 (46.1%), while renter-occupied units make up 497 (53.9%).
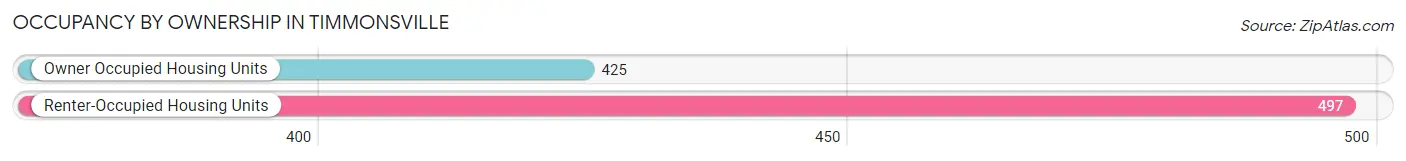
| Occupancy | # Housing Units | % Housing Units |
| Owner Occupied Housing Units | 425 | 46.1% |
| Renter-Occupied Housing Units | 497 | 53.9% |
| Total Occupied Housing Units | 922 | 100.0% |
Occupancy by Household Size in Timmonsville
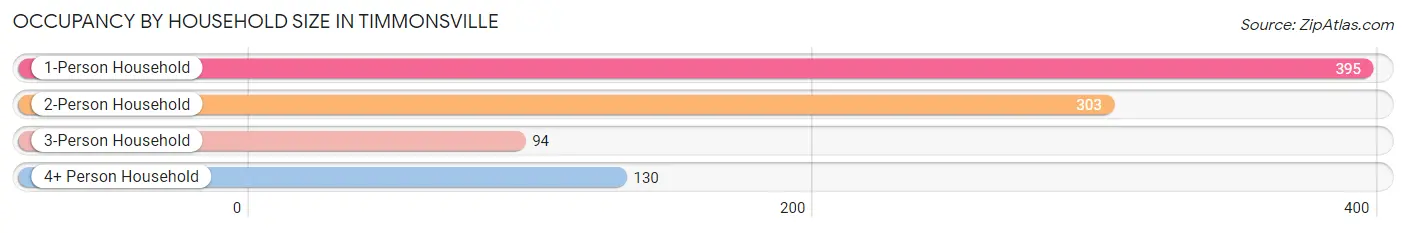
| Household Size | # Housing Units | % Housing Units |
| 1-Person Household | 395 | 42.8% |
| 2-Person Household | 303 | 32.9% |
| 3-Person Household | 94 | 10.2% |
| 4+ Person Household | 130 | 14.1% |
| Total Housing Units | 922 | 100.0% |
Occupancy by Ownership by Household Size in Timmonsville
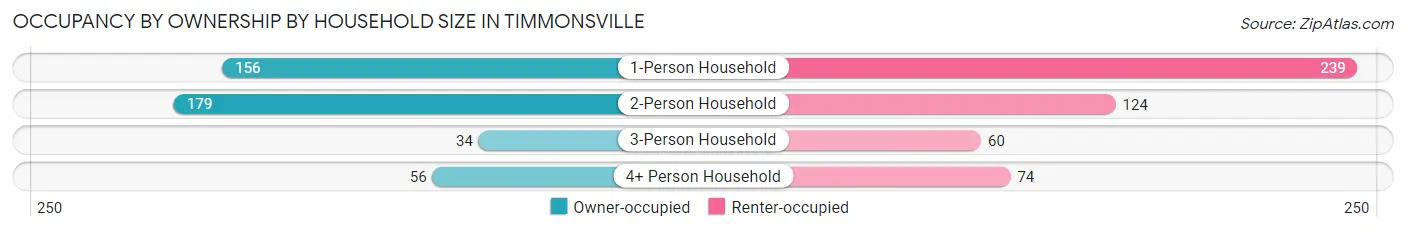
| Household Size | Owner-occupied | Renter-occupied |
| 1-Person Household | 156 (39.5%) | 239 (60.5%) |
| 2-Person Household | 179 (59.1%) | 124 (40.9%) |
| 3-Person Household | 34 (36.2%) | 60 (63.8%) |
| 4+ Person Household | 56 (43.1%) | 74 (56.9%) |
| Total Housing Units | 425 (46.1%) | 497 (53.9%) |
Occupancy by Educational Attainment in Timmonsville
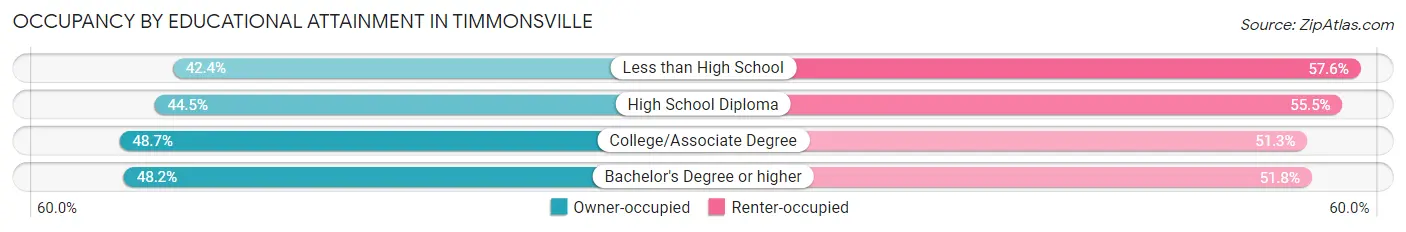
| Household Size | Owner-occupied | Renter-occupied |
| Less than High School | 64 (42.4%) | 87 (57.6%) |
| High School Diploma | 151 (44.5%) | 188 (55.5%) |
| College/Associate Degree | 170 (48.7%) | 179 (51.3%) |
| Bachelor's Degree or higher | 40 (48.2%) | 43 (51.8%) |
Occupancy by Age of Householder in Timmonsville
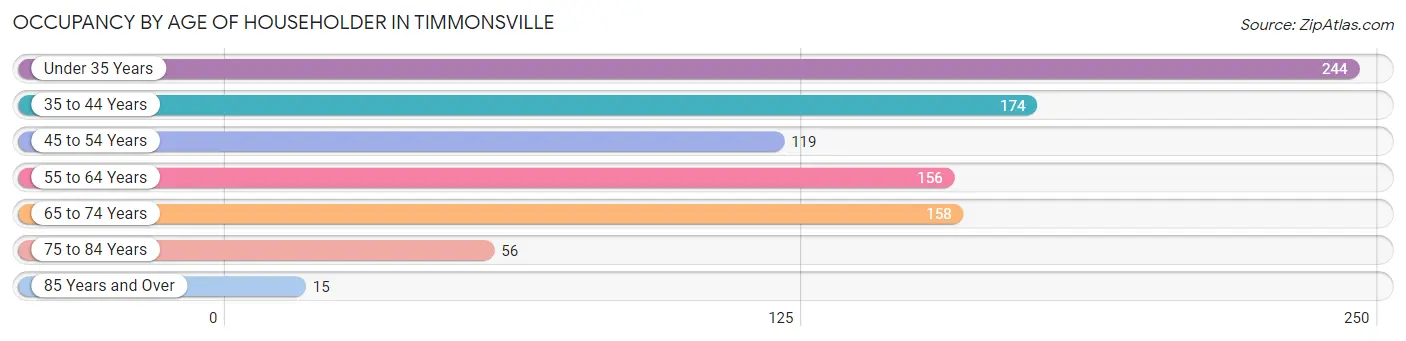
| Age Bracket | # Households | % Households |
| Under 35 Years | 244 | 26.5% |
| 35 to 44 Years | 174 | 18.9% |
| 45 to 54 Years | 119 | 12.9% |
| 55 to 64 Years | 156 | 16.9% |
| 65 to 74 Years | 158 | 17.1% |
| 75 to 84 Years | 56 | 6.1% |
| 85 Years and Over | 15 | 1.6% |
| Total | 922 | 100.0% |
Housing Finances in Timmonsville
Median Income by Occupancy in Timmonsville
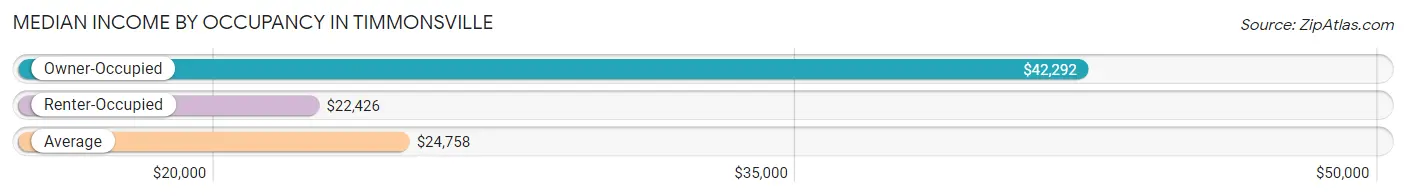
| Occupancy Type | # Households | Median Income |
| Owner-Occupied | 425 (46.1%) | $42,292 |
| Renter-Occupied | 497 (53.9%) | $22,426 |
| Average | 922 (100.0%) | $24,758 |
Occupancy by Householder Income Bracket in Timmonsville
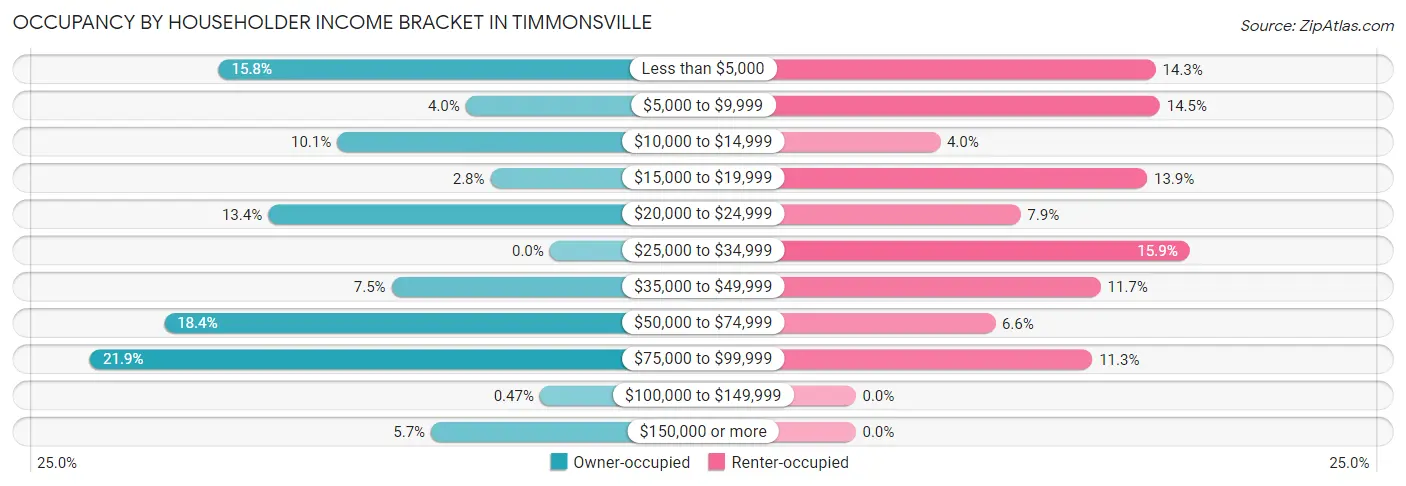
| Income Bracket | Owner-occupied | Renter-occupied |
| Less than $5,000 | 67 (15.8%) | 71 (14.3%) |
| $5,000 to $9,999 | 17 (4.0%) | 72 (14.5%) |
| $10,000 to $14,999 | 43 (10.1%) | 20 (4.0%) |
| $15,000 to $19,999 | 12 (2.8%) | 69 (13.9%) |
| $20,000 to $24,999 | 57 (13.4%) | 39 (7.9%) |
| $25,000 to $34,999 | 0 (0.0%) | 79 (15.9%) |
| $35,000 to $49,999 | 32 (7.5%) | 58 (11.7%) |
| $50,000 to $74,999 | 78 (18.3%) | 33 (6.6%) |
| $75,000 to $99,999 | 93 (21.9%) | 56 (11.3%) |
| $100,000 to $149,999 | 2 (0.5%) | 0 (0.0%) |
| $150,000 or more | 24 (5.7%) | 0 (0.0%) |
| Total | 425 (100.0%) | 497 (100.0%) |
Monthly Housing Cost Tiers in Timmonsville
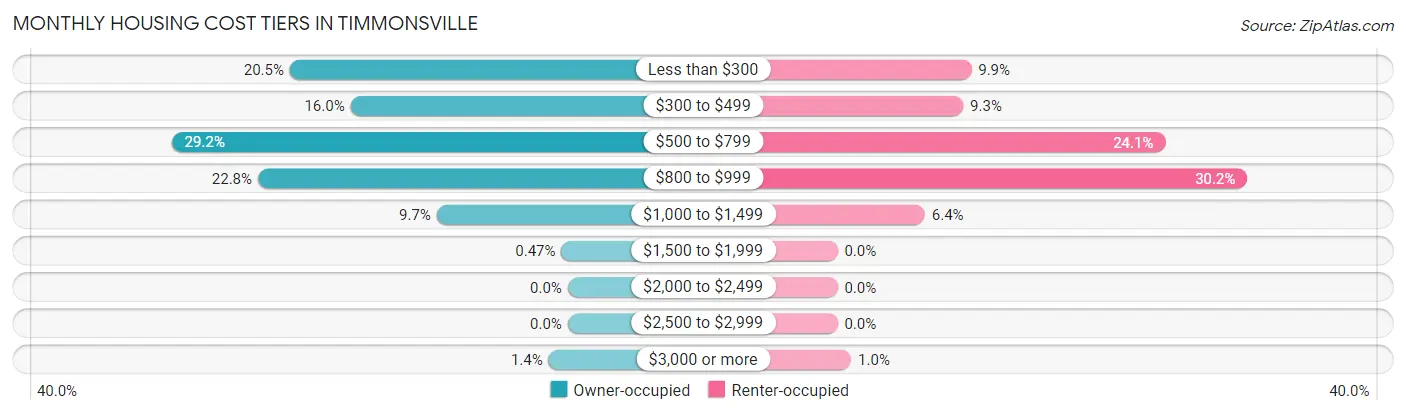
| Monthly Cost | Owner-occupied | Renter-occupied |
| Less than $300 | 87 (20.5%) | 49 (9.9%) |
| $300 to $499 | 68 (16.0%) | 46 (9.3%) |
| $500 to $799 | 124 (29.2%) | 120 (24.1%) |
| $800 to $999 | 97 (22.8%) | 150 (30.2%) |
| $1,000 to $1,499 | 41 (9.7%) | 32 (6.4%) |
| $1,500 to $1,999 | 2 (0.5%) | 0 (0.0%) |
| $2,000 to $2,499 | 0 (0.0%) | 0 (0.0%) |
| $2,500 to $2,999 | 0 (0.0%) | 0 (0.0%) |
| $3,000 or more | 6 (1.4%) | 5 (1.0%) |
| Total | 425 (100.0%) | 497 (100.0%) |
Physical Housing Characteristics in Timmonsville
Housing Structures in Timmonsville
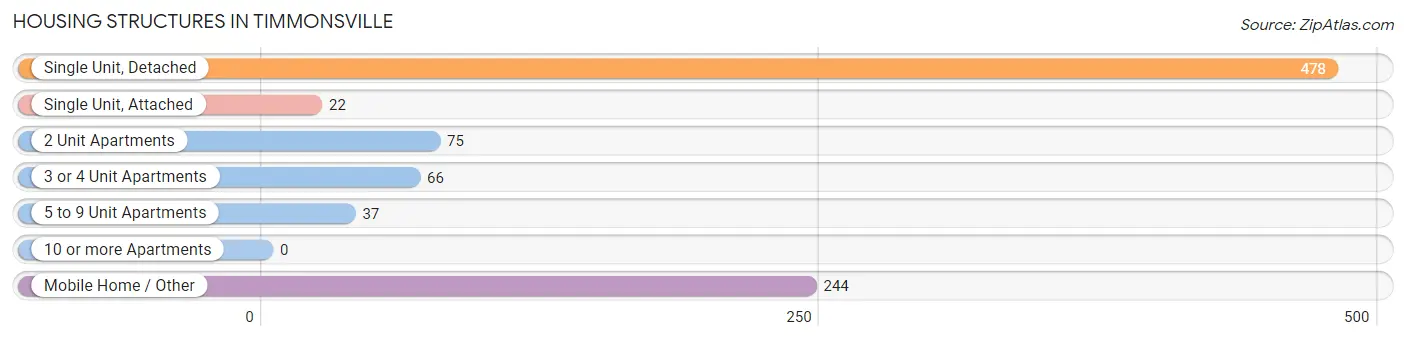
| Structure Type | # Housing Units | % Housing Units |
| Single Unit, Detached | 478 | 51.8% |
| Single Unit, Attached | 22 | 2.4% |
| 2 Unit Apartments | 75 | 8.1% |
| 3 or 4 Unit Apartments | 66 | 7.2% |
| 5 to 9 Unit Apartments | 37 | 4.0% |
| 10 or more Apartments | 0 | 0.0% |
| Mobile Home / Other | 244 | 26.5% |
| Total | 922 | 100.0% |
Housing Structures by Occupancy in Timmonsville
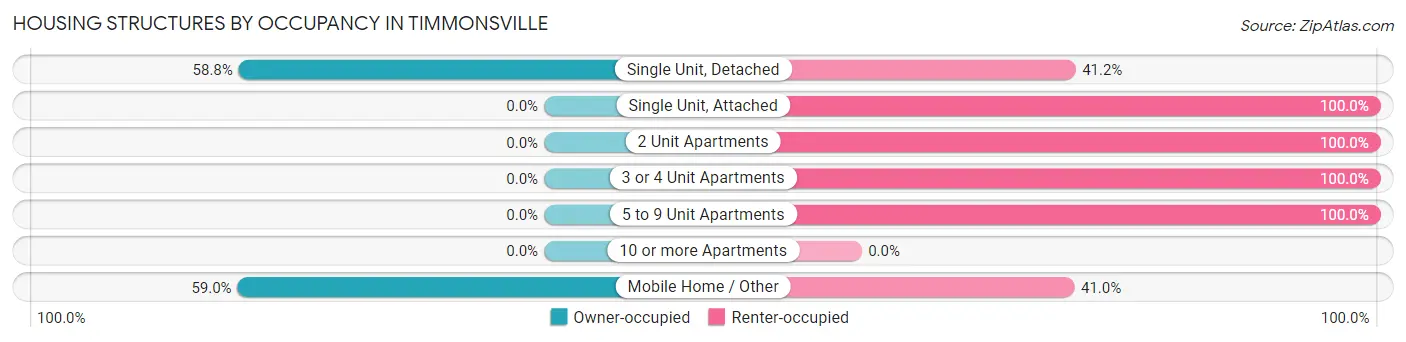
| Structure Type | Owner-occupied | Renter-occupied |
| Single Unit, Detached | 281 (58.8%) | 197 (41.2%) |
| Single Unit, Attached | 0 (0.0%) | 22 (100.0%) |
| 2 Unit Apartments | 0 (0.0%) | 75 (100.0%) |
| 3 or 4 Unit Apartments | 0 (0.0%) | 66 (100.0%) |
| 5 to 9 Unit Apartments | 0 (0.0%) | 37 (100.0%) |
| 10 or more Apartments | 0 (0.0%) | 0 (0.0%) |
| Mobile Home / Other | 144 (59.0%) | 100 (41.0%) |
| Total | 425 (46.1%) | 497 (53.9%) |
Housing Structures by Number of Rooms in Timmonsville
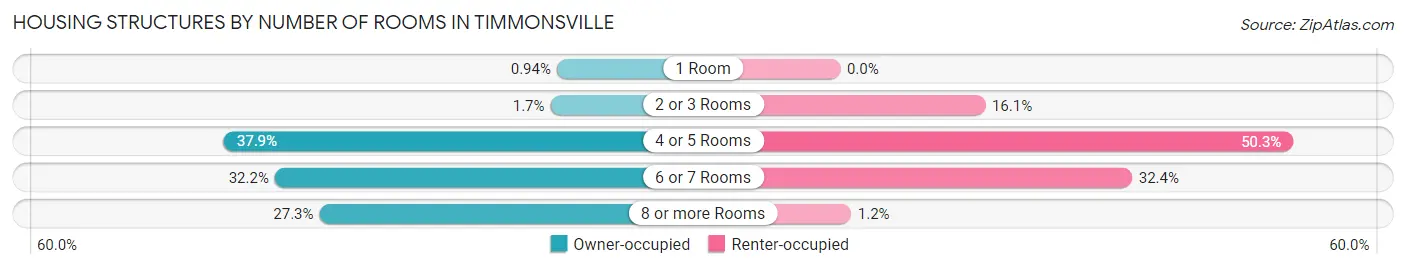
| Number of Rooms | Owner-occupied | Renter-occupied |
| 1 Room | 4 (0.9%) | 0 (0.0%) |
| 2 or 3 Rooms | 7 (1.7%) | 80 (16.1%) |
| 4 or 5 Rooms | 161 (37.9%) | 250 (50.3%) |
| 6 or 7 Rooms | 137 (32.2%) | 161 (32.4%) |
| 8 or more Rooms | 116 (27.3%) | 6 (1.2%) |
| Total | 425 (100.0%) | 497 (100.0%) |
Housing Structure by Heating Type in Timmonsville
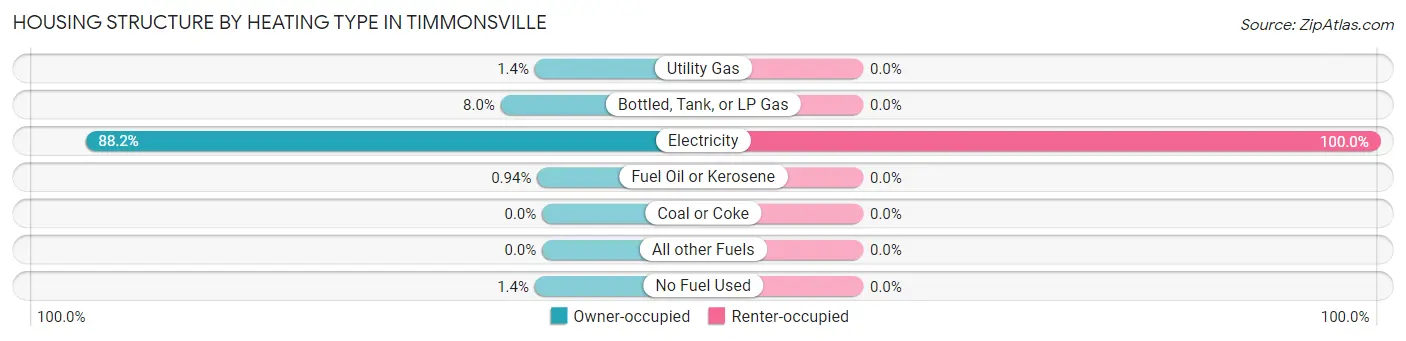
| Heating Type | Owner-occupied | Renter-occupied |
| Utility Gas | 6 (1.4%) | 0 (0.0%) |
| Bottled, Tank, or LP Gas | 34 (8.0%) | 0 (0.0%) |
| Electricity | 375 (88.2%) | 497 (100.0%) |
| Fuel Oil or Kerosene | 4 (0.9%) | 0 (0.0%) |
| Coal or Coke | 0 (0.0%) | 0 (0.0%) |
| All other Fuels | 0 (0.0%) | 0 (0.0%) |
| No Fuel Used | 6 (1.4%) | 0 (0.0%) |
| Total | 425 (100.0%) | 497 (100.0%) |
Household Vehicle Usage in Timmonsville
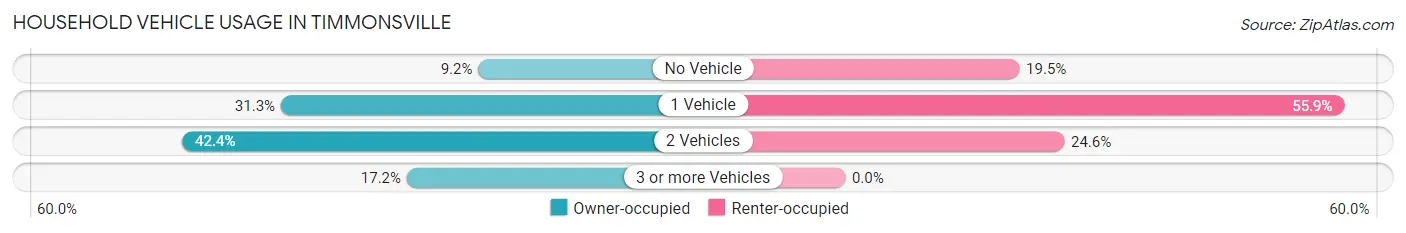
| Vehicles per Household | Owner-occupied | Renter-occupied |
| No Vehicle | 39 (9.2%) | 97 (19.5%) |
| 1 Vehicle | 133 (31.3%) | 278 (55.9%) |
| 2 Vehicles | 180 (42.3%) | 122 (24.5%) |
| 3 or more Vehicles | 73 (17.2%) | 0 (0.0%) |
| Total | 425 (100.0%) | 497 (100.0%) |
Real Estate & Mortgages in Timmonsville
Real Estate and Mortgage Overview in Timmonsville
| Characteristic | Without Mortgage | With Mortgage |
| Housing Units | 258 | 167 |
| Median Property Value | $82,800 | $116,600 |
| Median Household Income | $22,688 | $0 |
| Monthly Housing Costs | $457 | $0 |
| Real Estate Taxes | $346 | $0 |
Property Value by Mortgage Status in Timmonsville
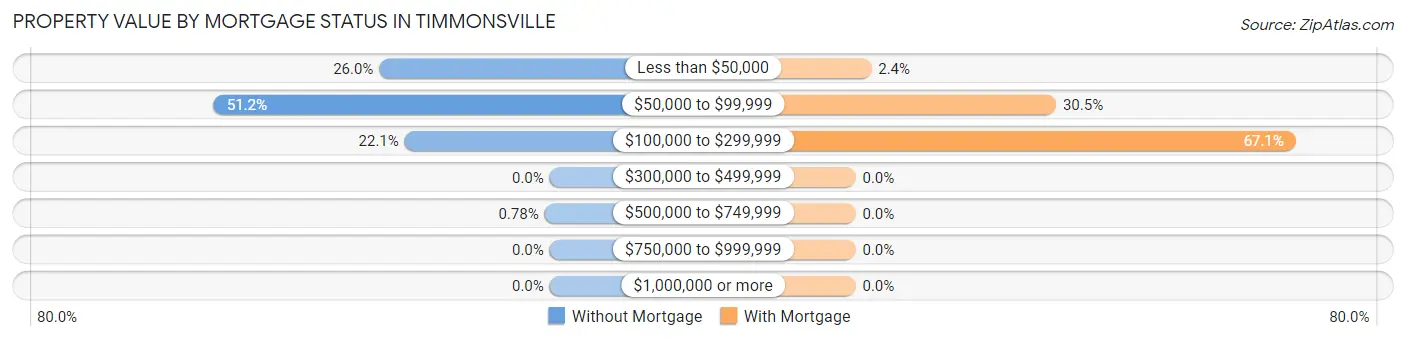
| Property Value | Without Mortgage | With Mortgage |
| Less than $50,000 | 67 (26.0%) | 4 (2.4%) |
| $50,000 to $99,999 | 132 (51.2%) | 51 (30.5%) |
| $100,000 to $299,999 | 57 (22.1%) | 112 (67.1%) |
| $300,000 to $499,999 | 0 (0.0%) | 0 (0.0%) |
| $500,000 to $749,999 | 2 (0.8%) | 0 (0.0%) |
| $750,000 to $999,999 | 0 (0.0%) | 0 (0.0%) |
| $1,000,000 or more | 0 (0.0%) | 0 (0.0%) |
| Total | 258 (100.0%) | 167 (100.0%) |
Household Income by Mortgage Status in Timmonsville
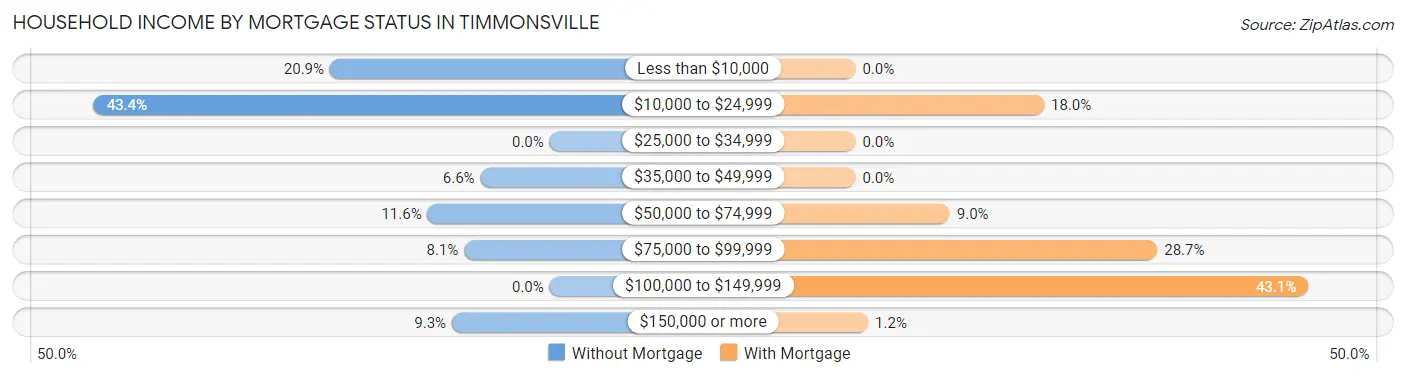
| Household Income | Without Mortgage | With Mortgage |
| Less than $10,000 | 54 (20.9%) | 0 (0.0%) |
| $10,000 to $24,999 | 112 (43.4%) | 30 (18.0%) |
| $25,000 to $34,999 | 0 (0.0%) | 0 (0.0%) |
| $35,000 to $49,999 | 17 (6.6%) | 0 (0.0%) |
| $50,000 to $74,999 | 30 (11.6%) | 15 (9.0%) |
| $75,000 to $99,999 | 21 (8.1%) | 48 (28.7%) |
| $100,000 to $149,999 | 0 (0.0%) | 72 (43.1%) |
| $150,000 or more | 24 (9.3%) | 2 (1.2%) |
| Total | 258 (100.0%) | 167 (100.0%) |
Property Value to Household Income Ratio in Timmonsville
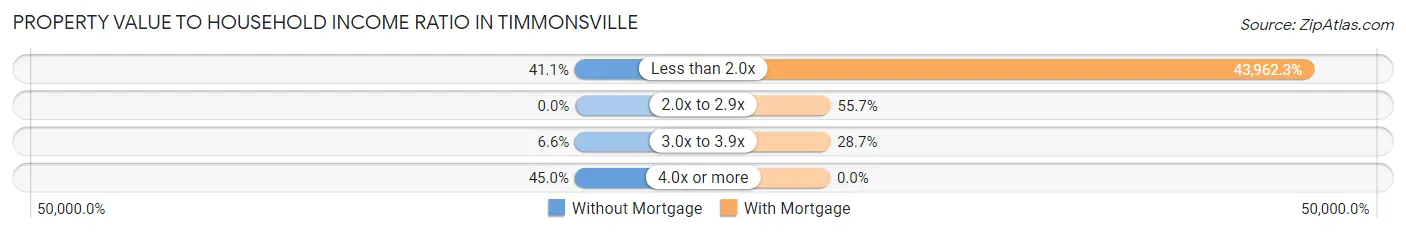
| Value-to-Income Ratio | Without Mortgage | With Mortgage |
| Less than 2.0x | 106 (41.1%) | 73,417 (43,962.3%) |
| 2.0x to 2.9x | 0 (0.0%) | 93 (55.7%) |
| 3.0x to 3.9x | 17 (6.6%) | 48 (28.7%) |
| 4.0x or more | 116 (45.0%) | 0 (0.0%) |
| Total | 258 (100.0%) | 167 (100.0%) |
Real Estate Taxes by Mortgage Status in Timmonsville
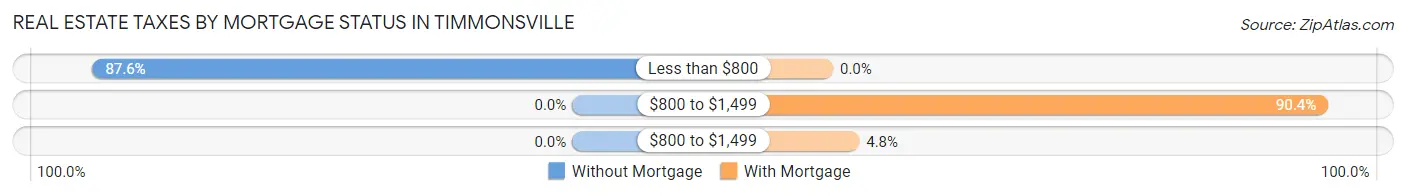
| Property Taxes | Without Mortgage | With Mortgage |
| Less than $800 | 226 (87.6%) | 0 (0.0%) |
| $800 to $1,499 | 0 (0.0%) | 151 (90.4%) |
| $800 to $1,499 | 0 (0.0%) | 8 (4.8%) |
| Total | 258 (100.0%) | 167 (100.0%) |
Health & Disability in Timmonsville
Health Insurance Coverage by Age in Timmonsville
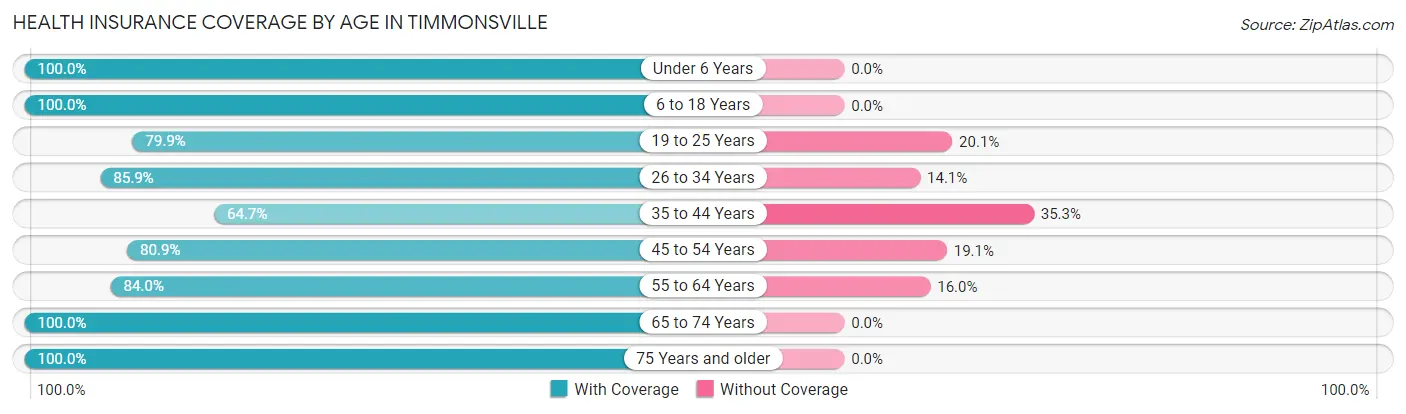
| Age Bracket | With Coverage | Without Coverage |
| Under 6 Years | 268 (100.0%) | 0 (0.0%) |
| 6 to 18 Years | 210 (100.0%) | 0 (0.0%) |
| 19 to 25 Years | 290 (79.9%) | 73 (20.1%) |
| 26 to 34 Years | 164 (85.9%) | 27 (14.1%) |
| 35 to 44 Years | 172 (64.7%) | 94 (35.3%) |
| 45 to 54 Years | 182 (80.9%) | 43 (19.1%) |
| 55 to 64 Years | 225 (84.0%) | 43 (16.0%) |
| 65 to 74 Years | 224 (100.0%) | 0 (0.0%) |
| 75 Years and older | 104 (100.0%) | 0 (0.0%) |
| Total | 1,839 (86.8%) | 280 (13.2%) |
Health Insurance Coverage by Citizenship Status in Timmonsville
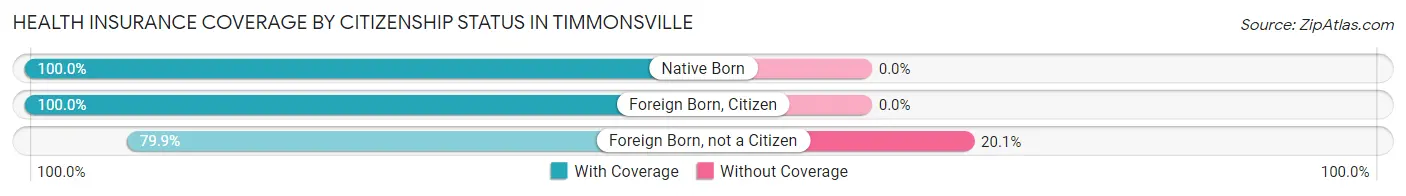
| Citizenship Status | With Coverage | Without Coverage |
| Native Born | 268 (100.0%) | 0 (0.0%) |
| Foreign Born, Citizen | 210 (100.0%) | 0 (0.0%) |
| Foreign Born, not a Citizen | 290 (79.9%) | 73 (20.1%) |
Health Insurance Coverage by Household Income in Timmonsville
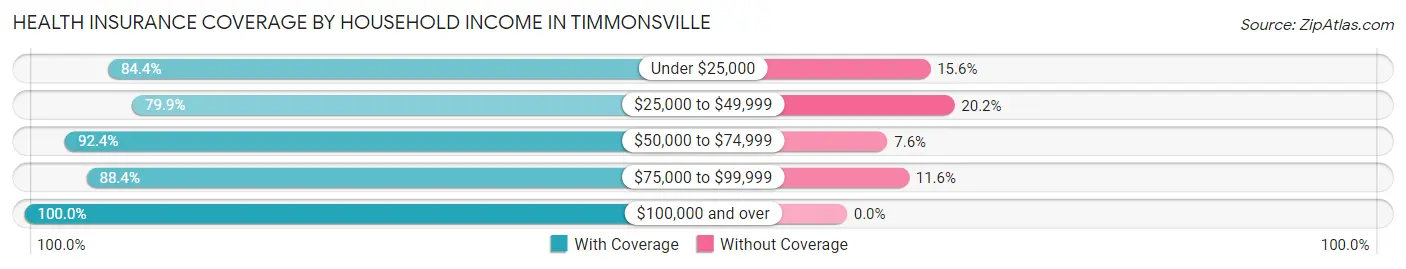
| Household Income | With Coverage | Without Coverage |
| Under $25,000 | 718 (84.4%) | 133 (15.6%) |
| $25,000 to $49,999 | 218 (79.8%) | 55 (20.2%) |
| $50,000 to $74,999 | 365 (92.4%) | 30 (7.6%) |
| $75,000 to $99,999 | 472 (88.4%) | 62 (11.6%) |
| $100,000 and over | 53 (100.0%) | 0 (0.0%) |
Public vs Private Health Insurance Coverage by Age in Timmonsville
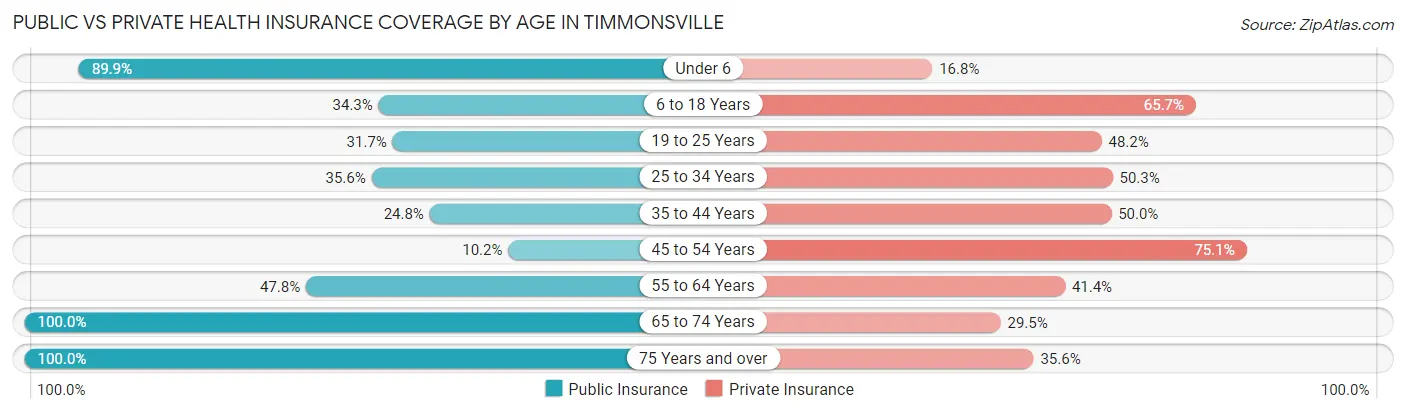
| Age Bracket | Public Insurance | Private Insurance |
| Under 6 | 241 (89.9%) | 45 (16.8%) |
| 6 to 18 Years | 72 (34.3%) | 138 (65.7%) |
| 19 to 25 Years | 115 (31.7%) | 175 (48.2%) |
| 25 to 34 Years | 68 (35.6%) | 96 (50.3%) |
| 35 to 44 Years | 66 (24.8%) | 133 (50.0%) |
| 45 to 54 Years | 23 (10.2%) | 169 (75.1%) |
| 55 to 64 Years | 128 (47.8%) | 111 (41.4%) |
| 65 to 74 Years | 224 (100.0%) | 66 (29.5%) |
| 75 Years and over | 104 (100.0%) | 37 (35.6%) |
| Total | 1,041 (49.1%) | 970 (45.8%) |
Disability Status by Sex by Age in Timmonsville
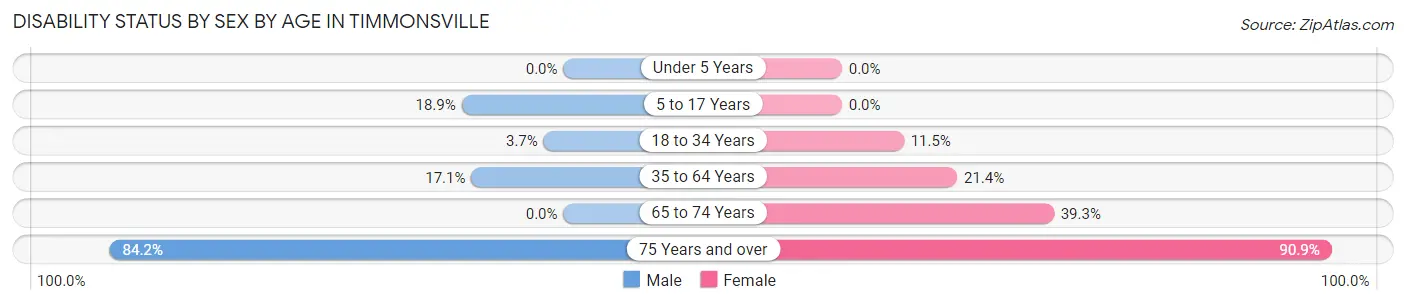
| Age Bracket | Male | Female |
| Under 5 Years | 0 (0.0%) | 0 (0.0%) |
| 5 to 17 Years | 41 (18.9%) | 0 (0.0%) |
| 18 to 34 Years | 12 (3.7%) | 30 (11.5%) |
| 35 to 64 Years | 61 (17.1%) | 86 (21.4%) |
| 65 to 74 Years | 0 (0.0%) | 48 (39.3%) |
| 75 Years and over | 32 (84.2%) | 60 (90.9%) |
Disability Class by Sex by Age in Timmonsville
Disability Class: Hearing Difficulty
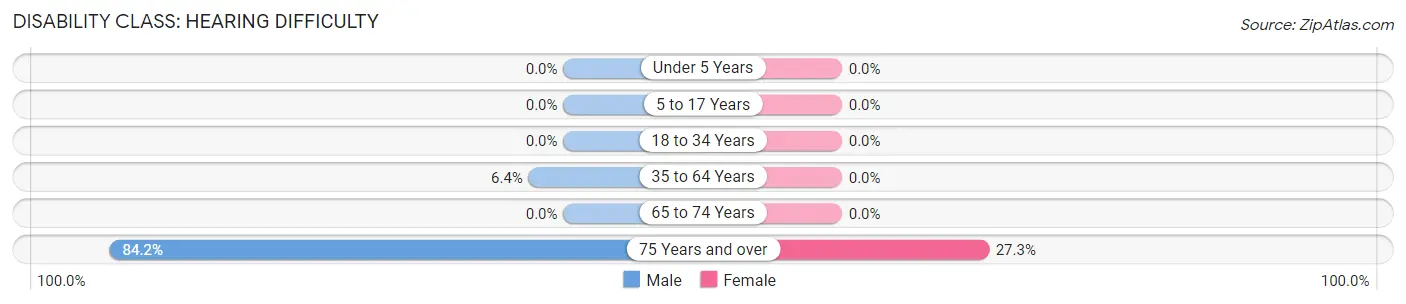
| Age Bracket | Male | Female |
| Under 5 Years | 0 (0.0%) | 0 (0.0%) |
| 5 to 17 Years | 0 (0.0%) | 0 (0.0%) |
| 18 to 34 Years | 0 (0.0%) | 0 (0.0%) |
| 35 to 64 Years | 23 (6.4%) | 0 (0.0%) |
| 65 to 74 Years | 0 (0.0%) | 0 (0.0%) |
| 75 Years and over | 32 (84.2%) | 18 (27.3%) |
Disability Class: Vision Difficulty
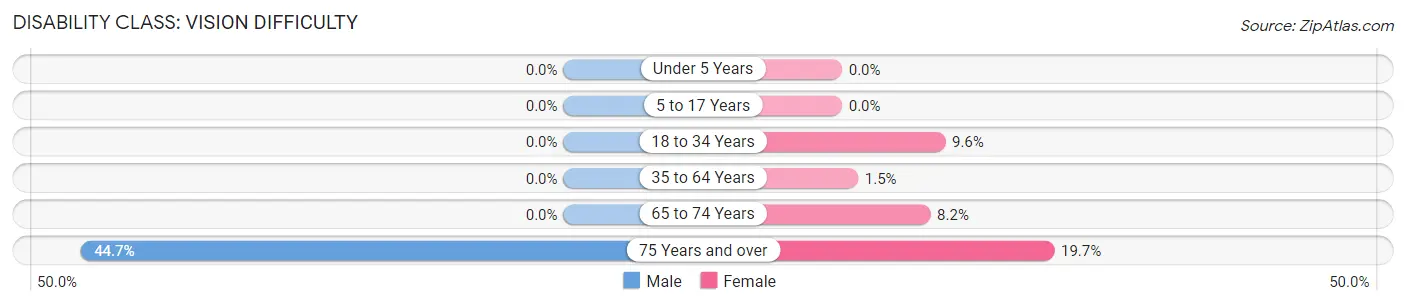
| Age Bracket | Male | Female |
| Under 5 Years | 0 (0.0%) | 0 (0.0%) |
| 5 to 17 Years | 0 (0.0%) | 0 (0.0%) |
| 18 to 34 Years | 0 (0.0%) | 25 (9.6%) |
| 35 to 64 Years | 0 (0.0%) | 6 (1.5%) |
| 65 to 74 Years | 0 (0.0%) | 10 (8.2%) |
| 75 Years and over | 17 (44.7%) | 13 (19.7%) |
Disability Class: Cognitive Difficulty
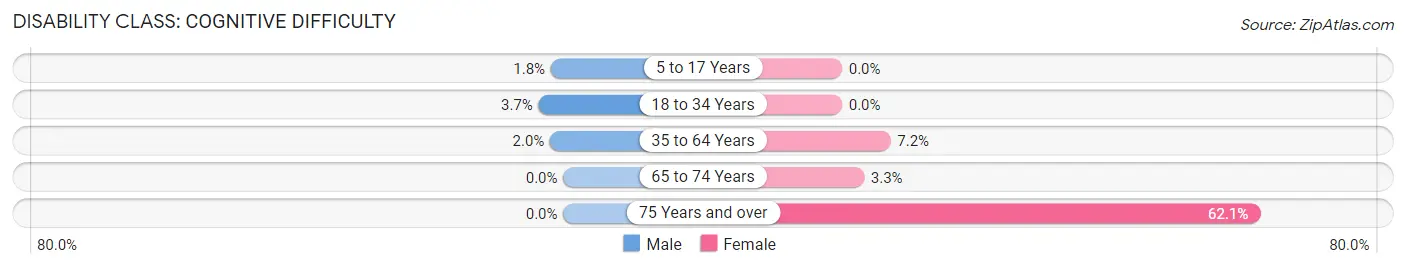
| Age Bracket | Male | Female |
| 5 to 17 Years | 4 (1.8%) | 0 (0.0%) |
| 18 to 34 Years | 12 (3.7%) | 0 (0.0%) |
| 35 to 64 Years | 7 (2.0%) | 29 (7.2%) |
| 65 to 74 Years | 0 (0.0%) | 4 (3.3%) |
| 75 Years and over | 0 (0.0%) | 41 (62.1%) |
Disability Class: Ambulatory Difficulty
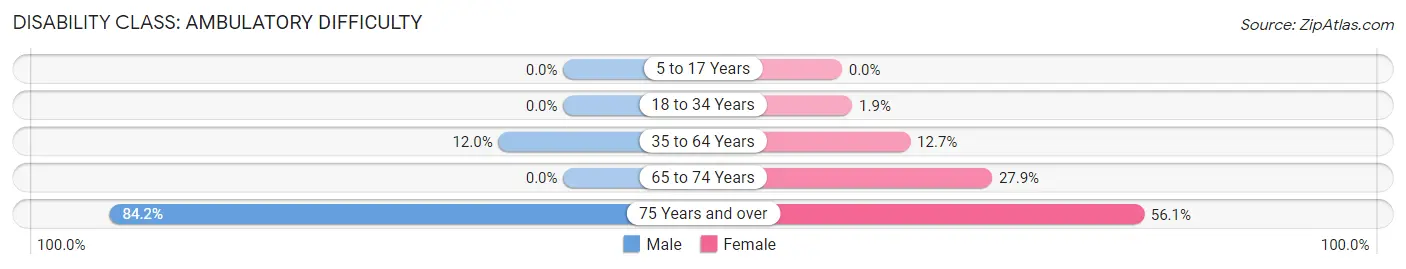
| Age Bracket | Male | Female |
| 5 to 17 Years | 0 (0.0%) | 0 (0.0%) |
| 18 to 34 Years | 0 (0.0%) | 5 (1.9%) |
| 35 to 64 Years | 43 (12.0%) | 51 (12.7%) |
| 65 to 74 Years | 0 (0.0%) | 34 (27.9%) |
| 75 Years and over | 32 (84.2%) | 37 (56.1%) |
Disability Class: Self-Care Difficulty
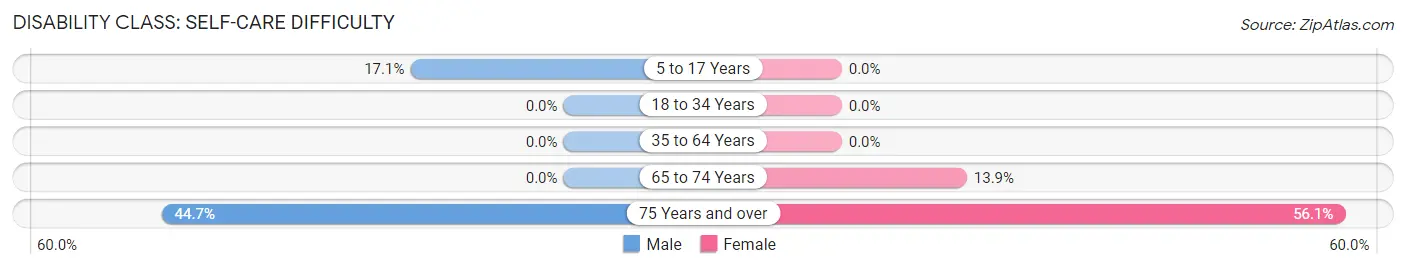
| Age Bracket | Male | Female |
| 5 to 17 Years | 37 (17.1%) | 0 (0.0%) |
| 18 to 34 Years | 0 (0.0%) | 0 (0.0%) |
| 35 to 64 Years | 0 (0.0%) | 0 (0.0%) |
| 65 to 74 Years | 0 (0.0%) | 17 (13.9%) |
| 75 Years and over | 17 (44.7%) | 37 (56.1%) |
Technology Access in Timmonsville
Computing Device Access in Timmonsville
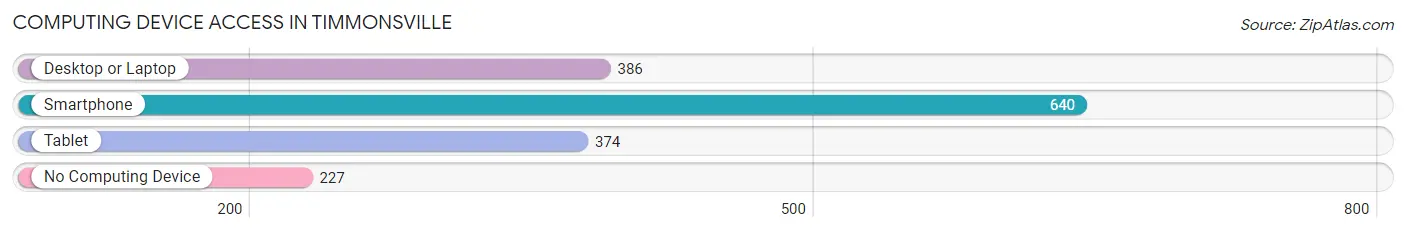
| Device Type | # Households | % Households |
| Desktop or Laptop | 386 | 41.9% |
| Smartphone | 640 | 69.4% |
| Tablet | 374 | 40.6% |
| No Computing Device | 227 | 24.6% |
| Total | 922 | 100.0% |
Internet Access in Timmonsville
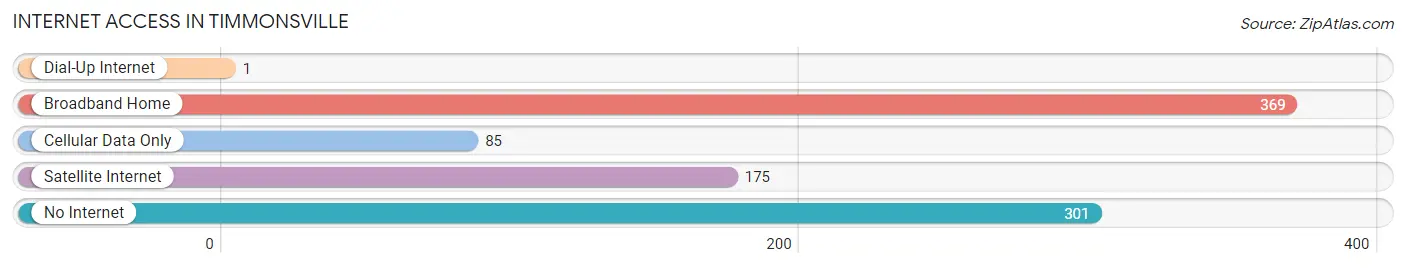
| Internet Type | # Households | % Households |
| Dial-Up Internet | 1 | 0.1% |
| Broadband Home | 369 | 40.0% |
| Cellular Data Only | 85 | 9.2% |
| Satellite Internet | 175 | 19.0% |
| No Internet | 301 | 32.7% |
| Total | 922 | 100.0% |
Timmonsville Summary
Timmonsville is a small town located in Florence County, South Carolina. It is situated in the Pee Dee region of the state, approximately 30 miles east of Florence and 60 miles northwest of Myrtle Beach. The town was founded in 1883 and named after the Timmons family, who were among the first settlers in the area. As of the 2010 census, the population of Timmonsville was 2,407.
Geography
Timmonsville is located at 33°59'N 79°51'W (33.983, -79.851). According to the United States Census Bureau, the town has a total area of 1.2 square miles (3.2 km2), all of it land.
The town is located in the Pee Dee region of South Carolina, which is characterized by flat, sandy terrain and numerous rivers and streams. The town is situated on the banks of the Lynches River, which flows through the town and is a popular spot for fishing and boating.
Economy
Timmonsville's economy is largely based on agriculture and manufacturing. The town is home to several large poultry farms, as well as a number of smaller farms that produce cotton, soybeans, and other crops. The town is also home to several manufacturing plants, including a paper mill and a furniture factory.
The town is also home to several small businesses, including restaurants, retail stores, and service providers. The town is also home to a number of churches, which provide a variety of services to the community.
Demographics
As of the 2010 census, there were 2,407 people, 945 households, and 645 families residing in the town. The population density was 1,988.3 people per square mile (766.3/km2). There were 1,053 housing units at an average density of 864.2 per square mile (333.3/km2). The racial makeup of the town was 57.2% White, 39.7% African American, 0.2% Native American, 0.7% Asian, 0.1% Pacific Islander, 1.2% from other races, and 1.0% from two or more races. Hispanic or Latino of any race were 2.2% of the population.
There were 945 households, out of which 28.2% had children under the age of 18 living with them, 43.2% were married couples living together, 19.2% had a female householder with no husband present, and 32.7% were non-families. 28.2% of all households were made up of individuals, and 12.2% had someone living alone who was 65 years of age or older. The average household size was 2.53 and the average family size was 3.09.
In the town, the population was spread out, with 25.2% under the age of 18, 8.2% from 18 to 24, 25.7% from 25 to 44, 24.2% from 45 to 64, and 16.7% who were 65 years of age or older. The median age was 38 years. For every 100 females, there were 87.2 males. For every 100 females age 18 and over, there were 81.2 males.
The median income for a household in the town was $27,917, and the median income for a family was $32,917. Males had a median income of $27,917 versus $20,000 for females. The per capita income for the town was $14,917. About 17.2% of families and 20.2% of the population were below the poverty line, including 28.2% of those under age 18 and 16.7% of those age 65 or over.
Common Questions
What is Per Capita Income in Timmonsville?
Per Capita income in Timmonsville is $18,816.
What is the Median Family Income in Timmonsville?
Median Family Income in Timmonsville is $35,909.
What is the Median Household income in Timmonsville?
Median Household Income in Timmonsville is $24,758.
What is Income or Wage Gap in Timmonsville?
Income or Wage Gap in Timmonsville is 25.8%.
Women in Timmonsville earn 74.2 cents for every dollar earned by a man.
What is Inequality or Gini Index in Timmonsville?
Inequality or Gini Index in Timmonsville is 0.54.
What is the Total Population of Timmonsville?
Total Population of Timmonsville is 2,119.
What is the Total Male Population of Timmonsville?
Total Male Population of Timmonsville is 1,145.
What is the Total Female Population of Timmonsville?
Total Female Population of Timmonsville is 974.
What is the Ratio of Males per 100 Females in Timmonsville?
There are 117.56 Males per 100 Females in Timmonsville.
What is the Ratio of Females per 100 Males in Timmonsville?
There are 85.07 Females per 100 Males in Timmonsville.
What is the Median Population Age in Timmonsville?
Median Population Age in Timmonsville is 37.8 Years.
What is the Average Family Size in Timmonsville
Average Family Size in Timmonsville is 3.3 People.
What is the Average Household Size in Timmonsville
Average Household Size in Timmonsville is 2.3 People.
How Large is the Labor Force in Timmonsville?
There are 933 People in the Labor Forcein in Timmonsville.
What is the Percentage of People in the Labor Force in Timmonsville?
54.1% of People are in the Labor Force in Timmonsville.
What is the Unemployment Rate in Timmonsville?
Unemployment Rate in Timmonsville is 7.8%.