Bennettsville, SC Map & Demographics
Bennettsville Map
Bennettsville Overview
$21,151
PER CAPITA INCOME
$43,000
AVG FAMILY INCOME
$37,891
AVG HOUSEHOLD INCOME
31.6%
WAGE / INCOME GAP [ % ]
68.4¢/ $1
WAGE / INCOME GAP [ $ ]
$11,953
FAMILY INCOME DEFICIT
0.49
INEQUALITY / GINI INDEX
6,975
TOTAL POPULATION
3,331
MALE POPULATION
3,644
FEMALE POPULATION
91.41
MALES / 100 FEMALES
109.40
FEMALES / 100 MALES
40.5
MEDIAN AGE
3.3
AVG FAMILY SIZE
2.3
AVG HOUSEHOLD SIZE
2,728
LABOR FORCE [ PEOPLE ]
48.0%
PERCENT IN LABOR FORCE
6.5%
UNEMPLOYMENT RATE
Bennettsville Zip Codes
Bennettsville Area Codes
Income in Bennettsville
Income Overview in Bennettsville
Per Capita Income in Bennettsville is $21,151, while median incomes of families and households are $43,000 and $37,891 respectively.
| Characteristic | Number | Measure |
| Per Capita Income | 6,975 | $21,151 |
| Median Family Income | 1,314 | $43,000 |
| Mean Family Income | 1,314 | $60,435 |
| Median Household Income | 2,749 | $37,891 |
| Mean Household Income | 2,749 | $49,825 |
| Income Deficit | 1,314 | $11,953 |
| Wage / Income Gap (%) | 6,975 | 31.59% |
| Wage / Income Gap ($) | 6,975 | 68.41¢ per $1 |
| Gini / Inequality Index | 6,975 | 0.49 |
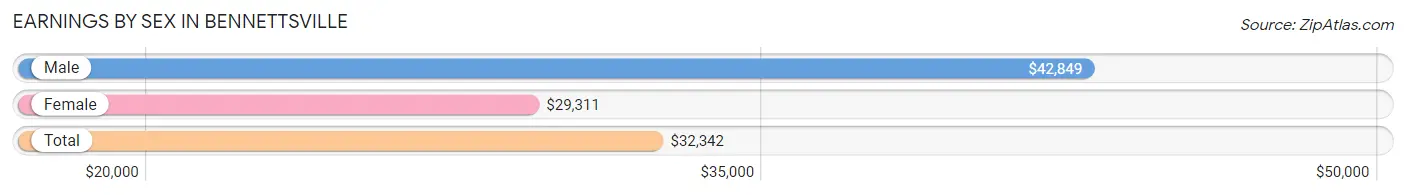
Earnings by Sex in Bennettsville
Average Earnings in Bennettsville are $32,342, $42,849 for men and $29,311 for women, a difference of 31.6%.
| Sex | Number | Average Earnings |
| Male | 1,163 (39.6%) | $42,849 |
| Female | 1,772 (60.4%) | $29,311 |
| Total | 2,935 (100.0%) | $32,342 |
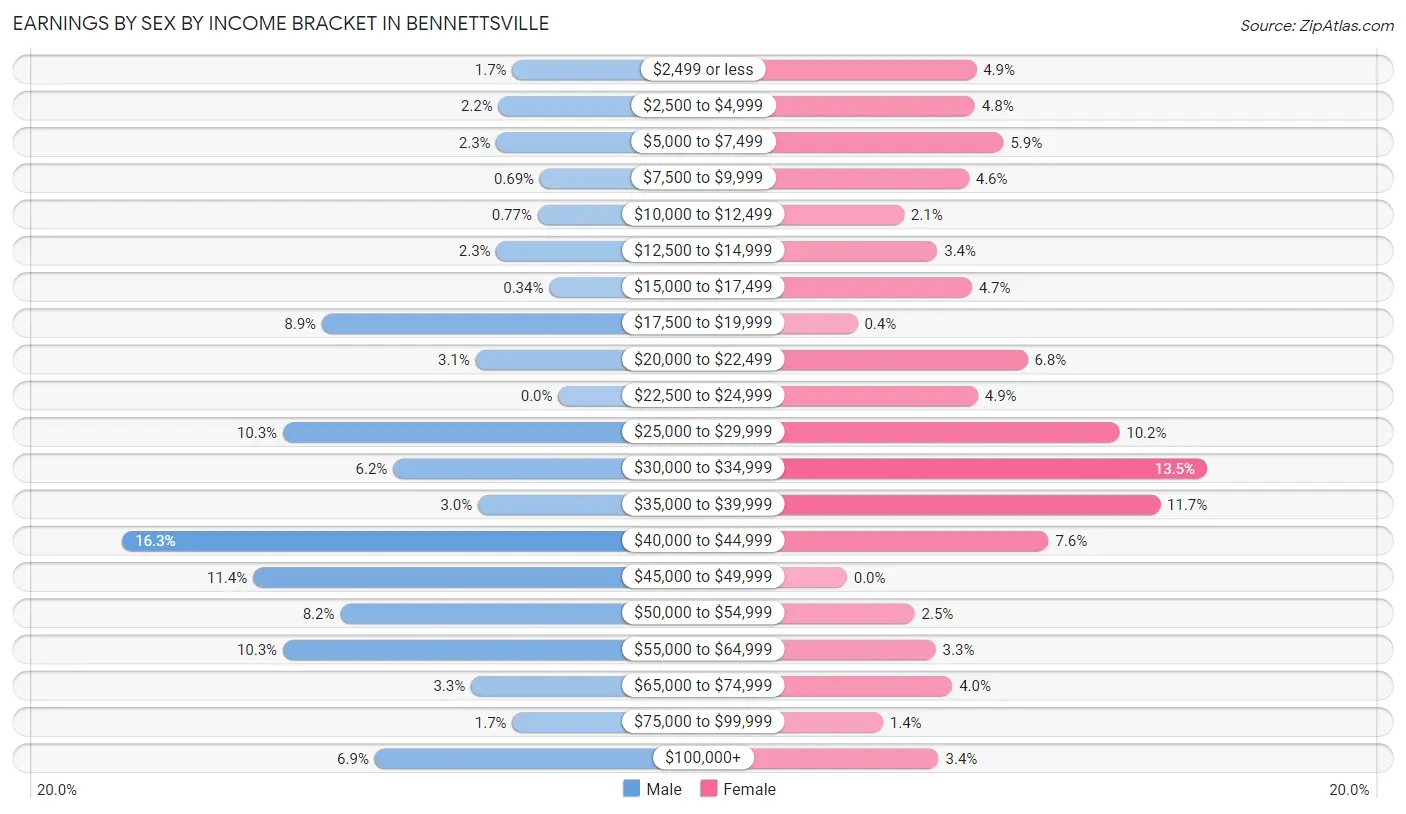
Earnings by Sex by Income Bracket in Bennettsville
The most common earnings brackets in Bennettsville are $40,000 to $44,999 for men (190 | 16.3%) and $30,000 to $34,999 for women (239 | 13.5%).
| Income | Male | Female |
| $2,499 or less | 20 (1.7%) | 86 (4.9%) |
| $2,500 to $4,999 | 26 (2.2%) | 85 (4.8%) |
| $5,000 to $7,499 | 27 (2.3%) | 104 (5.9%) |
| $7,500 to $9,999 | 8 (0.7%) | 81 (4.6%) |
| $10,000 to $12,499 | 9 (0.8%) | 38 (2.1%) |
| $12,500 to $14,999 | 27 (2.3%) | 60 (3.4%) |
| $15,000 to $17,499 | 4 (0.3%) | 83 (4.7%) |
| $17,500 to $19,999 | 103 (8.9%) | 7 (0.4%) |
| $20,000 to $22,499 | 36 (3.1%) | 120 (6.8%) |
| $22,500 to $24,999 | 0 (0.0%) | 87 (4.9%) |
| $25,000 to $29,999 | 120 (10.3%) | 181 (10.2%) |
| $30,000 to $34,999 | 72 (6.2%) | 239 (13.5%) |
| $35,000 to $39,999 | 35 (3.0%) | 208 (11.7%) |
| $40,000 to $44,999 | 190 (16.3%) | 134 (7.6%) |
| $45,000 to $49,999 | 133 (11.4%) | 0 (0.0%) |
| $50,000 to $54,999 | 95 (8.2%) | 45 (2.5%) |
| $55,000 to $64,999 | 120 (10.3%) | 59 (3.3%) |
| $65,000 to $74,999 | 38 (3.3%) | 70 (4.0%) |
| $75,000 to $99,999 | 20 (1.7%) | 24 (1.3%) |
| $100,000+ | 80 (6.9%) | 61 (3.4%) |
| Total | 1,163 (100.0%) | 1,772 (100.0%) |
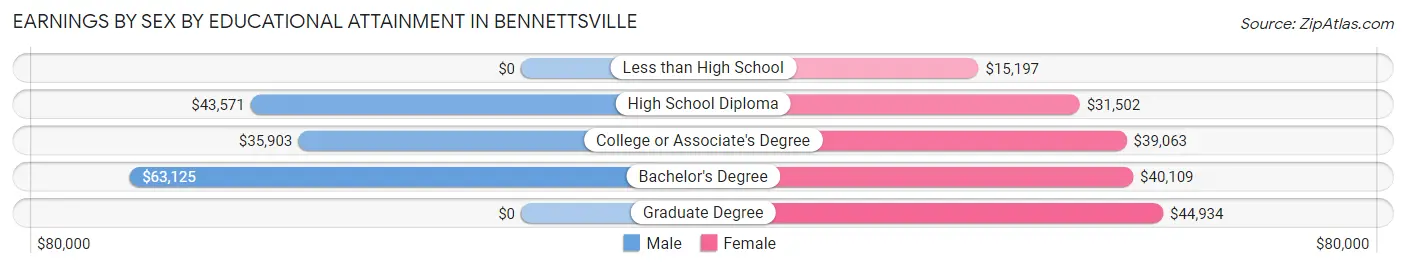
Earnings by Sex by Educational Attainment in Bennettsville
Average earnings in Bennettsville are $42,556 for men and $31,516 for women, a difference of 25.9%. Men with an educational attainment of bachelor's degree enjoy the highest average annual earnings of $63,125, while those with college or associate's degree education earn the least with $35,903. Women with an educational attainment of graduate degree earn the most with the average annual earnings of $44,934, while those with less than high school education have the smallest earnings of $15,197.
| Educational Attainment | Male Income | Female Income |
| Less than High School | - | - |
| High School Diploma | $43,571 | $31,502 |
| College or Associate's Degree | $35,903 | $39,063 |
| Bachelor's Degree | $63,125 | $40,109 |
| Graduate Degree | - | - |
| Total | $42,556 | $31,516 |
Family Income in Bennettsville
Family Income Brackets in Bennettsville
According to the Bennettsville family income data, there are 256 families falling into the $35,000 to $49,999 income range, which is the most common income bracket and makes up 19.5% of all families. Conversely, the $200,000+ income bracket is the least frequent group with only 14 families (1.1%) belonging to this category.
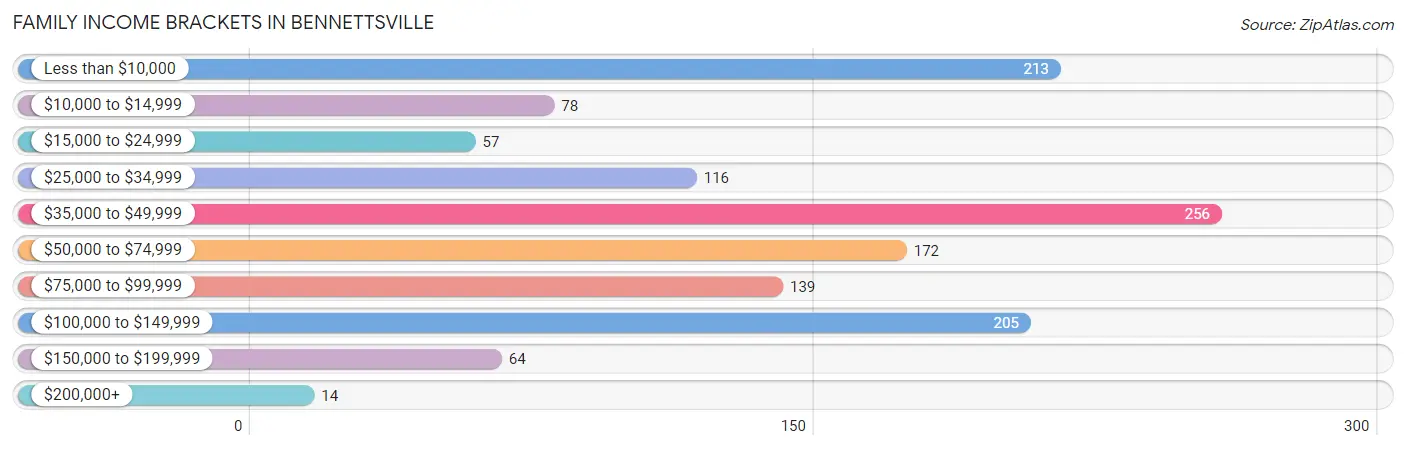
| Income Bracket | # Families | % Families |
| Less than $10,000 | 213 | 16.2% |
| $10,000 to $14,999 | 78 | 5.9% |
| $15,000 to $24,999 | 57 | 4.3% |
| $25,000 to $34,999 | 116 | 8.8% |
| $35,000 to $49,999 | 256 | 19.5% |
| $50,000 to $74,999 | 172 | 13.1% |
| $75,000 to $99,999 | 139 | 10.6% |
| $100,000 to $149,999 | 205 | 15.6% |
| $150,000 to $199,999 | 64 | 4.9% |
| $200,000+ | 14 | 1.1% |
Family Income by Famaliy Size in Bennettsville
4-person families (156 | 11.9%) account for the highest median family income in Bennettsville with $85,109 per family, while 4-person families (156 | 11.9%) have the highest median income of $21,277 per family member.
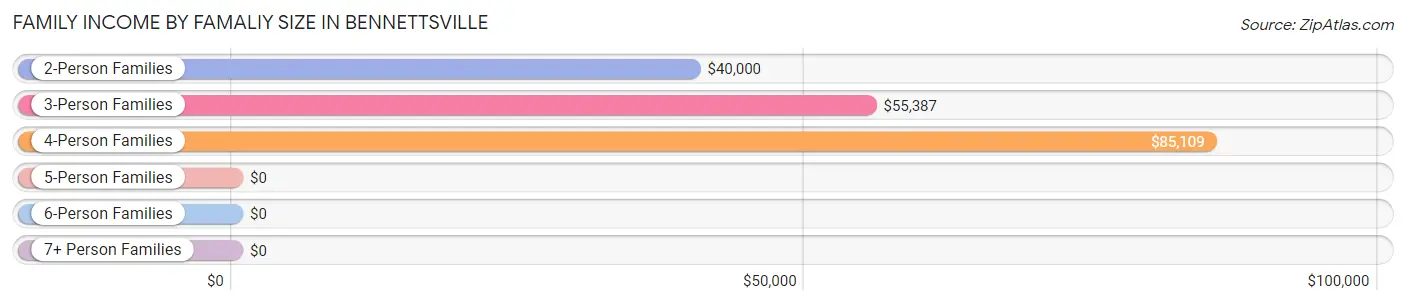
| Income Bracket | # Families | Median Income |
| 2-Person Families | 778 (59.2%) | $40,000 |
| 3-Person Families | 269 (20.5%) | $55,387 |
| 4-Person Families | 156 (11.9%) | $85,109 |
| 5-Person Families | 94 (7.1%) | $0 |
| 6-Person Families | 0 (0.0%) | $0 |
| 7+ Person Families | 17 (1.3%) | $0 |
| Total | 1,314 (100.0%) | $43,000 |
Family Income by Number of Earners in Bennettsville
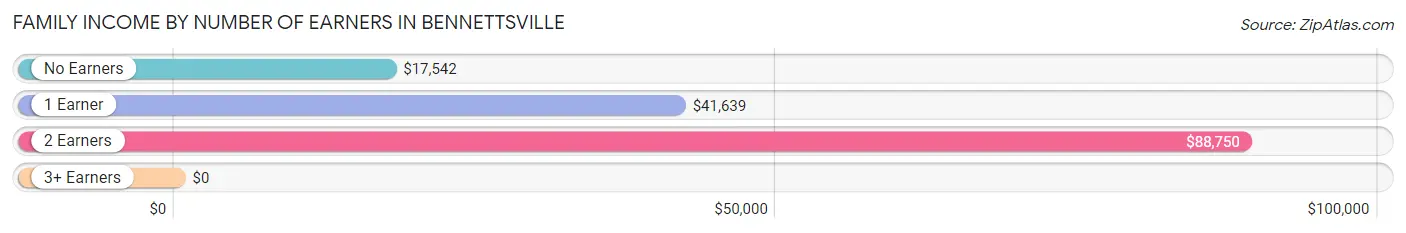
| Number of Earners | # Families | Median Income |
| No Earners | 417 (31.7%) | $17,542 |
| 1 Earner | 493 (37.5%) | $41,639 |
| 2 Earners | 354 (26.9%) | $88,750 |
| 3+ Earners | 50 (3.8%) | $0 |
| Total | 1,314 (100.0%) | $43,000 |
Household Income in Bennettsville
Household Income Brackets in Bennettsville
With 445 households falling in the category, the $35,000 to $49,999 income range is the most frequent in Bennettsville, accounting for 16.2% of all households. In contrast, only 27 households (1.0%) fall into the $200,000+ income bracket, making it the least populous group.
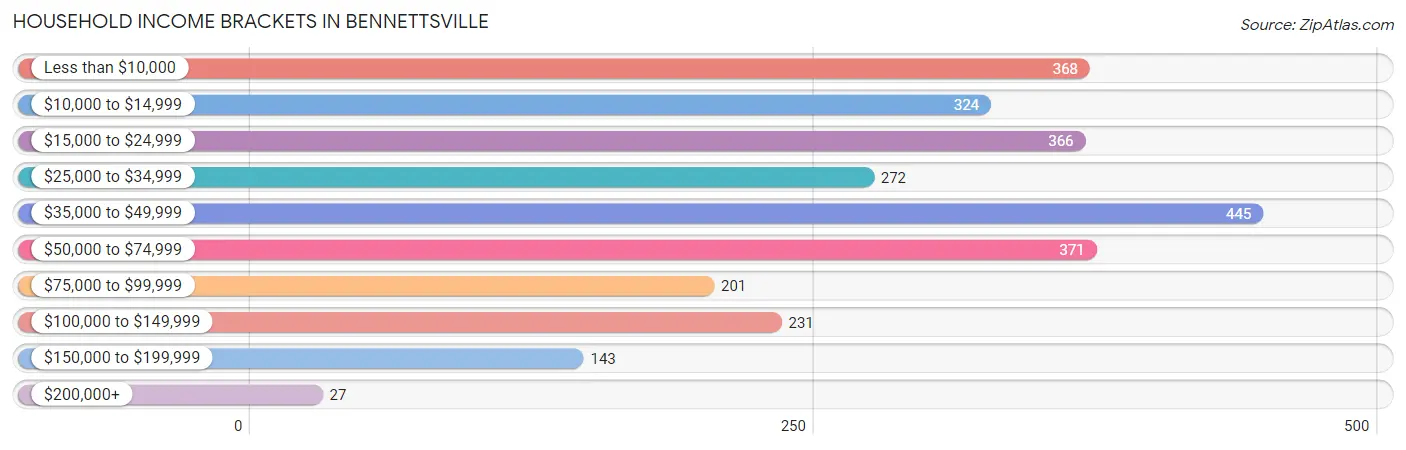
| Income Bracket | # Households | % Households |
| Less than $10,000 | 368 | 13.4% |
| $10,000 to $14,999 | 324 | 11.8% |
| $15,000 to $24,999 | 366 | 13.3% |
| $25,000 to $34,999 | 272 | 9.9% |
| $35,000 to $49,999 | 445 | 16.2% |
| $50,000 to $74,999 | 371 | 13.5% |
| $75,000 to $99,999 | 201 | 7.3% |
| $100,000 to $149,999 | 231 | 8.4% |
| $150,000 to $199,999 | 143 | 5.2% |
| $200,000+ | 27 | 1.0% |
Household Income by Householder Age in Bennettsville
The median household income in Bennettsville is $37,891, with the highest median household income of $42,521 found in the 25 to 44 years age bracket for the primary householder. A total of 1,085 households (39.5%) fall into this category. Meanwhile, the 15 to 24 years age bracket for the primary householder has the lowest median household income of $0, with 31 households (1.1%) in this group.
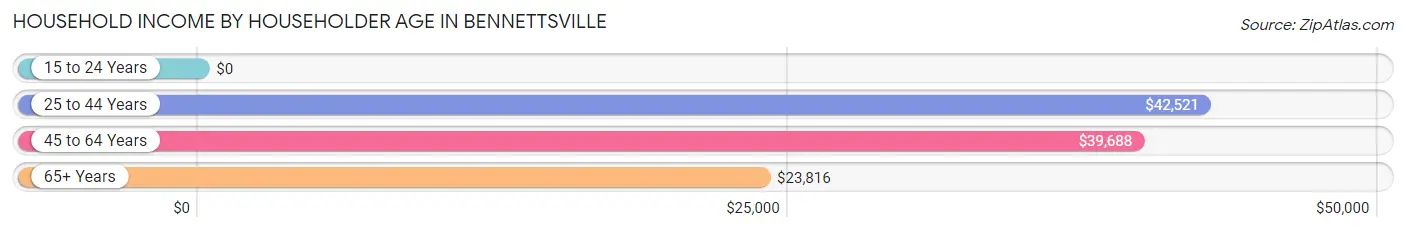
| Income Bracket | # Households | Median Income |
| 15 to 24 Years | 31 (1.1%) | $0 |
| 25 to 44 Years | 1,085 (39.5%) | $42,521 |
| 45 to 64 Years | 757 (27.5%) | $39,688 |
| 65+ Years | 876 (31.9%) | $23,816 |
| Total | 2,749 (100.0%) | $37,891 |
Poverty in Bennettsville
Income Below Poverty by Sex and Age in Bennettsville
With 22.4% poverty level for males and 30.6% for females among the residents of Bennettsville, 15 year old males and 5 year old females are the most vulnerable to poverty, with 14 males (100.0%) and 100 females (86.2%) in their respective age groups living below the poverty level.
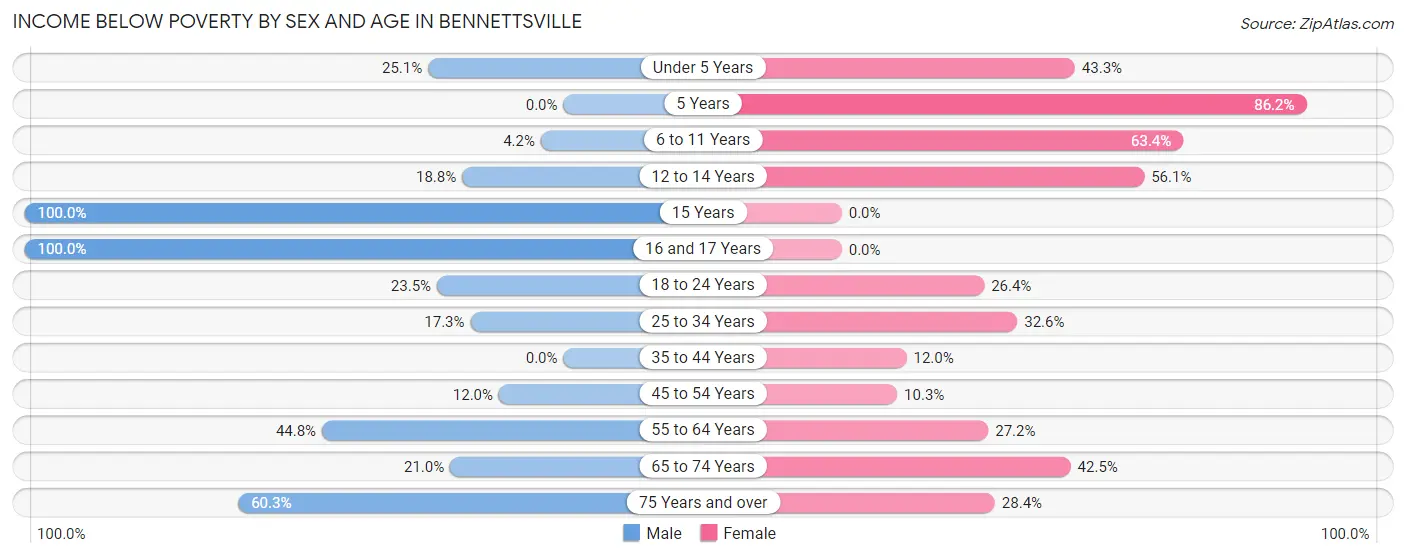
| Age Bracket | Male | Female |
| Under 5 Years | 52 (25.1%) | 74 (43.3%) |
| 5 Years | 0 (0.0%) | 100 (86.2%) |
| 6 to 11 Years | 8 (4.2%) | 140 (63.3%) |
| 12 to 14 Years | 41 (18.8%) | 64 (56.1%) |
| 15 Years | 14 (100.0%) | 0 (0.0%) |
| 16 and 17 Years | 38 (100.0%) | 0 (0.0%) |
| 18 to 24 Years | 92 (23.5%) | 88 (26.4%) |
| 25 to 34 Years | 53 (17.3%) | 142 (32.6%) |
| 35 to 44 Years | 0 (0.0%) | 59 (12.0%) |
| 45 to 54 Years | 34 (12.0%) | 52 (10.3%) |
| 55 to 64 Years | 82 (44.8%) | 118 (27.2%) |
| 65 to 74 Years | 41 (21.0%) | 144 (42.5%) |
| 75 Years and over | 140 (60.3%) | 108 (28.4%) |
| Total | 595 (22.4%) | 1,089 (30.6%) |
Income Above Poverty by Sex and Age in Bennettsville
According to the poverty statistics in Bennettsville, males aged 5 years and females aged 15 years are the age groups that are most secure financially, with 100.0% of males and 100.0% of females in these age groups living above the poverty line.
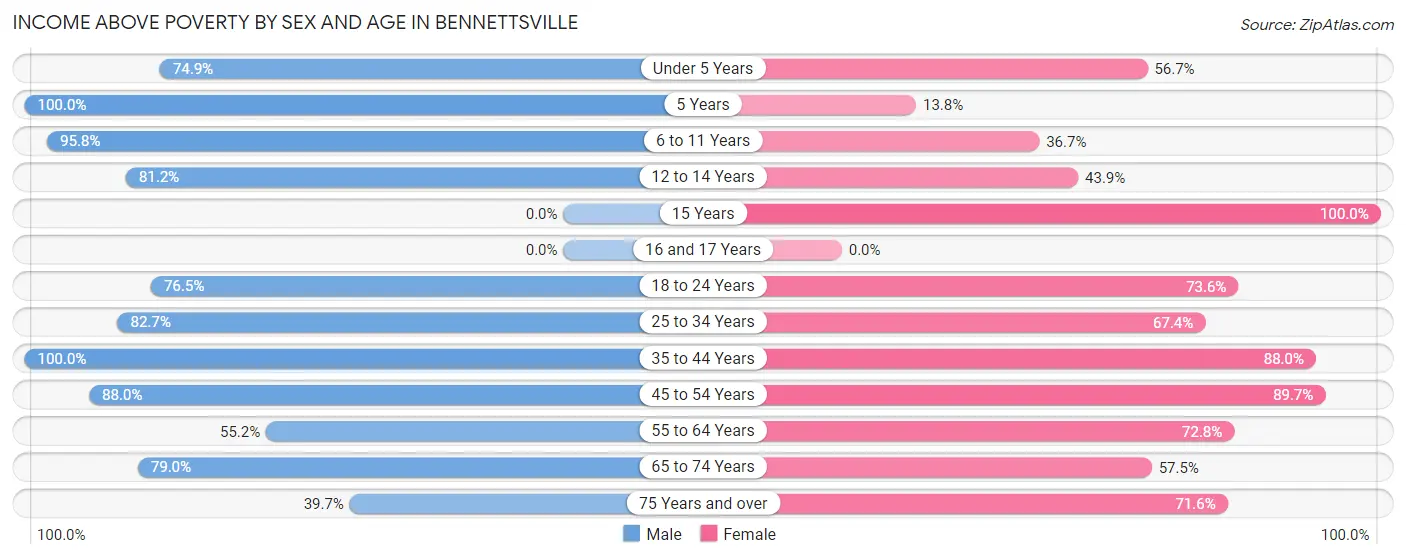
| Age Bracket | Male | Female |
| Under 5 Years | 155 (74.9%) | 97 (56.7%) |
| 5 Years | 22 (100.0%) | 16 (13.8%) |
| 6 to 11 Years | 183 (95.8%) | 81 (36.6%) |
| 12 to 14 Years | 177 (81.2%) | 50 (43.9%) |
| 15 Years | 0 (0.0%) | 17 (100.0%) |
| 16 and 17 Years | 0 (0.0%) | 0 (0.0%) |
| 18 to 24 Years | 300 (76.5%) | 245 (73.6%) |
| 25 to 34 Years | 254 (82.7%) | 294 (67.4%) |
| 35 to 44 Years | 377 (100.0%) | 432 (88.0%) |
| 45 to 54 Years | 250 (88.0%) | 454 (89.7%) |
| 55 to 64 Years | 101 (55.2%) | 316 (72.8%) |
| 65 to 74 Years | 154 (79.0%) | 195 (57.5%) |
| 75 Years and over | 92 (39.7%) | 272 (71.6%) |
| Total | 2,065 (77.6%) | 2,469 (69.4%) |
Income Below Poverty Among Married-Couple Families in Bennettsville
The poverty statistics for married-couple families in Bennettsville show that 16.2% or 93 of the total 575 families live below the poverty line. Families with no children have the highest poverty rate of 28.8%, comprising of 88 families. On the other hand, families with 3 or 4 children have the lowest poverty rate of 0.0%, which includes 0 families.
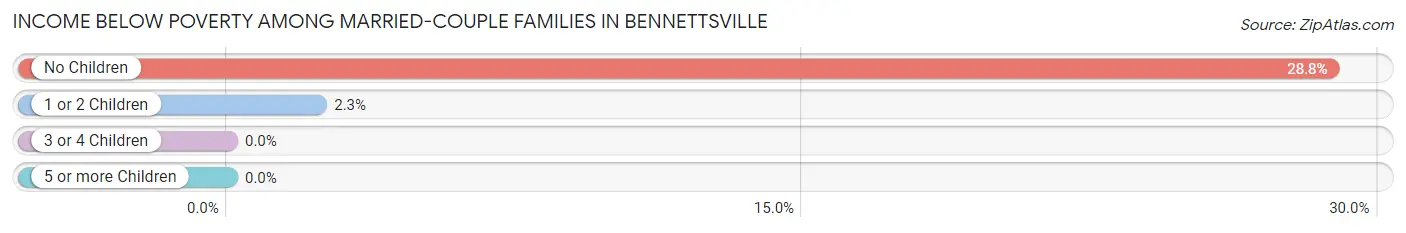
| Children | Above Poverty | Below Poverty |
| No Children | 218 (71.2%) | 88 (28.8%) |
| 1 or 2 Children | 210 (97.7%) | 5 (2.3%) |
| 3 or 4 Children | 54 (100.0%) | 0 (0.0%) |
| 5 or more Children | 0 (0.0%) | 0 (0.0%) |
| Total | 482 (83.8%) | 93 (16.2%) |
Income Below Poverty Among Single-Parent Households in Bennettsville
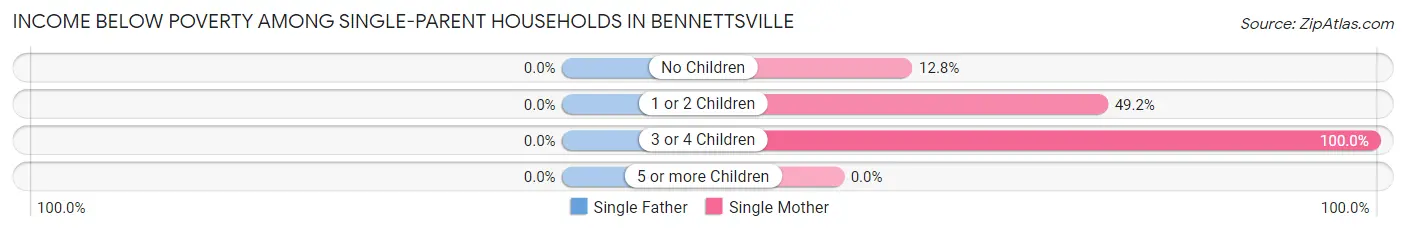
| Children | Single Father | Single Mother |
| No Children | 0 (0.0%) | 32 (12.8%) |
| 1 or 2 Children | 0 (0.0%) | 179 (49.2%) |
| 3 or 4 Children | 0 (0.0%) | 37 (100.0%) |
| 5 or more Children | 0 (0.0%) | 0 (0.0%) |
| Total | 0 (0.0%) | 248 (38.0%) |
Income Below Poverty Among Married-Couple vs Single-Parent Households in Bennettsville
The poverty data for Bennettsville shows that 93 of the married-couple family households (16.2%) and 248 of the single-parent households (33.6%) are living below the poverty level. Within the married-couple family households, those with no children have the highest poverty rate, with 88 households (28.8%) falling below the poverty line. Among the single-parent households, those with 3 or 4 children have the highest poverty rate, with 37 household (100.0%) living below poverty.
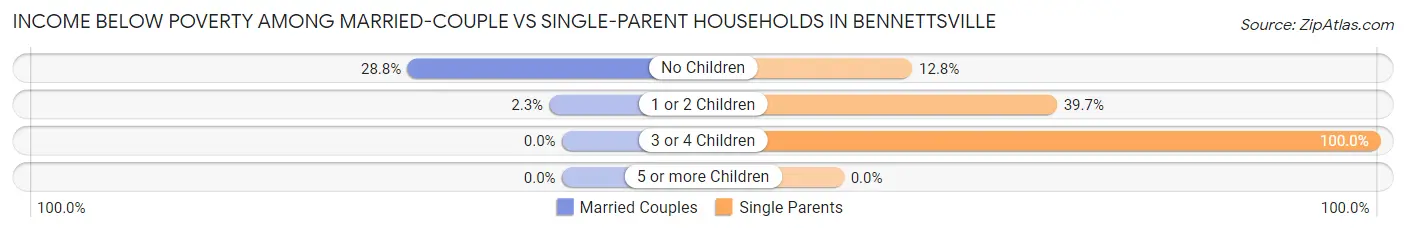
| Children | Married-Couple Families | Single-Parent Households |
| No Children | 88 (28.8%) | 32 (12.8%) |
| 1 or 2 Children | 5 (2.3%) | 179 (39.7%) |
| 3 or 4 Children | 0 (0.0%) | 37 (100.0%) |
| 5 or more Children | 0 (0.0%) | 0 (0.0%) |
| Total | 93 (16.2%) | 248 (33.6%) |
Race in Bennettsville
The most populous races in Bennettsville are Black / African American (4,237 | 60.8%), White / Caucasian (2,196 | 31.5%), and Two or more Races (293 | 4.2%).
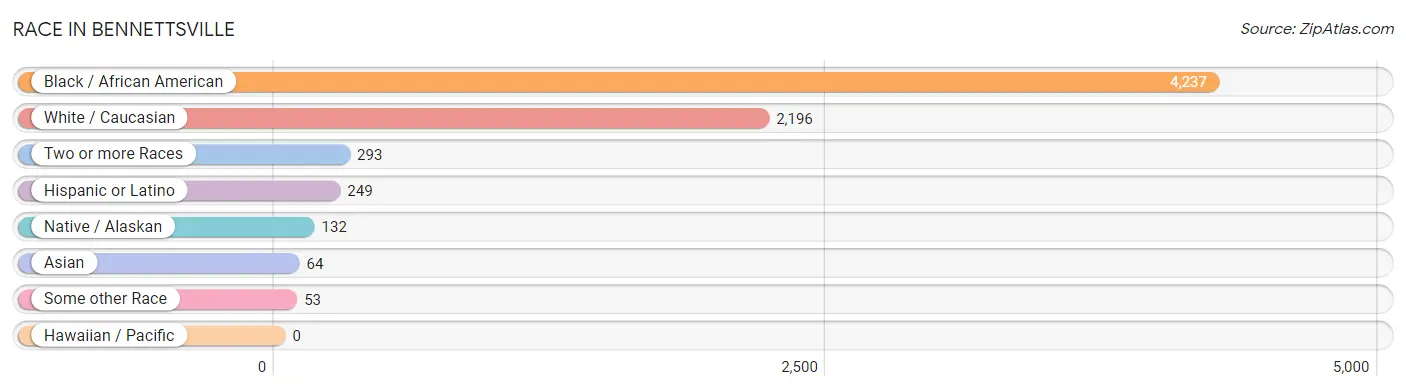
| Race | # Population | % Population |
| Asian | 64 | 0.9% |
| Black / African American | 4,237 | 60.8% |
| Hawaiian / Pacific | 0 | 0.0% |
| Hispanic or Latino | 249 | 3.6% |
| Native / Alaskan | 132 | 1.9% |
| White / Caucasian | 2,196 | 31.5% |
| Two or more Races | 293 | 4.2% |
| Some other Race | 53 | 0.8% |
| Total | 6,975 | 100.0% |
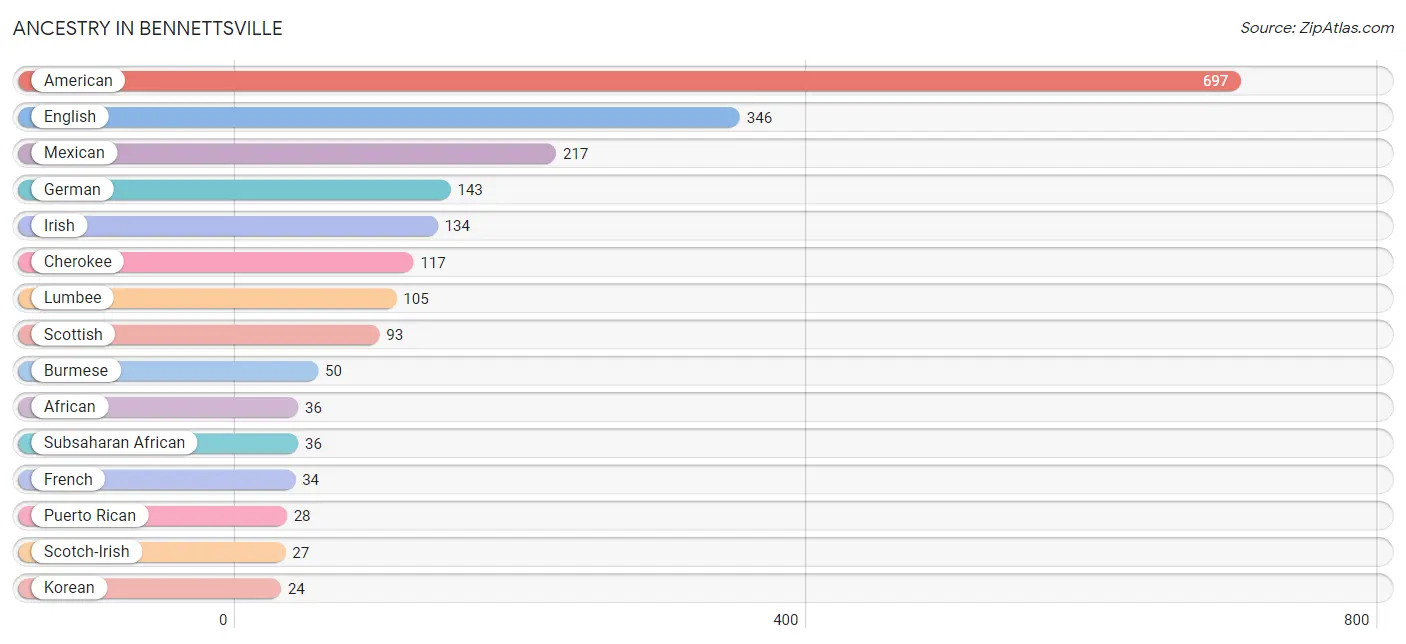
Ancestry in Bennettsville
The most populous ancestries reported in Bennettsville are American (697 | 10.0%), English (346 | 5.0%), Mexican (217 | 3.1%), German (143 | 2.1%), and Irish (134 | 1.9%), together accounting for 22.0% of all Bennettsville residents.
| Ancestry | # Population | % Population |
| African | 36 | 0.5% |
| American | 697 | 10.0% |
| Arab | 1 | 0.0% |
| British | 1 | 0.0% |
| Burmese | 50 | 0.7% |
| Cherokee | 117 | 1.7% |
| Dutch | 16 | 0.2% |
| English | 346 | 5.0% |
| French | 34 | 0.5% |
| French Canadian | 19 | 0.3% |
| German | 143 | 2.1% |
| Greek | 12 | 0.2% |
| Haitian | 10 | 0.1% |
| Hungarian | 12 | 0.2% |
| Irish | 134 | 1.9% |
| Korean | 24 | 0.3% |
| Lithuanian | 14 | 0.2% |
| Lumbee | 105 | 1.5% |
| Mexican | 217 | 3.1% |
| Moroccan | 1 | 0.0% |
| Puerto Rican | 28 | 0.4% |
| Romanian | 9 | 0.1% |
| Russian | 9 | 0.1% |
| Scotch-Irish | 27 | 0.4% |
| Scottish | 93 | 1.3% |
| Slovak | 7 | 0.1% |
| Subsaharan African | 36 | 0.5% |
| Welsh | 16 | 0.2% | View All 28 Rows |
Immigrants in Bennettsville
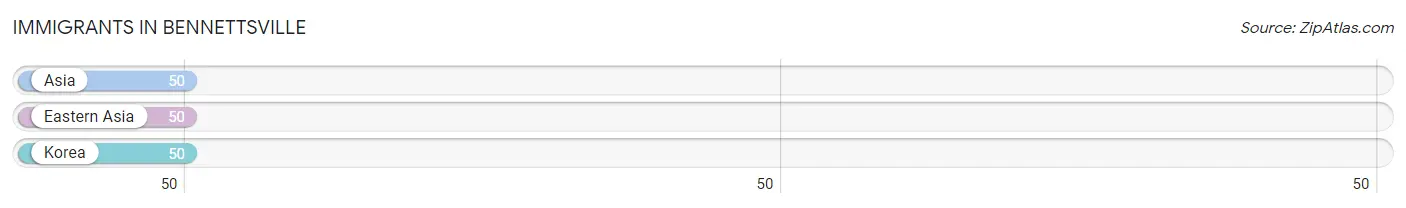
The most numerous immigrant groups reported in Bennettsville came from Asia (50 | 0.7%), Eastern Asia (50 | 0.7%), and Korea (50 | 0.7%), together accounting for 2.2% of all Bennettsville residents.
| Immigration Origin | # Population | % Population |
| Asia | 50 | 0.7% |
| Eastern Asia | 50 | 0.7% |
| Korea | 50 | 0.7% | View All 3 Rows |
Sex and Age in Bennettsville
Sex and Age in Bennettsville
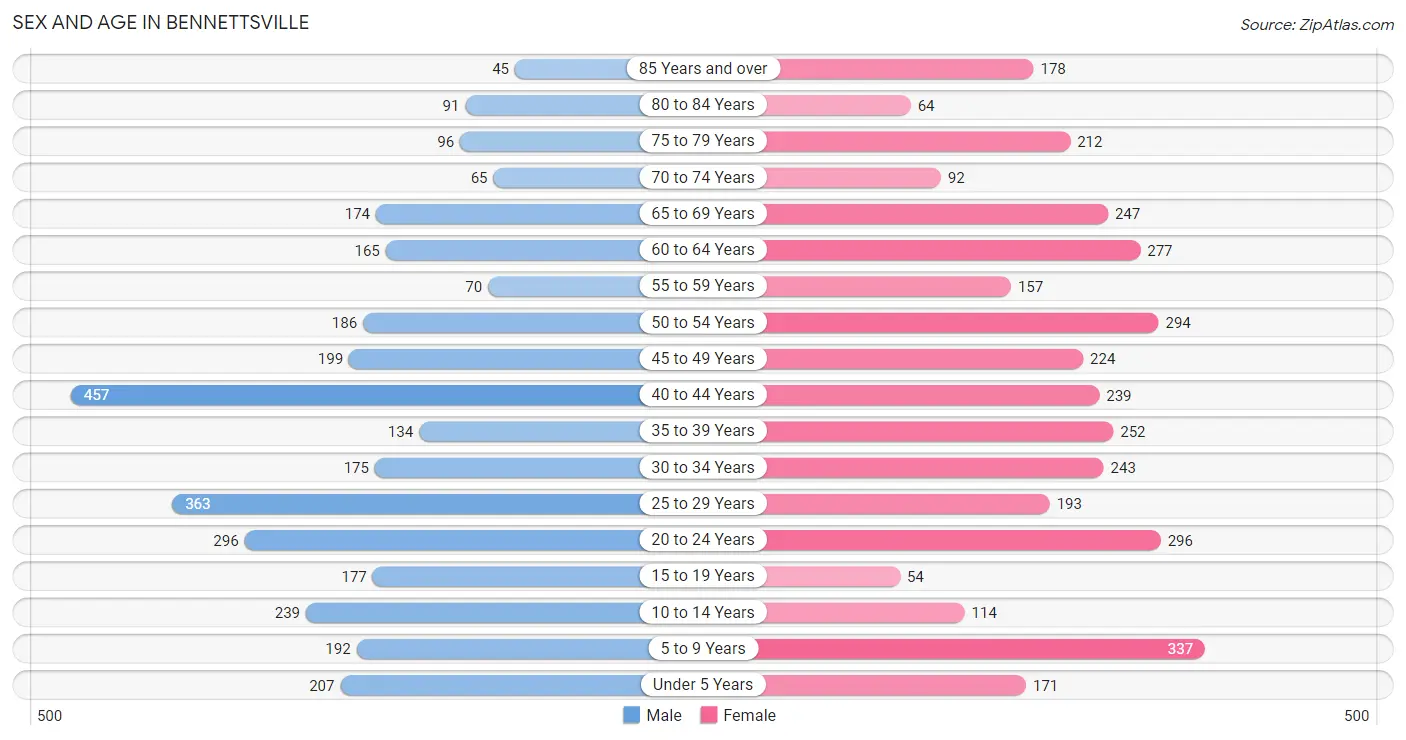
The most populous age groups in Bennettsville are 40 to 44 Years (457 | 13.7%) for men and 5 to 9 Years (337 | 9.2%) for women.
| Age Bracket | Male | Female |
| Under 5 Years | 207 (6.2%) | 171 (4.7%) |
| 5 to 9 Years | 192 (5.8%) | 337 (9.2%) |
| 10 to 14 Years | 239 (7.2%) | 114 (3.1%) |
| 15 to 19 Years | 177 (5.3%) | 54 (1.5%) |
| 20 to 24 Years | 296 (8.9%) | 296 (8.1%) |
| 25 to 29 Years | 363 (10.9%) | 193 (5.3%) |
| 30 to 34 Years | 175 (5.2%) | 243 (6.7%) |
| 35 to 39 Years | 134 (4.0%) | 252 (6.9%) |
| 40 to 44 Years | 457 (13.7%) | 239 (6.6%) |
| 45 to 49 Years | 199 (6.0%) | 224 (6.1%) |
| 50 to 54 Years | 186 (5.6%) | 294 (8.1%) |
| 55 to 59 Years | 70 (2.1%) | 157 (4.3%) |
| 60 to 64 Years | 165 (5.0%) | 277 (7.6%) |
| 65 to 69 Years | 174 (5.2%) | 247 (6.8%) |
| 70 to 74 Years | 65 (1.9%) | 92 (2.5%) |
| 75 to 79 Years | 96 (2.9%) | 212 (5.8%) |
| 80 to 84 Years | 91 (2.7%) | 64 (1.8%) |
| 85 Years and over | 45 (1.3%) | 178 (4.9%) |
| Total | 3,331 (100.0%) | 3,644 (100.0%) |
Families and Households in Bennettsville
Median Family Size in Bennettsville
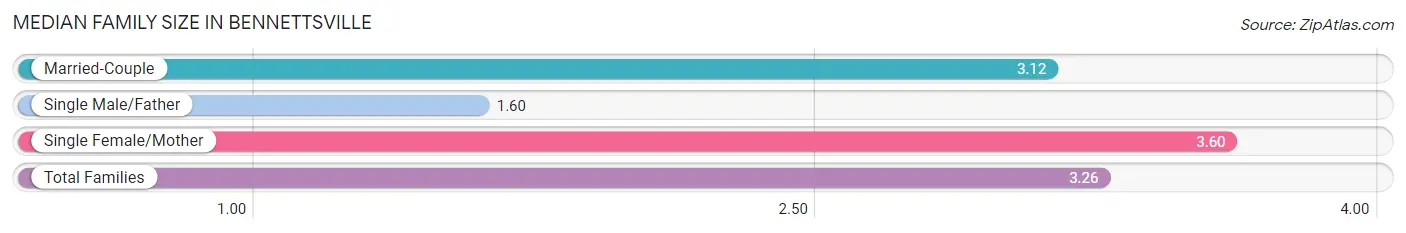
The median family size in Bennettsville is 3.26 persons per family, with single female/mother families (652 | 49.6%) accounting for the largest median family size of 3.6 persons per family. On the other hand, single male/father families (87 | 6.6%) represent the smallest median family size with 1.60 persons per family.
| Family Type | # Families | Family Size |
| Married-Couple | 575 (43.8%) | 3.12 |
| Single Male/Father | 87 (6.6%) | 1.60 |
| Single Female/Mother | 652 (49.6%) | 3.60 |
| Total Families | 1,314 (100.0%) | 3.26 |
Median Household Size in Bennettsville
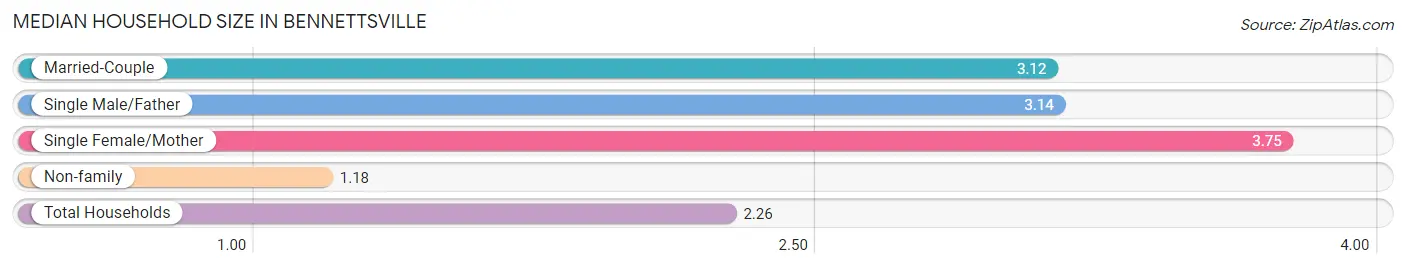
The median household size in Bennettsville is 2.26 persons per household, with single female/mother households (652 | 23.7%) accounting for the largest median household size of 3.75 persons per household. non-family households (1,435 | 52.2%) represent the smallest median household size with 1.18 persons per household.
| Household Type | # Households | Household Size |
| Married-Couple | 575 (20.9%) | 3.12 |
| Single Male/Father | 87 (3.2%) | 3.14 |
| Single Female/Mother | 652 (23.7%) | 3.75 |
| Non-family | 1,435 (52.2%) | 1.18 |
| Total Households | 2,749 (100.0%) | 2.26 |
Household Size by Marriage Status in Bennettsville
Out of a total of 2,749 households in Bennettsville, 1,314 (47.8%) are family households, while 1,435 (52.2%) are nonfamily households. The most numerous type of family households are 2-person households, comprising 662, and the most common type of nonfamily households are 1-person households, comprising 1,197.
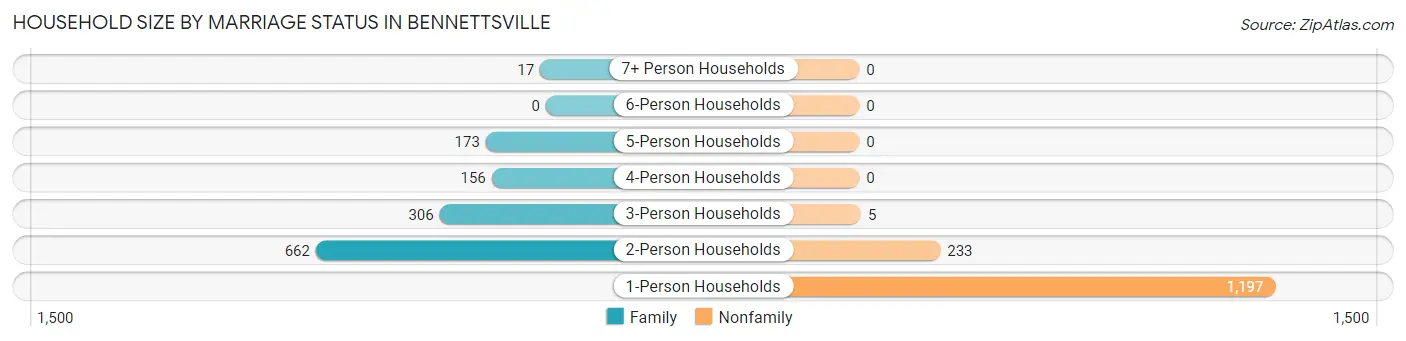
| Household Size | Family Households | Nonfamily Households |
| 1-Person Households | - | 1,197 (43.5%) |
| 2-Person Households | 662 (24.1%) | 233 (8.5%) |
| 3-Person Households | 306 (11.1%) | 5 (0.2%) |
| 4-Person Households | 156 (5.7%) | 0 (0.0%) |
| 5-Person Households | 173 (6.3%) | 0 (0.0%) |
| 6-Person Households | 0 (0.0%) | 0 (0.0%) |
| 7+ Person Households | 17 (0.6%) | 0 (0.0%) |
| Total | 1,314 (47.8%) | 1,435 (52.2%) |
Female Fertility in Bennettsville
Fertility by Age in Bennettsville
Average fertility rate in Bennettsville is 44.0 births per 1,000 women. Women in the age bracket of 20 to 34 years have the highest fertility rate with 52.0 births per 1,000 women. Women in the age bracket of 20 to 34 years acount for 52.0% of all women with births.
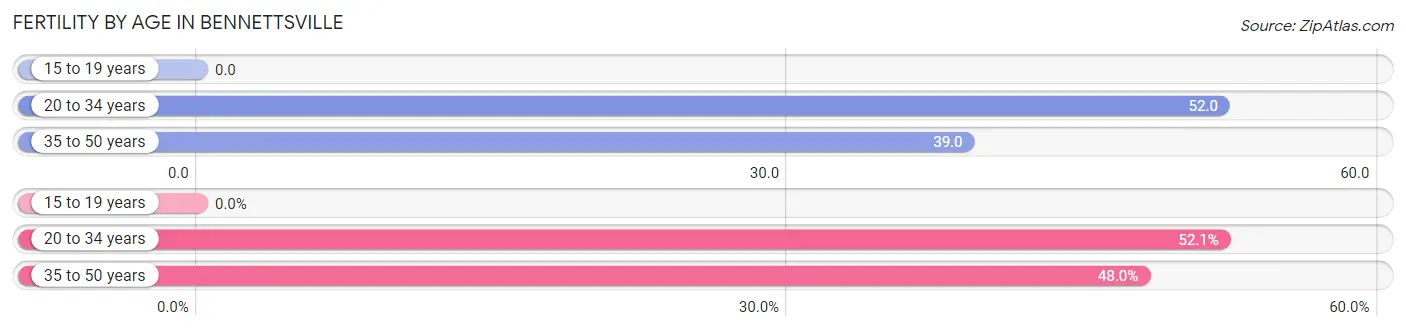
| Age Bracket | Women with Births | Births / 1,000 Women |
| 15 to 19 years | 0 (0.0%) | 0.0 |
| 20 to 34 years | 38 (52.0%) | 52.0 |
| 35 to 50 years | 35 (47.9%) | 39.0 |
| Total | 73 (100.0%) | 44.0 |
Fertility by Age by Marriage Status in Bennettsville
47.9% of women with births (73) in Bennettsville are married. The highest percentage of unmarried women with births falls into 20 to 34 years age bracket with 100.0% of them unmarried at the time of birth, while the lowest percentage of unmarried women with births belong to 35 to 50 years age bracket with 0.0% of them unmarried.
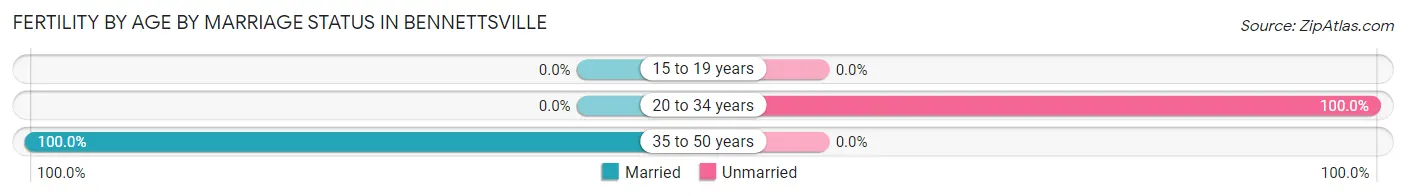
| Age Bracket | Married | Unmarried |
| 15 to 19 years | 0 (0.0%) | 0 (0.0%) |
| 20 to 34 years | 0 (0.0%) | 38 (100.0%) |
| 35 to 50 years | 35 (100.0%) | 0 (0.0%) |
| Total | 35 (47.9%) | 38 (52.0%) |
Fertility by Education in Bennettsville
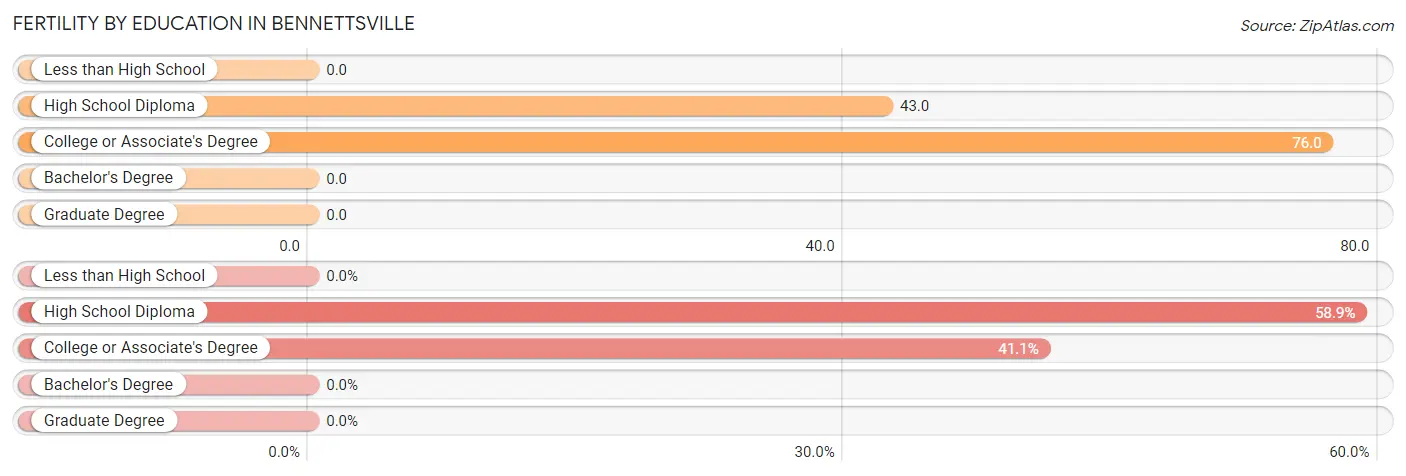
| Educational Attainment | Women with Births | Births / 1,000 Women |
| Less than High School | 0 (0.0%) | 0.0 |
| High School Diploma | 43 (58.9%) | 43.0 |
| College or Associate's Degree | 30 (41.1%) | 76.0 |
| Bachelor's Degree | 0 (0.0%) | 0.0 |
| Graduate Degree | 0 (0.0%) | 0.0 |
| Total | 73 (100.0%) | 44.0 |
Fertility by Education by Marriage Status in Bennettsville
52.0% of women with births in Bennettsville are unmarried. Women with the educational attainment of high school diploma are most likely to be married with 81.4% of them married at childbirth, while women with the educational attainment of college or associate's degree are least likely to be married with 100.0% of them unmarried at childbirth.
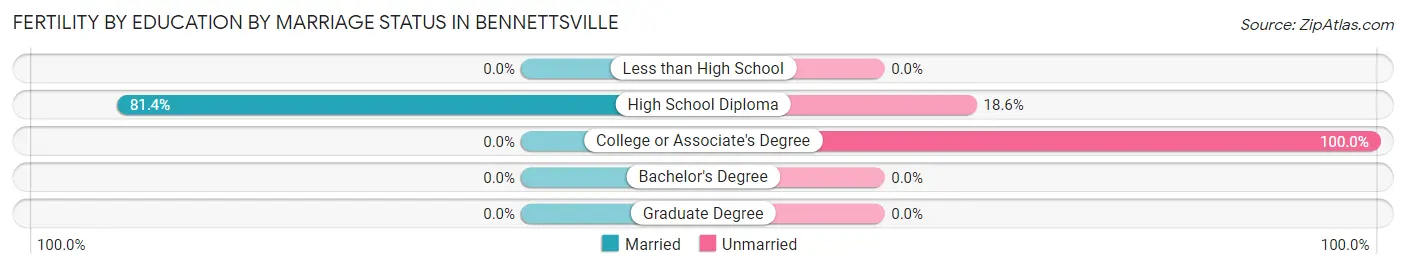
| Educational Attainment | Married | Unmarried |
| Less than High School | 0 (0.0%) | 0 (0.0%) |
| High School Diploma | 35 (81.4%) | 8 (18.6%) |
| College or Associate's Degree | 0 (0.0%) | 30 (100.0%) |
| Bachelor's Degree | 0 (0.0%) | 0 (0.0%) |
| Graduate Degree | 0 (0.0%) | 0 (0.0%) |
| Total | 35 (47.9%) | 38 (52.0%) |
Employment Characteristics in Bennettsville
Employment by Class of Employer in Bennettsville
Among the 2,513 employed individuals in Bennettsville, private company employees (1,912 | 76.1%), not-for-profit organizations (190 | 7.6%), and state government employees (164 | 6.5%) make up the most common classes of employment.
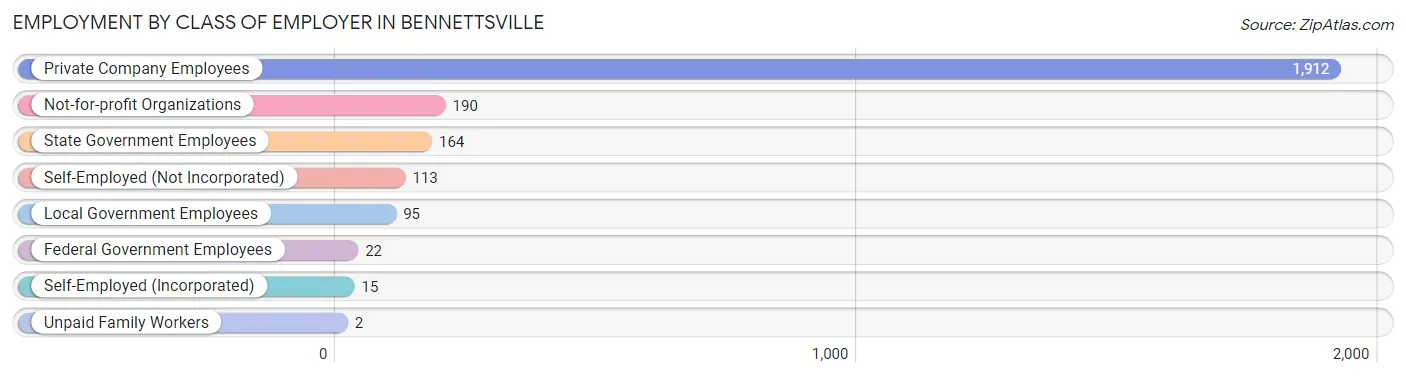
| Employer Class | # Employees | % Employees |
| Private Company Employees | 1,912 | 76.1% |
| Self-Employed (Incorporated) | 15 | 0.6% |
| Self-Employed (Not Incorporated) | 113 | 4.5% |
| Not-for-profit Organizations | 190 | 7.6% |
| Local Government Employees | 95 | 3.8% |
| State Government Employees | 164 | 6.5% |
| Federal Government Employees | 22 | 0.9% |
| Unpaid Family Workers | 2 | 0.1% |
| Total | 2,513 | 100.0% |
Employment Status by Age in Bennettsville
According to the labor force statistics for Bennettsville, out of the total population over 16 years of age (5,684), 48.0% or 2,728 individuals are in the labor force, with 6.5% or 177 of them unemployed. The age group with the highest labor force participation rate is 45 to 54 years, with 75.0% or 677 individuals in the labor force. Within the labor force, the 16 to 19 years age range has the highest percentage of unemployed individuals, with 44.8% or 30 of them being unemployed.
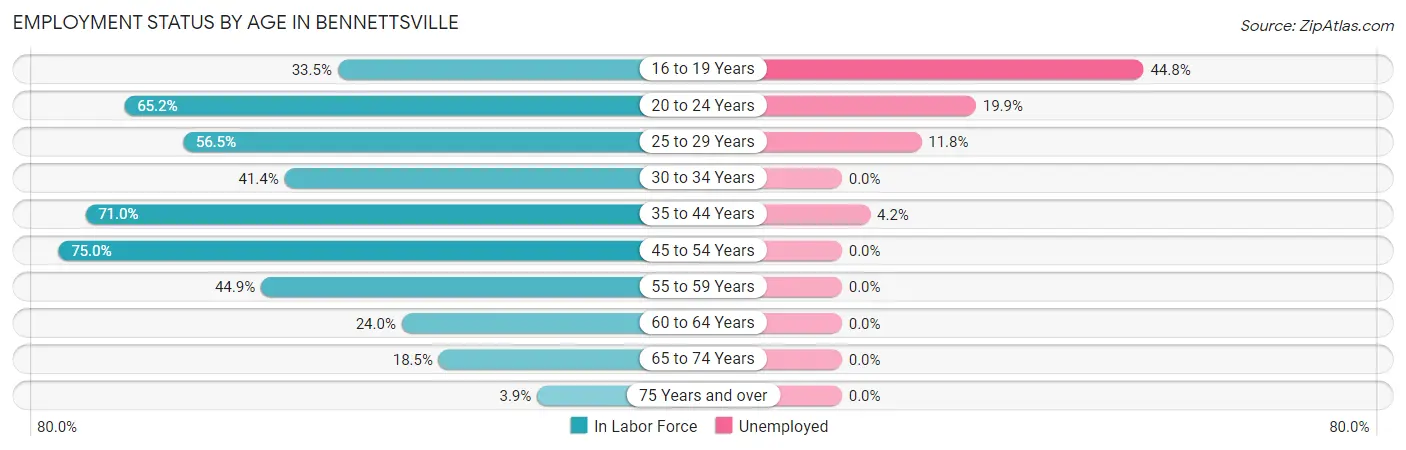
| Age Bracket | In Labor Force | Unemployed |
| 16 to 19 Years | 67 (33.5%) | 30 (44.8%) |
| 20 to 24 Years | 386 (65.2%) | 77 (19.9%) |
| 25 to 29 Years | 314 (56.5%) | 37 (11.8%) |
| 30 to 34 Years | 173 (41.4%) | 0 (0.0%) |
| 35 to 44 Years | 768 (71.0%) | 32 (4.2%) |
| 45 to 54 Years | 677 (75.0%) | 0 (0.0%) |
| 55 to 59 Years | 102 (44.9%) | 0 (0.0%) |
| 60 to 64 Years | 106 (24.0%) | 0 (0.0%) |
| 65 to 74 Years | 107 (18.5%) | 0 (0.0%) |
| 75 Years and over | 27 (3.9%) | 0 (0.0%) |
| Total | 2,728 (48.0%) | 177 (6.5%) |
Employment Status by Educational Attainment in Bennettsville
According to labor force statistics for Bennettsville, 59.0% of individuals (2,141) out of the total population between 25 and 64 years of age (3,628) are in the labor force, with 3.2% or 69 of them being unemployed. The group with the highest labor force participation rate are those with the educational attainment of bachelor's degree or higher, with 96.9% or 347 individuals in the labor force. Within the labor force, individuals with less than high school education have the highest percentage of unemployment, with 19.8% or 17 of them being unemployed.
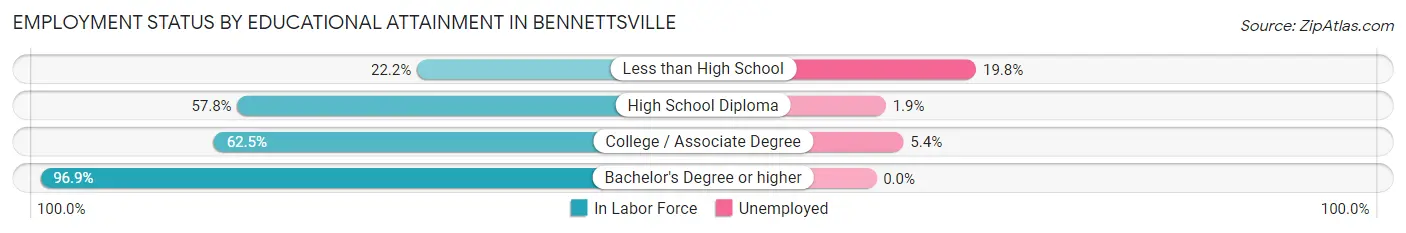
| Educational Attainment | In Labor Force | Unemployed |
| Less than High School | 86 (22.2%) | 77 (19.8%) |
| High School Diploma | 1,157 (57.8%) | 38 (1.9%) |
| College / Associate Degree | 551 (62.5%) | 48 (5.4%) |
| Bachelor's Degree or higher | 347 (96.9%) | 0 (0.0%) |
| Total | 2,141 (59.0%) | 116 (3.2%) |
Employment Occupations by Sex in Bennettsville
Management, Business, Science and Arts Occupations
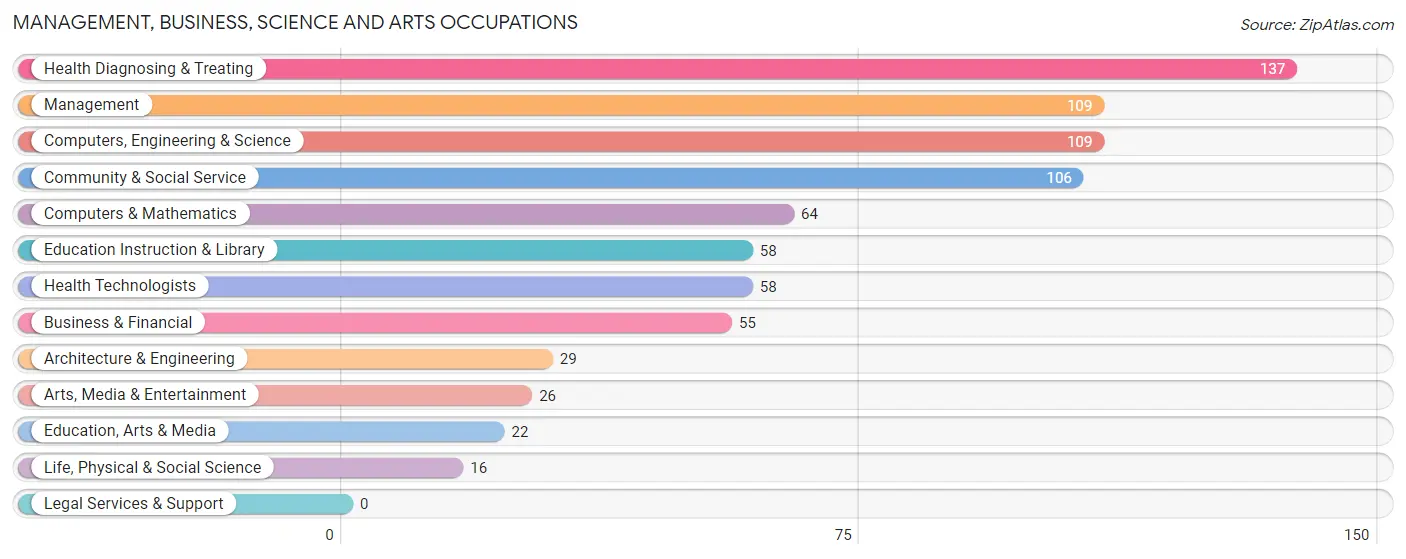
The most common Management, Business, Science and Arts occupations in Bennettsville are Health Diagnosing & Treating (137 | 5.4%), Management (109 | 4.3%), Computers, Engineering & Science (109 | 4.3%), Community & Social Service (106 | 4.2%), and Computers & Mathematics (64 | 2.5%).
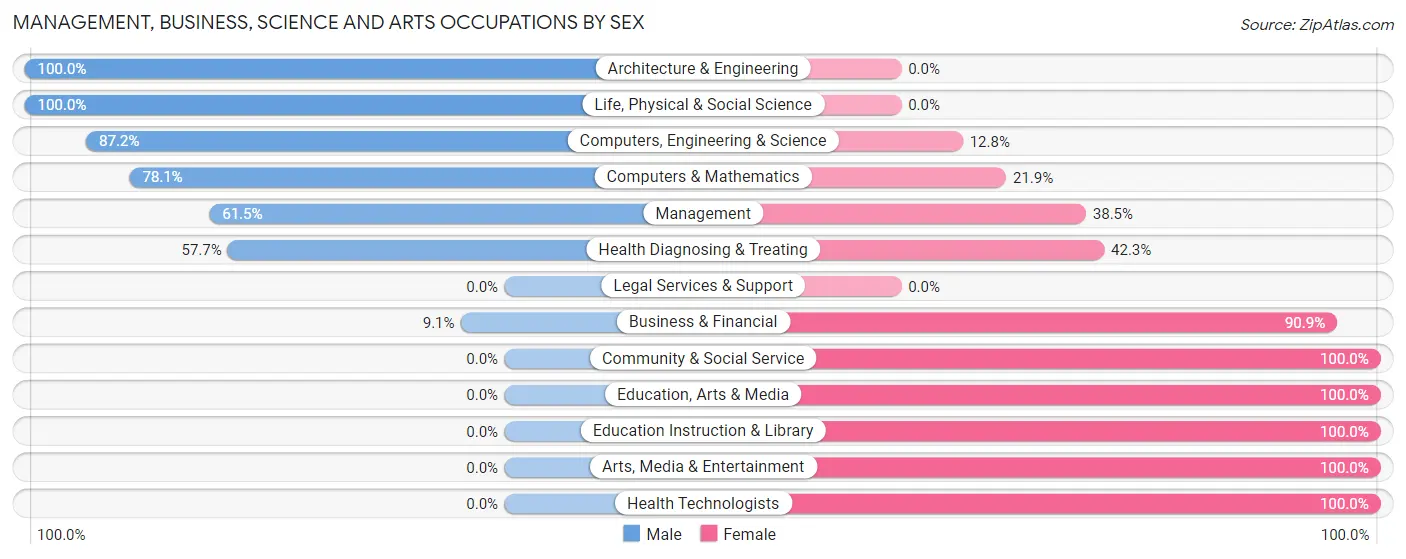
Management, Business, Science and Arts Occupations by Sex
Within the Management, Business, Science and Arts occupations in Bennettsville, the most male-oriented occupations are Architecture & Engineering (100.0%), Life, Physical & Social Science (100.0%), and Computers, Engineering & Science (87.2%), while the most female-oriented occupations are Community & Social Service (100.0%), Education, Arts & Media (100.0%), and Education Instruction & Library (100.0%).
| Occupation | Male | Female |
| Management | 67 (61.5%) | 42 (38.5%) |
| Business & Financial | 5 (9.1%) | 50 (90.9%) |
| Computers, Engineering & Science | 95 (87.2%) | 14 (12.8%) |
| Computers & Mathematics | 50 (78.1%) | 14 (21.9%) |
| Architecture & Engineering | 29 (100.0%) | 0 (0.0%) |
| Life, Physical & Social Science | 16 (100.0%) | 0 (0.0%) |
| Community & Social Service | 0 (0.0%) | 106 (100.0%) |
| Education, Arts & Media | 0 (0.0%) | 22 (100.0%) |
| Legal Services & Support | 0 (0.0%) | 0 (0.0%) |
| Education Instruction & Library | 0 (0.0%) | 58 (100.0%) |
| Arts, Media & Entertainment | 0 (0.0%) | 26 (100.0%) |
| Health Diagnosing & Treating | 79 (57.7%) | 58 (42.3%) |
| Health Technologists | 0 (0.0%) | 58 (100.0%) |
| Total (Category) | 246 (47.7%) | 270 (52.3%) |
| Total (Overall) | 999 (39.2%) | 1,552 (60.8%) |
Services Occupations
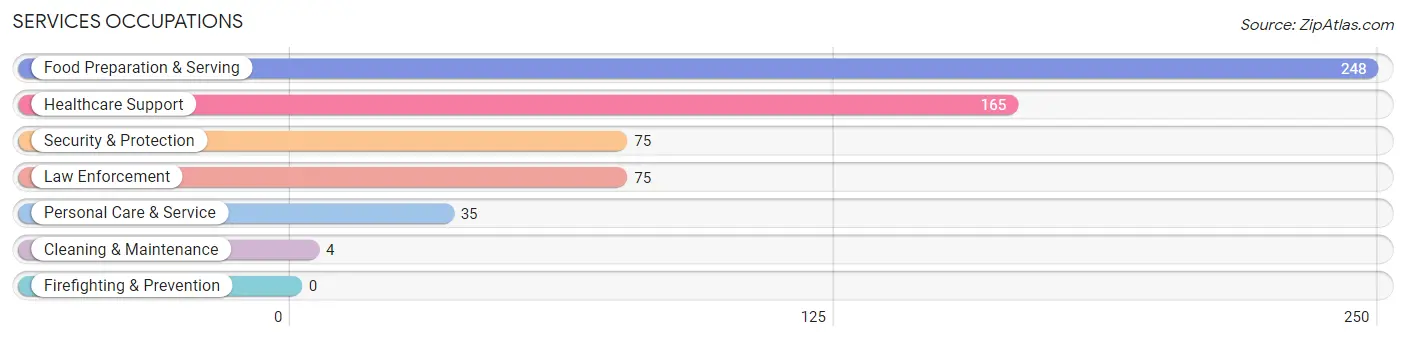
The most common Services occupations in Bennettsville are Food Preparation & Serving (248 | 9.7%), Healthcare Support (165 | 6.5%), Security & Protection (75 | 2.9%), Law Enforcement (75 | 2.9%), and Personal Care & Service (35 | 1.4%).
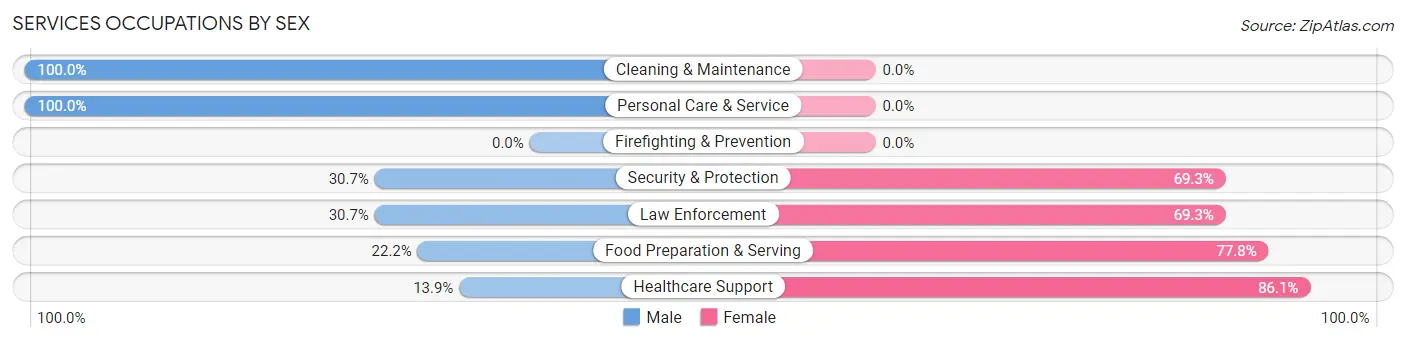
Services Occupations by Sex
Within the Services occupations in Bennettsville, the most male-oriented occupations are Cleaning & Maintenance (100.0%), Personal Care & Service (100.0%), and Security & Protection (30.7%), while the most female-oriented occupations are Healthcare Support (86.1%), Food Preparation & Serving (77.8%), and Security & Protection (69.3%).
| Occupation | Male | Female |
| Healthcare Support | 23 (13.9%) | 142 (86.1%) |
| Security & Protection | 23 (30.7%) | 52 (69.3%) |
| Firefighting & Prevention | 0 (0.0%) | 0 (0.0%) |
| Law Enforcement | 23 (30.7%) | 52 (69.3%) |
| Food Preparation & Serving | 55 (22.2%) | 193 (77.8%) |
| Cleaning & Maintenance | 4 (100.0%) | 0 (0.0%) |
| Personal Care & Service | 35 (100.0%) | 0 (0.0%) |
| Total (Category) | 140 (26.6%) | 387 (73.4%) |
| Total (Overall) | 999 (39.2%) | 1,552 (60.8%) |
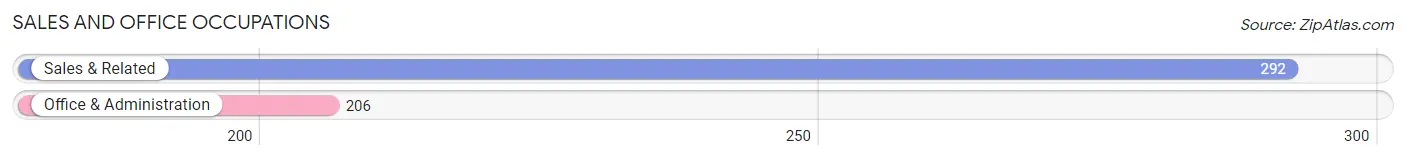
Sales and Office Occupations
The most common Sales and Office occupations in Bennettsville are Sales & Related (292 | 11.5%), and Office & Administration (206 | 8.1%).
Sales and Office Occupations by Sex
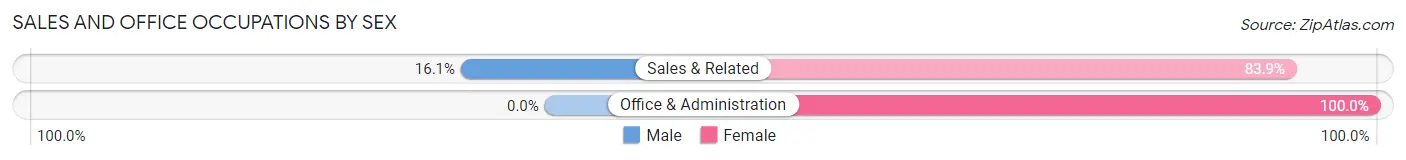
| Occupation | Male | Female |
| Sales & Related | 47 (16.1%) | 245 (83.9%) |
| Office & Administration | 0 (0.0%) | 206 (100.0%) |
| Total (Category) | 47 (9.4%) | 451 (90.6%) |
| Total (Overall) | 999 (39.2%) | 1,552 (60.8%) |
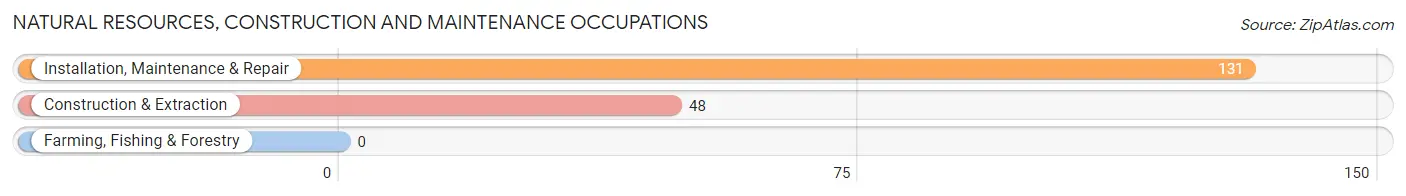
Natural Resources, Construction and Maintenance Occupations
The most common Natural Resources, Construction and Maintenance occupations in Bennettsville are Installation, Maintenance & Repair (131 | 5.1%), and Construction & Extraction (48 | 1.9%).
Natural Resources, Construction and Maintenance Occupations by Sex
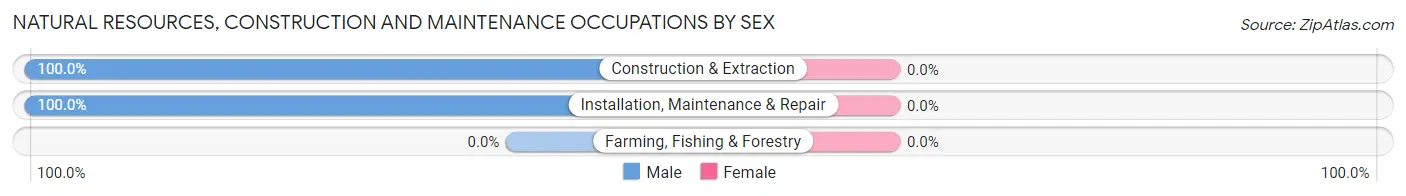
| Occupation | Male | Female |
| Farming, Fishing & Forestry | 0 (0.0%) | 0 (0.0%) |
| Construction & Extraction | 48 (100.0%) | 0 (0.0%) |
| Installation, Maintenance & Repair | 131 (100.0%) | 0 (0.0%) |
| Total (Category) | 179 (100.0%) | 0 (0.0%) |
| Total (Overall) | 999 (39.2%) | 1,552 (60.8%) |
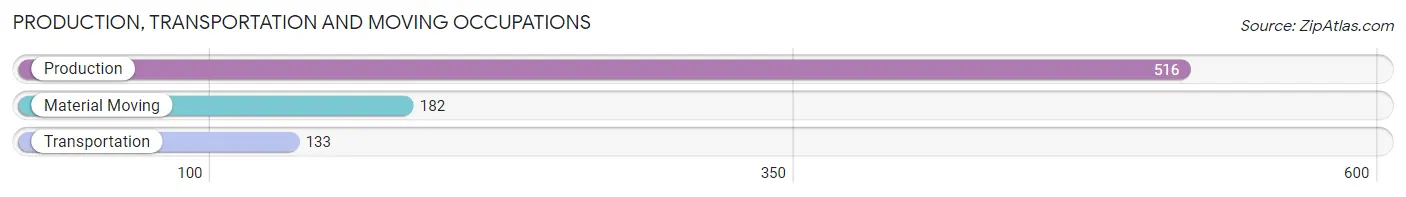
Production, Transportation and Moving Occupations
The most common Production, Transportation and Moving occupations in Bennettsville are Production (516 | 20.2%), Material Moving (182 | 7.1%), and Transportation (133 | 5.2%).
Production, Transportation and Moving Occupations by Sex
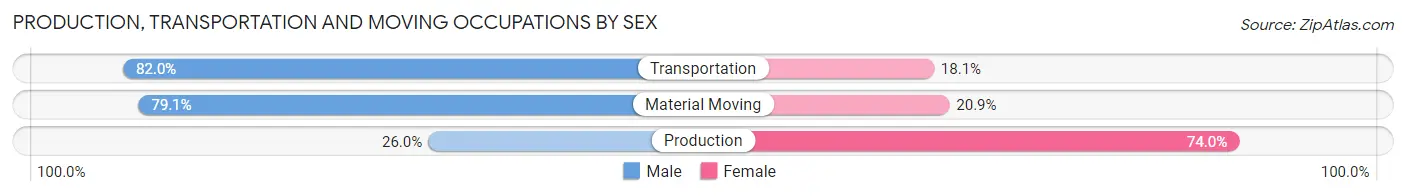
| Occupation | Male | Female |
| Production | 134 (26.0%) | 382 (74.0%) |
| Transportation | 109 (82.0%) | 24 (18.0%) |
| Material Moving | 144 (79.1%) | 38 (20.9%) |
| Total (Category) | 387 (46.6%) | 444 (53.4%) |
| Total (Overall) | 999 (39.2%) | 1,552 (60.8%) |
Employment Industries by Sex in Bennettsville
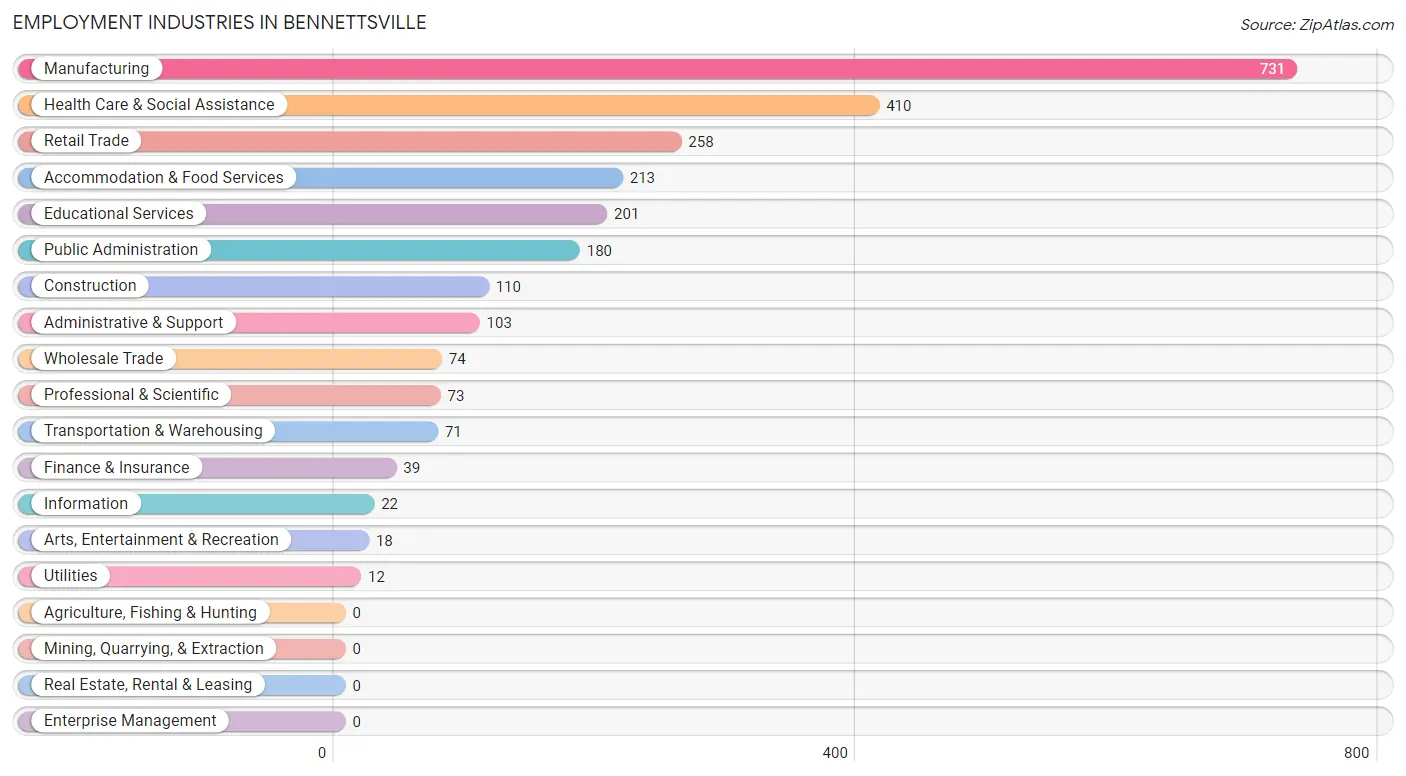
Employment Industries in Bennettsville
The major employment industries in Bennettsville include Manufacturing (731 | 28.7%), Health Care & Social Assistance (410 | 16.1%), Retail Trade (258 | 10.1%), Accommodation & Food Services (213 | 8.4%), and Educational Services (201 | 7.9%).
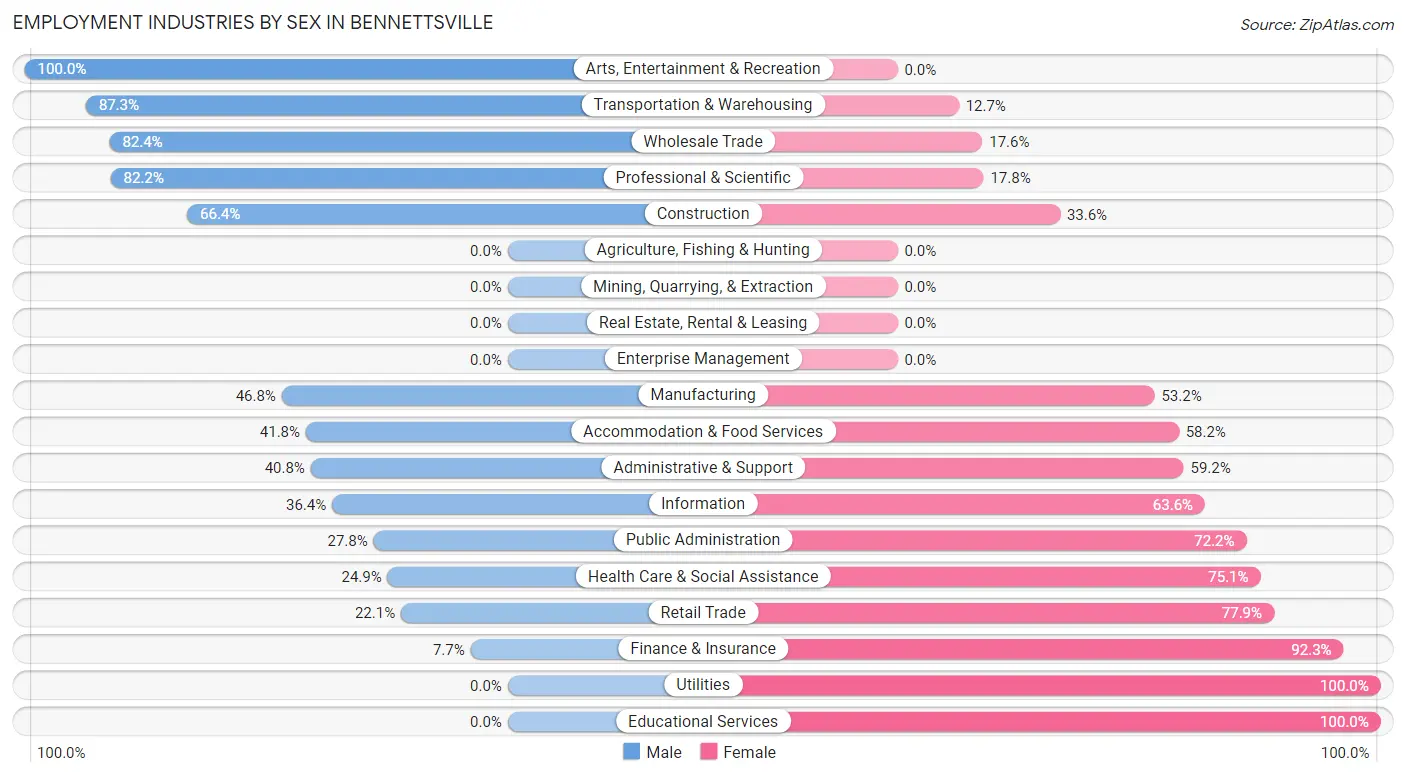
Employment Industries by Sex in Bennettsville
The Bennettsville industries that see more men than women are Arts, Entertainment & Recreation (100.0%), Transportation & Warehousing (87.3%), and Wholesale Trade (82.4%), whereas the industries that tend to have a higher number of women are Utilities (100.0%), Educational Services (100.0%), and Finance & Insurance (92.3%).
| Industry | Male | Female |
| Agriculture, Fishing & Hunting | 0 (0.0%) | 0 (0.0%) |
| Mining, Quarrying, & Extraction | 0 (0.0%) | 0 (0.0%) |
| Construction | 73 (66.4%) | 37 (33.6%) |
| Manufacturing | 342 (46.8%) | 389 (53.2%) |
| Wholesale Trade | 61 (82.4%) | 13 (17.6%) |
| Retail Trade | 57 (22.1%) | 201 (77.9%) |
| Transportation & Warehousing | 62 (87.3%) | 9 (12.7%) |
| Utilities | 0 (0.0%) | 12 (100.0%) |
| Information | 8 (36.4%) | 14 (63.6%) |
| Finance & Insurance | 3 (7.7%) | 36 (92.3%) |
| Real Estate, Rental & Leasing | 0 (0.0%) | 0 (0.0%) |
| Professional & Scientific | 60 (82.2%) | 13 (17.8%) |
| Enterprise Management | 0 (0.0%) | 0 (0.0%) |
| Administrative & Support | 42 (40.8%) | 61 (59.2%) |
| Educational Services | 0 (0.0%) | 201 (100.0%) |
| Health Care & Social Assistance | 102 (24.9%) | 308 (75.1%) |
| Arts, Entertainment & Recreation | 18 (100.0%) | 0 (0.0%) |
| Accommodation & Food Services | 89 (41.8%) | 124 (58.2%) |
| Public Administration | 50 (27.8%) | 130 (72.2%) |
| Total | 999 (39.2%) | 1,552 (60.8%) |
Education in Bennettsville
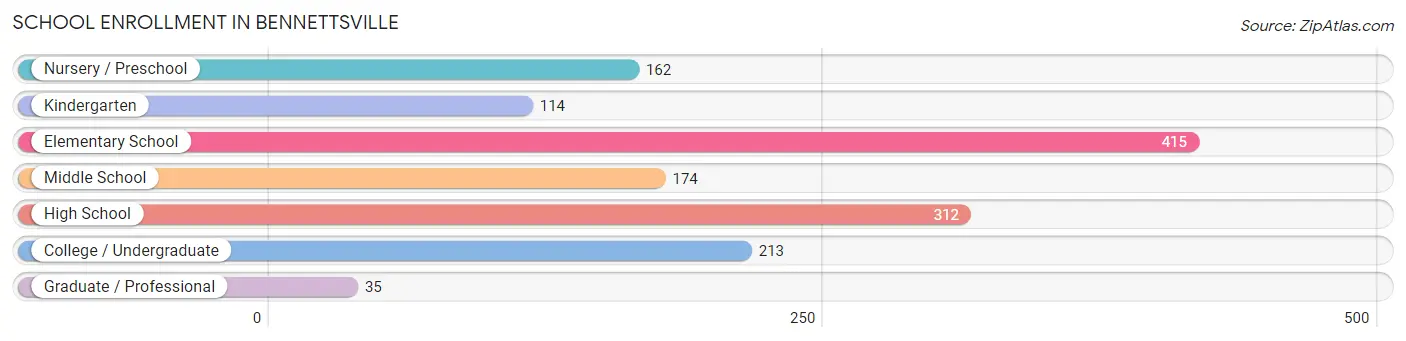
School Enrollment in Bennettsville
The most common levels of schooling among the 1,425 students in Bennettsville are elementary school (415 | 29.1%), high school (312 | 21.9%), and college / undergraduate (213 | 14.9%).
| School Level | # Students | % Students |
| Nursery / Preschool | 162 | 11.4% |
| Kindergarten | 114 | 8.0% |
| Elementary School | 415 | 29.1% |
| Middle School | 174 | 12.2% |
| High School | 312 | 21.9% |
| College / Undergraduate | 213 | 14.9% |
| Graduate / Professional | 35 | 2.5% |
| Total | 1,425 | 100.0% |
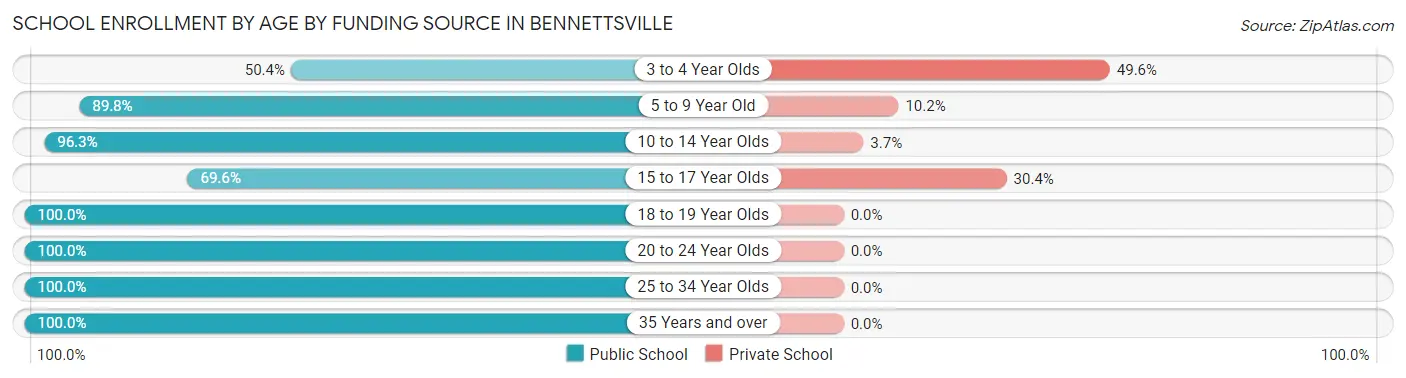
School Enrollment by Age by Funding Source in Bennettsville
Out of a total of 1,425 students who are enrolled in schools in Bennettsville, 142 (10.0%) attend a private institution, while the remaining 1,282 (90.0%) are enrolled in public schools. The age group of 3 to 4 year olds has the highest likelihood of being enrolled in private schools, with 59 (49.6% in the age bracket) enrolled. Conversely, the age group of 18 to 19 year olds has the lowest likelihood of being enrolled in a private school, with 125 (100.0% in the age bracket) attending a public institution.
| Age Bracket | Public School | Private School |
| 3 to 4 Year Olds | 60 (50.4%) | 59 (49.6%) |
| 5 to 9 Year Old | 475 (89.8%) | 54 (10.2%) |
| 10 to 14 Year Olds | 340 (96.3%) | 13 (3.7%) |
| 15 to 17 Year Olds | 39 (69.6%) | 17 (30.4%) |
| 18 to 19 Year Olds | 125 (100.0%) | 0 (0.0%) |
| 20 to 24 Year Olds | 117 (100.0%) | 0 (0.0%) |
| 25 to 34 Year Olds | 27 (100.0%) | 0 (0.0%) |
| 35 Years and over | 99 (100.0%) | 0 (0.0%) |
| Total | 1,282 (90.0%) | 142 (10.0%) |
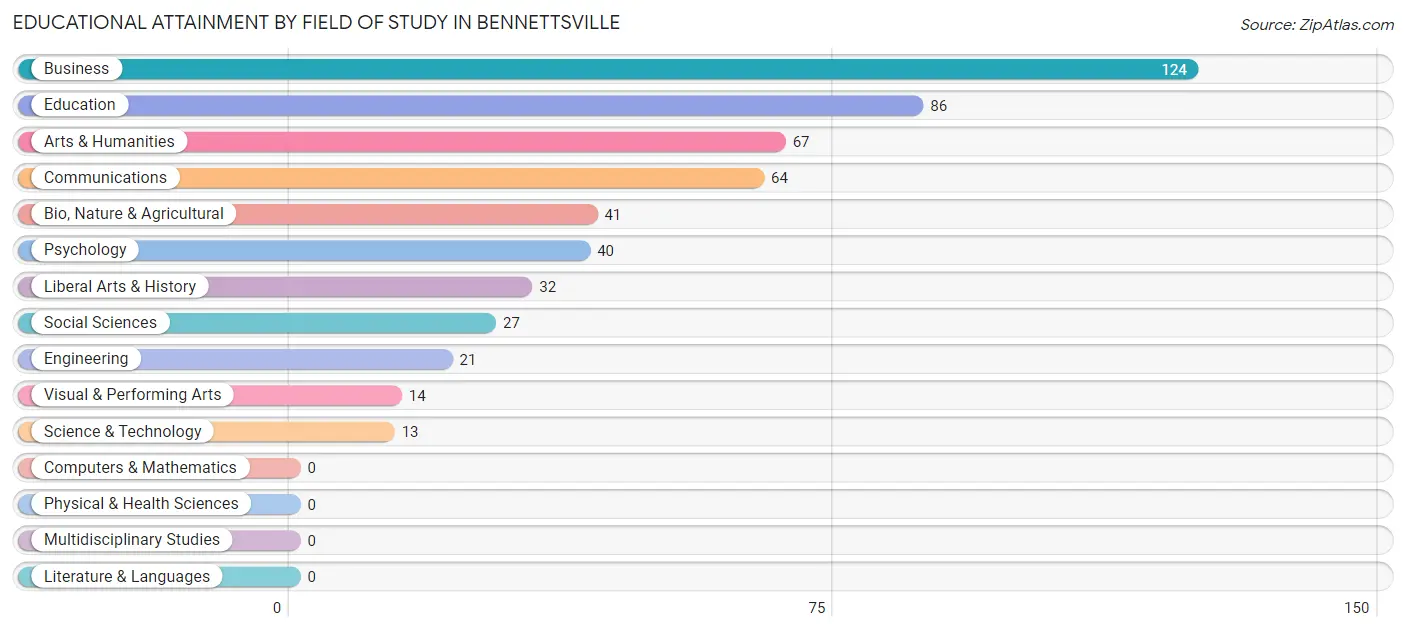
Educational Attainment by Field of Study in Bennettsville
Business (124 | 23.4%), education (86 | 16.3%), arts & humanities (67 | 12.7%), communications (64 | 12.1%), and bio, nature & agricultural (41 | 7.7%) are the most common fields of study among 529 individuals in Bennettsville who have obtained a bachelor's degree or higher.
| Field of Study | # Graduates | % Graduates |
| Computers & Mathematics | 0 | 0.0% |
| Bio, Nature & Agricultural | 41 | 7.7% |
| Physical & Health Sciences | 0 | 0.0% |
| Psychology | 40 | 7.6% |
| Social Sciences | 27 | 5.1% |
| Engineering | 21 | 4.0% |
| Multidisciplinary Studies | 0 | 0.0% |
| Science & Technology | 13 | 2.5% |
| Business | 124 | 23.4% |
| Education | 86 | 16.3% |
| Literature & Languages | 0 | 0.0% |
| Liberal Arts & History | 32 | 6.0% |
| Visual & Performing Arts | 14 | 2.6% |
| Communications | 64 | 12.1% |
| Arts & Humanities | 67 | 12.7% |
| Total | 529 | 100.0% |
Transportation & Commute in Bennettsville
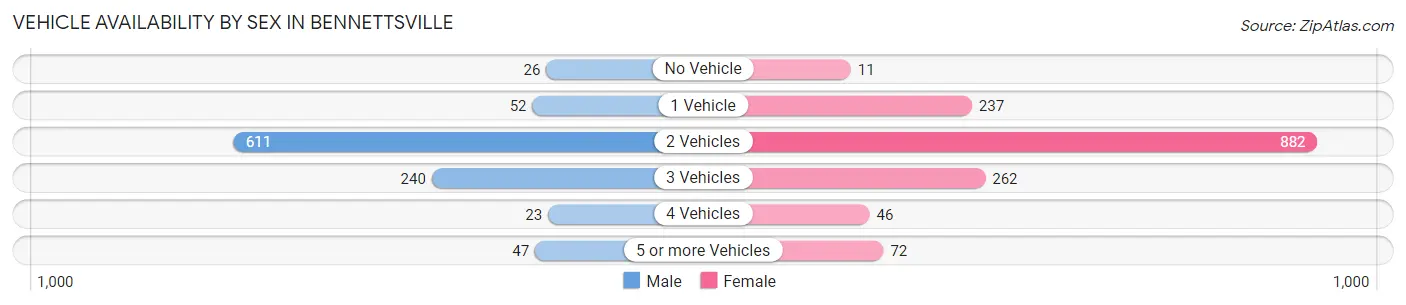
Vehicle Availability by Sex in Bennettsville
The most prevalent vehicle ownership categories in Bennettsville are males with 2 vehicles (611, accounting for 61.2%) and females with 2 vehicles (882, making up 40.5%).
| Vehicles Available | Male | Female |
| No Vehicle | 26 (2.6%) | 11 (0.7%) |
| 1 Vehicle | 52 (5.2%) | 237 (15.7%) |
| 2 Vehicles | 611 (61.2%) | 882 (58.4%) |
| 3 Vehicles | 240 (24.0%) | 262 (17.3%) |
| 4 Vehicles | 23 (2.3%) | 46 (3.0%) |
| 5 or more Vehicles | 47 (4.7%) | 72 (4.8%) |
| Total | 999 (100.0%) | 1,510 (100.0%) |
Commute Time in Bennettsville
The most frequently occuring commute durations in Bennettsville are 10 to 14 minutes (523 commuters, 21.9%), 15 to 19 minutes (420 commuters, 17.6%), and 60 to 89 minutes (285 commuters, 11.9%).
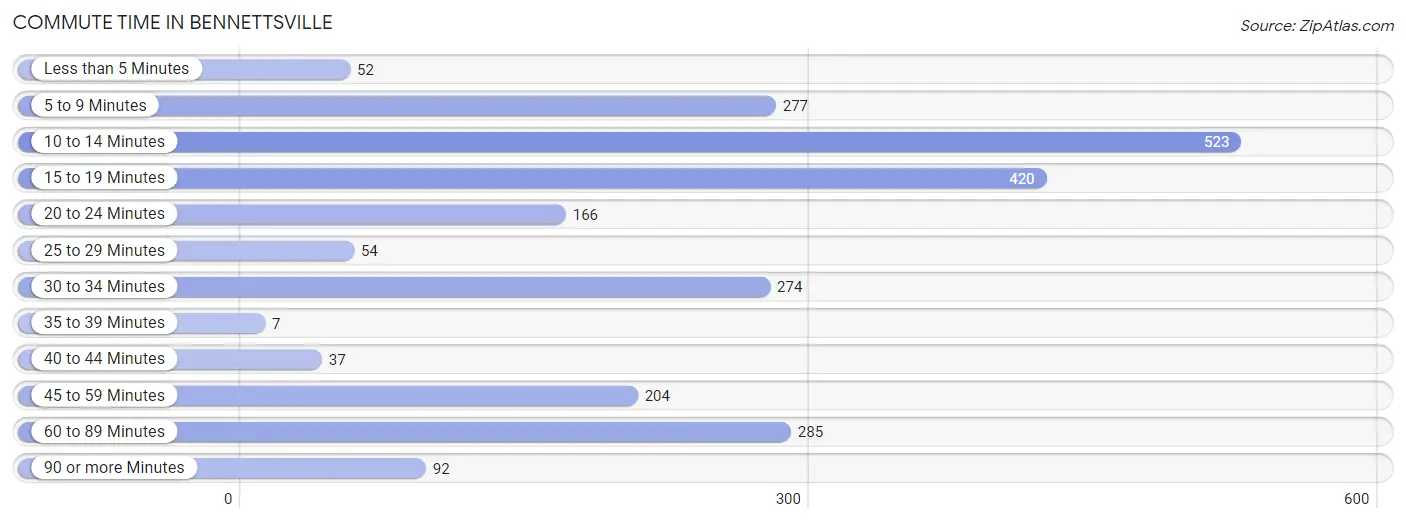
| Commute Time | # Commuters | % Commuters |
| Less than 5 Minutes | 52 | 2.2% |
| 5 to 9 Minutes | 277 | 11.6% |
| 10 to 14 Minutes | 523 | 21.9% |
| 15 to 19 Minutes | 420 | 17.6% |
| 20 to 24 Minutes | 166 | 6.9% |
| 25 to 29 Minutes | 54 | 2.3% |
| 30 to 34 Minutes | 274 | 11.5% |
| 35 to 39 Minutes | 7 | 0.3% |
| 40 to 44 Minutes | 37 | 1.5% |
| 45 to 59 Minutes | 204 | 8.5% |
| 60 to 89 Minutes | 285 | 11.9% |
| 90 or more Minutes | 92 | 3.8% |
Commute Time by Sex in Bennettsville
The most common commute times in Bennettsville are 10 to 14 minutes (206 commuters, 21.2%) for males and 10 to 14 minutes (317 commuters, 22.4%) for females.
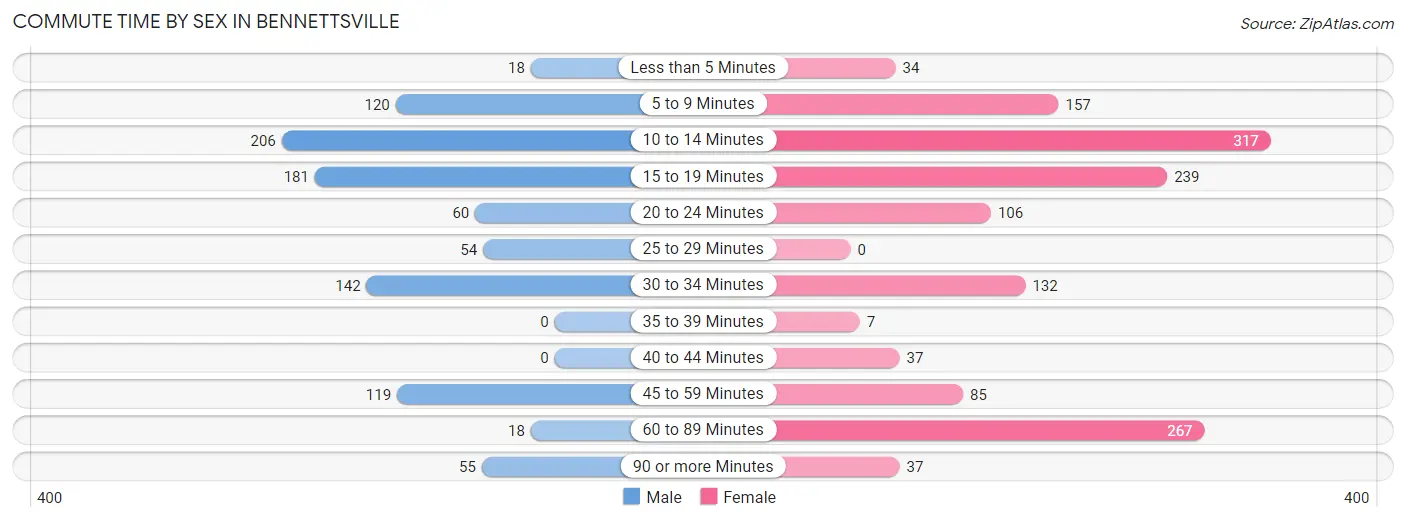
| Commute Time | Male | Female |
| Less than 5 Minutes | 18 (1.8%) | 34 (2.4%) |
| 5 to 9 Minutes | 120 (12.3%) | 157 (11.1%) |
| 10 to 14 Minutes | 206 (21.2%) | 317 (22.4%) |
| 15 to 19 Minutes | 181 (18.6%) | 239 (16.9%) |
| 20 to 24 Minutes | 60 (6.2%) | 106 (7.5%) |
| 25 to 29 Minutes | 54 (5.6%) | 0 (0.0%) |
| 30 to 34 Minutes | 142 (14.6%) | 132 (9.3%) |
| 35 to 39 Minutes | 0 (0.0%) | 7 (0.5%) |
| 40 to 44 Minutes | 0 (0.0%) | 37 (2.6%) |
| 45 to 59 Minutes | 119 (12.2%) | 85 (6.0%) |
| 60 to 89 Minutes | 18 (1.8%) | 267 (18.8%) |
| 90 or more Minutes | 55 (5.7%) | 37 (2.6%) |
Time of Departure to Work by Sex in Bennettsville
The most frequent times of departure to work in Bennettsville are 12:00 PM to 3:59 PM (260, 26.7%) for males and 12:00 PM to 3:59 PM (452, 31.9%) for females.
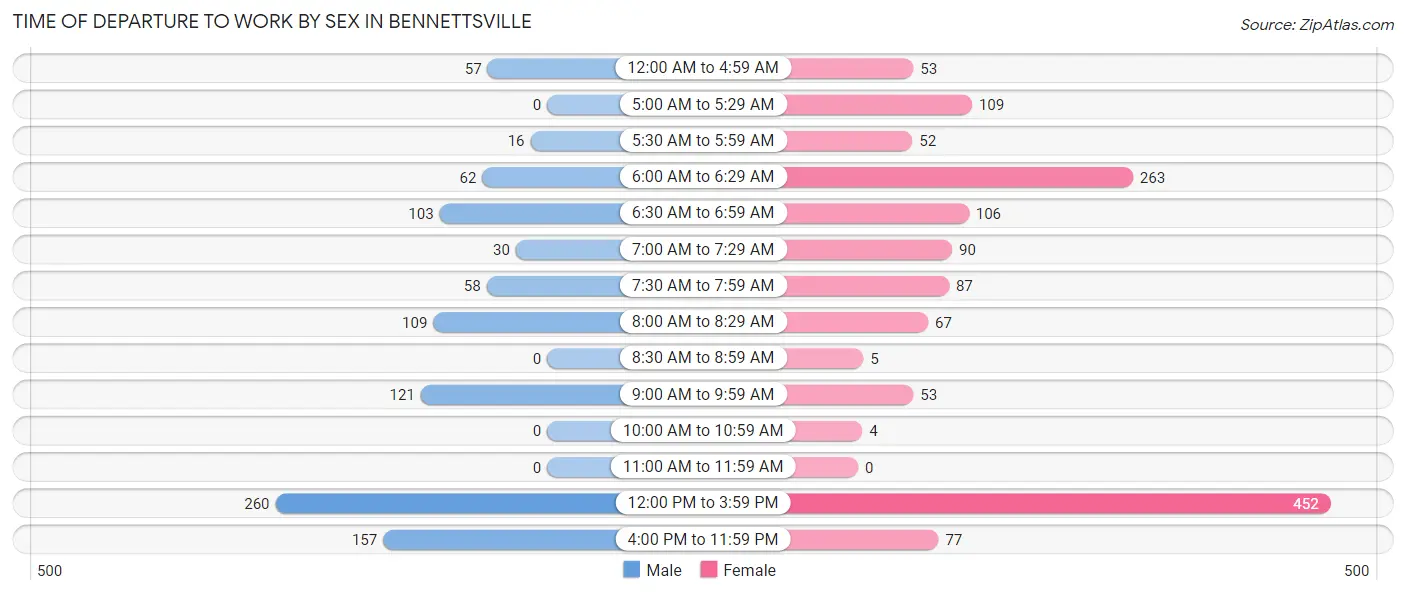
| Time of Departure | Male | Female |
| 12:00 AM to 4:59 AM | 57 (5.9%) | 53 (3.7%) |
| 5:00 AM to 5:29 AM | 0 (0.0%) | 109 (7.7%) |
| 5:30 AM to 5:59 AM | 16 (1.6%) | 52 (3.7%) |
| 6:00 AM to 6:29 AM | 62 (6.4%) | 263 (18.5%) |
| 6:30 AM to 6:59 AM | 103 (10.6%) | 106 (7.5%) |
| 7:00 AM to 7:29 AM | 30 (3.1%) | 90 (6.4%) |
| 7:30 AM to 7:59 AM | 58 (6.0%) | 87 (6.1%) |
| 8:00 AM to 8:29 AM | 109 (11.2%) | 67 (4.7%) |
| 8:30 AM to 8:59 AM | 0 (0.0%) | 5 (0.4%) |
| 9:00 AM to 9:59 AM | 121 (12.4%) | 53 (3.7%) |
| 10:00 AM to 10:59 AM | 0 (0.0%) | 4 (0.3%) |
| 11:00 AM to 11:59 AM | 0 (0.0%) | 0 (0.0%) |
| 12:00 PM to 3:59 PM | 260 (26.7%) | 452 (31.9%) |
| 4:00 PM to 11:59 PM | 157 (16.1%) | 77 (5.4%) |
| Total | 973 (100.0%) | 1,418 (100.0%) |
Housing Occupancy in Bennettsville
Occupancy by Ownership in Bennettsville
Of the total 2,749 dwellings in Bennettsville, owner-occupied units account for 1,465 (53.3%), while renter-occupied units make up 1,284 (46.7%).
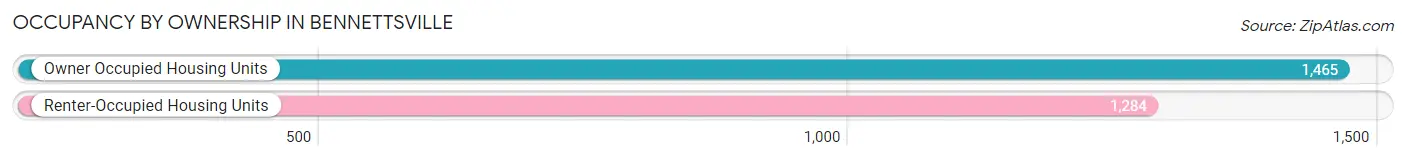
| Occupancy | # Housing Units | % Housing Units |
| Owner Occupied Housing Units | 1,465 | 53.3% |
| Renter-Occupied Housing Units | 1,284 | 46.7% |
| Total Occupied Housing Units | 2,749 | 100.0% |
Occupancy by Household Size in Bennettsville
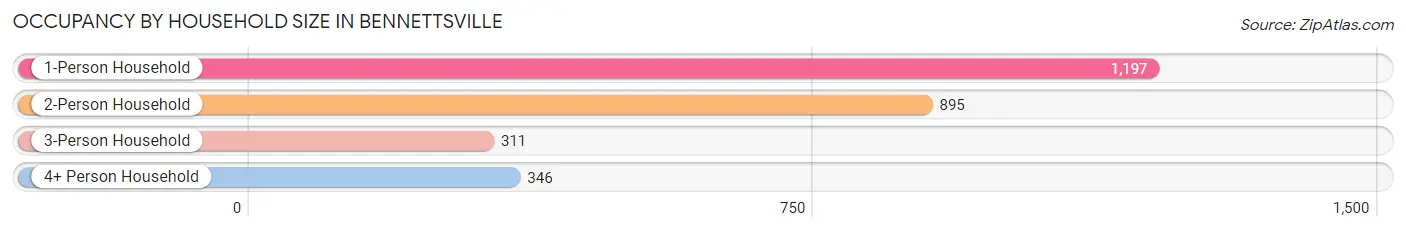
| Household Size | # Housing Units | % Housing Units |
| 1-Person Household | 1,197 | 43.5% |
| 2-Person Household | 895 | 32.6% |
| 3-Person Household | 311 | 11.3% |
| 4+ Person Household | 346 | 12.6% |
| Total Housing Units | 2,749 | 100.0% |
Occupancy by Ownership by Household Size in Bennettsville
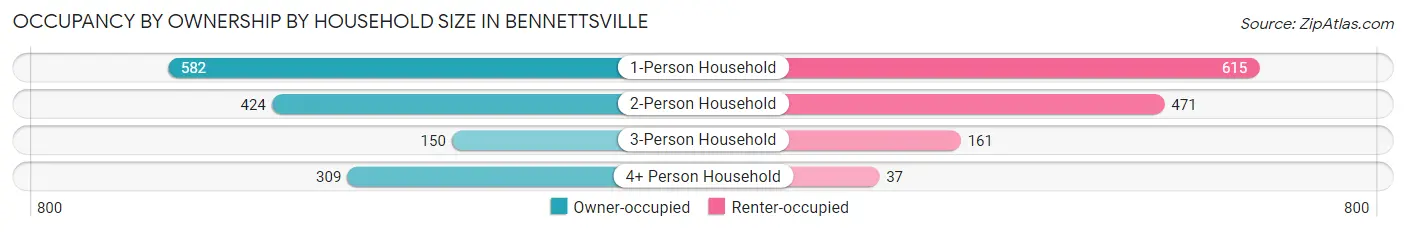
| Household Size | Owner-occupied | Renter-occupied |
| 1-Person Household | 582 (48.6%) | 615 (51.4%) |
| 2-Person Household | 424 (47.4%) | 471 (52.6%) |
| 3-Person Household | 150 (48.2%) | 161 (51.8%) |
| 4+ Person Household | 309 (89.3%) | 37 (10.7%) |
| Total Housing Units | 1,465 (53.3%) | 1,284 (46.7%) |
Occupancy by Educational Attainment in Bennettsville
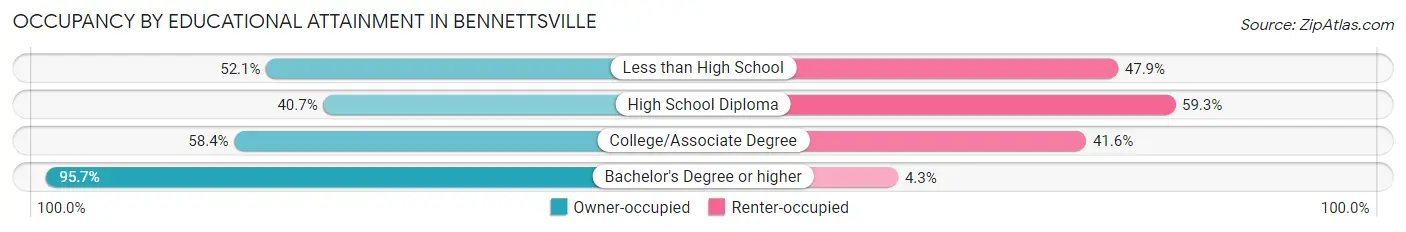
| Household Size | Owner-occupied | Renter-occupied |
| Less than High School | 188 (52.1%) | 173 (47.9%) |
| High School Diploma | 550 (40.7%) | 800 (59.3%) |
| College/Associate Degree | 417 (58.4%) | 297 (41.6%) |
| Bachelor's Degree or higher | 310 (95.7%) | 14 (4.3%) |
Occupancy by Age of Householder in Bennettsville
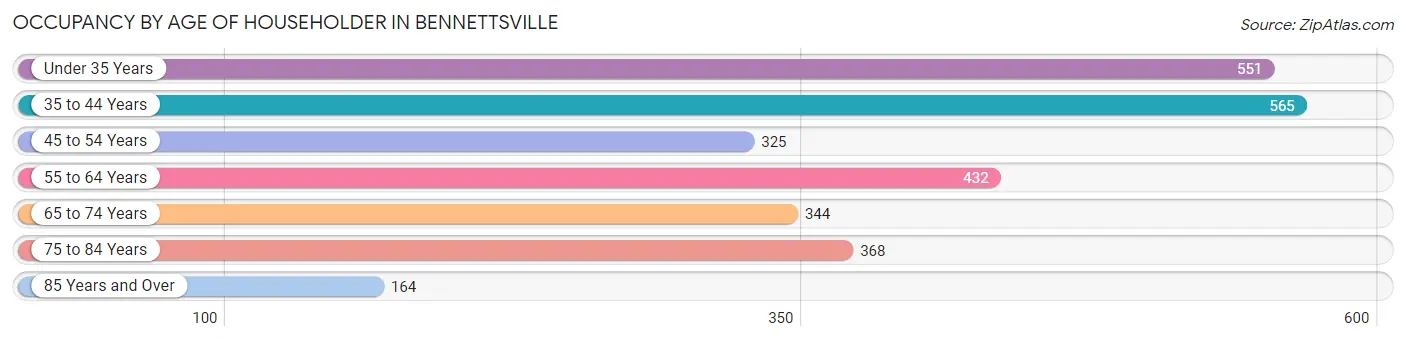
| Age Bracket | # Households | % Households |
| Under 35 Years | 551 | 20.0% |
| 35 to 44 Years | 565 | 20.5% |
| 45 to 54 Years | 325 | 11.8% |
| 55 to 64 Years | 432 | 15.7% |
| 65 to 74 Years | 344 | 12.5% |
| 75 to 84 Years | 368 | 13.4% |
| 85 Years and Over | 164 | 6.0% |
| Total | 2,749 | 100.0% |
Housing Finances in Bennettsville
Median Income by Occupancy in Bennettsville
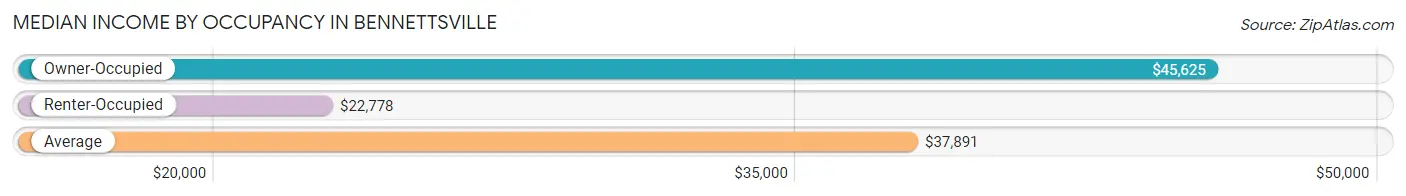
| Occupancy Type | # Households | Median Income |
| Owner-Occupied | 1,465 (53.3%) | $45,625 |
| Renter-Occupied | 1,284 (46.7%) | $22,778 |
| Average | 2,749 (100.0%) | $37,891 |
Occupancy by Householder Income Bracket in Bennettsville
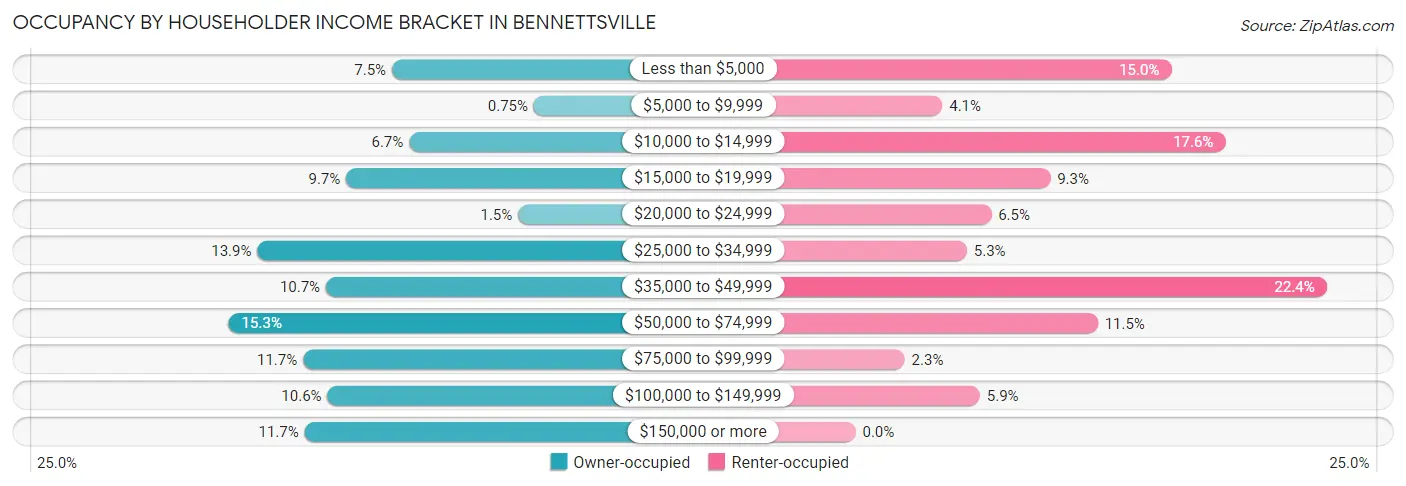
| Income Bracket | Owner-occupied | Renter-occupied |
| Less than $5,000 | 110 (7.5%) | 193 (15.0%) |
| $5,000 to $9,999 | 11 (0.7%) | 53 (4.1%) |
| $10,000 to $14,999 | 98 (6.7%) | 226 (17.6%) |
| $15,000 to $19,999 | 142 (9.7%) | 119 (9.3%) |
| $20,000 to $24,999 | 22 (1.5%) | 83 (6.5%) |
| $25,000 to $34,999 | 204 (13.9%) | 68 (5.3%) |
| $35,000 to $49,999 | 156 (10.6%) | 288 (22.4%) |
| $50,000 to $74,999 | 224 (15.3%) | 148 (11.5%) |
| $75,000 to $99,999 | 172 (11.7%) | 30 (2.3%) |
| $100,000 to $149,999 | 155 (10.6%) | 76 (5.9%) |
| $150,000 or more | 171 (11.7%) | 0 (0.0%) |
| Total | 1,465 (100.0%) | 1,284 (100.0%) |
Monthly Housing Cost Tiers in Bennettsville
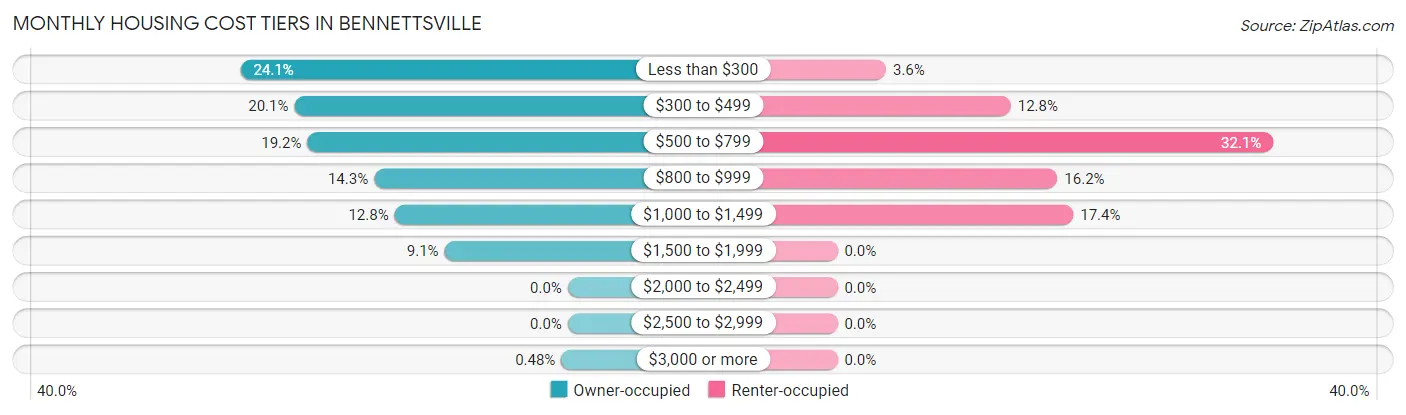
| Monthly Cost | Owner-occupied | Renter-occupied |
| Less than $300 | 353 (24.1%) | 46 (3.6%) |
| $300 to $499 | 295 (20.1%) | 164 (12.8%) |
| $500 to $799 | 281 (19.2%) | 412 (32.1%) |
| $800 to $999 | 209 (14.3%) | 208 (16.2%) |
| $1,000 to $1,499 | 187 (12.8%) | 223 (17.4%) |
| $1,500 to $1,999 | 133 (9.1%) | 0 (0.0%) |
| $2,000 to $2,499 | 0 (0.0%) | 0 (0.0%) |
| $2,500 to $2,999 | 0 (0.0%) | 0 (0.0%) |
| $3,000 or more | 7 (0.5%) | 0 (0.0%) |
| Total | 1,465 (100.0%) | 1,284 (100.0%) |
Physical Housing Characteristics in Bennettsville
Housing Structures in Bennettsville
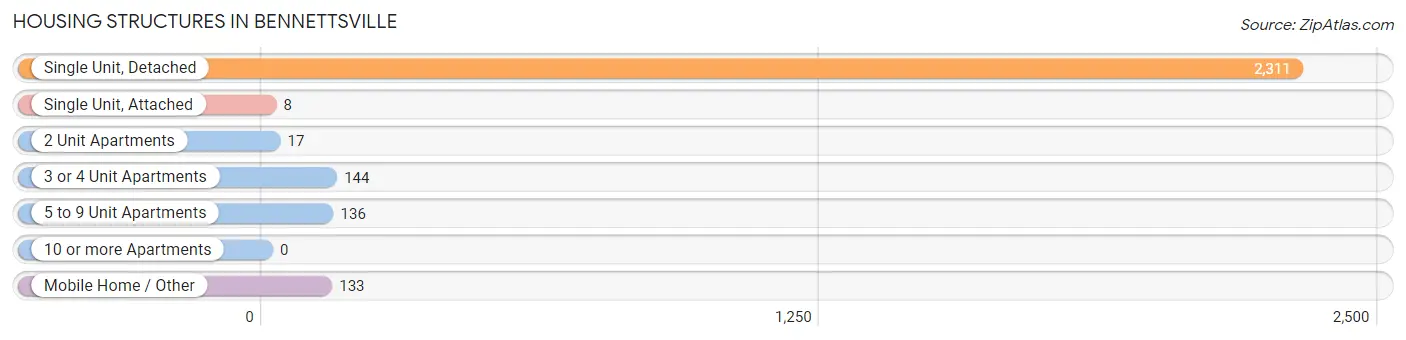
| Structure Type | # Housing Units | % Housing Units |
| Single Unit, Detached | 2,311 | 84.1% |
| Single Unit, Attached | 8 | 0.3% |
| 2 Unit Apartments | 17 | 0.6% |
| 3 or 4 Unit Apartments | 144 | 5.2% |
| 5 to 9 Unit Apartments | 136 | 5.0% |
| 10 or more Apartments | 0 | 0.0% |
| Mobile Home / Other | 133 | 4.8% |
| Total | 2,749 | 100.0% |
Housing Structures by Occupancy in Bennettsville
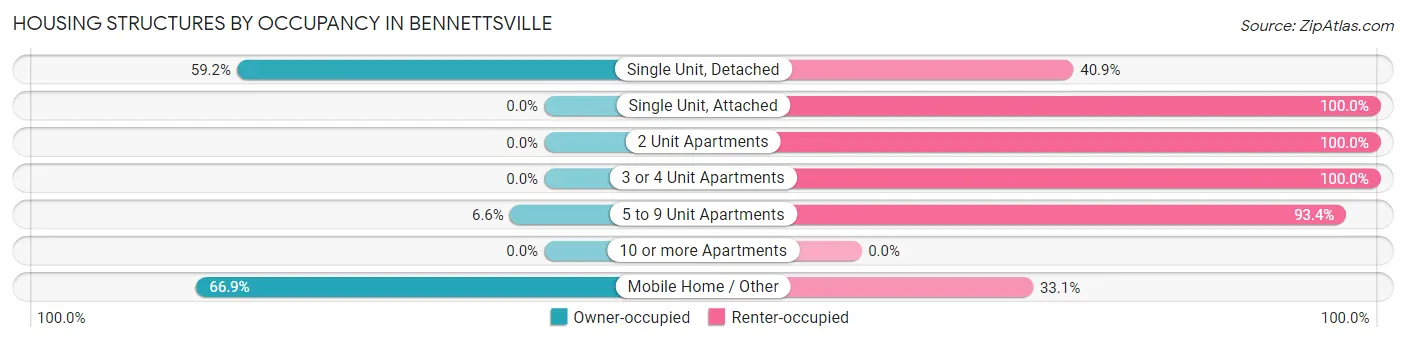
| Structure Type | Owner-occupied | Renter-occupied |
| Single Unit, Detached | 1,367 (59.2%) | 944 (40.8%) |
| Single Unit, Attached | 0 (0.0%) | 8 (100.0%) |
| 2 Unit Apartments | 0 (0.0%) | 17 (100.0%) |
| 3 or 4 Unit Apartments | 0 (0.0%) | 144 (100.0%) |
| 5 to 9 Unit Apartments | 9 (6.6%) | 127 (93.4%) |
| 10 or more Apartments | 0 (0.0%) | 0 (0.0%) |
| Mobile Home / Other | 89 (66.9%) | 44 (33.1%) |
| Total | 1,465 (53.3%) | 1,284 (46.7%) |
Housing Structures by Number of Rooms in Bennettsville
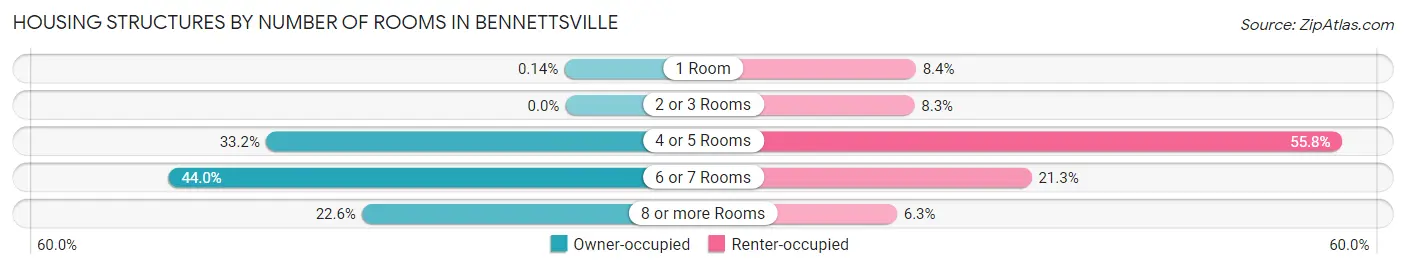
| Number of Rooms | Owner-occupied | Renter-occupied |
| 1 Room | 2 (0.1%) | 108 (8.4%) |
| 2 or 3 Rooms | 0 (0.0%) | 106 (8.3%) |
| 4 or 5 Rooms | 487 (33.2%) | 716 (55.8%) |
| 6 or 7 Rooms | 645 (44.0%) | 273 (21.3%) |
| 8 or more Rooms | 331 (22.6%) | 81 (6.3%) |
| Total | 1,465 (100.0%) | 1,284 (100.0%) |
Housing Structure by Heating Type in Bennettsville
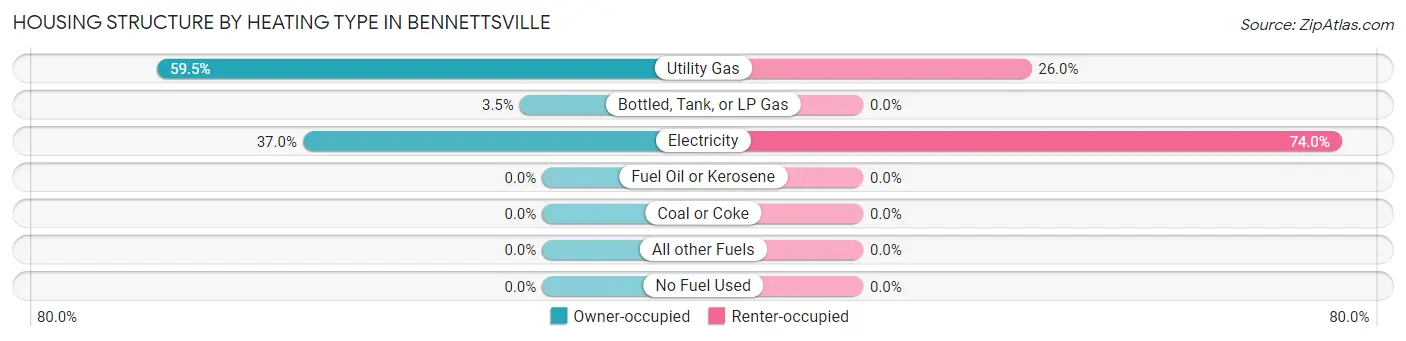
| Heating Type | Owner-occupied | Renter-occupied |
| Utility Gas | 872 (59.5%) | 334 (26.0%) |
| Bottled, Tank, or LP Gas | 51 (3.5%) | 0 (0.0%) |
| Electricity | 542 (37.0%) | 950 (74.0%) |
| Fuel Oil or Kerosene | 0 (0.0%) | 0 (0.0%) |
| Coal or Coke | 0 (0.0%) | 0 (0.0%) |
| All other Fuels | 0 (0.0%) | 0 (0.0%) |
| No Fuel Used | 0 (0.0%) | 0 (0.0%) |
| Total | 1,465 (100.0%) | 1,284 (100.0%) |
Household Vehicle Usage in Bennettsville
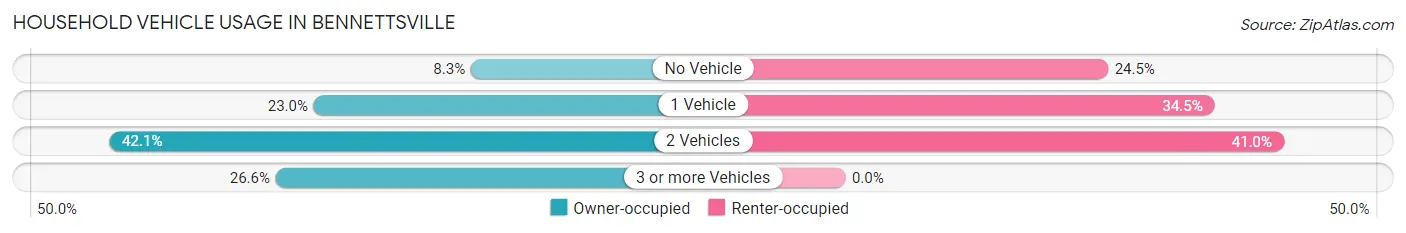
| Vehicles per Household | Owner-occupied | Renter-occupied |
| No Vehicle | 122 (8.3%) | 315 (24.5%) |
| 1 Vehicle | 337 (23.0%) | 443 (34.5%) |
| 2 Vehicles | 617 (42.1%) | 526 (41.0%) |
| 3 or more Vehicles | 389 (26.6%) | 0 (0.0%) |
| Total | 1,465 (100.0%) | 1,284 (100.0%) |
Real Estate & Mortgages in Bennettsville
Real Estate and Mortgage Overview in Bennettsville
| Characteristic | Without Mortgage | With Mortgage |
| Housing Units | 877 | 588 |
| Median Property Value | $75,600 | $121,800 |
| Median Household Income | $33,481 | $133 |
| Monthly Housing Costs | $342 | $7 |
| Real Estate Taxes | $393 | $19 |
Property Value by Mortgage Status in Bennettsville
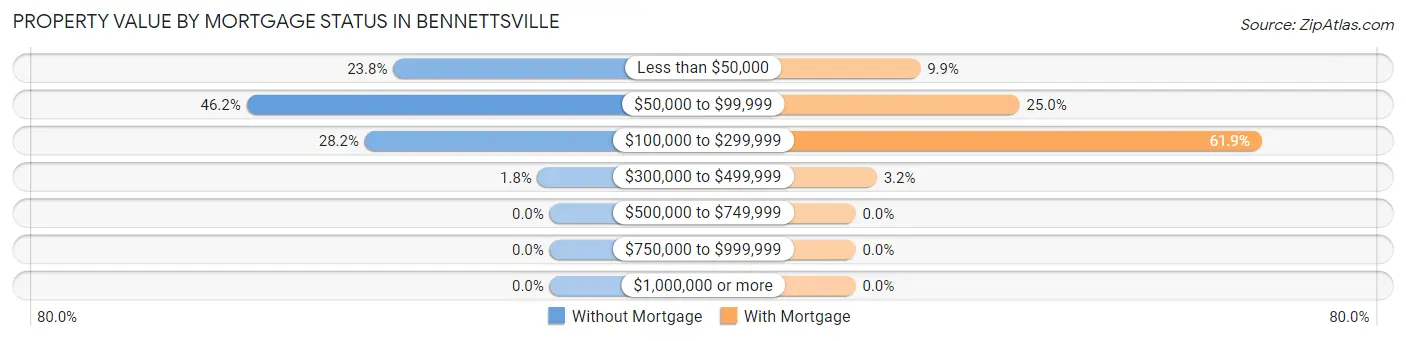
| Property Value | Without Mortgage | With Mortgage |
| Less than $50,000 | 209 (23.8%) | 58 (9.9%) |
| $50,000 to $99,999 | 405 (46.2%) | 147 (25.0%) |
| $100,000 to $299,999 | 247 (28.2%) | 364 (61.9%) |
| $300,000 to $499,999 | 16 (1.8%) | 19 (3.2%) |
| $500,000 to $749,999 | 0 (0.0%) | 0 (0.0%) |
| $750,000 to $999,999 | 0 (0.0%) | 0 (0.0%) |
| $1,000,000 or more | 0 (0.0%) | 0 (0.0%) |
| Total | 877 (100.0%) | 588 (100.0%) |
Household Income by Mortgage Status in Bennettsville
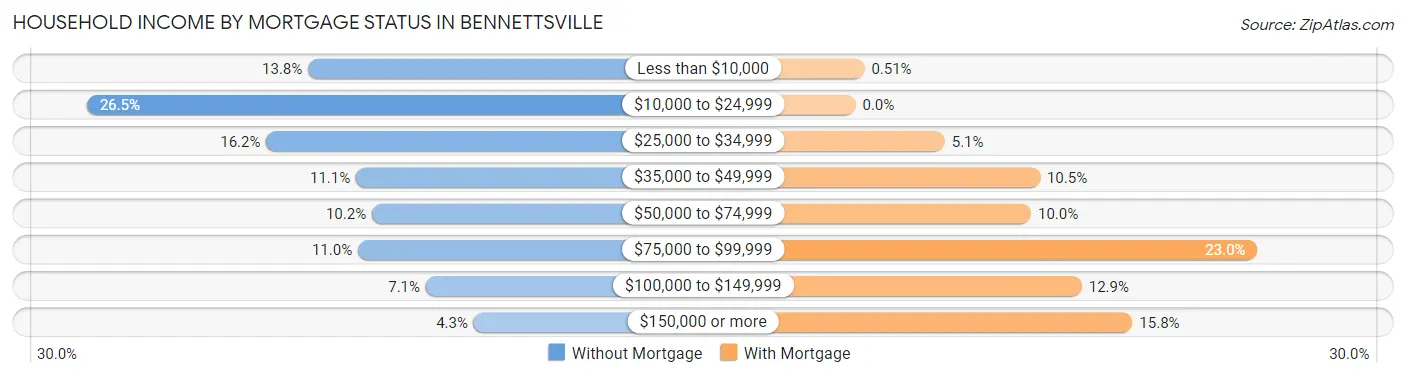
| Household Income | Without Mortgage | With Mortgage |
| Less than $10,000 | 121 (13.8%) | 3 (0.5%) |
| $10,000 to $24,999 | 232 (26.5%) | 0 (0.0%) |
| $25,000 to $34,999 | 142 (16.2%) | 30 (5.1%) |
| $35,000 to $49,999 | 97 (11.1%) | 62 (10.5%) |
| $50,000 to $74,999 | 89 (10.2%) | 59 (10.0%) |
| $75,000 to $99,999 | 96 (11.0%) | 135 (23.0%) |
| $100,000 to $149,999 | 62 (7.1%) | 76 (12.9%) |
| $150,000 or more | 38 (4.3%) | 93 (15.8%) |
| Total | 877 (100.0%) | 588 (100.0%) |
Property Value to Household Income Ratio in Bennettsville
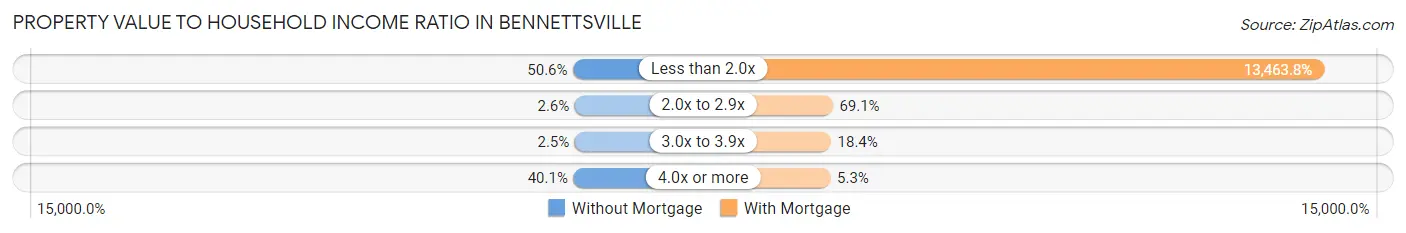
| Value-to-Income Ratio | Without Mortgage | With Mortgage |
| Less than 2.0x | 444 (50.6%) | 79,167 (13,463.8%) |
| 2.0x to 2.9x | 23 (2.6%) | 406 (69.1%) |
| 3.0x to 3.9x | 22 (2.5%) | 108 (18.4%) |
| 4.0x or more | 352 (40.1%) | 31 (5.3%) |
| Total | 877 (100.0%) | 588 (100.0%) |
Real Estate Taxes by Mortgage Status in Bennettsville
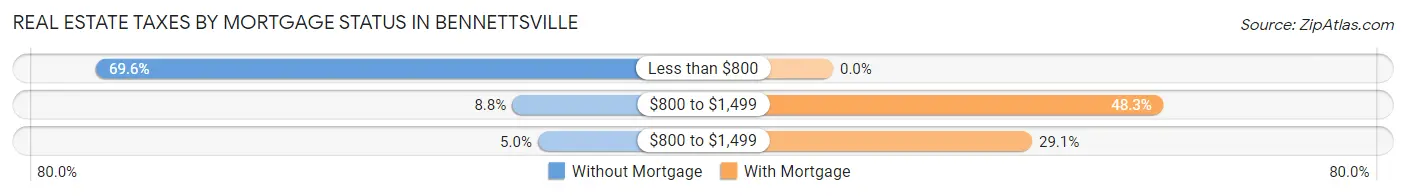
| Property Taxes | Without Mortgage | With Mortgage |
| Less than $800 | 610 (69.6%) | 0 (0.0%) |
| $800 to $1,499 | 77 (8.8%) | 284 (48.3%) |
| $800 to $1,499 | 44 (5.0%) | 171 (29.1%) |
| Total | 877 (100.0%) | 588 (100.0%) |
Health & Disability in Bennettsville
Health Insurance Coverage by Age in Bennettsville
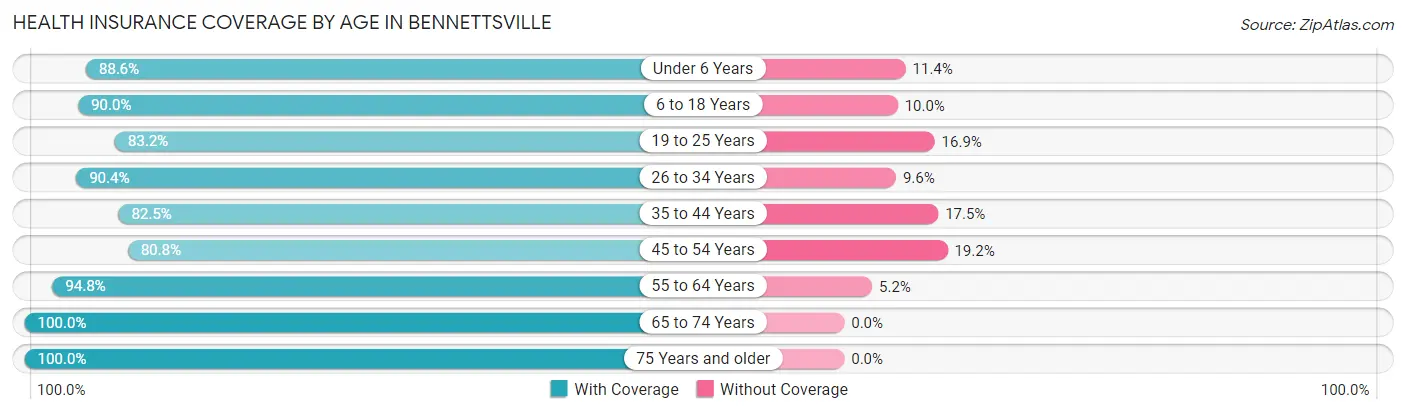
| Age Bracket | With Coverage | Without Coverage |
| Under 6 Years | 457 (88.6%) | 59 (11.4%) |
| 6 to 18 Years | 759 (90.0%) | 84 (10.0%) |
| 19 to 25 Years | 617 (83.2%) | 125 (16.9%) |
| 26 to 34 Years | 629 (90.4%) | 67 (9.6%) |
| 35 to 44 Years | 716 (82.5%) | 152 (17.5%) |
| 45 to 54 Years | 638 (80.8%) | 152 (19.2%) |
| 55 to 64 Years | 585 (94.8%) | 32 (5.2%) |
| 65 to 74 Years | 534 (100.0%) | 0 (0.0%) |
| 75 Years and older | 612 (100.0%) | 0 (0.0%) |
| Total | 5,547 (89.2%) | 671 (10.8%) |
Health Insurance Coverage by Citizenship Status in Bennettsville
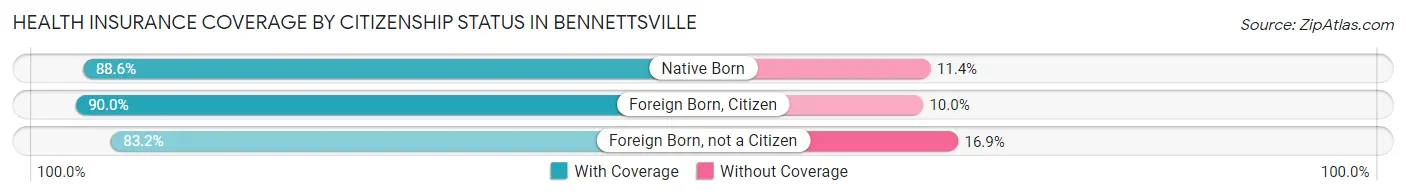
| Citizenship Status | With Coverage | Without Coverage |
| Native Born | 457 (88.6%) | 59 (11.4%) |
| Foreign Born, Citizen | 759 (90.0%) | 84 (10.0%) |
| Foreign Born, not a Citizen | 617 (83.2%) | 125 (16.9%) |
Health Insurance Coverage by Household Income in Bennettsville
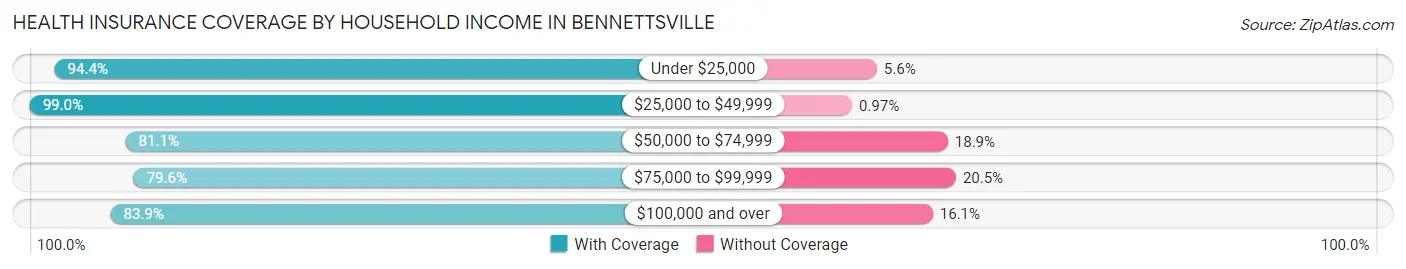
| Household Income | With Coverage | Without Coverage |
| Under $25,000 | 1,806 (94.4%) | 108 (5.6%) |
| $25,000 to $49,999 | 1,219 (99.0%) | 12 (1.0%) |
| $50,000 to $74,999 | 676 (81.1%) | 158 (18.9%) |
| $75,000 to $99,999 | 642 (79.5%) | 165 (20.4%) |
| $100,000 and over | 1,186 (83.9%) | 228 (16.1%) |
Public vs Private Health Insurance Coverage by Age in Bennettsville
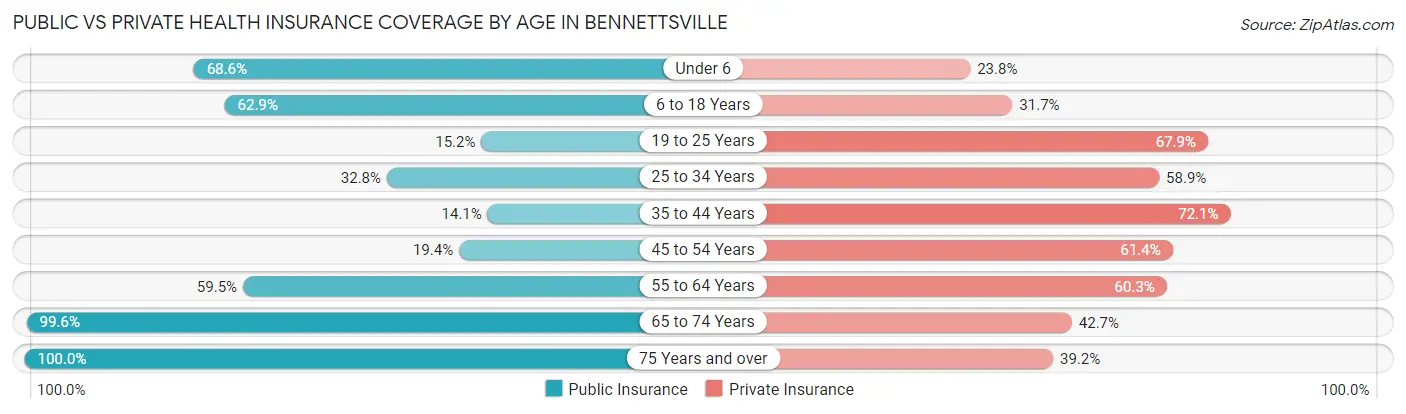
| Age Bracket | Public Insurance | Private Insurance |
| Under 6 | 354 (68.6%) | 123 (23.8%) |
| 6 to 18 Years | 530 (62.9%) | 267 (31.7%) |
| 19 to 25 Years | 113 (15.2%) | 504 (67.9%) |
| 25 to 34 Years | 228 (32.8%) | 410 (58.9%) |
| 35 to 44 Years | 122 (14.1%) | 626 (72.1%) |
| 45 to 54 Years | 153 (19.4%) | 485 (61.4%) |
| 55 to 64 Years | 367 (59.5%) | 372 (60.3%) |
| 65 to 74 Years | 532 (99.6%) | 228 (42.7%) |
| 75 Years and over | 612 (100.0%) | 240 (39.2%) |
| Total | 3,011 (48.4%) | 3,255 (52.3%) |
Disability Status by Sex by Age in Bennettsville
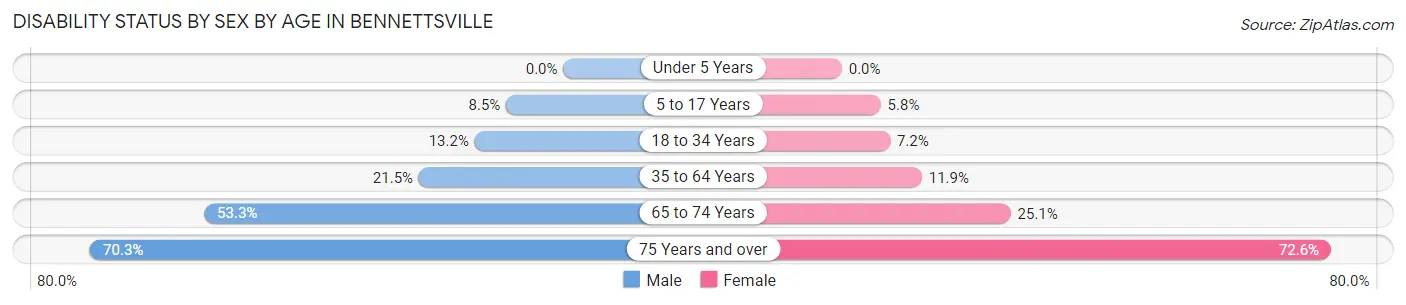
| Age Bracket | Male | Female |
| Under 5 Years | 0 (0.0%) | 0 (0.0%) |
| 5 to 17 Years | 41 (8.5%) | 27 (5.8%) |
| 18 to 34 Years | 92 (13.2%) | 55 (7.1%) |
| 35 to 64 Years | 181 (21.4%) | 170 (11.9%) |
| 65 to 74 Years | 104 (53.3%) | 85 (25.1%) |
| 75 Years and over | 163 (70.3%) | 276 (72.6%) |
Disability Class by Sex by Age in Bennettsville
Disability Class: Hearing Difficulty
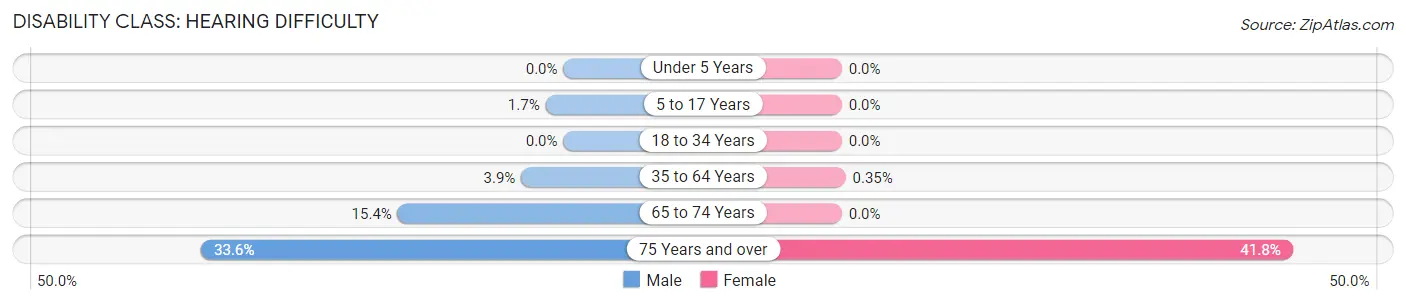
| Age Bracket | Male | Female |
| Under 5 Years | 0 (0.0%) | 0 (0.0%) |
| 5 to 17 Years | 8 (1.7%) | 0 (0.0%) |
| 18 to 34 Years | 0 (0.0%) | 0 (0.0%) |
| 35 to 64 Years | 33 (3.9%) | 5 (0.4%) |
| 65 to 74 Years | 30 (15.4%) | 0 (0.0%) |
| 75 Years and over | 78 (33.6%) | 159 (41.8%) |
Disability Class: Vision Difficulty
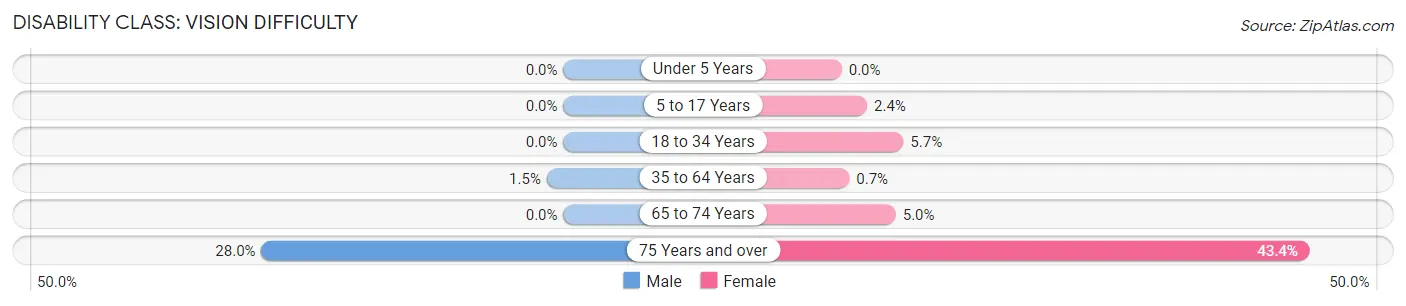
| Age Bracket | Male | Female |
| Under 5 Years | 0 (0.0%) | 0 (0.0%) |
| 5 to 17 Years | 0 (0.0%) | 11 (2.4%) |
| 18 to 34 Years | 0 (0.0%) | 44 (5.7%) |
| 35 to 64 Years | 13 (1.5%) | 10 (0.7%) |
| 65 to 74 Years | 0 (0.0%) | 17 (5.0%) |
| 75 Years and over | 65 (28.0%) | 165 (43.4%) |
Disability Class: Cognitive Difficulty
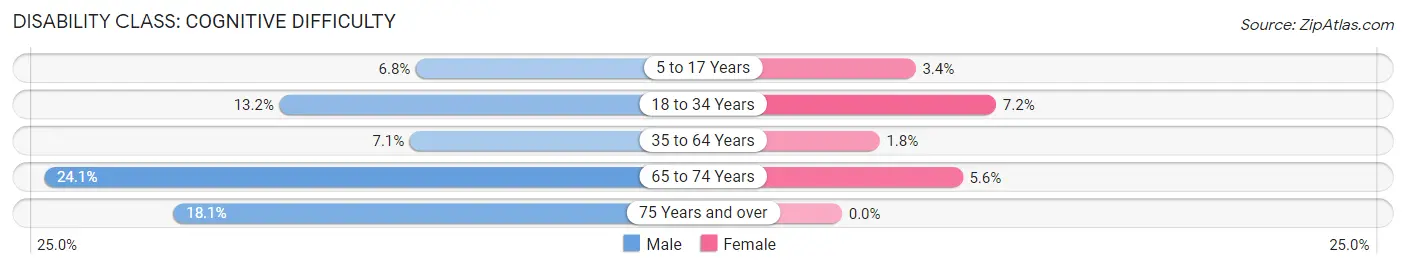
| Age Bracket | Male | Female |
| 5 to 17 Years | 33 (6.8%) | 16 (3.4%) |
| 18 to 34 Years | 92 (13.2%) | 55 (7.1%) |
| 35 to 64 Years | 60 (7.1%) | 25 (1.8%) |
| 65 to 74 Years | 47 (24.1%) | 19 (5.6%) |
| 75 Years and over | 42 (18.1%) | 0 (0.0%) |
Disability Class: Ambulatory Difficulty
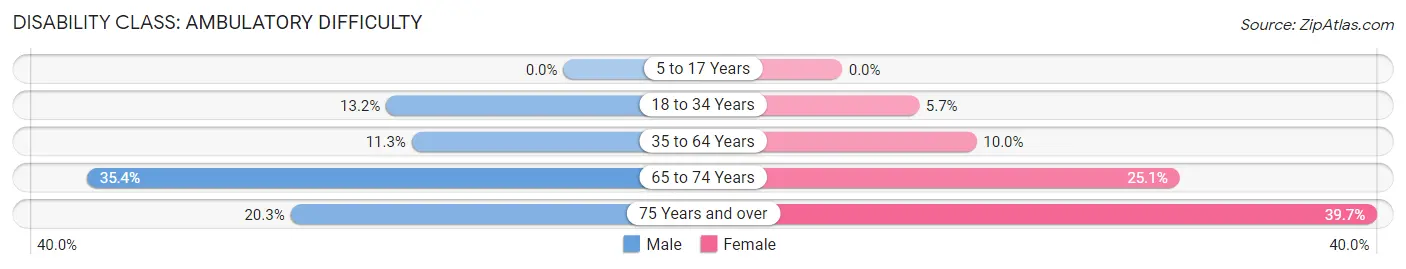
| Age Bracket | Male | Female |
| 5 to 17 Years | 0 (0.0%) | 0 (0.0%) |
| 18 to 34 Years | 92 (13.2%) | 44 (5.7%) |
| 35 to 64 Years | 95 (11.3%) | 143 (10.0%) |
| 65 to 74 Years | 69 (35.4%) | 85 (25.1%) |
| 75 Years and over | 47 (20.3%) | 151 (39.7%) |
Disability Class: Self-Care Difficulty
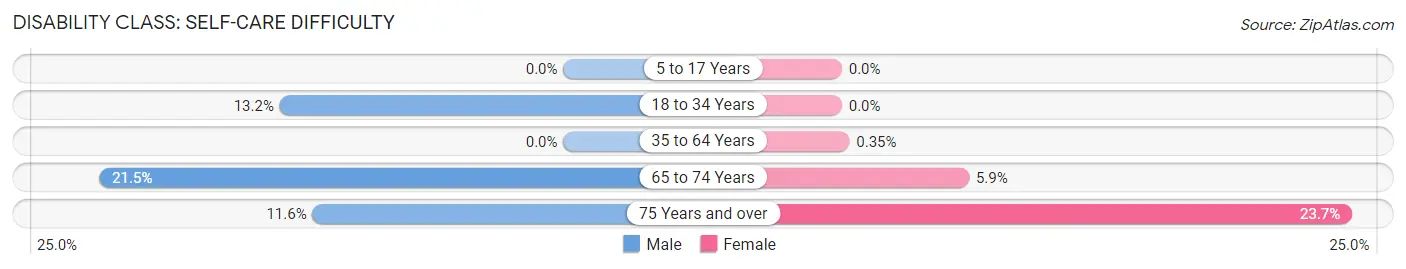
| Age Bracket | Male | Female |
| 5 to 17 Years | 0 (0.0%) | 0 (0.0%) |
| 18 to 34 Years | 92 (13.2%) | 0 (0.0%) |
| 35 to 64 Years | 0 (0.0%) | 5 (0.4%) |
| 65 to 74 Years | 42 (21.5%) | 20 (5.9%) |
| 75 Years and over | 27 (11.6%) | 90 (23.7%) |
Technology Access in Bennettsville
Computing Device Access in Bennettsville
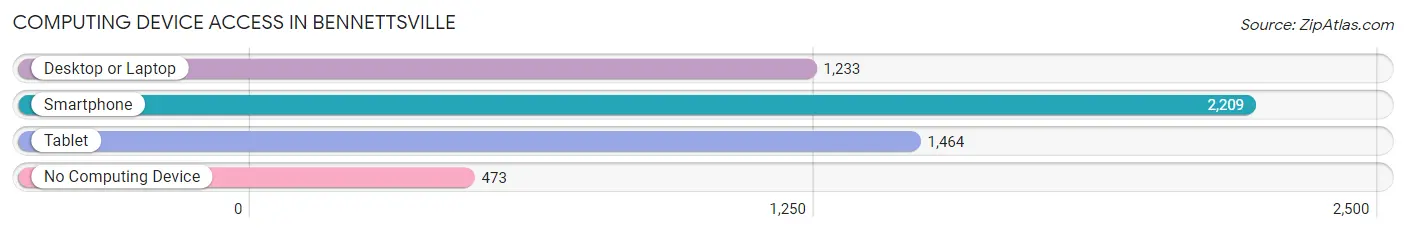
| Device Type | # Households | % Households |
| Desktop or Laptop | 1,233 | 44.9% |
| Smartphone | 2,209 | 80.4% |
| Tablet | 1,464 | 53.3% |
| No Computing Device | 473 | 17.2% |
| Total | 2,749 | 100.0% |
Internet Access in Bennettsville
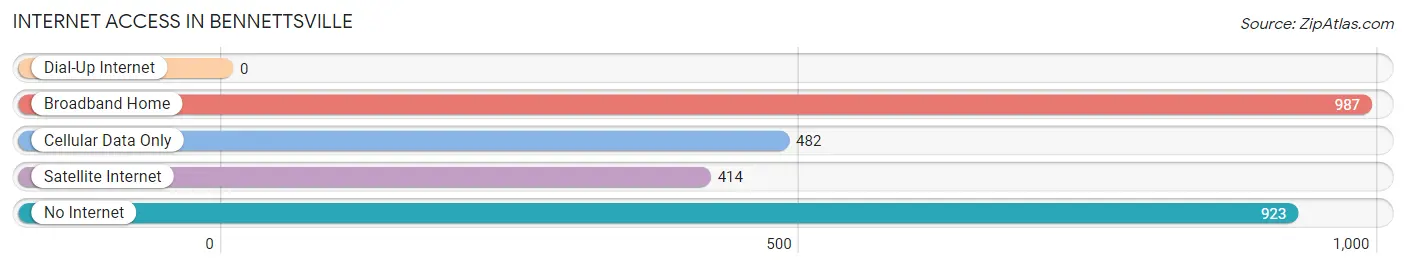
| Internet Type | # Households | % Households |
| Dial-Up Internet | 0 | 0.0% |
| Broadband Home | 987 | 35.9% |
| Cellular Data Only | 482 | 17.5% |
| Satellite Internet | 414 | 15.1% |
| No Internet | 923 | 33.6% |
| Total | 2,749 | 100.0% |
Bennettsville Summary
Bennettsville is a city located in Marlboro County, South Carolina, United States. The population was 8,425 at the 2010 census. It is the county seat of Marlboro County. Bennettsville is located in the Pee Dee region of South Carolina, and is known for its historic downtown area.
History
Bennettsville was founded in 1819 by Thomas Bennett, Jr., a wealthy planter and politician from Charleston. The town was named after him and was incorporated in 1820. The town was laid out in a grid pattern, with a central square for public buildings. The town quickly became a center of commerce and government for the surrounding area.
In the early 19th century, Bennettsville was a major cotton-producing center. The town was home to several cotton mills, and the Bennettsville Cotton Mill was one of the largest in the state. The town was also home to several banks, stores, and other businesses.
During the Civil War, Bennettsville was occupied by Union forces in 1865. After the war, the town experienced a period of economic decline, but by the early 20th century, it had become a center of the tobacco industry. The town was also home to several textile mills, and the Bennettsville Cotton Mill was one of the largest in the state.
Geography
Bennettsville is located at 34°39'25" North, 79°41'17" West (34.656944, -79.688056). According to the United States Census Bureau, the city has a total area of 8.2 square miles (21.2 km2), of which 8.1 square miles (21.0 km2) is land and 0.1 square miles (0.2 km2) is water.
Economy
Bennettsville is a small city with a diverse economy. The city is home to several manufacturing companies, including a paper mill, a plastics plant, and a furniture factory. The city is also home to several retail stores, restaurants, and other businesses. The city is also home to several medical facilities, including a hospital and several clinics.
Demographics
As of the 2010 census, there were 8,425 people, 3,521 households, and 2,092 families residing in the city. The population density was 1,037.2 people per square mile (400.3/km2). There were 3,945 housing units at an average density of 487.2 per square mile (188.2/km2). The racial makeup of the city was 54.2% White, 40.3% African American, 0.3% Native American, 0.7% Asian, 0.1% Pacific Islander, 3.2% from other races, and 1.4% from two or more races. Hispanic or Latino of any race were 5.2% of the population.
There were 3,521 households, out of which 28.2% had children under the age of 18 living with them, 34.2% were married couples living together, 22.2% had a female householder with no husband present, and 38.7% were non-families. 33.2% of all households were made up of individuals, and 14.2% had someone living alone who was 65 years of age or older. The average household size was 2.37 and the average family size was 2.99.
In the city, the population was spread out, with 25.2% under the age of 18, 8.3% from 18 to 24, 25.7% from 25 to 44, 22.7% from 45 to 64, and 18.1% who were 65 years of age or older. The median age was 38 years. For every 100 females, there were 86.2 males. For every 100 females age 18 and over, there were 81.2 males.
The median income for a household in the city was $25,945, and the median income for a family was $32,813. Males had a median income of $27,917 versus $20,972 for females. The per capita income for the city was $14,945. About 19.2% of families and 22.7% of the population were below the poverty line, including 33.2% of those under age 18 and 17.2% of those age 65 or over.
Common Questions
What is Per Capita Income in Bennettsville?
Per Capita income in Bennettsville is $21,151.
What is the Median Family Income in Bennettsville?
Median Family Income in Bennettsville is $43,000.
What is the Median Household income in Bennettsville?
Median Household Income in Bennettsville is $37,891.
What is Income or Wage Gap in Bennettsville?
Income or Wage Gap in Bennettsville is 31.6%.
Women in Bennettsville earn 68.4 cents for every dollar earned by a man.
What is Family Income Deficit in Bennettsville?
Family Income Deficit in Bennettsville is $11,953.
Families that are below poverty line in Bennettsville earn $11,953 less on average than the poverty threshold level.
What is Inequality or Gini Index in Bennettsville?
Inequality or Gini Index in Bennettsville is 0.49.
What is the Total Population of Bennettsville?
Total Population of Bennettsville is 6,975.
What is the Total Male Population of Bennettsville?
Total Male Population of Bennettsville is 3,331.
What is the Total Female Population of Bennettsville?
Total Female Population of Bennettsville is 3,644.
What is the Ratio of Males per 100 Females in Bennettsville?
There are 91.41 Males per 100 Females in Bennettsville.
What is the Ratio of Females per 100 Males in Bennettsville?
There are 109.40 Females per 100 Males in Bennettsville.
What is the Median Population Age in Bennettsville?
Median Population Age in Bennettsville is 40.5 Years.
What is the Average Family Size in Bennettsville
Average Family Size in Bennettsville is 3.3 People.
What is the Average Household Size in Bennettsville
Average Household Size in Bennettsville is 2.3 People.
How Large is the Labor Force in Bennettsville?
There are 2,728 People in the Labor Forcein in Bennettsville.
What is the Percentage of People in the Labor Force in Bennettsville?
48.0% of People are in the Labor Force in Bennettsville.
What is the Unemployment Rate in Bennettsville?
Unemployment Rate in Bennettsville is 6.5%.