Buffalo, SC Map & Demographics
Buffalo Map
Buffalo Overview
$16,077
PER CAPITA INCOME
$19,770
AVG HOUSEHOLD INCOME
0.49
INEQUALITY / GINI INDEX
1,159
TOTAL POPULATION
608
MALE POPULATION
551
FEMALE POPULATION
110.34
MALES / 100 FEMALES
90.62
FEMALES / 100 MALES
29.9
MEDIAN AGE
3.6
AVG FAMILY SIZE
2.4
AVG HOUSEHOLD SIZE
438
LABOR FORCE [ PEOPLE ]
56.0%
PERCENT IN LABOR FORCE
10.7%
UNEMPLOYMENT RATE
Buffalo Zip Codes
Buffalo Area Codes
Income in Buffalo
Income Overview in Buffalo
| Characteristic | Number | Measure |
| Per Capita Income | 1,159 | $16,077 |
| Median Family Income | 254 | $0 |
| Mean Family Income | 254 | $46,819 |
| Median Household Income | 484 | $19,770 |
| Mean Household Income | 484 | $38,920 |
| Income Deficit | 254 | $0 |
| Wage / Income Gap (%) | 1,159 | 0.00% |
| Wage / Income Gap ($) | 1,159 | 100.00¢ per $1 |
| Gini / Inequality Index | 1,159 | 0.49 |
Earnings by Sex in Buffalo
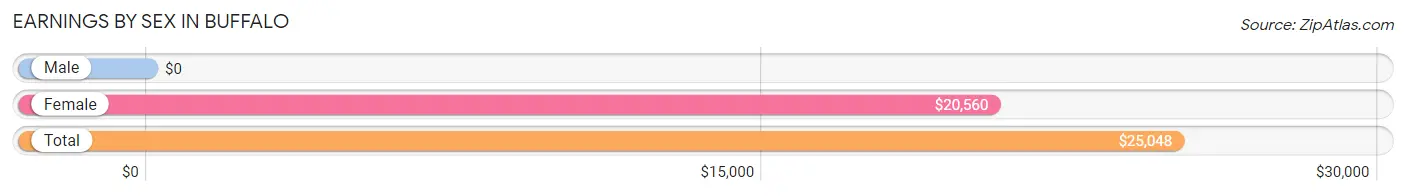
| Sex | Number | Average Earnings |
| Male | 144 (34.7%) | $0 |
| Female | 271 (65.3%) | $20,560 |
| Total | 415 (100.0%) | $25,048 |
Earnings by Sex by Income Bracket in Buffalo
The most common earnings brackets in Buffalo are $25,000 to $29,999 for men (30 | 20.8%) and $30,000 to $34,999 for women (65 | 24.0%).
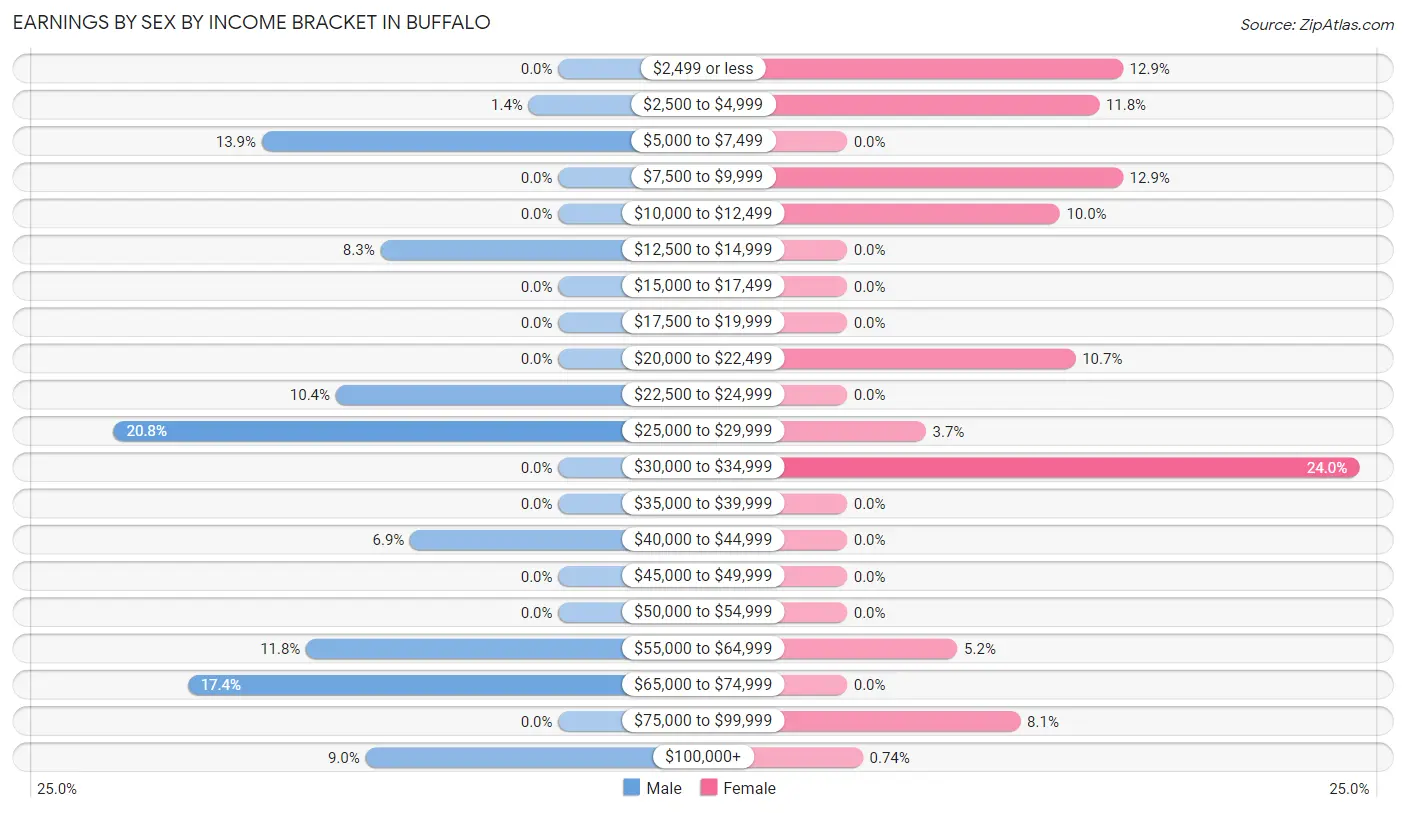
| Income | Male | Female |
| $2,499 or less | 0 (0.0%) | 35 (12.9%) |
| $2,500 to $4,999 | 2 (1.4%) | 32 (11.8%) |
| $5,000 to $7,499 | 20 (13.9%) | 0 (0.0%) |
| $7,500 to $9,999 | 0 (0.0%) | 35 (12.9%) |
| $10,000 to $12,499 | 0 (0.0%) | 27 (10.0%) |
| $12,500 to $14,999 | 12 (8.3%) | 0 (0.0%) |
| $15,000 to $17,499 | 0 (0.0%) | 0 (0.0%) |
| $17,500 to $19,999 | 0 (0.0%) | 0 (0.0%) |
| $20,000 to $22,499 | 0 (0.0%) | 29 (10.7%) |
| $22,500 to $24,999 | 15 (10.4%) | 0 (0.0%) |
| $25,000 to $29,999 | 30 (20.8%) | 10 (3.7%) |
| $30,000 to $34,999 | 0 (0.0%) | 65 (24.0%) |
| $35,000 to $39,999 | 0 (0.0%) | 0 (0.0%) |
| $40,000 to $44,999 | 10 (6.9%) | 0 (0.0%) |
| $45,000 to $49,999 | 0 (0.0%) | 0 (0.0%) |
| $50,000 to $54,999 | 0 (0.0%) | 0 (0.0%) |
| $55,000 to $64,999 | 17 (11.8%) | 14 (5.2%) |
| $65,000 to $74,999 | 25 (17.4%) | 0 (0.0%) |
| $75,000 to $99,999 | 0 (0.0%) | 22 (8.1%) |
| $100,000+ | 13 (9.0%) | 2 (0.7%) |
| Total | 144 (100.0%) | 271 (100.0%) |
Earnings by Sex by Educational Attainment in Buffalo
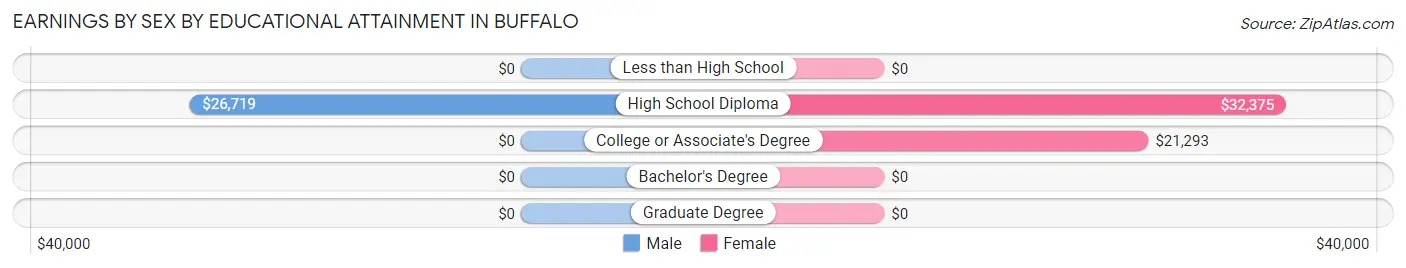
| Educational Attainment | Male Income | Female Income |
| Less than High School | - | - |
| High School Diploma | $26,719 | $32,375 |
| College or Associate's Degree | - | - |
| Bachelor's Degree | - | - |
| Graduate Degree | - | - |
| Total | - | - |
Family Income in Buffalo
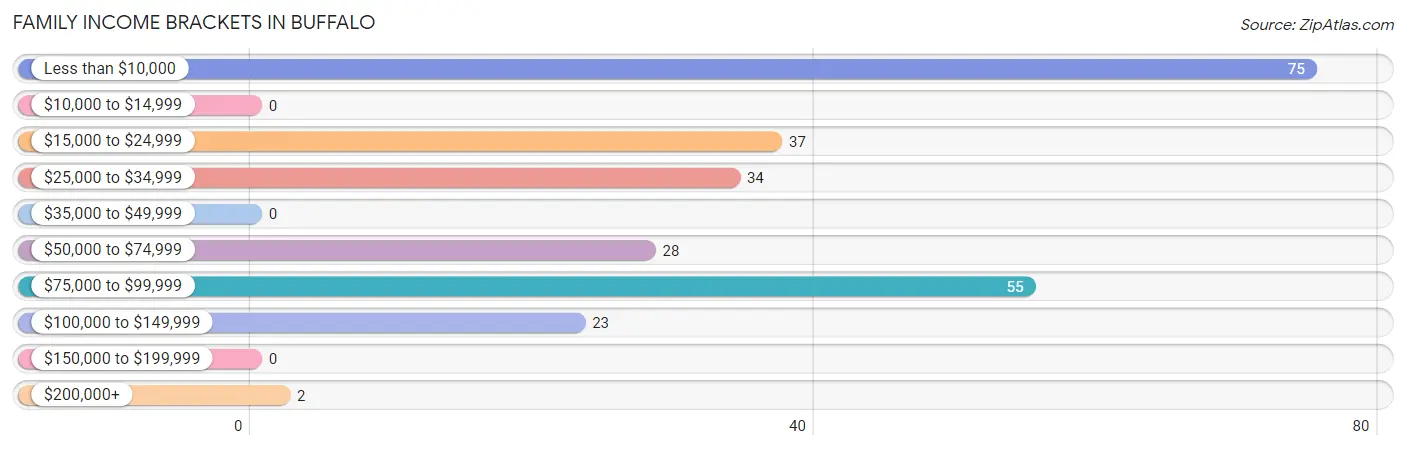
Family Income Brackets in Buffalo
According to the Buffalo family income data, there are 75 families falling into the less than $10,000 income range, which is the most common income bracket and makes up 29.5% of all families.
| Income Bracket | # Families | % Families |
| Less than $10,000 | 75 | 29.5% |
| $10,000 to $14,999 | 0 | 0.0% |
| $15,000 to $24,999 | 37 | 14.6% |
| $25,000 to $34,999 | 34 | 13.4% |
| $35,000 to $49,999 | 0 | 0.0% |
| $50,000 to $74,999 | 28 | 11.0% |
| $75,000 to $99,999 | 55 | 21.7% |
| $100,000 to $149,999 | 23 | 9.1% |
| $150,000 to $199,999 | 0 | 0.0% |
| $200,000+ | 2 | 0.8% |
Family Income by Famaliy Size in Buffalo
| Income Bracket | # Families | Median Income |
| 2-Person Families | 69 (27.2%) | $0 |
| 3-Person Families | 88 (34.6%) | $0 |
| 4-Person Families | 48 (18.9%) | $0 |
| 5-Person Families | 23 (9.1%) | $0 |
| 6-Person Families | 0 (0.0%) | $0 |
| 7+ Person Families | 26 (10.2%) | $0 |
| Total | 254 (100.0%) | $0 |
Family Income by Number of Earners in Buffalo
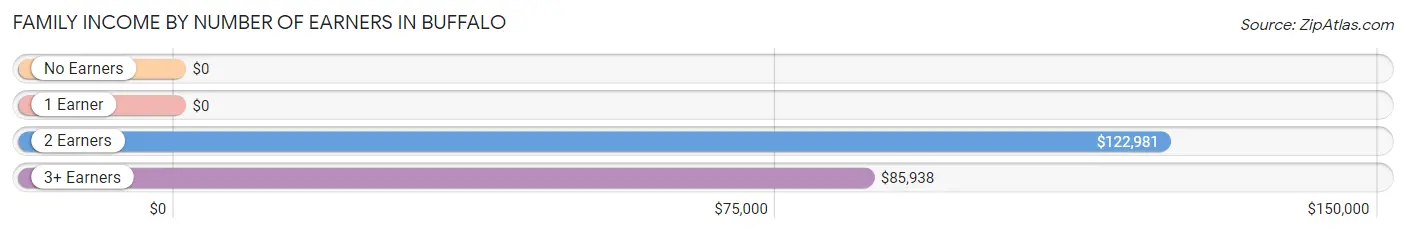
| Number of Earners | # Families | Median Income |
| No Earners | 17 (6.7%) | $0 |
| 1 Earner | 172 (67.7%) | $0 |
| 2 Earners | 25 (9.8%) | $122,981 |
| 3+ Earners | 40 (15.8%) | $85,938 |
| Total | 254 (100.0%) | $0 |
Household Income in Buffalo
Household Income Brackets in Buffalo
With 178 households falling in the category, the $15,000 to $24,999 income range is the most frequent in Buffalo, accounting for 36.8% of all households.
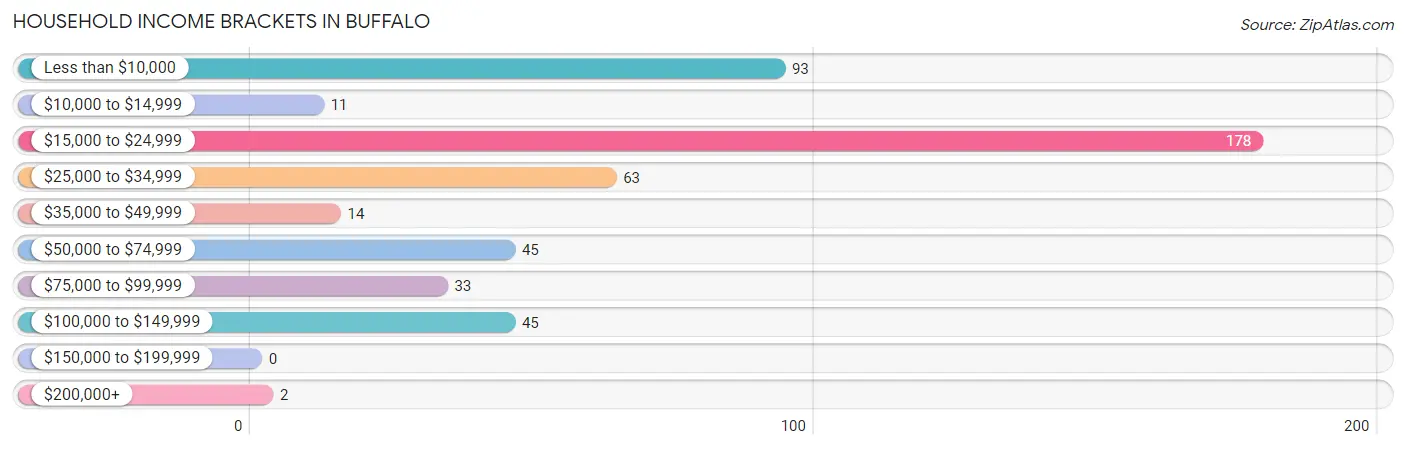
| Income Bracket | # Households | % Households |
| Less than $10,000 | 93 | 19.2% |
| $10,000 to $14,999 | 11 | 2.3% |
| $15,000 to $24,999 | 178 | 36.8% |
| $25,000 to $34,999 | 63 | 13.0% |
| $35,000 to $49,999 | 14 | 2.9% |
| $50,000 to $74,999 | 45 | 9.3% |
| $75,000 to $99,999 | 33 | 6.8% |
| $100,000 to $149,999 | 45 | 9.3% |
| $150,000 to $199,999 | 0 | 0.0% |
| $200,000+ | 2 | 0.4% |
Household Income by Householder Age in Buffalo
The median household income in Buffalo is $19,770, with the highest median household income of $38,214 found in the 65+ years age bracket for the primary householder. A total of 38 households (7.9%) fall into this category.
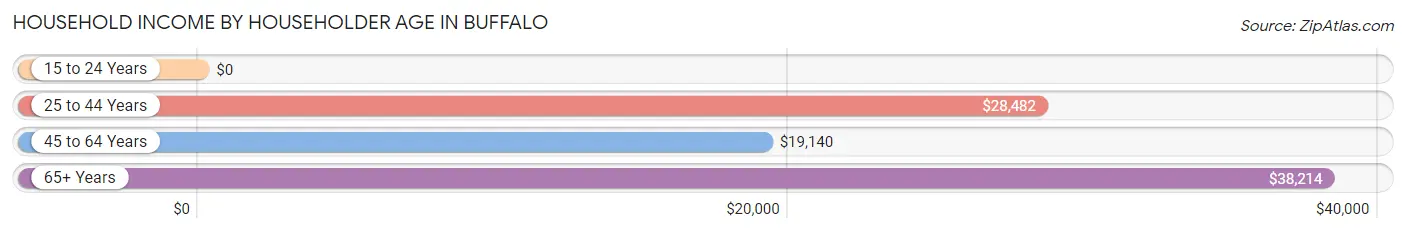
| Income Bracket | # Households | Median Income |
| 15 to 24 Years | 0 (0.0%) | $0 |
| 25 to 44 Years | 167 (34.5%) | $28,482 |
| 45 to 64 Years | 279 (57.6%) | $19,140 |
| 65+ Years | 38 (7.9%) | $38,214 |
| Total | 484 (100.0%) | $19,770 |
Poverty in Buffalo
Income Below Poverty by Sex and Age in Buffalo
With 31.4% poverty level for males and 45.2% for females among the residents of Buffalo, 5 year old males and under 5 year old females are the most vulnerable to poverty, with 23 males (100.0%) and 64 females (81.0%) in their respective age groups living below the poverty level.
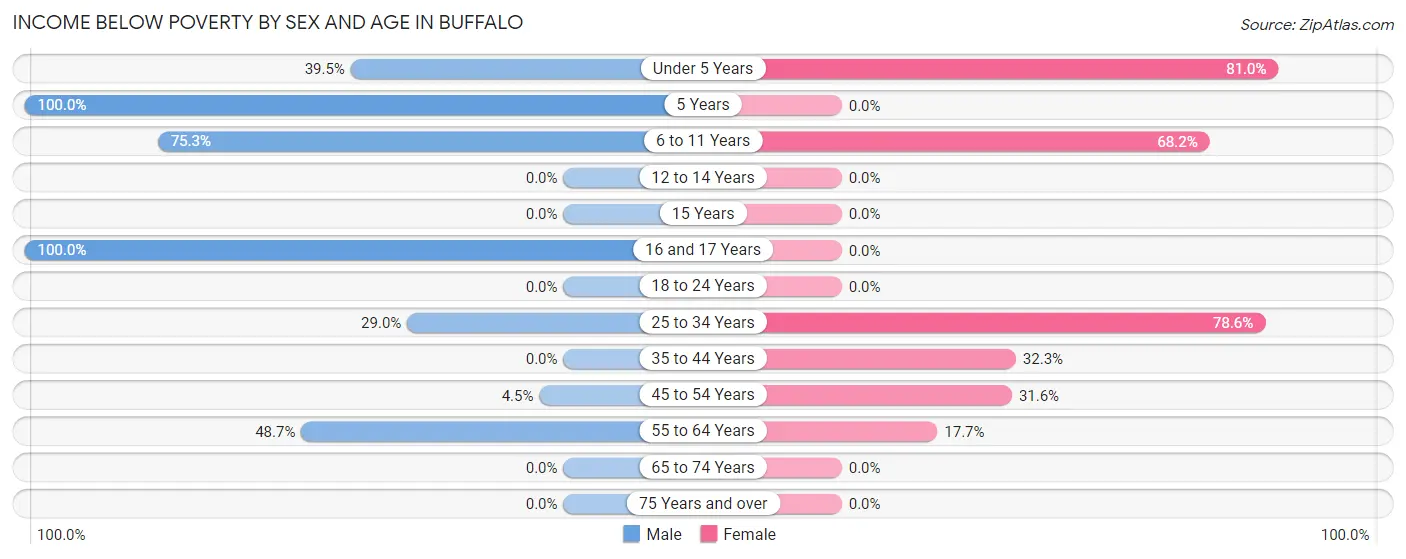
| Age Bracket | Male | Female |
| Under 5 Years | 30 (39.5%) | 64 (81.0%) |
| 5 Years | 23 (100.0%) | 0 (0.0%) |
| 6 to 11 Years | 64 (75.3%) | 58 (68.2%) |
| 12 to 14 Years | 0 (0.0%) | 0 (0.0%) |
| 15 Years | 0 (0.0%) | 0 (0.0%) |
| 16 and 17 Years | 27 (100.0%) | 0 (0.0%) |
| 18 to 24 Years | 0 (0.0%) | 0 (0.0%) |
| 25 to 34 Years | 20 (29.0%) | 66 (78.6%) |
| 35 to 44 Years | 0 (0.0%) | 32 (32.3%) |
| 45 to 54 Years | 9 (4.5%) | 18 (31.6%) |
| 55 to 64 Years | 18 (48.6%) | 11 (17.7%) |
| 65 to 74 Years | 0 (0.0%) | 0 (0.0%) |
| 75 Years and over | 0 (0.0%) | 0 (0.0%) |
| Total | 191 (31.4%) | 249 (45.2%) |
Income Above Poverty by Sex and Age in Buffalo
According to the poverty statistics in Buffalo, males aged 15 years and females aged 15 years are the age groups that are most secure financially, with 100.0% of males and 100.0% of females in these age groups living above the poverty line.
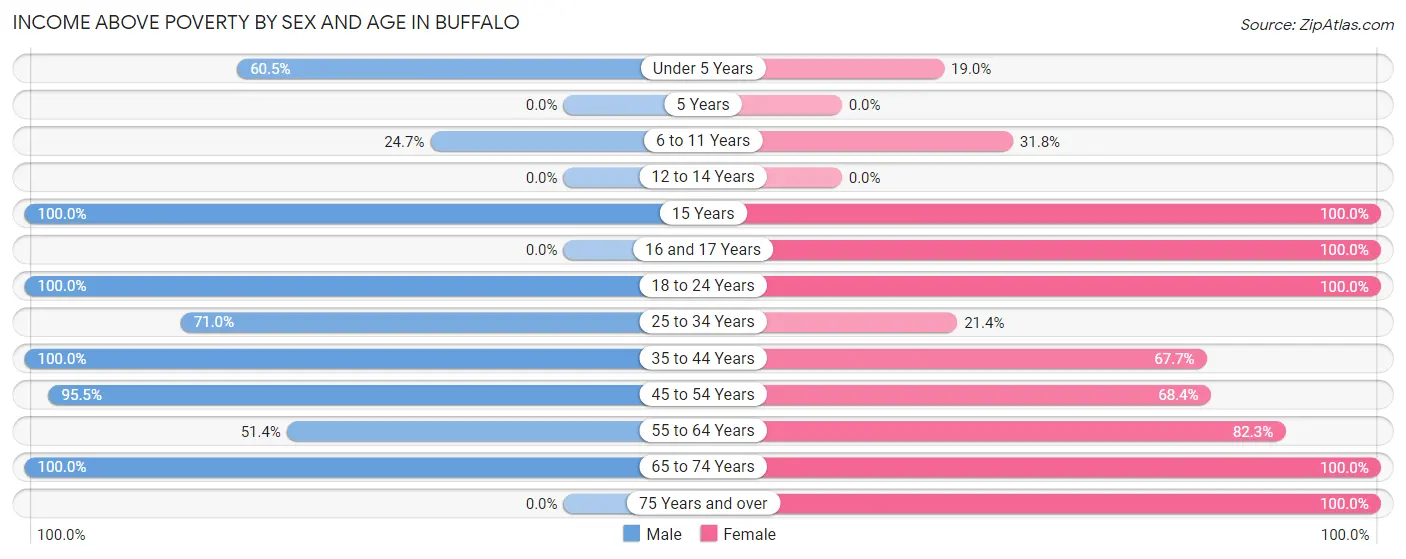
| Age Bracket | Male | Female |
| Under 5 Years | 46 (60.5%) | 15 (19.0%) |
| 5 Years | 0 (0.0%) | 0 (0.0%) |
| 6 to 11 Years | 21 (24.7%) | 27 (31.8%) |
| 12 to 14 Years | 0 (0.0%) | 0 (0.0%) |
| 15 Years | 11 (100.0%) | 18 (100.0%) |
| 16 and 17 Years | 0 (0.0%) | 13 (100.0%) |
| 18 to 24 Years | 12 (100.0%) | 32 (100.0%) |
| 25 to 34 Years | 49 (71.0%) | 18 (21.4%) |
| 35 to 44 Years | 41 (100.0%) | 67 (67.7%) |
| 45 to 54 Years | 193 (95.5%) | 39 (68.4%) |
| 55 to 64 Years | 19 (51.3%) | 51 (82.3%) |
| 65 to 74 Years | 25 (100.0%) | 8 (100.0%) |
| 75 Years and over | 0 (0.0%) | 14 (100.0%) |
| Total | 417 (68.6%) | 302 (54.8%) |
Income Below Poverty Among Married-Couple Families in Buffalo
The poverty statistics for married-couple families in Buffalo show that 10.7% or 10 of the total 93 families live below the poverty line. Families with no children have the highest poverty rate of 31.2%, comprising of 10 families. On the other hand, families with 1 or 2 children have the lowest poverty rate of 0.0%, which includes 0 families.
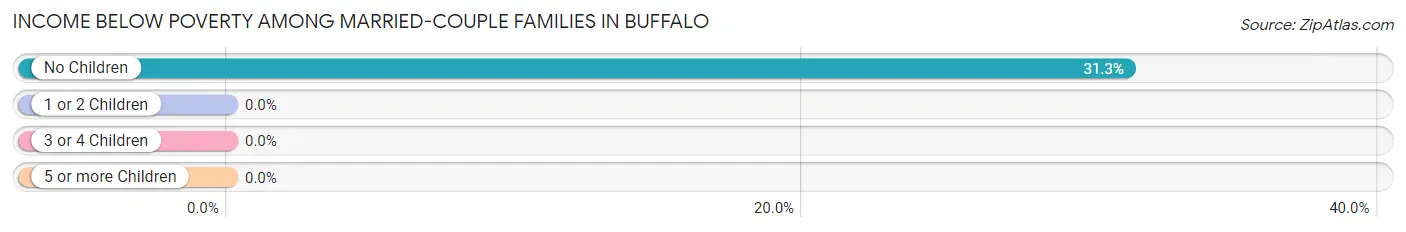
| Children | Above Poverty | Below Poverty |
| No Children | 22 (68.8%) | 10 (31.2%) |
| 1 or 2 Children | 45 (100.0%) | 0 (0.0%) |
| 3 or 4 Children | 0 (0.0%) | 0 (0.0%) |
| 5 or more Children | 16 (100.0%) | 0 (0.0%) |
| Total | 83 (89.2%) | 10 (10.7%) |
Income Below Poverty Among Single-Parent Households in Buffalo
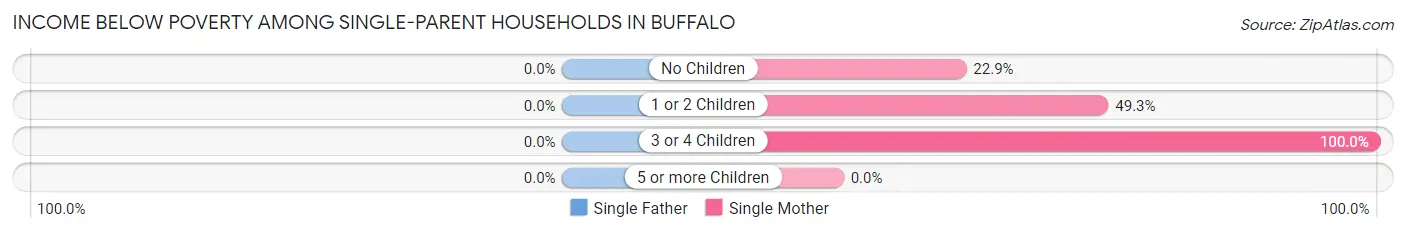
| Children | Single Father | Single Mother |
| No Children | 0 (0.0%) | 8 (22.9%) |
| 1 or 2 Children | 0 (0.0%) | 35 (49.3%) |
| 3 or 4 Children | 0 (0.0%) | 55 (100.0%) |
| 5 or more Children | 0 (0.0%) | 0 (0.0%) |
| Total | 0 (0.0%) | 98 (60.9%) |
Income Below Poverty Among Married-Couple vs Single-Parent Households in Buffalo
The poverty data for Buffalo shows that 10 of the married-couple family households (10.7%) and 98 of the single-parent households (60.9%) are living below the poverty level. Within the married-couple family households, those with no children have the highest poverty rate, with 10 households (31.2%) falling below the poverty line. Among the single-parent households, those with 3 or 4 children have the highest poverty rate, with 55 household (100.0%) living below poverty.
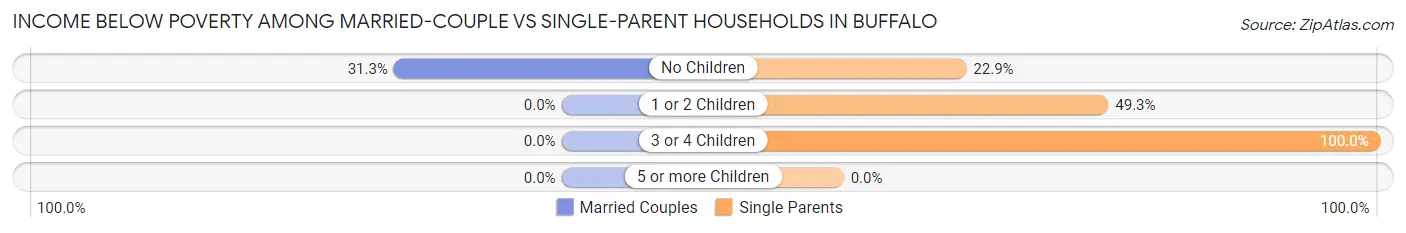
| Children | Married-Couple Families | Single-Parent Households |
| No Children | 10 (31.2%) | 8 (22.9%) |
| 1 or 2 Children | 0 (0.0%) | 35 (49.3%) |
| 3 or 4 Children | 0 (0.0%) | 55 (100.0%) |
| 5 or more Children | 0 (0.0%) | 0 (0.0%) |
| Total | 10 (10.7%) | 98 (60.9%) |
Race in Buffalo
The most populous races in Buffalo are White / Caucasian (1,108 | 95.6%), and Black / African American (51 | 4.4%).
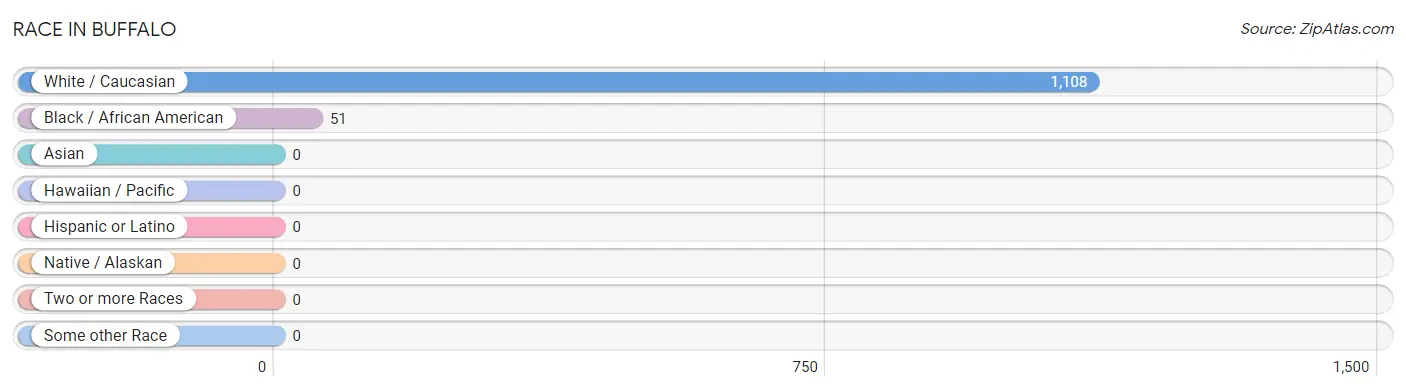
| Race | # Population | % Population |
| Asian | 0 | 0.0% |
| Black / African American | 51 | 4.4% |
| Hawaiian / Pacific | 0 | 0.0% |
| Hispanic or Latino | 0 | 0.0% |
| Native / Alaskan | 0 | 0.0% |
| White / Caucasian | 1,108 | 95.6% |
| Two or more Races | 0 | 0.0% |
| Some other Race | 0 | 0.0% |
| Total | 1,159 | 100.0% |
Ancestry in Buffalo
The most populous ancestries reported in Buffalo are American (441 | 38.1%), German (106 | 9.1%), Irish (58 | 5.0%), English (18 | 1.5%), and European (7 | 0.6%), together accounting for 54.3% of all Buffalo residents.
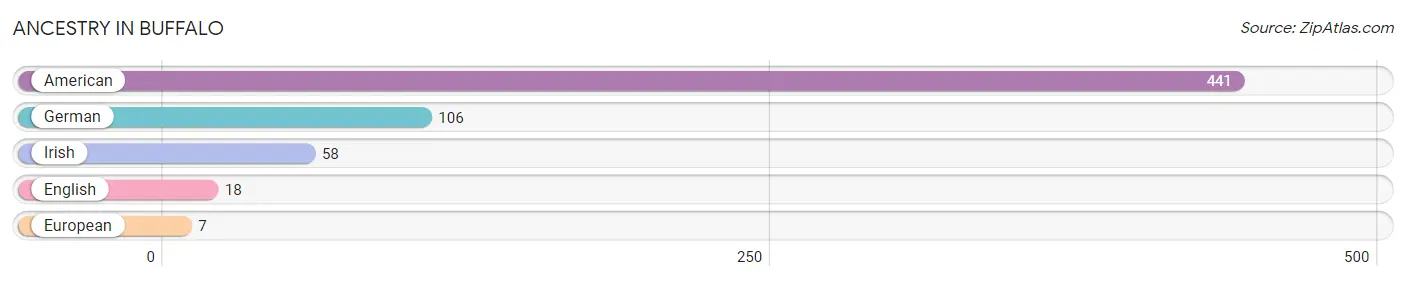
| Ancestry | # Population | % Population |
| American | 441 | 38.1% |
| English | 18 | 1.5% |
| European | 7 | 0.6% |
| German | 106 | 9.1% |
| Irish | 58 | 5.0% | View All 5 Rows |
Immigrants in Buffalo

| Immigration Origin | # Population | % Population | View All 0 Rows |
Sex and Age in Buffalo
Sex and Age in Buffalo
The most populous age groups in Buffalo are 50 to 54 Years (202 | 33.2%) for men and Under 5 Years (79 | 14.3%) for women.
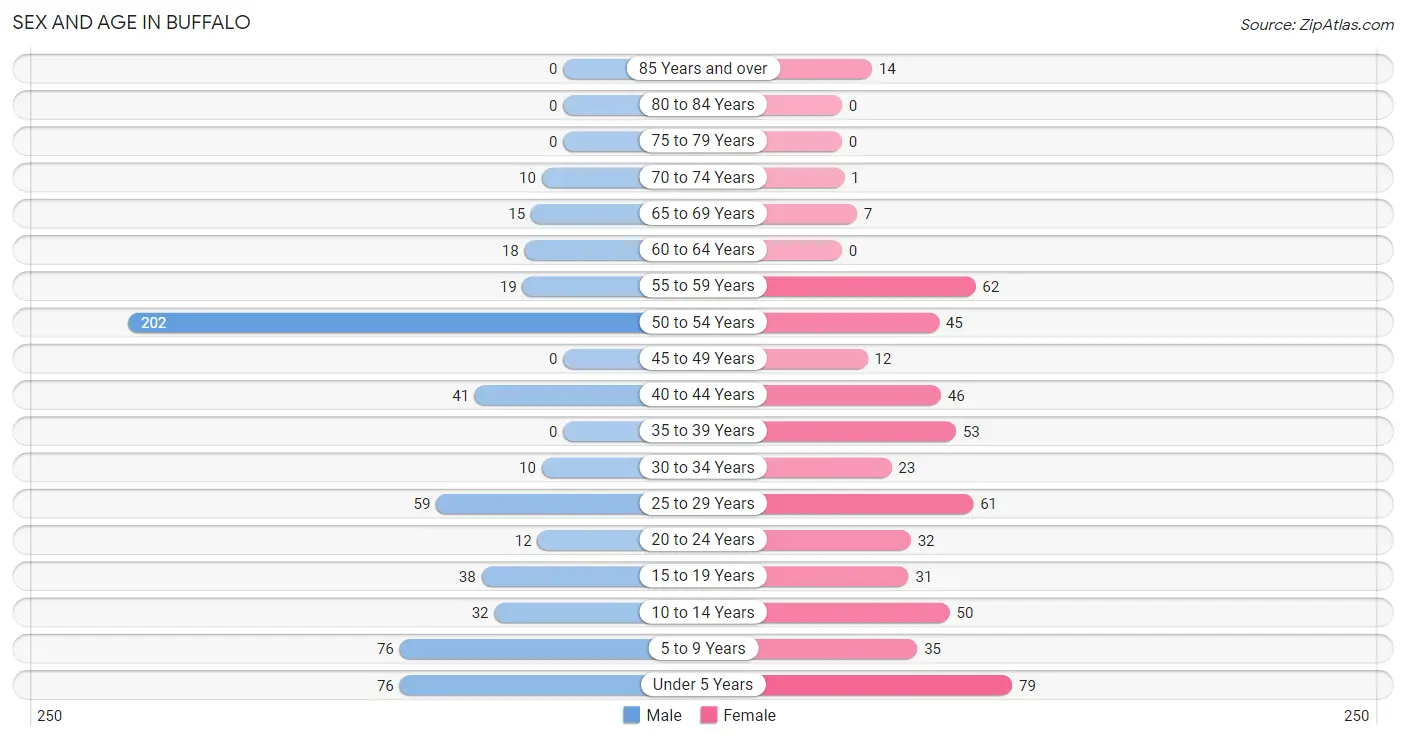
| Age Bracket | Male | Female |
| Under 5 Years | 76 (12.5%) | 79 (14.3%) |
| 5 to 9 Years | 76 (12.5%) | 35 (6.4%) |
| 10 to 14 Years | 32 (5.3%) | 50 (9.1%) |
| 15 to 19 Years | 38 (6.2%) | 31 (5.6%) |
| 20 to 24 Years | 12 (2.0%) | 32 (5.8%) |
| 25 to 29 Years | 59 (9.7%) | 61 (11.1%) |
| 30 to 34 Years | 10 (1.6%) | 23 (4.2%) |
| 35 to 39 Years | 0 (0.0%) | 53 (9.6%) |
| 40 to 44 Years | 41 (6.7%) | 46 (8.4%) |
| 45 to 49 Years | 0 (0.0%) | 12 (2.2%) |
| 50 to 54 Years | 202 (33.2%) | 45 (8.2%) |
| 55 to 59 Years | 19 (3.1%) | 62 (11.3%) |
| 60 to 64 Years | 18 (3.0%) | 0 (0.0%) |
| 65 to 69 Years | 15 (2.5%) | 7 (1.3%) |
| 70 to 74 Years | 10 (1.6%) | 1 (0.2%) |
| 75 to 79 Years | 0 (0.0%) | 0 (0.0%) |
| 80 to 84 Years | 0 (0.0%) | 0 (0.0%) |
| 85 Years and over | 0 (0.0%) | 14 (2.5%) |
| Total | 608 (100.0%) | 551 (100.0%) |
Families and Households in Buffalo
Median Family Size in Buffalo
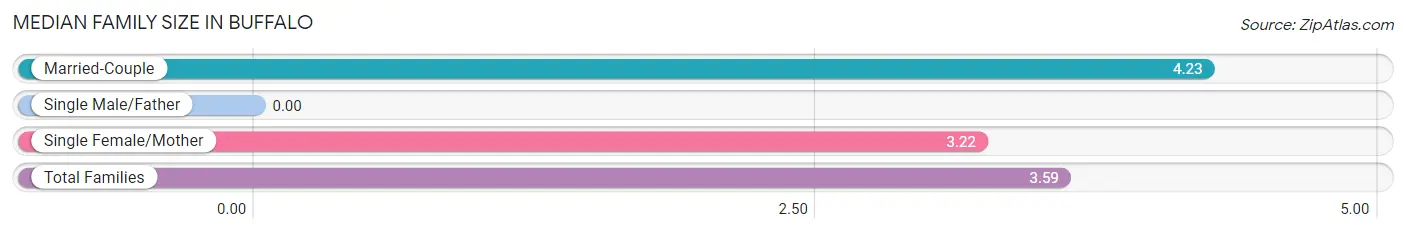
| Family Type | # Families | Family Size |
| Married-Couple | 93 (36.6%) | 4.23 |
| Single Male/Father | 0 (0.0%) | - |
| Single Female/Mother | 161 (63.4%) | 3.22 |
| Total Families | 254 (100.0%) | 3.59 |
Median Household Size in Buffalo
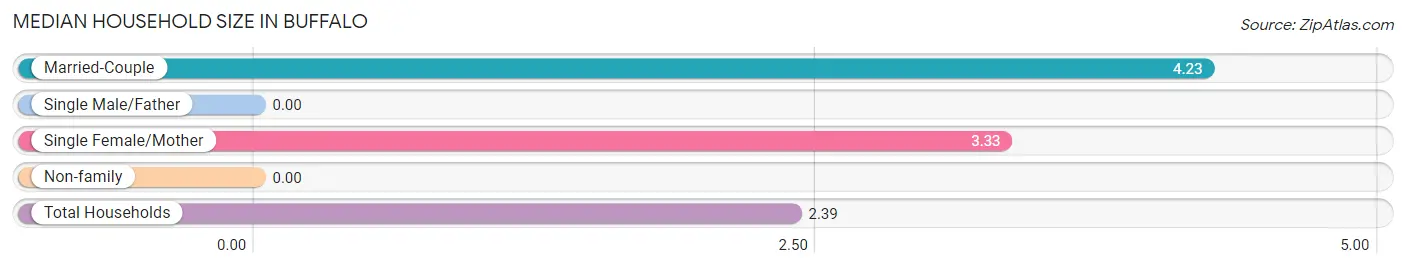
| Household Type | # Households | Household Size |
| Married-Couple | 93 (19.2%) | 4.23 |
| Single Male/Father | 0 (0.0%) | - |
| Single Female/Mother | 161 (33.3%) | 3.33 |
| Non-family | 230 (47.5%) | - |
| Total Households | 484 (100.0%) | 2.39 |
Household Size by Marriage Status in Buffalo
Out of a total of 484 households in Buffalo, 254 (52.5%) are family households, while 230 (47.5%) are nonfamily households. The most numerous type of family households are 4-person households, comprising 70, and the most common type of nonfamily households are 1-person households, comprising 230.
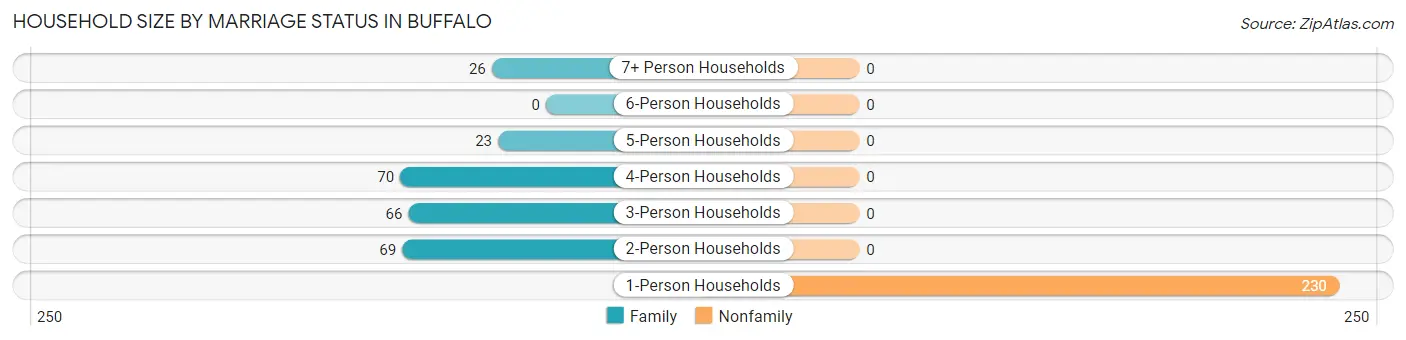
| Household Size | Family Households | Nonfamily Households |
| 1-Person Households | - | 230 (47.5%) |
| 2-Person Households | 69 (14.3%) | 0 (0.0%) |
| 3-Person Households | 66 (13.6%) | 0 (0.0%) |
| 4-Person Households | 70 (14.5%) | 0 (0.0%) |
| 5-Person Households | 23 (4.8%) | 0 (0.0%) |
| 6-Person Households | 0 (0.0%) | 0 (0.0%) |
| 7+ Person Households | 26 (5.4%) | 0 (0.0%) |
| Total | 254 (52.5%) | 230 (47.5%) |
Female Fertility in Buffalo
Fertility by Age in Buffalo
Average fertility rate in Buffalo is 178.0 births per 1,000 women. Women in the age bracket of 20 to 34 years have the highest fertility rate with 302.0 births per 1,000 women. Women in the age bracket of 20 to 34 years acount for 76.1% of all women with births.
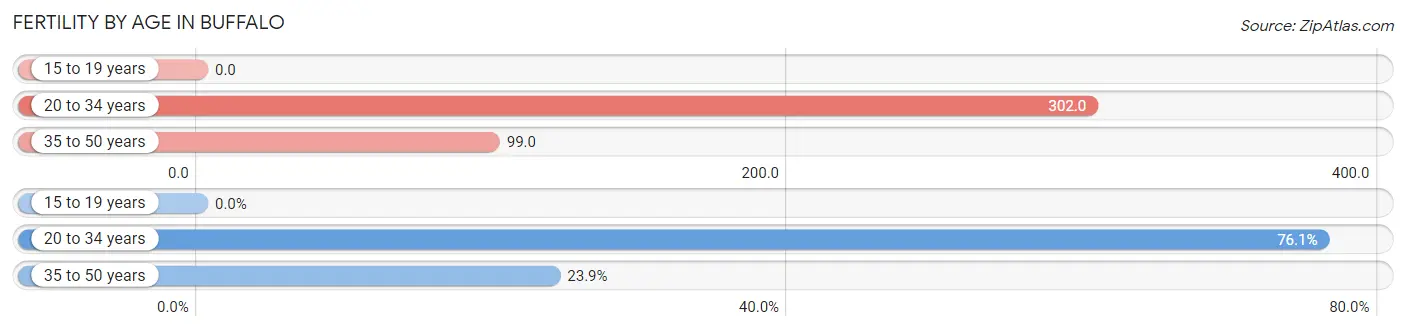
| Age Bracket | Women with Births | Births / 1,000 Women |
| 15 to 19 years | 0 (0.0%) | 0.0 |
| 20 to 34 years | 35 (76.1%) | 302.0 |
| 35 to 50 years | 11 (23.9%) | 99.0 |
| Total | 46 (100.0%) | 178.0 |
Fertility by Age by Marriage Status in Buffalo
23.9% of women with births (46) in Buffalo are married. The highest percentage of unmarried women with births falls into 20 to 34 years age bracket with 100.0% of them unmarried at the time of birth, while the lowest percentage of unmarried women with births belong to 35 to 50 years age bracket with 0.0% of them unmarried.
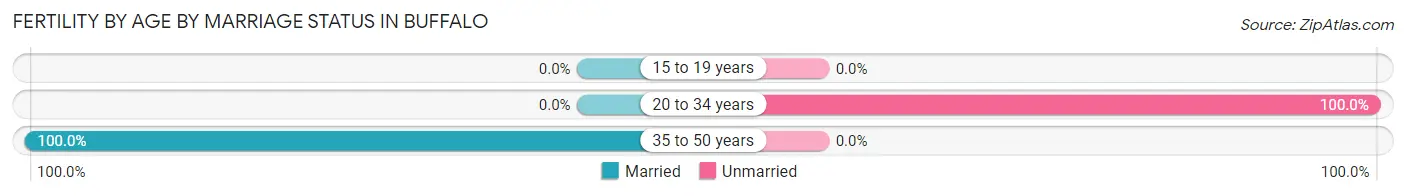
| Age Bracket | Married | Unmarried |
| 15 to 19 years | 0 (0.0%) | 0 (0.0%) |
| 20 to 34 years | 0 (0.0%) | 35 (100.0%) |
| 35 to 50 years | 11 (100.0%) | 0 (0.0%) |
| Total | 11 (23.9%) | 35 (76.1%) |
Fertility by Education in Buffalo
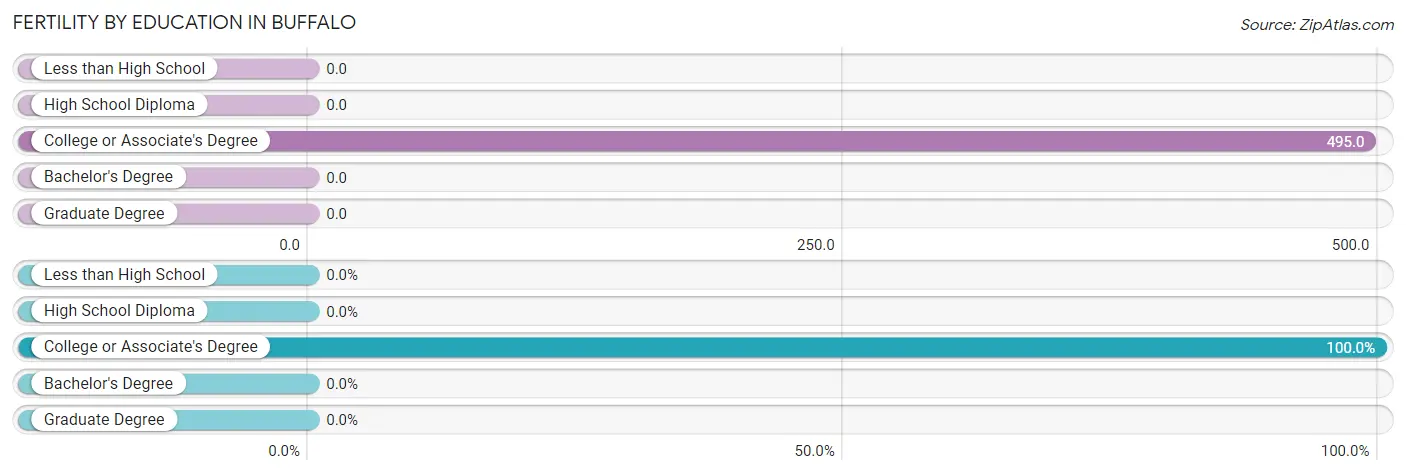
| Educational Attainment | Women with Births | Births / 1,000 Women |
| Less than High School | 0 (0.0%) | 0.0 |
| High School Diploma | 0 (0.0%) | 0.0 |
| College or Associate's Degree | 46 (100.0%) | 495.0 |
| Bachelor's Degree | 0 (0.0%) | 0.0 |
| Graduate Degree | 0 (0.0%) | 0.0 |
| Total | 46 (100.0%) | 178.0 |
Fertility by Education by Marriage Status in Buffalo
76.1% of women with births in Buffalo are unmarried. Women with the educational attainment of college or associate's degree are most likely to be married with 23.9% of them married at childbirth, while women with the educational attainment of college or associate's degree are least likely to be married with 76.1% of them unmarried at childbirth.
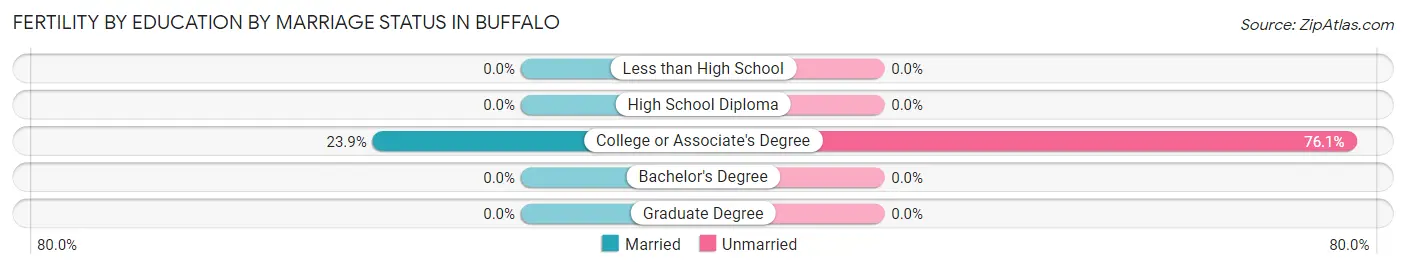
| Educational Attainment | Married | Unmarried |
| Less than High School | 0 (0.0%) | 0 (0.0%) |
| High School Diploma | 0 (0.0%) | 0 (0.0%) |
| College or Associate's Degree | 11 (23.9%) | 35 (76.1%) |
| Bachelor's Degree | 0 (0.0%) | 0 (0.0%) |
| Graduate Degree | 0 (0.0%) | 0 (0.0%) |
| Total | 11 (23.9%) | 35 (76.1%) |
Employment Characteristics in Buffalo
Employment by Class of Employer in Buffalo
Among the 391 employed individuals in Buffalo, private company employees (264 | 67.5%), not-for-profit organizations (39 | 10.0%), and self-employed (not incorporated) (29 | 7.4%) make up the most common classes of employment.
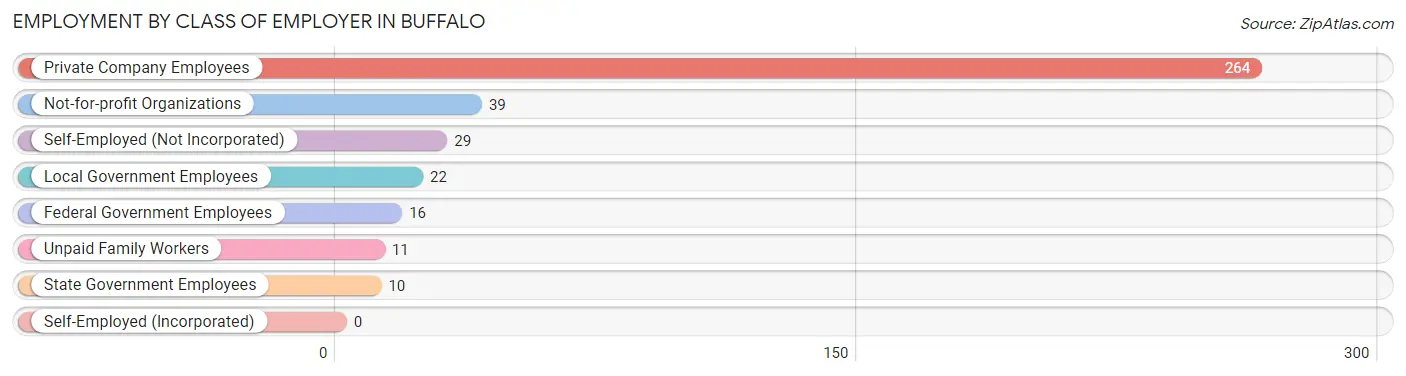
| Employer Class | # Employees | % Employees |
| Private Company Employees | 264 | 67.5% |
| Self-Employed (Incorporated) | 0 | 0.0% |
| Self-Employed (Not Incorporated) | 29 | 7.4% |
| Not-for-profit Organizations | 39 | 10.0% |
| Local Government Employees | 22 | 5.6% |
| State Government Employees | 10 | 2.6% |
| Federal Government Employees | 16 | 4.1% |
| Unpaid Family Workers | 11 | 2.8% |
| Total | 391 | 100.0% |
Employment Status by Age in Buffalo
According to the labor force statistics for Buffalo, out of the total population over 16 years of age (782), 56.0% or 438 individuals are in the labor force, with 10.7% or 47 of them unemployed. The age group with the highest labor force participation rate is 30 to 34 years, with 100.0% or 33 individuals in the labor force. Within the labor force, the 16 to 19 years age range has the highest percentage of unemployed individuals, with 100.0% or 13 of them being unemployed.
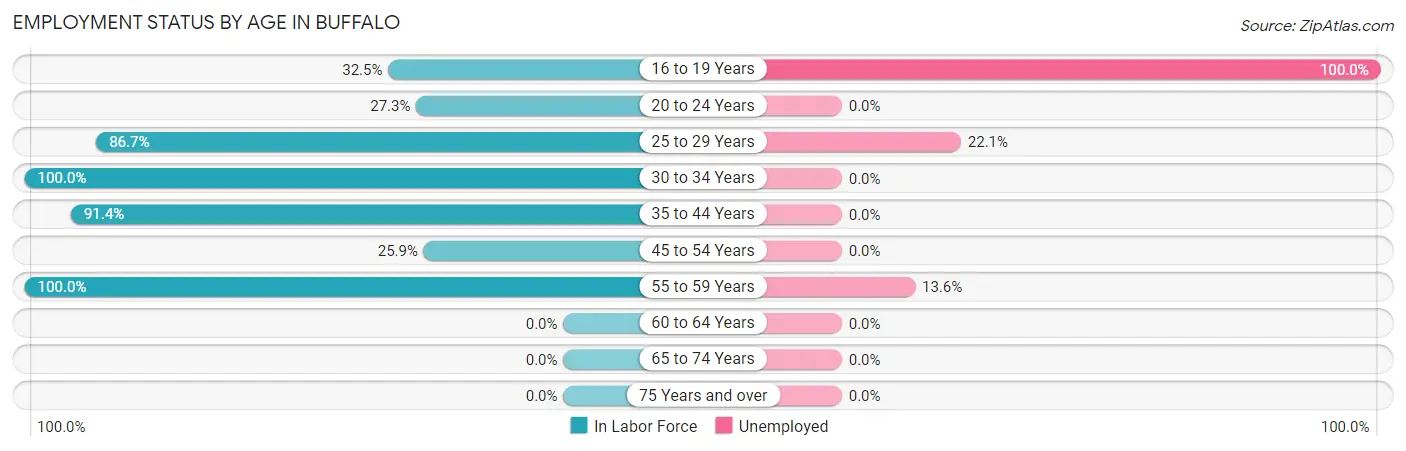
| Age Bracket | In Labor Force | Unemployed |
| 16 to 19 Years | 13 (32.5%) | 13 (100.0%) |
| 20 to 24 Years | 12 (27.3%) | 0 (0.0%) |
| 25 to 29 Years | 104 (86.7%) | 23 (22.1%) |
| 30 to 34 Years | 33 (100.0%) | 0 (0.0%) |
| 35 to 44 Years | 128 (91.4%) | 0 (0.0%) |
| 45 to 54 Years | 67 (25.9%) | 0 (0.0%) |
| 55 to 59 Years | 81 (100.0%) | 11 (13.6%) |
| 60 to 64 Years | 0 (0.0%) | 0 (0.0%) |
| 65 to 74 Years | 0 (0.0%) | 0 (0.0%) |
| 75 Years and over | 0 (0.0%) | 0 (0.0%) |
| Total | 438 (56.0%) | 47 (10.7%) |
Employment Status by Educational Attainment in Buffalo
According to labor force statistics for Buffalo, 63.4% of individuals (413) out of the total population between 25 and 64 years of age (651) are in the labor force, with 8.2% or 34 of them being unemployed. The group with the highest labor force participation rate are those with the educational attainment of bachelor's degree or higher, with 86.0% or 49 individuals in the labor force. Within the labor force, individuals with college / associate degree education have the highest percentage of unemployment, with 13.1% or 23 of them being unemployed.
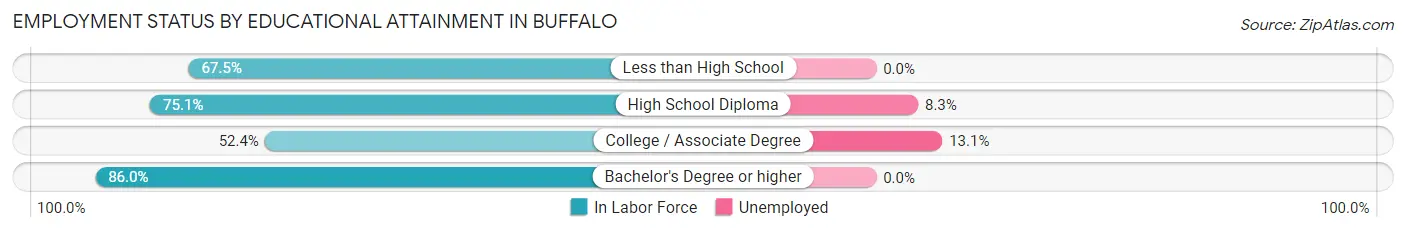
| Educational Attainment | In Labor Force | Unemployed |
| Less than High School | 56 (67.5%) | 0 (0.0%) |
| High School Diploma | 133 (75.1%) | 15 (8.3%) |
| College / Associate Degree | 175 (52.4%) | 44 (13.1%) |
| Bachelor's Degree or higher | 49 (86.0%) | 0 (0.0%) |
| Total | 413 (63.4%) | 53 (8.2%) |
Employment Occupations by Sex in Buffalo
Management, Business, Science and Arts Occupations
The most common Management, Business, Science and Arts occupations in Buffalo are Health Diagnosing & Treating (39 | 10.0%), Business & Financial (35 | 8.9%), Health Technologists (22 | 5.6%), Computers, Engineering & Science (14 | 3.6%), and Computers & Mathematics (14 | 3.6%).
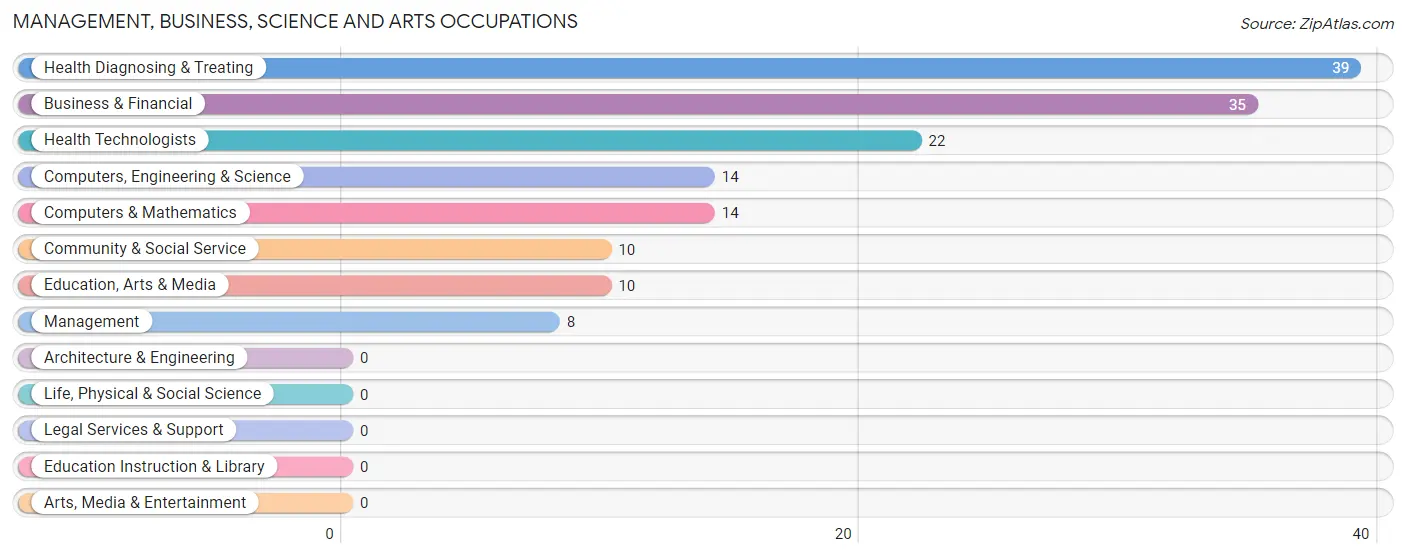
Management, Business, Science and Arts Occupations by Sex
Within the Management, Business, Science and Arts occupations in Buffalo, the most male-oriented occupations are Management (100.0%), and Health Diagnosing & Treating (43.6%), while the most female-oriented occupations are Business & Financial (100.0%), Computers, Engineering & Science (100.0%), and Computers & Mathematics (100.0%).
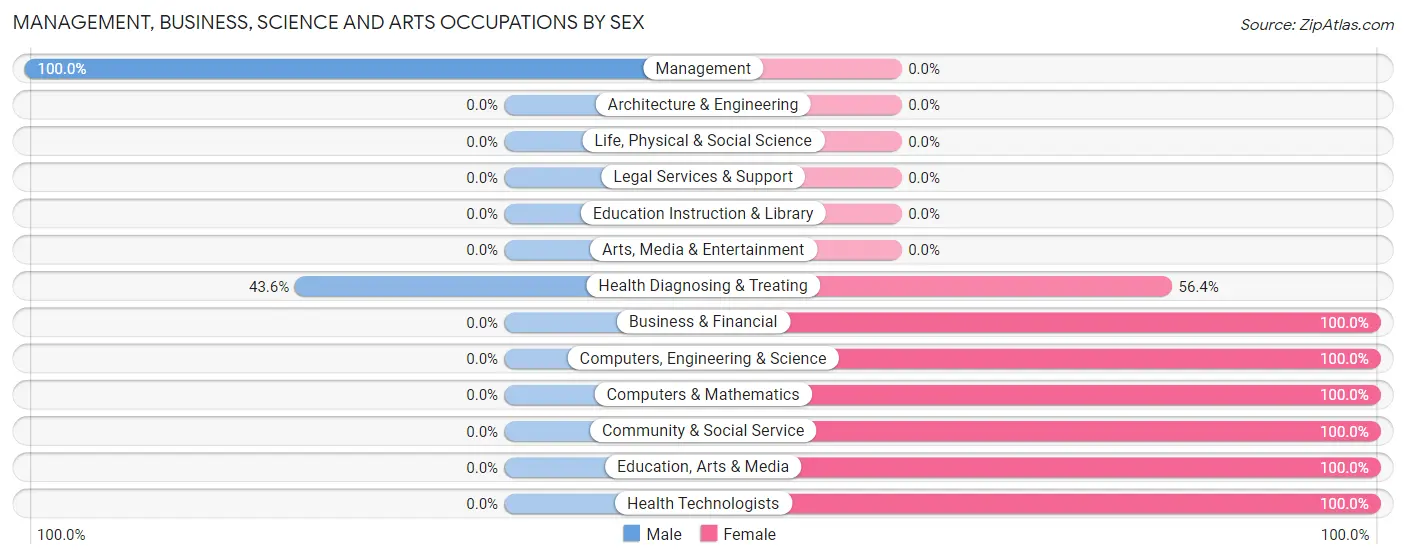
| Occupation | Male | Female |
| Management | 8 (100.0%) | 0 (0.0%) |
| Business & Financial | 0 (0.0%) | 35 (100.0%) |
| Computers, Engineering & Science | 0 (0.0%) | 14 (100.0%) |
| Computers & Mathematics | 0 (0.0%) | 14 (100.0%) |
| Architecture & Engineering | 0 (0.0%) | 0 (0.0%) |
| Life, Physical & Social Science | 0 (0.0%) | 0 (0.0%) |
| Community & Social Service | 0 (0.0%) | 10 (100.0%) |
| Education, Arts & Media | 0 (0.0%) | 10 (100.0%) |
| Legal Services & Support | 0 (0.0%) | 0 (0.0%) |
| Education Instruction & Library | 0 (0.0%) | 0 (0.0%) |
| Arts, Media & Entertainment | 0 (0.0%) | 0 (0.0%) |
| Health Diagnosing & Treating | 17 (43.6%) | 22 (56.4%) |
| Health Technologists | 0 (0.0%) | 22 (100.0%) |
| Total (Category) | 25 (23.6%) | 81 (76.4%) |
| Total (Overall) | 144 (36.8%) | 247 (63.2%) |
Services Occupations
The most common Services occupations in Buffalo are Healthcare Support (55 | 14.1%), Personal Care & Service (26 | 6.7%), and Cleaning & Maintenance (2 | 0.5%).
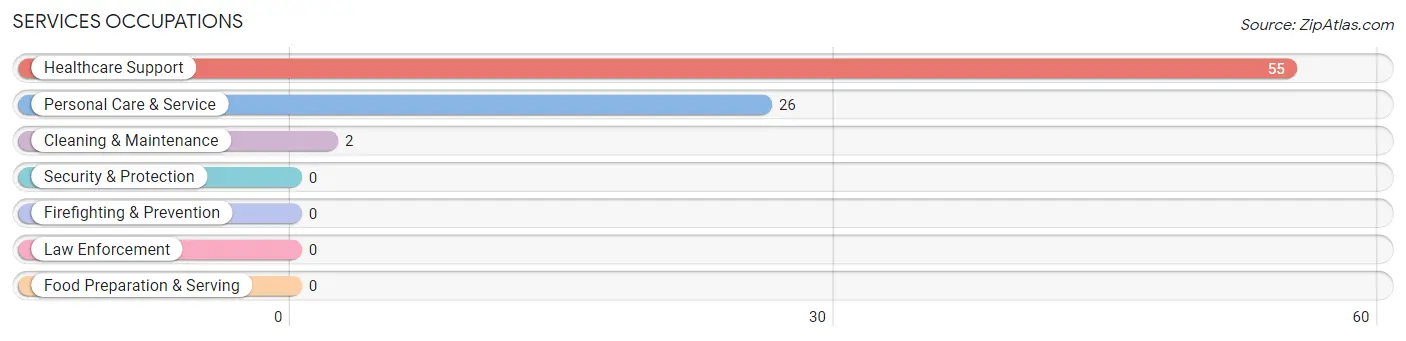
Services Occupations by Sex
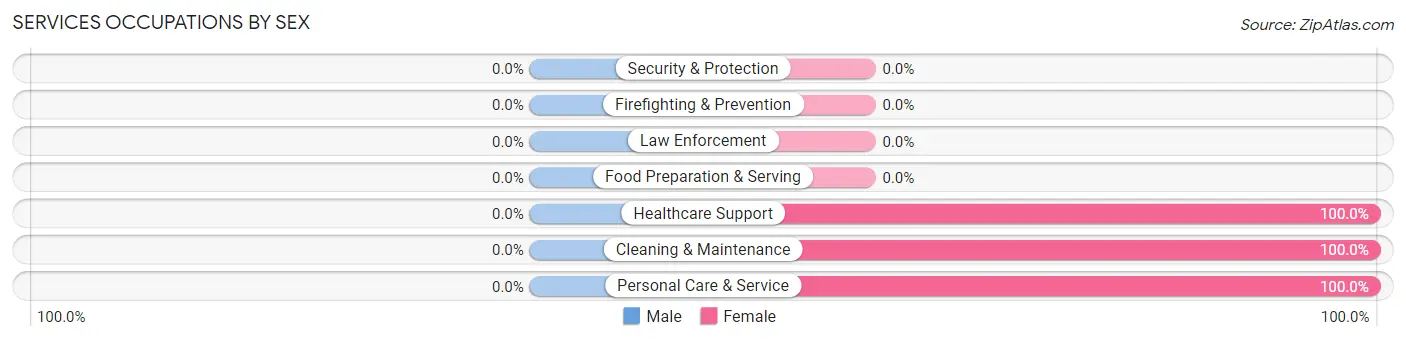
| Occupation | Male | Female |
| Healthcare Support | 0 (0.0%) | 55 (100.0%) |
| Security & Protection | 0 (0.0%) | 0 (0.0%) |
| Firefighting & Prevention | 0 (0.0%) | 0 (0.0%) |
| Law Enforcement | 0 (0.0%) | 0 (0.0%) |
| Food Preparation & Serving | 0 (0.0%) | 0 (0.0%) |
| Cleaning & Maintenance | 0 (0.0%) | 2 (100.0%) |
| Personal Care & Service | 0 (0.0%) | 26 (100.0%) |
| Total (Category) | 0 (0.0%) | 83 (100.0%) |
| Total (Overall) | 144 (36.8%) | 247 (63.2%) |
Sales and Office Occupations
The most common Sales and Office occupations in Buffalo are Sales & Related (37 | 9.5%), and Office & Administration (29 | 7.4%).

Sales and Office Occupations by Sex

| Occupation | Male | Female |
| Sales & Related | 0 (0.0%) | 37 (100.0%) |
| Office & Administration | 29 (100.0%) | 0 (0.0%) |
| Total (Category) | 29 (43.9%) | 37 (56.1%) |
| Total (Overall) | 144 (36.8%) | 247 (63.2%) |
Natural Resources, Construction and Maintenance Occupations
The most common Natural Resources, Construction and Maintenance occupations in Buffalo are , and Construction & Extraction (2 | 0.5%).

Natural Resources, Construction and Maintenance Occupations by Sex

| Occupation | Male | Female |
| Farming, Fishing & Forestry | 0 (0.0%) | 0 (0.0%) |
| Construction & Extraction | 2 (100.0%) | 0 (0.0%) |
| Installation, Maintenance & Repair | 0 (0.0%) | 0 (0.0%) |
| Total (Category) | 2 (100.0%) | 0 (0.0%) |
| Total (Overall) | 144 (36.8%) | 247 (63.2%) |
Production, Transportation and Moving Occupations
The most common Production, Transportation and Moving occupations in Buffalo are Production (85 | 21.7%), and Transportation (49 | 12.5%).
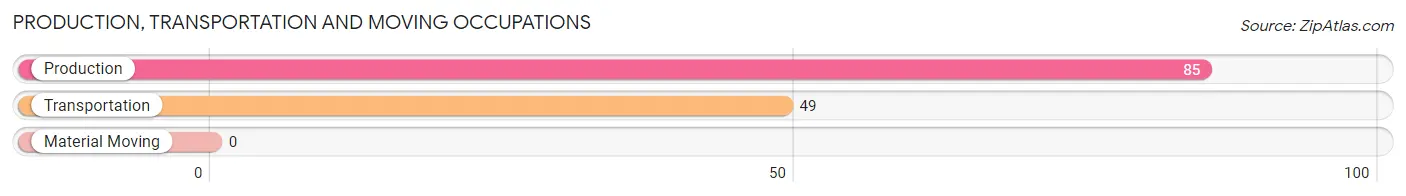
Production, Transportation and Moving Occupations by Sex
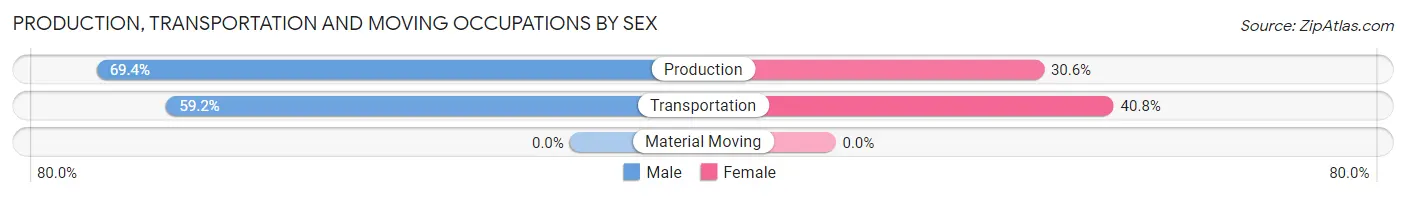
| Occupation | Male | Female |
| Production | 59 (69.4%) | 26 (30.6%) |
| Transportation | 29 (59.2%) | 20 (40.8%) |
| Material Moving | 0 (0.0%) | 0 (0.0%) |
| Total (Category) | 88 (65.7%) | 46 (34.3%) |
| Total (Overall) | 144 (36.8%) | 247 (63.2%) |
Employment Industries by Sex in Buffalo
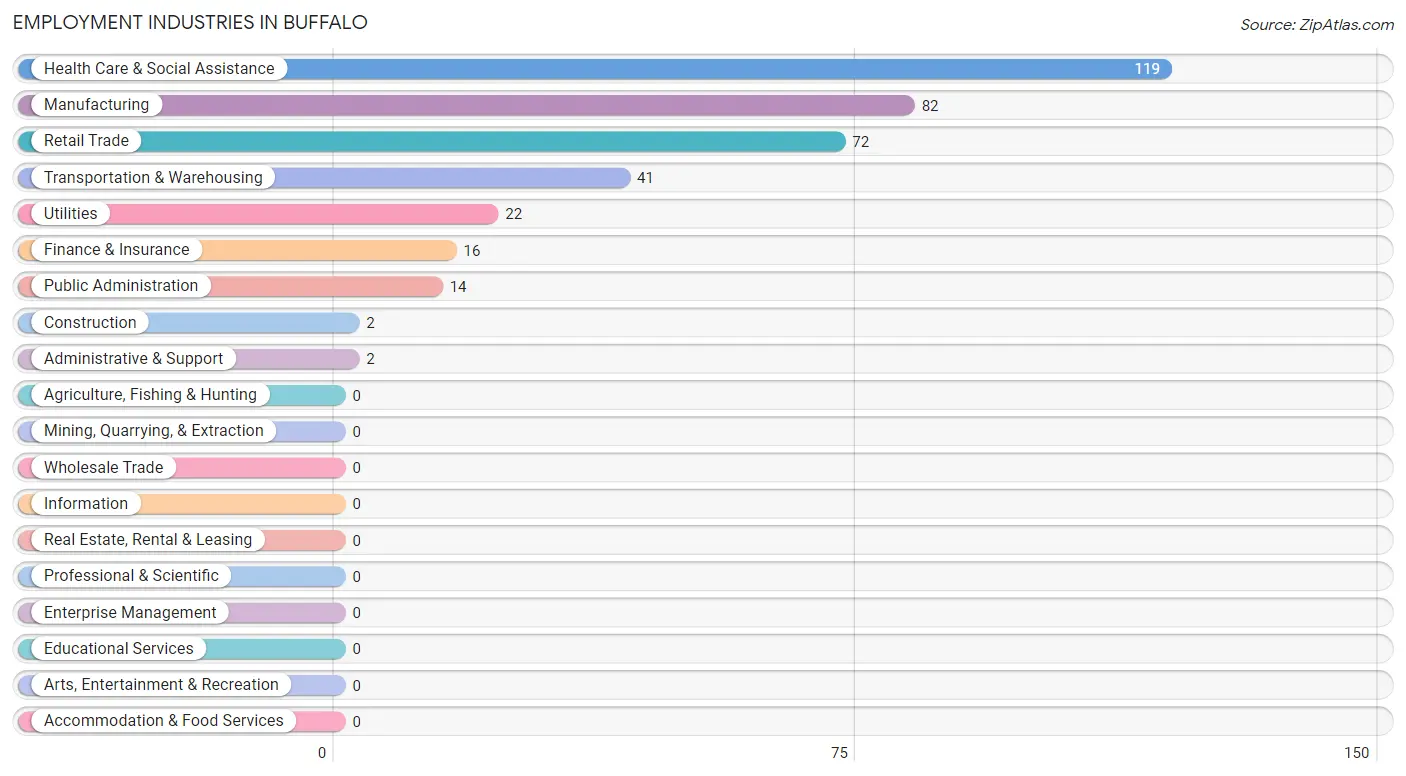
Employment Industries in Buffalo
The major employment industries in Buffalo include Health Care & Social Assistance (119 | 30.4%), Manufacturing (82 | 21.0%), Retail Trade (72 | 18.4%), Transportation & Warehousing (41 | 10.5%), and Utilities (22 | 5.6%).
Employment Industries by Sex in Buffalo
The Buffalo industries that see more men than women are Construction (100.0%), Utilities (100.0%), and Finance & Insurance (100.0%), whereas the industries that tend to have a higher number of women are Retail Trade (100.0%), Administrative & Support (100.0%), and Public Administration (100.0%).
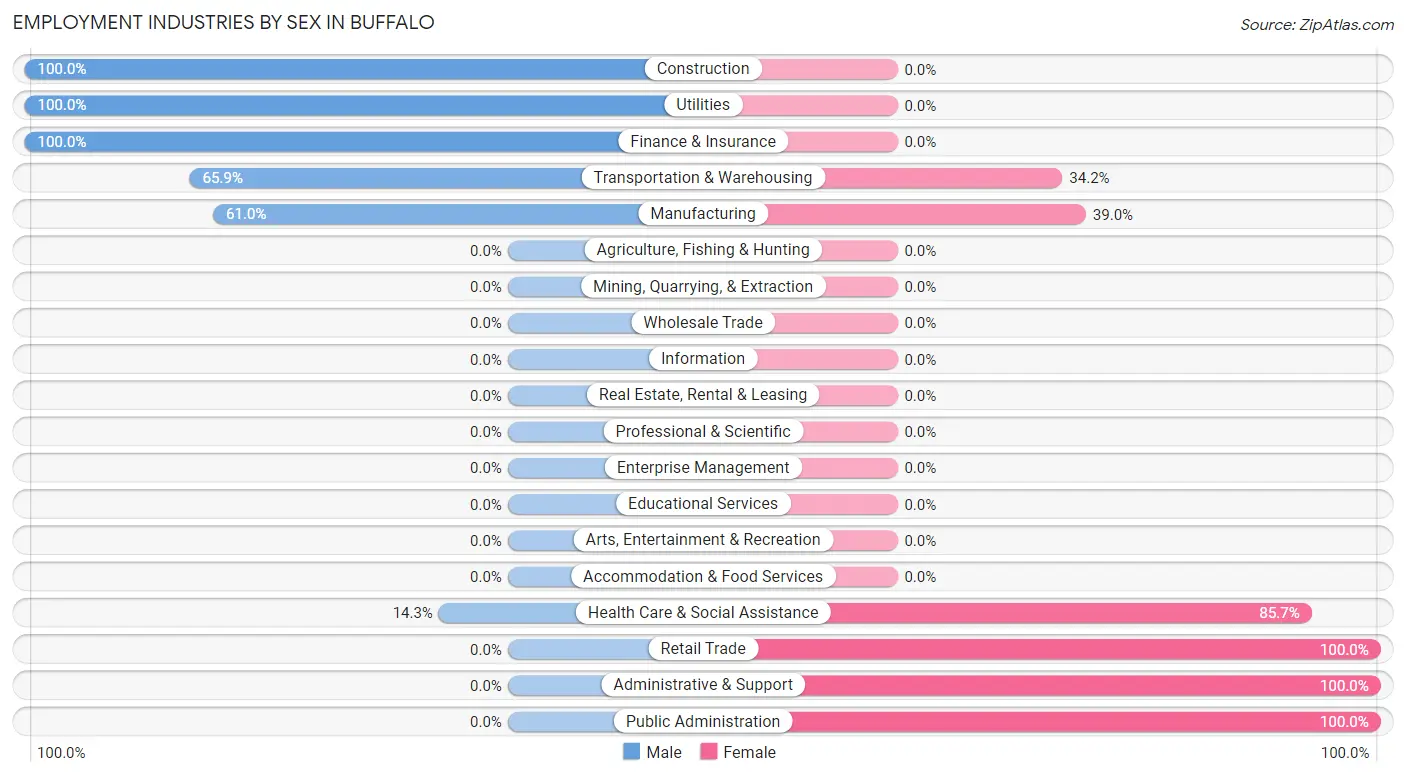
| Industry | Male | Female |
| Agriculture, Fishing & Hunting | 0 (0.0%) | 0 (0.0%) |
| Mining, Quarrying, & Extraction | 0 (0.0%) | 0 (0.0%) |
| Construction | 2 (100.0%) | 0 (0.0%) |
| Manufacturing | 50 (61.0%) | 32 (39.0%) |
| Wholesale Trade | 0 (0.0%) | 0 (0.0%) |
| Retail Trade | 0 (0.0%) | 72 (100.0%) |
| Transportation & Warehousing | 27 (65.8%) | 14 (34.2%) |
| Utilities | 22 (100.0%) | 0 (0.0%) |
| Information | 0 (0.0%) | 0 (0.0%) |
| Finance & Insurance | 16 (100.0%) | 0 (0.0%) |
| Real Estate, Rental & Leasing | 0 (0.0%) | 0 (0.0%) |
| Professional & Scientific | 0 (0.0%) | 0 (0.0%) |
| Enterprise Management | 0 (0.0%) | 0 (0.0%) |
| Administrative & Support | 0 (0.0%) | 2 (100.0%) |
| Educational Services | 0 (0.0%) | 0 (0.0%) |
| Health Care & Social Assistance | 17 (14.3%) | 102 (85.7%) |
| Arts, Entertainment & Recreation | 0 (0.0%) | 0 (0.0%) |
| Accommodation & Food Services | 0 (0.0%) | 0 (0.0%) |
| Public Administration | 0 (0.0%) | 14 (100.0%) |
| Total | 144 (36.8%) | 247 (63.2%) |
Education in Buffalo
School Enrollment in Buffalo
The most common levels of schooling among the 338 students in Buffalo are elementary school (104 | 30.8%), high school (71 | 21.0%), and middle school (66 | 19.5%).
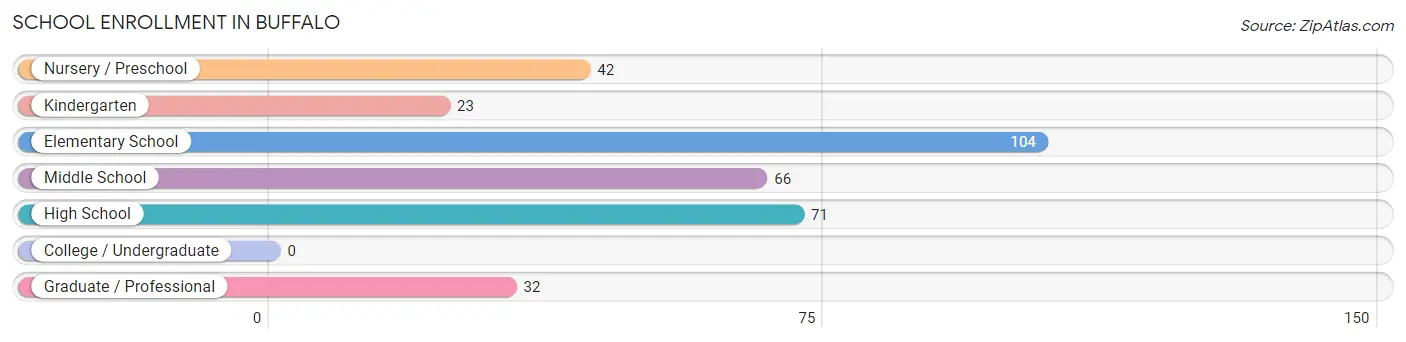
| School Level | # Students | % Students |
| Nursery / Preschool | 42 | 12.4% |
| Kindergarten | 23 | 6.8% |
| Elementary School | 104 | 30.8% |
| Middle School | 66 | 19.5% |
| High School | 71 | 21.0% |
| College / Undergraduate | 0 | 0.0% |
| Graduate / Professional | 32 | 9.5% |
| Total | 338 | 100.0% |
School Enrollment by Age by Funding Source in Buffalo
Out of a total of 338 students who are enrolled in schools in Buffalo, 53 (15.7%) attend a private institution, while the remaining 285 (84.3%) are enrolled in public schools. The age group of 20 to 24 year olds has the highest likelihood of being enrolled in private schools, with 32 (100.0% in the age bracket) enrolled. Conversely, the age group of 10 to 14 year olds has the lowest likelihood of being enrolled in a private school, with 82 (100.0% in the age bracket) attending a public institution.
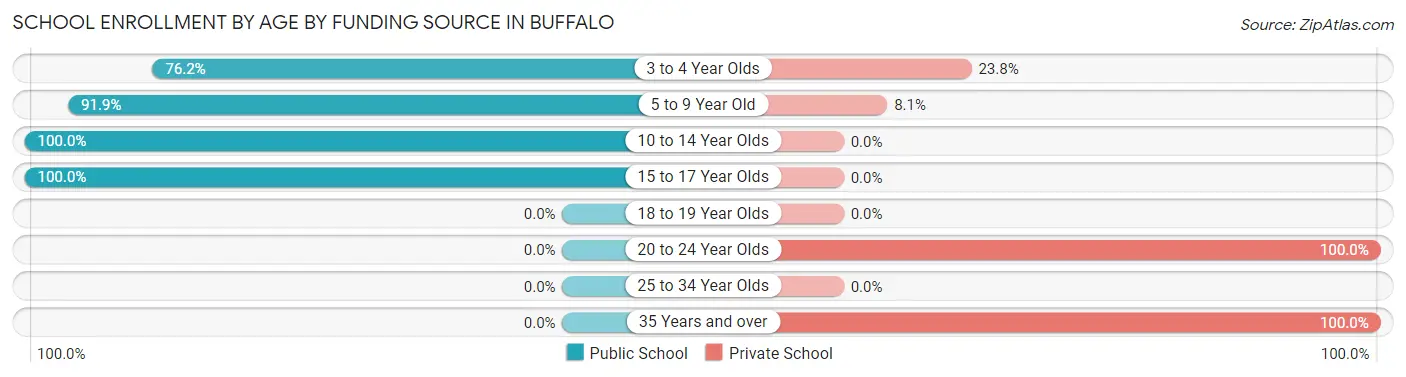
| Age Bracket | Public School | Private School |
| 3 to 4 Year Olds | 32 (76.2%) | 10 (23.8%) |
| 5 to 9 Year Old | 102 (91.9%) | 9 (8.1%) |
| 10 to 14 Year Olds | 82 (100.0%) | 0 (0.0%) |
| 15 to 17 Year Olds | 69 (100.0%) | 0 (0.0%) |
| 18 to 19 Year Olds | 0 (0.0%) | 0 (0.0%) |
| 20 to 24 Year Olds | 0 (0.0%) | 32 (100.0%) |
| 25 to 34 Year Olds | 0 (0.0%) | 0 (0.0%) |
| 35 Years and over | 0 (0.0%) | 2 (100.0%) |
| Total | 285 (84.3%) | 53 (15.7%) |
Educational Attainment by Field of Study in Buffalo
Science & technology (49 | 62.8%), computers & mathematics (14 | 17.9%), liberal arts & history (8 | 10.3%), and education (7 | 9.0%) are the most common fields of study among 78 individuals in Buffalo who have obtained a bachelor's degree or higher.
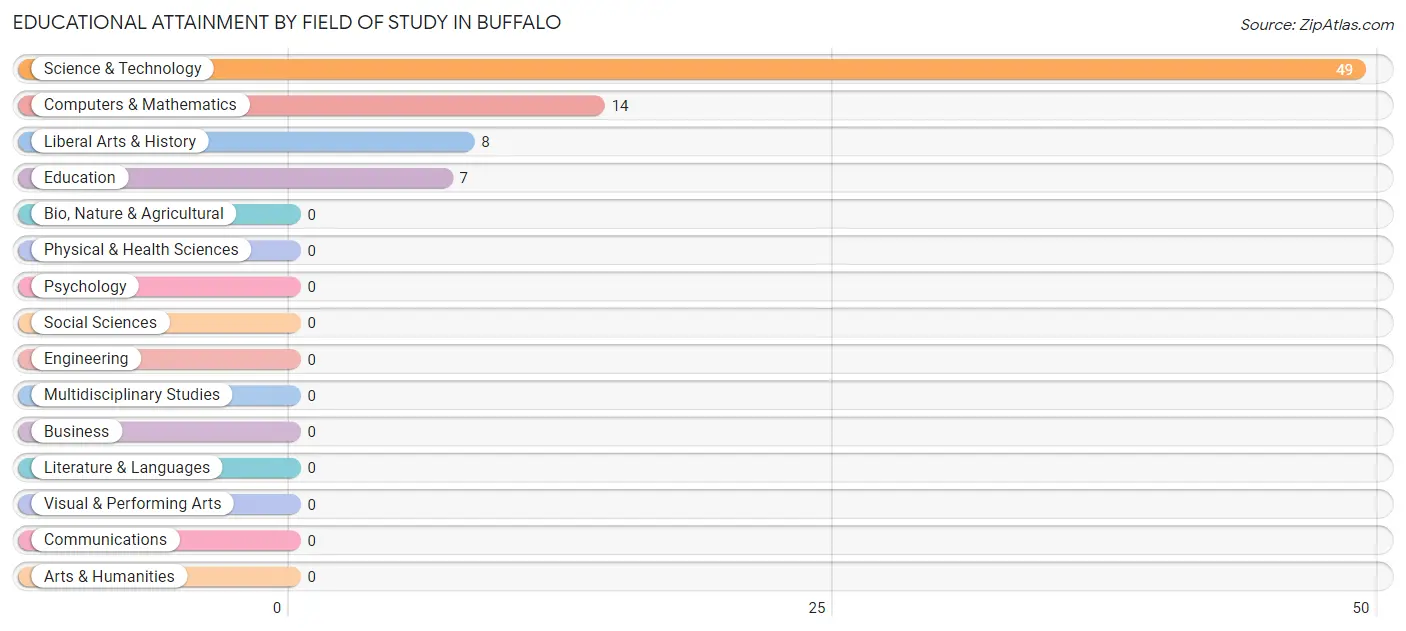
| Field of Study | # Graduates | % Graduates |
| Computers & Mathematics | 14 | 17.9% |
| Bio, Nature & Agricultural | 0 | 0.0% |
| Physical & Health Sciences | 0 | 0.0% |
| Psychology | 0 | 0.0% |
| Social Sciences | 0 | 0.0% |
| Engineering | 0 | 0.0% |
| Multidisciplinary Studies | 0 | 0.0% |
| Science & Technology | 49 | 62.8% |
| Business | 0 | 0.0% |
| Education | 7 | 9.0% |
| Literature & Languages | 0 | 0.0% |
| Liberal Arts & History | 8 | 10.3% |
| Visual & Performing Arts | 0 | 0.0% |
| Communications | 0 | 0.0% |
| Arts & Humanities | 0 | 0.0% |
| Total | 78 | 100.0% |
Transportation & Commute in Buffalo
Vehicle Availability by Sex in Buffalo
The most prevalent vehicle ownership categories in Buffalo are males with 2 vehicles (73, accounting for 50.7%) and females with 2 vehicles (111, making up 29.5%).
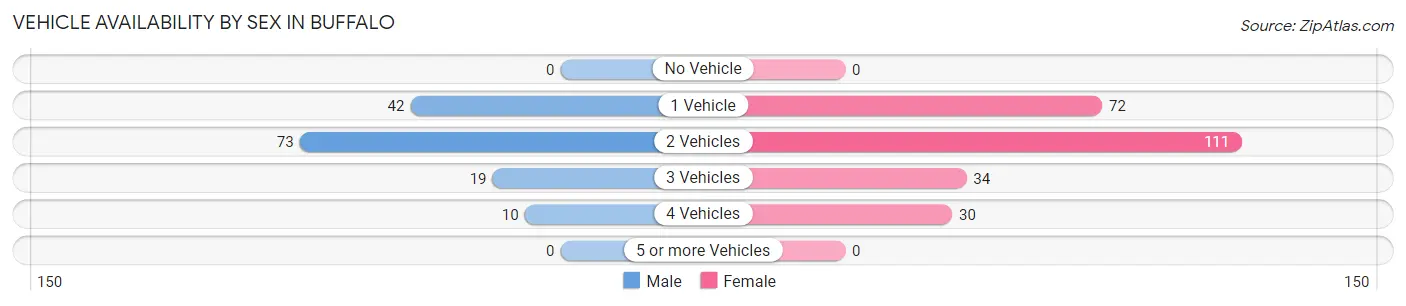
| Vehicles Available | Male | Female |
| No Vehicle | 0 (0.0%) | 0 (0.0%) |
| 1 Vehicle | 42 (29.2%) | 72 (29.1%) |
| 2 Vehicles | 73 (50.7%) | 111 (44.9%) |
| 3 Vehicles | 19 (13.2%) | 34 (13.8%) |
| 4 Vehicles | 10 (6.9%) | 30 (12.1%) |
| 5 or more Vehicles | 0 (0.0%) | 0 (0.0%) |
| Total | 144 (100.0%) | 247 (100.0%) |
Commute Time in Buffalo
The most frequently occuring commute durations in Buffalo are 10 to 14 minutes (75 commuters, 19.2%), 15 to 19 minutes (74 commuters, 18.9%), and 5 to 9 minutes (72 commuters, 18.4%).
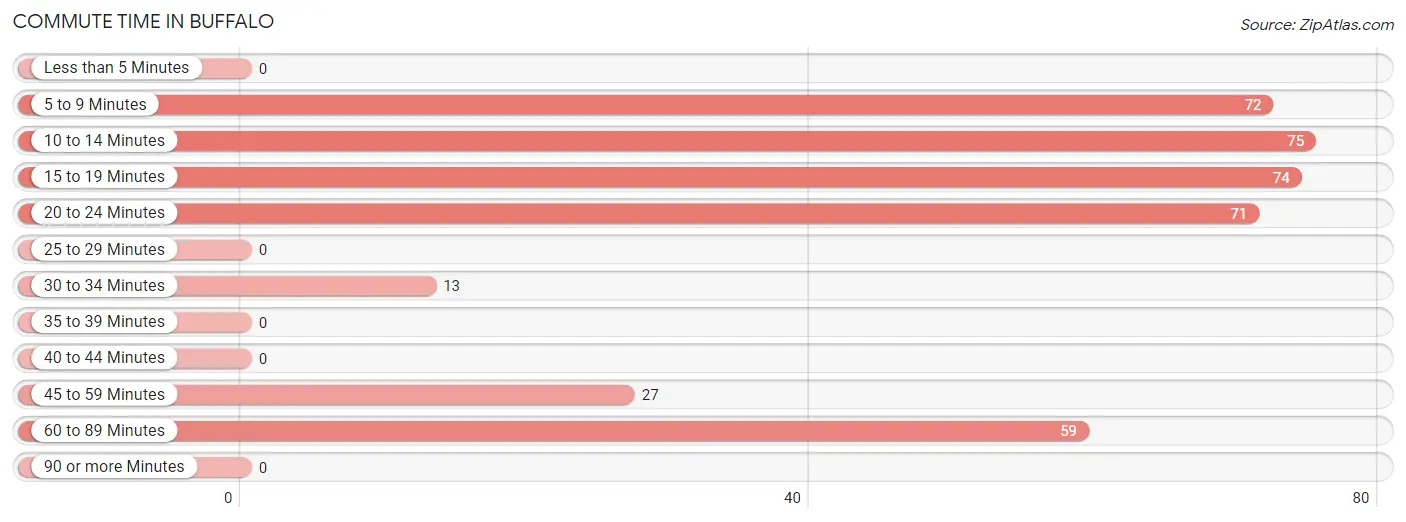
| Commute Time | # Commuters | % Commuters |
| Less than 5 Minutes | 0 | 0.0% |
| 5 to 9 Minutes | 72 | 18.4% |
| 10 to 14 Minutes | 75 | 19.2% |
| 15 to 19 Minutes | 74 | 18.9% |
| 20 to 24 Minutes | 71 | 18.2% |
| 25 to 29 Minutes | 0 | 0.0% |
| 30 to 34 Minutes | 13 | 3.3% |
| 35 to 39 Minutes | 0 | 0.0% |
| 40 to 44 Minutes | 0 | 0.0% |
| 45 to 59 Minutes | 27 | 6.9% |
| 60 to 89 Minutes | 59 | 15.1% |
| 90 or more Minutes | 0 | 0.0% |
Commute Time by Sex in Buffalo
The most common commute times in Buffalo are 5 to 9 minutes (37 commuters, 25.7%) for males and 10 to 14 minutes (59 commuters, 23.9%) for females.
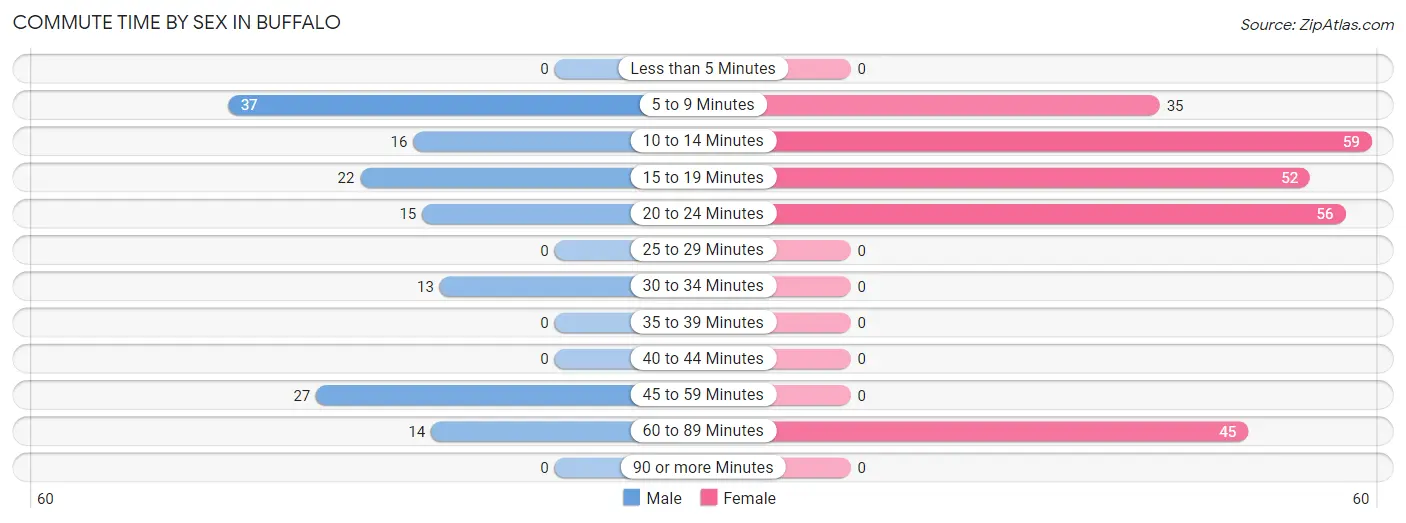
| Commute Time | Male | Female |
| Less than 5 Minutes | 0 (0.0%) | 0 (0.0%) |
| 5 to 9 Minutes | 37 (25.7%) | 35 (14.2%) |
| 10 to 14 Minutes | 16 (11.1%) | 59 (23.9%) |
| 15 to 19 Minutes | 22 (15.3%) | 52 (21.0%) |
| 20 to 24 Minutes | 15 (10.4%) | 56 (22.7%) |
| 25 to 29 Minutes | 0 (0.0%) | 0 (0.0%) |
| 30 to 34 Minutes | 13 (9.0%) | 0 (0.0%) |
| 35 to 39 Minutes | 0 (0.0%) | 0 (0.0%) |
| 40 to 44 Minutes | 0 (0.0%) | 0 (0.0%) |
| 45 to 59 Minutes | 27 (18.8%) | 0 (0.0%) |
| 60 to 89 Minutes | 14 (9.7%) | 45 (18.2%) |
| 90 or more Minutes | 0 (0.0%) | 0 (0.0%) |
Time of Departure to Work by Sex in Buffalo
The most frequent times of departure to work in Buffalo are 4:00 PM to 11:59 PM (35, 24.3%) for males and 7:30 AM to 7:59 AM (87, 35.2%) for females.
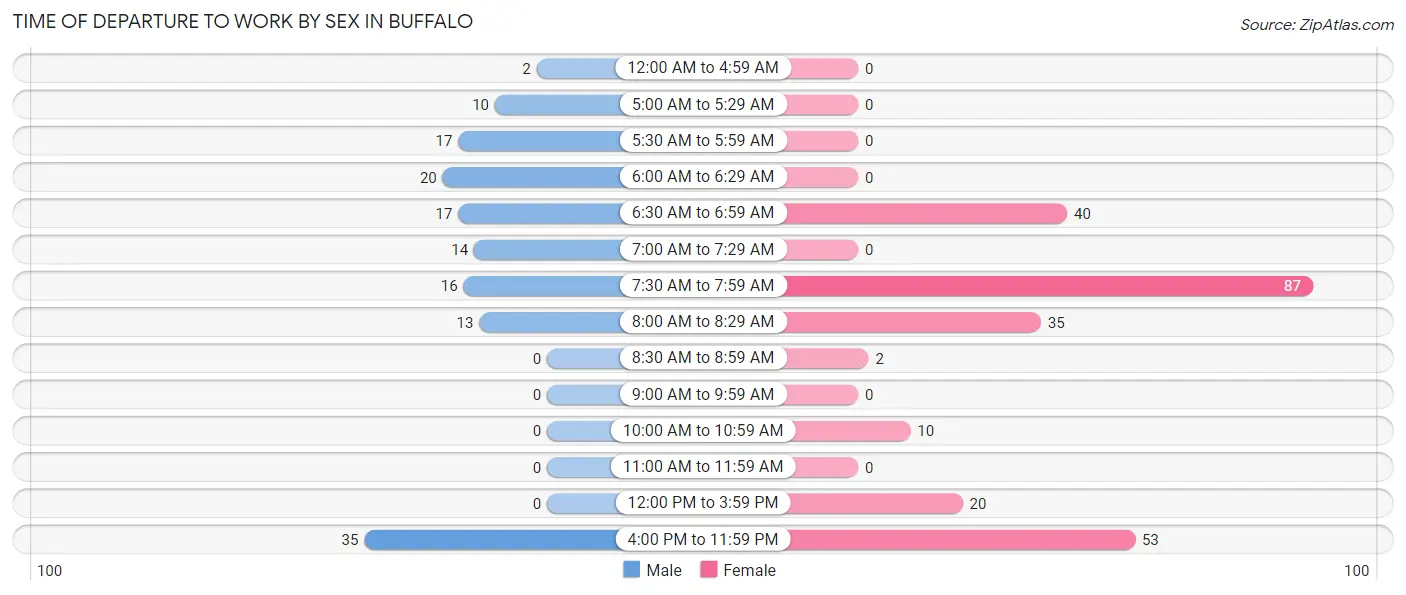
| Time of Departure | Male | Female |
| 12:00 AM to 4:59 AM | 2 (1.4%) | 0 (0.0%) |
| 5:00 AM to 5:29 AM | 10 (6.9%) | 0 (0.0%) |
| 5:30 AM to 5:59 AM | 17 (11.8%) | 0 (0.0%) |
| 6:00 AM to 6:29 AM | 20 (13.9%) | 0 (0.0%) |
| 6:30 AM to 6:59 AM | 17 (11.8%) | 40 (16.2%) |
| 7:00 AM to 7:29 AM | 14 (9.7%) | 0 (0.0%) |
| 7:30 AM to 7:59 AM | 16 (11.1%) | 87 (35.2%) |
| 8:00 AM to 8:29 AM | 13 (9.0%) | 35 (14.2%) |
| 8:30 AM to 8:59 AM | 0 (0.0%) | 2 (0.8%) |
| 9:00 AM to 9:59 AM | 0 (0.0%) | 0 (0.0%) |
| 10:00 AM to 10:59 AM | 0 (0.0%) | 10 (4.1%) |
| 11:00 AM to 11:59 AM | 0 (0.0%) | 0 (0.0%) |
| 12:00 PM to 3:59 PM | 0 (0.0%) | 20 (8.1%) |
| 4:00 PM to 11:59 PM | 35 (24.3%) | 53 (21.5%) |
| Total | 144 (100.0%) | 247 (100.0%) |
Housing Occupancy in Buffalo
Occupancy by Ownership in Buffalo
Of the total 484 dwellings in Buffalo, owner-occupied units account for 392 (81.0%), while renter-occupied units make up 92 (19.0%).
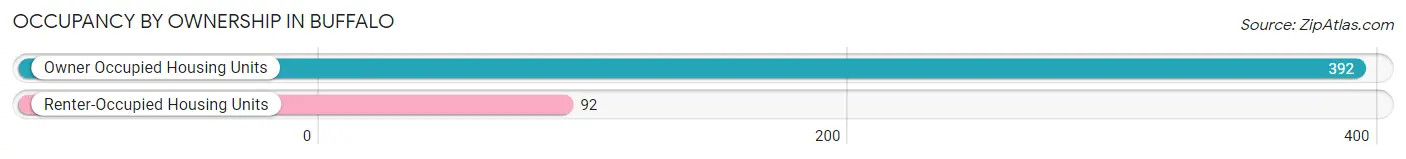
| Occupancy | # Housing Units | % Housing Units |
| Owner Occupied Housing Units | 392 | 81.0% |
| Renter-Occupied Housing Units | 92 | 19.0% |
| Total Occupied Housing Units | 484 | 100.0% |
Occupancy by Household Size in Buffalo
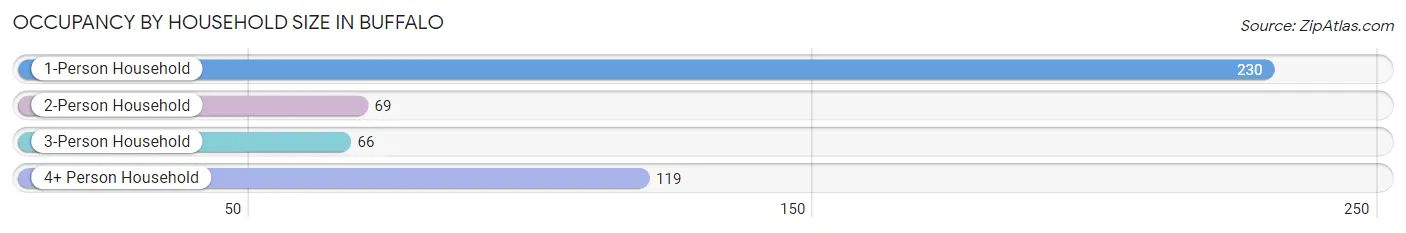
| Household Size | # Housing Units | % Housing Units |
| 1-Person Household | 230 | 47.5% |
| 2-Person Household | 69 | 14.3% |
| 3-Person Household | 66 | 13.6% |
| 4+ Person Household | 119 | 24.6% |
| Total Housing Units | 484 | 100.0% |
Occupancy by Ownership by Household Size in Buffalo
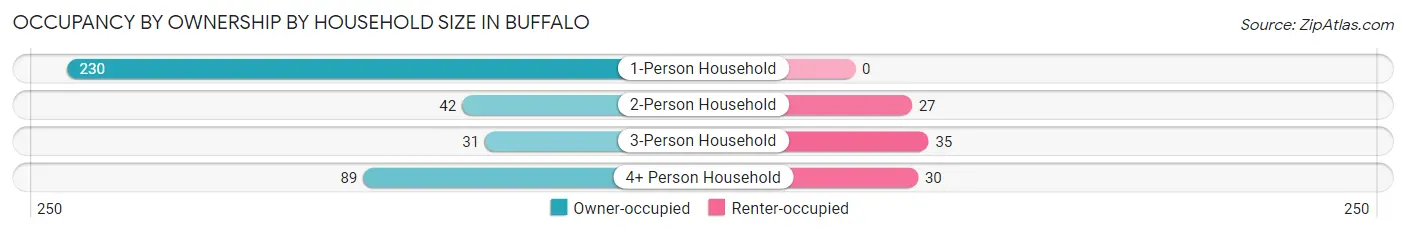
| Household Size | Owner-occupied | Renter-occupied |
| 1-Person Household | 230 (100.0%) | 0 (0.0%) |
| 2-Person Household | 42 (60.9%) | 27 (39.1%) |
| 3-Person Household | 31 (47.0%) | 35 (53.0%) |
| 4+ Person Household | 89 (74.8%) | 30 (25.2%) |
| Total Housing Units | 392 (81.0%) | 92 (19.0%) |
Occupancy by Educational Attainment in Buffalo
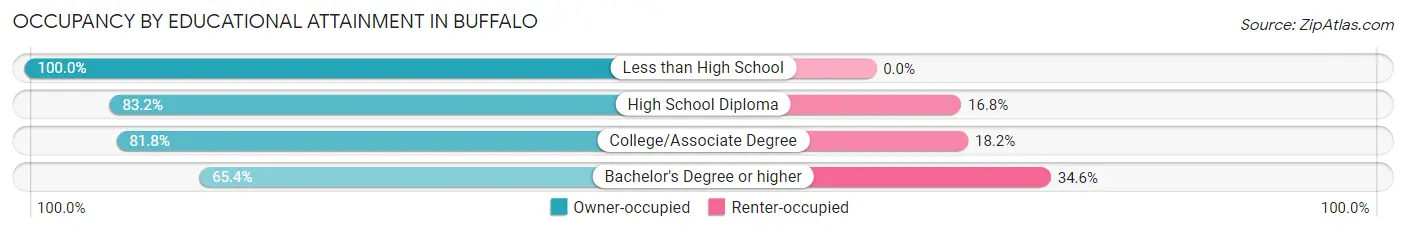
| Household Size | Owner-occupied | Renter-occupied |
| Less than High School | 42 (100.0%) | 0 (0.0%) |
| High School Diploma | 79 (83.2%) | 16 (16.8%) |
| College/Associate Degree | 220 (81.8%) | 49 (18.2%) |
| Bachelor's Degree or higher | 51 (65.4%) | 27 (34.6%) |
Occupancy by Age of Householder in Buffalo
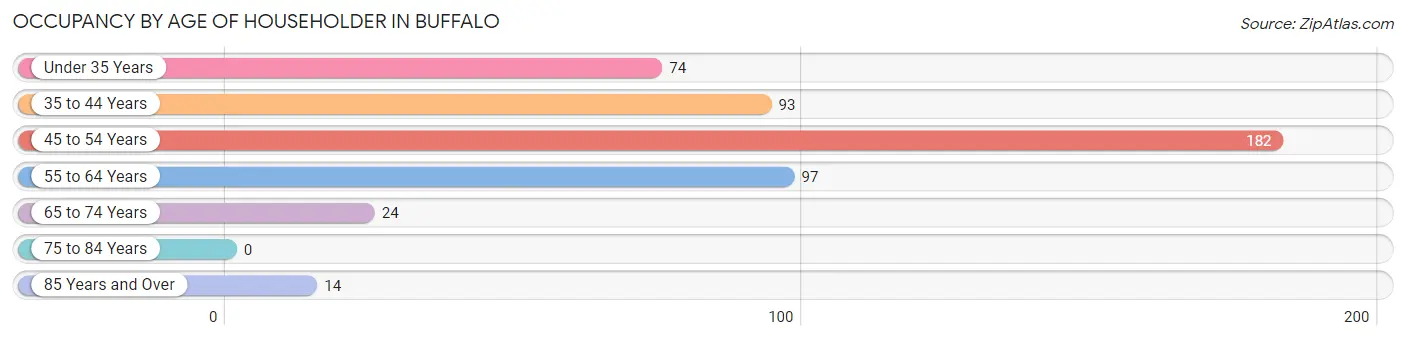
| Age Bracket | # Households | % Households |
| Under 35 Years | 74 | 15.3% |
| 35 to 44 Years | 93 | 19.2% |
| 45 to 54 Years | 182 | 37.6% |
| 55 to 64 Years | 97 | 20.0% |
| 65 to 74 Years | 24 | 5.0% |
| 75 to 84 Years | 0 | 0.0% |
| 85 Years and Over | 14 | 2.9% |
| Total | 484 | 100.0% |
Housing Finances in Buffalo
Median Income by Occupancy in Buffalo
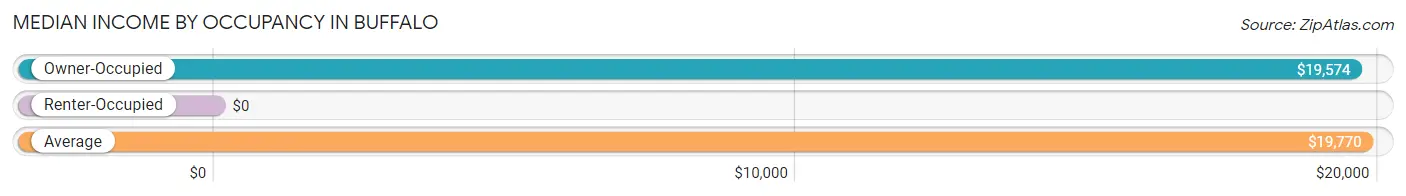
| Occupancy Type | # Households | Median Income |
| Owner-Occupied | 392 (81.0%) | $19,574 |
| Renter-Occupied | 92 (19.0%) | $0 |
| Average | 484 (100.0%) | $19,770 |
Occupancy by Householder Income Bracket in Buffalo
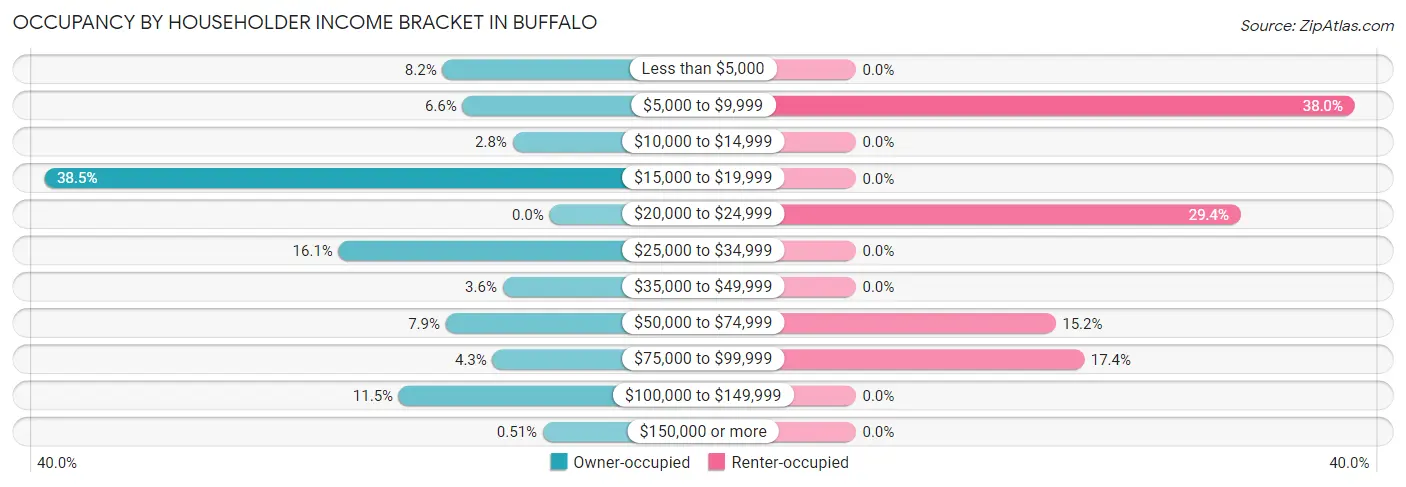
| Income Bracket | Owner-occupied | Renter-occupied |
| Less than $5,000 | 32 (8.2%) | 0 (0.0%) |
| $5,000 to $9,999 | 26 (6.6%) | 35 (38.0%) |
| $10,000 to $14,999 | 11 (2.8%) | 0 (0.0%) |
| $15,000 to $19,999 | 151 (38.5%) | 0 (0.0%) |
| $20,000 to $24,999 | 0 (0.0%) | 27 (29.3%) |
| $25,000 to $34,999 | 63 (16.1%) | 0 (0.0%) |
| $35,000 to $49,999 | 14 (3.6%) | 0 (0.0%) |
| $50,000 to $74,999 | 31 (7.9%) | 14 (15.2%) |
| $75,000 to $99,999 | 17 (4.3%) | 16 (17.4%) |
| $100,000 to $149,999 | 45 (11.5%) | 0 (0.0%) |
| $150,000 or more | 2 (0.5%) | 0 (0.0%) |
| Total | 392 (100.0%) | 92 (100.0%) |
Monthly Housing Cost Tiers in Buffalo
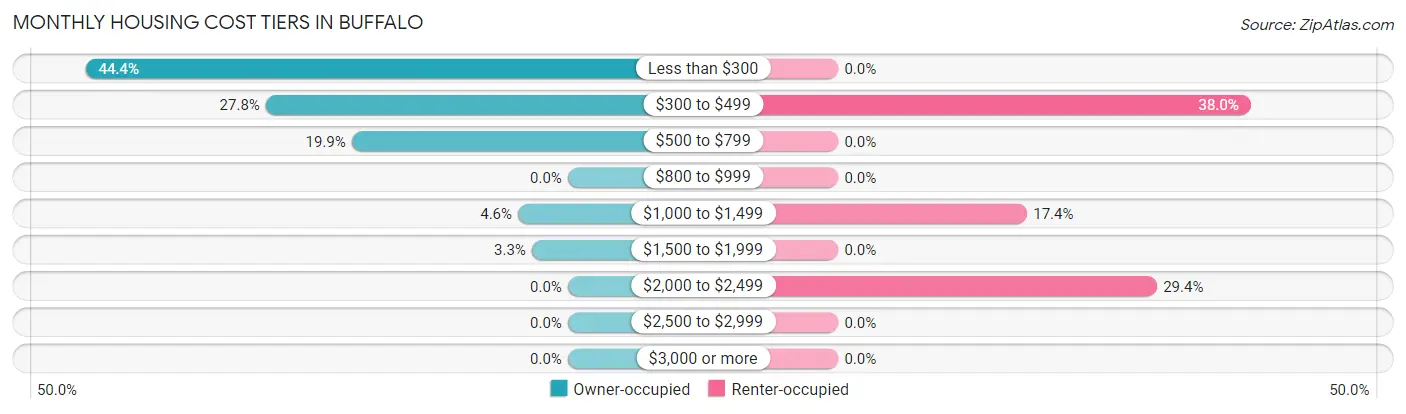
| Monthly Cost | Owner-occupied | Renter-occupied |
| Less than $300 | 174 (44.4%) | 0 (0.0%) |
| $300 to $499 | 109 (27.8%) | 35 (38.0%) |
| $500 to $799 | 78 (19.9%) | 0 (0.0%) |
| $800 to $999 | 0 (0.0%) | 0 (0.0%) |
| $1,000 to $1,499 | 18 (4.6%) | 16 (17.4%) |
| $1,500 to $1,999 | 13 (3.3%) | 0 (0.0%) |
| $2,000 to $2,499 | 0 (0.0%) | 27 (29.3%) |
| $2,500 to $2,999 | 0 (0.0%) | 0 (0.0%) |
| $3,000 or more | 0 (0.0%) | 0 (0.0%) |
| Total | 392 (100.0%) | 92 (100.0%) |
Physical Housing Characteristics in Buffalo
Housing Structures in Buffalo
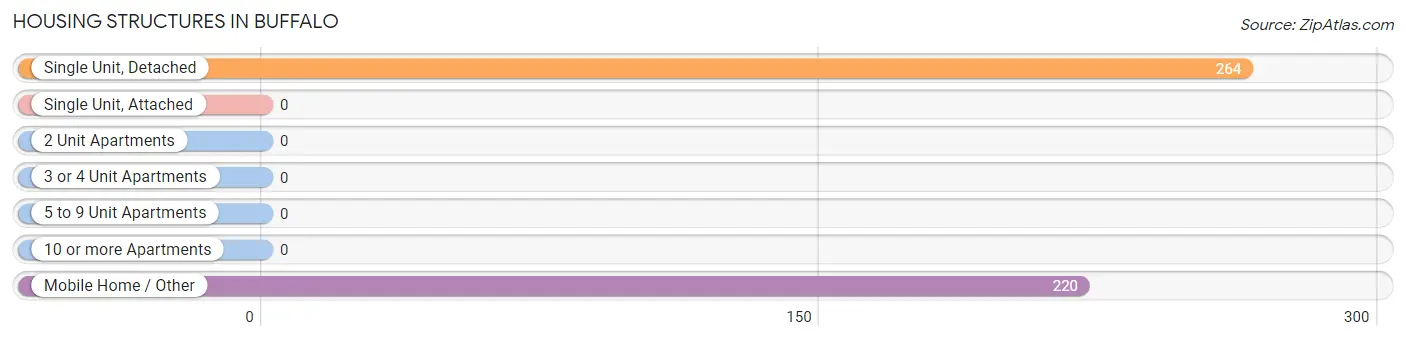
| Structure Type | # Housing Units | % Housing Units |
| Single Unit, Detached | 264 | 54.5% |
| Single Unit, Attached | 0 | 0.0% |
| 2 Unit Apartments | 0 | 0.0% |
| 3 or 4 Unit Apartments | 0 | 0.0% |
| 5 to 9 Unit Apartments | 0 | 0.0% |
| 10 or more Apartments | 0 | 0.0% |
| Mobile Home / Other | 220 | 45.5% |
| Total | 484 | 100.0% |
Housing Structures by Occupancy in Buffalo
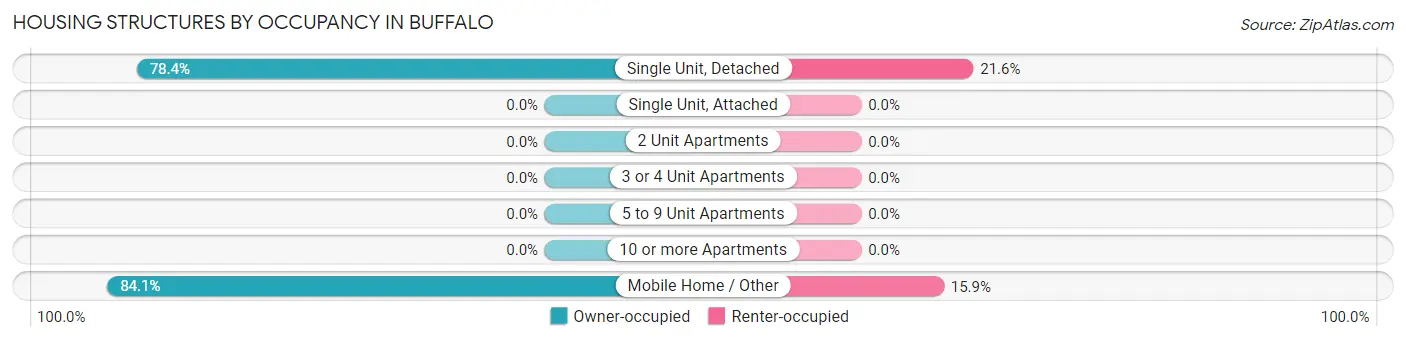
| Structure Type | Owner-occupied | Renter-occupied |
| Single Unit, Detached | 207 (78.4%) | 57 (21.6%) |
| Single Unit, Attached | 0 (0.0%) | 0 (0.0%) |
| 2 Unit Apartments | 0 (0.0%) | 0 (0.0%) |
| 3 or 4 Unit Apartments | 0 (0.0%) | 0 (0.0%) |
| 5 to 9 Unit Apartments | 0 (0.0%) | 0 (0.0%) |
| 10 or more Apartments | 0 (0.0%) | 0 (0.0%) |
| Mobile Home / Other | 185 (84.1%) | 35 (15.9%) |
| Total | 392 (81.0%) | 92 (19.0%) |
Housing Structures by Number of Rooms in Buffalo
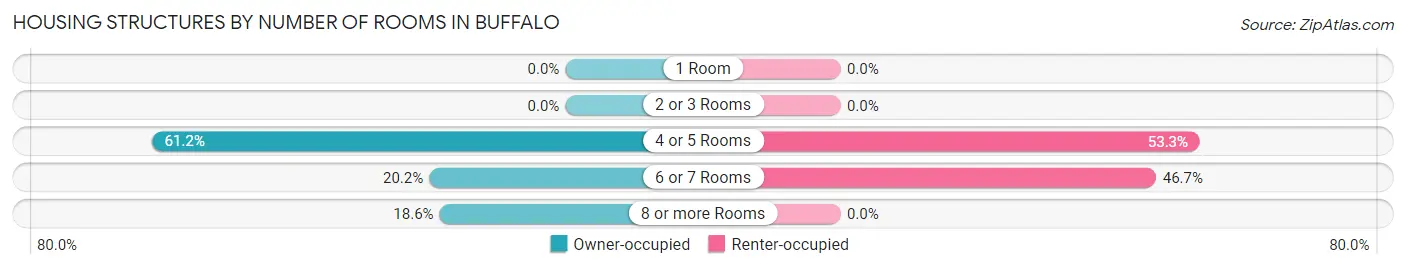
| Number of Rooms | Owner-occupied | Renter-occupied |
| 1 Room | 0 (0.0%) | 0 (0.0%) |
| 2 or 3 Rooms | 0 (0.0%) | 0 (0.0%) |
| 4 or 5 Rooms | 240 (61.2%) | 49 (53.3%) |
| 6 or 7 Rooms | 79 (20.2%) | 43 (46.7%) |
| 8 or more Rooms | 73 (18.6%) | 0 (0.0%) |
| Total | 392 (100.0%) | 92 (100.0%) |
Housing Structure by Heating Type in Buffalo
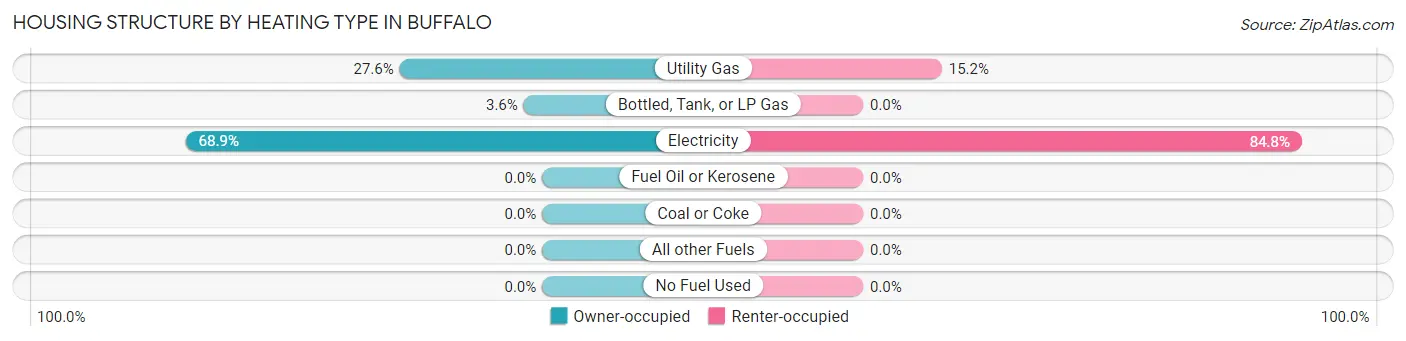
| Heating Type | Owner-occupied | Renter-occupied |
| Utility Gas | 108 (27.6%) | 14 (15.2%) |
| Bottled, Tank, or LP Gas | 14 (3.6%) | 0 (0.0%) |
| Electricity | 270 (68.9%) | 78 (84.8%) |
| Fuel Oil or Kerosene | 0 (0.0%) | 0 (0.0%) |
| Coal or Coke | 0 (0.0%) | 0 (0.0%) |
| All other Fuels | 0 (0.0%) | 0 (0.0%) |
| No Fuel Used | 0 (0.0%) | 0 (0.0%) |
| Total | 392 (100.0%) | 92 (100.0%) |
Household Vehicle Usage in Buffalo
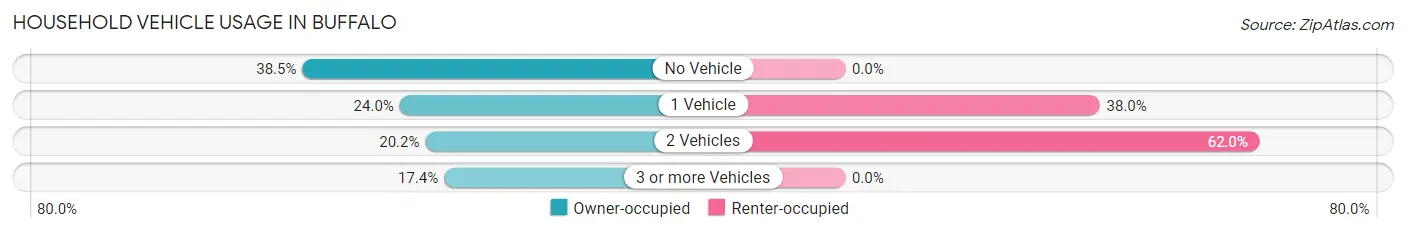
| Vehicles per Household | Owner-occupied | Renter-occupied |
| No Vehicle | 151 (38.5%) | 0 (0.0%) |
| 1 Vehicle | 94 (24.0%) | 35 (38.0%) |
| 2 Vehicles | 79 (20.2%) | 57 (62.0%) |
| 3 or more Vehicles | 68 (17.3%) | 0 (0.0%) |
| Total | 392 (100.0%) | 92 (100.0%) |
Real Estate & Mortgages in Buffalo
Real Estate and Mortgage Overview in Buffalo
| Characteristic | Without Mortgage | With Mortgage |
| Housing Units | 330 | 62 |
| Median Property Value | $44,500 | $112,500 |
| Median Household Income | $19,344 | $0 |
| Monthly Housing Costs | $243 | $0 |
| Real Estate Taxes | $588 | $17 |
Property Value by Mortgage Status in Buffalo
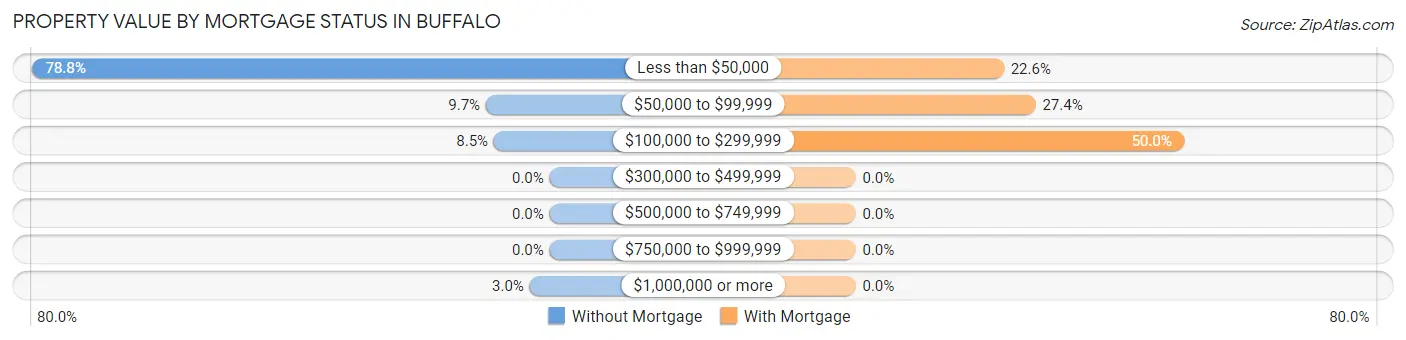
| Property Value | Without Mortgage | With Mortgage |
| Less than $50,000 | 260 (78.8%) | 14 (22.6%) |
| $50,000 to $99,999 | 32 (9.7%) | 17 (27.4%) |
| $100,000 to $299,999 | 28 (8.5%) | 31 (50.0%) |
| $300,000 to $499,999 | 0 (0.0%) | 0 (0.0%) |
| $500,000 to $749,999 | 0 (0.0%) | 0 (0.0%) |
| $750,000 to $999,999 | 0 (0.0%) | 0 (0.0%) |
| $1,000,000 or more | 10 (3.0%) | 0 (0.0%) |
| Total | 330 (100.0%) | 62 (100.0%) |
Household Income by Mortgage Status in Buffalo
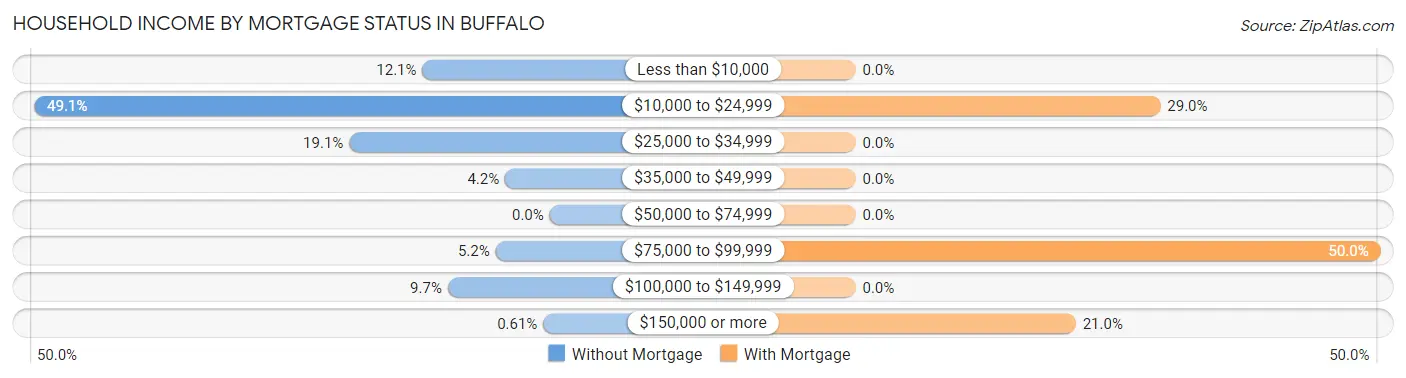
| Household Income | Without Mortgage | With Mortgage |
| Less than $10,000 | 40 (12.1%) | 0 (0.0%) |
| $10,000 to $24,999 | 162 (49.1%) | 18 (29.0%) |
| $25,000 to $34,999 | 63 (19.1%) | 0 (0.0%) |
| $35,000 to $49,999 | 14 (4.2%) | 0 (0.0%) |
| $50,000 to $74,999 | 0 (0.0%) | 0 (0.0%) |
| $75,000 to $99,999 | 17 (5.1%) | 31 (50.0%) |
| $100,000 to $149,999 | 32 (9.7%) | 0 (0.0%) |
| $150,000 or more | 2 (0.6%) | 13 (21.0%) |
| Total | 330 (100.0%) | 62 (100.0%) |
Property Value to Household Income Ratio in Buffalo
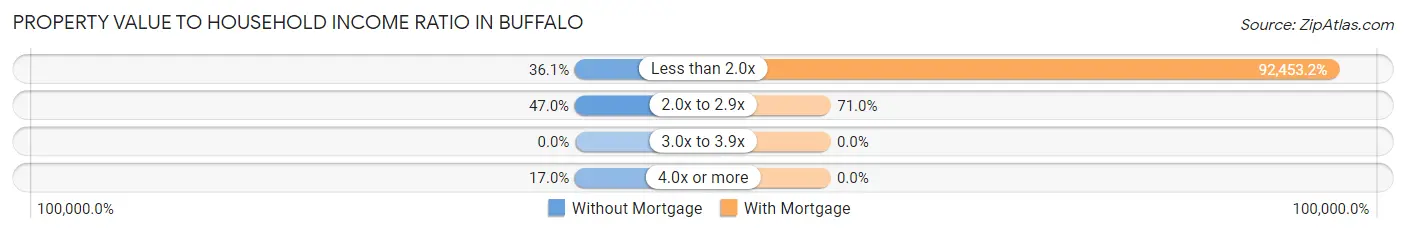
| Value-to-Income Ratio | Without Mortgage | With Mortgage |
| Less than 2.0x | 119 (36.1%) | 57,321 (92,453.2%) |
| 2.0x to 2.9x | 155 (47.0%) | 44 (71.0%) |
| 3.0x to 3.9x | 0 (0.0%) | 0 (0.0%) |
| 4.0x or more | 56 (17.0%) | 0 (0.0%) |
| Total | 330 (100.0%) | 62 (100.0%) |
Real Estate Taxes by Mortgage Status in Buffalo
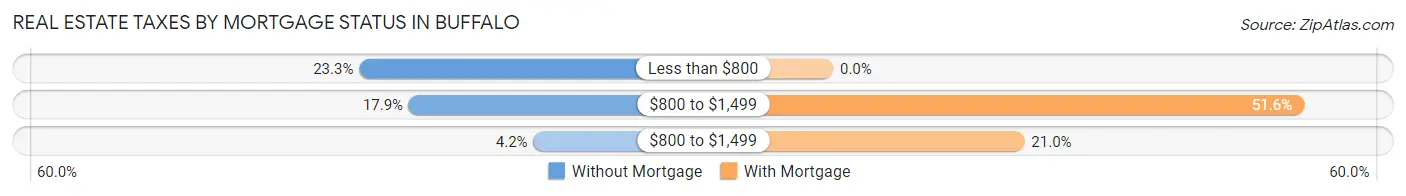
| Property Taxes | Without Mortgage | With Mortgage |
| Less than $800 | 77 (23.3%) | 0 (0.0%) |
| $800 to $1,499 | 59 (17.9%) | 32 (51.6%) |
| $800 to $1,499 | 14 (4.2%) | 13 (21.0%) |
| Total | 330 (100.0%) | 62 (100.0%) |
Health & Disability in Buffalo
Health Insurance Coverage by Age in Buffalo
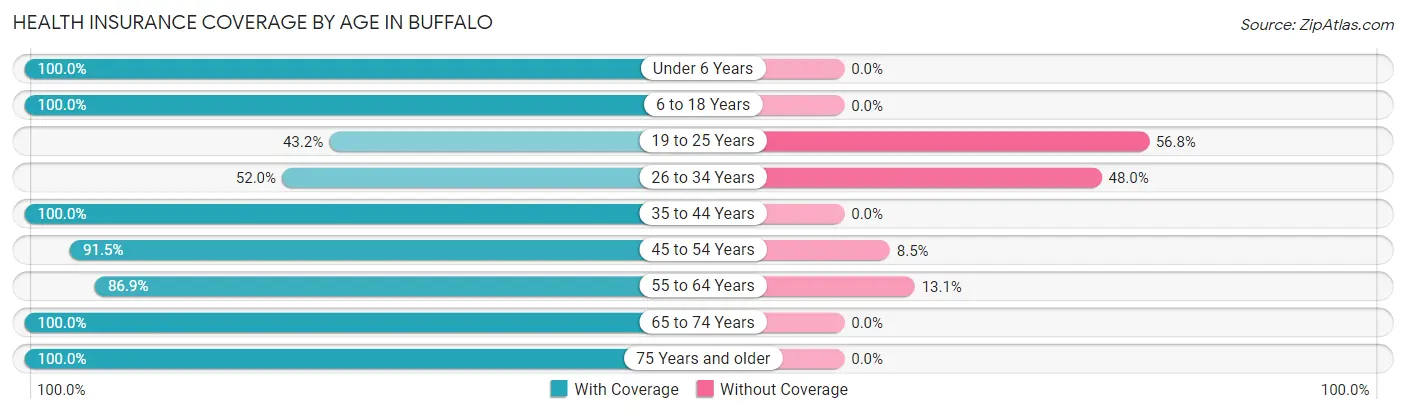
| Age Bracket | With Coverage | Without Coverage |
| Under 6 Years | 178 (100.0%) | 0 (0.0%) |
| 6 to 18 Years | 239 (100.0%) | 0 (0.0%) |
| 19 to 25 Years | 32 (43.2%) | 42 (56.8%) |
| 26 to 34 Years | 64 (52.0%) | 59 (48.0%) |
| 35 to 44 Years | 140 (100.0%) | 0 (0.0%) |
| 45 to 54 Years | 237 (91.5%) | 22 (8.5%) |
| 55 to 64 Years | 86 (86.9%) | 13 (13.1%) |
| 65 to 74 Years | 33 (100.0%) | 0 (0.0%) |
| 75 Years and older | 14 (100.0%) | 0 (0.0%) |
| Total | 1,023 (88.3%) | 136 (11.7%) |
Health Insurance Coverage by Citizenship Status in Buffalo
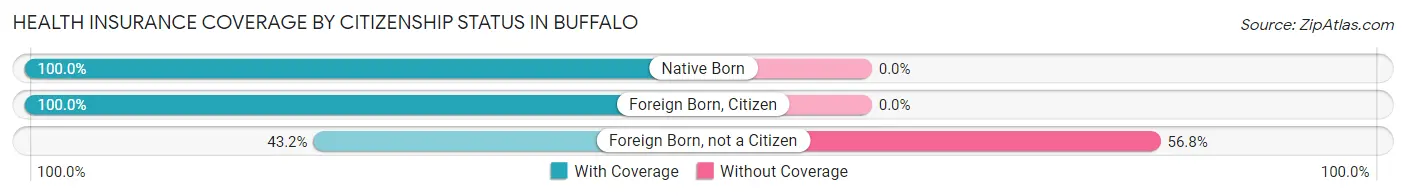
| Citizenship Status | With Coverage | Without Coverage |
| Native Born | 178 (100.0%) | 0 (0.0%) |
| Foreign Born, Citizen | 239 (100.0%) | 0 (0.0%) |
| Foreign Born, not a Citizen | 32 (43.2%) | 42 (56.8%) |
Health Insurance Coverage by Household Income in Buffalo
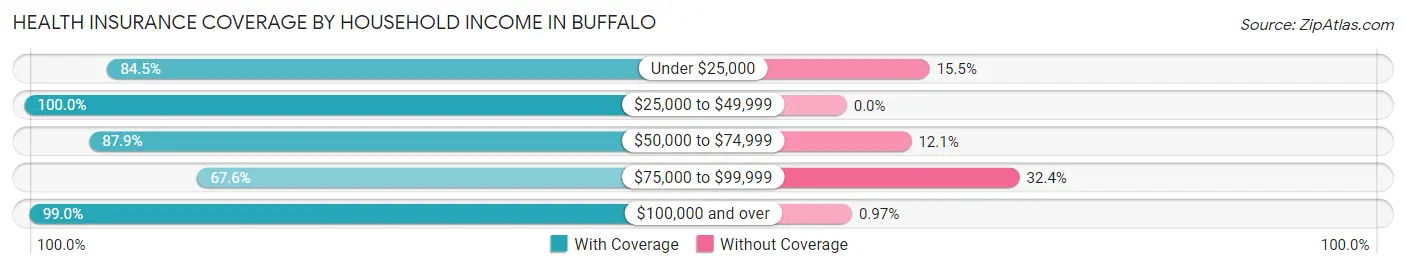
| Household Income | With Coverage | Without Coverage |
| Under $25,000 | 413 (84.5%) | 76 (15.5%) |
| $25,000 to $49,999 | 223 (100.0%) | 0 (0.0%) |
| $50,000 to $74,999 | 87 (87.9%) | 12 (12.1%) |
| $75,000 to $99,999 | 96 (67.6%) | 46 (32.4%) |
| $100,000 and over | 204 (99.0%) | 2 (1.0%) |
Public vs Private Health Insurance Coverage by Age in Buffalo
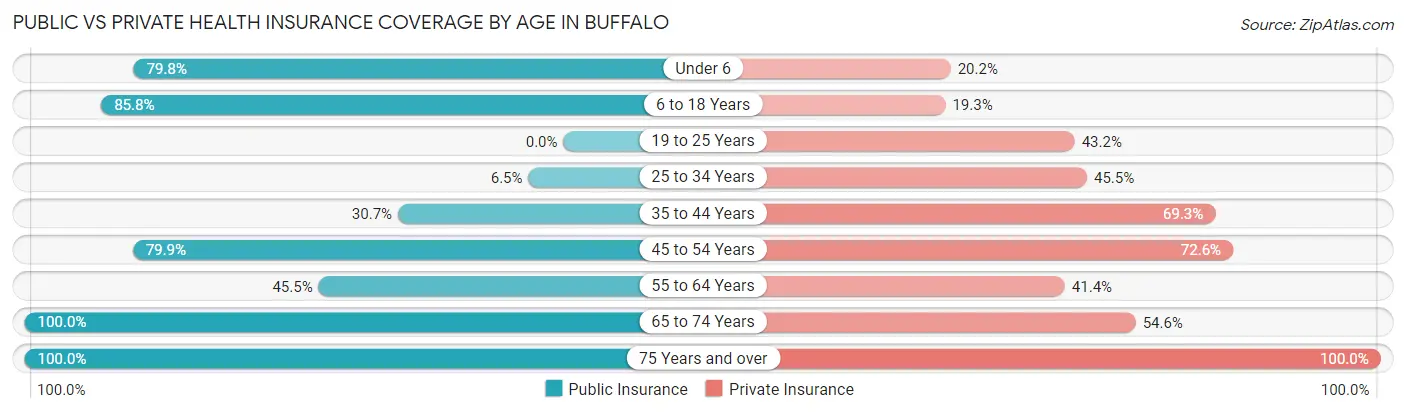
| Age Bracket | Public Insurance | Private Insurance |
| Under 6 | 142 (79.8%) | 36 (20.2%) |
| 6 to 18 Years | 205 (85.8%) | 46 (19.3%) |
| 19 to 25 Years | 0 (0.0%) | 32 (43.2%) |
| 25 to 34 Years | 8 (6.5%) | 56 (45.5%) |
| 35 to 44 Years | 43 (30.7%) | 97 (69.3%) |
| 45 to 54 Years | 207 (79.9%) | 188 (72.6%) |
| 55 to 64 Years | 45 (45.5%) | 41 (41.4%) |
| 65 to 74 Years | 33 (100.0%) | 18 (54.5%) |
| 75 Years and over | 14 (100.0%) | 14 (100.0%) |
| Total | 697 (60.1%) | 528 (45.6%) |
Disability Status by Sex by Age in Buffalo
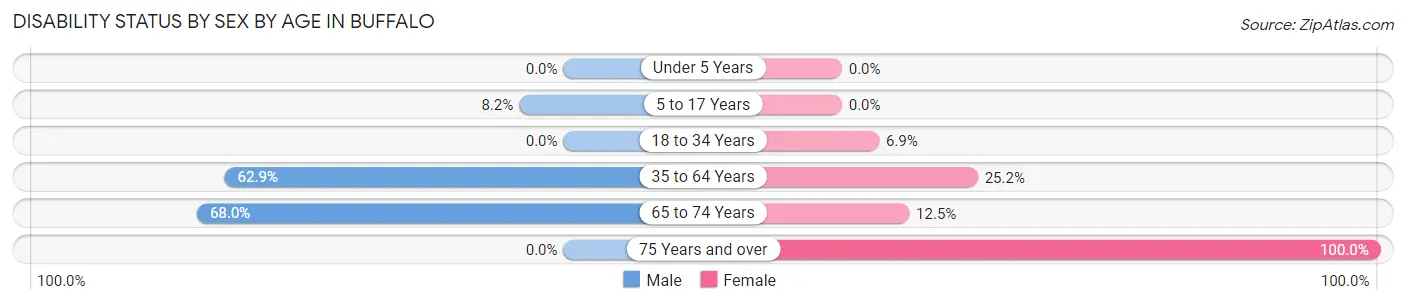
| Age Bracket | Male | Female |
| Under 5 Years | 0 (0.0%) | 0 (0.0%) |
| 5 to 17 Years | 12 (8.2%) | 0 (0.0%) |
| 18 to 34 Years | 0 (0.0%) | 8 (6.9%) |
| 35 to 64 Years | 176 (62.9%) | 55 (25.2%) |
| 65 to 74 Years | 17 (68.0%) | 1 (12.5%) |
| 75 Years and over | 0 (0.0%) | 14 (100.0%) |
Disability Class by Sex by Age in Buffalo
Disability Class: Hearing Difficulty
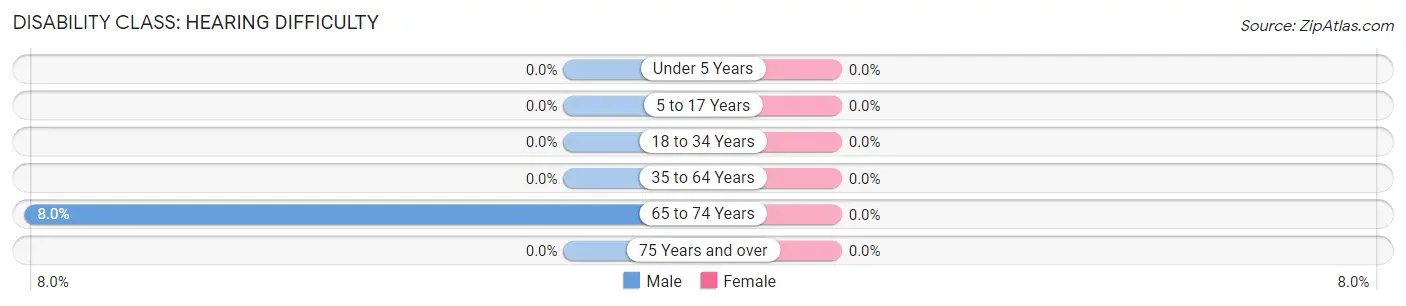
| Age Bracket | Male | Female |
| Under 5 Years | 0 (0.0%) | 0 (0.0%) |
| 5 to 17 Years | 0 (0.0%) | 0 (0.0%) |
| 18 to 34 Years | 0 (0.0%) | 0 (0.0%) |
| 35 to 64 Years | 0 (0.0%) | 0 (0.0%) |
| 65 to 74 Years | 2 (8.0%) | 0 (0.0%) |
| 75 Years and over | 0 (0.0%) | 0 (0.0%) |
Disability Class: Vision Difficulty
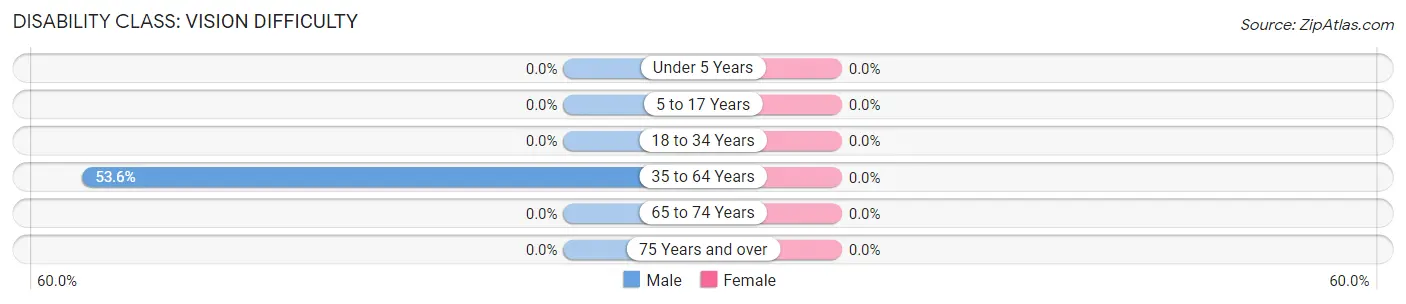
| Age Bracket | Male | Female |
| Under 5 Years | 0 (0.0%) | 0 (0.0%) |
| 5 to 17 Years | 0 (0.0%) | 0 (0.0%) |
| 18 to 34 Years | 0 (0.0%) | 0 (0.0%) |
| 35 to 64 Years | 150 (53.6%) | 0 (0.0%) |
| 65 to 74 Years | 0 (0.0%) | 0 (0.0%) |
| 75 Years and over | 0 (0.0%) | 0 (0.0%) |
Disability Class: Cognitive Difficulty
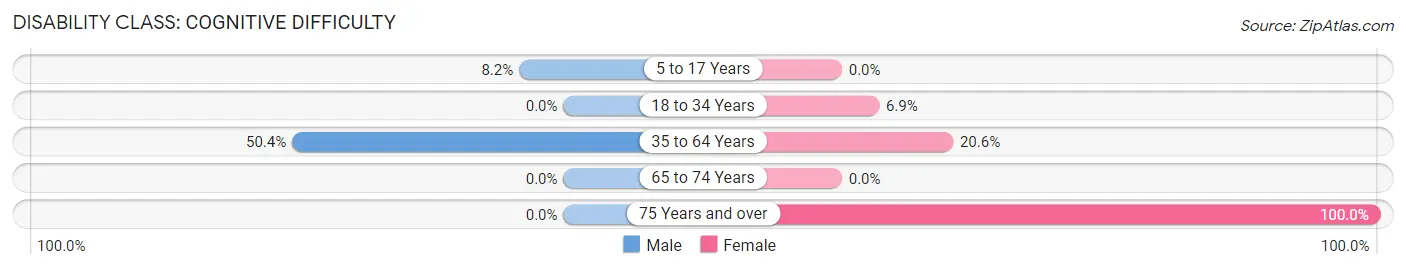
| Age Bracket | Male | Female |
| 5 to 17 Years | 12 (8.2%) | 0 (0.0%) |
| 18 to 34 Years | 0 (0.0%) | 8 (6.9%) |
| 35 to 64 Years | 141 (50.4%) | 45 (20.6%) |
| 65 to 74 Years | 0 (0.0%) | 0 (0.0%) |
| 75 Years and over | 0 (0.0%) | 14 (100.0%) |
Disability Class: Ambulatory Difficulty
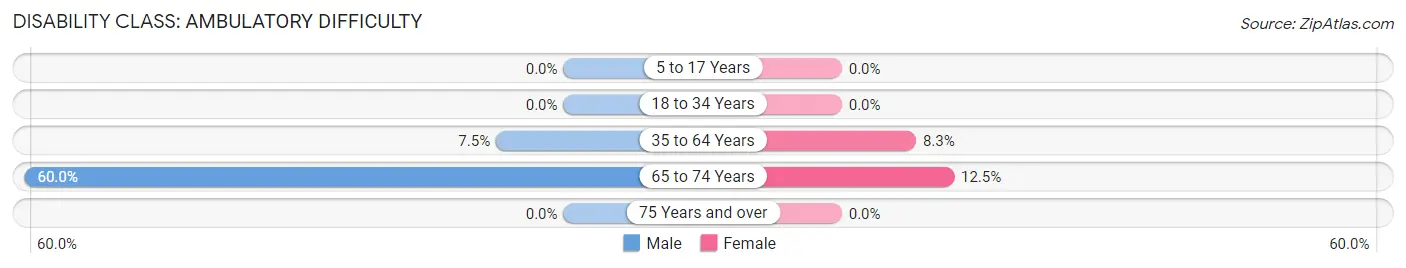
| Age Bracket | Male | Female |
| 5 to 17 Years | 0 (0.0%) | 0 (0.0%) |
| 18 to 34 Years | 0 (0.0%) | 0 (0.0%) |
| 35 to 64 Years | 21 (7.5%) | 18 (8.3%) |
| 65 to 74 Years | 15 (60.0%) | 1 (12.5%) |
| 75 Years and over | 0 (0.0%) | 0 (0.0%) |
Disability Class: Self-Care Difficulty
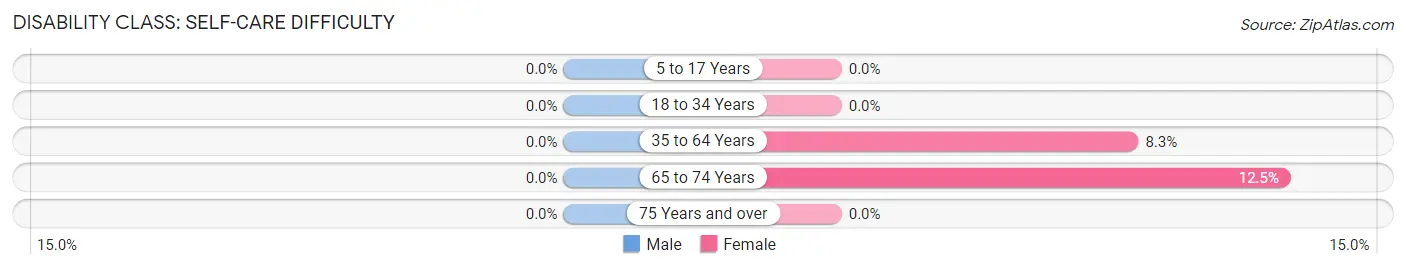
| Age Bracket | Male | Female |
| 5 to 17 Years | 0 (0.0%) | 0 (0.0%) |
| 18 to 34 Years | 0 (0.0%) | 0 (0.0%) |
| 35 to 64 Years | 0 (0.0%) | 18 (8.3%) |
| 65 to 74 Years | 0 (0.0%) | 1 (12.5%) |
| 75 Years and over | 0 (0.0%) | 0 (0.0%) |
Technology Access in Buffalo
Computing Device Access in Buffalo
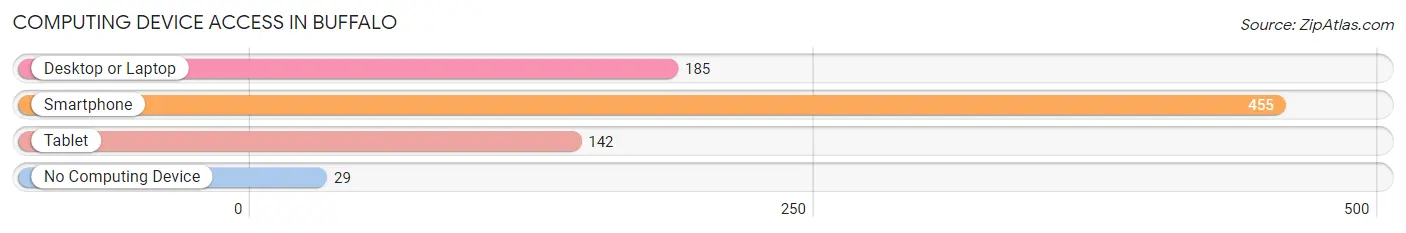
| Device Type | # Households | % Households |
| Desktop or Laptop | 185 | 38.2% |
| Smartphone | 455 | 94.0% |
| Tablet | 142 | 29.3% |
| No Computing Device | 29 | 6.0% |
| Total | 484 | 100.0% |
Internet Access in Buffalo
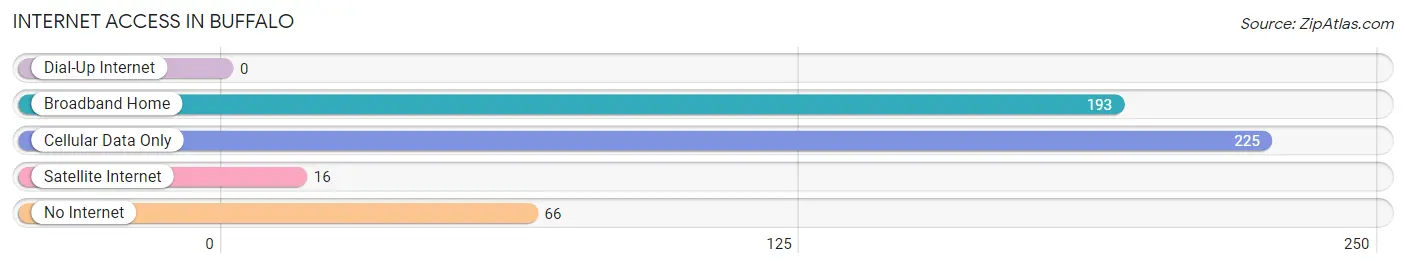
| Internet Type | # Households | % Households |
| Dial-Up Internet | 0 | 0.0% |
| Broadband Home | 193 | 39.9% |
| Cellular Data Only | 225 | 46.5% |
| Satellite Internet | 16 | 3.3% |
| No Internet | 66 | 13.6% |
| Total | 484 | 100.0% |
Buffalo Summary
Buffalo is a small town located in Union County, South Carolina. It is situated in the foothills of the Blue Ridge Mountains, approximately 25 miles northwest of Spartanburg. The town was founded in 1820 and named after the nearby Buffalo Creek. The population of Buffalo was estimated to be 1,093 in 2019.
Geography
Buffalo is located in the Piedmont region of South Carolina, in the foothills of the Blue Ridge Mountains. The town is situated at an elevation of 890 feet above sea level. The town is located in the Upstate region of South Carolina, approximately 25 miles northwest of Spartanburg. The town is located in Union County, which is bordered by Cherokee, Spartanburg, and Laurens counties. The town is located in the Piedmont region of South Carolina, which is characterized by rolling hills and valleys. The town is located in the Piedmont Uplands ecoregion, which is characterized by a mix of deciduous and evergreen forests.
Economy
The economy of Buffalo is largely based on agriculture and manufacturing. The town is home to several small businesses, including a grocery store, a hardware store, and a restaurant. The town is also home to several small manufacturing companies, including a furniture manufacturer and a textile mill. The town is also home to several farms, which produce a variety of crops, including corn, soybeans, and cotton.
Demographics
The population of Buffalo was estimated to be 1,093 in 2019. The town has a population that is predominantly white, with a small percentage of African Americans and Hispanics. The median household income in Buffalo is $37,941, which is lower than the state median of $50,570. The median age in Buffalo is 44.7, which is slightly higher than the state median of 38.7.
History
Buffalo was founded in 1820 and named after the nearby Buffalo Creek. The town was originally settled by farmers and was known for its production of cotton and tobacco. The town was also home to several small businesses, including a grocery store, a hardware store, and a restaurant. The town was also home to several small manufacturing companies, including a furniture manufacturer and a textile mill. The town was also home to several churches, including the Buffalo Presbyterian Church, which was founded in 1820.
In the late 19th century, the town was home to several schools, including the Buffalo Academy, which was founded in 1876. The town was also home to several churches, including the Buffalo Presbyterian Church, which was founded in 1820. The town was also home to several small businesses, including a grocery store, a hardware store, and a restaurant.
In the early 20th century, the town was home to several small businesses, including a grocery store, a hardware store, and a restaurant. The town was also home to several churches, including the Buffalo Presbyterian Church, which was founded in 1820. The town was also home to several schools, including the Buffalo Academy, which was founded in 1876.
In the late 20th century, the town was home to several small businesses, including a grocery store, a hardware store, and a restaurant. The town was also home to several churches, including the Buffalo Presbyterian Church, which was founded in 1820. The town was also home to several schools, including the Buffalo Academy, which was founded in 1876. The town was also home to several manufacturing companies, including a furniture manufacturer and a textile mill.
Conclusion
Buffalo is a small town located in Union County, South Carolina. It is situated in the foothills of the Blue Ridge Mountains, approximately 25 miles northwest of Spartanburg. The town was founded in 1820 and named after the nearby Buffalo Creek. The population of Buffalo was estimated to be 1,093 in 2019. The economy of Buffalo is largely based on agriculture and manufacturing. The town is home to several small businesses, including a grocery store, a hardware store, and a restaurant. The town is also home to several small manufacturing companies, including a furniture manufacturer and a textile mill. The town is also home to several farms, which produce a variety of crops, including corn, soybeans, and cotton. The population of Buffalo is predominantly white, with a small percentage of African Americans and Hispanics. The median household income in Buffalo is $37,941, which is lower than the state median of $50,570. The median age in Buffalo is 44.7, which is slightly higher than the state median of 38.7. Buffalo is a small town with a rich history and a diverse economy.
Common Questions
What is Per Capita Income in Buffalo?
Per Capita income in Buffalo is $16,077.
What is the Median Household income in Buffalo?
Median Household Income in Buffalo is $19,770.
What is Inequality or Gini Index in Buffalo?
Inequality or Gini Index in Buffalo is 0.49.
What is the Total Population of Buffalo?
Total Population of Buffalo is 1,159.
What is the Total Male Population of Buffalo?
Total Male Population of Buffalo is 608.
What is the Total Female Population of Buffalo?
Total Female Population of Buffalo is 551.
What is the Ratio of Males per 100 Females in Buffalo?
There are 110.34 Males per 100 Females in Buffalo.
What is the Ratio of Females per 100 Males in Buffalo?
There are 90.62 Females per 100 Males in Buffalo.
What is the Median Population Age in Buffalo?
Median Population Age in Buffalo is 29.9 Years.
What is the Average Family Size in Buffalo
Average Family Size in Buffalo is 3.6 People.
What is the Average Household Size in Buffalo
Average Household Size in Buffalo is 2.4 People.
How Large is the Labor Force in Buffalo?
There are 438 People in the Labor Forcein in Buffalo.
What is the Percentage of People in the Labor Force in Buffalo?
56.0% of People are in the Labor Force in Buffalo.
What is the Unemployment Rate in Buffalo?
Unemployment Rate in Buffalo is 10.7%.