Branchville, SC Map & Demographics
Branchville Map
Branchville Overview
$22,222
PER CAPITA INCOME
$50,500
AVG FAMILY INCOME
$34,486
AVG HOUSEHOLD INCOME
18.3%
WAGE / INCOME GAP [ % ]
81.7¢/ $1
WAGE / INCOME GAP [ $ ]
0.52
INEQUALITY / GINI INDEX
1,301
TOTAL POPULATION
603
MALE POPULATION
698
FEMALE POPULATION
86.39
MALES / 100 FEMALES
115.75
FEMALES / 100 MALES
53.3
MEDIAN AGE
3.2
AVG FAMILY SIZE
2.3
AVG HOUSEHOLD SIZE
597
LABOR FORCE [ PEOPLE ]
50.5%
PERCENT IN LABOR FORCE
10.9%
UNEMPLOYMENT RATE
Branchville Zip Codes
Branchville Area Codes
Income in Branchville
Income Overview in Branchville
Per Capita Income in Branchville is $22,222, while median incomes of families and households are $50,500 and $34,486 respectively.
| Characteristic | Number | Measure |
| Per Capita Income | 1,301 | $22,222 |
| Median Family Income | 318 | $50,500 |
| Mean Family Income | 318 | $67,340 |
| Median Household Income | 552 | $34,486 |
| Mean Household Income | 552 | $48,295 |
| Income Deficit | 318 | $0 |
| Wage / Income Gap (%) | 1,301 | 18.30% |
| Wage / Income Gap ($) | 1,301 | 81.70¢ per $1 |
| Gini / Inequality Index | 1,301 | 0.52 |
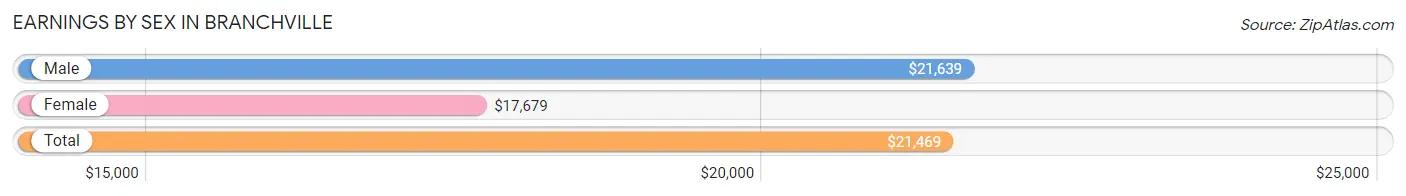
Earnings by Sex in Branchville
Average Earnings in Branchville are $21,469, $21,639 for men and $17,679 for women, a difference of 18.3%.
| Sex | Number | Average Earnings |
| Male | 319 (52.8%) | $21,639 |
| Female | 285 (47.2%) | $17,679 |
| Total | 604 (100.0%) | $21,469 |
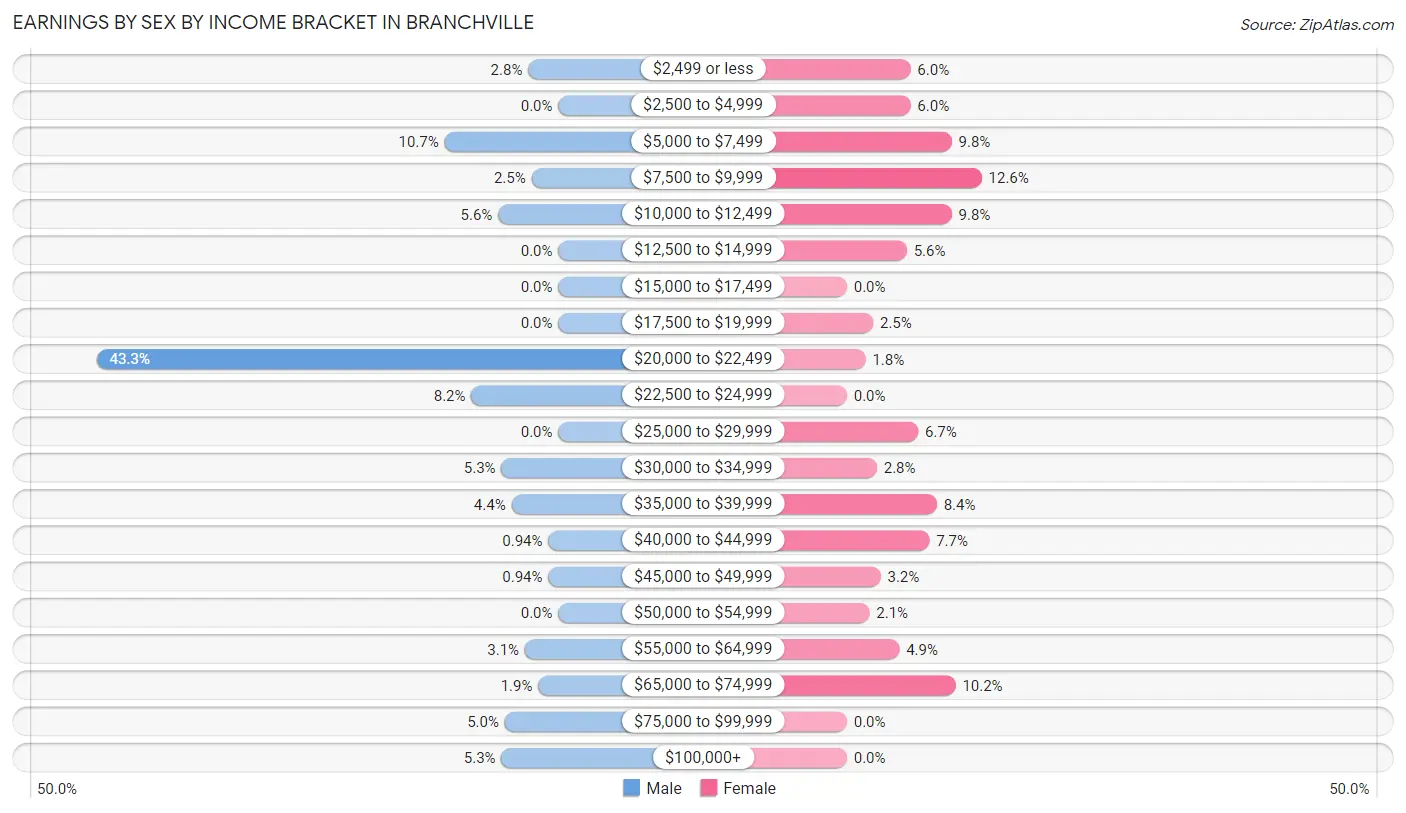
Earnings by Sex by Income Bracket in Branchville
The most common earnings brackets in Branchville are $20,000 to $22,499 for men (138 | 43.3%) and $7,500 to $9,999 for women (36 | 12.6%).
| Income | Male | Female |
| $2,499 or less | 9 (2.8%) | 17 (6.0%) |
| $2,500 to $4,999 | 0 (0.0%) | 17 (6.0%) |
| $5,000 to $7,499 | 34 (10.7%) | 28 (9.8%) |
| $7,500 to $9,999 | 8 (2.5%) | 36 (12.6%) |
| $10,000 to $12,499 | 18 (5.6%) | 28 (9.8%) |
| $12,500 to $14,999 | 0 (0.0%) | 16 (5.6%) |
| $15,000 to $17,499 | 0 (0.0%) | 0 (0.0%) |
| $17,500 to $19,999 | 0 (0.0%) | 7 (2.5%) |
| $20,000 to $22,499 | 138 (43.3%) | 5 (1.8%) |
| $22,500 to $24,999 | 26 (8.2%) | 0 (0.0%) |
| $25,000 to $29,999 | 0 (0.0%) | 19 (6.7%) |
| $30,000 to $34,999 | 17 (5.3%) | 8 (2.8%) |
| $35,000 to $39,999 | 14 (4.4%) | 24 (8.4%) |
| $40,000 to $44,999 | 3 (0.9%) | 22 (7.7%) |
| $45,000 to $49,999 | 3 (0.9%) | 9 (3.2%) |
| $50,000 to $54,999 | 0 (0.0%) | 6 (2.1%) |
| $55,000 to $64,999 | 10 (3.1%) | 14 (4.9%) |
| $65,000 to $74,999 | 6 (1.9%) | 29 (10.2%) |
| $75,000 to $99,999 | 16 (5.0%) | 0 (0.0%) |
| $100,000+ | 17 (5.3%) | 0 (0.0%) |
| Total | 319 (100.0%) | 285 (100.0%) |
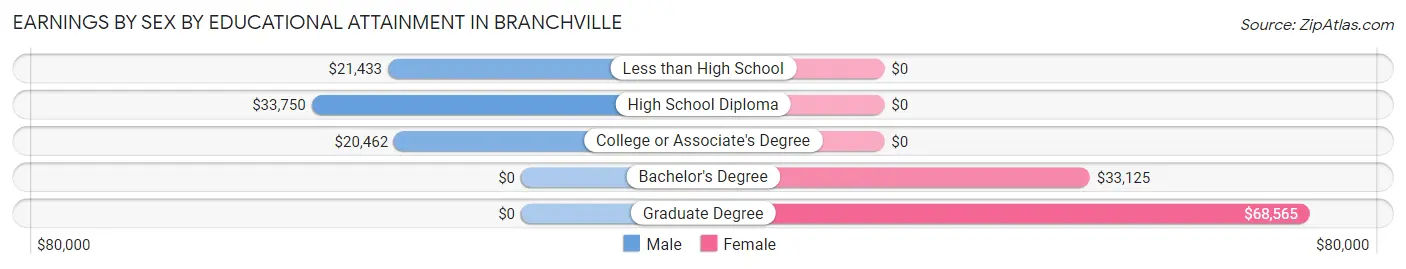
Earnings by Sex by Educational Attainment in Branchville
Average earnings in Branchville are $21,495 for men and $27,167 for women, a difference of 20.9%. Men with an educational attainment of high school diploma enjoy the highest average annual earnings of $33,750, while those with college or associate's degree education earn the least with $20,462. Women with an educational attainment of graduate degree earn the most with the average annual earnings of $68,565, while those with bachelor's degree education have the smallest earnings of $33,125.
| Educational Attainment | Male Income | Female Income |
| Less than High School | $21,433 | $0 |
| High School Diploma | $33,750 | $0 |
| College or Associate's Degree | $20,462 | $0 |
| Bachelor's Degree | - | - |
| Graduate Degree | - | - |
| Total | $21,495 | $27,167 |
Family Income in Branchville
Family Income Brackets in Branchville
According to the Branchville family income data, there are 69 families falling into the $25,000 to $34,999 income range, which is the most common income bracket and makes up 21.7% of all families. Conversely, the $10,000 to $14,999 income bracket is the least frequent group with only 3 families (0.9%) belonging to this category.
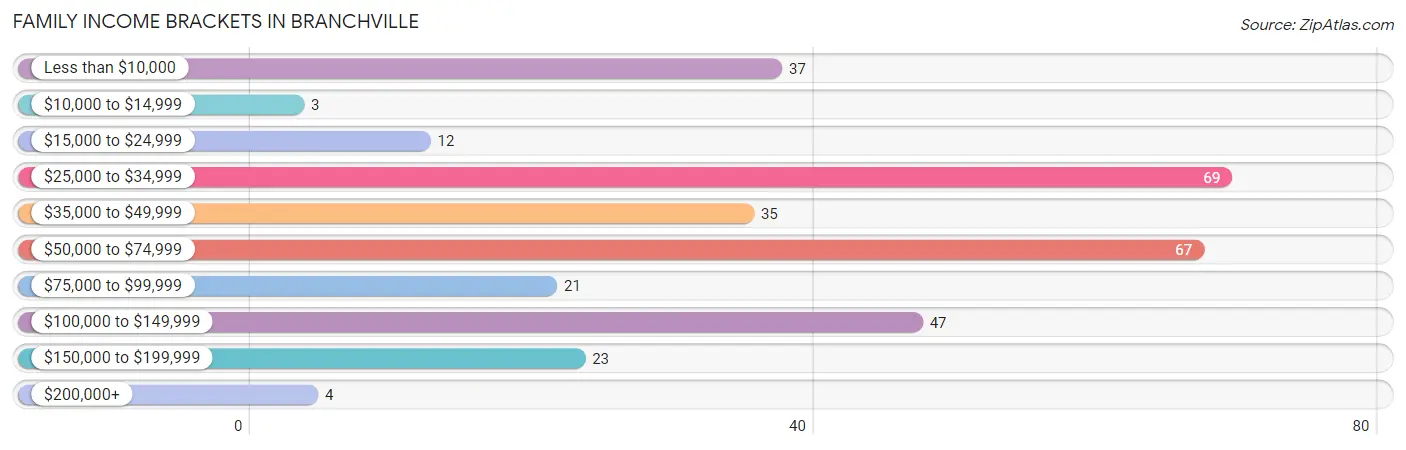
| Income Bracket | # Families | % Families |
| Less than $10,000 | 37 | 11.6% |
| $10,000 to $14,999 | 3 | 0.9% |
| $15,000 to $24,999 | 12 | 3.8% |
| $25,000 to $34,999 | 69 | 21.7% |
| $35,000 to $49,999 | 35 | 11.0% |
| $50,000 to $74,999 | 67 | 21.1% |
| $75,000 to $99,999 | 21 | 6.6% |
| $100,000 to $149,999 | 47 | 14.8% |
| $150,000 to $199,999 | 23 | 7.2% |
| $200,000+ | 4 | 1.3% |
Family Income by Famaliy Size in Branchville
2-person families (176 | 55.3%) account for the highest median family income in Branchville with $33,770 per family, while 2-person families (176 | 55.3%) have the highest median income of $16,885 per family member.
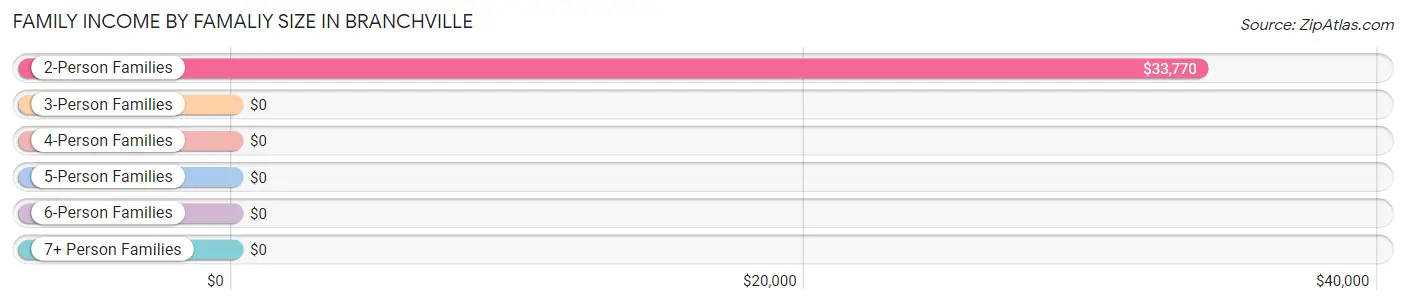
| Income Bracket | # Families | Median Income |
| 2-Person Families | 176 (55.3%) | $33,770 |
| 3-Person Families | 74 (23.3%) | $0 |
| 4-Person Families | 57 (17.9%) | $0 |
| 5-Person Families | 8 (2.5%) | $0 |
| 6-Person Families | 3 (0.9%) | $0 |
| 7+ Person Families | 0 (0.0%) | $0 |
| Total | 318 (100.0%) | $50,500 |
Family Income by Number of Earners in Branchville
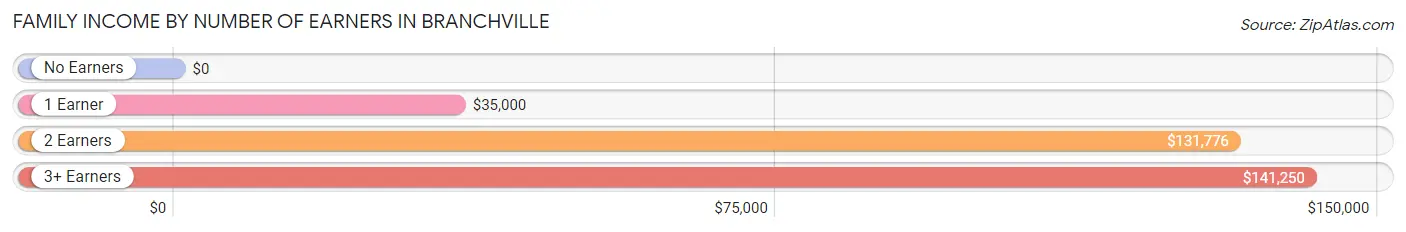
| Number of Earners | # Families | Median Income |
| No Earners | 34 (10.7%) | $0 |
| 1 Earner | 198 (62.3%) | $35,000 |
| 2 Earners | 51 (16.0%) | $131,776 |
| 3+ Earners | 35 (11.0%) | $141,250 |
| Total | 318 (100.0%) | $50,500 |
Household Income in Branchville
Household Income Brackets in Branchville
With 134 households falling in the category, the less than $10,000 income range is the most frequent in Branchville, accounting for 24.3% of all households. In contrast, only 4 households (0.7%) fall into the $200,000+ income bracket, making it the least populous group.
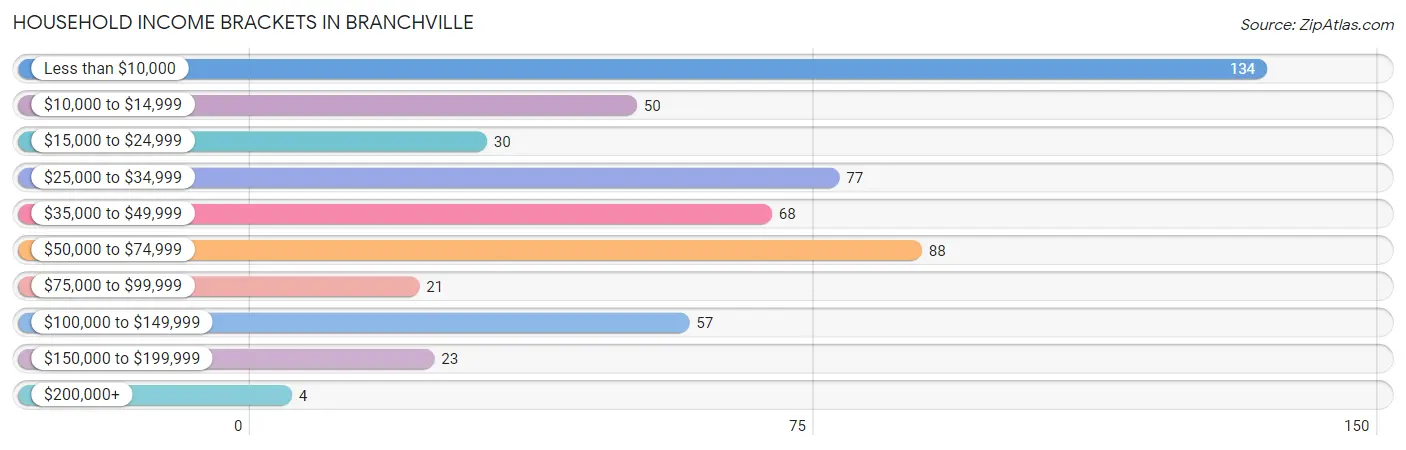
| Income Bracket | # Households | % Households |
| Less than $10,000 | 134 | 24.3% |
| $10,000 to $14,999 | 50 | 9.1% |
| $15,000 to $24,999 | 30 | 5.4% |
| $25,000 to $34,999 | 77 | 13.9% |
| $35,000 to $49,999 | 68 | 12.3% |
| $50,000 to $74,999 | 88 | 15.9% |
| $75,000 to $99,999 | 21 | 3.8% |
| $100,000 to $149,999 | 57 | 10.3% |
| $150,000 to $199,999 | 23 | 4.2% |
| $200,000+ | 4 | 0.7% |
Household Income by Householder Age in Branchville
The median household income in Branchville is $34,486, with the highest median household income of $41,667 found in the 65+ years age bracket for the primary householder. A total of 218 households (39.5%) fall into this category.
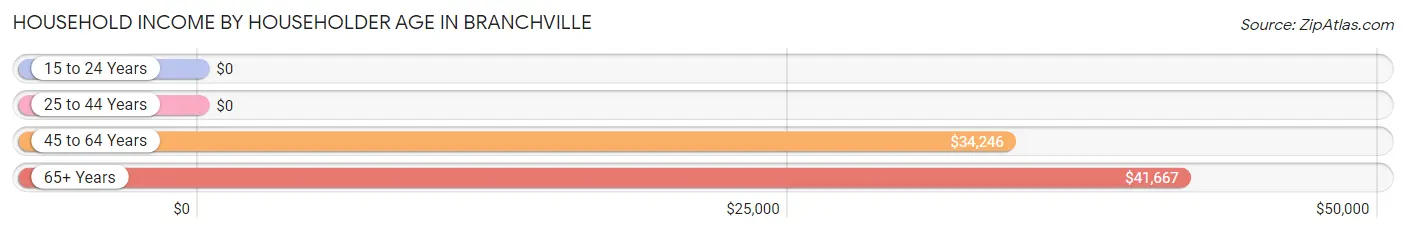
| Income Bracket | # Households | Median Income |
| 15 to 24 Years | 0 (0.0%) | $0 |
| 25 to 44 Years | 134 (24.3%) | $0 |
| 45 to 64 Years | 200 (36.2%) | $34,246 |
| 65+ Years | 218 (39.5%) | $41,667 |
| Total | 552 (100.0%) | $34,486 |
Poverty in Branchville
Income Below Poverty by Sex and Age in Branchville
With 8.0% poverty level for males and 35.5% for females among the residents of Branchville, under 5 year old males and 75 year old and over females are the most vulnerable to poverty, with 18 males (40.0%) and 61 females (58.1%) in their respective age groups living below the poverty level.
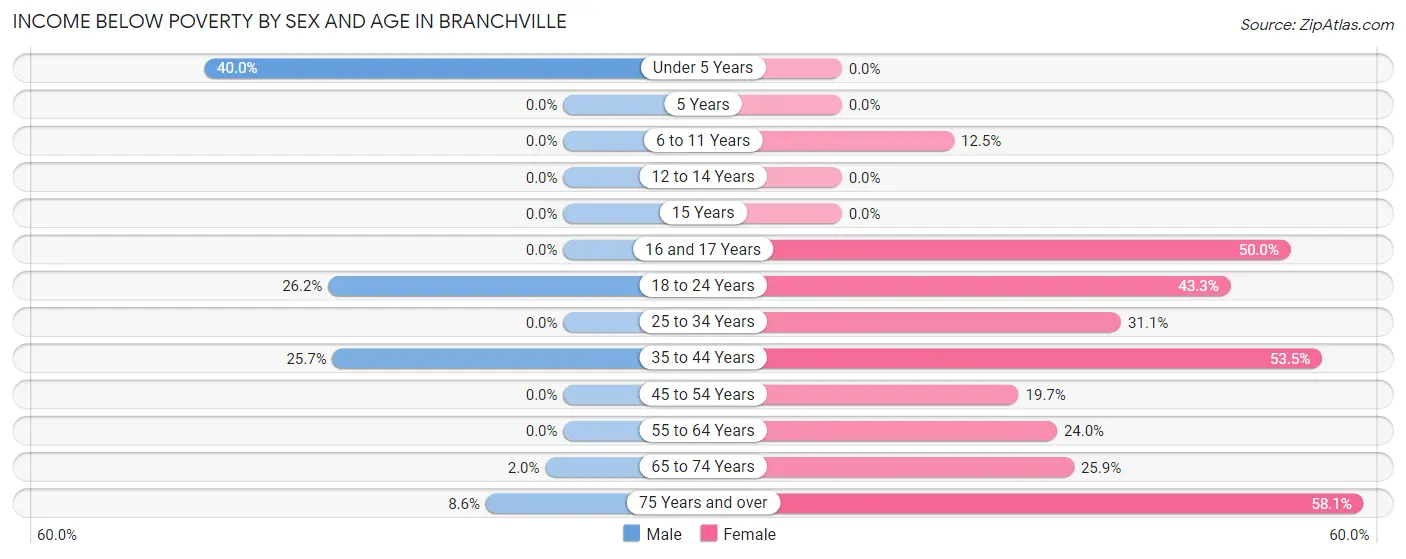
| Age Bracket | Male | Female |
| Under 5 Years | 18 (40.0%) | 0 (0.0%) |
| 5 Years | 0 (0.0%) | 0 (0.0%) |
| 6 to 11 Years | 0 (0.0%) | 2 (12.5%) |
| 12 to 14 Years | 0 (0.0%) | 0 (0.0%) |
| 15 Years | 0 (0.0%) | 0 (0.0%) |
| 16 and 17 Years | 0 (0.0%) | 3 (50.0%) |
| 18 to 24 Years | 11 (26.2%) | 42 (43.3%) |
| 25 to 34 Years | 0 (0.0%) | 28 (31.1%) |
| 35 to 44 Years | 9 (25.7%) | 46 (53.5%) |
| 45 to 54 Years | 0 (0.0%) | 25 (19.7%) |
| 55 to 64 Years | 0 (0.0%) | 23 (24.0%) |
| 65 to 74 Years | 2 (2.0%) | 15 (25.9%) |
| 75 Years and over | 7 (8.6%) | 61 (58.1%) |
| Total | 47 (8.0%) | 245 (35.5%) |
Income Above Poverty by Sex and Age in Branchville
According to the poverty statistics in Branchville, males aged 6 to 11 years and females aged under 5 years are the age groups that are most secure financially, with 100.0% of males and 100.0% of females in these age groups living above the poverty line.
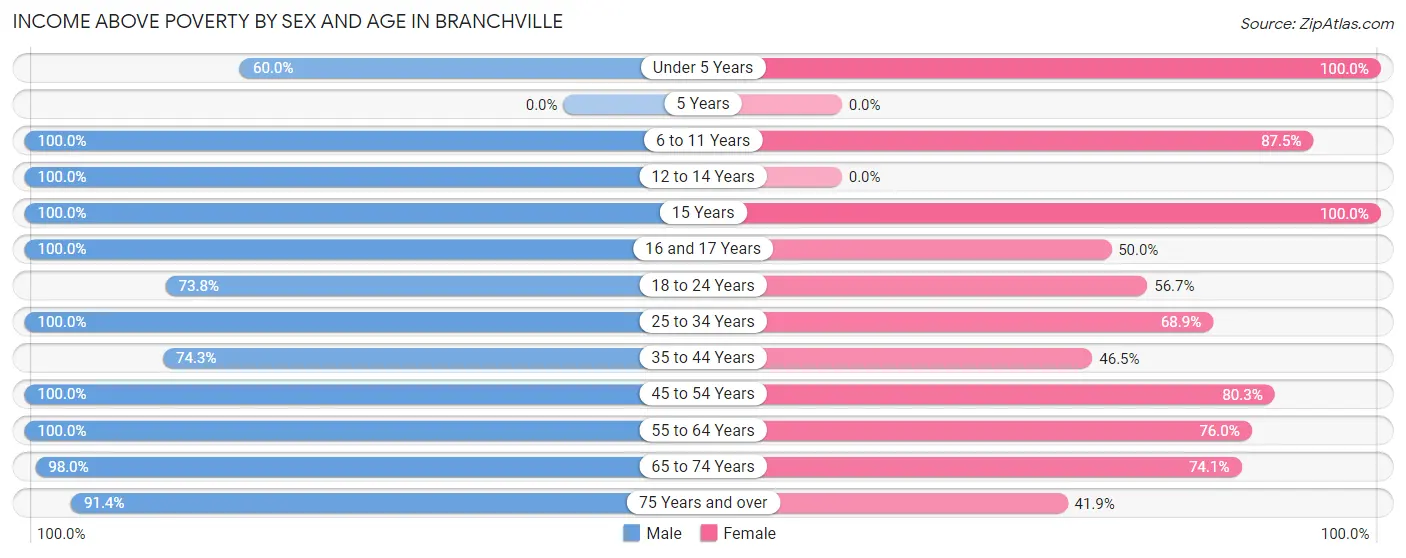
| Age Bracket | Male | Female |
| Under 5 Years | 27 (60.0%) | 6 (100.0%) |
| 5 Years | 0 (0.0%) | 0 (0.0%) |
| 6 to 11 Years | 10 (100.0%) | 14 (87.5%) |
| 12 to 14 Years | 30 (100.0%) | 0 (0.0%) |
| 15 Years | 4 (100.0%) | 3 (100.0%) |
| 16 and 17 Years | 11 (100.0%) | 3 (50.0%) |
| 18 to 24 Years | 31 (73.8%) | 55 (56.7%) |
| 25 to 34 Years | 18 (100.0%) | 62 (68.9%) |
| 35 to 44 Years | 26 (74.3%) | 40 (46.5%) |
| 45 to 54 Years | 79 (100.0%) | 102 (80.3%) |
| 55 to 64 Years | 136 (100.0%) | 73 (76.0%) |
| 65 to 74 Years | 98 (98.0%) | 43 (74.1%) |
| 75 Years and over | 74 (91.4%) | 44 (41.9%) |
| Total | 544 (92.0%) | 445 (64.5%) |
Income Below Poverty Among Married-Couple Families in Branchville
The poverty statistics for married-couple families in Branchville show that 1.3% or 3 of the total 222 families live below the poverty line. Families with no children have the highest poverty rate of 1.7%, comprising of 3 families. On the other hand, families with 1 or 2 children have the lowest poverty rate of 0.0%, which includes 0 families.
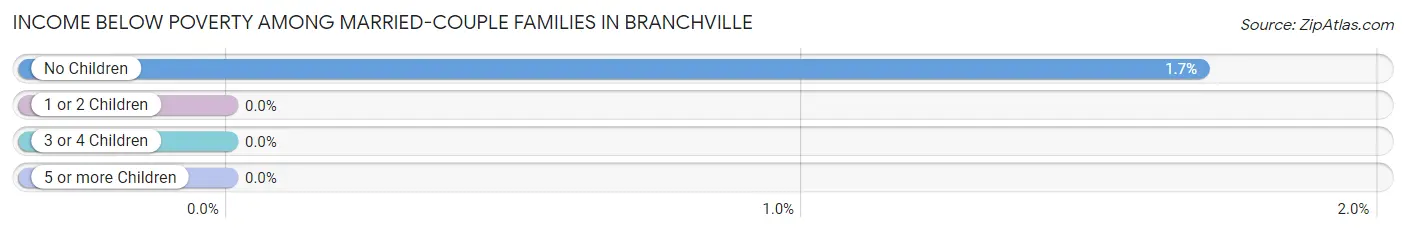
| Children | Above Poverty | Below Poverty |
| No Children | 175 (98.3%) | 3 (1.7%) |
| 1 or 2 Children | 41 (100.0%) | 0 (0.0%) |
| 3 or 4 Children | 3 (100.0%) | 0 (0.0%) |
| 5 or more Children | 0 (0.0%) | 0 (0.0%) |
| Total | 219 (98.7%) | 3 (1.3%) |
Income Below Poverty Among Single-Parent Households in Branchville
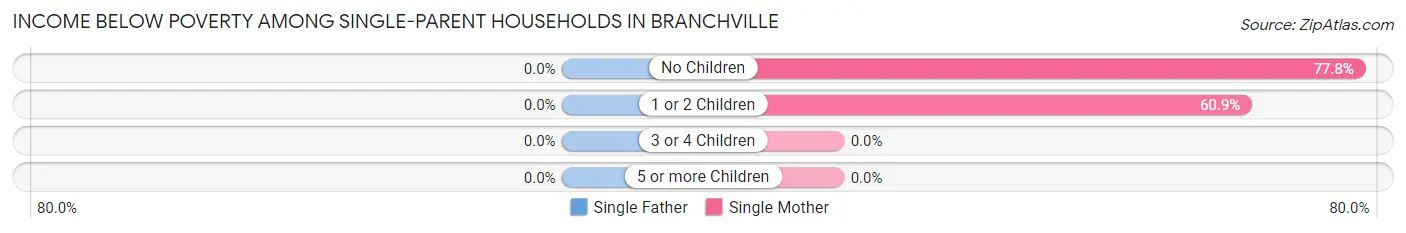
| Children | Single Father | Single Mother |
| No Children | 0 (0.0%) | 35 (77.8%) |
| 1 or 2 Children | 0 (0.0%) | 14 (60.9%) |
| 3 or 4 Children | 0 (0.0%) | 0 (0.0%) |
| 5 or more Children | 0 (0.0%) | 0 (0.0%) |
| Total | 0 (0.0%) | 49 (66.2%) |
Income Below Poverty Among Married-Couple vs Single-Parent Households in Branchville
The poverty data for Branchville shows that 3 of the married-couple family households (1.3%) and 49 of the single-parent households (51.0%) are living below the poverty level. Within the married-couple family households, those with no children have the highest poverty rate, with 3 households (1.7%) falling below the poverty line. Among the single-parent households, those with no children have the highest poverty rate, with 35 household (54.7%) living below poverty.
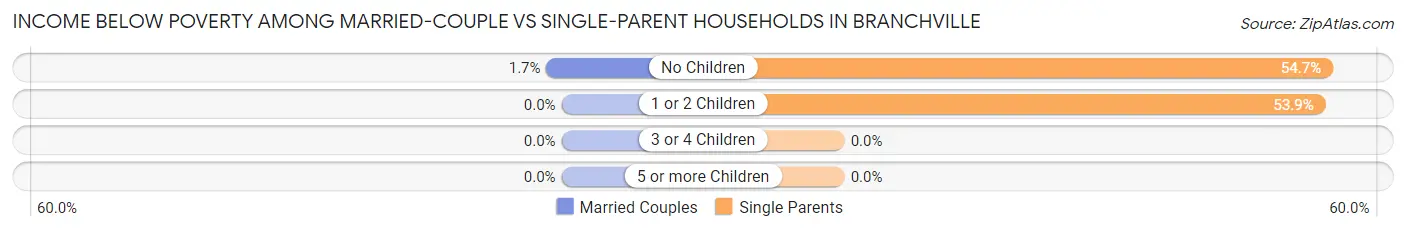
| Children | Married-Couple Families | Single-Parent Households |
| No Children | 3 (1.7%) | 35 (54.7%) |
| 1 or 2 Children | 0 (0.0%) | 14 (53.8%) |
| 3 or 4 Children | 0 (0.0%) | 0 (0.0%) |
| 5 or more Children | 0 (0.0%) | 0 (0.0%) |
| Total | 3 (1.3%) | 49 (51.0%) |
Race in Branchville
The most populous races in Branchville are White / Caucasian (718 | 55.2%), Black / African American (533 | 41.0%), and Hispanic or Latino (34 | 2.6%).
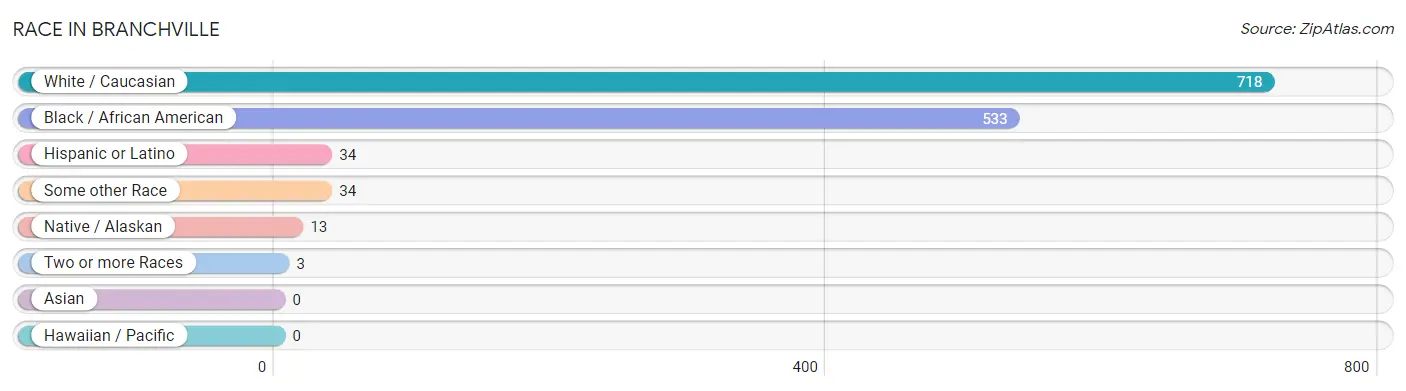
| Race | # Population | % Population |
| Asian | 0 | 0.0% |
| Black / African American | 533 | 41.0% |
| Hawaiian / Pacific | 0 | 0.0% |
| Hispanic or Latino | 34 | 2.6% |
| Native / Alaskan | 13 | 1.0% |
| White / Caucasian | 718 | 55.2% |
| Two or more Races | 3 | 0.2% |
| Some other Race | 34 | 2.6% |
| Total | 1,301 | 100.0% |
Ancestry in Branchville
The most populous ancestries reported in Branchville are Swiss (62 | 4.8%), German (58 | 4.5%), English (52 | 4.0%), British (41 | 3.2%), and Scottish (35 | 2.7%), together accounting for 19.1% of all Branchville residents.
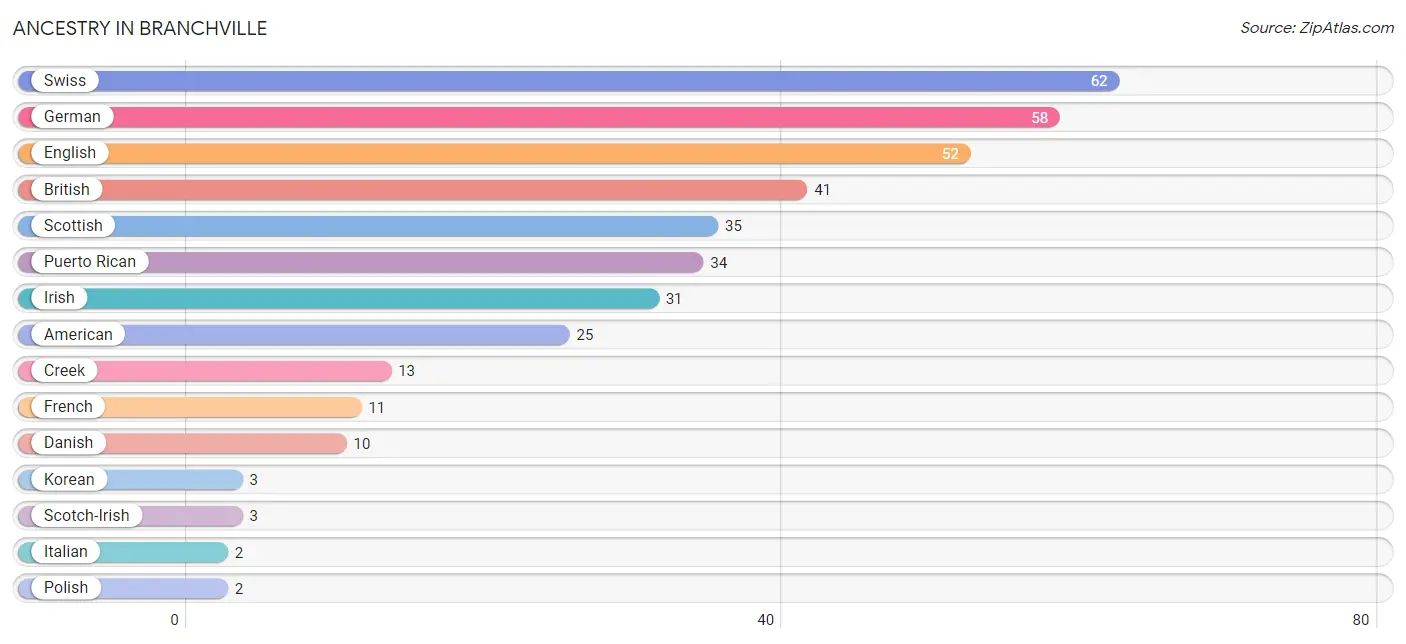
| Ancestry | # Population | % Population |
| American | 25 | 1.9% |
| British | 41 | 3.2% |
| Creek | 13 | 1.0% |
| Danish | 10 | 0.8% |
| English | 52 | 4.0% |
| French | 11 | 0.9% |
| German | 58 | 4.5% |
| Irish | 31 | 2.4% |
| Italian | 2 | 0.2% |
| Korean | 3 | 0.2% |
| Polish | 2 | 0.2% |
| Puerto Rican | 34 | 2.6% |
| Scotch-Irish | 3 | 0.2% |
| Scottish | 35 | 2.7% |
| Swiss | 62 | 4.8% | View All 15 Rows |
Immigrants in Branchville

| Immigration Origin | # Population | % Population | View All 0 Rows |
Sex and Age in Branchville
Sex and Age in Branchville
The most populous age groups in Branchville are 60 to 64 Years (106 | 17.6%) for men and 75 to 79 Years (97 | 13.9%) for women.
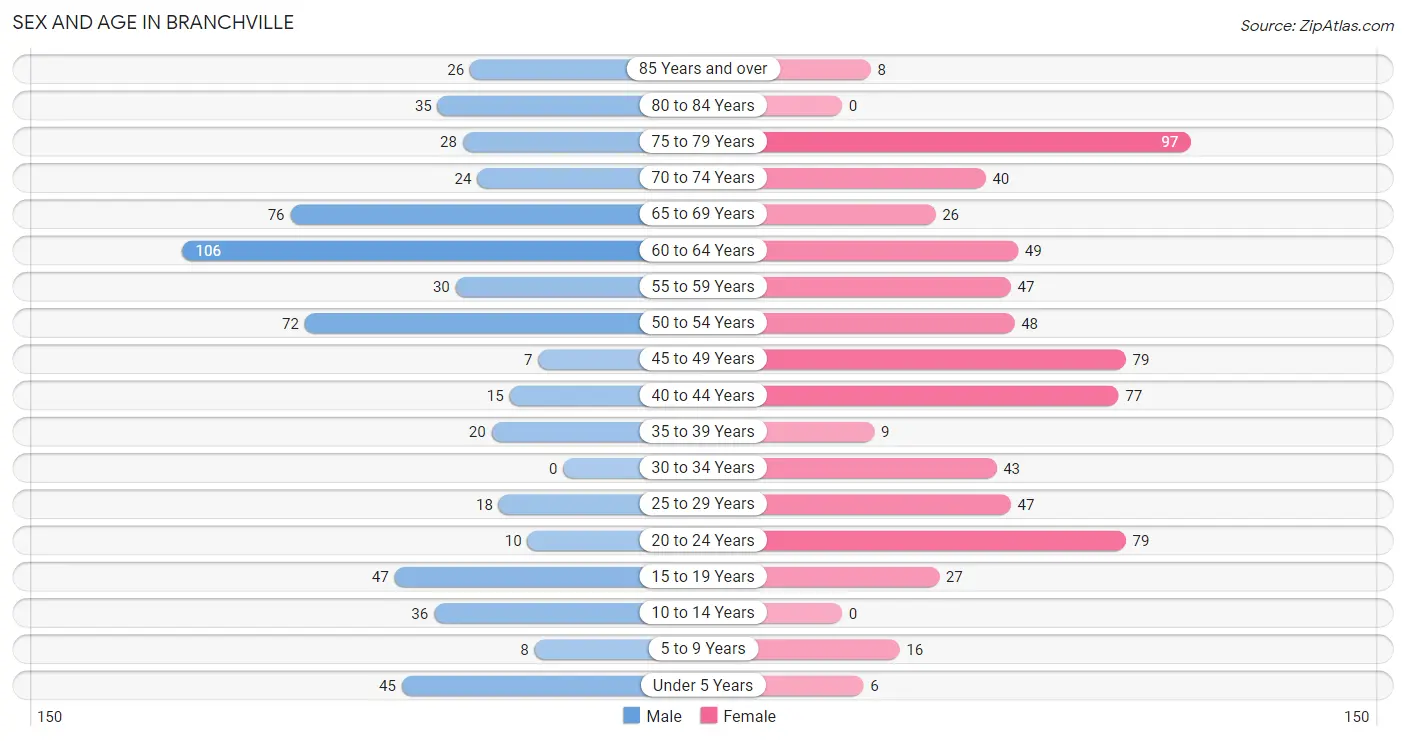
| Age Bracket | Male | Female |
| Under 5 Years | 45 (7.5%) | 6 (0.9%) |
| 5 to 9 Years | 8 (1.3%) | 16 (2.3%) |
| 10 to 14 Years | 36 (6.0%) | 0 (0.0%) |
| 15 to 19 Years | 47 (7.8%) | 27 (3.9%) |
| 20 to 24 Years | 10 (1.7%) | 79 (11.3%) |
| 25 to 29 Years | 18 (3.0%) | 47 (6.7%) |
| 30 to 34 Years | 0 (0.0%) | 43 (6.2%) |
| 35 to 39 Years | 20 (3.3%) | 9 (1.3%) |
| 40 to 44 Years | 15 (2.5%) | 77 (11.0%) |
| 45 to 49 Years | 7 (1.2%) | 79 (11.3%) |
| 50 to 54 Years | 72 (11.9%) | 48 (6.9%) |
| 55 to 59 Years | 30 (5.0%) | 47 (6.7%) |
| 60 to 64 Years | 106 (17.6%) | 49 (7.0%) |
| 65 to 69 Years | 76 (12.6%) | 26 (3.7%) |
| 70 to 74 Years | 24 (4.0%) | 40 (5.7%) |
| 75 to 79 Years | 28 (4.6%) | 97 (13.9%) |
| 80 to 84 Years | 35 (5.8%) | 0 (0.0%) |
| 85 Years and over | 26 (4.3%) | 8 (1.1%) |
| Total | 603 (100.0%) | 698 (100.0%) |
Families and Households in Branchville
Median Family Size in Branchville
The median family size in Branchville is 3.20 persons per family, with single male/father families (22 | 6.9%) accounting for the largest median family size of 3.45 persons per family. On the other hand, single female/mother families (74 | 23.3%) represent the smallest median family size with 2.80 persons per family.
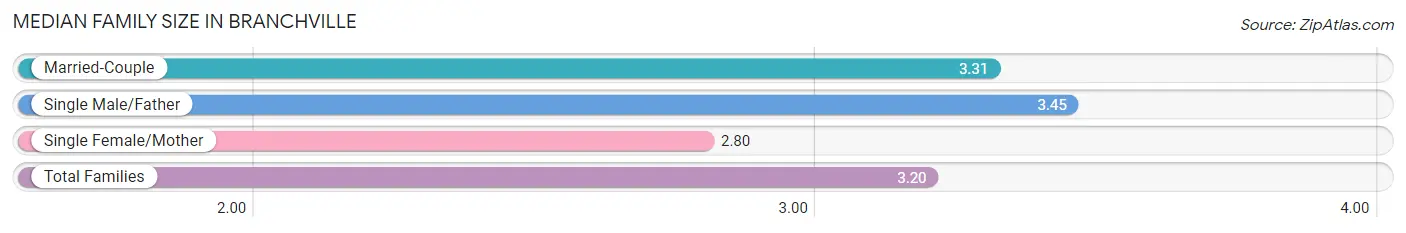
| Family Type | # Families | Family Size |
| Married-Couple | 222 (69.8%) | 3.31 |
| Single Male/Father | 22 (6.9%) | 3.45 |
| Single Female/Mother | 74 (23.3%) | 2.80 |
| Total Families | 318 (100.0%) | 3.20 |
Median Household Size in Branchville
The median household size in Branchville is 2.33 persons per household, with single male/father households (22 | 4.0%) accounting for the largest median household size of 3.45 persons per household. non-family households (234 | 42.4%) represent the smallest median household size with 1.12 persons per household.
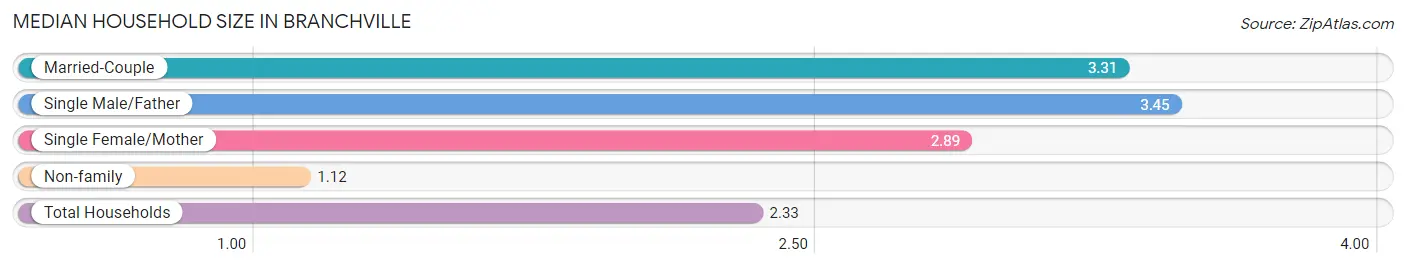
| Household Type | # Households | Household Size |
| Married-Couple | 222 (40.2%) | 3.31 |
| Single Male/Father | 22 (4.0%) | 3.45 |
| Single Female/Mother | 74 (13.4%) | 2.89 |
| Non-family | 234 (42.4%) | 1.12 |
| Total Households | 552 (100.0%) | 2.33 |
Household Size by Marriage Status in Branchville
Out of a total of 552 households in Branchville, 318 (57.6%) are family households, while 234 (42.4%) are nonfamily households. The most numerous type of family households are 2-person households, comprising 171, and the most common type of nonfamily households are 1-person households, comprising 209.
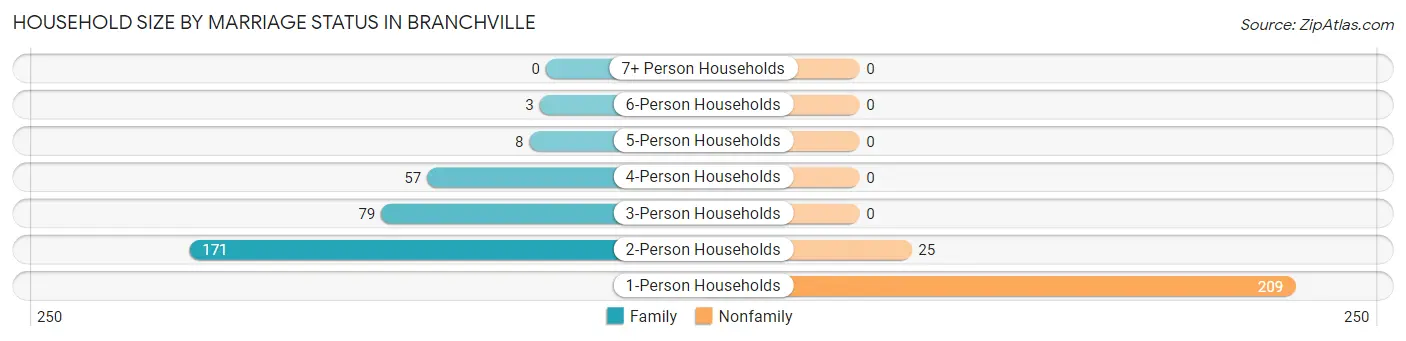
| Household Size | Family Households | Nonfamily Households |
| 1-Person Households | - | 209 (37.9%) |
| 2-Person Households | 171 (31.0%) | 25 (4.5%) |
| 3-Person Households | 79 (14.3%) | 0 (0.0%) |
| 4-Person Households | 57 (10.3%) | 0 (0.0%) |
| 5-Person Households | 8 (1.5%) | 0 (0.0%) |
| 6-Person Households | 3 (0.5%) | 0 (0.0%) |
| 7+ Person Households | 0 (0.0%) | 0 (0.0%) |
| Total | 318 (57.6%) | 234 (42.4%) |
Female Fertility in Branchville
Fertility by Age in Branchville
Average fertility rate in Branchville is 98.0 births per 1,000 women. Women in the age bracket of 20 to 34 years have the highest fertility rate with 219.0 births per 1,000 women. Women in the age bracket of 20 to 34 years acount for 100.0% of all women with births.
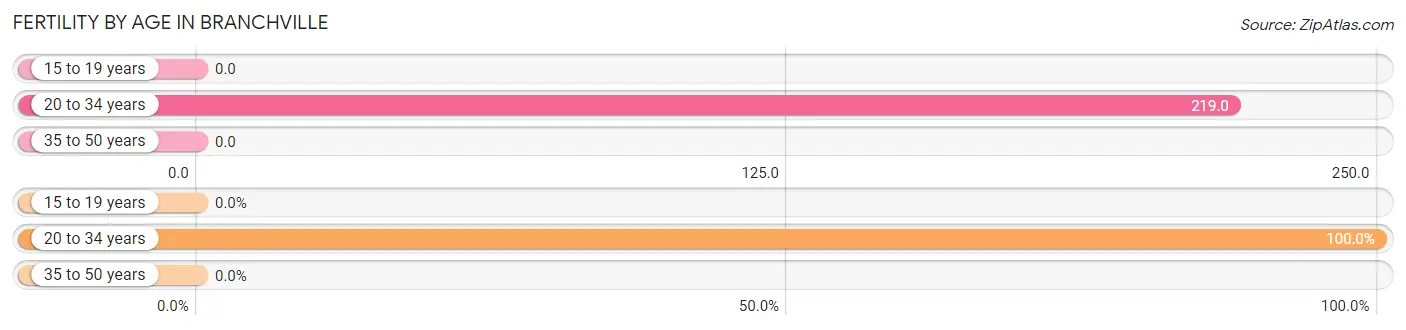
| Age Bracket | Women with Births | Births / 1,000 Women |
| 15 to 19 years | 0 (0.0%) | 0.0 |
| 20 to 34 years | 37 (100.0%) | 219.0 |
| 35 to 50 years | 0 (0.0%) | 0.0 |
| Total | 37 (100.0%) | 98.0 |
Fertility by Age by Marriage Status in Branchville
73.0% of women with births (37) in Branchville are married. The highest percentage of unmarried women with births falls into 20 to 34 years age bracket with 27.0% of them unmarried at the time of birth, while the lowest percentage of unmarried women with births belong to 20 to 34 years age bracket with 27.0% of them unmarried.
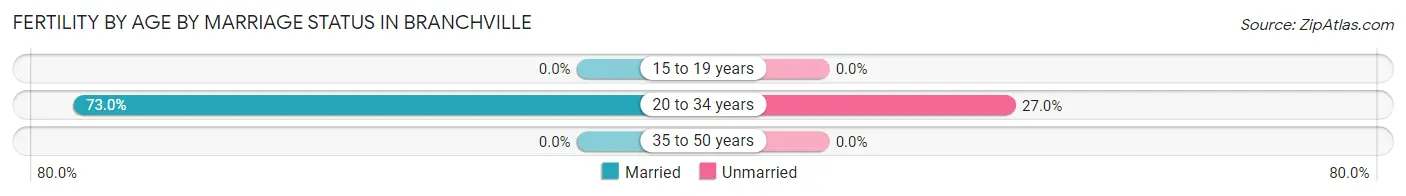
| Age Bracket | Married | Unmarried |
| 15 to 19 years | 0 (0.0%) | 0 (0.0%) |
| 20 to 34 years | 27 (73.0%) | 10 (27.0%) |
| 35 to 50 years | 0 (0.0%) | 0 (0.0%) |
| Total | 27 (73.0%) | 10 (27.0%) |
Fertility by Education in Branchville
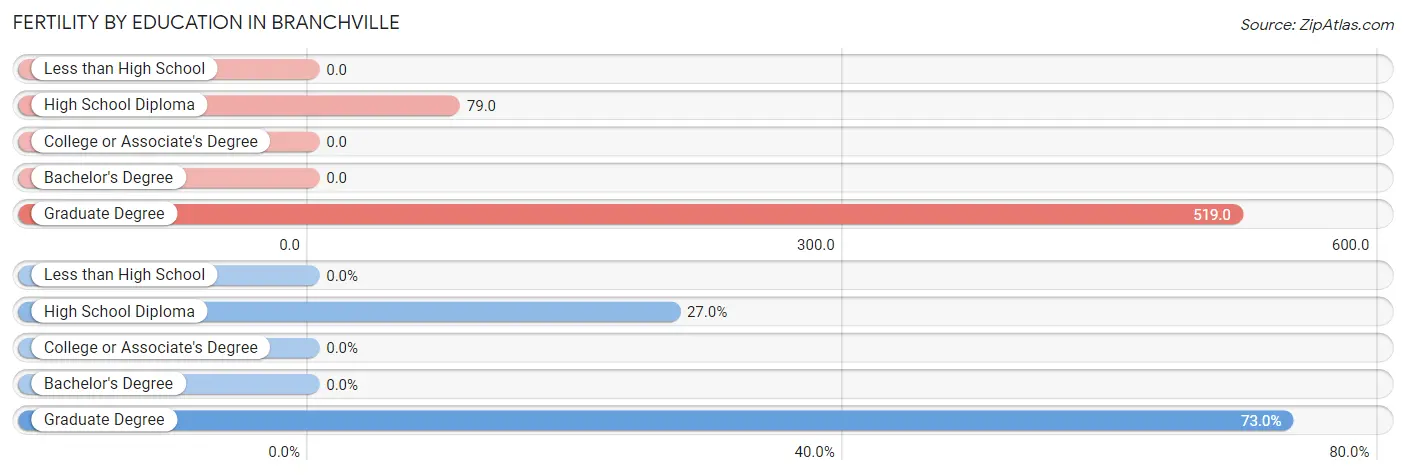
| Educational Attainment | Women with Births | Births / 1,000 Women |
| Less than High School | 0 (0.0%) | 0.0 |
| High School Diploma | 10 (27.0%) | 79.0 |
| College or Associate's Degree | 0 (0.0%) | 0.0 |
| Bachelor's Degree | 0 (0.0%) | 0.0 |
| Graduate Degree | 27 (73.0%) | 519.0 |
| Total | 37 (100.0%) | 98.0 |
Fertility by Education by Marriage Status in Branchville
27.0% of women with births in Branchville are unmarried. Women with the educational attainment of graduate degree are most likely to be married with 100.0% of them married at childbirth, while women with the educational attainment of high school diploma are least likely to be married with 100.0% of them unmarried at childbirth.
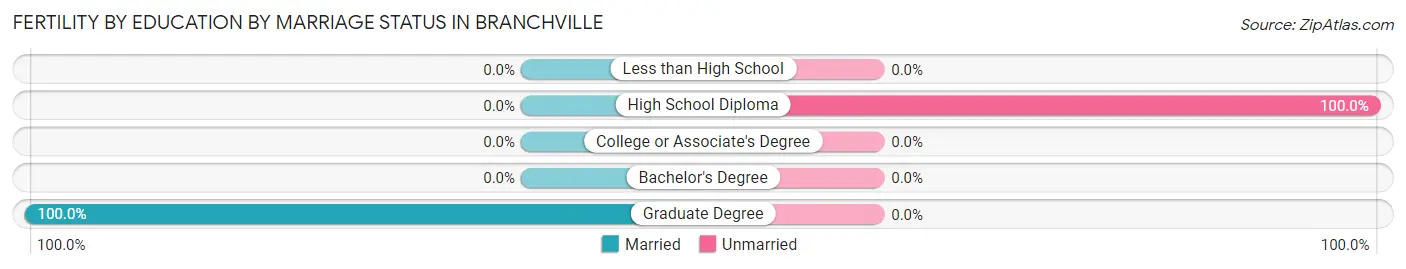
| Educational Attainment | Married | Unmarried |
| Less than High School | 0 (0.0%) | 0 (0.0%) |
| High School Diploma | 0 (0.0%) | 10 (100.0%) |
| College or Associate's Degree | 0 (0.0%) | 0 (0.0%) |
| Bachelor's Degree | 0 (0.0%) | 0 (0.0%) |
| Graduate Degree | 27 (100.0%) | 0 (0.0%) |
| Total | 27 (73.0%) | 10 (27.0%) |
Employment Characteristics in Branchville
Employment by Class of Employer in Branchville
Among the 510 employed individuals in Branchville, private company employees (374 | 73.3%), not-for-profit organizations (80 | 15.7%), and state government employees (25 | 4.9%) make up the most common classes of employment.
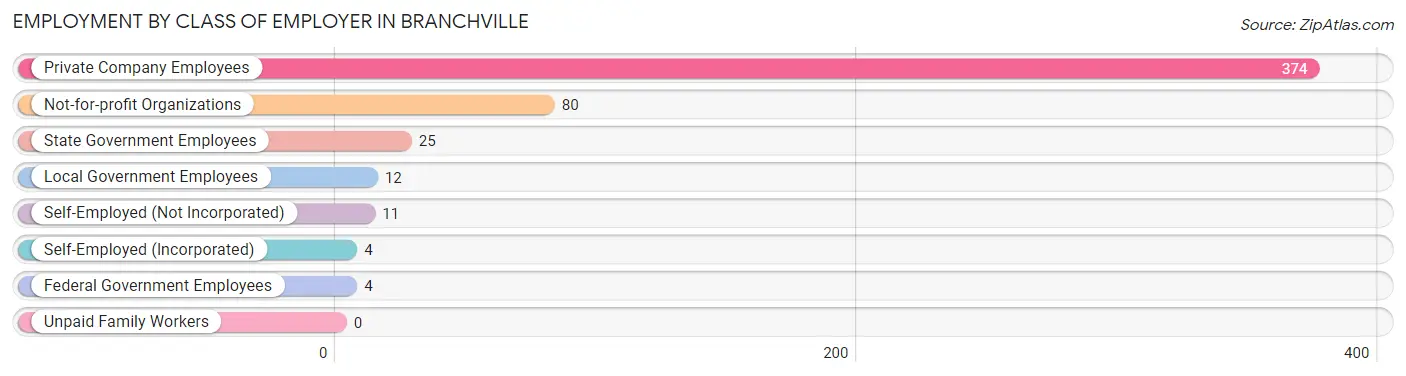
| Employer Class | # Employees | % Employees |
| Private Company Employees | 374 | 73.3% |
| Self-Employed (Incorporated) | 4 | 0.8% |
| Self-Employed (Not Incorporated) | 11 | 2.2% |
| Not-for-profit Organizations | 80 | 15.7% |
| Local Government Employees | 12 | 2.4% |
| State Government Employees | 25 | 4.9% |
| Federal Government Employees | 4 | 0.8% |
| Unpaid Family Workers | 0 | 0.0% |
| Total | 510 | 100.0% |
Employment Status by Age in Branchville
According to the labor force statistics for Branchville, out of the total population over 16 years of age (1,183), 50.5% or 597 individuals are in the labor force, with 10.9% or 65 of them unemployed. The age group with the highest labor force participation rate is 30 to 34 years, with 100.0% or 43 individuals in the labor force. Within the labor force, the 65 to 74 years age range has the highest percentage of unemployed individuals, with 50.7% or 34 of them being unemployed.

| Age Bracket | In Labor Force | Unemployed |
| 16 to 19 Years | 38 (56.7%) | 7 (18.4%) |
| 20 to 24 Years | 52 (58.4%) | 10 (19.2%) |
| 25 to 29 Years | 46 (70.8%) | 0 (0.0%) |
| 30 to 34 Years | 43 (100.0%) | 0 (0.0%) |
| 35 to 44 Years | 79 (65.3%) | 0 (0.0%) |
| 45 to 54 Years | 109 (52.9%) | 0 (0.0%) |
| 55 to 59 Years | 47 (61.0%) | 14 (29.8%) |
| 60 to 64 Years | 110 (71.0%) | 0 (0.0%) |
| 65 to 74 Years | 67 (40.4%) | 34 (50.7%) |
| 75 Years and over | 7 (3.6%) | 0 (0.0%) |
| Total | 597 (50.5%) | 65 (10.9%) |
Employment Status by Educational Attainment in Branchville
According to labor force statistics for Branchville, 65.1% of individuals (434) out of the total population between 25 and 64 years of age (667) are in the labor force, with 3.2% or 14 of them being unemployed. The group with the highest labor force participation rate are those with the educational attainment of bachelor's degree or higher, with 73.9% or 99 individuals in the labor force. Within the labor force, individuals with bachelor's degree or higher education have the highest percentage of unemployment, with 14.1% or 14 of them being unemployed.
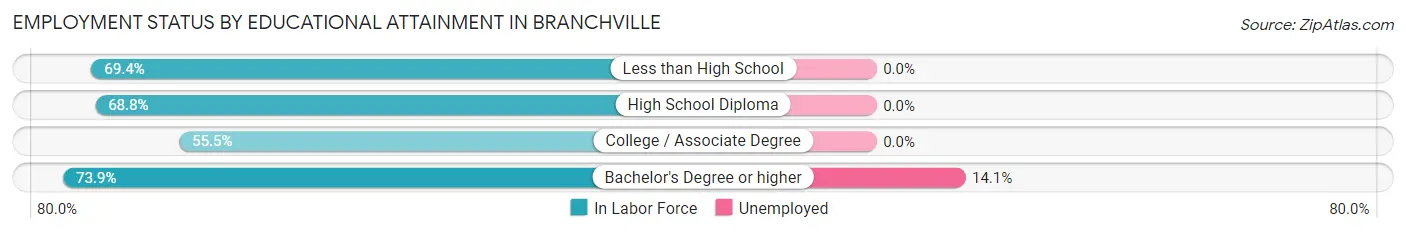
| Educational Attainment | In Labor Force | Unemployed |
| Less than High School | 102 (69.4%) | 0 (0.0%) |
| High School Diploma | 97 (68.8%) | 0 (0.0%) |
| College / Associate Degree | 136 (55.5%) | 0 (0.0%) |
| Bachelor's Degree or higher | 99 (73.9%) | 19 (14.1%) |
| Total | 434 (65.1%) | 21 (3.2%) |
Employment Occupations by Sex in Branchville
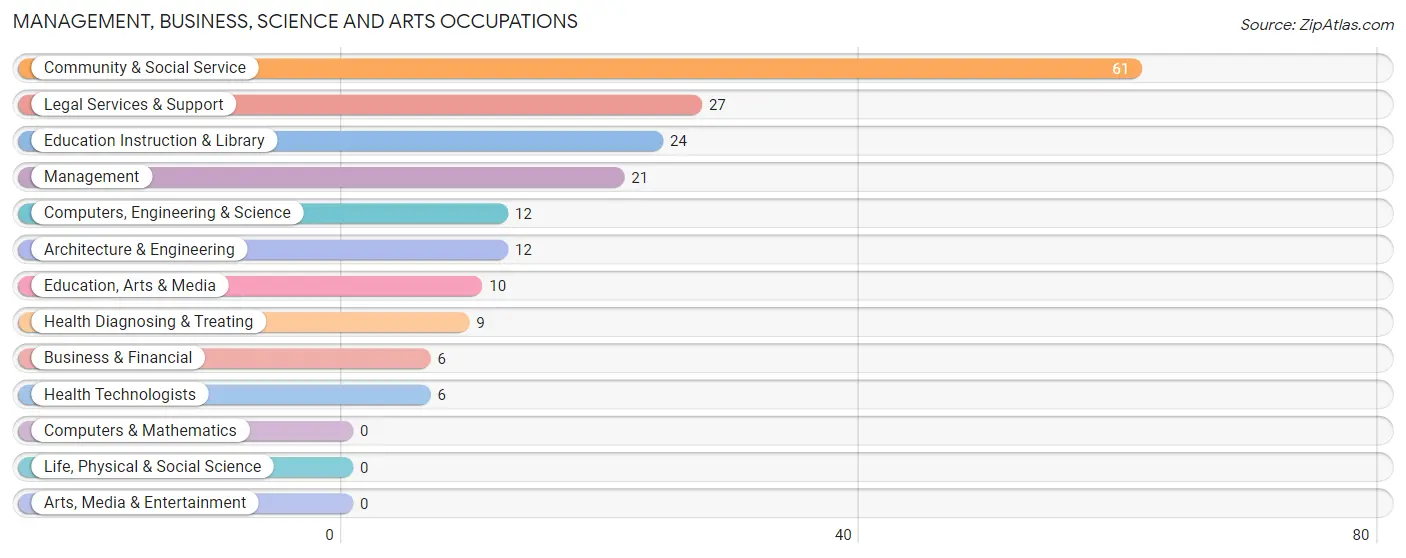
Management, Business, Science and Arts Occupations
The most common Management, Business, Science and Arts occupations in Branchville are Community & Social Service (61 | 11.4%), Legal Services & Support (27 | 5.1%), Education Instruction & Library (24 | 4.5%), Management (21 | 3.9%), and Computers, Engineering & Science (12 | 2.2%).
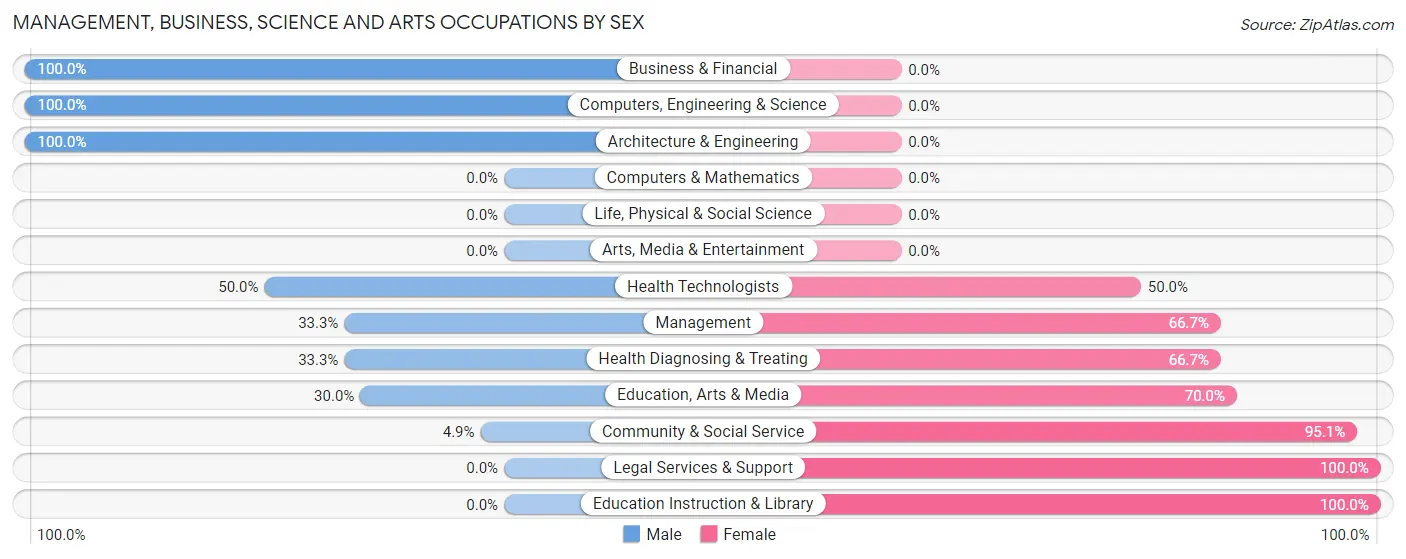
Management, Business, Science and Arts Occupations by Sex
Within the Management, Business, Science and Arts occupations in Branchville, the most male-oriented occupations are Business & Financial (100.0%), Computers, Engineering & Science (100.0%), and Architecture & Engineering (100.0%), while the most female-oriented occupations are Legal Services & Support (100.0%), Education Instruction & Library (100.0%), and Community & Social Service (95.1%).
| Occupation | Male | Female |
| Management | 7 (33.3%) | 14 (66.7%) |
| Business & Financial | 6 (100.0%) | 0 (0.0%) |
| Computers, Engineering & Science | 12 (100.0%) | 0 (0.0%) |
| Computers & Mathematics | 0 (0.0%) | 0 (0.0%) |
| Architecture & Engineering | 12 (100.0%) | 0 (0.0%) |
| Life, Physical & Social Science | 0 (0.0%) | 0 (0.0%) |
| Community & Social Service | 3 (4.9%) | 58 (95.1%) |
| Education, Arts & Media | 3 (30.0%) | 7 (70.0%) |
| Legal Services & Support | 0 (0.0%) | 27 (100.0%) |
| Education Instruction & Library | 0 (0.0%) | 24 (100.0%) |
| Arts, Media & Entertainment | 0 (0.0%) | 0 (0.0%) |
| Health Diagnosing & Treating | 3 (33.3%) | 6 (66.7%) |
| Health Technologists | 3 (50.0%) | 3 (50.0%) |
| Total (Category) | 31 (28.4%) | 78 (71.6%) |
| Total (Overall) | 278 (52.2%) | 255 (47.8%) |
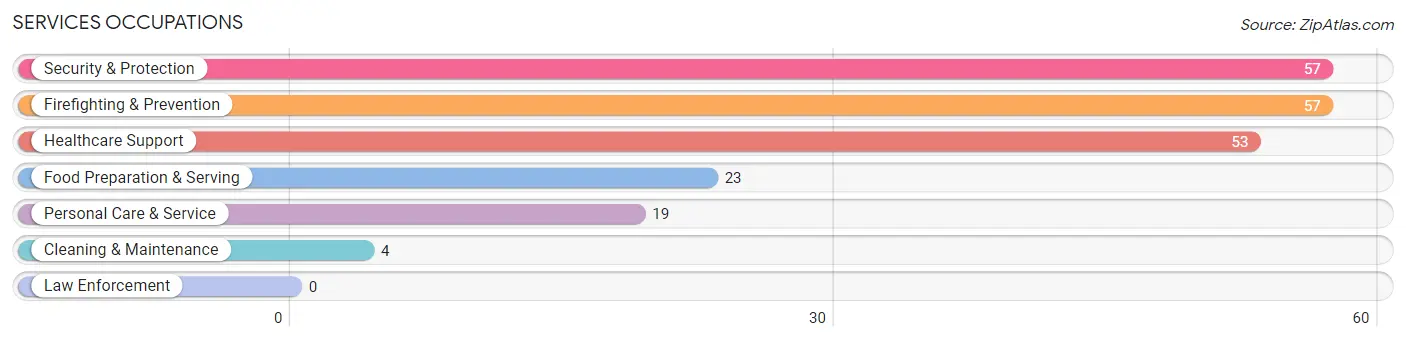
Services Occupations
The most common Services occupations in Branchville are Security & Protection (57 | 10.7%), Firefighting & Prevention (57 | 10.7%), Healthcare Support (53 | 9.9%), Food Preparation & Serving (23 | 4.3%), and Personal Care & Service (19 | 3.6%).
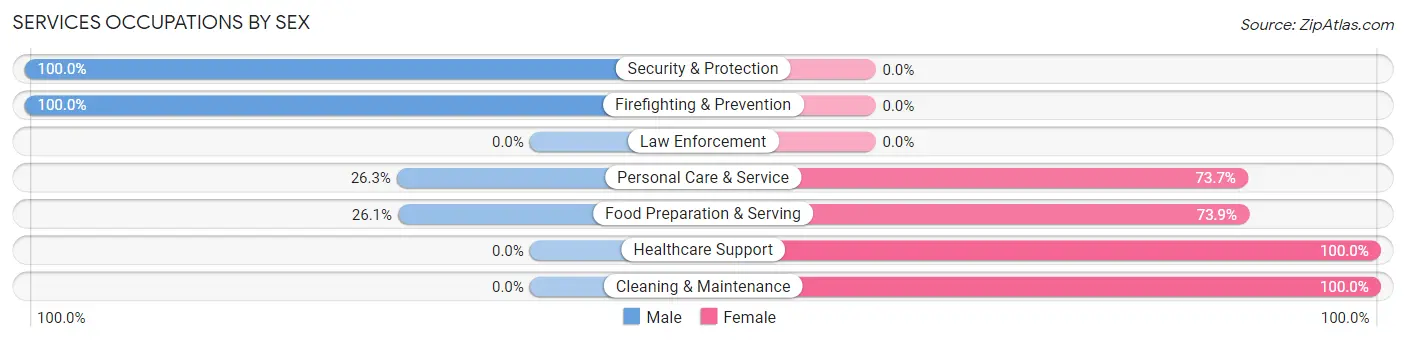
Services Occupations by Sex
Within the Services occupations in Branchville, the most male-oriented occupations are Security & Protection (100.0%), Firefighting & Prevention (100.0%), and Personal Care & Service (26.3%), while the most female-oriented occupations are Healthcare Support (100.0%), Cleaning & Maintenance (100.0%), and Food Preparation & Serving (73.9%).
| Occupation | Male | Female |
| Healthcare Support | 0 (0.0%) | 53 (100.0%) |
| Security & Protection | 57 (100.0%) | 0 (0.0%) |
| Firefighting & Prevention | 57 (100.0%) | 0 (0.0%) |
| Law Enforcement | 0 (0.0%) | 0 (0.0%) |
| Food Preparation & Serving | 6 (26.1%) | 17 (73.9%) |
| Cleaning & Maintenance | 0 (0.0%) | 4 (100.0%) |
| Personal Care & Service | 5 (26.3%) | 14 (73.7%) |
| Total (Category) | 68 (43.6%) | 88 (56.4%) |
| Total (Overall) | 278 (52.2%) | 255 (47.8%) |
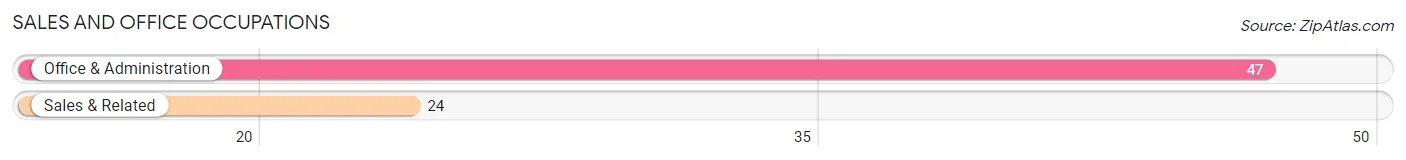
Sales and Office Occupations
The most common Sales and Office occupations in Branchville are Office & Administration (47 | 8.8%), and Sales & Related (24 | 4.5%).
Sales and Office Occupations by Sex
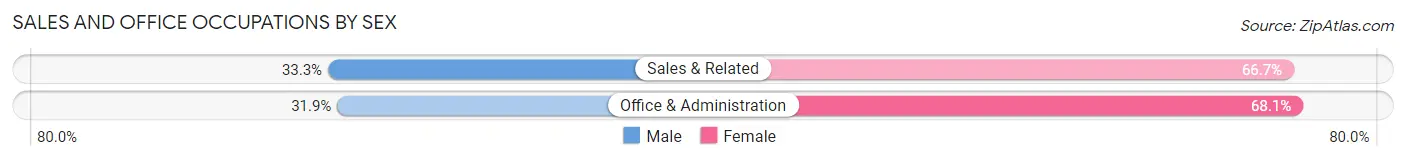
| Occupation | Male | Female |
| Sales & Related | 8 (33.3%) | 16 (66.7%) |
| Office & Administration | 15 (31.9%) | 32 (68.1%) |
| Total (Category) | 23 (32.4%) | 48 (67.6%) |
| Total (Overall) | 278 (52.2%) | 255 (47.8%) |
Natural Resources, Construction and Maintenance Occupations
The most common Natural Resources, Construction and Maintenance occupations in Branchville are Installation, Maintenance & Repair (37 | 6.9%), and Construction & Extraction (29 | 5.4%).
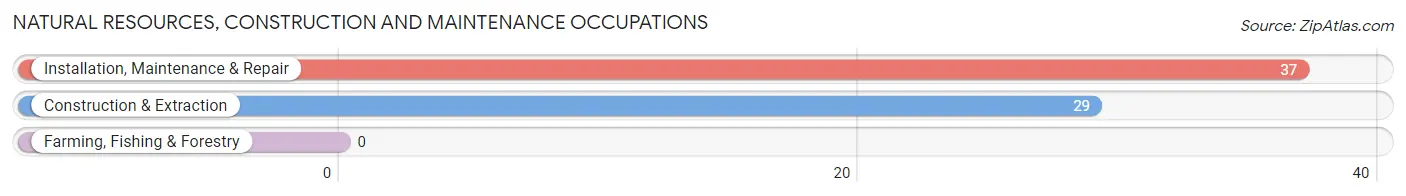
Natural Resources, Construction and Maintenance Occupations by Sex

| Occupation | Male | Female |
| Farming, Fishing & Forestry | 0 (0.0%) | 0 (0.0%) |
| Construction & Extraction | 18 (62.1%) | 11 (37.9%) |
| Installation, Maintenance & Repair | 37 (100.0%) | 0 (0.0%) |
| Total (Category) | 55 (83.3%) | 11 (16.7%) |
| Total (Overall) | 278 (52.2%) | 255 (47.8%) |
Production, Transportation and Moving Occupations
The most common Production, Transportation and Moving occupations in Branchville are Production (123 | 23.1%), Material Moving (5 | 0.9%), and Transportation (3 | 0.6%).
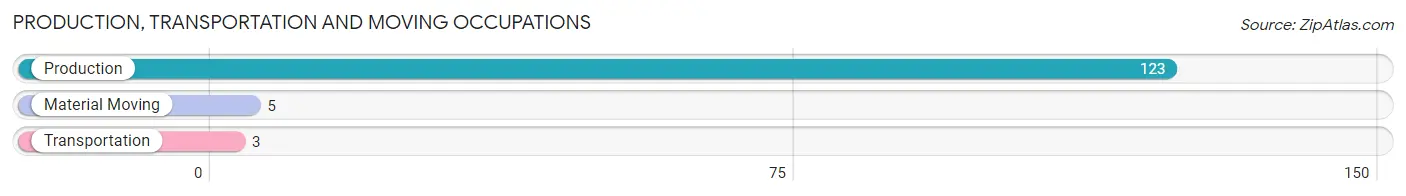
Production, Transportation and Moving Occupations by Sex
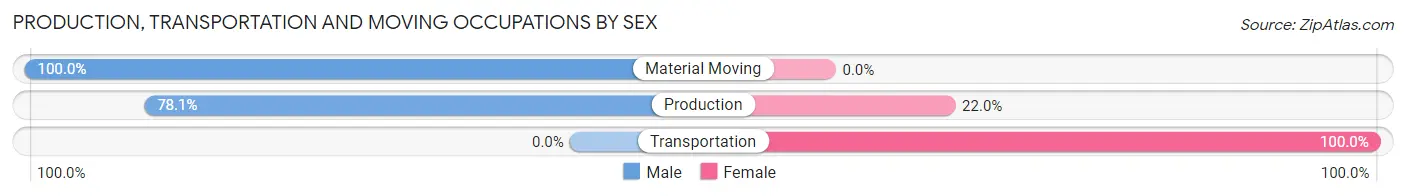
| Occupation | Male | Female |
| Production | 96 (78.0%) | 27 (22.0%) |
| Transportation | 0 (0.0%) | 3 (100.0%) |
| Material Moving | 5 (100.0%) | 0 (0.0%) |
| Total (Category) | 101 (77.1%) | 30 (22.9%) |
| Total (Overall) | 278 (52.2%) | 255 (47.8%) |
Employment Industries by Sex in Branchville
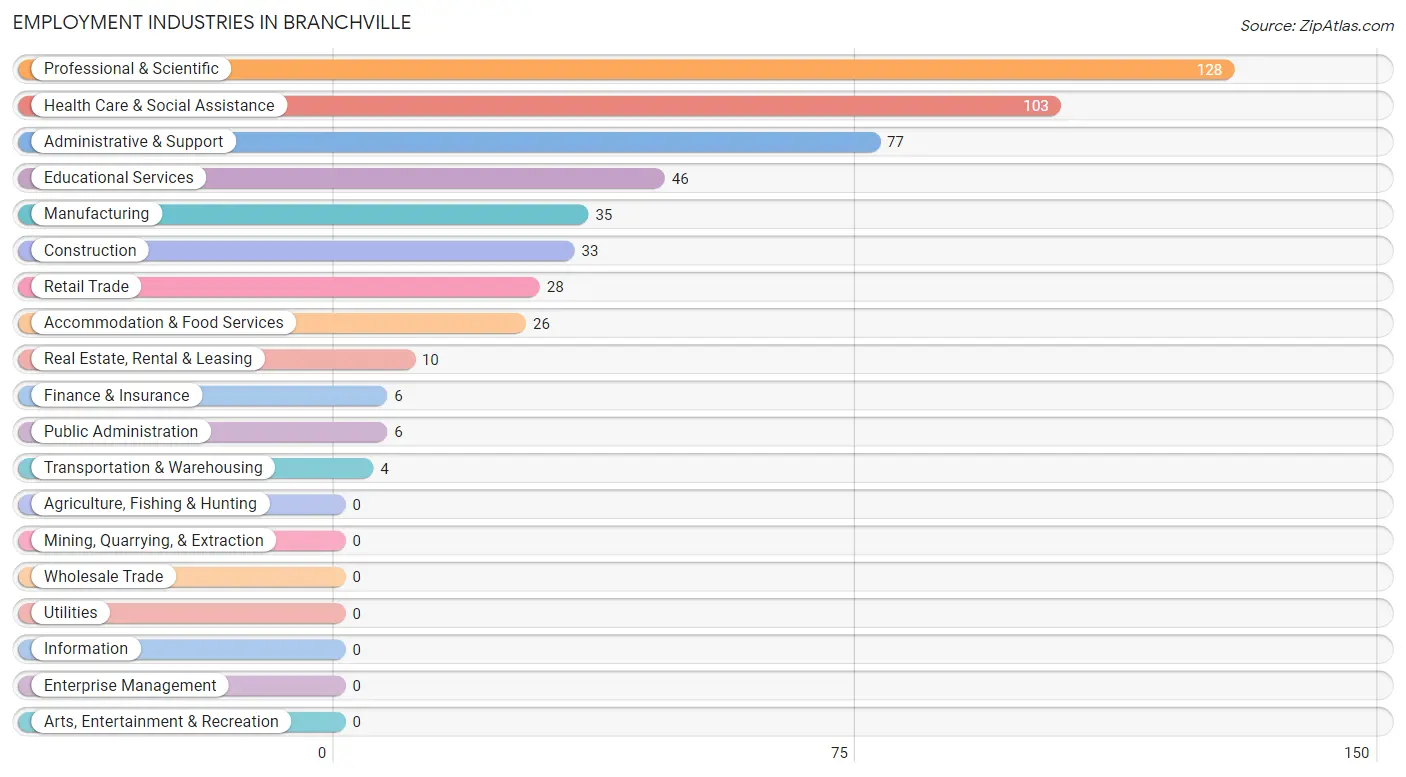
Employment Industries in Branchville
The major employment industries in Branchville include Professional & Scientific (128 | 24.0%), Health Care & Social Assistance (103 | 19.3%), Administrative & Support (77 | 14.4%), Educational Services (46 | 8.6%), and Manufacturing (35 | 6.6%).
Employment Industries by Sex in Branchville
The Branchville industries that see more men than women are Professional & Scientific (78.9%), Administrative & Support (74.0%), and Construction (66.7%), whereas the industries that tend to have a higher number of women are Transportation & Warehousing (100.0%), Finance & Insurance (100.0%), and Real Estate, Rental & Leasing (100.0%).
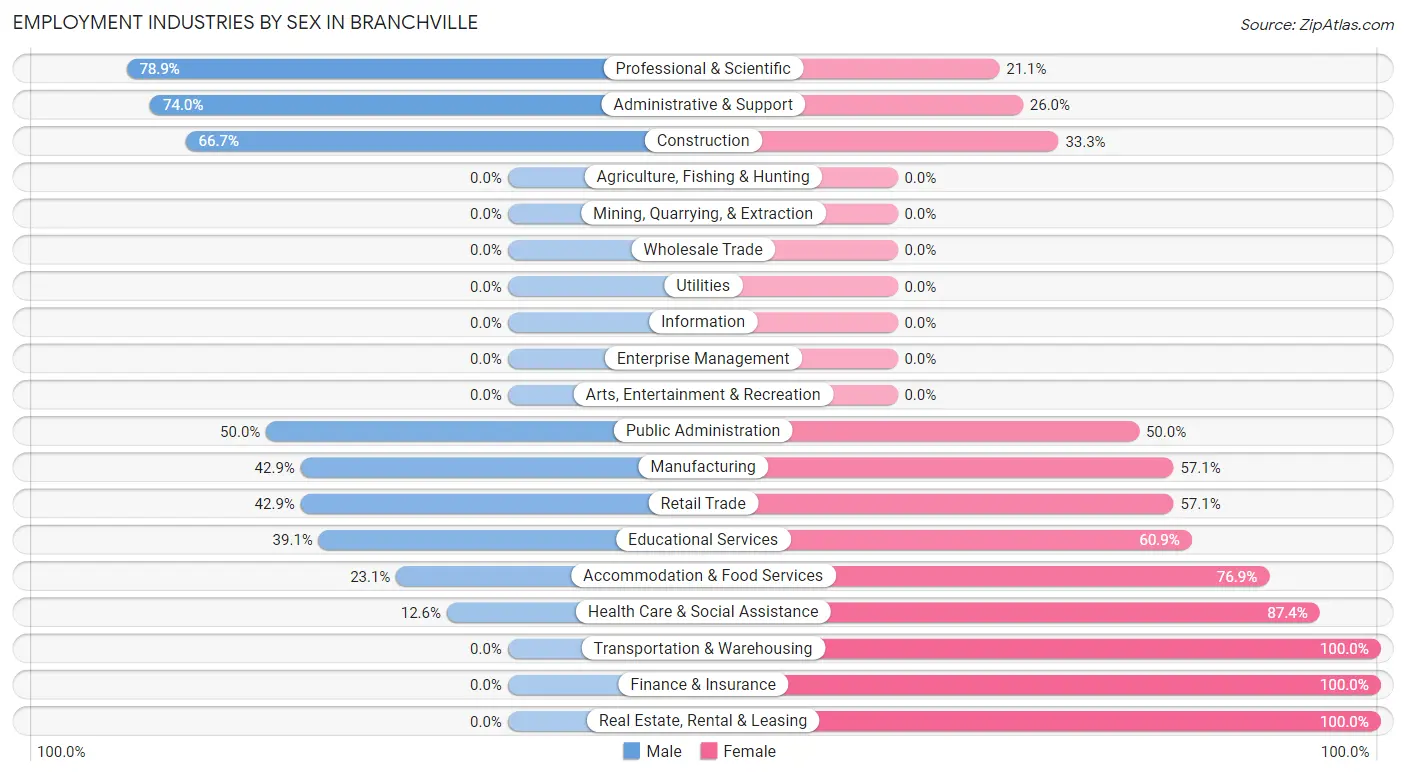
| Industry | Male | Female |
| Agriculture, Fishing & Hunting | 0 (0.0%) | 0 (0.0%) |
| Mining, Quarrying, & Extraction | 0 (0.0%) | 0 (0.0%) |
| Construction | 22 (66.7%) | 11 (33.3%) |
| Manufacturing | 15 (42.9%) | 20 (57.1%) |
| Wholesale Trade | 0 (0.0%) | 0 (0.0%) |
| Retail Trade | 12 (42.9%) | 16 (57.1%) |
| Transportation & Warehousing | 0 (0.0%) | 4 (100.0%) |
| Utilities | 0 (0.0%) | 0 (0.0%) |
| Information | 0 (0.0%) | 0 (0.0%) |
| Finance & Insurance | 0 (0.0%) | 6 (100.0%) |
| Real Estate, Rental & Leasing | 0 (0.0%) | 10 (100.0%) |
| Professional & Scientific | 101 (78.9%) | 27 (21.1%) |
| Enterprise Management | 0 (0.0%) | 0 (0.0%) |
| Administrative & Support | 57 (74.0%) | 20 (26.0%) |
| Educational Services | 18 (39.1%) | 28 (60.9%) |
| Health Care & Social Assistance | 13 (12.6%) | 90 (87.4%) |
| Arts, Entertainment & Recreation | 0 (0.0%) | 0 (0.0%) |
| Accommodation & Food Services | 6 (23.1%) | 20 (76.9%) |
| Public Administration | 3 (50.0%) | 3 (50.0%) |
| Total | 278 (52.2%) | 255 (47.8%) |
Education in Branchville
School Enrollment in Branchville
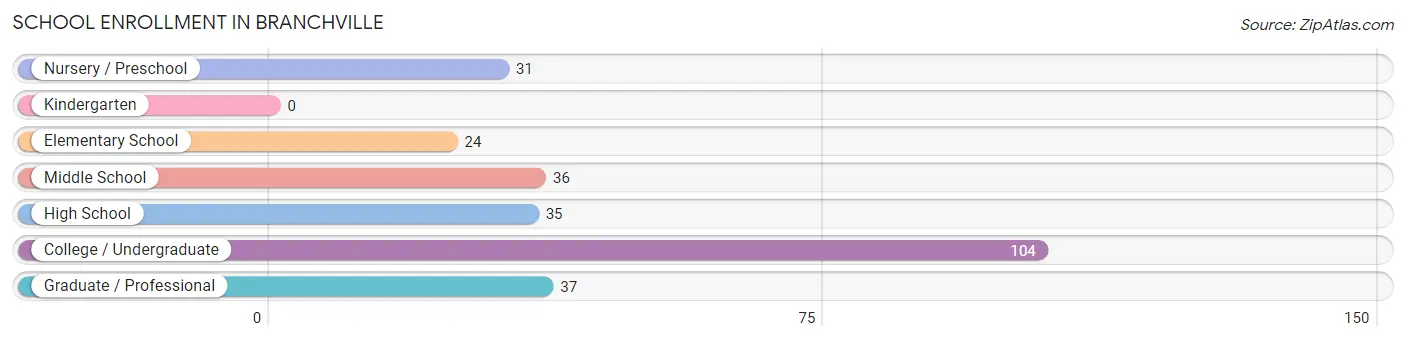
The most common levels of schooling among the 267 students in Branchville are college / undergraduate (104 | 39.0%), graduate / professional (37 | 13.9%), and middle school (36 | 13.5%).
| School Level | # Students | % Students |
| Nursery / Preschool | 31 | 11.6% |
| Kindergarten | 0 | 0.0% |
| Elementary School | 24 | 9.0% |
| Middle School | 36 | 13.5% |
| High School | 35 | 13.1% |
| College / Undergraduate | 104 | 39.0% |
| Graduate / Professional | 37 | 13.9% |
| Total | 267 | 100.0% |
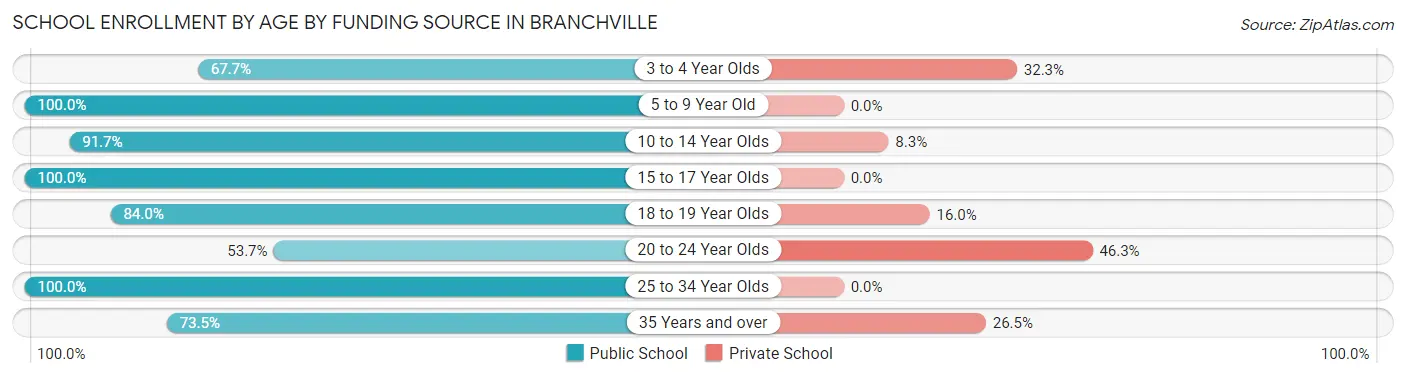
School Enrollment by Age by Funding Source in Branchville
Out of a total of 267 students who are enrolled in schools in Branchville, 49 (18.4%) attend a private institution, while the remaining 218 (81.6%) are enrolled in public schools. The age group of 20 to 24 year olds has the highest likelihood of being enrolled in private schools, with 19 (46.3% in the age bracket) enrolled. Conversely, the age group of 5 to 9 year old has the lowest likelihood of being enrolled in a private school, with 24 (100.0% in the age bracket) attending a public institution.
| Age Bracket | Public School | Private School |
| 3 to 4 Year Olds | 21 (67.7%) | 10 (32.3%) |
| 5 to 9 Year Old | 24 (100.0%) | 0 (0.0%) |
| 10 to 14 Year Olds | 33 (91.7%) | 3 (8.3%) |
| 15 to 17 Year Olds | 24 (100.0%) | 0 (0.0%) |
| 18 to 19 Year Olds | 42 (84.0%) | 8 (16.0%) |
| 20 to 24 Year Olds | 22 (53.7%) | 19 (46.3%) |
| 25 to 34 Year Olds | 27 (100.0%) | 0 (0.0%) |
| 35 Years and over | 25 (73.5%) | 9 (26.5%) |
| Total | 218 (81.6%) | 49 (18.4%) |
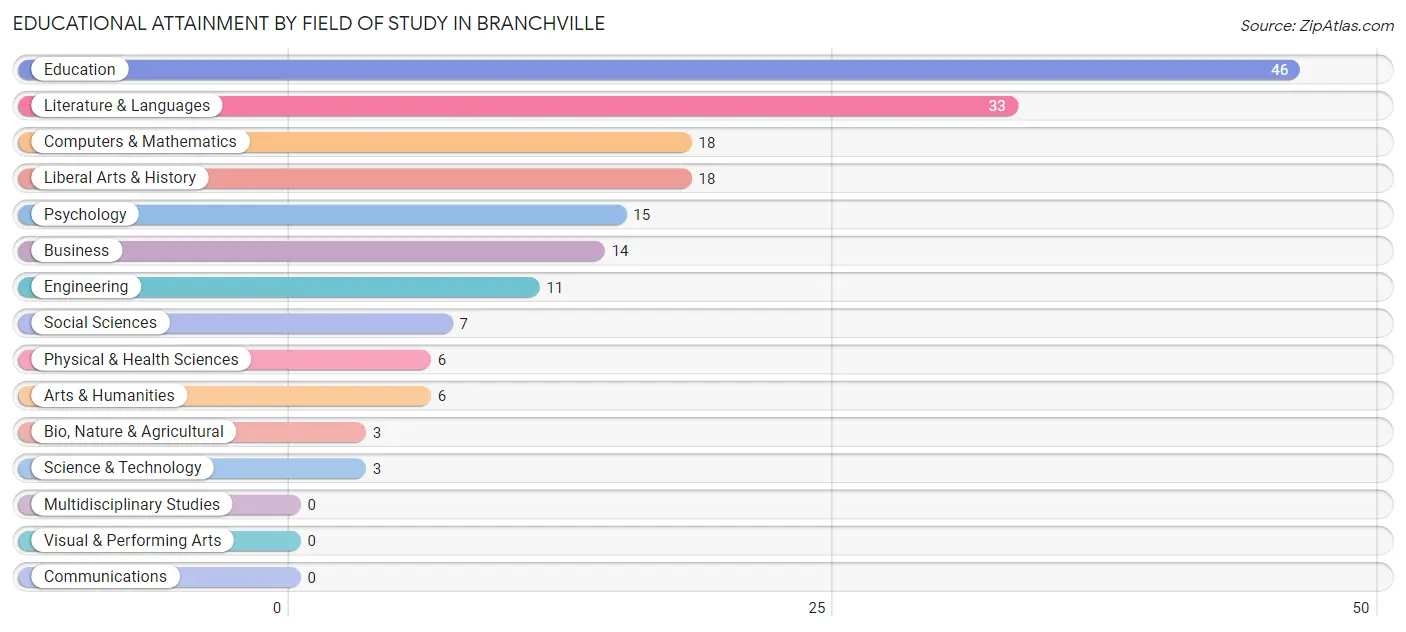
Educational Attainment by Field of Study in Branchville
Education (46 | 25.6%), literature & languages (33 | 18.3%), computers & mathematics (18 | 10.0%), liberal arts & history (18 | 10.0%), and psychology (15 | 8.3%) are the most common fields of study among 180 individuals in Branchville who have obtained a bachelor's degree or higher.
| Field of Study | # Graduates | % Graduates |
| Computers & Mathematics | 18 | 10.0% |
| Bio, Nature & Agricultural | 3 | 1.7% |
| Physical & Health Sciences | 6 | 3.3% |
| Psychology | 15 | 8.3% |
| Social Sciences | 7 | 3.9% |
| Engineering | 11 | 6.1% |
| Multidisciplinary Studies | 0 | 0.0% |
| Science & Technology | 3 | 1.7% |
| Business | 14 | 7.8% |
| Education | 46 | 25.6% |
| Literature & Languages | 33 | 18.3% |
| Liberal Arts & History | 18 | 10.0% |
| Visual & Performing Arts | 0 | 0.0% |
| Communications | 0 | 0.0% |
| Arts & Humanities | 6 | 3.3% |
| Total | 180 | 100.0% |
Transportation & Commute in Branchville
Vehicle Availability by Sex in Branchville
The most prevalent vehicle ownership categories in Branchville are males with 3 vehicles (122, accounting for 47.8%) and females with 3 vehicles (69, making up 47.8%).
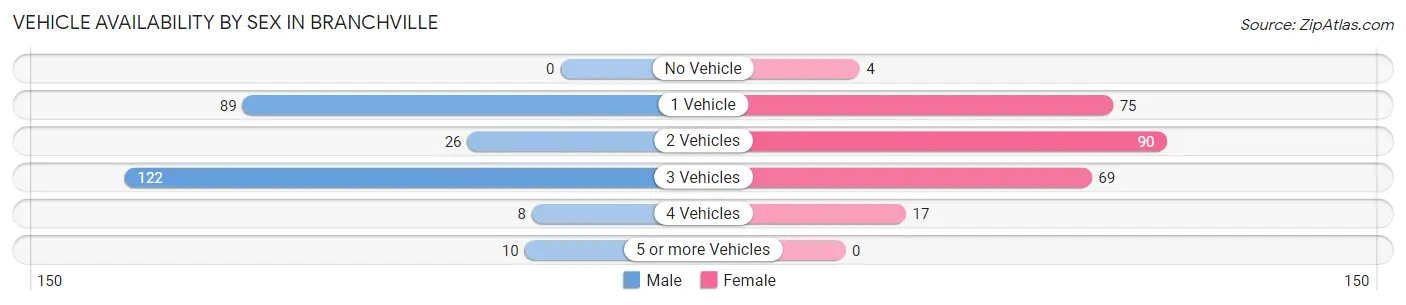
| Vehicles Available | Male | Female |
| No Vehicle | 0 (0.0%) | 4 (1.6%) |
| 1 Vehicle | 89 (34.9%) | 75 (29.4%) |
| 2 Vehicles | 26 (10.2%) | 90 (35.3%) |
| 3 Vehicles | 122 (47.8%) | 69 (27.1%) |
| 4 Vehicles | 8 (3.1%) | 17 (6.7%) |
| 5 or more Vehicles | 10 (3.9%) | 0 (0.0%) |
| Total | 255 (100.0%) | 255 (100.0%) |
Commute Time in Branchville
The most frequently occuring commute durations in Branchville are 30 to 34 minutes (202 commuters, 40.2%), 60 to 89 minutes (78 commuters, 15.5%), and 25 to 29 minutes (65 commuters, 13.0%).
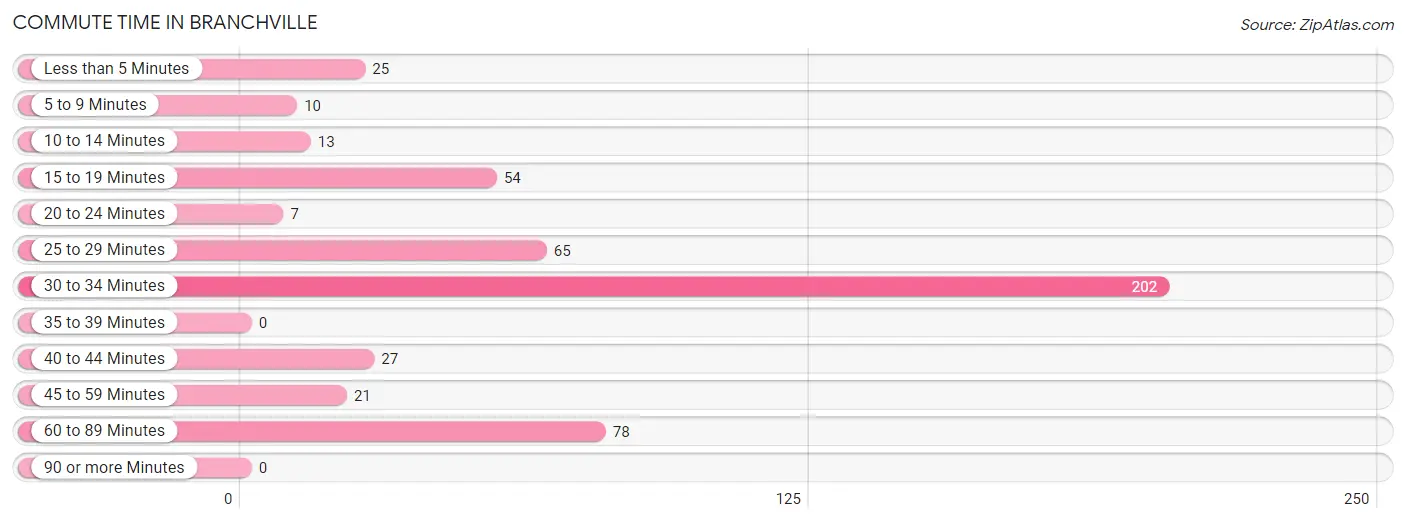
| Commute Time | # Commuters | % Commuters |
| Less than 5 Minutes | 25 | 5.0% |
| 5 to 9 Minutes | 10 | 2.0% |
| 10 to 14 Minutes | 13 | 2.6% |
| 15 to 19 Minutes | 54 | 10.8% |
| 20 to 24 Minutes | 7 | 1.4% |
| 25 to 29 Minutes | 65 | 13.0% |
| 30 to 34 Minutes | 202 | 40.2% |
| 35 to 39 Minutes | 0 | 0.0% |
| 40 to 44 Minutes | 27 | 5.4% |
| 45 to 59 Minutes | 21 | 4.2% |
| 60 to 89 Minutes | 78 | 15.5% |
| 90 or more Minutes | 0 | 0.0% |
Commute Time by Sex in Branchville
The most common commute times in Branchville are 30 to 34 minutes (103 commuters, 40.4%) for males and 30 to 34 minutes (99 commuters, 40.1%) for females.
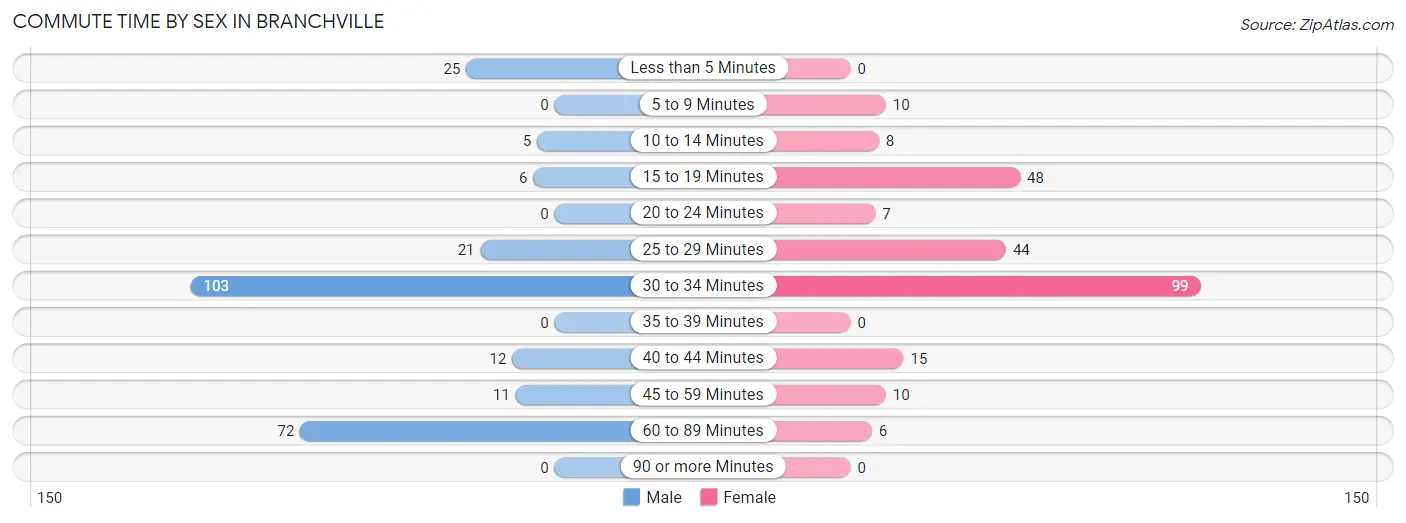
| Commute Time | Male | Female |
| Less than 5 Minutes | 25 (9.8%) | 0 (0.0%) |
| 5 to 9 Minutes | 0 (0.0%) | 10 (4.1%) |
| 10 to 14 Minutes | 5 (2.0%) | 8 (3.2%) |
| 15 to 19 Minutes | 6 (2.4%) | 48 (19.4%) |
| 20 to 24 Minutes | 0 (0.0%) | 7 (2.8%) |
| 25 to 29 Minutes | 21 (8.2%) | 44 (17.8%) |
| 30 to 34 Minutes | 103 (40.4%) | 99 (40.1%) |
| 35 to 39 Minutes | 0 (0.0%) | 0 (0.0%) |
| 40 to 44 Minutes | 12 (4.7%) | 15 (6.1%) |
| 45 to 59 Minutes | 11 (4.3%) | 10 (4.1%) |
| 60 to 89 Minutes | 72 (28.2%) | 6 (2.4%) |
| 90 or more Minutes | 0 (0.0%) | 0 (0.0%) |
Time of Departure to Work by Sex in Branchville
The most frequent times of departure to work in Branchville are 6:00 AM to 6:29 AM (114, 44.7%) for males and 6:30 AM to 6:59 AM (55, 22.3%) for females.
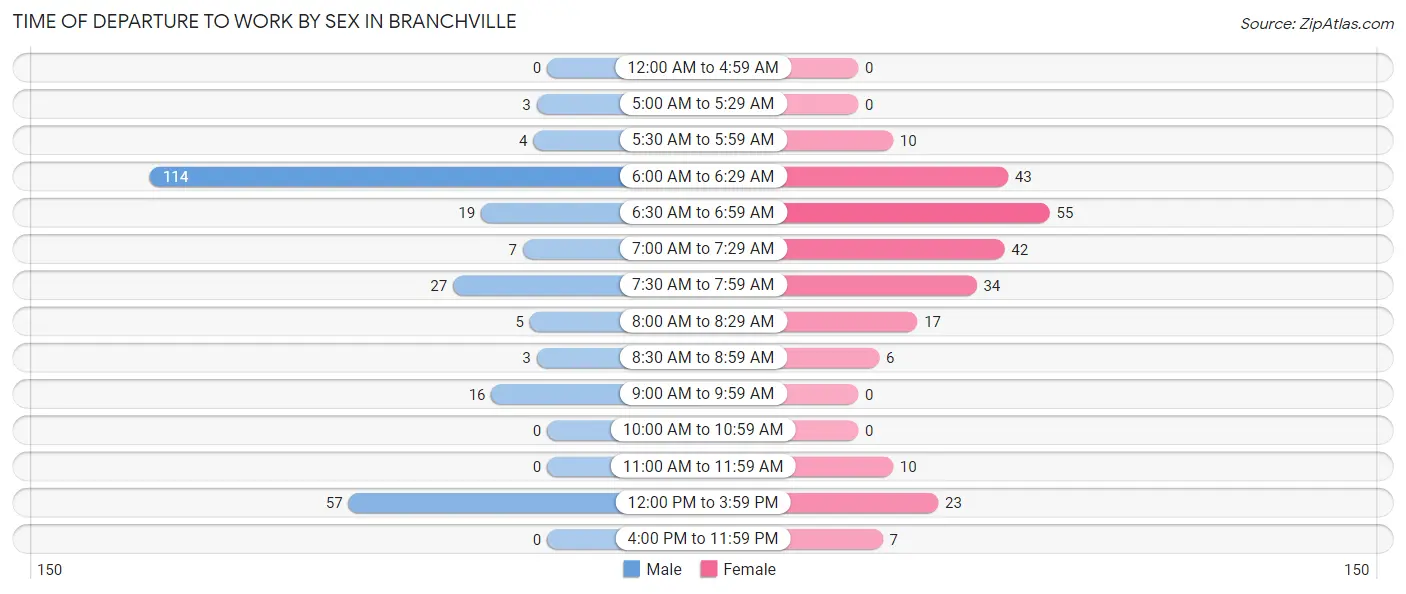
| Time of Departure | Male | Female |
| 12:00 AM to 4:59 AM | 0 (0.0%) | 0 (0.0%) |
| 5:00 AM to 5:29 AM | 3 (1.2%) | 0 (0.0%) |
| 5:30 AM to 5:59 AM | 4 (1.6%) | 10 (4.1%) |
| 6:00 AM to 6:29 AM | 114 (44.7%) | 43 (17.4%) |
| 6:30 AM to 6:59 AM | 19 (7.4%) | 55 (22.3%) |
| 7:00 AM to 7:29 AM | 7 (2.8%) | 42 (17.0%) |
| 7:30 AM to 7:59 AM | 27 (10.6%) | 34 (13.8%) |
| 8:00 AM to 8:29 AM | 5 (2.0%) | 17 (6.9%) |
| 8:30 AM to 8:59 AM | 3 (1.2%) | 6 (2.4%) |
| 9:00 AM to 9:59 AM | 16 (6.3%) | 0 (0.0%) |
| 10:00 AM to 10:59 AM | 0 (0.0%) | 0 (0.0%) |
| 11:00 AM to 11:59 AM | 0 (0.0%) | 10 (4.1%) |
| 12:00 PM to 3:59 PM | 57 (22.4%) | 23 (9.3%) |
| 4:00 PM to 11:59 PM | 0 (0.0%) | 7 (2.8%) |
| Total | 255 (100.0%) | 247 (100.0%) |
Housing Occupancy in Branchville
Occupancy by Ownership in Branchville
Of the total 552 dwellings in Branchville, owner-occupied units account for 291 (52.7%), while renter-occupied units make up 261 (47.3%).
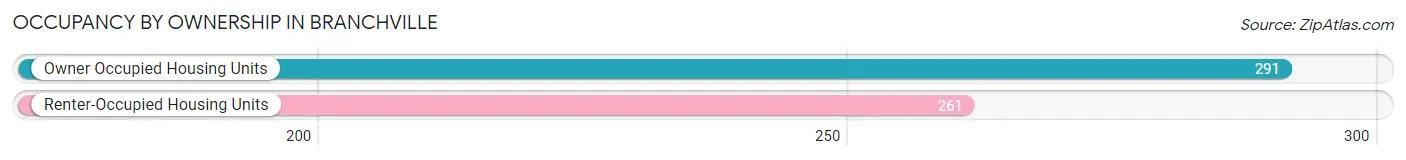
| Occupancy | # Housing Units | % Housing Units |
| Owner Occupied Housing Units | 291 | 52.7% |
| Renter-Occupied Housing Units | 261 | 47.3% |
| Total Occupied Housing Units | 552 | 100.0% |
Occupancy by Household Size in Branchville
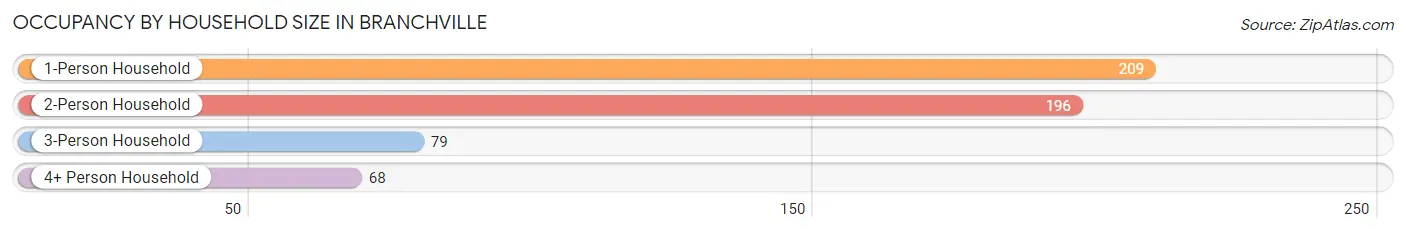
| Household Size | # Housing Units | % Housing Units |
| 1-Person Household | 209 | 37.9% |
| 2-Person Household | 196 | 35.5% |
| 3-Person Household | 79 | 14.3% |
| 4+ Person Household | 68 | 12.3% |
| Total Housing Units | 552 | 100.0% |
Occupancy by Ownership by Household Size in Branchville
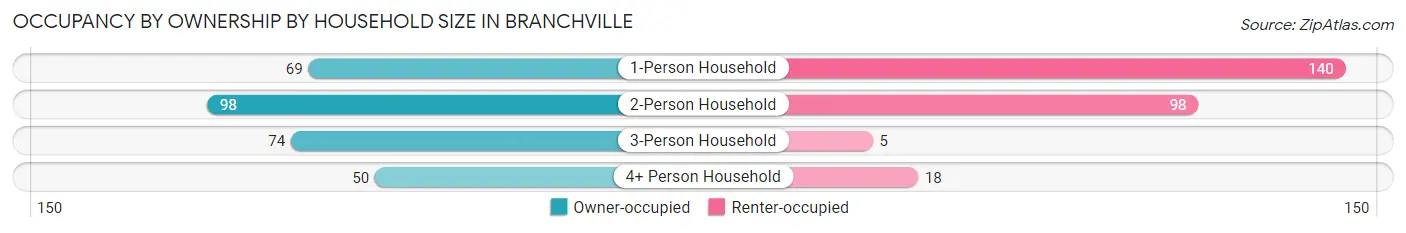
| Household Size | Owner-occupied | Renter-occupied |
| 1-Person Household | 69 (33.0%) | 140 (67.0%) |
| 2-Person Household | 98 (50.0%) | 98 (50.0%) |
| 3-Person Household | 74 (93.7%) | 5 (6.3%) |
| 4+ Person Household | 50 (73.5%) | 18 (26.5%) |
| Total Housing Units | 291 (52.7%) | 261 (47.3%) |
Occupancy by Educational Attainment in Branchville
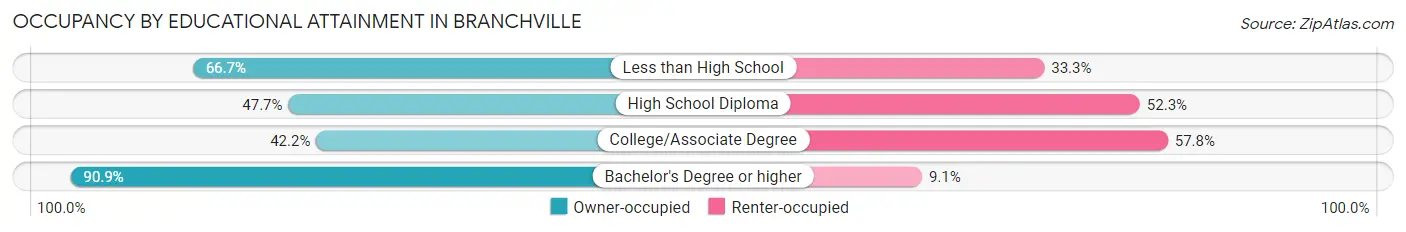
| Household Size | Owner-occupied | Renter-occupied |
| Less than High School | 38 (66.7%) | 19 (33.3%) |
| High School Diploma | 104 (47.7%) | 114 (52.3%) |
| College/Associate Degree | 89 (42.2%) | 122 (57.8%) |
| Bachelor's Degree or higher | 60 (90.9%) | 6 (9.1%) |
Occupancy by Age of Householder in Branchville
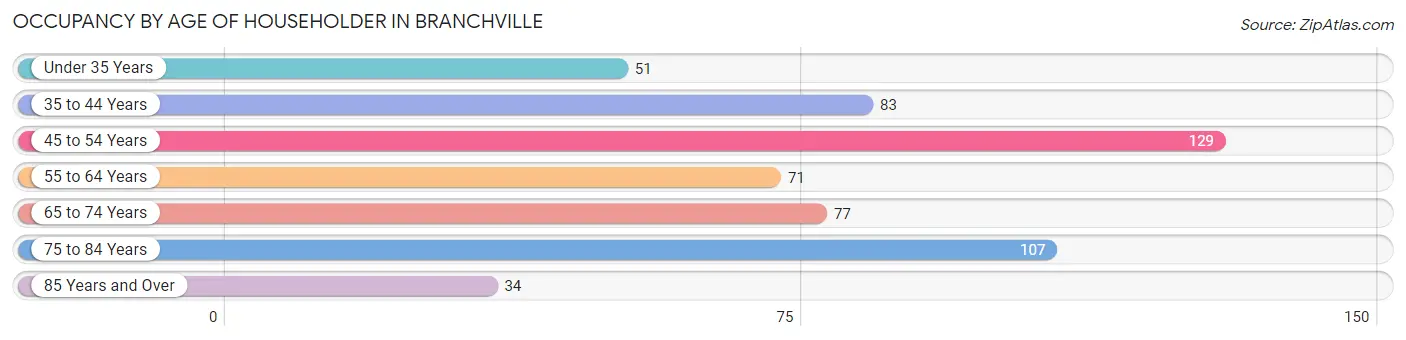
| Age Bracket | # Households | % Households |
| Under 35 Years | 51 | 9.2% |
| 35 to 44 Years | 83 | 15.0% |
| 45 to 54 Years | 129 | 23.4% |
| 55 to 64 Years | 71 | 12.9% |
| 65 to 74 Years | 77 | 14.0% |
| 75 to 84 Years | 107 | 19.4% |
| 85 Years and Over | 34 | 6.2% |
| Total | 552 | 100.0% |
Housing Finances in Branchville
Median Income by Occupancy in Branchville
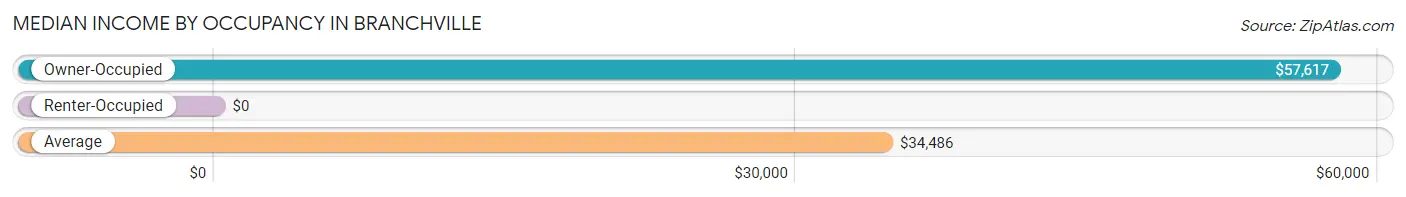
| Occupancy Type | # Households | Median Income |
| Owner-Occupied | 291 (52.7%) | $57,617 |
| Renter-Occupied | 261 (47.3%) | $0 |
| Average | 552 (100.0%) | $34,486 |
Occupancy by Householder Income Bracket in Branchville
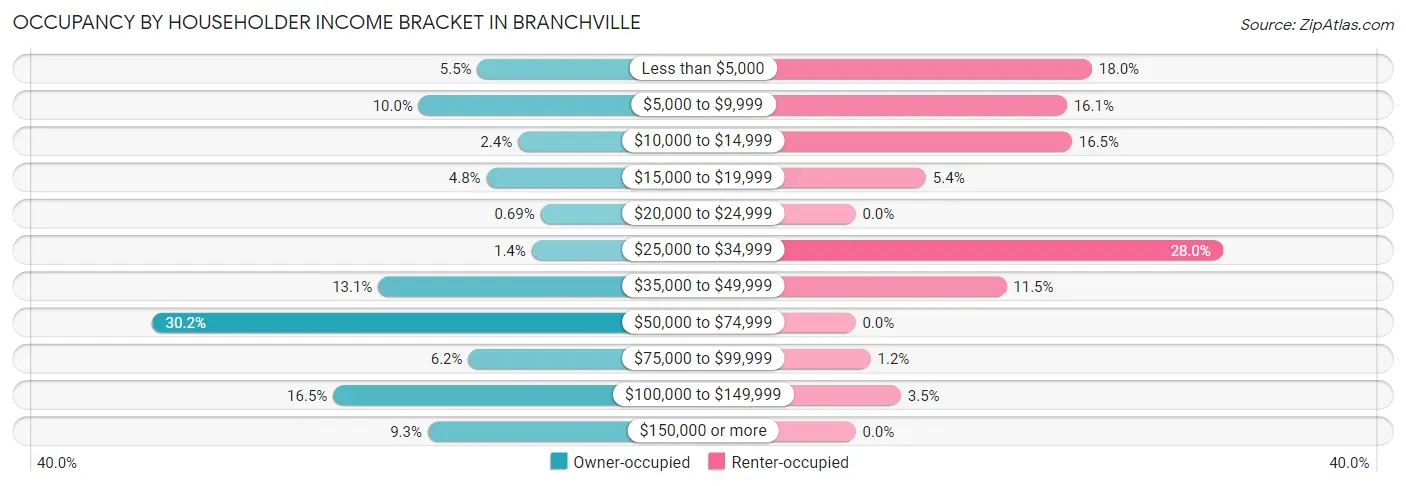
| Income Bracket | Owner-occupied | Renter-occupied |
| Less than $5,000 | 16 (5.5%) | 47 (18.0%) |
| $5,000 to $9,999 | 29 (10.0%) | 42 (16.1%) |
| $10,000 to $14,999 | 7 (2.4%) | 43 (16.5%) |
| $15,000 to $19,999 | 14 (4.8%) | 14 (5.4%) |
| $20,000 to $24,999 | 2 (0.7%) | 0 (0.0%) |
| $25,000 to $34,999 | 4 (1.4%) | 73 (28.0%) |
| $35,000 to $49,999 | 38 (13.1%) | 30 (11.5%) |
| $50,000 to $74,999 | 88 (30.2%) | 0 (0.0%) |
| $75,000 to $99,999 | 18 (6.2%) | 3 (1.1%) |
| $100,000 to $149,999 | 48 (16.5%) | 9 (3.5%) |
| $150,000 or more | 27 (9.3%) | 0 (0.0%) |
| Total | 291 (100.0%) | 261 (100.0%) |
Monthly Housing Cost Tiers in Branchville
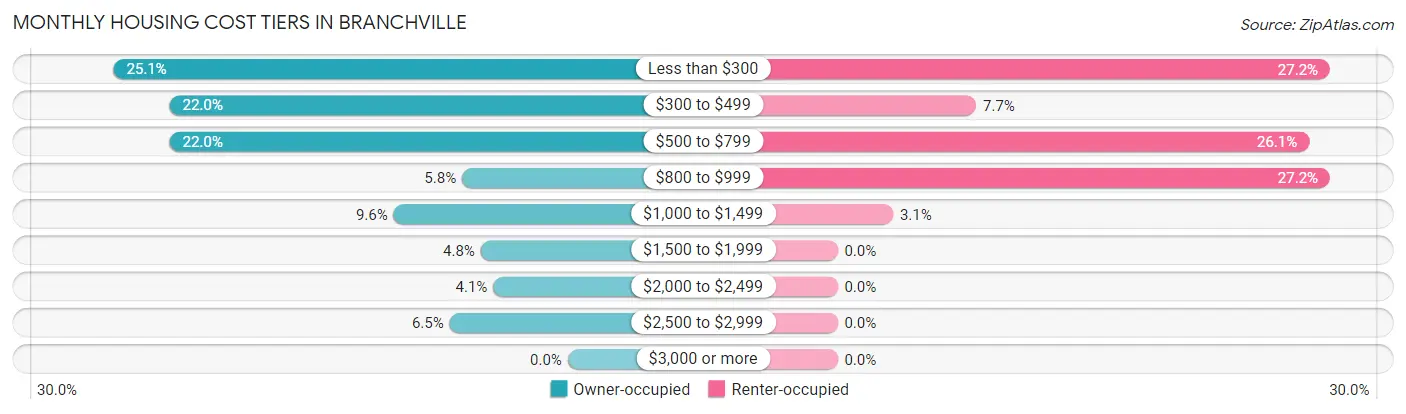
| Monthly Cost | Owner-occupied | Renter-occupied |
| Less than $300 | 73 (25.1%) | 71 (27.2%) |
| $300 to $499 | 64 (22.0%) | 20 (7.7%) |
| $500 to $799 | 64 (22.0%) | 68 (26.1%) |
| $800 to $999 | 17 (5.8%) | 71 (27.2%) |
| $1,000 to $1,499 | 28 (9.6%) | 8 (3.1%) |
| $1,500 to $1,999 | 14 (4.8%) | 0 (0.0%) |
| $2,000 to $2,499 | 12 (4.1%) | 0 (0.0%) |
| $2,500 to $2,999 | 19 (6.5%) | 0 (0.0%) |
| $3,000 or more | 0 (0.0%) | 0 (0.0%) |
| Total | 291 (100.0%) | 261 (100.0%) |
Physical Housing Characteristics in Branchville
Housing Structures in Branchville
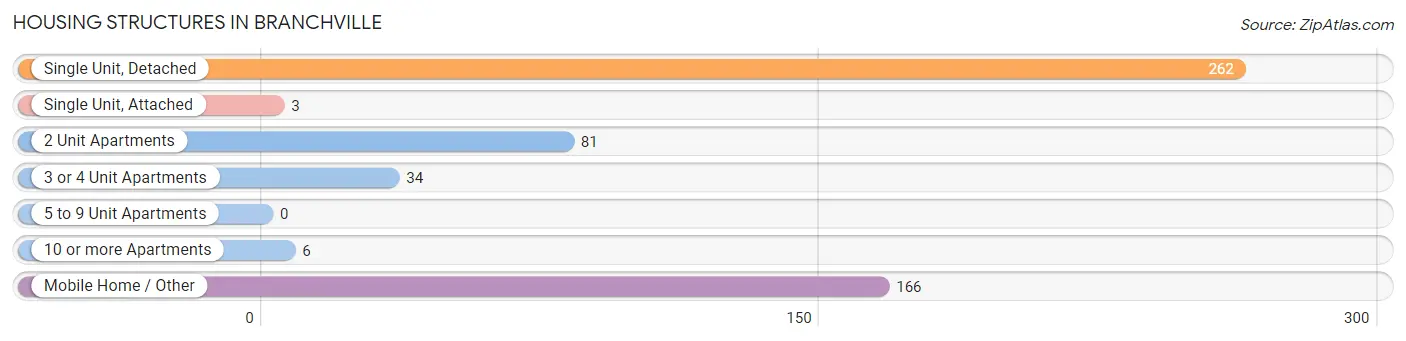
| Structure Type | # Housing Units | % Housing Units |
| Single Unit, Detached | 262 | 47.5% |
| Single Unit, Attached | 3 | 0.5% |
| 2 Unit Apartments | 81 | 14.7% |
| 3 or 4 Unit Apartments | 34 | 6.2% |
| 5 to 9 Unit Apartments | 0 | 0.0% |
| 10 or more Apartments | 6 | 1.1% |
| Mobile Home / Other | 166 | 30.1% |
| Total | 552 | 100.0% |
Housing Structures by Occupancy in Branchville
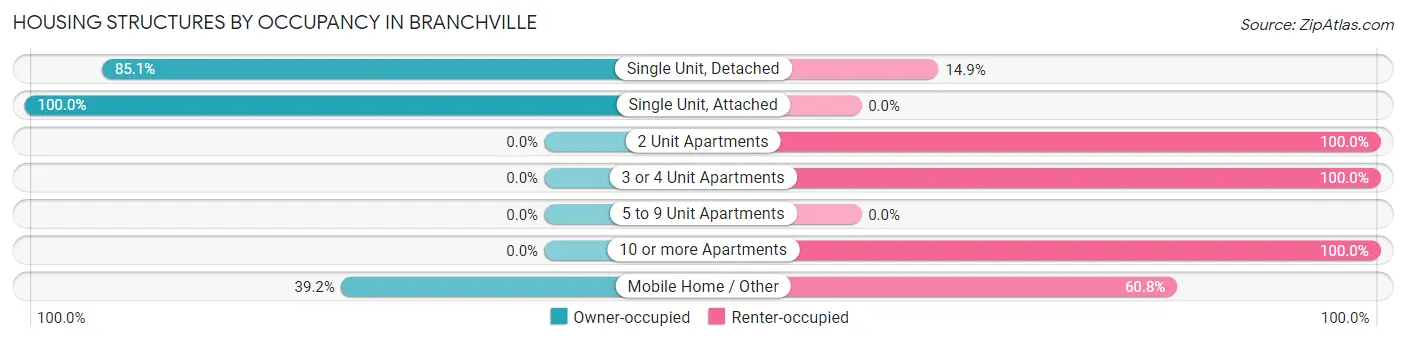
| Structure Type | Owner-occupied | Renter-occupied |
| Single Unit, Detached | 223 (85.1%) | 39 (14.9%) |
| Single Unit, Attached | 3 (100.0%) | 0 (0.0%) |
| 2 Unit Apartments | 0 (0.0%) | 81 (100.0%) |
| 3 or 4 Unit Apartments | 0 (0.0%) | 34 (100.0%) |
| 5 to 9 Unit Apartments | 0 (0.0%) | 0 (0.0%) |
| 10 or more Apartments | 0 (0.0%) | 6 (100.0%) |
| Mobile Home / Other | 65 (39.2%) | 101 (60.8%) |
| Total | 291 (52.7%) | 261 (47.3%) |
Housing Structures by Number of Rooms in Branchville
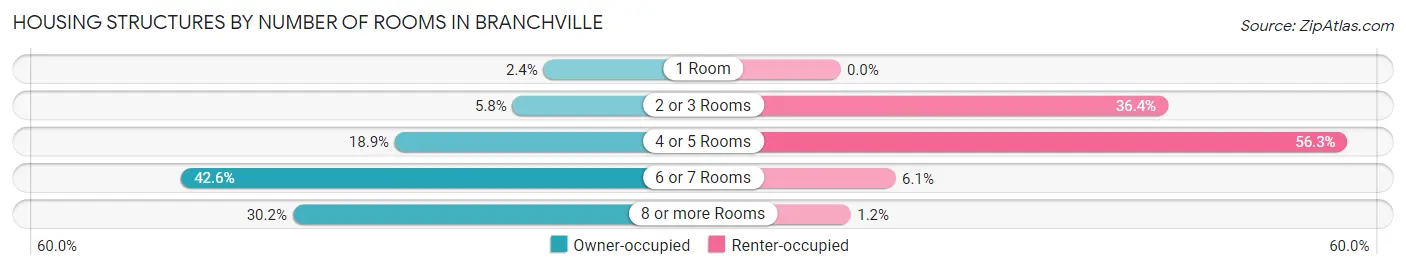
| Number of Rooms | Owner-occupied | Renter-occupied |
| 1 Room | 7 (2.4%) | 0 (0.0%) |
| 2 or 3 Rooms | 17 (5.8%) | 95 (36.4%) |
| 4 or 5 Rooms | 55 (18.9%) | 147 (56.3%) |
| 6 or 7 Rooms | 124 (42.6%) | 16 (6.1%) |
| 8 or more Rooms | 88 (30.2%) | 3 (1.1%) |
| Total | 291 (100.0%) | 261 (100.0%) |
Housing Structure by Heating Type in Branchville
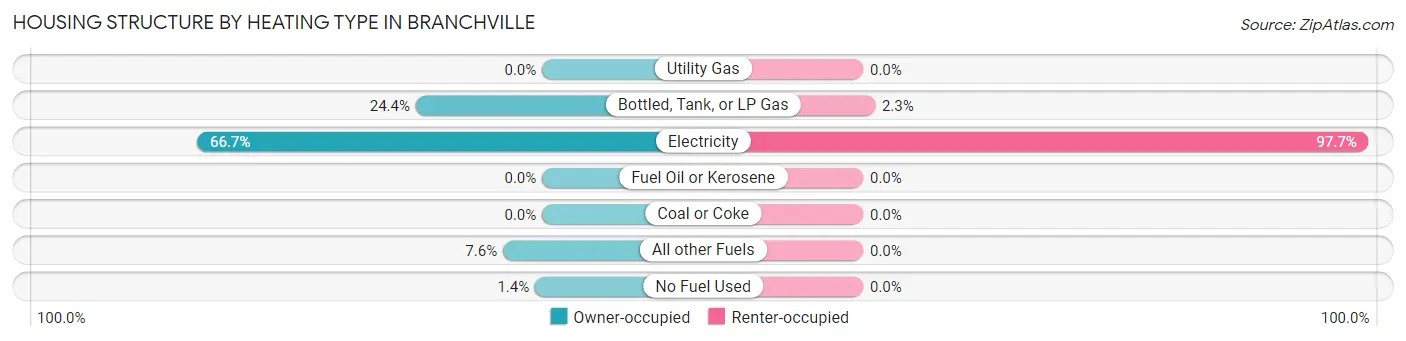
| Heating Type | Owner-occupied | Renter-occupied |
| Utility Gas | 0 (0.0%) | 0 (0.0%) |
| Bottled, Tank, or LP Gas | 71 (24.4%) | 6 (2.3%) |
| Electricity | 194 (66.7%) | 255 (97.7%) |
| Fuel Oil or Kerosene | 0 (0.0%) | 0 (0.0%) |
| Coal or Coke | 0 (0.0%) | 0 (0.0%) |
| All other Fuels | 22 (7.6%) | 0 (0.0%) |
| No Fuel Used | 4 (1.4%) | 0 (0.0%) |
| Total | 291 (100.0%) | 261 (100.0%) |
Household Vehicle Usage in Branchville
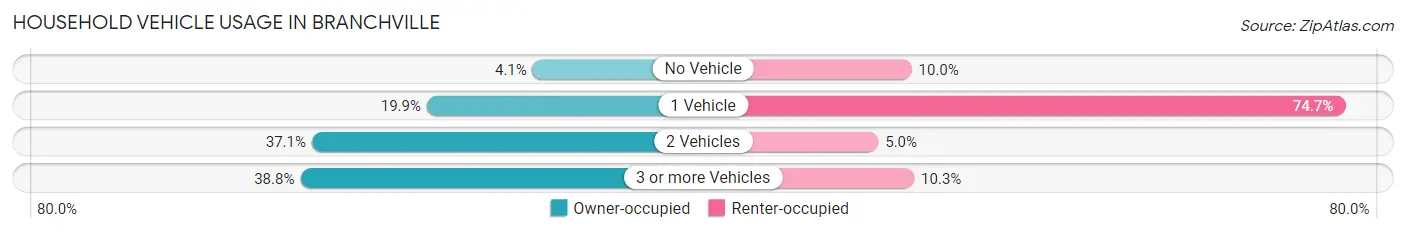
| Vehicles per Household | Owner-occupied | Renter-occupied |
| No Vehicle | 12 (4.1%) | 26 (10.0%) |
| 1 Vehicle | 58 (19.9%) | 195 (74.7%) |
| 2 Vehicles | 108 (37.1%) | 13 (5.0%) |
| 3 or more Vehicles | 113 (38.8%) | 27 (10.3%) |
| Total | 291 (100.0%) | 261 (100.0%) |
Real Estate & Mortgages in Branchville
Real Estate and Mortgage Overview in Branchville
| Characteristic | Without Mortgage | With Mortgage |
| Housing Units | 192 | 99 |
| Median Property Value | $58,700 | $134,400 |
| Median Household Income | $42,375 | $23 |
| Monthly Housing Costs | $367 | $0 |
| Real Estate Taxes | $387 | $17 |
Property Value by Mortgage Status in Branchville
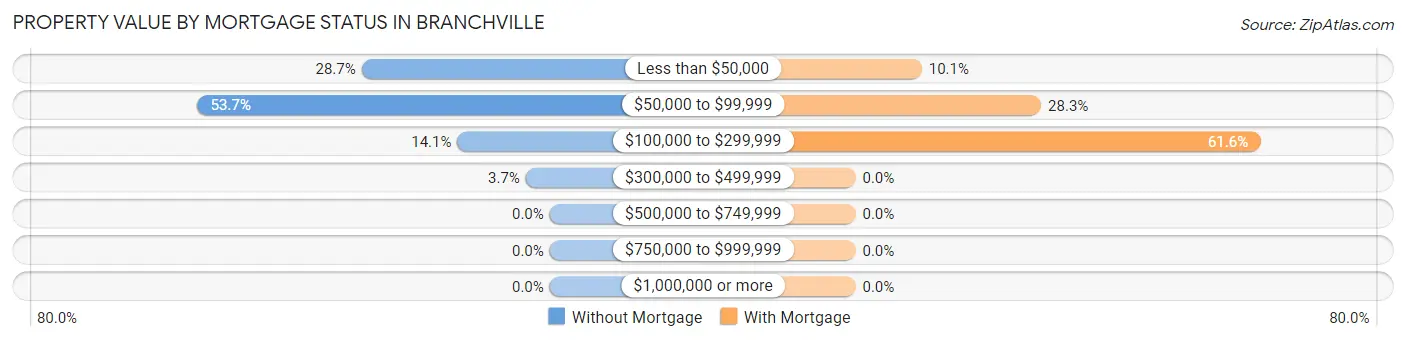
| Property Value | Without Mortgage | With Mortgage |
| Less than $50,000 | 55 (28.6%) | 10 (10.1%) |
| $50,000 to $99,999 | 103 (53.6%) | 28 (28.3%) |
| $100,000 to $299,999 | 27 (14.1%) | 61 (61.6%) |
| $300,000 to $499,999 | 7 (3.6%) | 0 (0.0%) |
| $500,000 to $749,999 | 0 (0.0%) | 0 (0.0%) |
| $750,000 to $999,999 | 0 (0.0%) | 0 (0.0%) |
| $1,000,000 or more | 0 (0.0%) | 0 (0.0%) |
| Total | 192 (100.0%) | 99 (100.0%) |
Household Income by Mortgage Status in Branchville
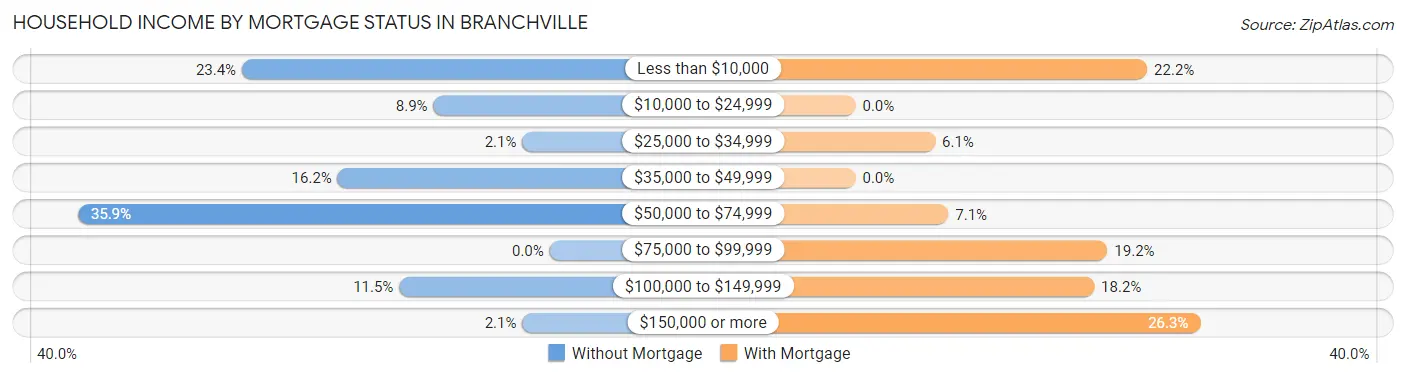
| Household Income | Without Mortgage | With Mortgage |
| Less than $10,000 | 45 (23.4%) | 22 (22.2%) |
| $10,000 to $24,999 | 17 (8.8%) | 0 (0.0%) |
| $25,000 to $34,999 | 4 (2.1%) | 6 (6.1%) |
| $35,000 to $49,999 | 31 (16.2%) | 0 (0.0%) |
| $50,000 to $74,999 | 69 (35.9%) | 7 (7.1%) |
| $75,000 to $99,999 | 0 (0.0%) | 19 (19.2%) |
| $100,000 to $149,999 | 22 (11.5%) | 18 (18.2%) |
| $150,000 or more | 4 (2.1%) | 26 (26.3%) |
| Total | 192 (100.0%) | 99 (100.0%) |
Property Value to Household Income Ratio in Branchville
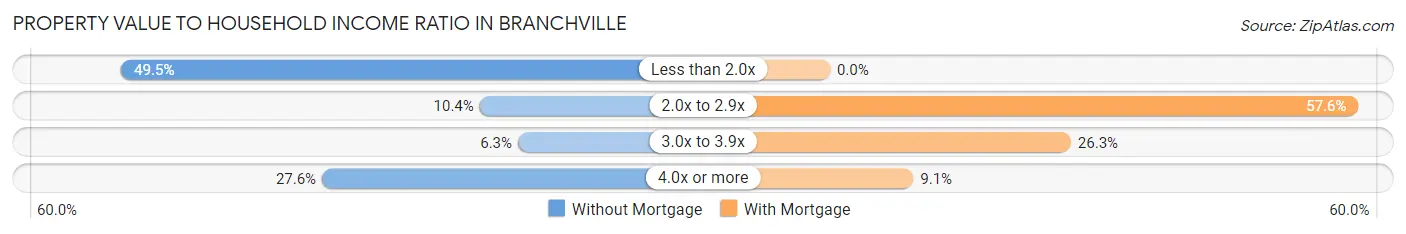
| Value-to-Income Ratio | Without Mortgage | With Mortgage |
| Less than 2.0x | 95 (49.5%) | 0 (0.0%) |
| 2.0x to 2.9x | 20 (10.4%) | 57 (57.6%) |
| 3.0x to 3.9x | 12 (6.2%) | 26 (26.3%) |
| 4.0x or more | 53 (27.6%) | 9 (9.1%) |
| Total | 192 (100.0%) | 99 (100.0%) |
Real Estate Taxes by Mortgage Status in Branchville
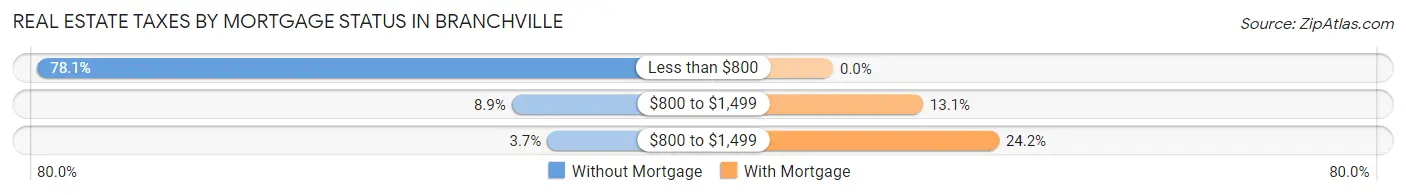
| Property Taxes | Without Mortgage | With Mortgage |
| Less than $800 | 150 (78.1%) | 0 (0.0%) |
| $800 to $1,499 | 17 (8.8%) | 13 (13.1%) |
| $800 to $1,499 | 7 (3.6%) | 24 (24.2%) |
| Total | 192 (100.0%) | 99 (100.0%) |
Health & Disability in Branchville
Health Insurance Coverage by Age in Branchville
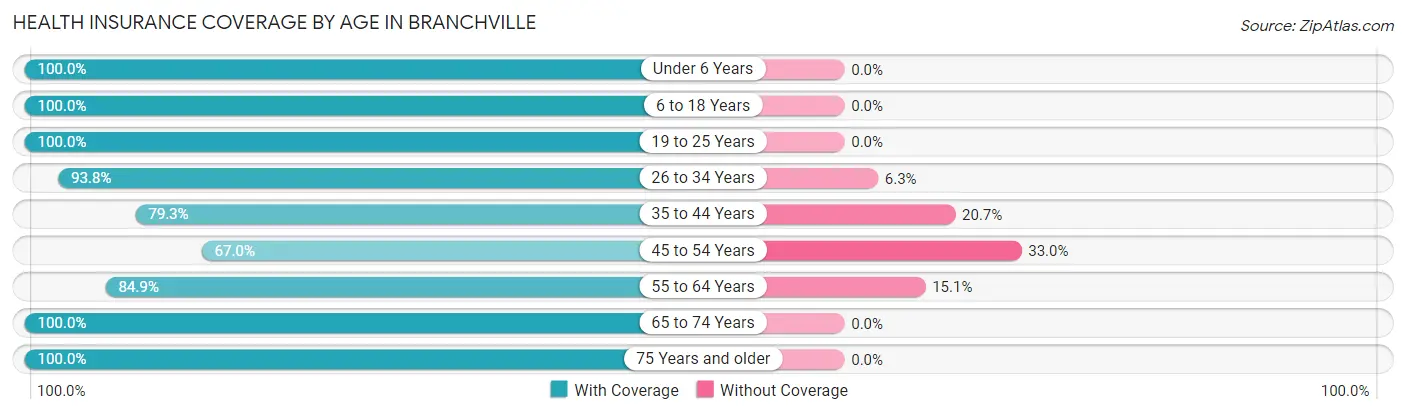
| Age Bracket | With Coverage | Without Coverage |
| Under 6 Years | 51 (100.0%) | 0 (0.0%) |
| 6 to 18 Years | 110 (100.0%) | 0 (0.0%) |
| 19 to 25 Years | 141 (100.0%) | 0 (0.0%) |
| 26 to 34 Years | 75 (93.8%) | 5 (6.2%) |
| 35 to 44 Years | 96 (79.3%) | 25 (20.7%) |
| 45 to 54 Years | 138 (67.0%) | 68 (33.0%) |
| 55 to 64 Years | 197 (84.9%) | 35 (15.1%) |
| 65 to 74 Years | 158 (100.0%) | 0 (0.0%) |
| 75 Years and older | 186 (100.0%) | 0 (0.0%) |
| Total | 1,152 (89.6%) | 133 (10.3%) |
Health Insurance Coverage by Citizenship Status in Branchville
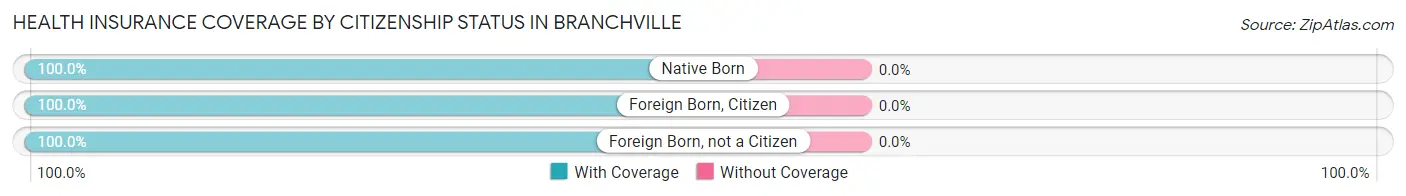
| Citizenship Status | With Coverage | Without Coverage |
| Native Born | 51 (100.0%) | 0 (0.0%) |
| Foreign Born, Citizen | 110 (100.0%) | 0 (0.0%) |
| Foreign Born, not a Citizen | 141 (100.0%) | 0 (0.0%) |
Health Insurance Coverage by Household Income in Branchville
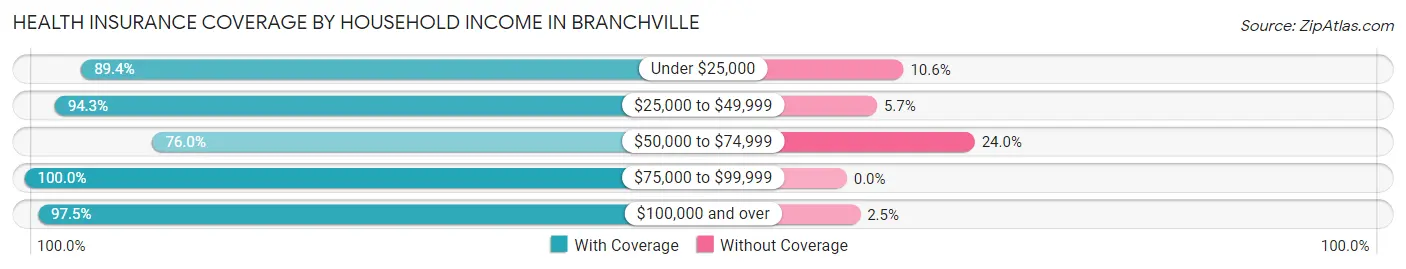
| Household Income | With Coverage | Without Coverage |
| Under $25,000 | 261 (89.4%) | 31 (10.6%) |
| $25,000 to $49,999 | 300 (94.3%) | 18 (5.7%) |
| $50,000 to $74,999 | 241 (76.0%) | 76 (24.0%) |
| $75,000 to $99,999 | 41 (100.0%) | 0 (0.0%) |
| $100,000 and over | 309 (97.5%) | 8 (2.5%) |
Public vs Private Health Insurance Coverage by Age in Branchville
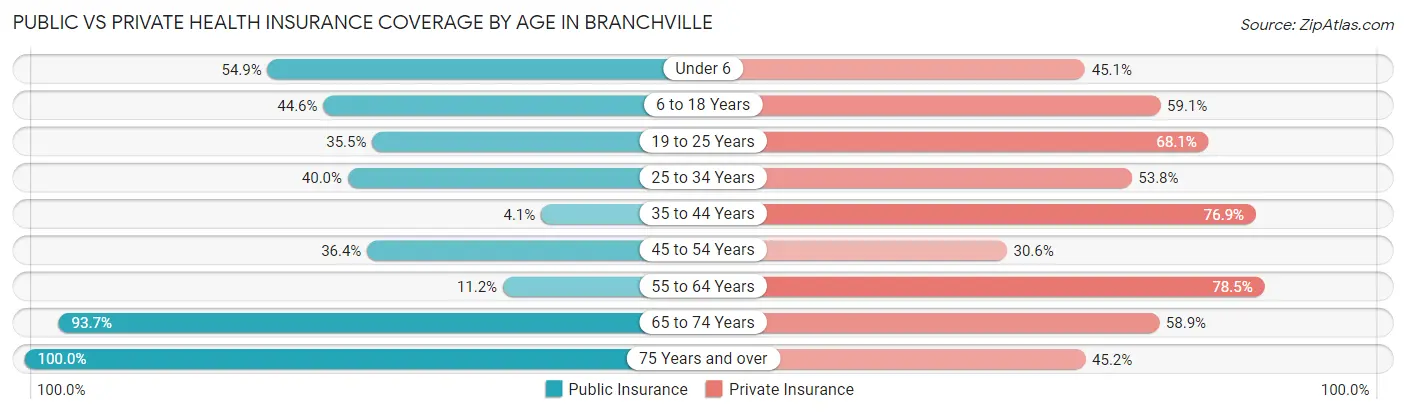
| Age Bracket | Public Insurance | Private Insurance |
| Under 6 | 28 (54.9%) | 23 (45.1%) |
| 6 to 18 Years | 49 (44.6%) | 65 (59.1%) |
| 19 to 25 Years | 50 (35.5%) | 96 (68.1%) |
| 25 to 34 Years | 32 (40.0%) | 43 (53.7%) |
| 35 to 44 Years | 5 (4.1%) | 93 (76.9%) |
| 45 to 54 Years | 75 (36.4%) | 63 (30.6%) |
| 55 to 64 Years | 26 (11.2%) | 182 (78.4%) |
| 65 to 74 Years | 148 (93.7%) | 93 (58.9%) |
| 75 Years and over | 186 (100.0%) | 84 (45.2%) |
| Total | 599 (46.6%) | 742 (57.7%) |
Disability Status by Sex by Age in Branchville
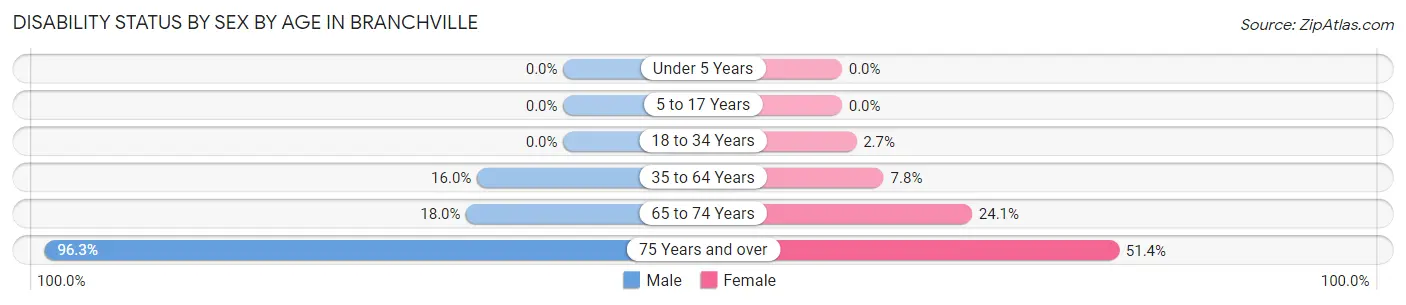
| Age Bracket | Male | Female |
| Under 5 Years | 0 (0.0%) | 0 (0.0%) |
| 5 to 17 Years | 0 (0.0%) | 0 (0.0%) |
| 18 to 34 Years | 0 (0.0%) | 5 (2.7%) |
| 35 to 64 Years | 40 (16.0%) | 24 (7.8%) |
| 65 to 74 Years | 18 (18.0%) | 14 (24.1%) |
| 75 Years and over | 78 (96.3%) | 54 (51.4%) |
Disability Class by Sex by Age in Branchville
Disability Class: Hearing Difficulty
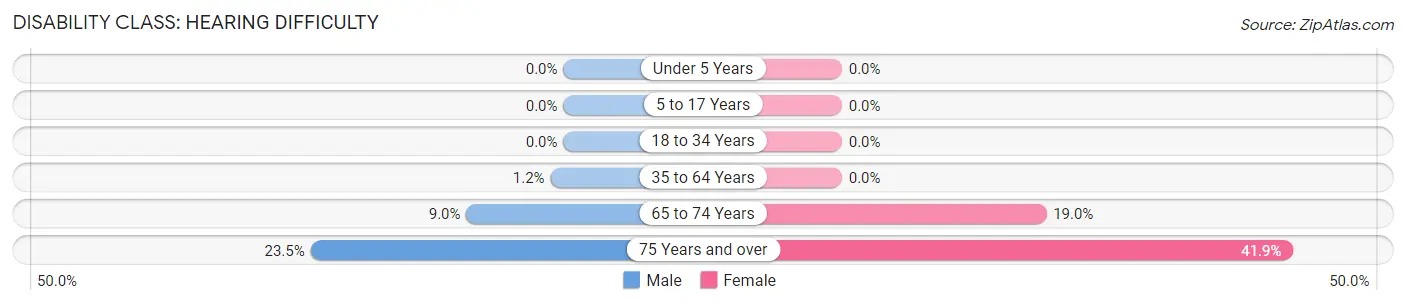
| Age Bracket | Male | Female |
| Under 5 Years | 0 (0.0%) | 0 (0.0%) |
| 5 to 17 Years | 0 (0.0%) | 0 (0.0%) |
| 18 to 34 Years | 0 (0.0%) | 0 (0.0%) |
| 35 to 64 Years | 3 (1.2%) | 0 (0.0%) |
| 65 to 74 Years | 9 (9.0%) | 11 (19.0%) |
| 75 Years and over | 19 (23.5%) | 44 (41.9%) |
Disability Class: Vision Difficulty
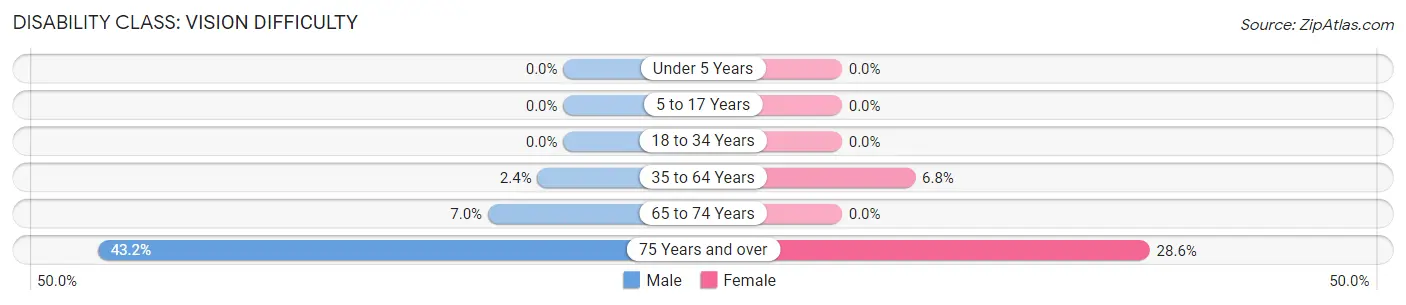
| Age Bracket | Male | Female |
| Under 5 Years | 0 (0.0%) | 0 (0.0%) |
| 5 to 17 Years | 0 (0.0%) | 0 (0.0%) |
| 18 to 34 Years | 0 (0.0%) | 0 (0.0%) |
| 35 to 64 Years | 6 (2.4%) | 21 (6.8%) |
| 65 to 74 Years | 7 (7.0%) | 0 (0.0%) |
| 75 Years and over | 35 (43.2%) | 30 (28.6%) |
Disability Class: Cognitive Difficulty
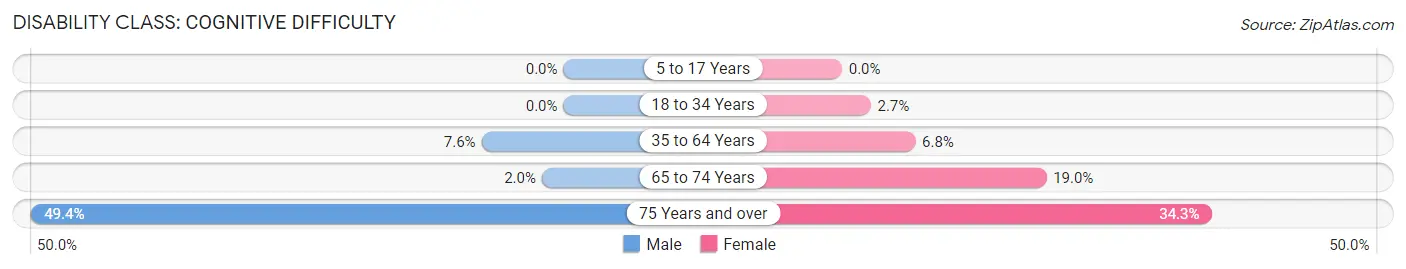
| Age Bracket | Male | Female |
| 5 to 17 Years | 0 (0.0%) | 0 (0.0%) |
| 18 to 34 Years | 0 (0.0%) | 5 (2.7%) |
| 35 to 64 Years | 19 (7.6%) | 21 (6.8%) |
| 65 to 74 Years | 2 (2.0%) | 11 (19.0%) |
| 75 Years and over | 40 (49.4%) | 36 (34.3%) |
Disability Class: Ambulatory Difficulty
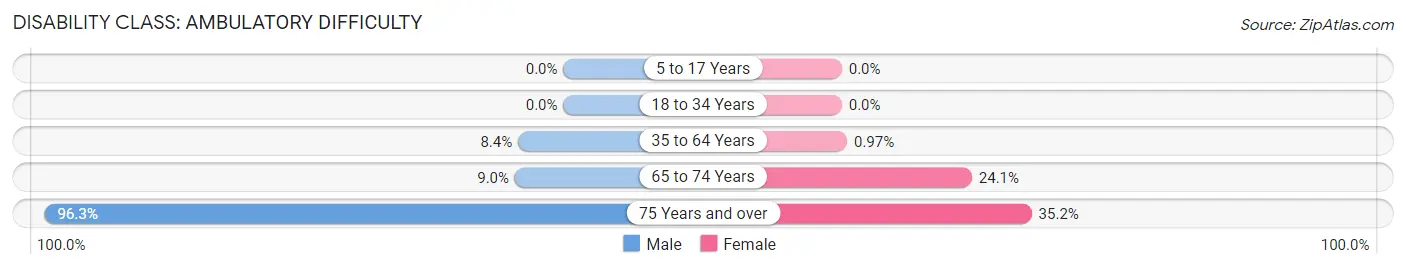
| Age Bracket | Male | Female |
| 5 to 17 Years | 0 (0.0%) | 0 (0.0%) |
| 18 to 34 Years | 0 (0.0%) | 0 (0.0%) |
| 35 to 64 Years | 21 (8.4%) | 3 (1.0%) |
| 65 to 74 Years | 9 (9.0%) | 14 (24.1%) |
| 75 Years and over | 78 (96.3%) | 37 (35.2%) |
Disability Class: Self-Care Difficulty
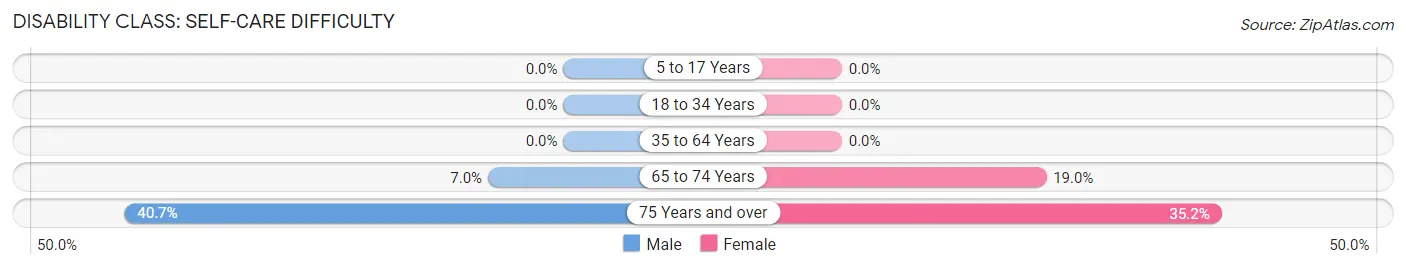
| Age Bracket | Male | Female |
| 5 to 17 Years | 0 (0.0%) | 0 (0.0%) |
| 18 to 34 Years | 0 (0.0%) | 0 (0.0%) |
| 35 to 64 Years | 0 (0.0%) | 0 (0.0%) |
| 65 to 74 Years | 7 (7.0%) | 11 (19.0%) |
| 75 Years and over | 33 (40.7%) | 37 (35.2%) |
Technology Access in Branchville
Computing Device Access in Branchville
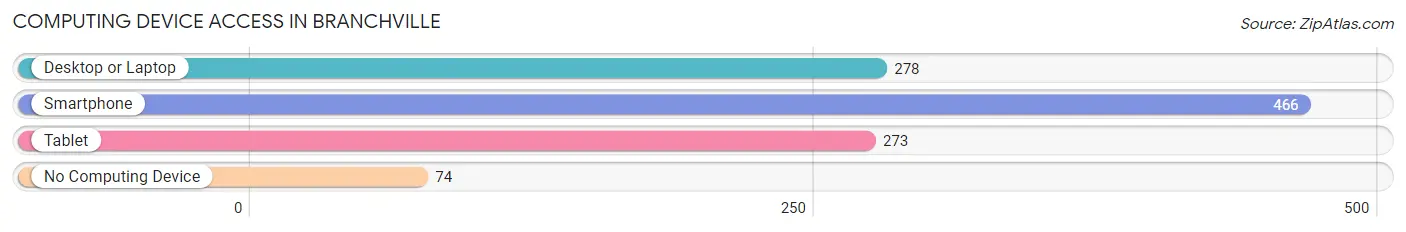
| Device Type | # Households | % Households |
| Desktop or Laptop | 278 | 50.4% |
| Smartphone | 466 | 84.4% |
| Tablet | 273 | 49.5% |
| No Computing Device | 74 | 13.4% |
| Total | 552 | 100.0% |
Internet Access in Branchville
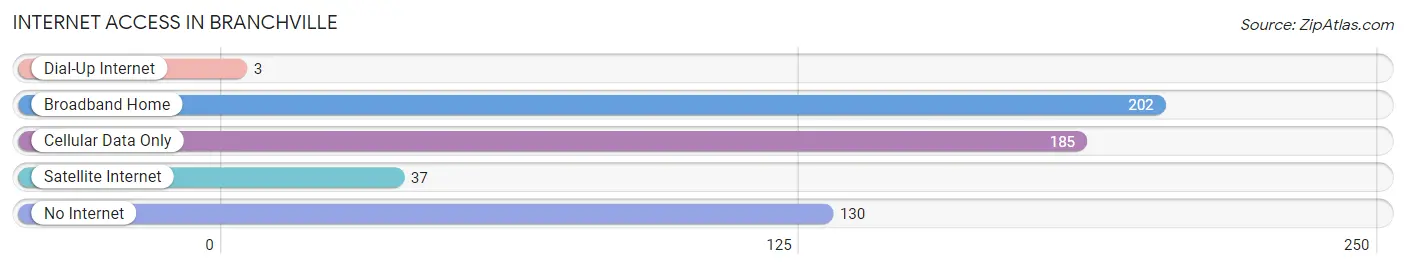
| Internet Type | # Households | % Households |
| Dial-Up Internet | 3 | 0.5% |
| Broadband Home | 202 | 36.6% |
| Cellular Data Only | 185 | 33.5% |
| Satellite Internet | 37 | 6.7% |
| No Internet | 130 | 23.5% |
| Total | 552 | 100.0% |
Branchville Summary
Branchville, South Carolina is a small town located in Orangeburg County, South Carolina. It is situated in the heart of the South Carolina Lowcountry, approximately halfway between Columbia and Charleston. The town is located on the banks of the Edisto River, and is home to a population of approximately 1,000 people.
Geography
Branchville is located in the heart of the South Carolina Lowcountry, approximately halfway between Columbia and Charleston. The town is situated on the banks of the Edisto River, and is surrounded by a number of small towns and rural communities. The town is located in the Piedmont region of South Carolina, and is characterized by rolling hills and lush forests. The town is located at an elevation of approximately 200 feet above sea level.
History
Branchville was founded in 1820 by a group of settlers from North Carolina. The town was named after a nearby branch of the Edisto River, and was originally intended to be a trading post for the local farmers and merchants. The town quickly grew, and by the mid-1800s, it had become a thriving agricultural center. The town was also home to a number of cotton mills, which provided employment for many of the town’s residents.
In the late 1800s, Branchville was connected to the rest of the state by the South Carolina Railroad. This allowed the town to become a major shipping hub for the region, and it quickly became a popular destination for tourists. The town was also home to a number of churches, schools, and other businesses.
Economy
Branchville’s economy is largely based on agriculture and tourism. The town is home to a number of farms, which produce a variety of crops, including cotton, corn, soybeans, and peanuts. The town is also home to a number of tourist attractions, including the Edisto River, the Branchville Railroad Museum, and the Branchville Historic District.
Demographics
As of the 2010 census, Branchville had a population of 1,000 people. The town is predominantly white, with approximately 75% of the population identifying as Caucasian. The remaining 25% of the population is made up of African Americans, Hispanics, and other ethnicities. The median household income in Branchville is approximately $35,000, and the median home value is approximately $100,000.
Conclusion
Branchville, South Carolina is a small town located in Orangeburg County, South Carolina. It is situated in the heart of the South Carolina Lowcountry, approximately halfway between Columbia and Charleston. The town is located on the banks of the Edisto River, and is home to a population of approximately 1,000 people. The town’s economy is largely based on agriculture and tourism, and the town is predominantly white. Branchville is home to a number of farms, tourist attractions, churches, schools, and other businesses.
Common Questions
What is Per Capita Income in Branchville?
Per Capita income in Branchville is $22,222.
What is the Median Family Income in Branchville?
Median Family Income in Branchville is $50,500.
What is the Median Household income in Branchville?
Median Household Income in Branchville is $34,486.
What is Income or Wage Gap in Branchville?
Income or Wage Gap in Branchville is 18.3%.
Women in Branchville earn 81.7 cents for every dollar earned by a man.
What is Inequality or Gini Index in Branchville?
Inequality or Gini Index in Branchville is 0.52.
What is the Total Population of Branchville?
Total Population of Branchville is 1,301.
What is the Total Male Population of Branchville?
Total Male Population of Branchville is 603.
What is the Total Female Population of Branchville?
Total Female Population of Branchville is 698.
What is the Ratio of Males per 100 Females in Branchville?
There are 86.39 Males per 100 Females in Branchville.
What is the Ratio of Females per 100 Males in Branchville?
There are 115.75 Females per 100 Males in Branchville.
What is the Median Population Age in Branchville?
Median Population Age in Branchville is 53.3 Years.
What is the Average Family Size in Branchville
Average Family Size in Branchville is 3.2 People.
What is the Average Household Size in Branchville
Average Household Size in Branchville is 2.3 People.
How Large is the Labor Force in Branchville?
There are 597 People in the Labor Forcein in Branchville.
What is the Percentage of People in the Labor Force in Branchville?
50.5% of People are in the Labor Force in Branchville.
What is the Unemployment Rate in Branchville?
Unemployment Rate in Branchville is 10.9%.