Cheraw, SC Map & Demographics
Cheraw Map
Cheraw Overview
$26,958
PER CAPITA INCOME
$47,441
AVG FAMILY INCOME
$30,658
AVG HOUSEHOLD INCOME
24.2%
WAGE / INCOME GAP [ % ]
75.8¢/ $1
WAGE / INCOME GAP [ $ ]
$15,247
FAMILY INCOME DEFICIT
0.53
INEQUALITY / GINI INDEX
5,056
TOTAL POPULATION
2,595
MALE POPULATION
2,461
FEMALE POPULATION
105.44
MALES / 100 FEMALES
94.84
FEMALES / 100 MALES
47.2
MEDIAN AGE
3.3
AVG FAMILY SIZE
2.2
AVG HOUSEHOLD SIZE
2,274
LABOR FORCE [ PEOPLE ]
52.9%
PERCENT IN LABOR FORCE
17.7%
UNEMPLOYMENT RATE
Cheraw Zip Codes
Cheraw Area Codes
Income in Cheraw
Income Overview in Cheraw
Per Capita Income in Cheraw is $26,958, while median incomes of families and households are $47,441 and $30,658 respectively.
| Characteristic | Number | Measure |
| Per Capita Income | 5,056 | $26,958 |
| Median Family Income | 1,114 | $47,441 |
| Mean Family Income | 1,114 | $73,899 |
| Median Household Income | 2,146 | $30,658 |
| Mean Household Income | 2,146 | $53,430 |
| Income Deficit | 1,114 | $15,247 |
| Wage / Income Gap (%) | 5,056 | 24.19% |
| Wage / Income Gap ($) | 5,056 | 75.81¢ per $1 |
| Gini / Inequality Index | 5,056 | 0.53 |
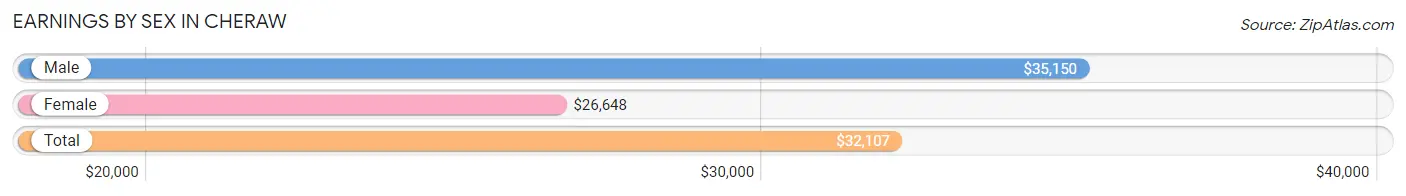
Earnings by Sex in Cheraw
Average Earnings in Cheraw are $32,107, $35,150 for men and $26,648 for women, a difference of 24.2%.
| Sex | Number | Average Earnings |
| Male | 1,281 (57.6%) | $35,150 |
| Female | 945 (42.4%) | $26,648 |
| Total | 2,226 (100.0%) | $32,107 |
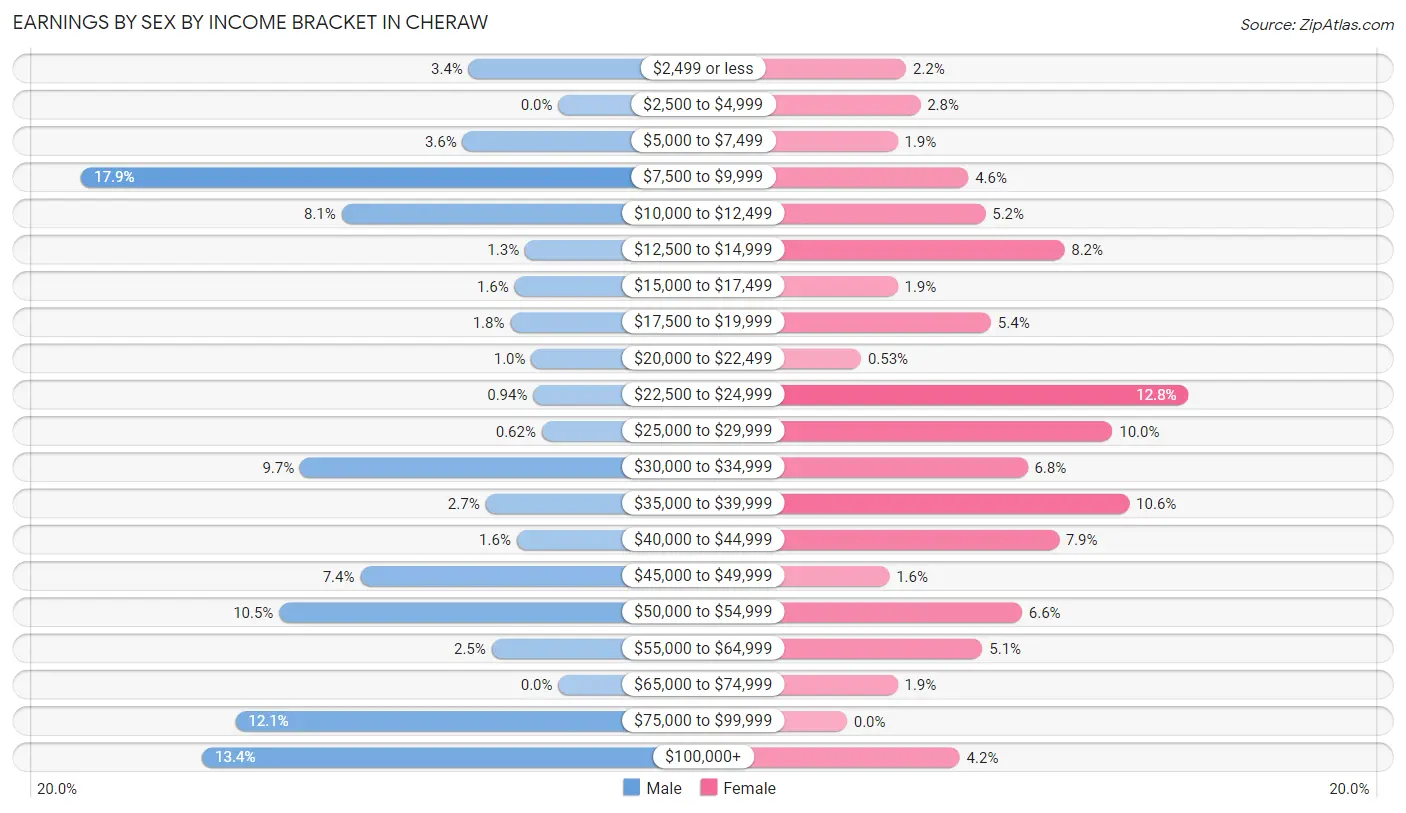
Earnings by Sex by Income Bracket in Cheraw
The most common earnings brackets in Cheraw are $7,500 to $9,999 for men (229 | 17.9%) and $22,500 to $24,999 for women (121 | 12.8%).
| Income | Male | Female |
| $2,499 or less | 43 (3.4%) | 21 (2.2%) |
| $2,500 to $4,999 | 0 (0.0%) | 26 (2.8%) |
| $5,000 to $7,499 | 46 (3.6%) | 18 (1.9%) |
| $7,500 to $9,999 | 229 (17.9%) | 43 (4.5%) |
| $10,000 to $12,499 | 104 (8.1%) | 49 (5.2%) |
| $12,500 to $14,999 | 16 (1.3%) | 77 (8.2%) |
| $15,000 to $17,499 | 21 (1.6%) | 18 (1.9%) |
| $17,500 to $19,999 | 23 (1.8%) | 51 (5.4%) |
| $20,000 to $22,499 | 13 (1.0%) | 5 (0.5%) |
| $22,500 to $24,999 | 12 (0.9%) | 121 (12.8%) |
| $25,000 to $29,999 | 8 (0.6%) | 94 (10.0%) |
| $30,000 to $34,999 | 124 (9.7%) | 64 (6.8%) |
| $35,000 to $39,999 | 35 (2.7%) | 100 (10.6%) |
| $40,000 to $44,999 | 20 (1.6%) | 75 (7.9%) |
| $45,000 to $49,999 | 95 (7.4%) | 15 (1.6%) |
| $50,000 to $54,999 | 134 (10.5%) | 62 (6.6%) |
| $55,000 to $64,999 | 32 (2.5%) | 48 (5.1%) |
| $65,000 to $74,999 | 0 (0.0%) | 18 (1.9%) |
| $75,000 to $99,999 | 155 (12.1%) | 0 (0.0%) |
| $100,000+ | 171 (13.4%) | 40 (4.2%) |
| Total | 1,281 (100.0%) | 945 (100.0%) |
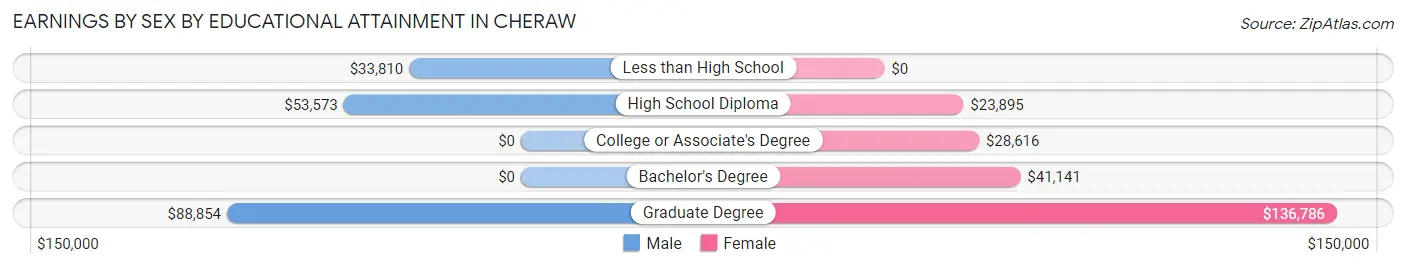
Earnings by Sex by Educational Attainment in Cheraw
Average earnings in Cheraw are $45,724 for men and $28,438 for women, a difference of 37.8%. Men with an educational attainment of graduate degree enjoy the highest average annual earnings of $88,854, while those with less than high school education earn the least with $33,810. Women with an educational attainment of graduate degree earn the most with the average annual earnings of $136,786, while those with high school diploma education have the smallest earnings of $23,895.
| Educational Attainment | Male Income | Female Income |
| Less than High School | $33,810 | $0 |
| High School Diploma | $53,573 | $23,895 |
| College or Associate's Degree | - | - |
| Bachelor's Degree | - | - |
| Graduate Degree | $88,854 | $136,786 |
| Total | $45,724 | $28,438 |
Family Income in Cheraw
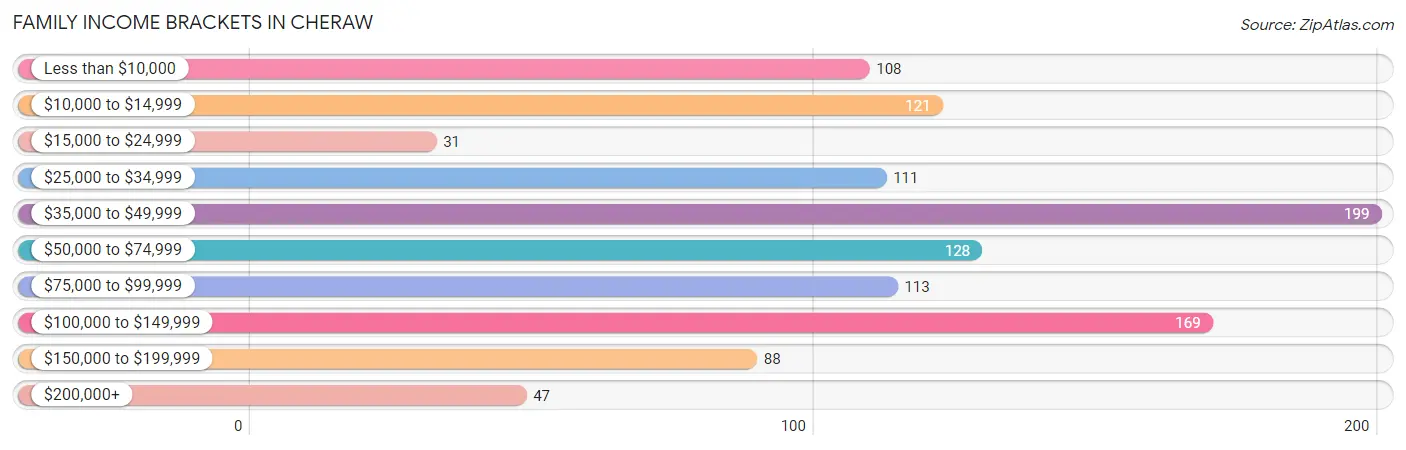
Family Income Brackets in Cheraw
According to the Cheraw family income data, there are 199 families falling into the $35,000 to $49,999 income range, which is the most common income bracket and makes up 17.9% of all families. Conversely, the $15,000 to $24,999 income bracket is the least frequent group with only 31 families (2.8%) belonging to this category.
| Income Bracket | # Families | % Families |
| Less than $10,000 | 108 | 9.7% |
| $10,000 to $14,999 | 121 | 10.9% |
| $15,000 to $24,999 | 31 | 2.8% |
| $25,000 to $34,999 | 111 | 10.0% |
| $35,000 to $49,999 | 199 | 17.9% |
| $50,000 to $74,999 | 128 | 11.5% |
| $75,000 to $99,999 | 113 | 10.1% |
| $100,000 to $149,999 | 169 | 15.2% |
| $150,000 to $199,999 | 88 | 7.9% |
| $200,000+ | 47 | 4.2% |
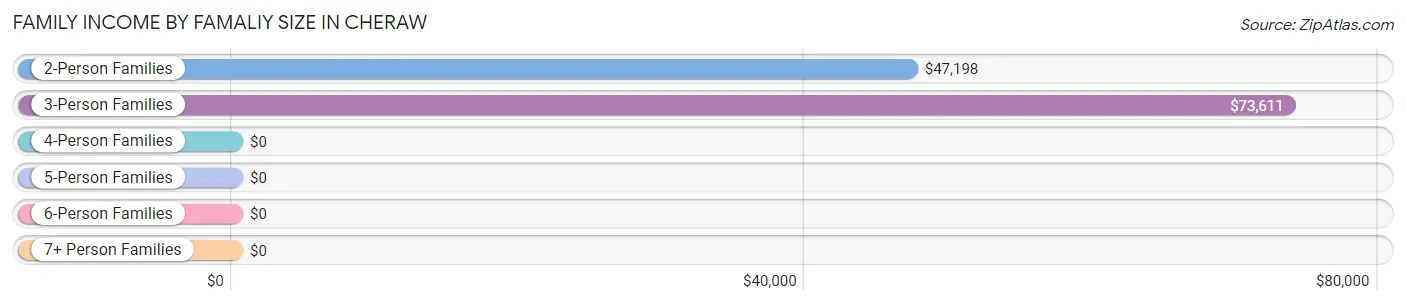
Family Income by Famaliy Size in Cheraw
3-person families (340 | 30.5%) account for the highest median family income in Cheraw with $73,611 per family, while 3-person families (340 | 30.5%) have the highest median income of $24,537 per family member.
| Income Bracket | # Families | Median Income |
| 2-Person Families | 638 (57.3%) | $47,198 |
| 3-Person Families | 340 (30.5%) | $73,611 |
| 4-Person Families | 78 (7.0%) | $0 |
| 5-Person Families | 3 (0.3%) | $0 |
| 6-Person Families | 18 (1.6%) | $0 |
| 7+ Person Families | 37 (3.3%) | $0 |
| Total | 1,114 (100.0%) | $47,441 |
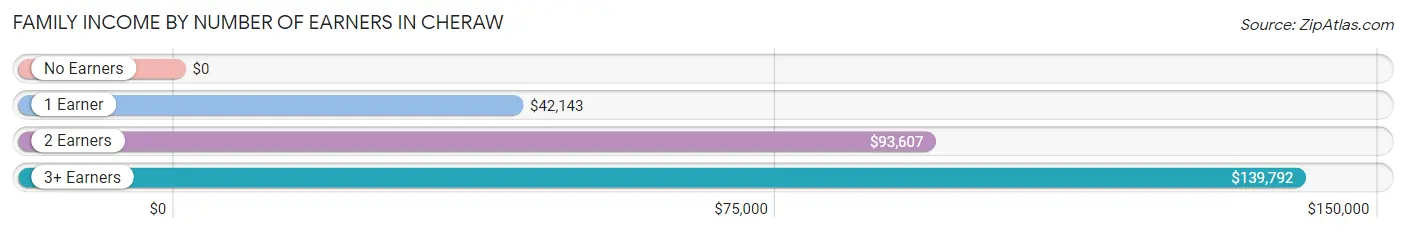
Family Income by Number of Earners in Cheraw
| Number of Earners | # Families | Median Income |
| No Earners | 184 (16.5%) | $0 |
| 1 Earner | 518 (46.5%) | $42,143 |
| 2 Earners | 329 (29.5%) | $93,607 |
| 3+ Earners | 83 (7.4%) | $139,792 |
| Total | 1,114 (100.0%) | $47,441 |
Household Income in Cheraw
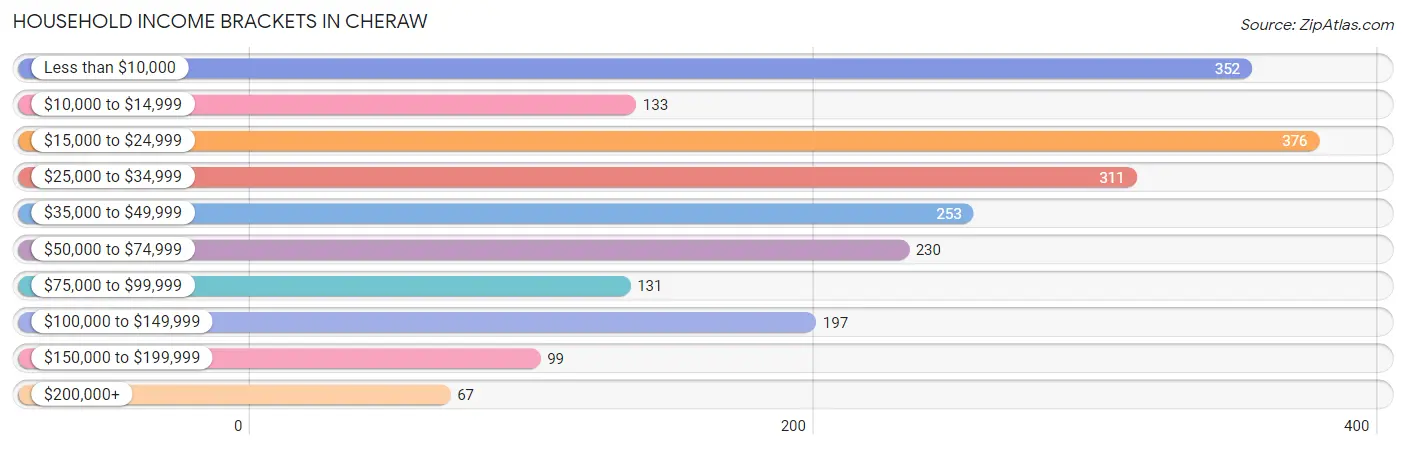
Household Income Brackets in Cheraw
With 376 households falling in the category, the $15,000 to $24,999 income range is the most frequent in Cheraw, accounting for 17.5% of all households. In contrast, only 67 households (3.1%) fall into the $200,000+ income bracket, making it the least populous group.
| Income Bracket | # Households | % Households |
| Less than $10,000 | 352 | 16.4% |
| $10,000 to $14,999 | 133 | 6.2% |
| $15,000 to $24,999 | 376 | 17.5% |
| $25,000 to $34,999 | 311 | 14.5% |
| $35,000 to $49,999 | 253 | 11.8% |
| $50,000 to $74,999 | 230 | 10.7% |
| $75,000 to $99,999 | 131 | 6.1% |
| $100,000 to $149,999 | 197 | 9.2% |
| $150,000 to $199,999 | 99 | 4.6% |
| $200,000+ | 67 | 3.1% |
Household Income by Householder Age in Cheraw
The median household income in Cheraw is $30,658, with the highest median household income of $43,712 found in the 45 to 64 years age bracket for the primary householder. A total of 1,007 households (46.9%) fall into this category. Meanwhile, the 15 to 24 years age bracket for the primary householder has the lowest median household income of $0, with 42 households (2.0%) in this group.
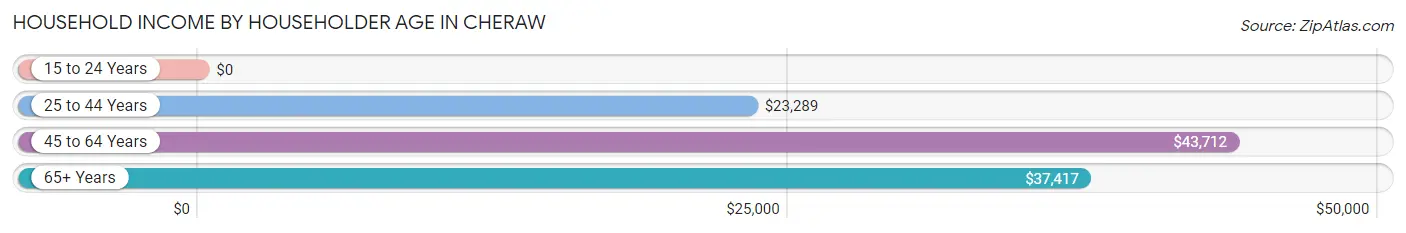
| Income Bracket | # Households | Median Income |
| 15 to 24 Years | 42 (2.0%) | $0 |
| 25 to 44 Years | 512 (23.9%) | $23,289 |
| 45 to 64 Years | 1,007 (46.9%) | $43,712 |
| 65+ Years | 585 (27.3%) | $37,417 |
| Total | 2,146 (100.0%) | $30,658 |
Poverty in Cheraw
Income Below Poverty by Sex and Age in Cheraw
With 38.8% poverty level for males and 28.4% for females among the residents of Cheraw, 16 and 17 year old males and 15 year old females are the most vulnerable to poverty, with 144 males (84.2%) and 30 females (100.0%) in their respective age groups living below the poverty level.
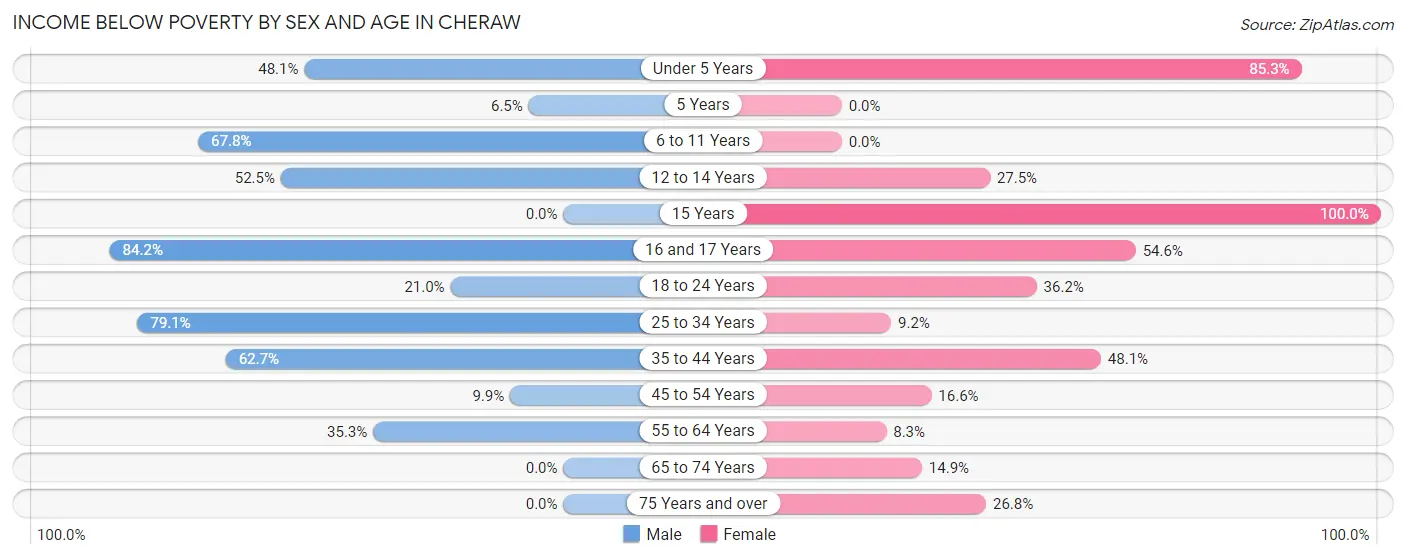
| Age Bracket | Male | Female |
| Under 5 Years | 50 (48.1%) | 151 (85.3%) |
| 5 Years | 6 (6.5%) | 0 (0.0%) |
| 6 to 11 Years | 61 (67.8%) | 0 (0.0%) |
| 12 to 14 Years | 75 (52.4%) | 11 (27.5%) |
| 15 Years | 0 (0.0%) | 30 (100.0%) |
| 16 and 17 Years | 144 (84.2%) | 18 (54.5%) |
| 18 to 24 Years | 35 (21.0%) | 68 (36.2%) |
| 25 to 34 Years | 317 (79.0%) | 15 (9.1%) |
| 35 to 44 Years | 94 (62.7%) | 151 (48.1%) |
| 45 to 54 Years | 36 (9.9%) | 80 (16.6%) |
| 55 to 64 Years | 149 (35.3%) | 27 (8.3%) |
| 65 to 74 Years | 0 (0.0%) | 29 (14.9%) |
| 75 Years and over | 0 (0.0%) | 79 (26.8%) |
| Total | 967 (38.8%) | 659 (28.4%) |
Income Above Poverty by Sex and Age in Cheraw
According to the poverty statistics in Cheraw, males aged 65 to 74 years and females aged 6 to 11 years are the age groups that are most secure financially, with 100.0% of males and 100.0% of females in these age groups living above the poverty line.
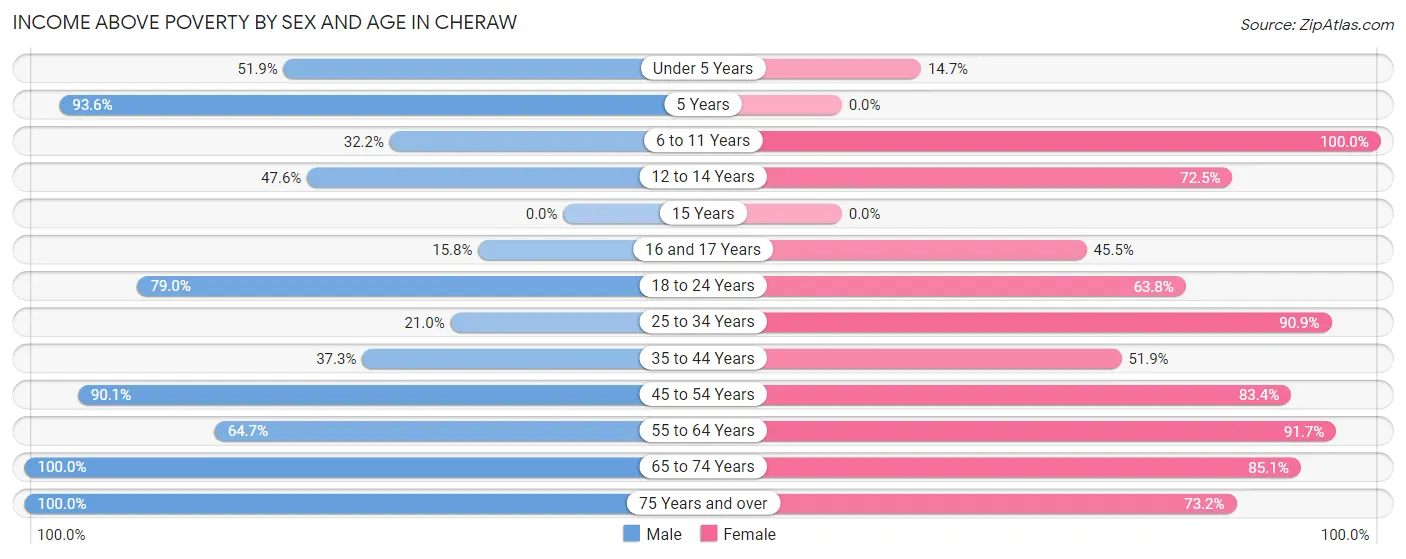
| Age Bracket | Male | Female |
| Under 5 Years | 54 (51.9%) | 26 (14.7%) |
| 5 Years | 87 (93.5%) | 0 (0.0%) |
| 6 to 11 Years | 29 (32.2%) | 78 (100.0%) |
| 12 to 14 Years | 68 (47.5%) | 29 (72.5%) |
| 15 Years | 0 (0.0%) | 0 (0.0%) |
| 16 and 17 Years | 27 (15.8%) | 15 (45.5%) |
| 18 to 24 Years | 132 (79.0%) | 120 (63.8%) |
| 25 to 34 Years | 84 (20.9%) | 149 (90.8%) |
| 35 to 44 Years | 56 (37.3%) | 163 (51.9%) |
| 45 to 54 Years | 328 (90.1%) | 401 (83.4%) |
| 55 to 64 Years | 273 (64.7%) | 300 (91.7%) |
| 65 to 74 Years | 276 (100.0%) | 166 (85.1%) |
| 75 Years and over | 112 (100.0%) | 216 (73.2%) |
| Total | 1,526 (61.2%) | 1,663 (71.6%) |
Income Below Poverty Among Married-Couple Families in Cheraw
The poverty statistics for married-couple families in Cheraw show that 12.5% or 82 of the total 658 families live below the poverty line. Families with 5 or more children have the highest poverty rate of 100.0%, comprising of 35 families. On the other hand, families with no children have the lowest poverty rate of 0.0%, which includes 0 families.
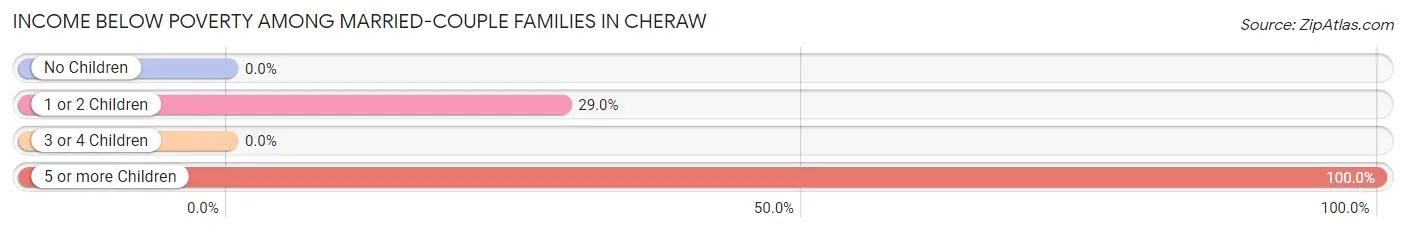
| Children | Above Poverty | Below Poverty |
| No Children | 461 (100.0%) | 0 (0.0%) |
| 1 or 2 Children | 115 (71.0%) | 47 (29.0%) |
| 3 or 4 Children | 0 (0.0%) | 0 (0.0%) |
| 5 or more Children | 0 (0.0%) | 35 (100.0%) |
| Total | 576 (87.5%) | 82 (12.5%) |
Income Below Poverty Among Single-Parent Households in Cheraw
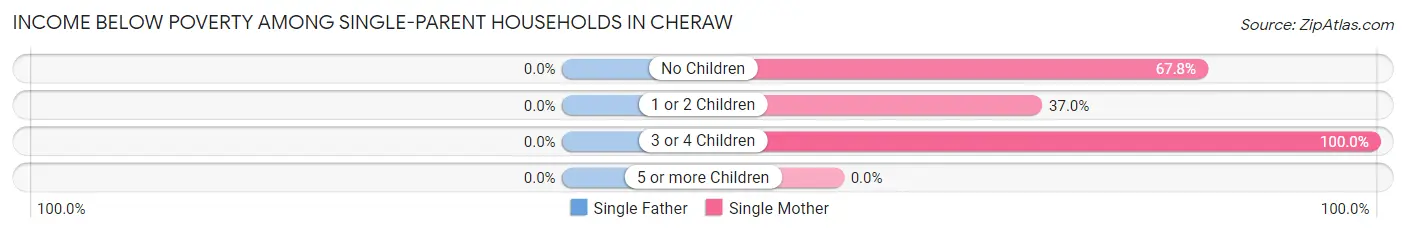
| Children | Single Father | Single Mother |
| No Children | 0 (0.0%) | 78 (67.8%) |
| 1 or 2 Children | 0 (0.0%) | 85 (37.0%) |
| 3 or 4 Children | 0 (0.0%) | 17 (100.0%) |
| 5 or more Children | 0 (0.0%) | 0 (0.0%) |
| Total | 0 (0.0%) | 180 (49.7%) |
Income Below Poverty Among Married-Couple vs Single-Parent Households in Cheraw
The poverty data for Cheraw shows that 82 of the married-couple family households (12.5%) and 180 of the single-parent households (39.5%) are living below the poverty level. Within the married-couple family households, those with 5 or more children have the highest poverty rate, with 35 households (100.0%) falling below the poverty line. Among the single-parent households, those with 3 or 4 children have the highest poverty rate, with 17 household (100.0%) living below poverty.
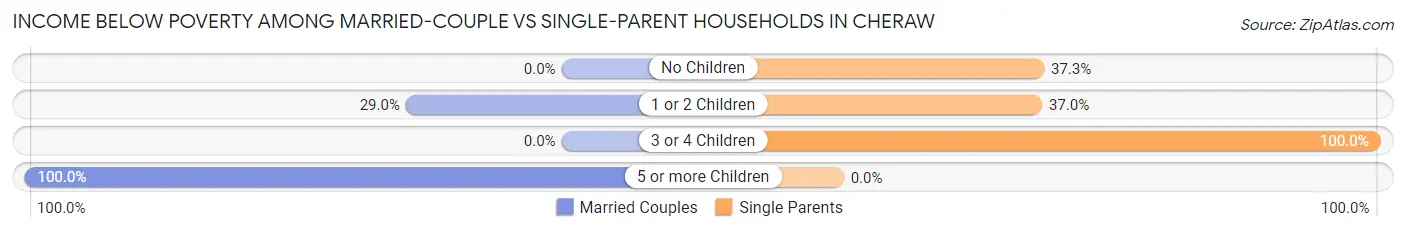
| Children | Married-Couple Families | Single-Parent Households |
| No Children | 0 (0.0%) | 78 (37.3%) |
| 1 or 2 Children | 47 (29.0%) | 85 (37.0%) |
| 3 or 4 Children | 0 (0.0%) | 17 (100.0%) |
| 5 or more Children | 35 (100.0%) | 0 (0.0%) |
| Total | 82 (12.5%) | 180 (39.5%) |
Race in Cheraw
The most populous races in Cheraw are White / Caucasian (2,489 | 49.2%), Black / African American (2,286 | 45.2%), and Hispanic or Latino (263 | 5.2%).
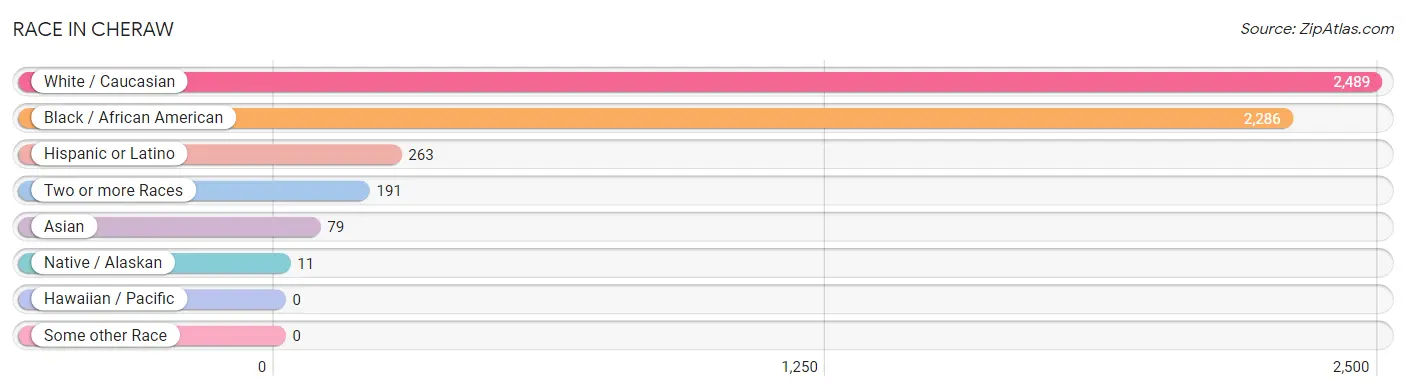
| Race | # Population | % Population |
| Asian | 79 | 1.6% |
| Black / African American | 2,286 | 45.2% |
| Hawaiian / Pacific | 0 | 0.0% |
| Hispanic or Latino | 263 | 5.2% |
| Native / Alaskan | 11 | 0.2% |
| White / Caucasian | 2,489 | 49.2% |
| Two or more Races | 191 | 3.8% |
| Some other Race | 0 | 0.0% |
| Total | 5,056 | 100.0% |
Ancestry in Cheraw
The most populous ancestries reported in Cheraw are English (432 | 8.5%), American (230 | 4.5%), German (188 | 3.7%), Mexican (163 | 3.2%), and Cherokee (140 | 2.8%), together accounting for 22.8% of all Cheraw residents.
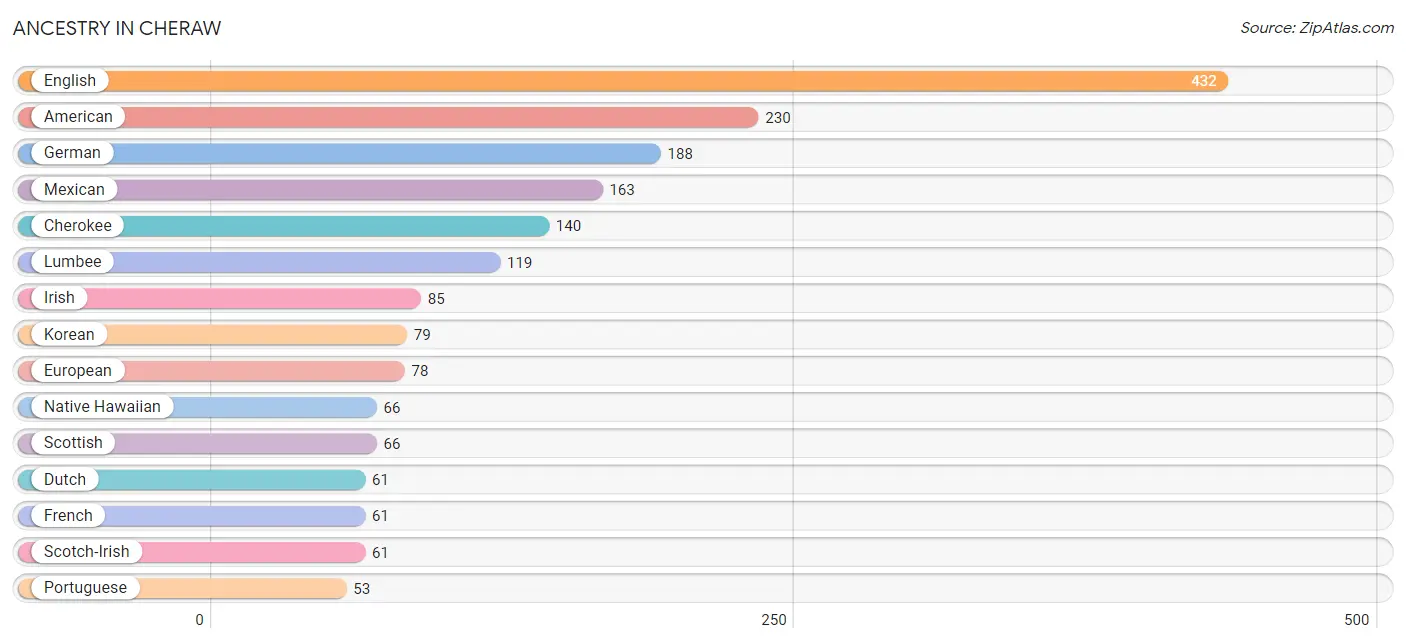
| Ancestry | # Population | % Population |
| American | 230 | 4.5% |
| Central American | 41 | 0.8% |
| Cherokee | 140 | 2.8% |
| Costa Rican | 41 | 0.8% |
| Dutch | 61 | 1.2% |
| English | 432 | 8.5% |
| European | 78 | 1.5% |
| French | 61 | 1.2% |
| German | 188 | 3.7% |
| Irish | 85 | 1.7% |
| Italian | 16 | 0.3% |
| Korean | 79 | 1.6% |
| Lumbee | 119 | 2.4% |
| Mexican | 163 | 3.2% |
| Native Hawaiian | 66 | 1.3% |
| Northern European | 40 | 0.8% |
| Polish | 9 | 0.2% |
| Portuguese | 53 | 1.1% |
| Puerto Rican | 30 | 0.6% |
| Romanian | 10 | 0.2% |
| Russian | 10 | 0.2% |
| Scandinavian | 14 | 0.3% |
| Scotch-Irish | 61 | 1.2% |
| Scottish | 66 | 1.3% |
| Welsh | 19 | 0.4% |
| Yugoslavian | 7 | 0.1% | View All 26 Rows |
Immigrants in Cheraw
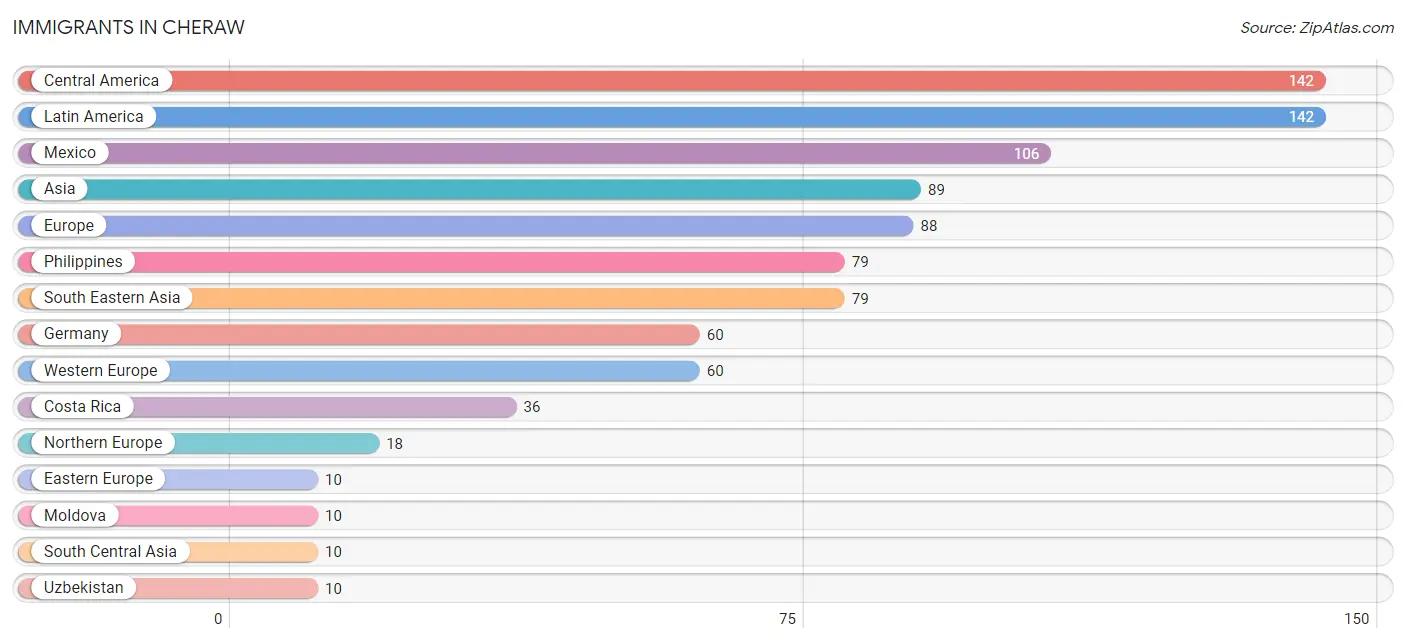
The most numerous immigrant groups reported in Cheraw came from Central America (142 | 2.8%), Latin America (142 | 2.8%), Mexico (106 | 2.1%), Asia (89 | 1.8%), and Europe (88 | 1.7%), together accounting for 11.2% of all Cheraw residents.
| Immigration Origin | # Population | % Population |
| Asia | 89 | 1.8% |
| Central America | 142 | 2.8% |
| Costa Rica | 36 | 0.7% |
| Eastern Europe | 10 | 0.2% |
| Europe | 88 | 1.7% |
| Germany | 60 | 1.2% |
| Latin America | 142 | 2.8% |
| Mexico | 106 | 2.1% |
| Moldova | 10 | 0.2% |
| Northern Europe | 18 | 0.4% |
| Philippines | 79 | 1.6% |
| South Central Asia | 10 | 0.2% |
| South Eastern Asia | 79 | 1.6% |
| Uzbekistan | 10 | 0.2% |
| Western Europe | 60 | 1.2% | View All 15 Rows |
Sex and Age in Cheraw
Sex and Age in Cheraw
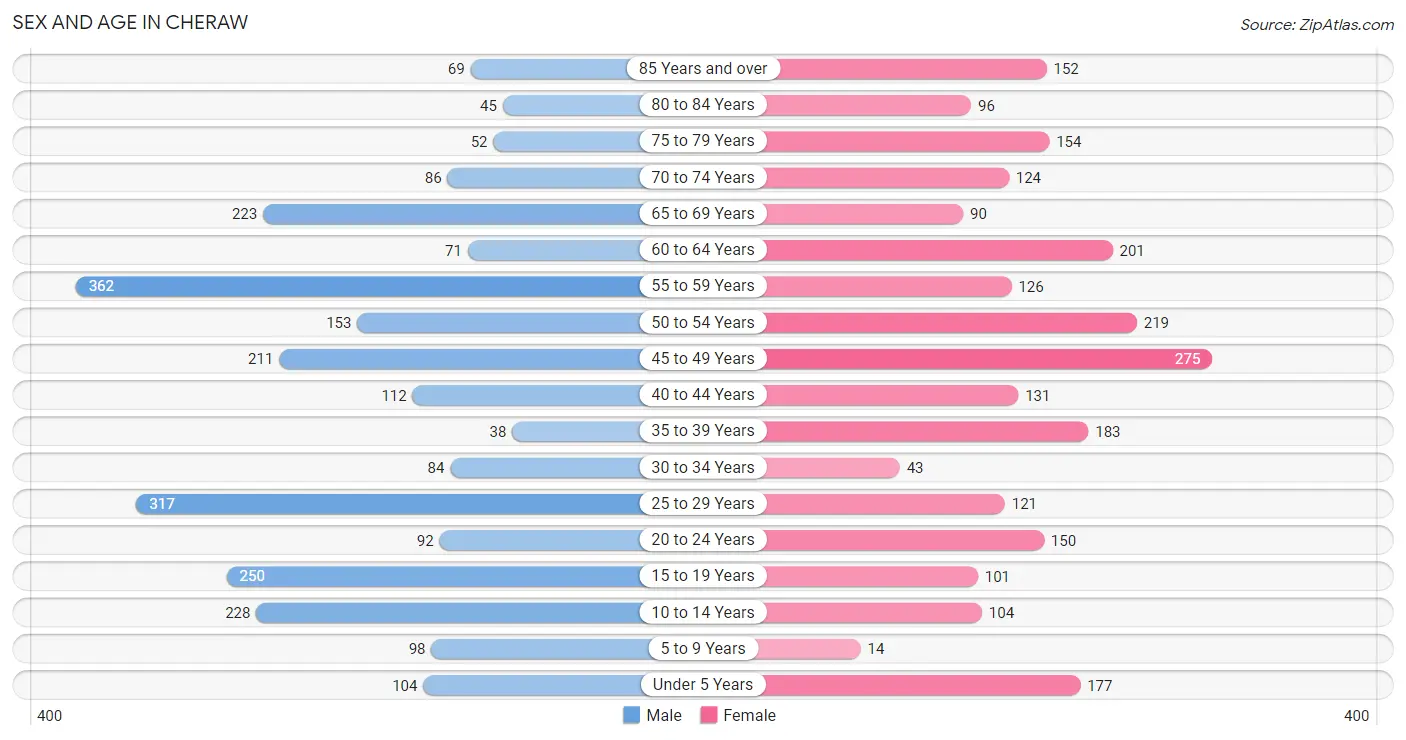
The most populous age groups in Cheraw are 55 to 59 Years (362 | 14.0%) for men and 45 to 49 Years (275 | 11.2%) for women.
| Age Bracket | Male | Female |
| Under 5 Years | 104 (4.0%) | 177 (7.2%) |
| 5 to 9 Years | 98 (3.8%) | 14 (0.6%) |
| 10 to 14 Years | 228 (8.8%) | 104 (4.2%) |
| 15 to 19 Years | 250 (9.6%) | 101 (4.1%) |
| 20 to 24 Years | 92 (3.5%) | 150 (6.1%) |
| 25 to 29 Years | 317 (12.2%) | 121 (4.9%) |
| 30 to 34 Years | 84 (3.2%) | 43 (1.8%) |
| 35 to 39 Years | 38 (1.5%) | 183 (7.4%) |
| 40 to 44 Years | 112 (4.3%) | 131 (5.3%) |
| 45 to 49 Years | 211 (8.1%) | 275 (11.2%) |
| 50 to 54 Years | 153 (5.9%) | 219 (8.9%) |
| 55 to 59 Years | 362 (14.0%) | 126 (5.1%) |
| 60 to 64 Years | 71 (2.7%) | 201 (8.2%) |
| 65 to 69 Years | 223 (8.6%) | 90 (3.7%) |
| 70 to 74 Years | 86 (3.3%) | 124 (5.0%) |
| 75 to 79 Years | 52 (2.0%) | 154 (6.3%) |
| 80 to 84 Years | 45 (1.7%) | 96 (3.9%) |
| 85 Years and over | 69 (2.7%) | 152 (6.2%) |
| Total | 2,595 (100.0%) | 2,461 (100.0%) |
Families and Households in Cheraw
Median Family Size in Cheraw
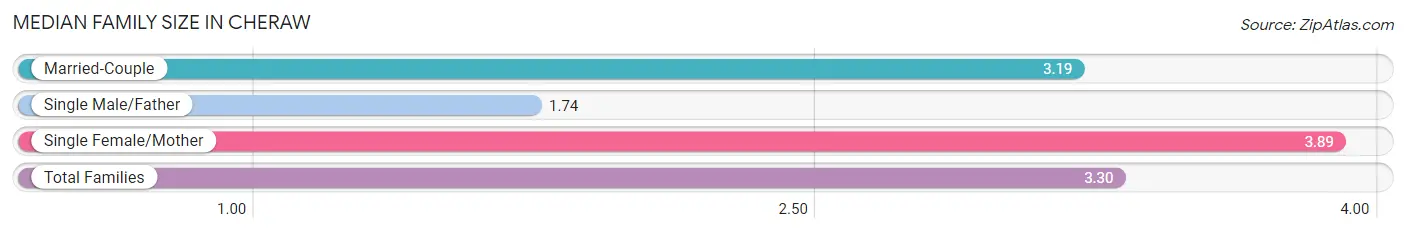
The median family size in Cheraw is 3.30 persons per family, with single female/mother families (362 | 32.5%) accounting for the largest median family size of 3.89 persons per family. On the other hand, single male/father families (94 | 8.4%) represent the smallest median family size with 1.74 persons per family.
| Family Type | # Families | Family Size |
| Married-Couple | 658 (59.1%) | 3.19 |
| Single Male/Father | 94 (8.4%) | 1.74 |
| Single Female/Mother | 362 (32.5%) | 3.89 |
| Total Families | 1,114 (100.0%) | 3.30 |
Median Household Size in Cheraw
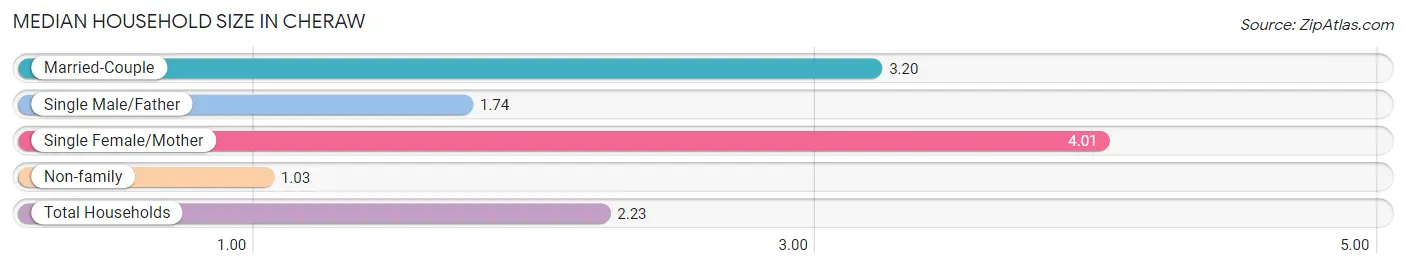
The median household size in Cheraw is 2.23 persons per household, with single female/mother households (362 | 16.9%) accounting for the largest median household size of 4.01 persons per household. non-family households (1,032 | 48.1%) represent the smallest median household size with 1.03 persons per household.
| Household Type | # Households | Household Size |
| Married-Couple | 658 (30.7%) | 3.20 |
| Single Male/Father | 94 (4.4%) | 1.74 |
| Single Female/Mother | 362 (16.9%) | 4.01 |
| Non-family | 1,032 (48.1%) | 1.03 |
| Total Households | 2,146 (100.0%) | 2.23 |
Household Size by Marriage Status in Cheraw
Out of a total of 2,146 households in Cheraw, 1,114 (51.9%) are family households, while 1,032 (48.1%) are nonfamily households. The most numerous type of family households are 2-person households, comprising 588, and the most common type of nonfamily households are 1-person households, comprising 1,001.
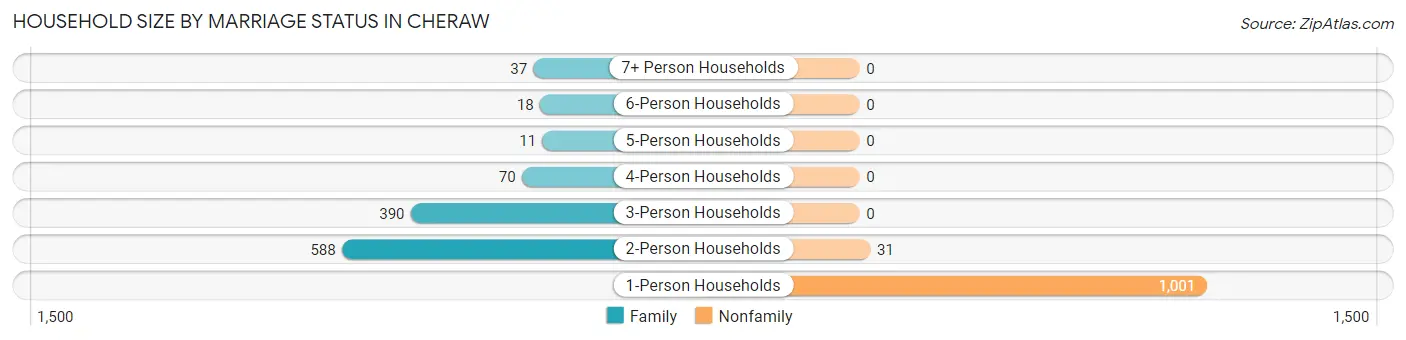
| Household Size | Family Households | Nonfamily Households |
| 1-Person Households | - | 1,001 (46.6%) |
| 2-Person Households | 588 (27.4%) | 31 (1.4%) |
| 3-Person Households | 390 (18.2%) | 0 (0.0%) |
| 4-Person Households | 70 (3.3%) | 0 (0.0%) |
| 5-Person Households | 11 (0.5%) | 0 (0.0%) |
| 6-Person Households | 18 (0.8%) | 0 (0.0%) |
| 7+ Person Households | 37 (1.7%) | 0 (0.0%) |
| Total | 1,114 (51.9%) | 1,032 (48.1%) |
Female Fertility in Cheraw
Fertility by Age in Cheraw
Average fertility rate in Cheraw is 34.0 births per 1,000 women. Women in the age bracket of 20 to 34 years have the highest fertility rate with 48.0 births per 1,000 women. Women in the age bracket of 35 to 50 years acount for 59.5% of all women with births.
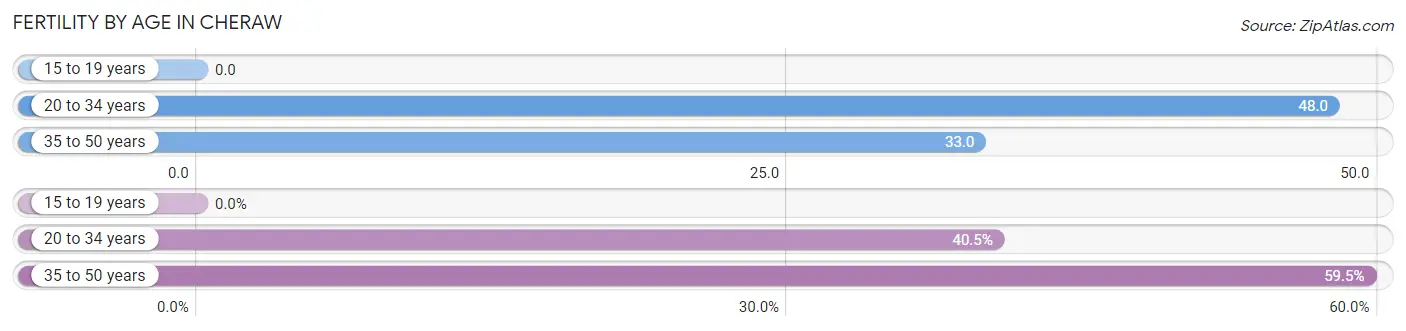
| Age Bracket | Women with Births | Births / 1,000 Women |
| 15 to 19 years | 0 (0.0%) | 0.0 |
| 20 to 34 years | 15 (40.5%) | 48.0 |
| 35 to 50 years | 22 (59.5%) | 33.0 |
| Total | 37 (100.0%) | 34.0 |
Fertility by Age by Marriage Status in Cheraw
59.5% of women with births (37) in Cheraw are married. The highest percentage of unmarried women with births falls into 20 to 34 years age bracket with 100.0% of them unmarried at the time of birth, while the lowest percentage of unmarried women with births belong to 35 to 50 years age bracket with 0.0% of them unmarried.
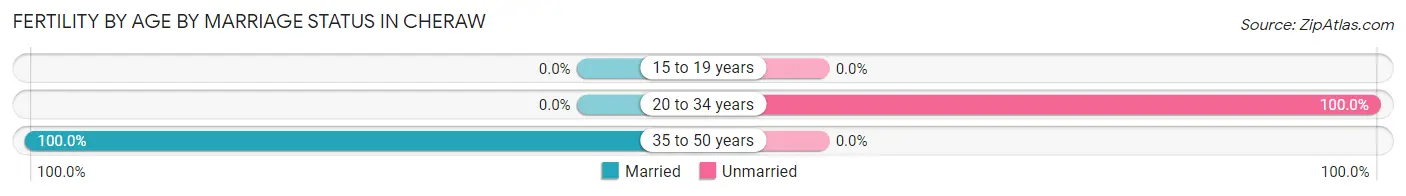
| Age Bracket | Married | Unmarried |
| 15 to 19 years | 0 (0.0%) | 0 (0.0%) |
| 20 to 34 years | 0 (0.0%) | 15 (100.0%) |
| 35 to 50 years | 22 (100.0%) | 0 (0.0%) |
| Total | 22 (59.5%) | 15 (40.5%) |
Fertility by Education in Cheraw
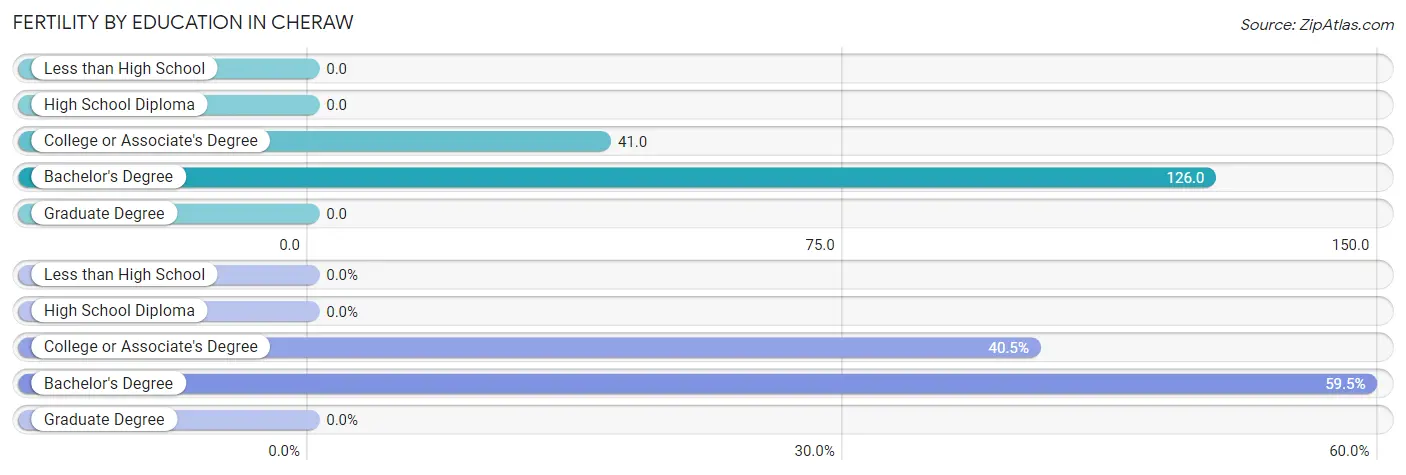
| Educational Attainment | Women with Births | Births / 1,000 Women |
| Less than High School | 0 (0.0%) | 0.0 |
| High School Diploma | 0 (0.0%) | 0.0 |
| College or Associate's Degree | 15 (40.5%) | 41.0 |
| Bachelor's Degree | 22 (59.5%) | 126.0 |
| Graduate Degree | 0 (0.0%) | 0.0 |
| Total | 37 (100.0%) | 34.0 |
Fertility by Education by Marriage Status in Cheraw
40.5% of women with births in Cheraw are unmarried. Women with the educational attainment of bachelor's degree are most likely to be married with 100.0% of them married at childbirth, while women with the educational attainment of college or associate's degree are least likely to be married with 100.0% of them unmarried at childbirth.
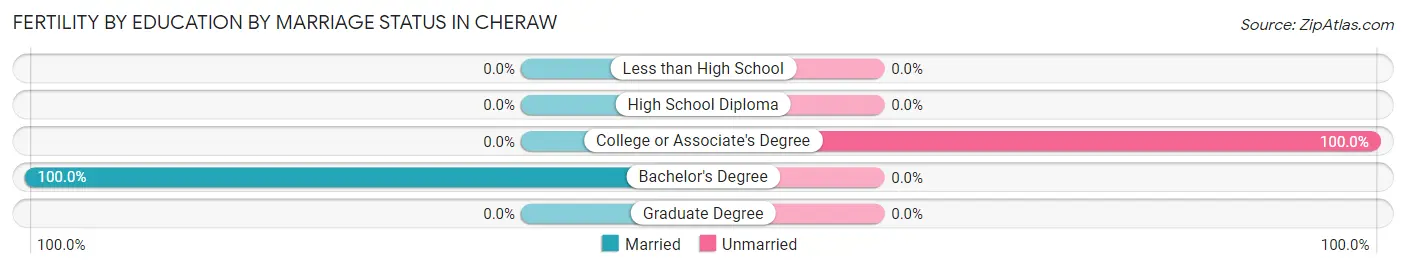
| Educational Attainment | Married | Unmarried |
| Less than High School | 0 (0.0%) | 0 (0.0%) |
| High School Diploma | 0 (0.0%) | 0 (0.0%) |
| College or Associate's Degree | 0 (0.0%) | 15 (100.0%) |
| Bachelor's Degree | 22 (100.0%) | 0 (0.0%) |
| Graduate Degree | 0 (0.0%) | 0 (0.0%) |
| Total | 22 (59.5%) | 15 (40.5%) |
Employment Characteristics in Cheraw
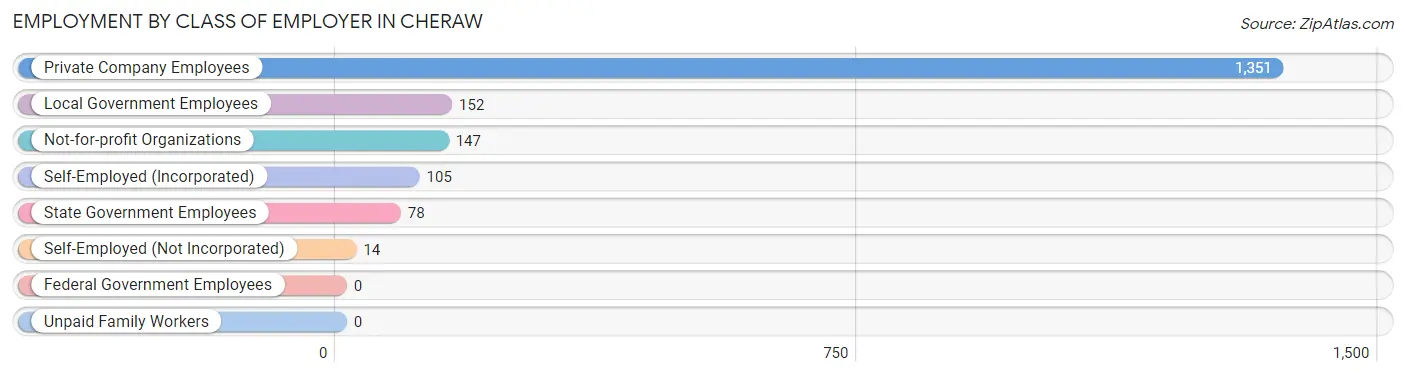
Employment by Class of Employer in Cheraw
Among the 1,847 employed individuals in Cheraw, private company employees (1,351 | 73.2%), local government employees (152 | 8.2%), and not-for-profit organizations (147 | 8.0%) make up the most common classes of employment.
| Employer Class | # Employees | % Employees |
| Private Company Employees | 1,351 | 73.2% |
| Self-Employed (Incorporated) | 105 | 5.7% |
| Self-Employed (Not Incorporated) | 14 | 0.8% |
| Not-for-profit Organizations | 147 | 8.0% |
| Local Government Employees | 152 | 8.2% |
| State Government Employees | 78 | 4.2% |
| Federal Government Employees | 0 | 0.0% |
| Unpaid Family Workers | 0 | 0.0% |
| Total | 1,847 | 100.0% |
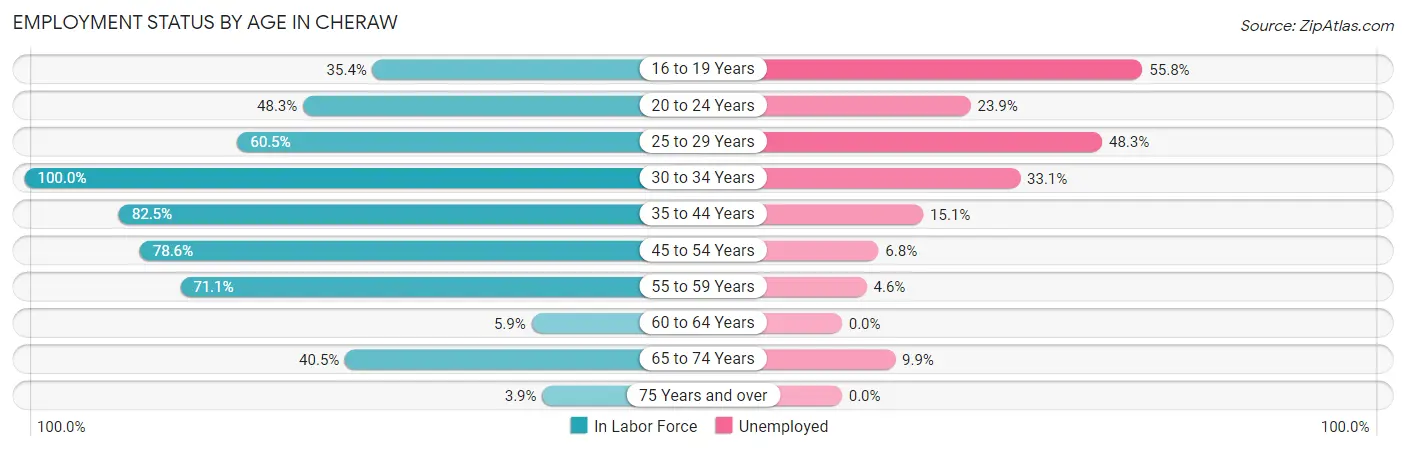
Employment Status by Age in Cheraw
According to the labor force statistics for Cheraw, out of the total population over 16 years of age (4,299), 52.9% or 2,274 individuals are in the labor force, with 17.7% or 402 of them unemployed. The age group with the highest labor force participation rate is 30 to 34 years, with 100.0% or 127 individuals in the labor force. Within the labor force, the 16 to 19 years age range has the highest percentage of unemployed individuals, with 55.8% or 63 of them being unemployed.
| Age Bracket | In Labor Force | Unemployed |
| 16 to 19 Years | 113 (35.4%) | 63 (55.8%) |
| 20 to 24 Years | 117 (48.3%) | 28 (23.9%) |
| 25 to 29 Years | 265 (60.5%) | 128 (48.3%) |
| 30 to 34 Years | 127 (100.0%) | 42 (33.1%) |
| 35 to 44 Years | 383 (82.5%) | 58 (15.1%) |
| 45 to 54 Years | 674 (78.6%) | 46 (6.8%) |
| 55 to 59 Years | 347 (71.1%) | 16 (4.6%) |
| 60 to 64 Years | 16 (5.9%) | 0 (0.0%) |
| 65 to 74 Years | 212 (40.5%) | 21 (9.9%) |
| 75 Years and over | 22 (3.9%) | 0 (0.0%) |
| Total | 2,274 (52.9%) | 402 (17.7%) |
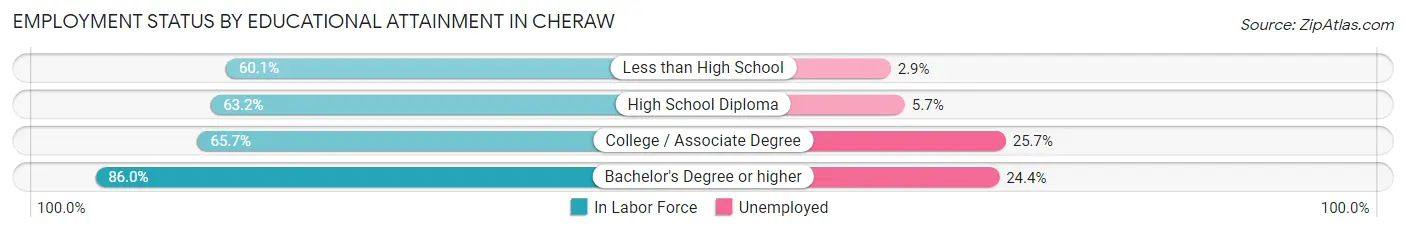
Employment Status by Educational Attainment in Cheraw
According to labor force statistics for Cheraw, 68.5% of individuals (1,813) out of the total population between 25 and 64 years of age (2,647) are in the labor force, with 16.0% or 290 of them being unemployed. The group with the highest labor force participation rate are those with the educational attainment of bachelor's degree or higher, with 86.0% or 509 individuals in the labor force. Within the labor force, individuals with college / associate degree education have the highest percentage of unemployment, with 25.7% or 128 of them being unemployed.
| Educational Attainment | In Labor Force | Unemployed |
| Less than High School | 277 (60.1%) | 13 (2.9%) |
| High School Diploma | 528 (63.2%) | 48 (5.7%) |
| College / Associate Degree | 498 (65.7%) | 195 (25.7%) |
| Bachelor's Degree or higher | 509 (86.0%) | 144 (24.4%) |
| Total | 1,813 (68.5%) | 424 (16.0%) |
Employment Occupations by Sex in Cheraw
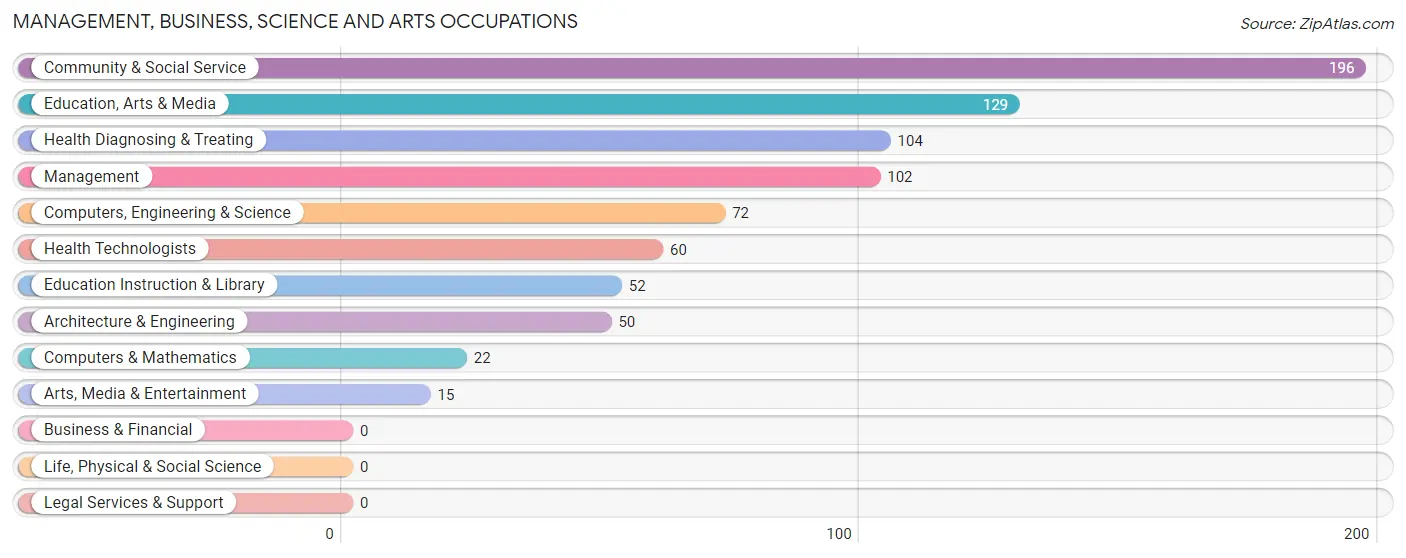
Management, Business, Science and Arts Occupations
The most common Management, Business, Science and Arts occupations in Cheraw are Community & Social Service (196 | 10.5%), Education, Arts & Media (129 | 6.9%), Health Diagnosing & Treating (104 | 5.6%), Management (102 | 5.4%), and Computers, Engineering & Science (72 | 3.8%).
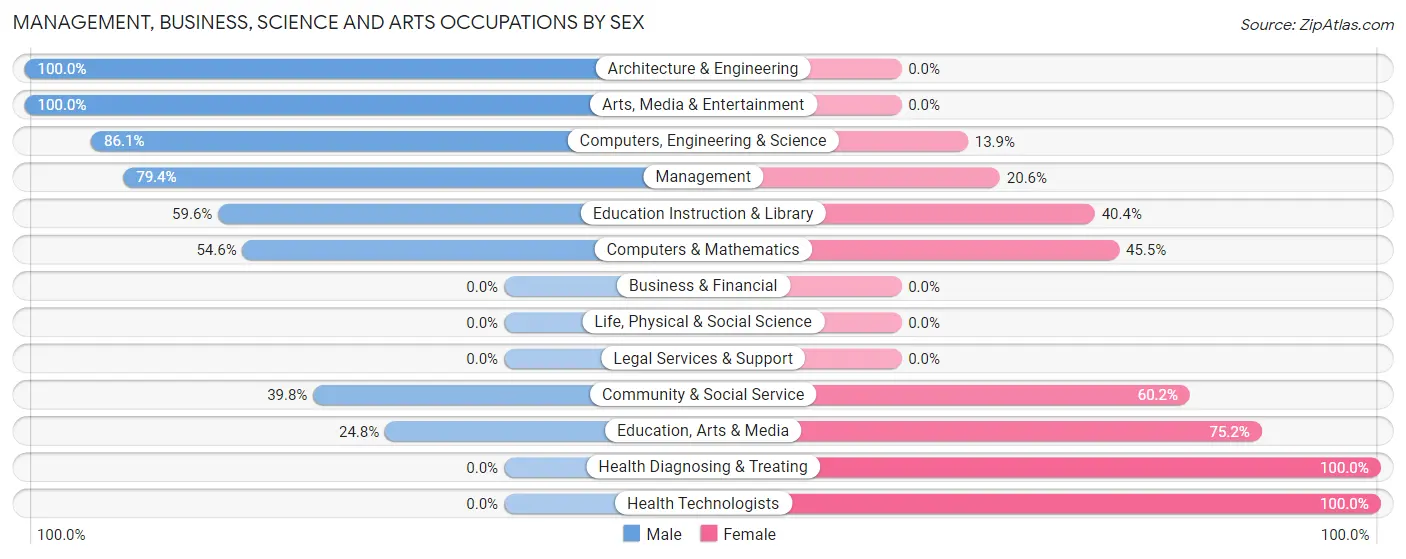
Management, Business, Science and Arts Occupations by Sex
Within the Management, Business, Science and Arts occupations in Cheraw, the most male-oriented occupations are Architecture & Engineering (100.0%), Arts, Media & Entertainment (100.0%), and Computers, Engineering & Science (86.1%), while the most female-oriented occupations are Health Diagnosing & Treating (100.0%), Health Technologists (100.0%), and Education, Arts & Media (75.2%).
| Occupation | Male | Female |
| Management | 81 (79.4%) | 21 (20.6%) |
| Business & Financial | 0 (0.0%) | 0 (0.0%) |
| Computers, Engineering & Science | 62 (86.1%) | 10 (13.9%) |
| Computers & Mathematics | 12 (54.5%) | 10 (45.5%) |
| Architecture & Engineering | 50 (100.0%) | 0 (0.0%) |
| Life, Physical & Social Science | 0 (0.0%) | 0 (0.0%) |
| Community & Social Service | 78 (39.8%) | 118 (60.2%) |
| Education, Arts & Media | 32 (24.8%) | 97 (75.2%) |
| Legal Services & Support | 0 (0.0%) | 0 (0.0%) |
| Education Instruction & Library | 31 (59.6%) | 21 (40.4%) |
| Arts, Media & Entertainment | 15 (100.0%) | 0 (0.0%) |
| Health Diagnosing & Treating | 0 (0.0%) | 104 (100.0%) |
| Health Technologists | 0 (0.0%) | 60 (100.0%) |
| Total (Category) | 221 (46.6%) | 253 (53.4%) |
| Total (Overall) | 999 (53.3%) | 875 (46.7%) |
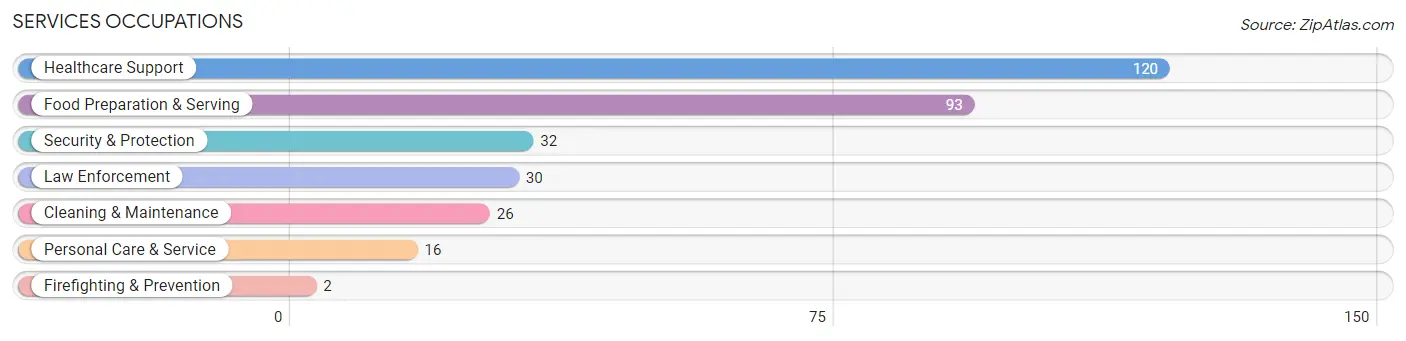
Services Occupations
The most common Services occupations in Cheraw are Healthcare Support (120 | 6.4%), Food Preparation & Serving (93 | 5.0%), Security & Protection (32 | 1.7%), Law Enforcement (30 | 1.6%), and Cleaning & Maintenance (26 | 1.4%).
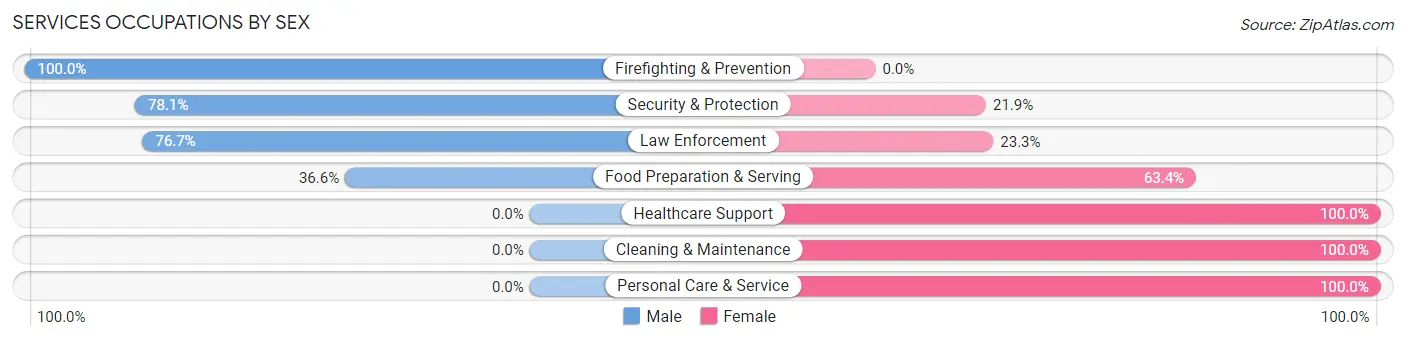
Services Occupations by Sex
Within the Services occupations in Cheraw, the most male-oriented occupations are Firefighting & Prevention (100.0%), Security & Protection (78.1%), and Law Enforcement (76.7%), while the most female-oriented occupations are Healthcare Support (100.0%), Cleaning & Maintenance (100.0%), and Personal Care & Service (100.0%).
| Occupation | Male | Female |
| Healthcare Support | 0 (0.0%) | 120 (100.0%) |
| Security & Protection | 25 (78.1%) | 7 (21.9%) |
| Firefighting & Prevention | 2 (100.0%) | 0 (0.0%) |
| Law Enforcement | 23 (76.7%) | 7 (23.3%) |
| Food Preparation & Serving | 34 (36.6%) | 59 (63.4%) |
| Cleaning & Maintenance | 0 (0.0%) | 26 (100.0%) |
| Personal Care & Service | 0 (0.0%) | 16 (100.0%) |
| Total (Category) | 59 (20.6%) | 228 (79.4%) |
| Total (Overall) | 999 (53.3%) | 875 (46.7%) |
Sales and Office Occupations
The most common Sales and Office occupations in Cheraw are Office & Administration (121 | 6.5%), and Sales & Related (68 | 3.6%).
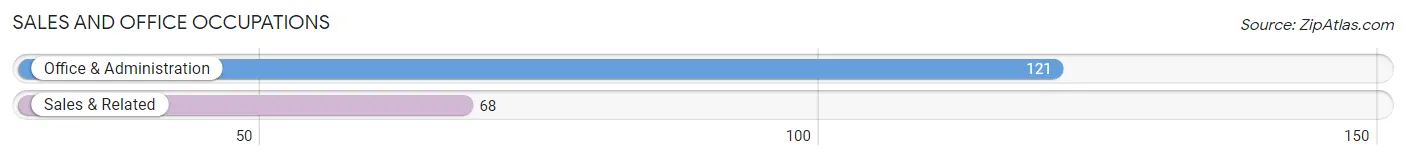
Sales and Office Occupations by Sex
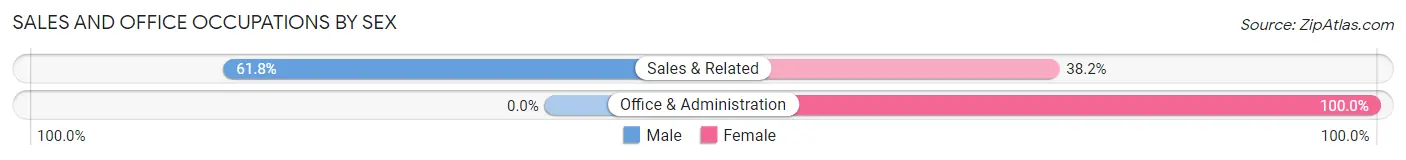
| Occupation | Male | Female |
| Sales & Related | 42 (61.8%) | 26 (38.2%) |
| Office & Administration | 0 (0.0%) | 121 (100.0%) |
| Total (Category) | 42 (22.2%) | 147 (77.8%) |
| Total (Overall) | 999 (53.3%) | 875 (46.7%) |
Natural Resources, Construction and Maintenance Occupations
The most common Natural Resources, Construction and Maintenance occupations in Cheraw are Installation, Maintenance & Repair (181 | 9.7%), and Farming, Fishing & Forestry (16 | 0.9%).
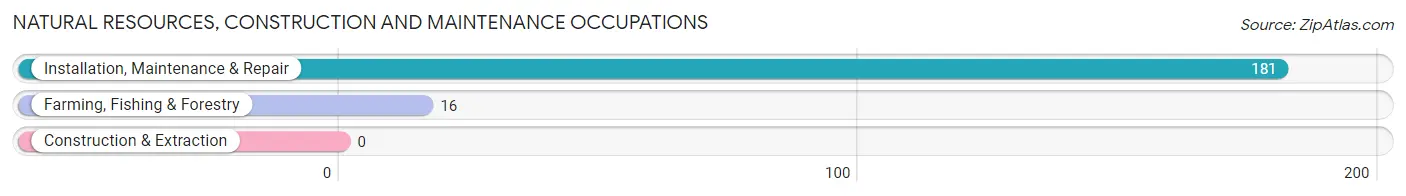
Natural Resources, Construction and Maintenance Occupations by Sex
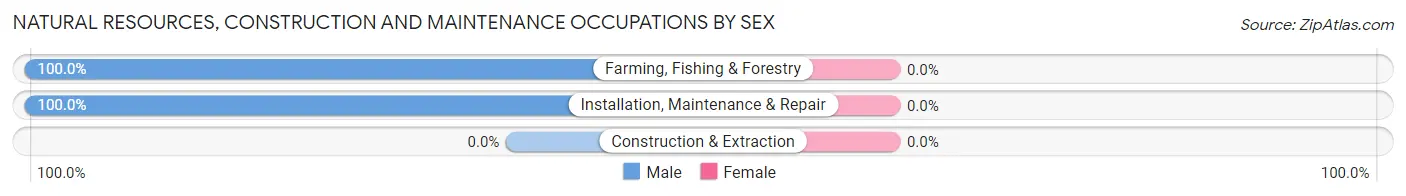
| Occupation | Male | Female |
| Farming, Fishing & Forestry | 16 (100.0%) | 0 (0.0%) |
| Construction & Extraction | 0 (0.0%) | 0 (0.0%) |
| Installation, Maintenance & Repair | 181 (100.0%) | 0 (0.0%) |
| Total (Category) | 197 (100.0%) | 0 (0.0%) |
| Total (Overall) | 999 (53.3%) | 875 (46.7%) |
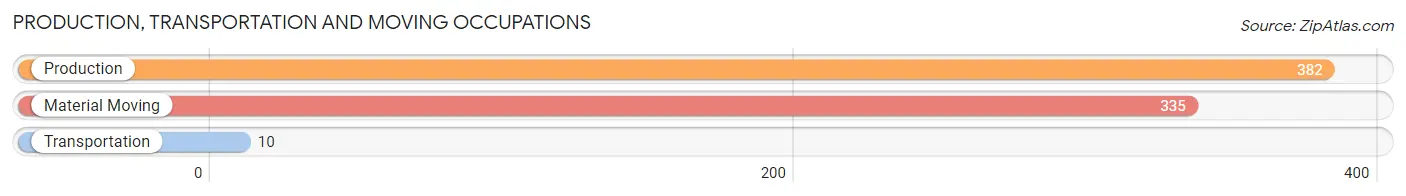
Production, Transportation and Moving Occupations
The most common Production, Transportation and Moving occupations in Cheraw are Production (382 | 20.4%), Material Moving (335 | 17.9%), and Transportation (10 | 0.5%).
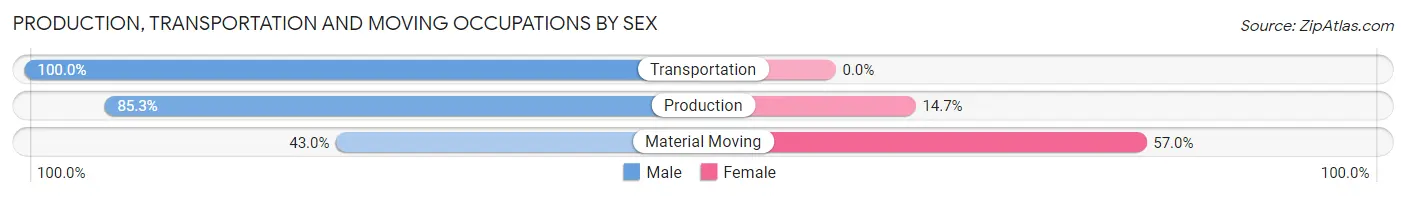
Production, Transportation and Moving Occupations by Sex
| Occupation | Male | Female |
| Production | 326 (85.3%) | 56 (14.7%) |
| Transportation | 10 (100.0%) | 0 (0.0%) |
| Material Moving | 144 (43.0%) | 191 (57.0%) |
| Total (Category) | 480 (66.0%) | 247 (34.0%) |
| Total (Overall) | 999 (53.3%) | 875 (46.7%) |
Employment Industries by Sex in Cheraw
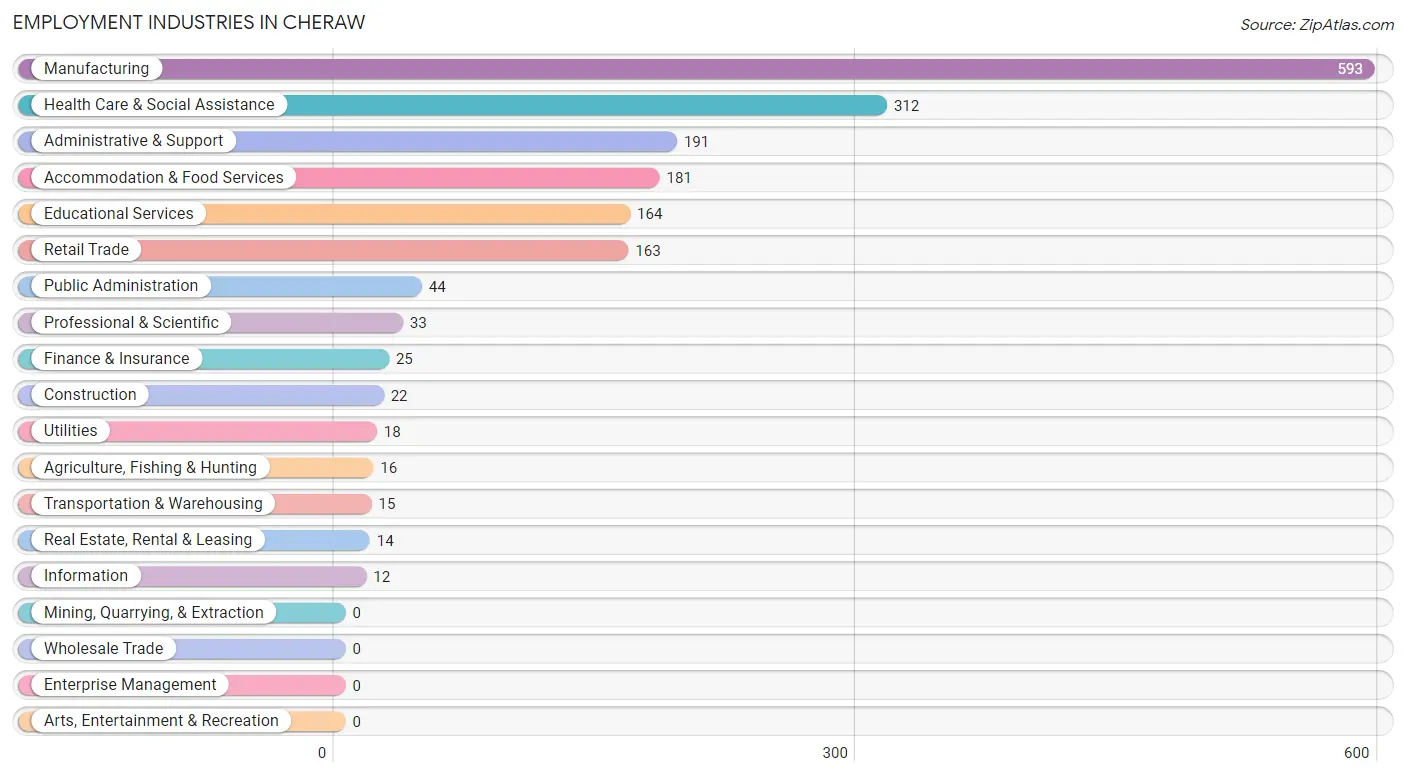
Employment Industries in Cheraw
The major employment industries in Cheraw include Manufacturing (593 | 31.6%), Health Care & Social Assistance (312 | 16.7%), Administrative & Support (191 | 10.2%), Accommodation & Food Services (181 | 9.7%), and Educational Services (164 | 8.7%).
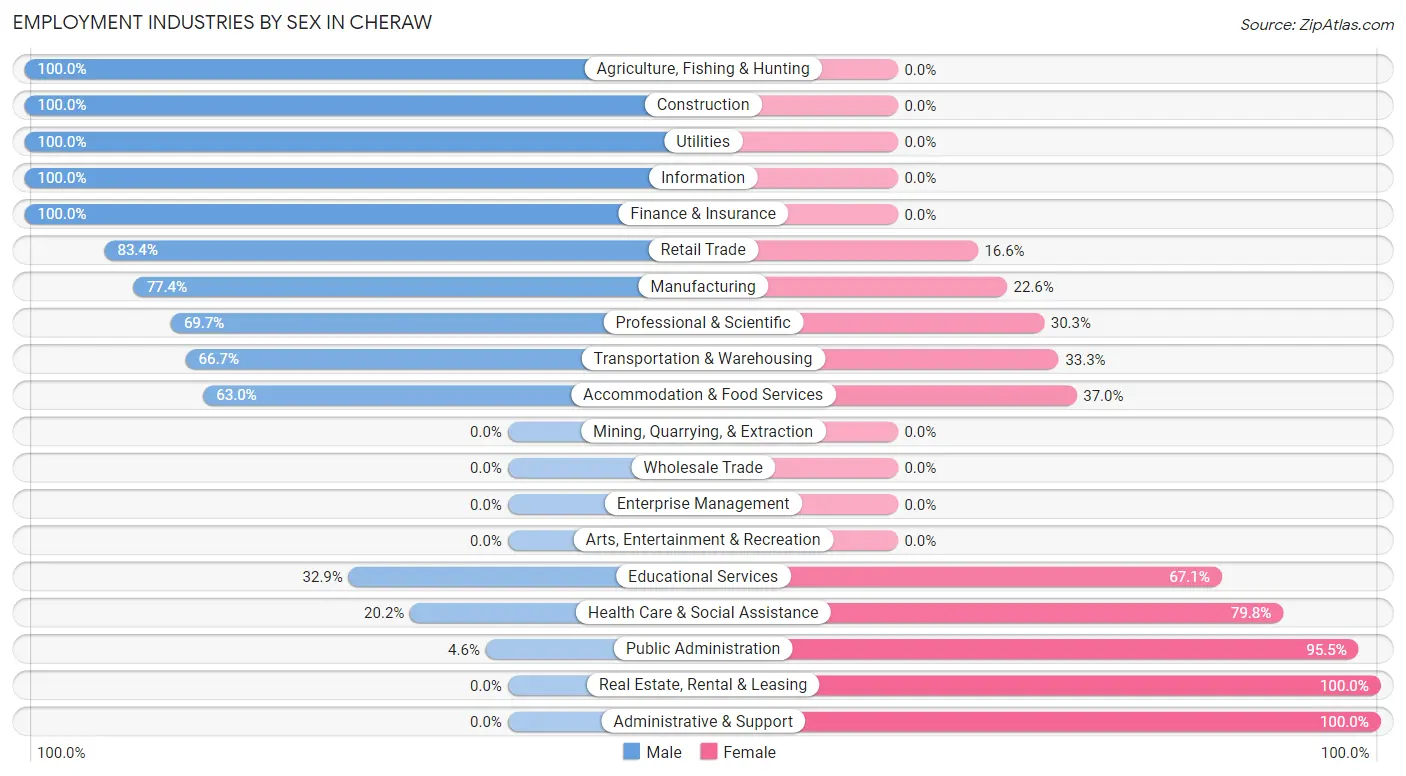
Employment Industries by Sex in Cheraw
The Cheraw industries that see more men than women are Agriculture, Fishing & Hunting (100.0%), Construction (100.0%), and Utilities (100.0%), whereas the industries that tend to have a higher number of women are Real Estate, Rental & Leasing (100.0%), Administrative & Support (100.0%), and Public Administration (95.5%).
| Industry | Male | Female |
| Agriculture, Fishing & Hunting | 16 (100.0%) | 0 (0.0%) |
| Mining, Quarrying, & Extraction | 0 (0.0%) | 0 (0.0%) |
| Construction | 22 (100.0%) | 0 (0.0%) |
| Manufacturing | 459 (77.4%) | 134 (22.6%) |
| Wholesale Trade | 0 (0.0%) | 0 (0.0%) |
| Retail Trade | 136 (83.4%) | 27 (16.6%) |
| Transportation & Warehousing | 10 (66.7%) | 5 (33.3%) |
| Utilities | 18 (100.0%) | 0 (0.0%) |
| Information | 12 (100.0%) | 0 (0.0%) |
| Finance & Insurance | 25 (100.0%) | 0 (0.0%) |
| Real Estate, Rental & Leasing | 0 (0.0%) | 14 (100.0%) |
| Professional & Scientific | 23 (69.7%) | 10 (30.3%) |
| Enterprise Management | 0 (0.0%) | 0 (0.0%) |
| Administrative & Support | 0 (0.0%) | 191 (100.0%) |
| Educational Services | 54 (32.9%) | 110 (67.1%) |
| Health Care & Social Assistance | 63 (20.2%) | 249 (79.8%) |
| Arts, Entertainment & Recreation | 0 (0.0%) | 0 (0.0%) |
| Accommodation & Food Services | 114 (63.0%) | 67 (37.0%) |
| Public Administration | 2 (4.5%) | 42 (95.5%) |
| Total | 999 (53.3%) | 875 (46.7%) |
Education in Cheraw
School Enrollment in Cheraw
The most common levels of schooling among the 994 students in Cheraw are middle school (248 | 24.9%), high school (237 | 23.8%), and graduate / professional (177 | 17.8%).
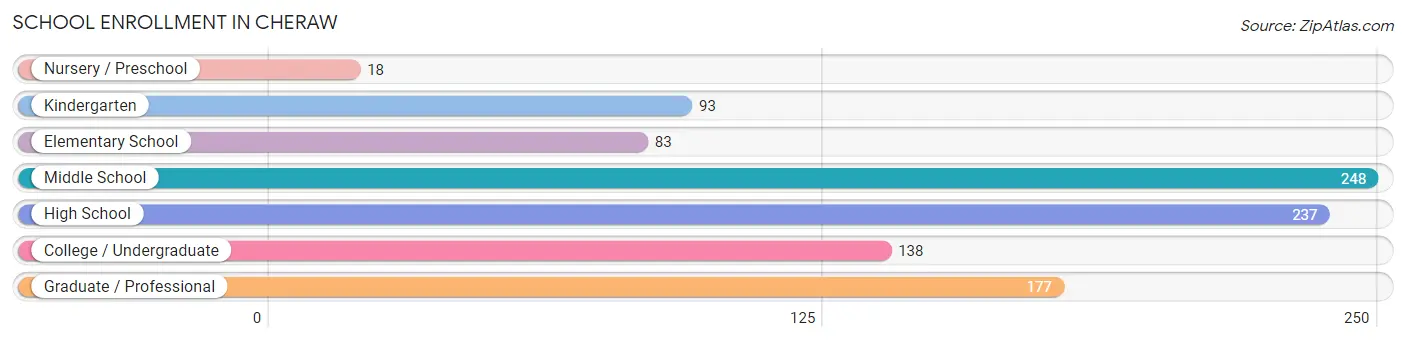
| School Level | # Students | % Students |
| Nursery / Preschool | 18 | 1.8% |
| Kindergarten | 93 | 9.4% |
| Elementary School | 83 | 8.4% |
| Middle School | 248 | 24.9% |
| High School | 237 | 23.8% |
| College / Undergraduate | 138 | 13.9% |
| Graduate / Professional | 177 | 17.8% |
| Total | 994 | 100.0% |
School Enrollment by Age by Funding Source in Cheraw
Out of a total of 994 students who are enrolled in schools in Cheraw, 174 (17.5%) attend a private institution, while the remaining 820 (82.5%) are enrolled in public schools. The age group of 20 to 24 year olds has the highest likelihood of being enrolled in private schools, with 111 (100.0% in the age bracket) enrolled. Conversely, the age group of 3 to 4 year olds has the lowest likelihood of being enrolled in a private school, with 18 (100.0% in the age bracket) attending a public institution.
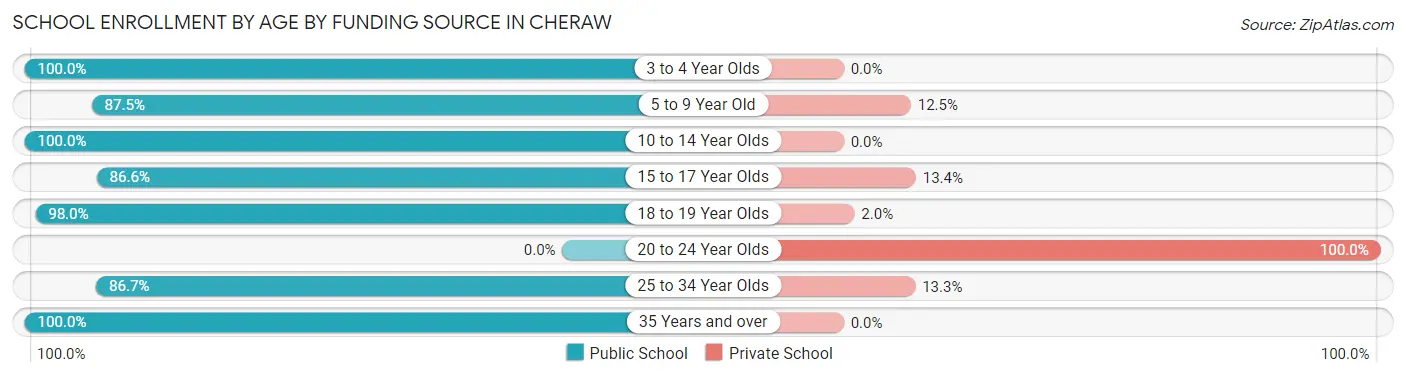
| Age Bracket | Public School | Private School |
| 3 to 4 Year Olds | 18 (100.0%) | 0 (0.0%) |
| 5 to 9 Year Old | 98 (87.5%) | 14 (12.5%) |
| 10 to 14 Year Olds | 332 (100.0%) | 0 (0.0%) |
| 15 to 17 Year Olds | 116 (86.6%) | 18 (13.4%) |
| 18 to 19 Year Olds | 49 (98.0%) | 1 (2.0%) |
| 20 to 24 Year Olds | 0 (0.0%) | 111 (100.0%) |
| 25 to 34 Year Olds | 195 (86.7%) | 30 (13.3%) |
| 35 Years and over | 12 (100.0%) | 0 (0.0%) |
| Total | 820 (82.5%) | 174 (17.5%) |
Educational Attainment by Field of Study in Cheraw
Education (319 | 39.1%), science & technology (84 | 10.3%), arts & humanities (83 | 10.2%), literature & languages (73 | 9.0%), and psychology (59 | 7.2%) are the most common fields of study among 815 individuals in Cheraw who have obtained a bachelor's degree or higher.
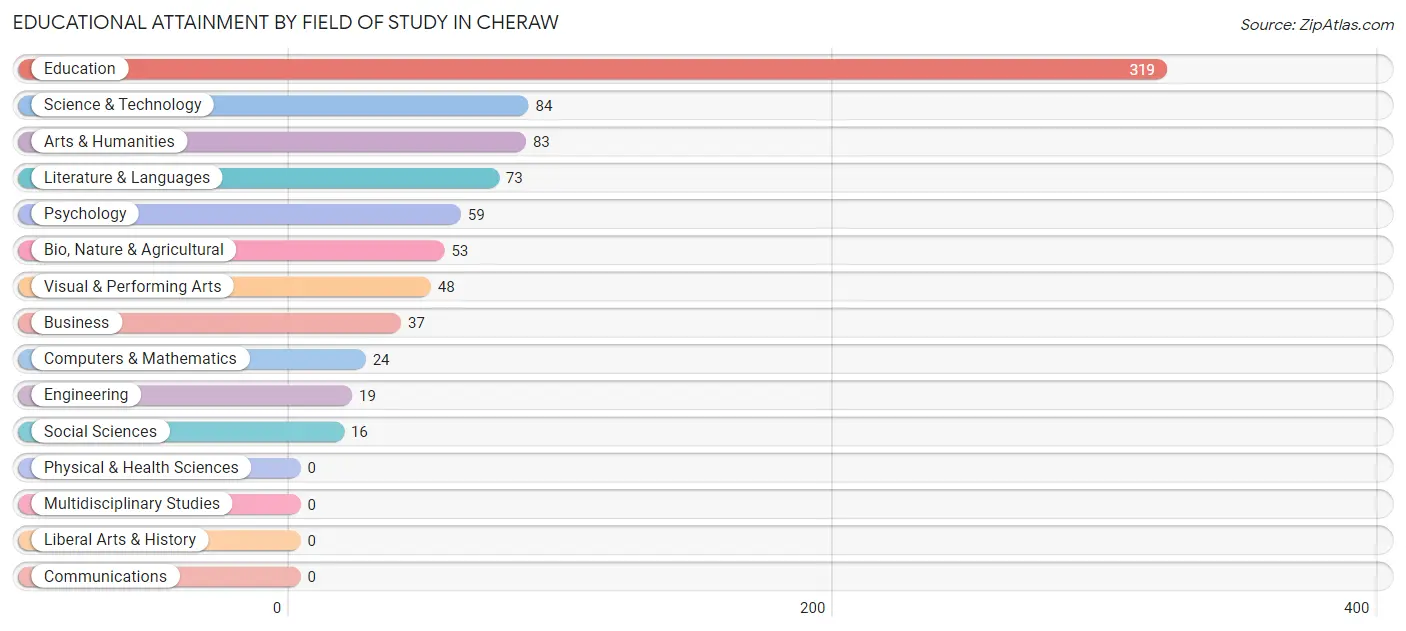
| Field of Study | # Graduates | % Graduates |
| Computers & Mathematics | 24 | 2.9% |
| Bio, Nature & Agricultural | 53 | 6.5% |
| Physical & Health Sciences | 0 | 0.0% |
| Psychology | 59 | 7.2% |
| Social Sciences | 16 | 2.0% |
| Engineering | 19 | 2.3% |
| Multidisciplinary Studies | 0 | 0.0% |
| Science & Technology | 84 | 10.3% |
| Business | 37 | 4.5% |
| Education | 319 | 39.1% |
| Literature & Languages | 73 | 9.0% |
| Liberal Arts & History | 0 | 0.0% |
| Visual & Performing Arts | 48 | 5.9% |
| Communications | 0 | 0.0% |
| Arts & Humanities | 83 | 10.2% |
| Total | 815 | 100.0% |
Transportation & Commute in Cheraw
Vehicle Availability by Sex in Cheraw
The most prevalent vehicle ownership categories in Cheraw are males with 2 vehicles (481, accounting for 49.7%) and females with 2 vehicles (292, making up 55.7%).
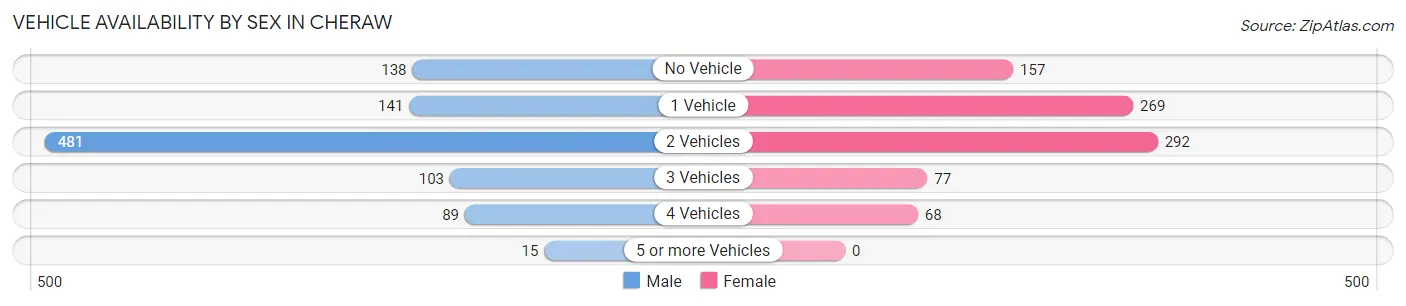
| Vehicles Available | Male | Female |
| No Vehicle | 138 (14.3%) | 157 (18.2%) |
| 1 Vehicle | 141 (14.6%) | 269 (31.2%) |
| 2 Vehicles | 481 (49.7%) | 292 (33.8%) |
| 3 Vehicles | 103 (10.6%) | 77 (8.9%) |
| 4 Vehicles | 89 (9.2%) | 68 (7.9%) |
| 5 or more Vehicles | 15 (1.5%) | 0 (0.0%) |
| Total | 967 (100.0%) | 863 (100.0%) |
Commute Time in Cheraw
The most frequently occuring commute durations in Cheraw are 10 to 14 minutes (590 commuters, 32.2%), 5 to 9 minutes (367 commuters, 20.1%), and less than 5 minutes (270 commuters, 14.7%).
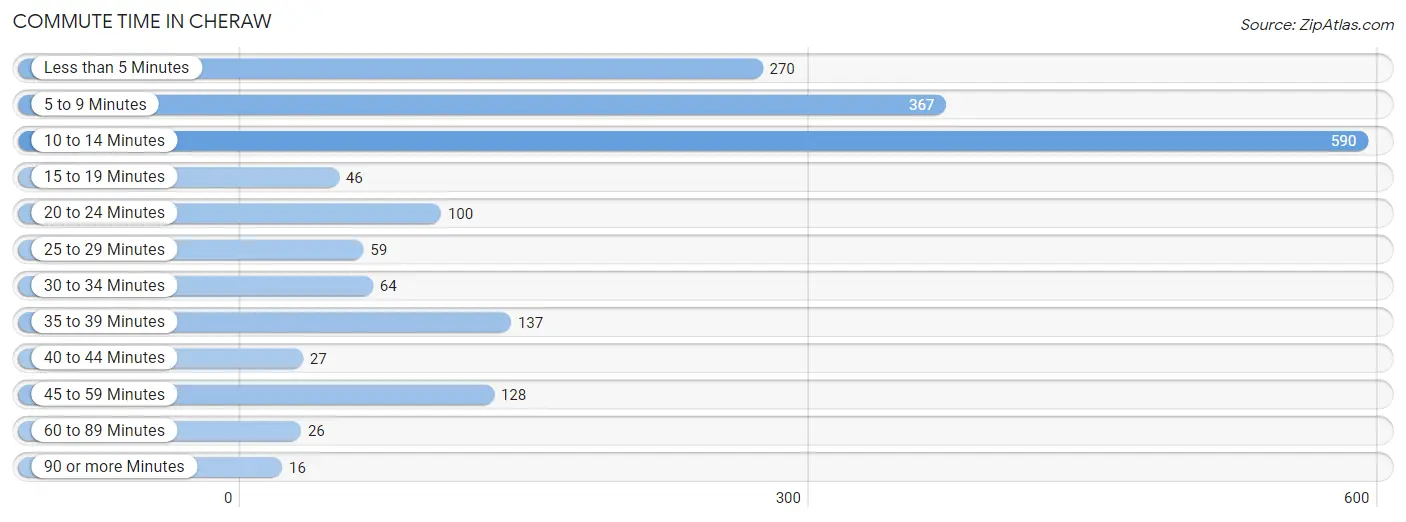
| Commute Time | # Commuters | % Commuters |
| Less than 5 Minutes | 270 | 14.7% |
| 5 to 9 Minutes | 367 | 20.1% |
| 10 to 14 Minutes | 590 | 32.2% |
| 15 to 19 Minutes | 46 | 2.5% |
| 20 to 24 Minutes | 100 | 5.5% |
| 25 to 29 Minutes | 59 | 3.2% |
| 30 to 34 Minutes | 64 | 3.5% |
| 35 to 39 Minutes | 137 | 7.5% |
| 40 to 44 Minutes | 27 | 1.5% |
| 45 to 59 Minutes | 128 | 7.0% |
| 60 to 89 Minutes | 26 | 1.4% |
| 90 or more Minutes | 16 | 0.9% |
Commute Time by Sex in Cheraw
The most common commute times in Cheraw are 10 to 14 minutes (303 commuters, 30.8%) for males and 10 to 14 minutes (287 commuters, 33.9%) for females.
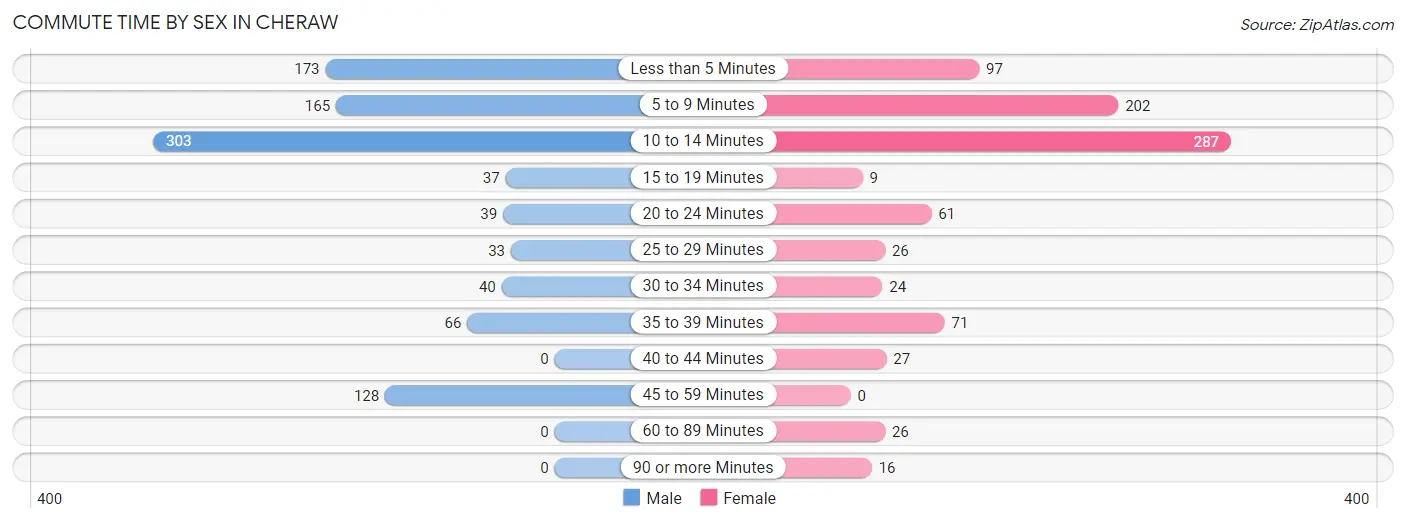
| Commute Time | Male | Female |
| Less than 5 Minutes | 173 (17.6%) | 97 (11.5%) |
| 5 to 9 Minutes | 165 (16.8%) | 202 (23.9%) |
| 10 to 14 Minutes | 303 (30.8%) | 287 (33.9%) |
| 15 to 19 Minutes | 37 (3.8%) | 9 (1.1%) |
| 20 to 24 Minutes | 39 (4.0%) | 61 (7.2%) |
| 25 to 29 Minutes | 33 (3.4%) | 26 (3.1%) |
| 30 to 34 Minutes | 40 (4.1%) | 24 (2.8%) |
| 35 to 39 Minutes | 66 (6.7%) | 71 (8.4%) |
| 40 to 44 Minutes | 0 (0.0%) | 27 (3.2%) |
| 45 to 59 Minutes | 128 (13.0%) | 0 (0.0%) |
| 60 to 89 Minutes | 0 (0.0%) | 26 (3.1%) |
| 90 or more Minutes | 0 (0.0%) | 16 (1.9%) |
Time of Departure to Work by Sex in Cheraw
The most frequent times of departure to work in Cheraw are 6:00 AM to 6:29 AM (158, 16.1%) for males and 7:00 AM to 7:29 AM (208, 24.6%) for females.
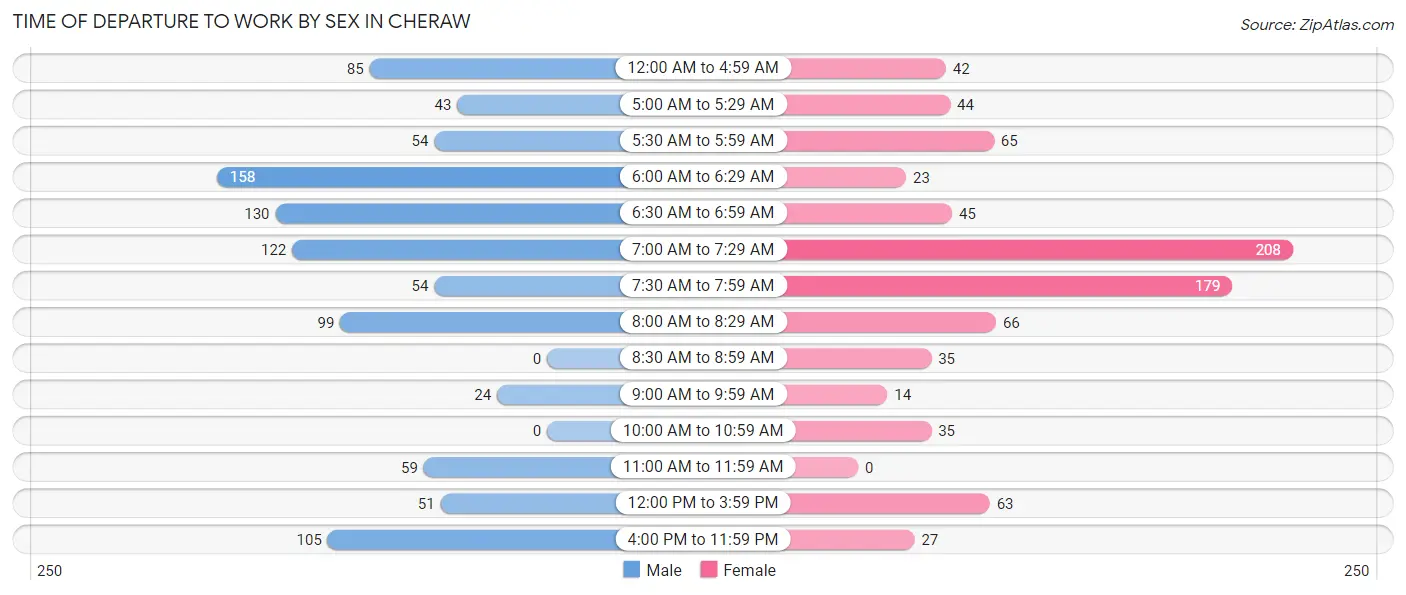
| Time of Departure | Male | Female |
| 12:00 AM to 4:59 AM | 85 (8.6%) | 42 (5.0%) |
| 5:00 AM to 5:29 AM | 43 (4.4%) | 44 (5.2%) |
| 5:30 AM to 5:59 AM | 54 (5.5%) | 65 (7.7%) |
| 6:00 AM to 6:29 AM | 158 (16.1%) | 23 (2.7%) |
| 6:30 AM to 6:59 AM | 130 (13.2%) | 45 (5.3%) |
| 7:00 AM to 7:29 AM | 122 (12.4%) | 208 (24.6%) |
| 7:30 AM to 7:59 AM | 54 (5.5%) | 179 (21.2%) |
| 8:00 AM to 8:29 AM | 99 (10.1%) | 66 (7.8%) |
| 8:30 AM to 8:59 AM | 0 (0.0%) | 35 (4.1%) |
| 9:00 AM to 9:59 AM | 24 (2.4%) | 14 (1.7%) |
| 10:00 AM to 10:59 AM | 0 (0.0%) | 35 (4.1%) |
| 11:00 AM to 11:59 AM | 59 (6.0%) | 0 (0.0%) |
| 12:00 PM to 3:59 PM | 51 (5.2%) | 63 (7.4%) |
| 4:00 PM to 11:59 PM | 105 (10.7%) | 27 (3.2%) |
| Total | 984 (100.0%) | 846 (100.0%) |
Housing Occupancy in Cheraw
Occupancy by Ownership in Cheraw
Of the total 2,146 dwellings in Cheraw, owner-occupied units account for 1,050 (48.9%), while renter-occupied units make up 1,096 (51.1%).
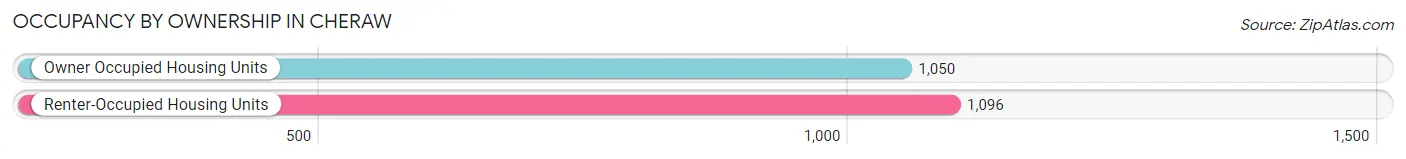
| Occupancy | # Housing Units | % Housing Units |
| Owner Occupied Housing Units | 1,050 | 48.9% |
| Renter-Occupied Housing Units | 1,096 | 51.1% |
| Total Occupied Housing Units | 2,146 | 100.0% |
Occupancy by Household Size in Cheraw
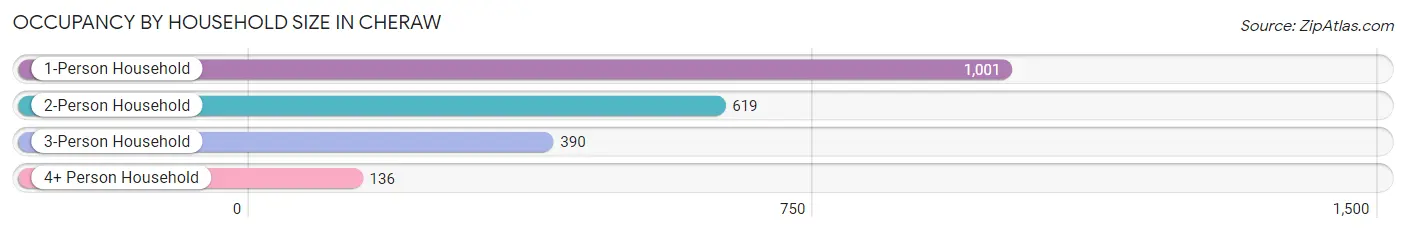
| Household Size | # Housing Units | % Housing Units |
| 1-Person Household | 1,001 | 46.6% |
| 2-Person Household | 619 | 28.8% |
| 3-Person Household | 390 | 18.2% |
| 4+ Person Household | 136 | 6.3% |
| Total Housing Units | 2,146 | 100.0% |
Occupancy by Ownership by Household Size in Cheraw
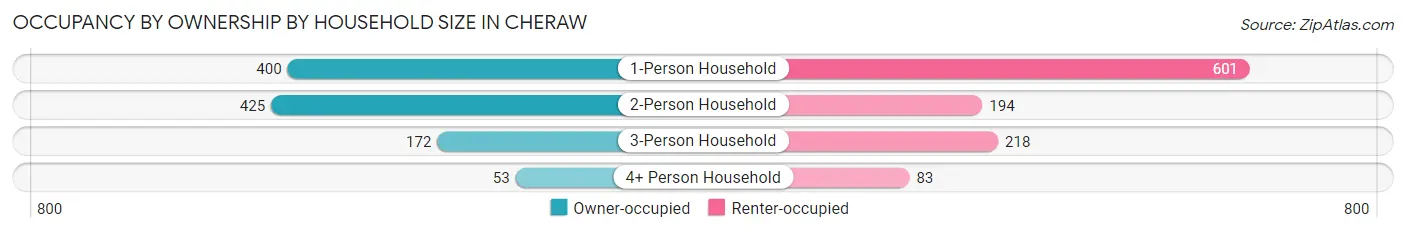
| Household Size | Owner-occupied | Renter-occupied |
| 1-Person Household | 400 (40.0%) | 601 (60.0%) |
| 2-Person Household | 425 (68.7%) | 194 (31.3%) |
| 3-Person Household | 172 (44.1%) | 218 (55.9%) |
| 4+ Person Household | 53 (39.0%) | 83 (61.0%) |
| Total Housing Units | 1,050 (48.9%) | 1,096 (51.1%) |
Occupancy by Educational Attainment in Cheraw
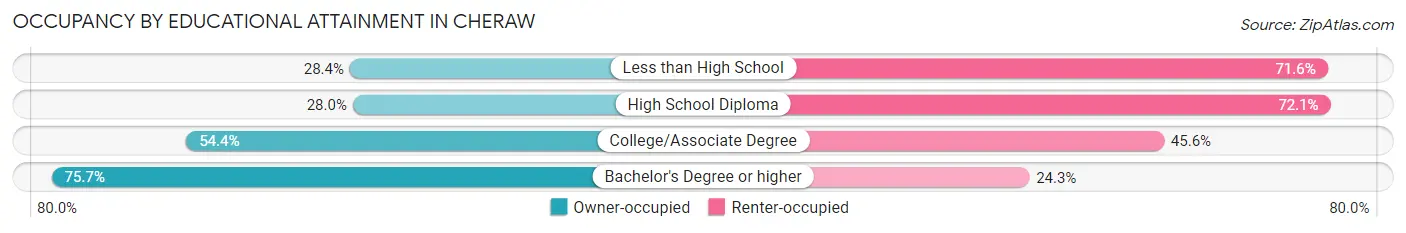
| Household Size | Owner-occupied | Renter-occupied |
| Less than High School | 108 (28.4%) | 272 (71.6%) |
| High School Diploma | 128 (28.0%) | 330 (72.1%) |
| College/Associate Degree | 449 (54.4%) | 377 (45.6%) |
| Bachelor's Degree or higher | 365 (75.7%) | 117 (24.3%) |
Occupancy by Age of Householder in Cheraw
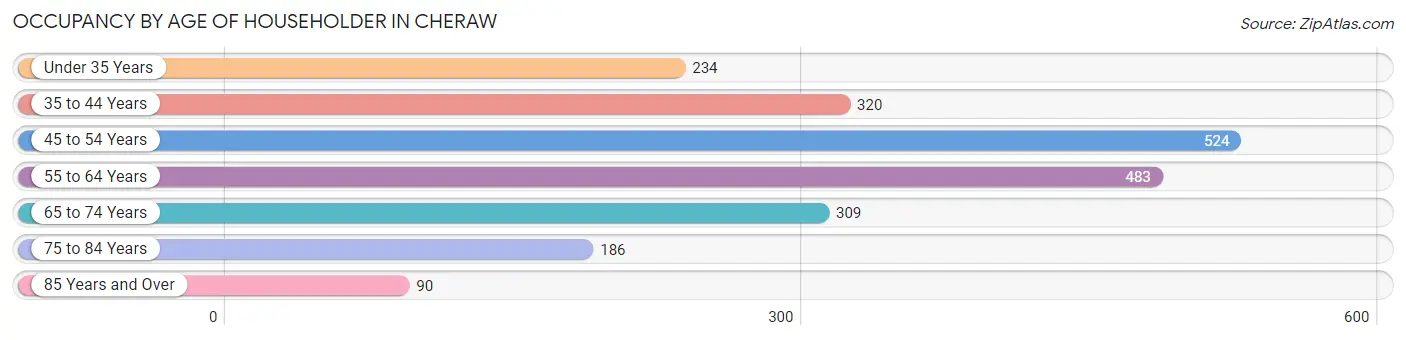
| Age Bracket | # Households | % Households |
| Under 35 Years | 234 | 10.9% |
| 35 to 44 Years | 320 | 14.9% |
| 45 to 54 Years | 524 | 24.4% |
| 55 to 64 Years | 483 | 22.5% |
| 65 to 74 Years | 309 | 14.4% |
| 75 to 84 Years | 186 | 8.7% |
| 85 Years and Over | 90 | 4.2% |
| Total | 2,146 | 100.0% |
Housing Finances in Cheraw
Median Income by Occupancy in Cheraw
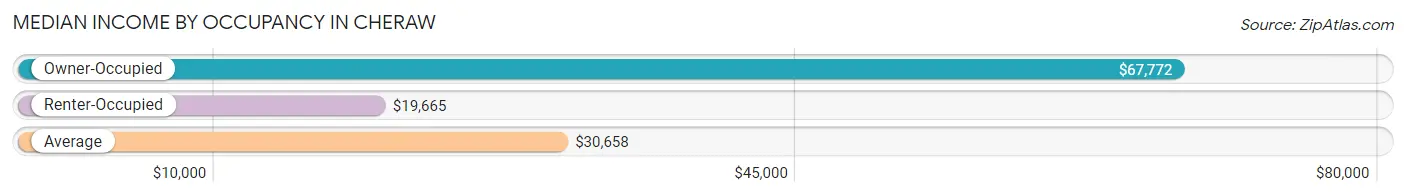
| Occupancy Type | # Households | Median Income |
| Owner-Occupied | 1,050 (48.9%) | $67,772 |
| Renter-Occupied | 1,096 (51.1%) | $19,665 |
| Average | 2,146 (100.0%) | $30,658 |
Occupancy by Householder Income Bracket in Cheraw
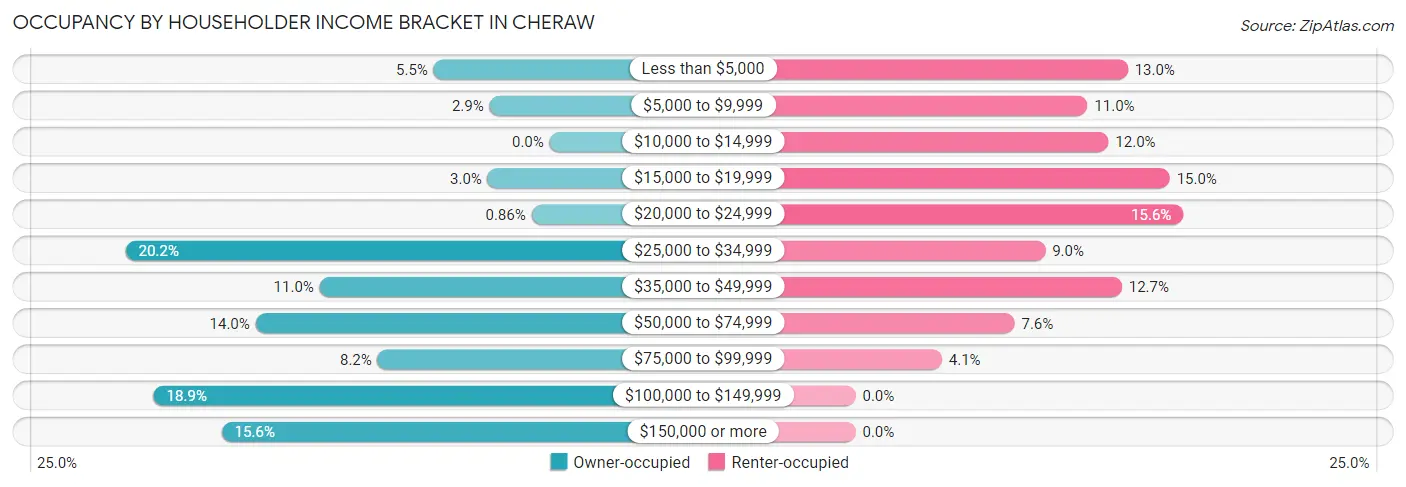
| Income Bracket | Owner-occupied | Renter-occupied |
| Less than $5,000 | 58 (5.5%) | 142 (13.0%) |
| $5,000 to $9,999 | 30 (2.9%) | 121 (11.0%) |
| $10,000 to $14,999 | 0 (0.0%) | 132 (12.0%) |
| $15,000 to $19,999 | 31 (2.9%) | 164 (15.0%) |
| $20,000 to $24,999 | 9 (0.9%) | 171 (15.6%) |
| $25,000 to $34,999 | 212 (20.2%) | 99 (9.0%) |
| $35,000 to $49,999 | 115 (11.0%) | 139 (12.7%) |
| $50,000 to $74,999 | 147 (14.0%) | 83 (7.6%) |
| $75,000 to $99,999 | 86 (8.2%) | 45 (4.1%) |
| $100,000 to $149,999 | 198 (18.9%) | 0 (0.0%) |
| $150,000 or more | 164 (15.6%) | 0 (0.0%) |
| Total | 1,050 (100.0%) | 1,096 (100.0%) |
Monthly Housing Cost Tiers in Cheraw
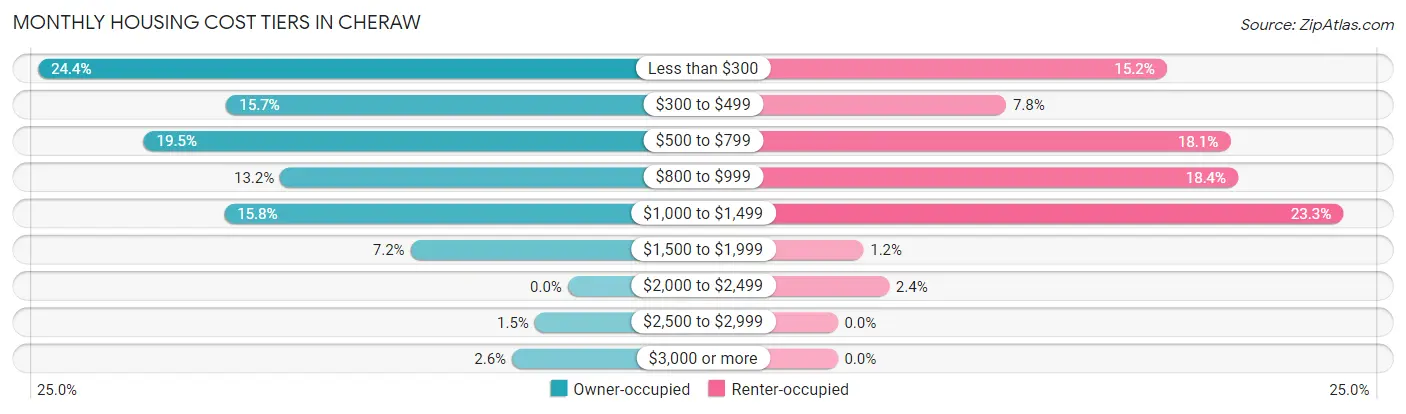
| Monthly Cost | Owner-occupied | Renter-occupied |
| Less than $300 | 256 (24.4%) | 166 (15.1%) |
| $300 to $499 | 165 (15.7%) | 85 (7.8%) |
| $500 to $799 | 205 (19.5%) | 198 (18.1%) |
| $800 to $999 | 139 (13.2%) | 202 (18.4%) |
| $1,000 to $1,499 | 166 (15.8%) | 255 (23.3%) |
| $1,500 to $1,999 | 76 (7.2%) | 13 (1.2%) |
| $2,000 to $2,499 | 0 (0.0%) | 26 (2.4%) |
| $2,500 to $2,999 | 16 (1.5%) | 0 (0.0%) |
| $3,000 or more | 27 (2.6%) | 0 (0.0%) |
| Total | 1,050 (100.0%) | 1,096 (100.0%) |
Physical Housing Characteristics in Cheraw
Housing Structures in Cheraw
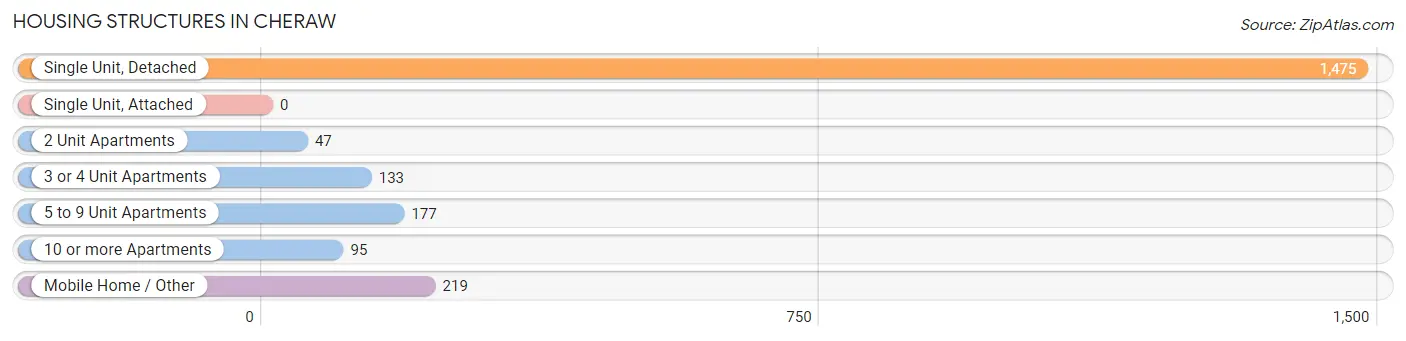
| Structure Type | # Housing Units | % Housing Units |
| Single Unit, Detached | 1,475 | 68.7% |
| Single Unit, Attached | 0 | 0.0% |
| 2 Unit Apartments | 47 | 2.2% |
| 3 or 4 Unit Apartments | 133 | 6.2% |
| 5 to 9 Unit Apartments | 177 | 8.3% |
| 10 or more Apartments | 95 | 4.4% |
| Mobile Home / Other | 219 | 10.2% |
| Total | 2,146 | 100.0% |
Housing Structures by Occupancy in Cheraw
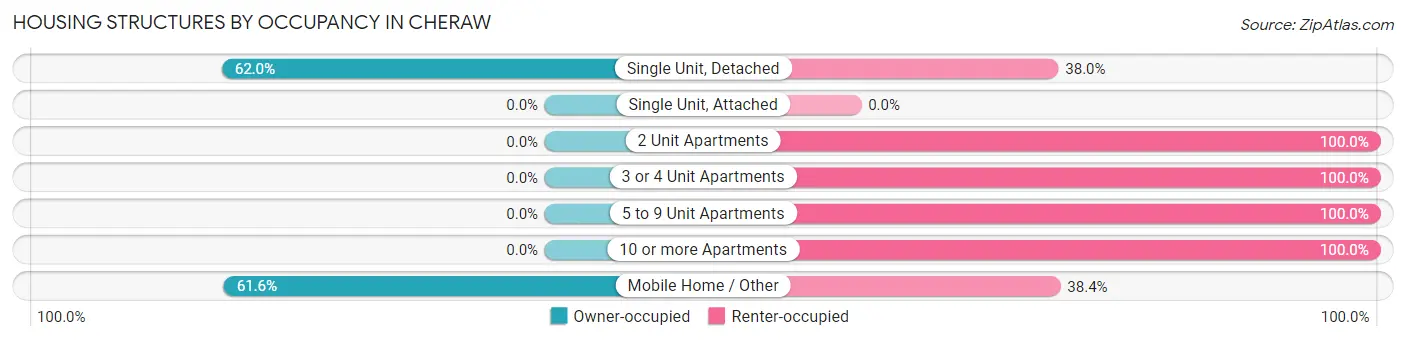
| Structure Type | Owner-occupied | Renter-occupied |
| Single Unit, Detached | 915 (62.0%) | 560 (38.0%) |
| Single Unit, Attached | 0 (0.0%) | 0 (0.0%) |
| 2 Unit Apartments | 0 (0.0%) | 47 (100.0%) |
| 3 or 4 Unit Apartments | 0 (0.0%) | 133 (100.0%) |
| 5 to 9 Unit Apartments | 0 (0.0%) | 177 (100.0%) |
| 10 or more Apartments | 0 (0.0%) | 95 (100.0%) |
| Mobile Home / Other | 135 (61.6%) | 84 (38.4%) |
| Total | 1,050 (48.9%) | 1,096 (51.1%) |
Housing Structures by Number of Rooms in Cheraw
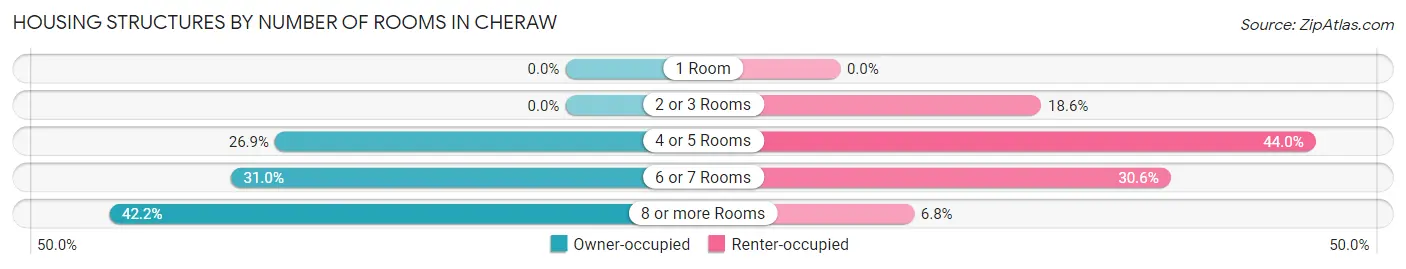
| Number of Rooms | Owner-occupied | Renter-occupied |
| 1 Room | 0 (0.0%) | 0 (0.0%) |
| 2 or 3 Rooms | 0 (0.0%) | 204 (18.6%) |
| 4 or 5 Rooms | 282 (26.9%) | 482 (44.0%) |
| 6 or 7 Rooms | 325 (30.9%) | 335 (30.6%) |
| 8 or more Rooms | 443 (42.2%) | 75 (6.8%) |
| Total | 1,050 (100.0%) | 1,096 (100.0%) |
Housing Structure by Heating Type in Cheraw
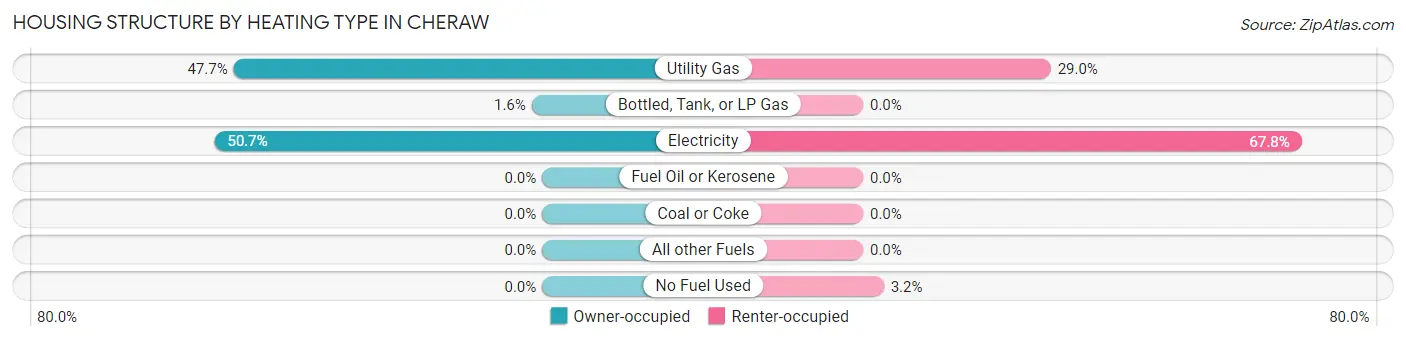
| Heating Type | Owner-occupied | Renter-occupied |
| Utility Gas | 501 (47.7%) | 318 (29.0%) |
| Bottled, Tank, or LP Gas | 17 (1.6%) | 0 (0.0%) |
| Electricity | 532 (50.7%) | 743 (67.8%) |
| Fuel Oil or Kerosene | 0 (0.0%) | 0 (0.0%) |
| Coal or Coke | 0 (0.0%) | 0 (0.0%) |
| All other Fuels | 0 (0.0%) | 0 (0.0%) |
| No Fuel Used | 0 (0.0%) | 35 (3.2%) |
| Total | 1,050 (100.0%) | 1,096 (100.0%) |
Household Vehicle Usage in Cheraw
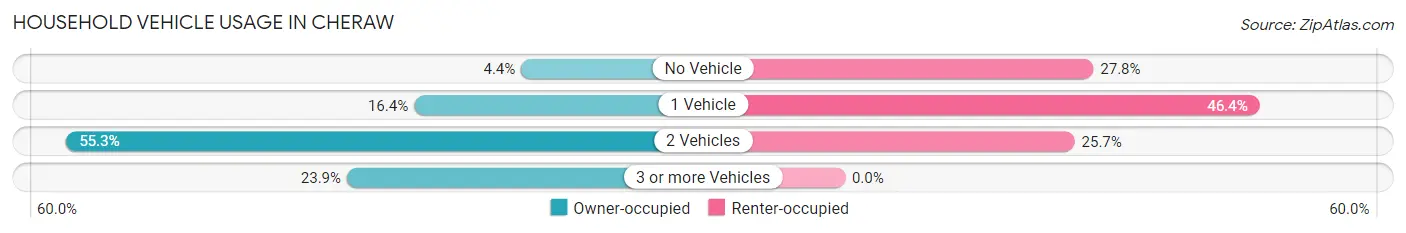
| Vehicles per Household | Owner-occupied | Renter-occupied |
| No Vehicle | 46 (4.4%) | 305 (27.8%) |
| 1 Vehicle | 172 (16.4%) | 509 (46.4%) |
| 2 Vehicles | 581 (55.3%) | 282 (25.7%) |
| 3 or more Vehicles | 251 (23.9%) | 0 (0.0%) |
| Total | 1,050 (100.0%) | 1,096 (100.0%) |
Real Estate & Mortgages in Cheraw
Real Estate and Mortgage Overview in Cheraw
| Characteristic | Without Mortgage | With Mortgage |
| Housing Units | 577 | 473 |
| Median Property Value | - | - |
| Median Household Income | $32,548 | $83 |
| Monthly Housing Costs | $326 | $27 |
| Real Estate Taxes | $397 | $27 |
Property Value by Mortgage Status in Cheraw
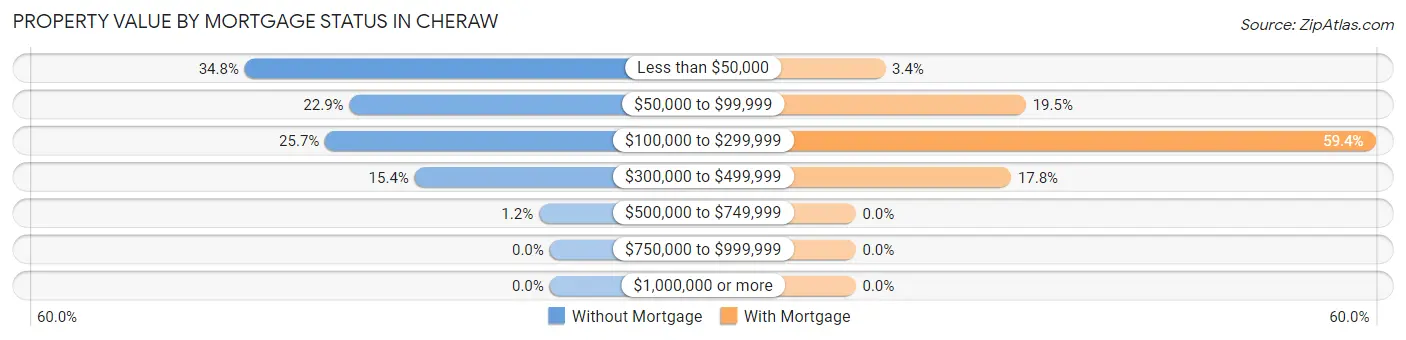
| Property Value | Without Mortgage | With Mortgage |
| Less than $50,000 | 201 (34.8%) | 16 (3.4%) |
| $50,000 to $99,999 | 132 (22.9%) | 92 (19.5%) |
| $100,000 to $299,999 | 148 (25.7%) | 281 (59.4%) |
| $300,000 to $499,999 | 89 (15.4%) | 84 (17.8%) |
| $500,000 to $749,999 | 7 (1.2%) | 0 (0.0%) |
| $750,000 to $999,999 | 0 (0.0%) | 0 (0.0%) |
| $1,000,000 or more | 0 (0.0%) | 0 (0.0%) |
| Total | 577 (100.0%) | 473 (100.0%) |
Household Income by Mortgage Status in Cheraw
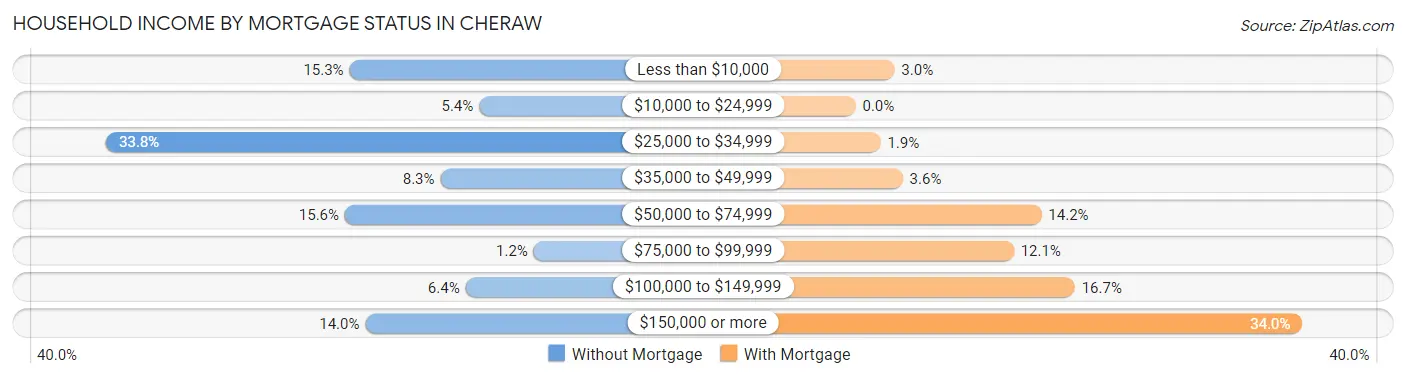
| Household Income | Without Mortgage | With Mortgage |
| Less than $10,000 | 88 (15.2%) | 14 (3.0%) |
| $10,000 to $24,999 | 31 (5.4%) | 0 (0.0%) |
| $25,000 to $34,999 | 195 (33.8%) | 9 (1.9%) |
| $35,000 to $49,999 | 48 (8.3%) | 17 (3.6%) |
| $50,000 to $74,999 | 90 (15.6%) | 67 (14.2%) |
| $75,000 to $99,999 | 7 (1.2%) | 57 (12.0%) |
| $100,000 to $149,999 | 37 (6.4%) | 79 (16.7%) |
| $150,000 or more | 81 (14.0%) | 161 (34.0%) |
| Total | 577 (100.0%) | 473 (100.0%) |
Property Value to Household Income Ratio in Cheraw
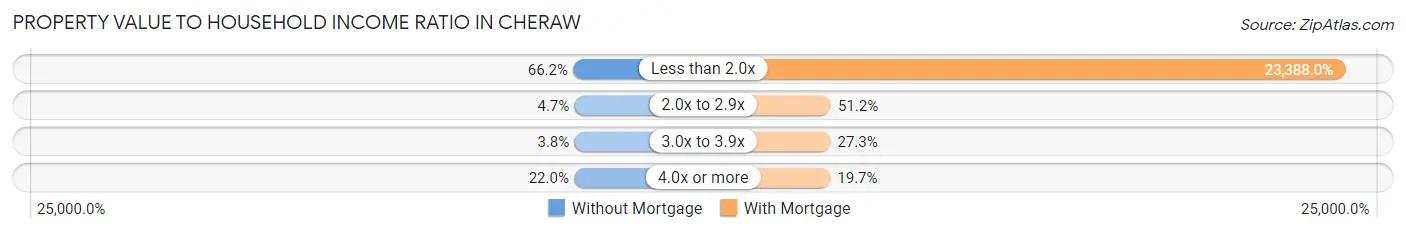
| Value-to-Income Ratio | Without Mortgage | With Mortgage |
| Less than 2.0x | 382 (66.2%) | 110,625 (23,388.0%) |
| 2.0x to 2.9x | 27 (4.7%) | 242 (51.2%) |
| 3.0x to 3.9x | 22 (3.8%) | 129 (27.3%) |
| 4.0x or more | 127 (22.0%) | 93 (19.7%) |
| Total | 577 (100.0%) | 473 (100.0%) |
Real Estate Taxes by Mortgage Status in Cheraw
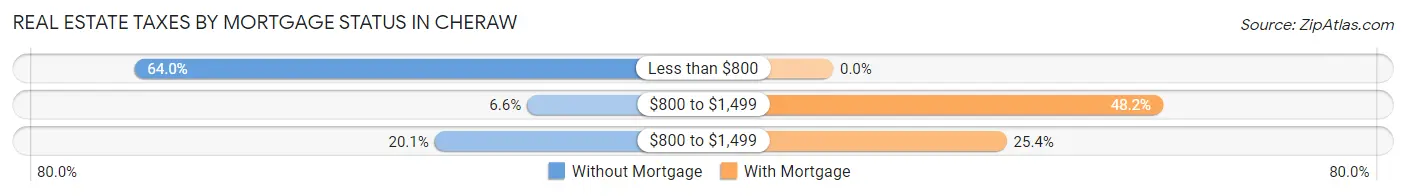
| Property Taxes | Without Mortgage | With Mortgage |
| Less than $800 | 369 (63.9%) | 0 (0.0%) |
| $800 to $1,499 | 38 (6.6%) | 228 (48.2%) |
| $800 to $1,499 | 116 (20.1%) | 120 (25.4%) |
| Total | 577 (100.0%) | 473 (100.0%) |
Health & Disability in Cheraw
Health Insurance Coverage by Age in Cheraw
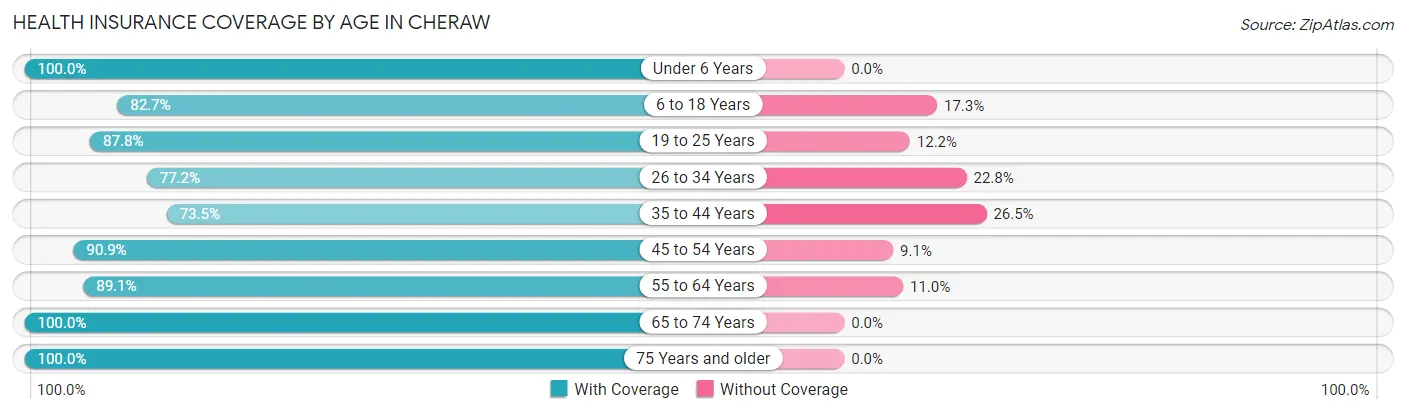
| Age Bracket | With Coverage | Without Coverage |
| Under 6 Years | 374 (100.0%) | 0 (0.0%) |
| 6 to 18 Years | 531 (82.7%) | 111 (17.3%) |
| 19 to 25 Years | 280 (87.8%) | 39 (12.2%) |
| 26 to 34 Years | 420 (77.2%) | 124 (22.8%) |
| 35 to 44 Years | 341 (73.5%) | 123 (26.5%) |
| 45 to 54 Years | 768 (90.9%) | 77 (9.1%) |
| 55 to 64 Years | 667 (89.0%) | 82 (11.0%) |
| 65 to 74 Years | 471 (100.0%) | 0 (0.0%) |
| 75 Years and older | 407 (100.0%) | 0 (0.0%) |
| Total | 4,259 (88.4%) | 556 (11.6%) |
Health Insurance Coverage by Citizenship Status in Cheraw
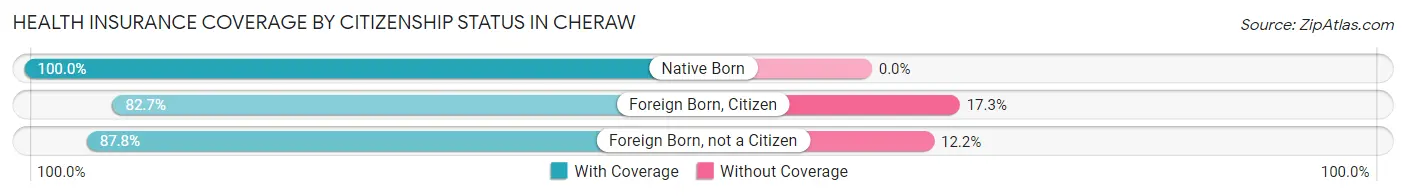
| Citizenship Status | With Coverage | Without Coverage |
| Native Born | 374 (100.0%) | 0 (0.0%) |
| Foreign Born, Citizen | 531 (82.7%) | 111 (17.3%) |
| Foreign Born, not a Citizen | 280 (87.8%) | 39 (12.2%) |
Health Insurance Coverage by Household Income in Cheraw
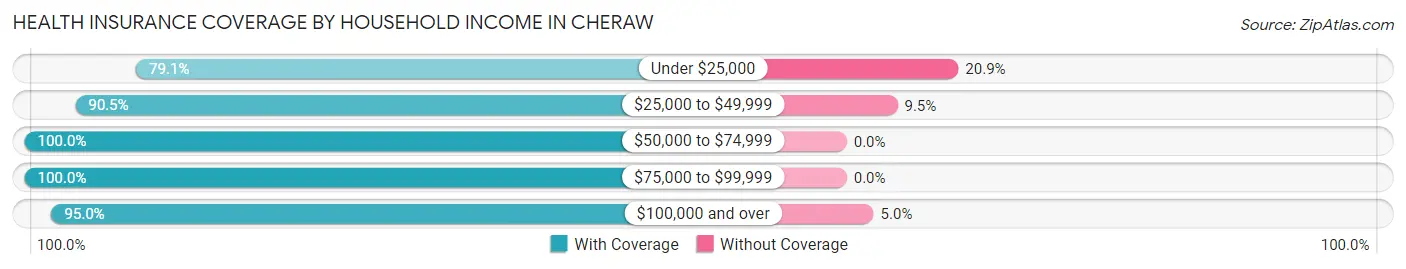
| Household Income | With Coverage | Without Coverage |
| Under $25,000 | 1,471 (79.1%) | 389 (20.9%) |
| $25,000 to $49,999 | 1,018 (90.5%) | 107 (9.5%) |
| $50,000 to $74,999 | 486 (100.0%) | 0 (0.0%) |
| $75,000 to $99,999 | 382 (100.0%) | 0 (0.0%) |
| $100,000 and over | 887 (95.0%) | 47 (5.0%) |
Public vs Private Health Insurance Coverage by Age in Cheraw
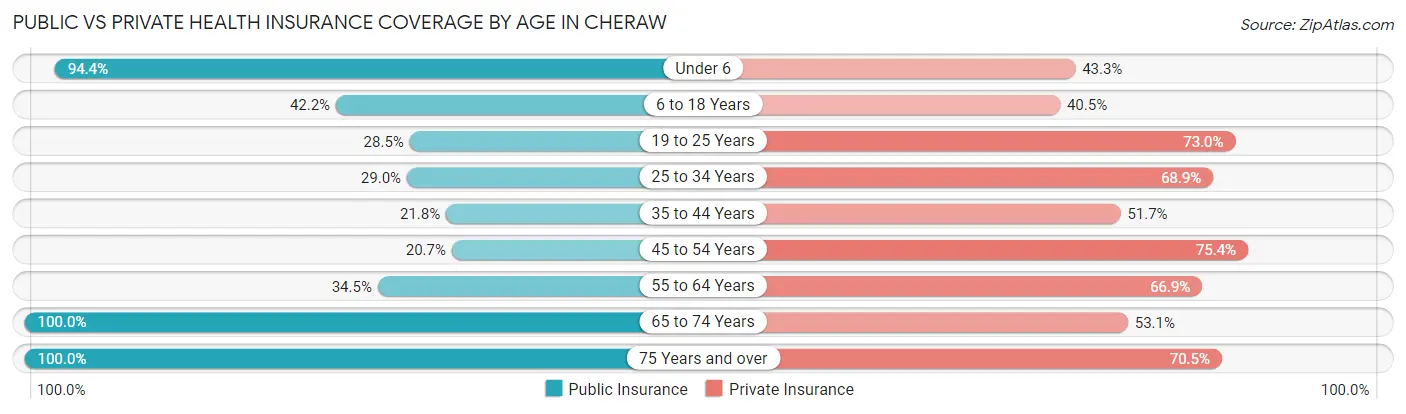
| Age Bracket | Public Insurance | Private Insurance |
| Under 6 | 353 (94.4%) | 162 (43.3%) |
| 6 to 18 Years | 271 (42.2%) | 260 (40.5%) |
| 19 to 25 Years | 91 (28.5%) | 233 (73.0%) |
| 25 to 34 Years | 158 (29.0%) | 375 (68.9%) |
| 35 to 44 Years | 101 (21.8%) | 240 (51.7%) |
| 45 to 54 Years | 175 (20.7%) | 637 (75.4%) |
| 55 to 64 Years | 258 (34.4%) | 501 (66.9%) |
| 65 to 74 Years | 471 (100.0%) | 250 (53.1%) |
| 75 Years and over | 407 (100.0%) | 287 (70.5%) |
| Total | 2,285 (47.5%) | 2,945 (61.2%) |
Disability Status by Sex by Age in Cheraw
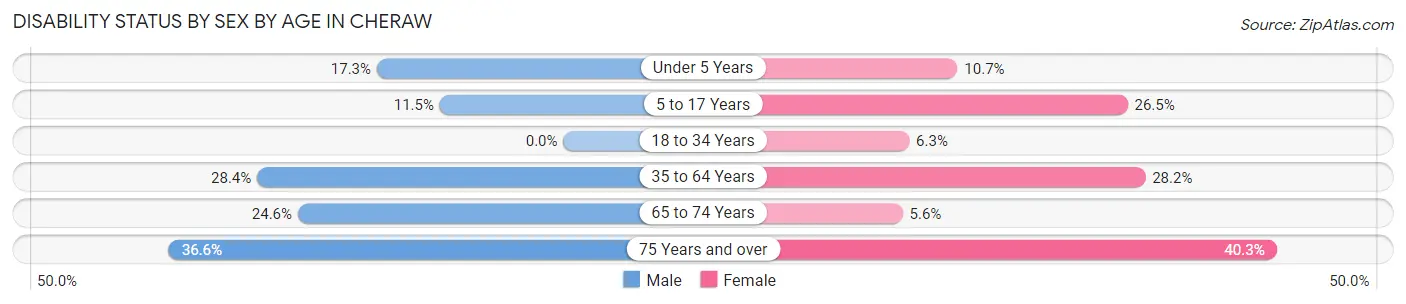
| Age Bracket | Male | Female |
| Under 5 Years | 18 (17.3%) | 19 (10.7%) |
| 5 to 17 Years | 57 (11.5%) | 48 (26.5%) |
| 18 to 34 Years | 0 (0.0%) | 22 (6.2%) |
| 35 to 64 Years | 266 (28.4%) | 316 (28.2%) |
| 65 to 74 Years | 68 (24.6%) | 11 (5.6%) |
| 75 Years and over | 41 (36.6%) | 119 (40.3%) |
Disability Class by Sex by Age in Cheraw
Disability Class: Hearing Difficulty
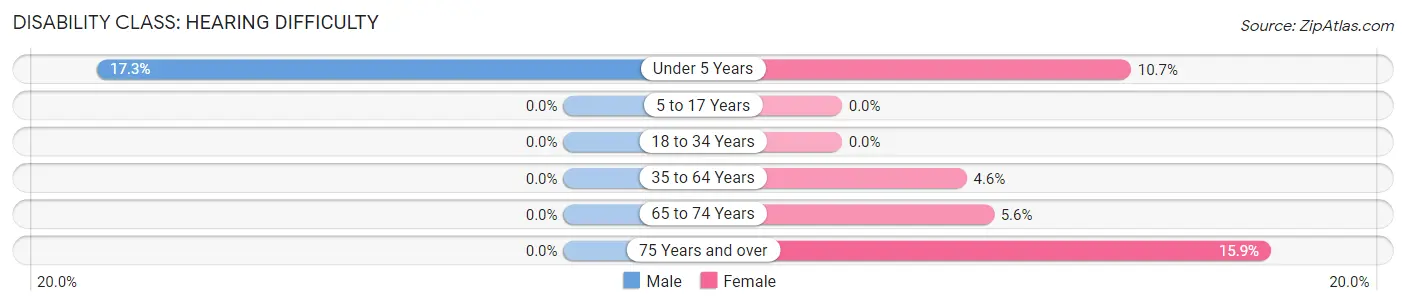
| Age Bracket | Male | Female |
| Under 5 Years | 18 (17.3%) | 19 (10.7%) |
| 5 to 17 Years | 0 (0.0%) | 0 (0.0%) |
| 18 to 34 Years | 0 (0.0%) | 0 (0.0%) |
| 35 to 64 Years | 0 (0.0%) | 52 (4.6%) |
| 65 to 74 Years | 0 (0.0%) | 11 (5.6%) |
| 75 Years and over | 0 (0.0%) | 47 (15.9%) |
Disability Class: Vision Difficulty
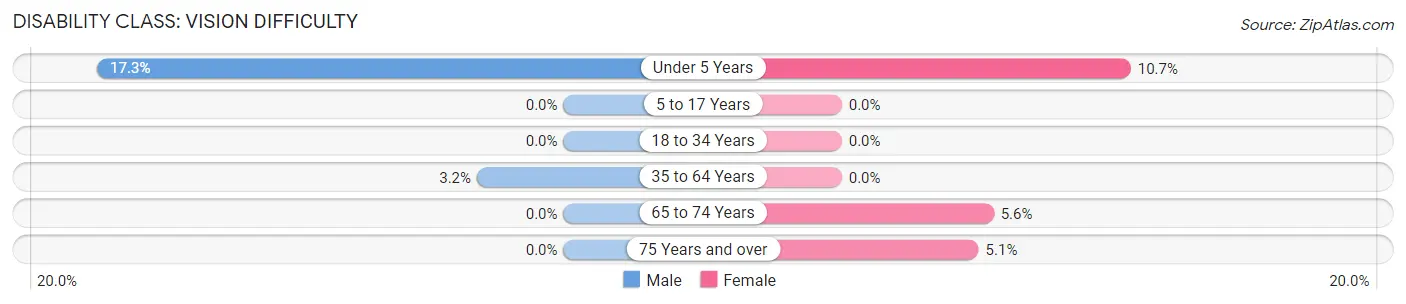
| Age Bracket | Male | Female |
| Under 5 Years | 18 (17.3%) | 19 (10.7%) |
| 5 to 17 Years | 0 (0.0%) | 0 (0.0%) |
| 18 to 34 Years | 0 (0.0%) | 0 (0.0%) |
| 35 to 64 Years | 30 (3.2%) | 0 (0.0%) |
| 65 to 74 Years | 0 (0.0%) | 11 (5.6%) |
| 75 Years and over | 0 (0.0%) | 15 (5.1%) |
Disability Class: Cognitive Difficulty
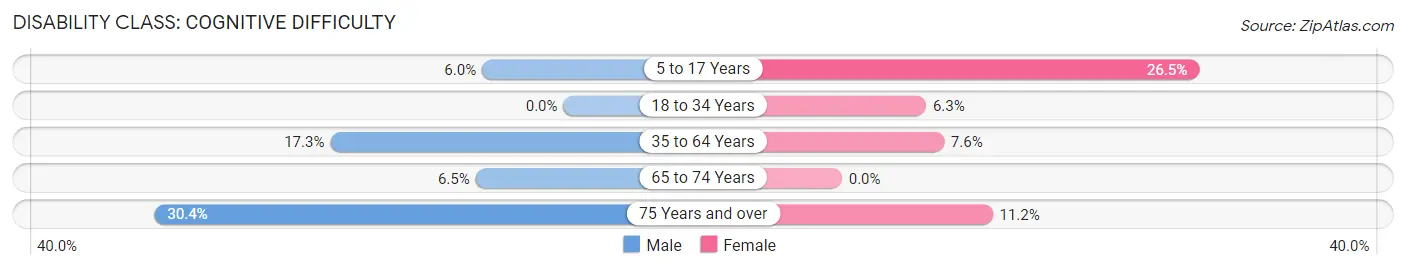
| Age Bracket | Male | Female |
| 5 to 17 Years | 30 (6.0%) | 48 (26.5%) |
| 18 to 34 Years | 0 (0.0%) | 22 (6.2%) |
| 35 to 64 Years | 162 (17.3%) | 85 (7.6%) |
| 65 to 74 Years | 18 (6.5%) | 0 (0.0%) |
| 75 Years and over | 34 (30.4%) | 33 (11.2%) |
Disability Class: Ambulatory Difficulty
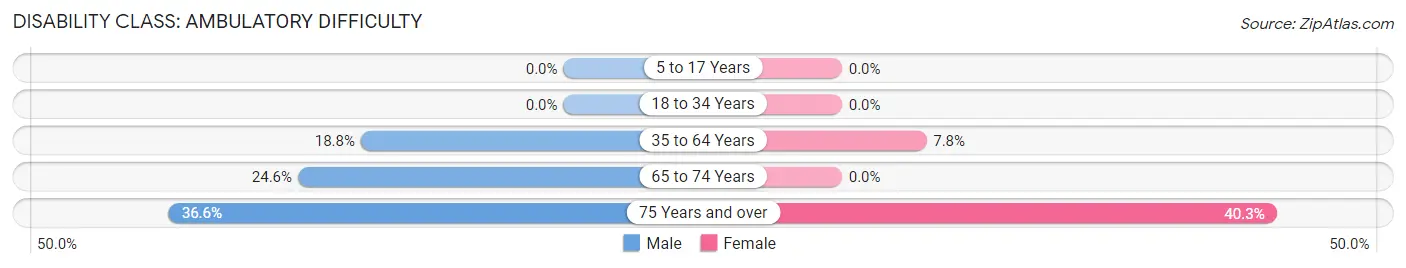
| Age Bracket | Male | Female |
| 5 to 17 Years | 0 (0.0%) | 0 (0.0%) |
| 18 to 34 Years | 0 (0.0%) | 0 (0.0%) |
| 35 to 64 Years | 176 (18.8%) | 88 (7.8%) |
| 65 to 74 Years | 68 (24.6%) | 0 (0.0%) |
| 75 Years and over | 41 (36.6%) | 119 (40.3%) |
Disability Class: Self-Care Difficulty
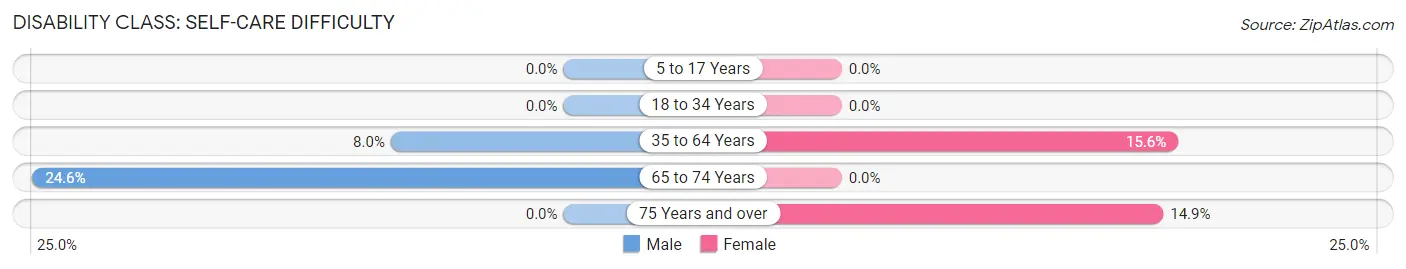
| Age Bracket | Male | Female |
| 5 to 17 Years | 0 (0.0%) | 0 (0.0%) |
| 18 to 34 Years | 0 (0.0%) | 0 (0.0%) |
| 35 to 64 Years | 75 (8.0%) | 175 (15.6%) |
| 65 to 74 Years | 68 (24.6%) | 0 (0.0%) |
| 75 Years and over | 0 (0.0%) | 44 (14.9%) |
Technology Access in Cheraw
Computing Device Access in Cheraw
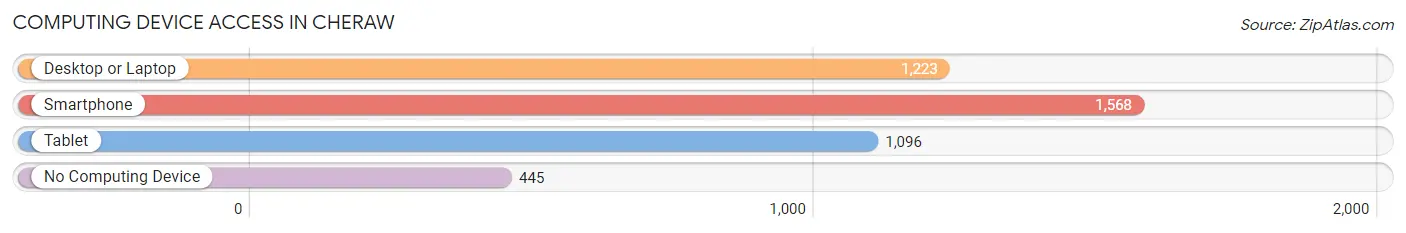
| Device Type | # Households | % Households |
| Desktop or Laptop | 1,223 | 57.0% |
| Smartphone | 1,568 | 73.1% |
| Tablet | 1,096 | 51.1% |
| No Computing Device | 445 | 20.7% |
| Total | 2,146 | 100.0% |
Internet Access in Cheraw
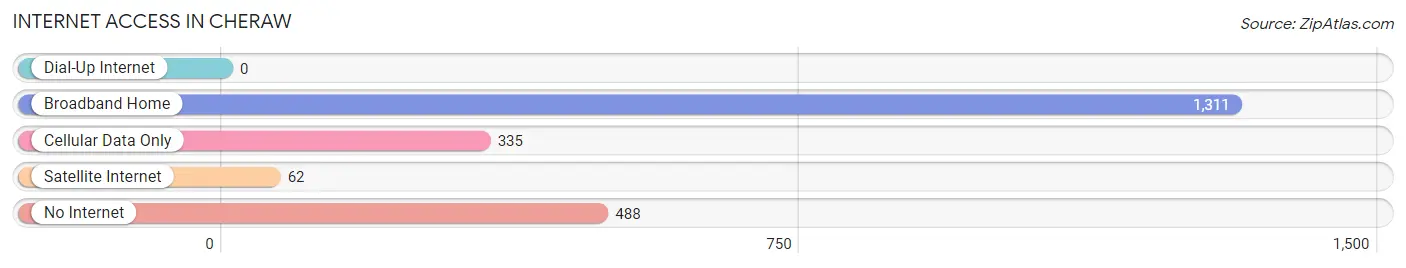
| Internet Type | # Households | % Households |
| Dial-Up Internet | 0 | 0.0% |
| Broadband Home | 1,311 | 61.1% |
| Cellular Data Only | 335 | 15.6% |
| Satellite Internet | 62 | 2.9% |
| No Internet | 488 | 22.7% |
| Total | 2,146 | 100.0% |
Cheraw Summary
Cheraw is a town located in Chesterfield County, South Carolina, United States. The population was 5,524 at the 2010 census. It is the home of the annual South Carolina Jazz Festival.
History
Cheraw was founded in 1766 by a group of Scots-Irish immigrants led by John Chesnut. The town was named after the Cheraw Indians, who were the original inhabitants of the area. The town was incorporated in 1820 and was the first town in the state to have a public library.
Cheraw was an important trading center during the antebellum period. It was the site of a major battle during the American Civil War in 1865. After the war, the town experienced a period of economic decline, but it was revitalized in the late 19th century with the arrival of the railroad.
Geography
Cheraw is located in the Pee Dee region of South Carolina, about 40 miles east of Columbia. It is situated on the banks of the Great Pee Dee River. The town is surrounded by rolling hills and forests.
The climate in Cheraw is humid subtropical, with hot, humid summers and mild winters. The average annual temperature is 64°F (18°C). The average annual precipitation is 48 inches (122 cm).
Economy
The economy of Cheraw is largely based on agriculture and manufacturing. The town is home to several large manufacturing plants, including a paper mill, a textile mill, and a furniture factory.
Agriculture is also an important part of the local economy. The area is known for its production of cotton, soybeans, corn, and tobacco.
Demographics
As of the 2010 census, the population of Cheraw was 5,524. The racial makeup of the town was 65.3% White, 30.2% African American, 0.4% Native American, 0.7% Asian, 0.1% Pacific Islander, and 2.3% from other races. Hispanic or Latino of any race were 3.2% of the population.
The median income for a household in Cheraw was $30,938, and the median income for a family was $37,917. The per capita income for the town was $17,845. About 19.3% of families and 22.2% of the population were below the poverty line, including 33.3% of those under age 18 and 16.2% of those age 65 or over.
Conclusion
Cheraw is a small town in South Carolina with a rich history and a diverse economy. The town is home to several large manufacturing plants and is known for its production of cotton, soybeans, corn, and tobacco. The population of Cheraw is 5,524, with a median household income of $30,938. The town has a humid subtropical climate, with hot, humid summers and mild winters.
Common Questions
What is Per Capita Income in Cheraw?
Per Capita income in Cheraw is $26,958.
What is the Median Family Income in Cheraw?
Median Family Income in Cheraw is $47,441.
What is the Median Household income in Cheraw?
Median Household Income in Cheraw is $30,658.
What is Income or Wage Gap in Cheraw?
Income or Wage Gap in Cheraw is 24.2%.
Women in Cheraw earn 75.8 cents for every dollar earned by a man.
What is Family Income Deficit in Cheraw?
Family Income Deficit in Cheraw is $15,247.
Families that are below poverty line in Cheraw earn $15,247 less on average than the poverty threshold level.
What is Inequality or Gini Index in Cheraw?
Inequality or Gini Index in Cheraw is 0.53.
What is the Total Population of Cheraw?
Total Population of Cheraw is 5,056.
What is the Total Male Population of Cheraw?
Total Male Population of Cheraw is 2,595.
What is the Total Female Population of Cheraw?
Total Female Population of Cheraw is 2,461.
What is the Ratio of Males per 100 Females in Cheraw?
There are 105.44 Males per 100 Females in Cheraw.
What is the Ratio of Females per 100 Males in Cheraw?
There are 94.84 Females per 100 Males in Cheraw.
What is the Median Population Age in Cheraw?
Median Population Age in Cheraw is 47.2 Years.
What is the Average Family Size in Cheraw
Average Family Size in Cheraw is 3.3 People.
What is the Average Household Size in Cheraw
Average Household Size in Cheraw is 2.2 People.
How Large is the Labor Force in Cheraw?
There are 2,274 People in the Labor Forcein in Cheraw.
What is the Percentage of People in the Labor Force in Cheraw?
52.9% of People are in the Labor Force in Cheraw.
What is the Unemployment Rate in Cheraw?
Unemployment Rate in Cheraw is 17.7%.