Hemingway, SC Map & Demographics
Hemingway Map
Hemingway Overview
$26,541
PER CAPITA INCOME
$66,875
AVG FAMILY INCOME
$36,042
AVG HOUSEHOLD INCOME
29.0%
WAGE / INCOME GAP [ % ]
71.0¢/ $1
WAGE / INCOME GAP [ $ ]
0.45
INEQUALITY / GINI INDEX
421
TOTAL POPULATION
196
MALE POPULATION
225
FEMALE POPULATION
87.11
MALES / 100 FEMALES
114.80
FEMALES / 100 MALES
43.6
MEDIAN AGE
3.4
AVG FAMILY SIZE
2.6
AVG HOUSEHOLD SIZE
165
LABOR FORCE [ PEOPLE ]
45.0%
PERCENT IN LABOR FORCE
3.8%
UNEMPLOYMENT RATE
Hemingway Zip Codes
Hemingway Area Codes
Income in Hemingway
Income Overview in Hemingway
Per Capita Income in Hemingway is $26,541, while median incomes of families and households are $66,875 and $36,042 respectively.
| Characteristic | Number | Measure |
| Per Capita Income | 421 | $26,541 |
| Median Family Income | 95 | $66,875 |
| Mean Family Income | 95 | $73,463 |
| Median Household Income | 162 | $36,042 |
| Mean Household Income | 162 | $54,204 |
| Income Deficit | 95 | $0 |
| Wage / Income Gap (%) | 421 | 29.02% |
| Wage / Income Gap ($) | 421 | 70.98¢ per $1 |
| Gini / Inequality Index | 421 | 0.45 |
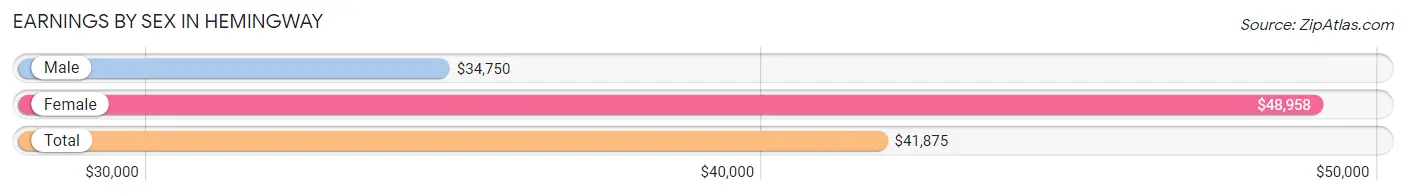
Earnings by Sex in Hemingway
Average Earnings in Hemingway are $41,875, $34,750 for men and $48,958 for women, a difference of 29.0%.
| Sex | Number | Average Earnings |
| Male | 95 (52.2%) | $34,750 |
| Female | 87 (47.8%) | $48,958 |
| Total | 182 (100.0%) | $41,875 |
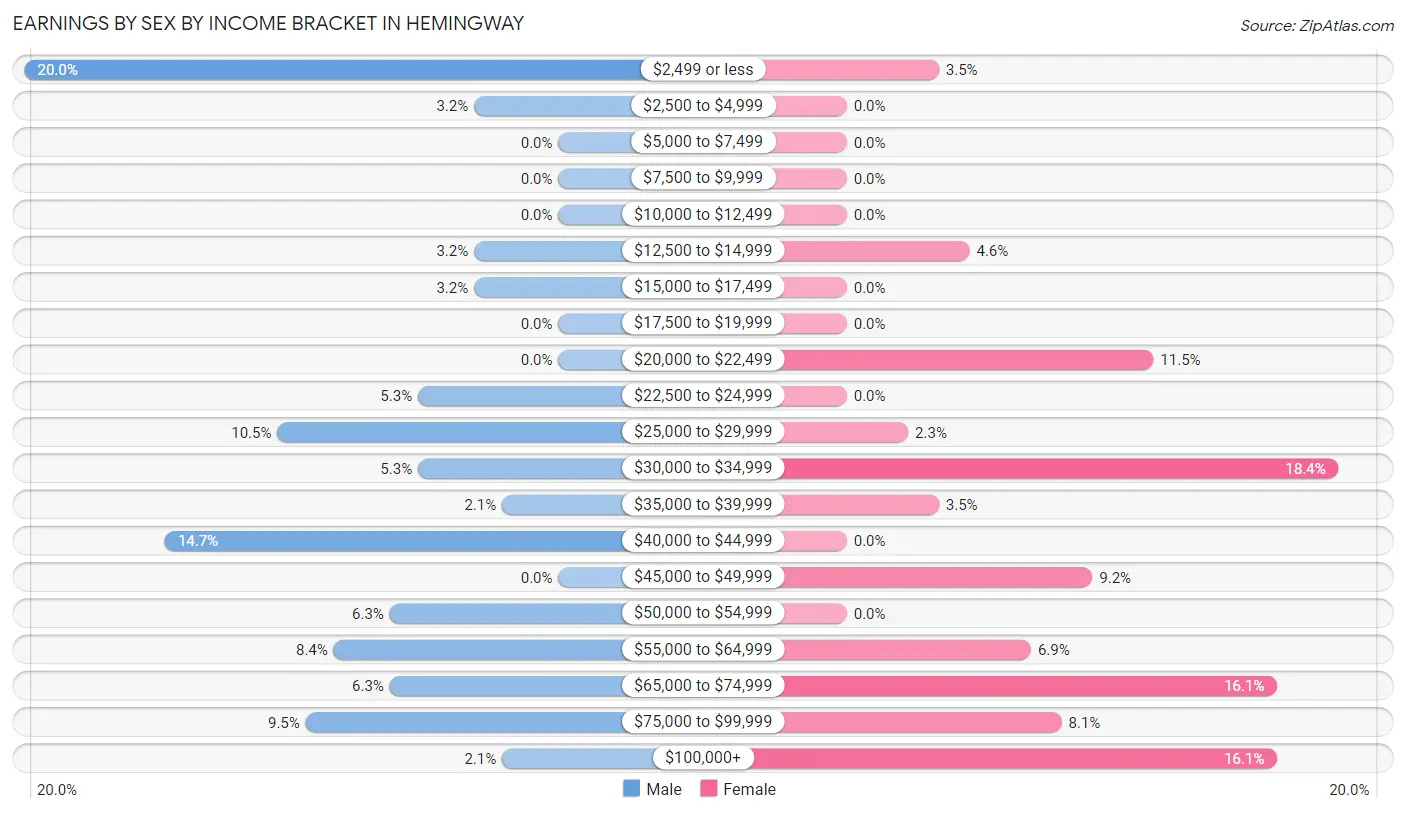
Earnings by Sex by Income Bracket in Hemingway
The most common earnings brackets in Hemingway are $2,499 or less for men (19 | 20.0%) and $30,000 to $34,999 for women (16 | 18.4%).
| Income | Male | Female |
| $2,499 or less | 19 (20.0%) | 3 (3.5%) |
| $2,500 to $4,999 | 3 (3.2%) | 0 (0.0%) |
| $5,000 to $7,499 | 0 (0.0%) | 0 (0.0%) |
| $7,500 to $9,999 | 0 (0.0%) | 0 (0.0%) |
| $10,000 to $12,499 | 0 (0.0%) | 0 (0.0%) |
| $12,500 to $14,999 | 3 (3.2%) | 4 (4.6%) |
| $15,000 to $17,499 | 3 (3.2%) | 0 (0.0%) |
| $17,500 to $19,999 | 0 (0.0%) | 0 (0.0%) |
| $20,000 to $22,499 | 0 (0.0%) | 10 (11.5%) |
| $22,500 to $24,999 | 5 (5.3%) | 0 (0.0%) |
| $25,000 to $29,999 | 10 (10.5%) | 2 (2.3%) |
| $30,000 to $34,999 | 5 (5.3%) | 16 (18.4%) |
| $35,000 to $39,999 | 2 (2.1%) | 3 (3.5%) |
| $40,000 to $44,999 | 14 (14.7%) | 0 (0.0%) |
| $45,000 to $49,999 | 0 (0.0%) | 8 (9.2%) |
| $50,000 to $54,999 | 6 (6.3%) | 0 (0.0%) |
| $55,000 to $64,999 | 8 (8.4%) | 6 (6.9%) |
| $65,000 to $74,999 | 6 (6.3%) | 14 (16.1%) |
| $75,000 to $99,999 | 9 (9.5%) | 7 (8.1%) |
| $100,000+ | 2 (2.1%) | 14 (16.1%) |
| Total | 95 (100.0%) | 87 (100.0%) |
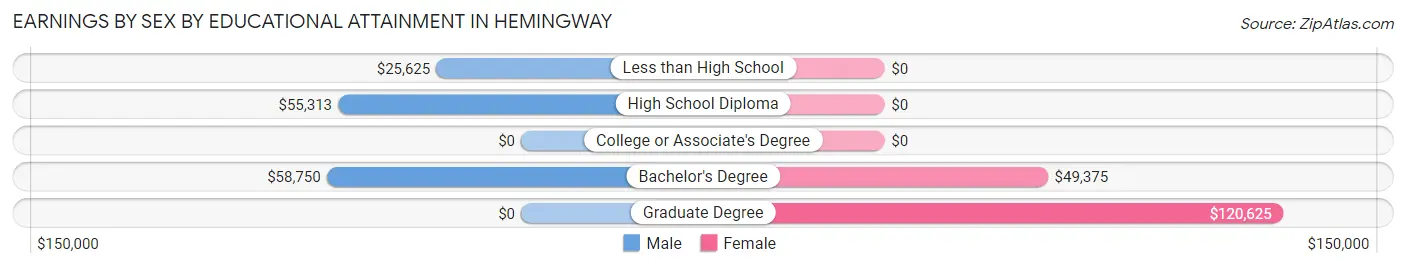
Earnings by Sex by Educational Attainment in Hemingway
Average earnings in Hemingway are $41,875 for men and $68,750 for women, a difference of 39.1%. Men with an educational attainment of bachelor's degree enjoy the highest average annual earnings of $58,750, while those with less than high school education earn the least with $25,625. Women with an educational attainment of graduate degree earn the most with the average annual earnings of $120,625, while those with bachelor's degree education have the smallest earnings of $49,375.
| Educational Attainment | Male Income | Female Income |
| Less than High School | $25,625 | $0 |
| High School Diploma | $55,313 | $0 |
| College or Associate's Degree | - | - |
| Bachelor's Degree | $58,750 | $49,375 |
| Graduate Degree | - | - |
| Total | $41,875 | $68,750 |
Family Income in Hemingway
Family Income Brackets in Hemingway
According to the Hemingway family income data, there are 25 families falling into the $35,000 to $49,999 income range, which is the most common income bracket and makes up 26.3% of all families.
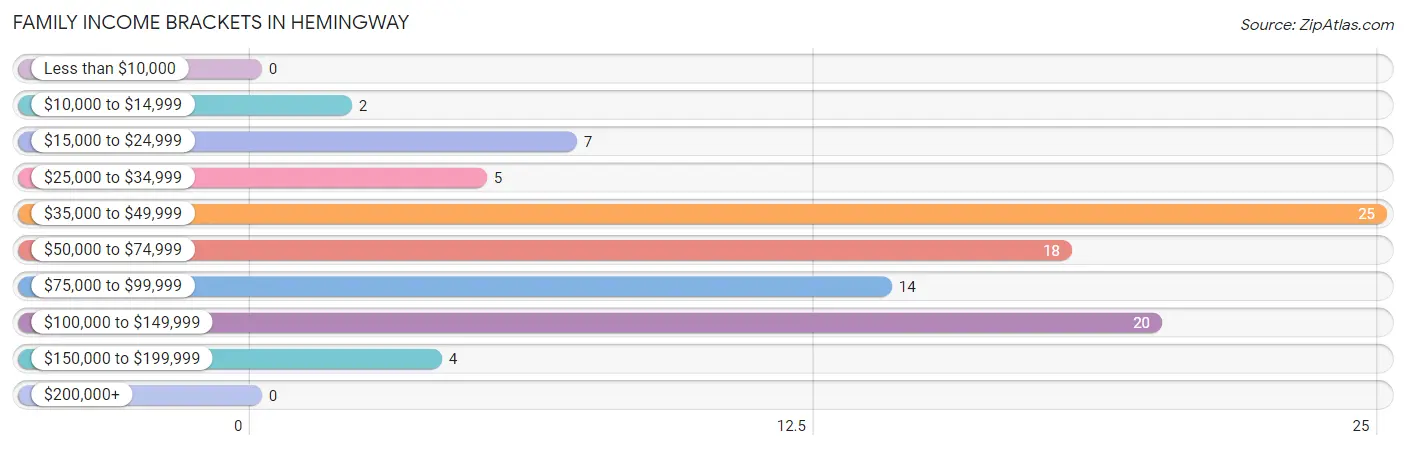
| Income Bracket | # Families | % Families |
| Less than $10,000 | 0 | 0.0% |
| $10,000 to $14,999 | 2 | 2.1% |
| $15,000 to $24,999 | 7 | 7.4% |
| $25,000 to $34,999 | 5 | 5.3% |
| $35,000 to $49,999 | 25 | 26.3% |
| $50,000 to $74,999 | 18 | 18.9% |
| $75,000 to $99,999 | 14 | 14.7% |
| $100,000 to $149,999 | 20 | 21.1% |
| $150,000 to $199,999 | 4 | 4.2% |
| $200,000+ | 0 | 0.0% |
Family Income by Famaliy Size in Hemingway
3-person families (25 | 26.3%) account for the highest median family income in Hemingway with $93,125 per family, while 3-person families (25 | 26.3%) have the highest median income of $31,042 per family member.
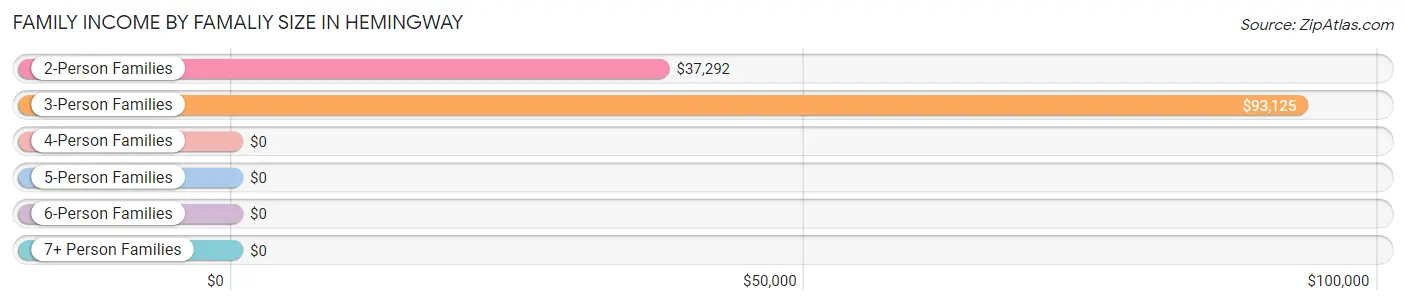
| Income Bracket | # Families | Median Income |
| 2-Person Families | 50 (52.6%) | $37,292 |
| 3-Person Families | 25 (26.3%) | $93,125 |
| 4-Person Families | 10 (10.5%) | $0 |
| 5-Person Families | 9 (9.5%) | $0 |
| 6-Person Families | 0 (0.0%) | $0 |
| 7+ Person Families | 1 (1.1%) | $0 |
| Total | 95 (100.0%) | $66,875 |
Family Income by Number of Earners in Hemingway
The median family income in Hemingway is $66,875, with families comprising 3+ earners (12) having the highest median family income of $148,000, while families with no earners (28) have the lowest median family income of $36,042, accounting for 12.6% and 29.5% of families, respectively.
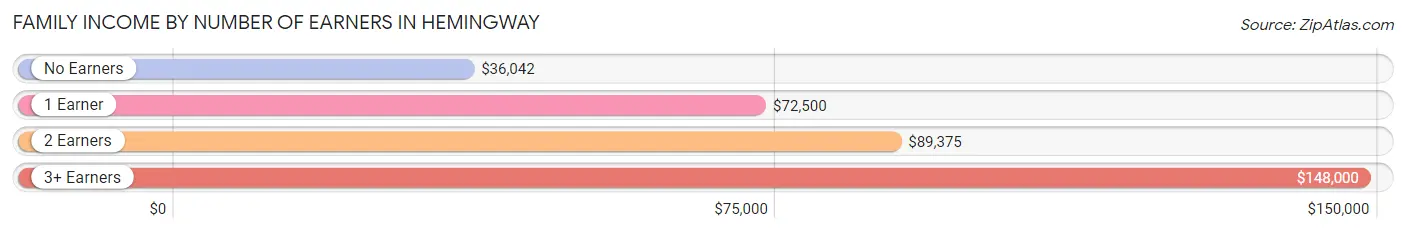
| Number of Earners | # Families | Median Income |
| No Earners | 28 (29.5%) | $36,042 |
| 1 Earner | 30 (31.6%) | $72,500 |
| 2 Earners | 25 (26.3%) | $89,375 |
| 3+ Earners | 12 (12.6%) | $148,000 |
| Total | 95 (100.0%) | $66,875 |
Household Income in Hemingway
Household Income Brackets in Hemingway
With 29 households falling in the category, the $25,000 to $34,999 income range is the most frequent in Hemingway, accounting for 17.9% of all households. In contrast, only 4 households (2.5%) fall into the $10,000 to $14,999 income bracket, making it the least populous group.
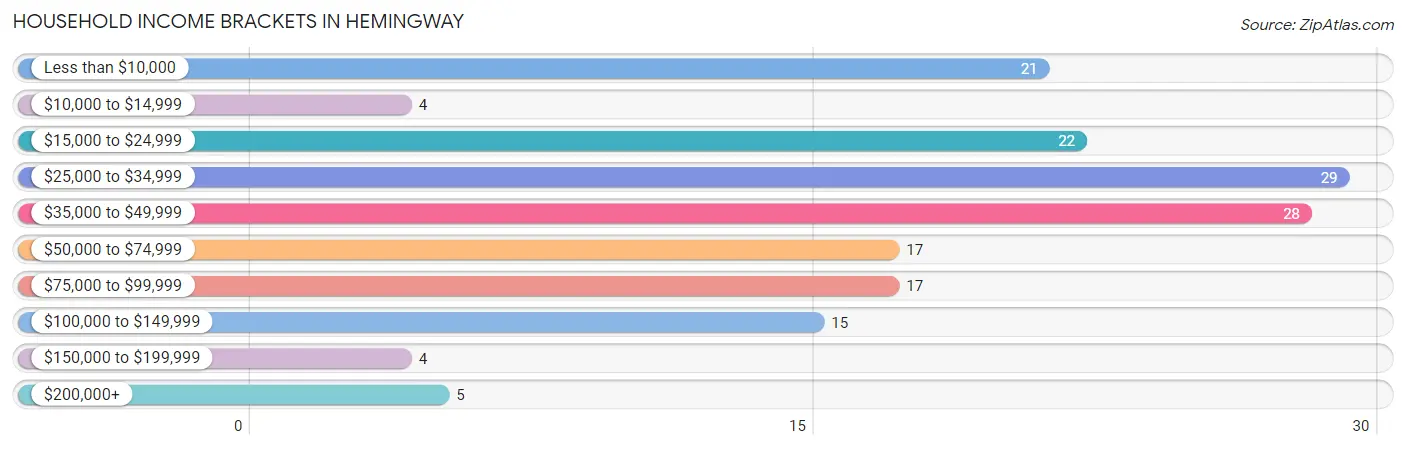
| Income Bracket | # Households | % Households |
| Less than $10,000 | 21 | 13.0% |
| $10,000 to $14,999 | 4 | 2.5% |
| $15,000 to $24,999 | 22 | 13.6% |
| $25,000 to $34,999 | 29 | 17.9% |
| $35,000 to $49,999 | 28 | 17.3% |
| $50,000 to $74,999 | 17 | 10.5% |
| $75,000 to $99,999 | 17 | 10.5% |
| $100,000 to $149,999 | 15 | 9.3% |
| $150,000 to $199,999 | 4 | 2.5% |
| $200,000+ | 5 | 3.1% |
Household Income by Householder Age in Hemingway
The median household income in Hemingway is $36,042, with the highest median household income of $75,313 found in the 25 to 44 years age bracket for the primary householder. A total of 31 households (19.1%) fall into this category. Meanwhile, the 15 to 24 years age bracket for the primary householder has the lowest median household income of $0, with 7 households (4.3%) in this group.
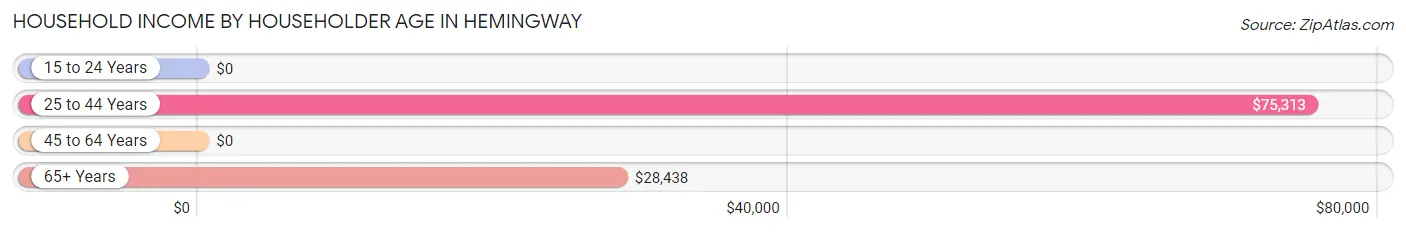
| Income Bracket | # Households | Median Income |
| 15 to 24 Years | 7 (4.3%) | $0 |
| 25 to 44 Years | 31 (19.1%) | $75,313 |
| 45 to 64 Years | 39 (24.1%) | $0 |
| 65+ Years | 85 (52.5%) | $28,438 |
| Total | 162 (100.0%) | $36,042 |
Poverty in Hemingway
Income Below Poverty by Sex and Age in Hemingway
With 3.6% poverty level for males and 11.2% for females among the residents of Hemingway, 55 to 64 year old males and 75 year old and over females are the most vulnerable to poverty, with 5 males (35.7%) and 16 females (61.5%) in their respective age groups living below the poverty level.
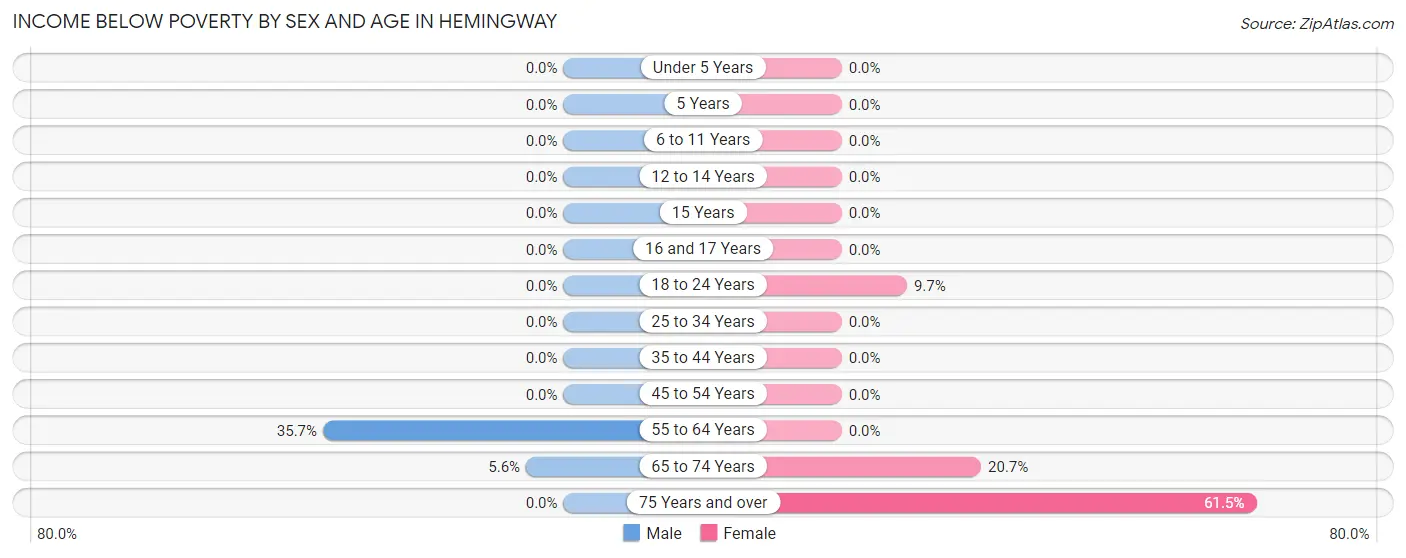
| Age Bracket | Male | Female |
| Under 5 Years | 0 (0.0%) | 0 (0.0%) |
| 5 Years | 0 (0.0%) | 0 (0.0%) |
| 6 to 11 Years | 0 (0.0%) | 0 (0.0%) |
| 12 to 14 Years | 0 (0.0%) | 0 (0.0%) |
| 15 Years | 0 (0.0%) | 0 (0.0%) |
| 16 and 17 Years | 0 (0.0%) | 0 (0.0%) |
| 18 to 24 Years | 0 (0.0%) | 3 (9.7%) |
| 25 to 34 Years | 0 (0.0%) | 0 (0.0%) |
| 35 to 44 Years | 0 (0.0%) | 0 (0.0%) |
| 45 to 54 Years | 0 (0.0%) | 0 (0.0%) |
| 55 to 64 Years | 5 (35.7%) | 0 (0.0%) |
| 65 to 74 Years | 2 (5.6%) | 6 (20.7%) |
| 75 Years and over | 0 (0.0%) | 16 (61.5%) |
| Total | 7 (3.6%) | 25 (11.2%) |
Income Above Poverty by Sex and Age in Hemingway
According to the poverty statistics in Hemingway, males aged under 5 years and females aged under 5 years are the age groups that are most secure financially, with 100.0% of males and 100.0% of females in these age groups living above the poverty line.
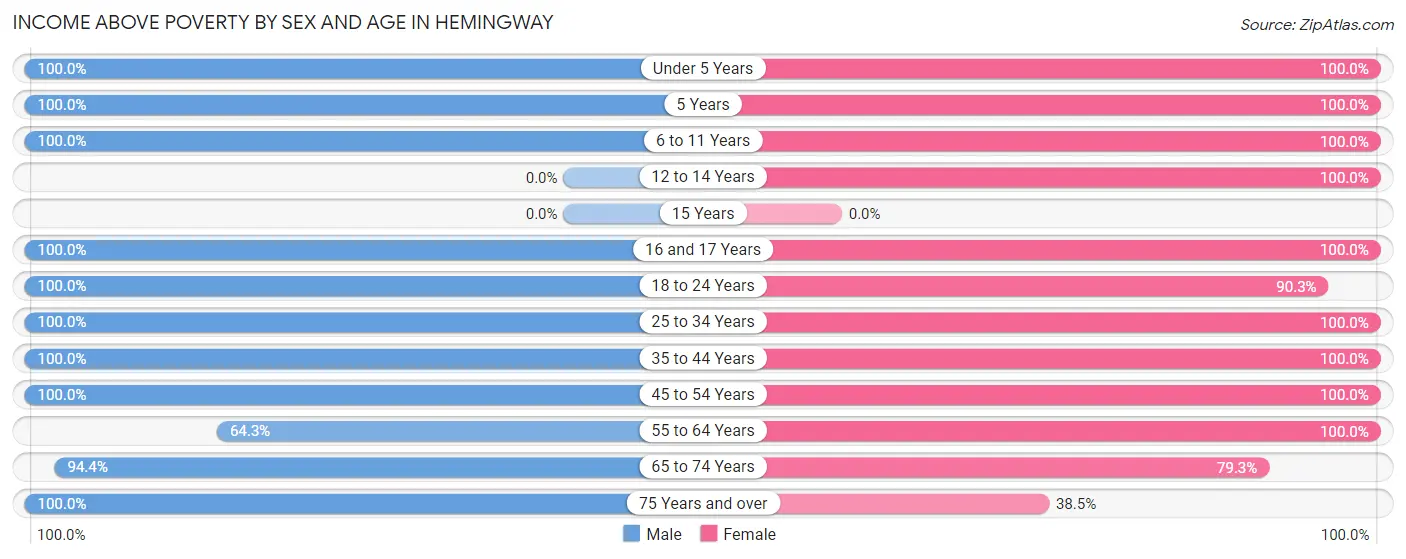
| Age Bracket | Male | Female |
| Under 5 Years | 9 (100.0%) | 8 (100.0%) |
| 5 Years | 3 (100.0%) | 7 (100.0%) |
| 6 to 11 Years | 9 (100.0%) | 3 (100.0%) |
| 12 to 14 Years | 0 (0.0%) | 12 (100.0%) |
| 15 Years | 0 (0.0%) | 0 (0.0%) |
| 16 and 17 Years | 13 (100.0%) | 14 (100.0%) |
| 18 to 24 Years | 34 (100.0%) | 28 (90.3%) |
| 25 to 34 Years | 17 (100.0%) | 9 (100.0%) |
| 35 to 44 Years | 27 (100.0%) | 23 (100.0%) |
| 45 to 54 Years | 19 (100.0%) | 37 (100.0%) |
| 55 to 64 Years | 9 (64.3%) | 24 (100.0%) |
| 65 to 74 Years | 34 (94.4%) | 23 (79.3%) |
| 75 Years and over | 14 (100.0%) | 10 (38.5%) |
| Total | 188 (96.4%) | 198 (88.8%) |
Income Below Poverty Among Married-Couple Families in Hemingway
The poverty statistics for married-couple families in Hemingway show that 3.2% or 2 of the total 63 families live below the poverty line. Families with no children have the highest poverty rate of 4.1%, comprising of 2 families. On the other hand, families with 1 or 2 children have the lowest poverty rate of 0.0%, which includes 0 families.
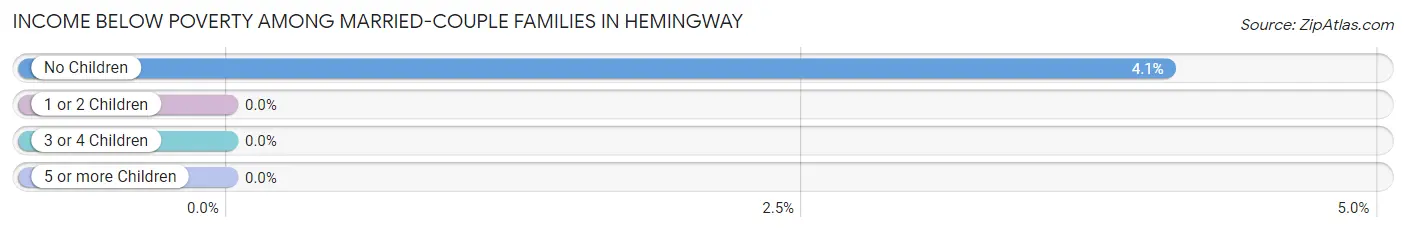
| Children | Above Poverty | Below Poverty |
| No Children | 47 (95.9%) | 2 (4.1%) |
| 1 or 2 Children | 13 (100.0%) | 0 (0.0%) |
| 3 or 4 Children | 1 (100.0%) | 0 (0.0%) |
| 5 or more Children | 0 (0.0%) | 0 (0.0%) |
| Total | 61 (96.8%) | 2 (3.2%) |
Income Below Poverty Among Single-Parent Households in Hemingway
| Children | Single Father | Single Mother |
| No Children | 0 (0.0%) | 0 (0.0%) |
| 1 or 2 Children | 0 (0.0%) | 0 (0.0%) |
| 3 or 4 Children | 0 (0.0%) | 0 (0.0%) |
| 5 or more Children | 0 (0.0%) | 0 (0.0%) |
| Total | 0 (0.0%) | 0 (0.0%) |
Income Below Poverty Among Married-Couple vs Single-Parent Households in Hemingway
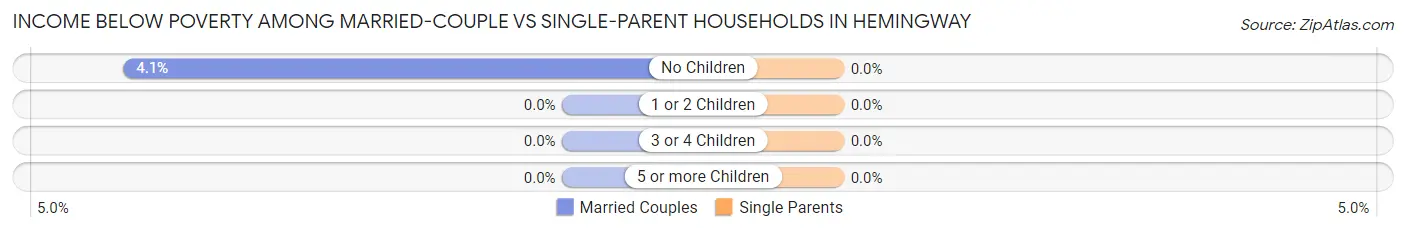
| Children | Married-Couple Families | Single-Parent Households |
| No Children | 2 (4.1%) | 0 (0.0%) |
| 1 or 2 Children | 0 (0.0%) | 0 (0.0%) |
| 3 or 4 Children | 0 (0.0%) | 0 (0.0%) |
| 5 or more Children | 0 (0.0%) | 0 (0.0%) |
| Total | 2 (3.2%) | 0 (0.0%) |
Race in Hemingway
The most populous races in Hemingway are White / Caucasian (251 | 59.6%), Black / African American (137 | 32.5%), and Some other Race (31 | 7.4%).
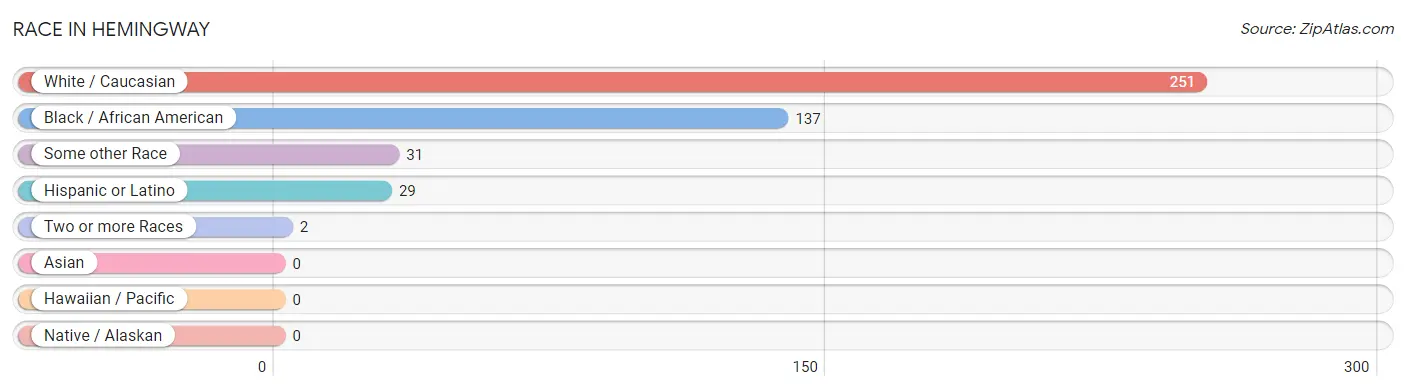
| Race | # Population | % Population |
| Asian | 0 | 0.0% |
| Black / African American | 137 | 32.5% |
| Hawaiian / Pacific | 0 | 0.0% |
| Hispanic or Latino | 29 | 6.9% |
| Native / Alaskan | 0 | 0.0% |
| White / Caucasian | 251 | 59.6% |
| Two or more Races | 2 | 0.5% |
| Some other Race | 31 | 7.4% |
| Total | 421 | 100.0% |
Ancestry in Hemingway
The most populous ancestries reported in Hemingway are American (48 | 11.4%), Irish (47 | 11.2%), Belizean (21 | 5.0%), Colombian (19 | 4.5%), and South American (19 | 4.5%), together accounting for 36.6% of all Hemingway residents.
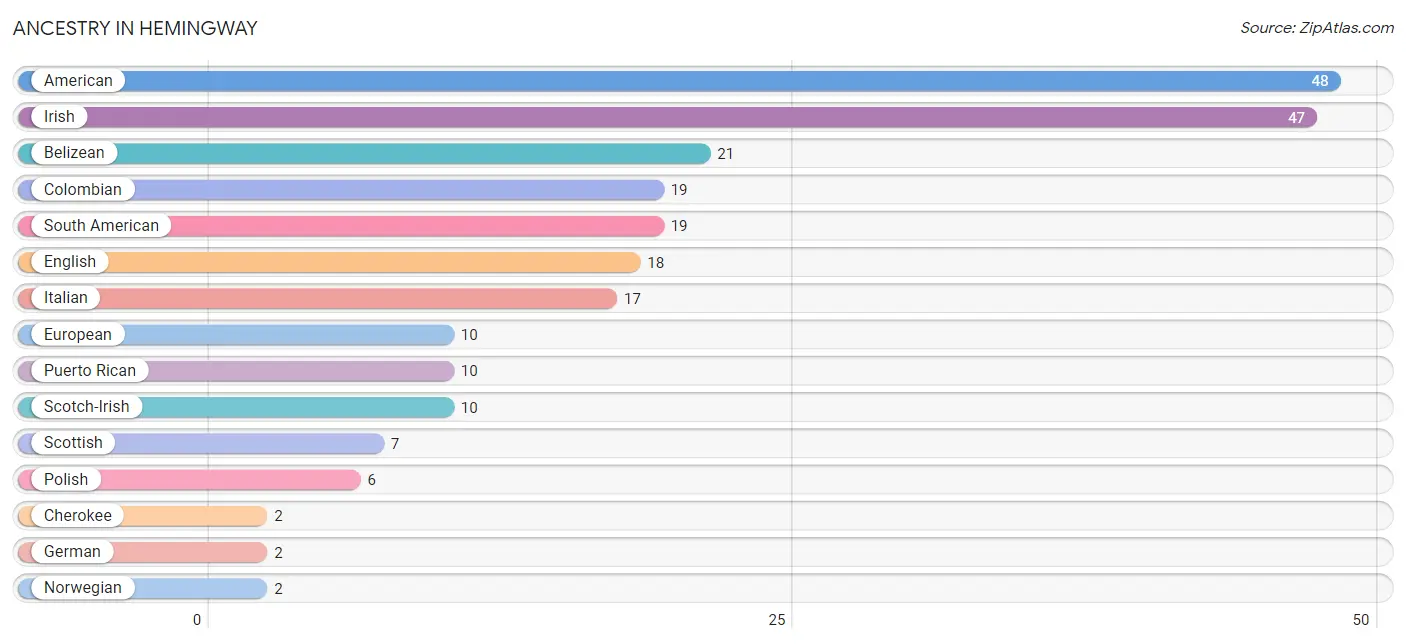
| Ancestry | # Population | % Population |
| American | 48 | 11.4% |
| Belizean | 21 | 5.0% |
| Cherokee | 2 | 0.5% |
| Colombian | 19 | 4.5% |
| English | 18 | 4.3% |
| European | 10 | 2.4% |
| German | 2 | 0.5% |
| Irish | 47 | 11.2% |
| Italian | 17 | 4.0% |
| Norwegian | 2 | 0.5% |
| Polish | 6 | 1.4% |
| Puerto Rican | 10 | 2.4% |
| Scotch-Irish | 10 | 2.4% |
| Scottish | 7 | 1.7% |
| South American | 19 | 4.5% |
| Welsh | 2 | 0.5% | View All 16 Rows |
Immigrants in Hemingway
The most numerous immigrant groups reported in Hemingway came from Central America (12 | 2.9%), Latin America (12 | 2.9%), and Honduras (9 | 2.1%), together accounting for 7.8% of all Hemingway residents.
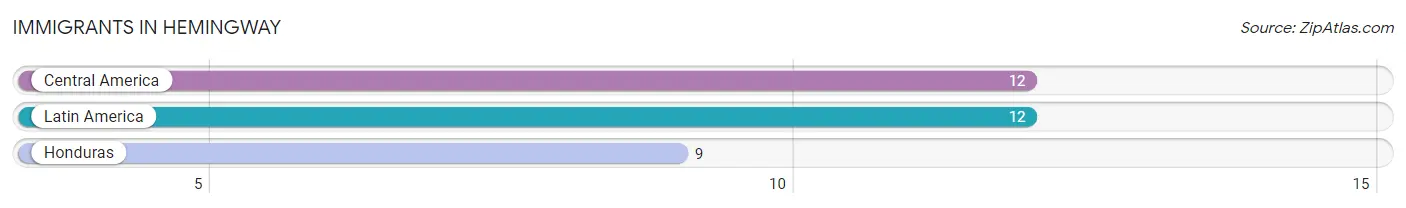
| Immigration Origin | # Population | % Population |
| Central America | 12 | 2.9% |
| Honduras | 9 | 2.1% |
| Latin America | 12 | 2.9% | View All 3 Rows |
Sex and Age in Hemingway
Sex and Age in Hemingway
The most populous age groups in Hemingway are 15 to 19 Years (38 | 19.4%) for men and 20 to 24 Years (28 | 12.4%) for women.
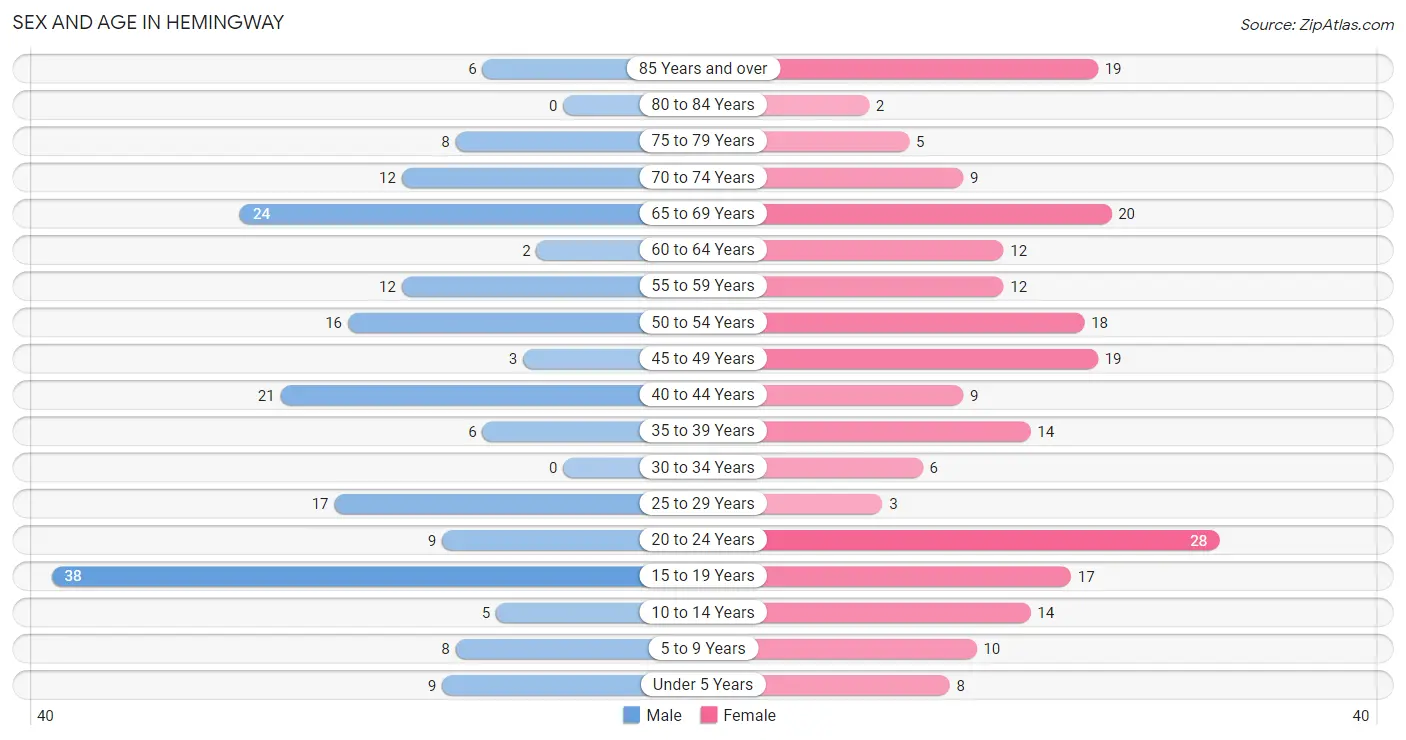
| Age Bracket | Male | Female |
| Under 5 Years | 9 (4.6%) | 8 (3.6%) |
| 5 to 9 Years | 8 (4.1%) | 10 (4.4%) |
| 10 to 14 Years | 5 (2.5%) | 14 (6.2%) |
| 15 to 19 Years | 38 (19.4%) | 17 (7.6%) |
| 20 to 24 Years | 9 (4.6%) | 28 (12.4%) |
| 25 to 29 Years | 17 (8.7%) | 3 (1.3%) |
| 30 to 34 Years | 0 (0.0%) | 6 (2.7%) |
| 35 to 39 Years | 6 (3.1%) | 14 (6.2%) |
| 40 to 44 Years | 21 (10.7%) | 9 (4.0%) |
| 45 to 49 Years | 3 (1.5%) | 19 (8.4%) |
| 50 to 54 Years | 16 (8.2%) | 18 (8.0%) |
| 55 to 59 Years | 12 (6.1%) | 12 (5.3%) |
| 60 to 64 Years | 2 (1.0%) | 12 (5.3%) |
| 65 to 69 Years | 24 (12.2%) | 20 (8.9%) |
| 70 to 74 Years | 12 (6.1%) | 9 (4.0%) |
| 75 to 79 Years | 8 (4.1%) | 5 (2.2%) |
| 80 to 84 Years | 0 (0.0%) | 2 (0.9%) |
| 85 Years and over | 6 (3.1%) | 19 (8.4%) |
| Total | 196 (100.0%) | 225 (100.0%) |
Families and Households in Hemingway
Median Family Size in Hemingway
The median family size in Hemingway is 3.44 persons per family, with single female/mother families (16 | 16.8%) accounting for the largest median family size of 3.88 persons per family. On the other hand, single male/father families (16 | 16.8%) represent the smallest median family size with 3.00 persons per family.
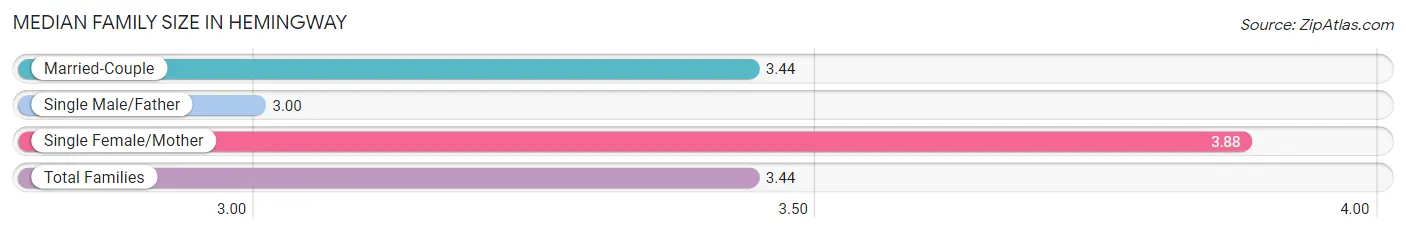
| Family Type | # Families | Family Size |
| Married-Couple | 63 (66.3%) | 3.44 |
| Single Male/Father | 16 (16.8%) | 3.00 |
| Single Female/Mother | 16 (16.8%) | 3.88 |
| Total Families | 95 (100.0%) | 3.44 |
Median Household Size in Hemingway
The median household size in Hemingway is 2.60 persons per household, with single female/mother households (16 | 9.9%) accounting for the largest median household size of 4.5 persons per household. non-family households (67 | 41.4%) represent the smallest median household size with 1.07 persons per household.
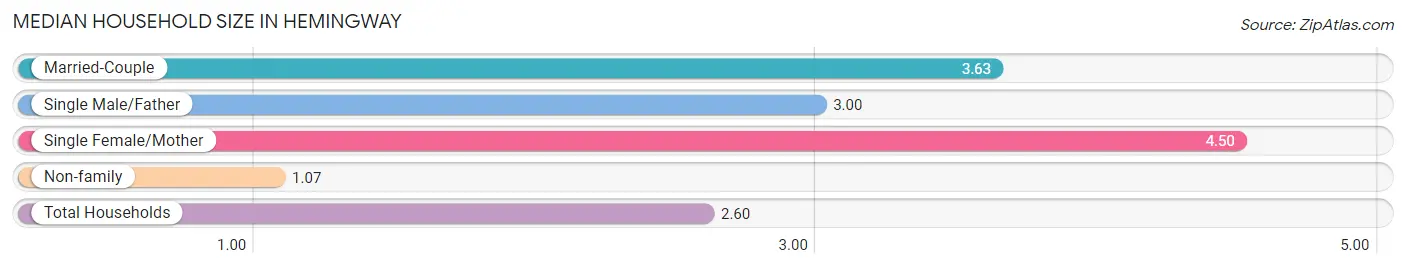
| Household Type | # Households | Household Size |
| Married-Couple | 63 (38.9%) | 3.63 |
| Single Male/Father | 16 (9.9%) | 3.00 |
| Single Female/Mother | 16 (9.9%) | 4.50 |
| Non-family | 67 (41.4%) | 1.07 |
| Total Households | 162 (100.0%) | 2.60 |
Household Size by Marriage Status in Hemingway
Out of a total of 162 households in Hemingway, 95 (58.6%) are family households, while 67 (41.4%) are nonfamily households. The most numerous type of family households are 2-person households, comprising 45, and the most common type of nonfamily households are 1-person households, comprising 63.
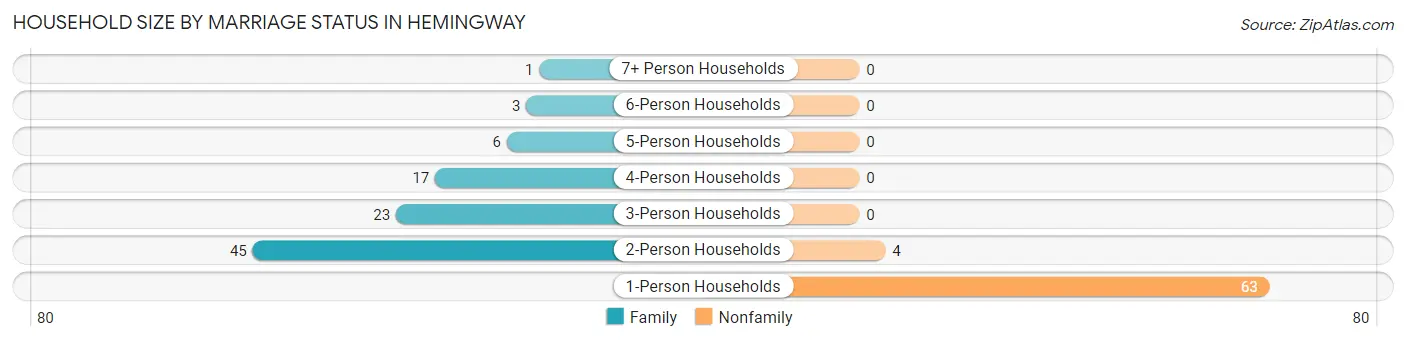
| Household Size | Family Households | Nonfamily Households |
| 1-Person Households | - | 63 (38.9%) |
| 2-Person Households | 45 (27.8%) | 4 (2.5%) |
| 3-Person Households | 23 (14.2%) | 0 (0.0%) |
| 4-Person Households | 17 (10.5%) | 0 (0.0%) |
| 5-Person Households | 6 (3.7%) | 0 (0.0%) |
| 6-Person Households | 3 (1.8%) | 0 (0.0%) |
| 7+ Person Households | 1 (0.6%) | 0 (0.0%) |
| Total | 95 (58.6%) | 67 (41.4%) |
Female Fertility in Hemingway
Fertility by Age in Hemingway
Average fertility rate in Hemingway is 36.0 births per 1,000 women. Women in the age bracket of 20 to 34 years have the highest fertility rate with 108.0 births per 1,000 women. Women in the age bracket of 20 to 34 years acount for 100.0% of all women with births.
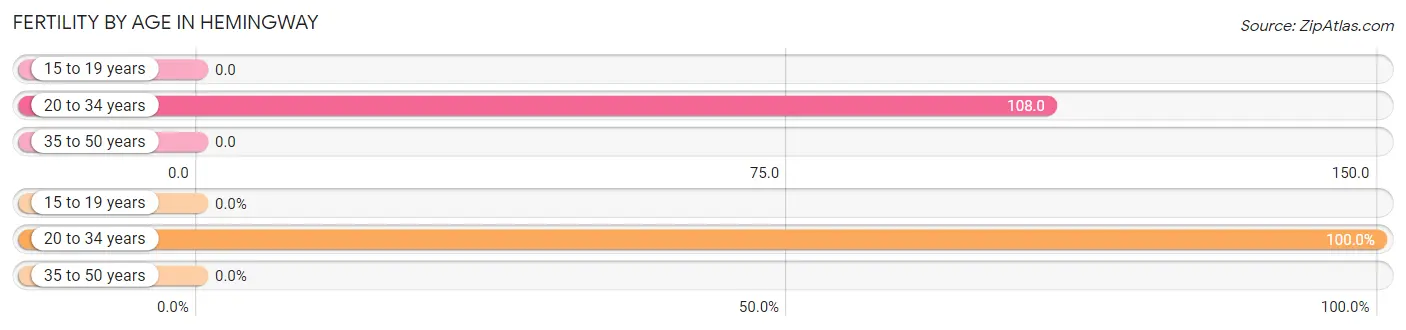
| Age Bracket | Women with Births | Births / 1,000 Women |
| 15 to 19 years | 0 (0.0%) | 0.0 |
| 20 to 34 years | 4 (100.0%) | 108.0 |
| 35 to 50 years | 0 (0.0%) | 0.0 |
| Total | 4 (100.0%) | 36.0 |
Fertility by Age by Marriage Status in Hemingway
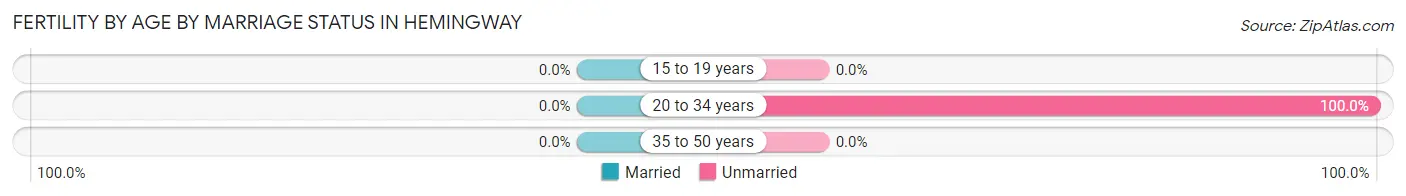
| Age Bracket | Married | Unmarried |
| 15 to 19 years | 0 (0.0%) | 0 (0.0%) |
| 20 to 34 years | 0 (0.0%) | 4 (100.0%) |
| 35 to 50 years | 0 (0.0%) | 0 (0.0%) |
| Total | 0 (0.0%) | 4 (100.0%) |
Fertility by Education in Hemingway
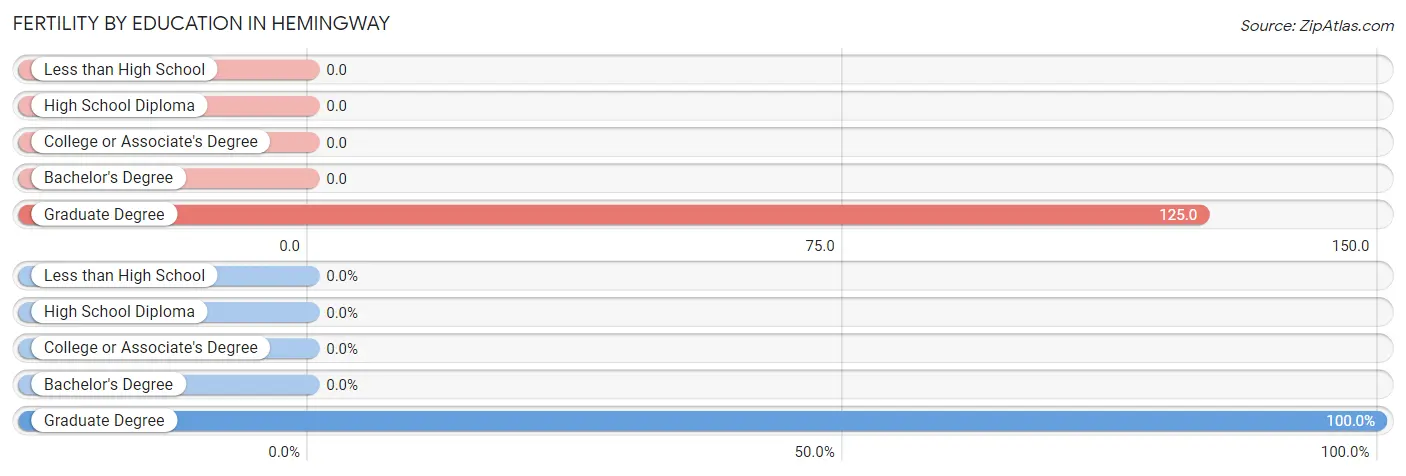
| Educational Attainment | Women with Births | Births / 1,000 Women |
| Less than High School | 0 (0.0%) | 0.0 |
| High School Diploma | 0 (0.0%) | 0.0 |
| College or Associate's Degree | 0 (0.0%) | 0.0 |
| Bachelor's Degree | 0 (0.0%) | 0.0 |
| Graduate Degree | 4 (100.0%) | 125.0 |
| Total | 4 (100.0%) | 36.0 |
Fertility by Education by Marriage Status in Hemingway
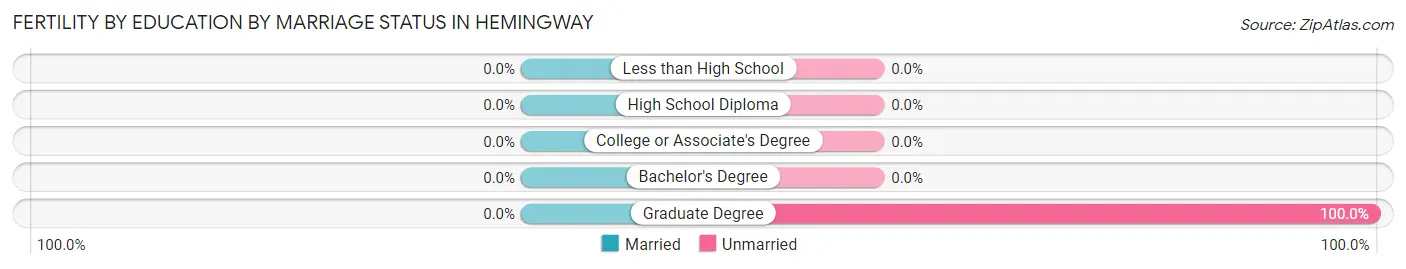
| Educational Attainment | Married | Unmarried |
| Less than High School | 0 (0.0%) | 0 (0.0%) |
| High School Diploma | 0 (0.0%) | 0 (0.0%) |
| College or Associate's Degree | 0 (0.0%) | 0 (0.0%) |
| Bachelor's Degree | 0 (0.0%) | 0 (0.0%) |
| Graduate Degree | 0 (0.0%) | 4 (100.0%) |
| Total | 0 (0.0%) | 4 (100.0%) |
Employment Characteristics in Hemingway
Employment by Class of Employer in Hemingway
Among the 159 employed individuals in Hemingway, private company employees (100 | 62.9%), local government employees (23 | 14.5%), and state government employees (16 | 10.1%) make up the most common classes of employment.
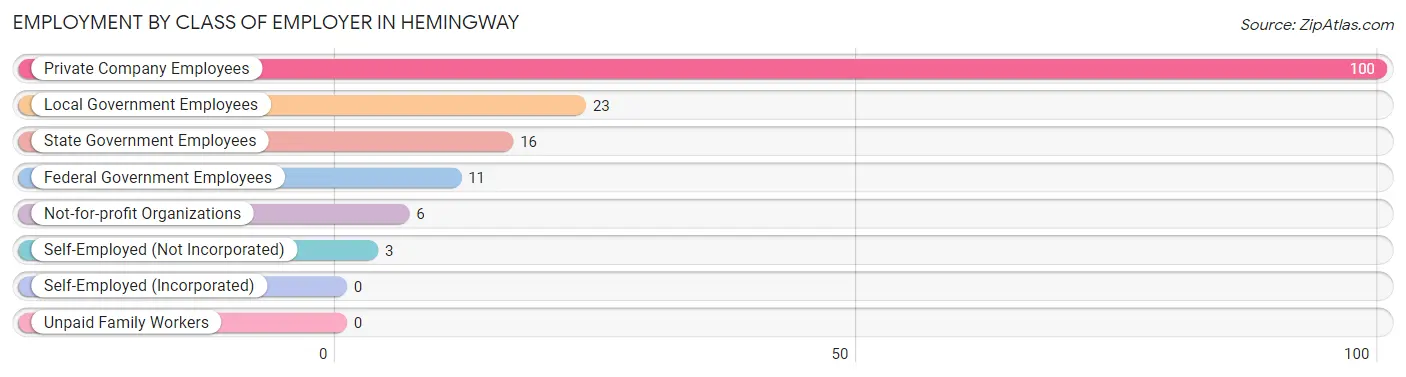
| Employer Class | # Employees | % Employees |
| Private Company Employees | 100 | 62.9% |
| Self-Employed (Incorporated) | 0 | 0.0% |
| Self-Employed (Not Incorporated) | 3 | 1.9% |
| Not-for-profit Organizations | 6 | 3.8% |
| Local Government Employees | 23 | 14.5% |
| State Government Employees | 16 | 10.1% |
| Federal Government Employees | 11 | 6.9% |
| Unpaid Family Workers | 0 | 0.0% |
| Total | 159 | 100.0% |
Employment Status by Age in Hemingway
According to the labor force statistics for Hemingway, out of the total population over 16 years of age (367), 45.0% or 165 individuals are in the labor force, with 3.8% or 6 of them unemployed. The age group with the highest labor force participation rate is 30 to 34 years, with 100.0% or 6 individuals in the labor force. Within the labor force, the 65 to 74 years age range has the highest percentage of unemployed individuals, with 42.9% or 3 of them being unemployed.
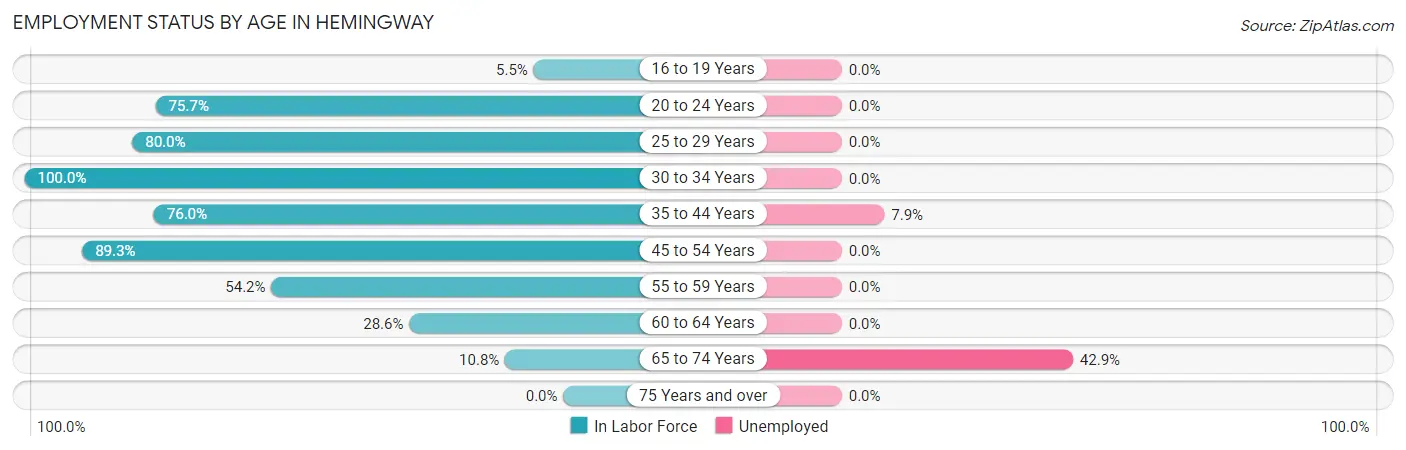
| Age Bracket | In Labor Force | Unemployed |
| 16 to 19 Years | 3 (5.5%) | 0 (0.0%) |
| 20 to 24 Years | 28 (75.7%) | 0 (0.0%) |
| 25 to 29 Years | 16 (80.0%) | 0 (0.0%) |
| 30 to 34 Years | 6 (100.0%) | 0 (0.0%) |
| 35 to 44 Years | 38 (76.0%) | 3 (7.9%) |
| 45 to 54 Years | 50 (89.3%) | 0 (0.0%) |
| 55 to 59 Years | 13 (54.2%) | 0 (0.0%) |
| 60 to 64 Years | 4 (28.6%) | 0 (0.0%) |
| 65 to 74 Years | 7 (10.8%) | 3 (42.9%) |
| 75 Years and over | 0 (0.0%) | 0 (0.0%) |
| Total | 165 (45.0%) | 6 (3.8%) |
Employment Status by Educational Attainment in Hemingway
According to labor force statistics for Hemingway, 74.7% of individuals (127) out of the total population between 25 and 64 years of age (170) are in the labor force, with 2.5% or 3 of them being unemployed. The group with the highest labor force participation rate are those with the educational attainment of bachelor's degree or higher, with 97.9% or 46 individuals in the labor force. Within the labor force, individuals with college / associate degree education have the highest percentage of unemployment, with 12.0% or 3 of them being unemployed.
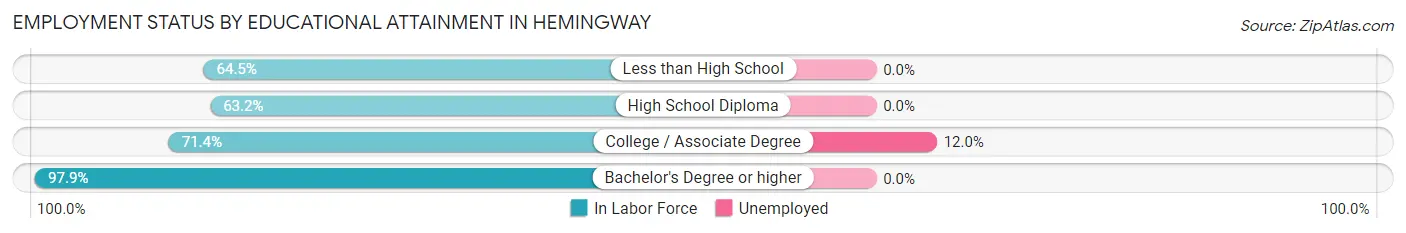
| Educational Attainment | In Labor Force | Unemployed |
| Less than High School | 20 (64.5%) | 0 (0.0%) |
| High School Diploma | 36 (63.2%) | 0 (0.0%) |
| College / Associate Degree | 25 (71.4%) | 4 (12.0%) |
| Bachelor's Degree or higher | 46 (97.9%) | 0 (0.0%) |
| Total | 127 (74.7%) | 4 (2.5%) |
Employment Occupations by Sex in Hemingway
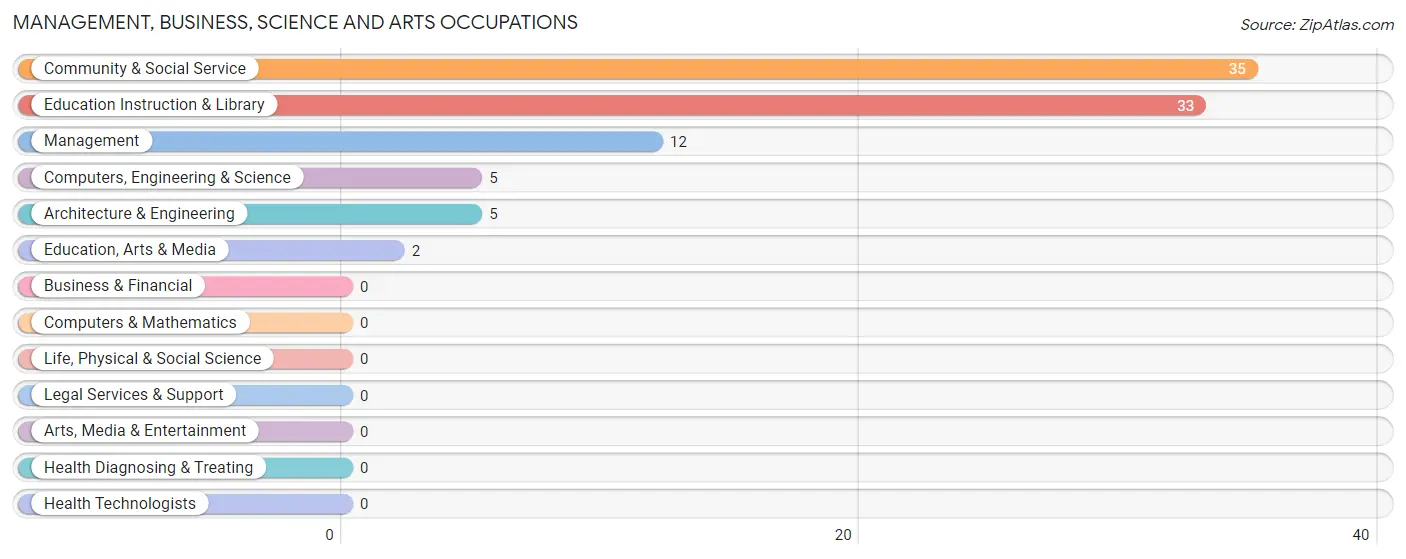
Management, Business, Science and Arts Occupations
The most common Management, Business, Science and Arts occupations in Hemingway are Community & Social Service (35 | 22.7%), Education Instruction & Library (33 | 21.4%), Management (12 | 7.8%), Computers, Engineering & Science (5 | 3.3%), and Architecture & Engineering (5 | 3.3%).
Management, Business, Science and Arts Occupations by Sex
Within the Management, Business, Science and Arts occupations in Hemingway, the most male-oriented occupations are Computers, Engineering & Science (100.0%), and Architecture & Engineering (100.0%), while the most female-oriented occupations are Management (100.0%), Community & Social Service (100.0%), and Education, Arts & Media (100.0%).
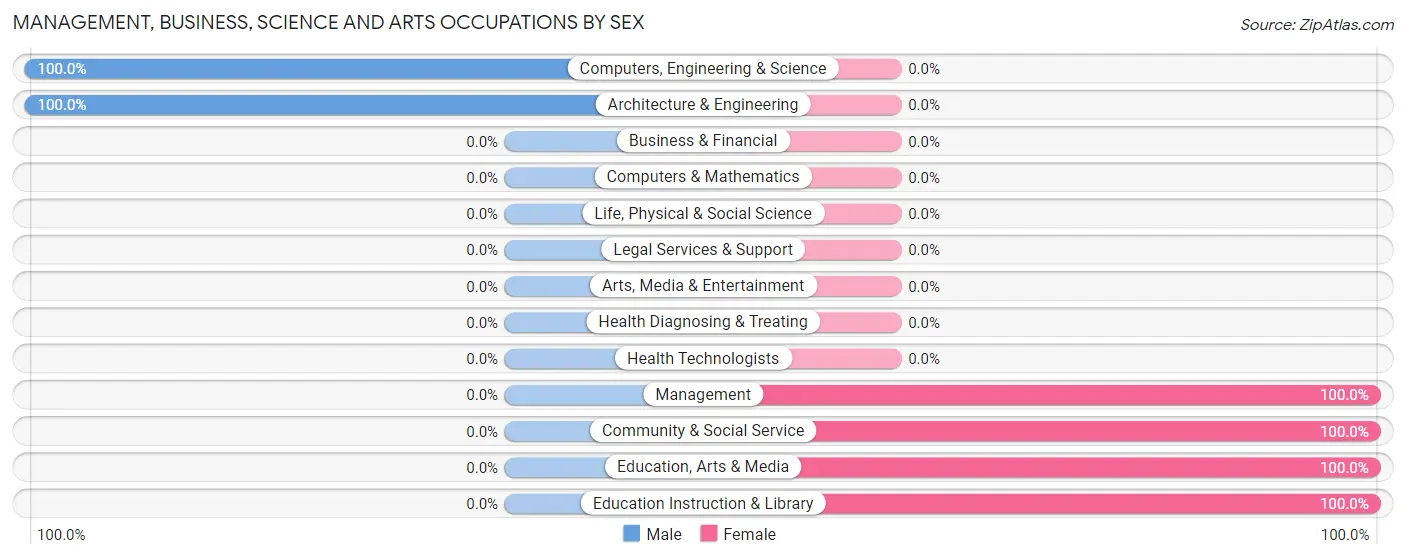
| Occupation | Male | Female |
| Management | 0 (0.0%) | 12 (100.0%) |
| Business & Financial | 0 (0.0%) | 0 (0.0%) |
| Computers, Engineering & Science | 5 (100.0%) | 0 (0.0%) |
| Computers & Mathematics | 0 (0.0%) | 0 (0.0%) |
| Architecture & Engineering | 5 (100.0%) | 0 (0.0%) |
| Life, Physical & Social Science | 0 (0.0%) | 0 (0.0%) |
| Community & Social Service | 0 (0.0%) | 35 (100.0%) |
| Education, Arts & Media | 0 (0.0%) | 2 (100.0%) |
| Legal Services & Support | 0 (0.0%) | 0 (0.0%) |
| Education Instruction & Library | 0 (0.0%) | 33 (100.0%) |
| Arts, Media & Entertainment | 0 (0.0%) | 0 (0.0%) |
| Health Diagnosing & Treating | 0 (0.0%) | 0 (0.0%) |
| Health Technologists | 0 (0.0%) | 0 (0.0%) |
| Total (Category) | 5 (9.6%) | 47 (90.4%) |
| Total (Overall) | 73 (47.4%) | 81 (52.6%) |
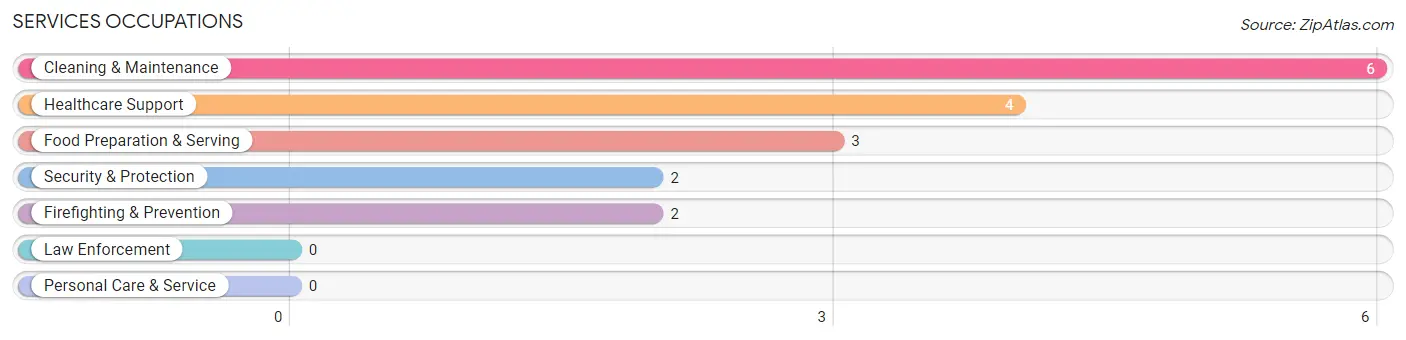
Services Occupations
The most common Services occupations in Hemingway are Cleaning & Maintenance (6 | 3.9%), Healthcare Support (4 | 2.6%), Food Preparation & Serving (3 | 1.9%), Security & Protection (2 | 1.3%), and Firefighting & Prevention (2 | 1.3%).
Services Occupations by Sex
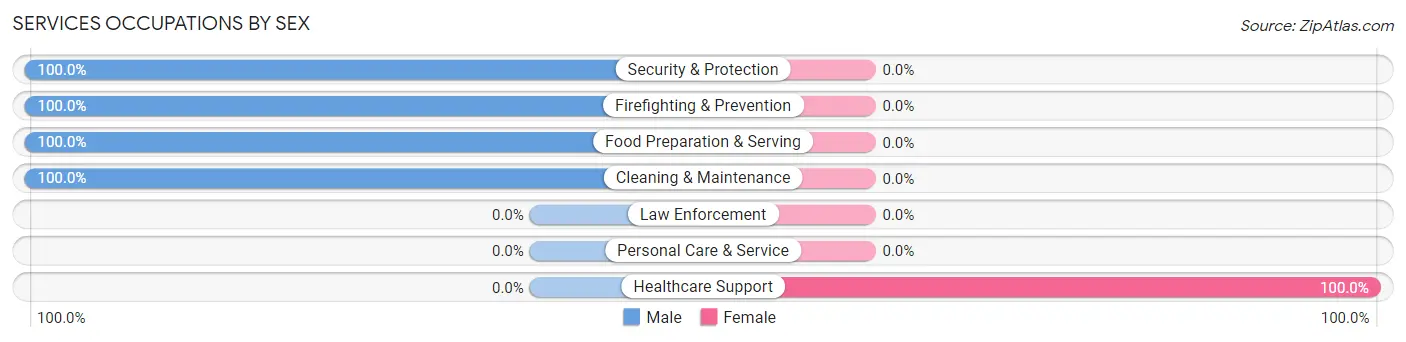
| Occupation | Male | Female |
| Healthcare Support | 0 (0.0%) | 4 (100.0%) |
| Security & Protection | 2 (100.0%) | 0 (0.0%) |
| Firefighting & Prevention | 2 (100.0%) | 0 (0.0%) |
| Law Enforcement | 0 (0.0%) | 0 (0.0%) |
| Food Preparation & Serving | 3 (100.0%) | 0 (0.0%) |
| Cleaning & Maintenance | 6 (100.0%) | 0 (0.0%) |
| Personal Care & Service | 0 (0.0%) | 0 (0.0%) |
| Total (Category) | 11 (73.3%) | 4 (26.7%) |
| Total (Overall) | 73 (47.4%) | 81 (52.6%) |
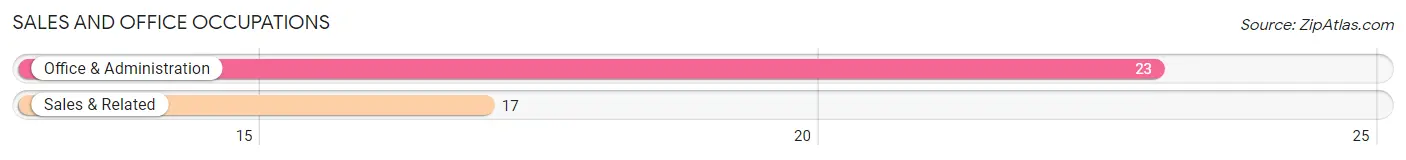
Sales and Office Occupations
The most common Sales and Office occupations in Hemingway are Office & Administration (23 | 14.9%), and Sales & Related (17 | 11.0%).
Sales and Office Occupations by Sex
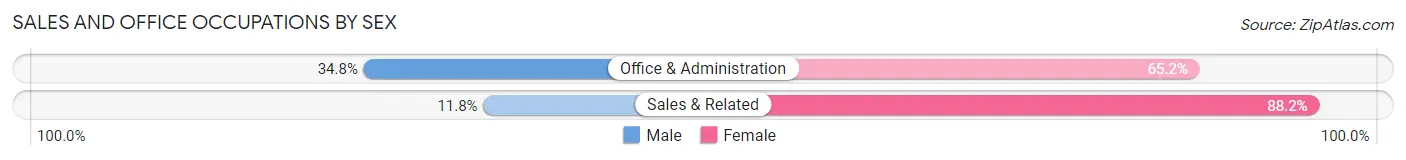
| Occupation | Male | Female |
| Sales & Related | 2 (11.8%) | 15 (88.2%) |
| Office & Administration | 8 (34.8%) | 15 (65.2%) |
| Total (Category) | 10 (25.0%) | 30 (75.0%) |
| Total (Overall) | 73 (47.4%) | 81 (52.6%) |
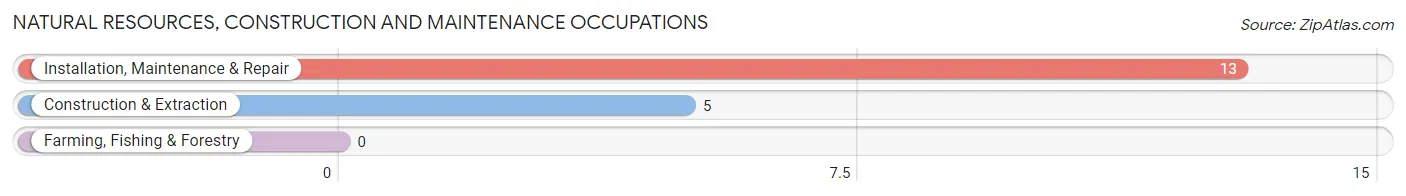
Natural Resources, Construction and Maintenance Occupations
The most common Natural Resources, Construction and Maintenance occupations in Hemingway are Installation, Maintenance & Repair (13 | 8.4%), and Construction & Extraction (5 | 3.3%).
Natural Resources, Construction and Maintenance Occupations by Sex
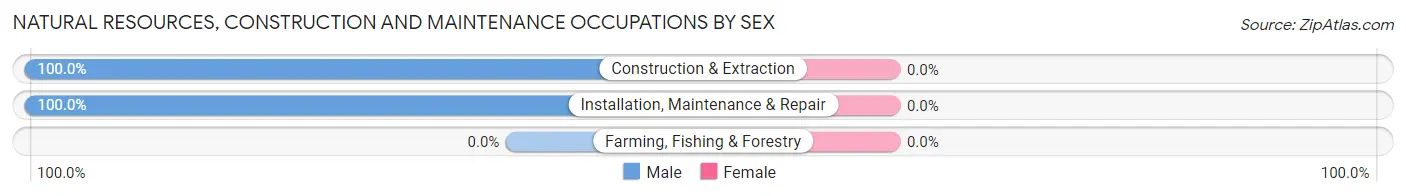
| Occupation | Male | Female |
| Farming, Fishing & Forestry | 0 (0.0%) | 0 (0.0%) |
| Construction & Extraction | 5 (100.0%) | 0 (0.0%) |
| Installation, Maintenance & Repair | 13 (100.0%) | 0 (0.0%) |
| Total (Category) | 18 (100.0%) | 0 (0.0%) |
| Total (Overall) | 73 (47.4%) | 81 (52.6%) |
Production, Transportation and Moving Occupations
The most common Production, Transportation and Moving occupations in Hemingway are Production (21 | 13.6%), Transportation (4 | 2.6%), and Material Moving (4 | 2.6%).
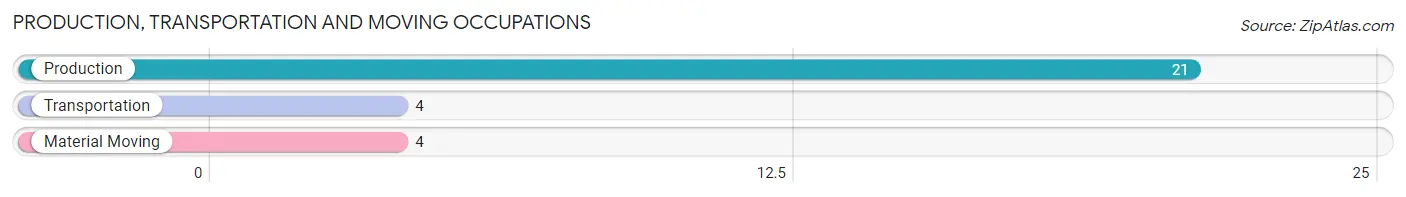
Production, Transportation and Moving Occupations by Sex
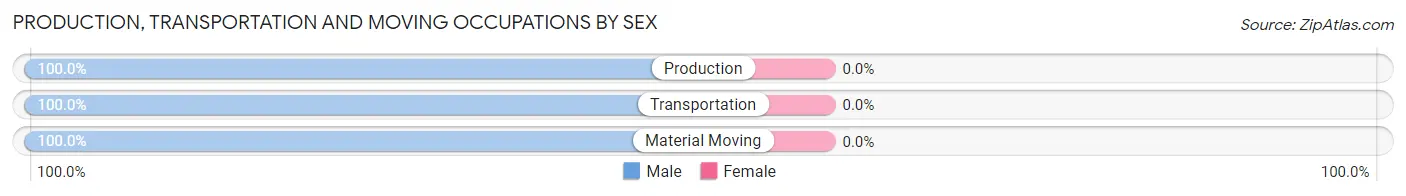
| Occupation | Male | Female |
| Production | 21 (100.0%) | 0 (0.0%) |
| Transportation | 4 (100.0%) | 0 (0.0%) |
| Material Moving | 4 (100.0%) | 0 (0.0%) |
| Total (Category) | 29 (100.0%) | 0 (0.0%) |
| Total (Overall) | 73 (47.4%) | 81 (52.6%) |
Employment Industries by Sex in Hemingway
Employment Industries in Hemingway
The major employment industries in Hemingway include Manufacturing (43 | 27.9%), Retail Trade (21 | 13.6%), Information (19 | 12.3%), Transportation & Warehousing (16 | 10.4%), and Educational Services (16 | 10.4%).
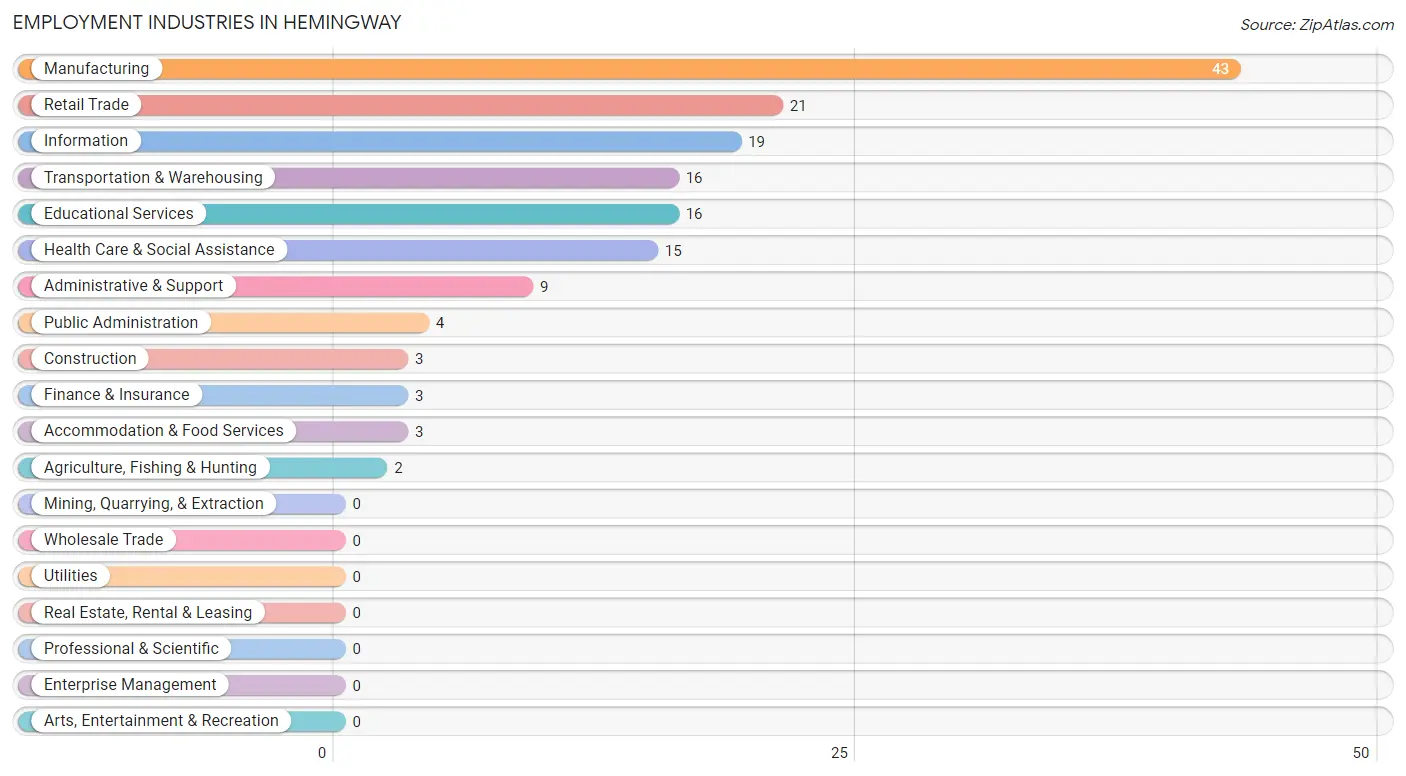
Employment Industries by Sex in Hemingway
The Hemingway industries that see more men than women are Agriculture, Fishing & Hunting (100.0%), Construction (100.0%), and Administrative & Support (100.0%), whereas the industries that tend to have a higher number of women are Information (100.0%), Finance & Insurance (100.0%), and Educational Services (100.0%).
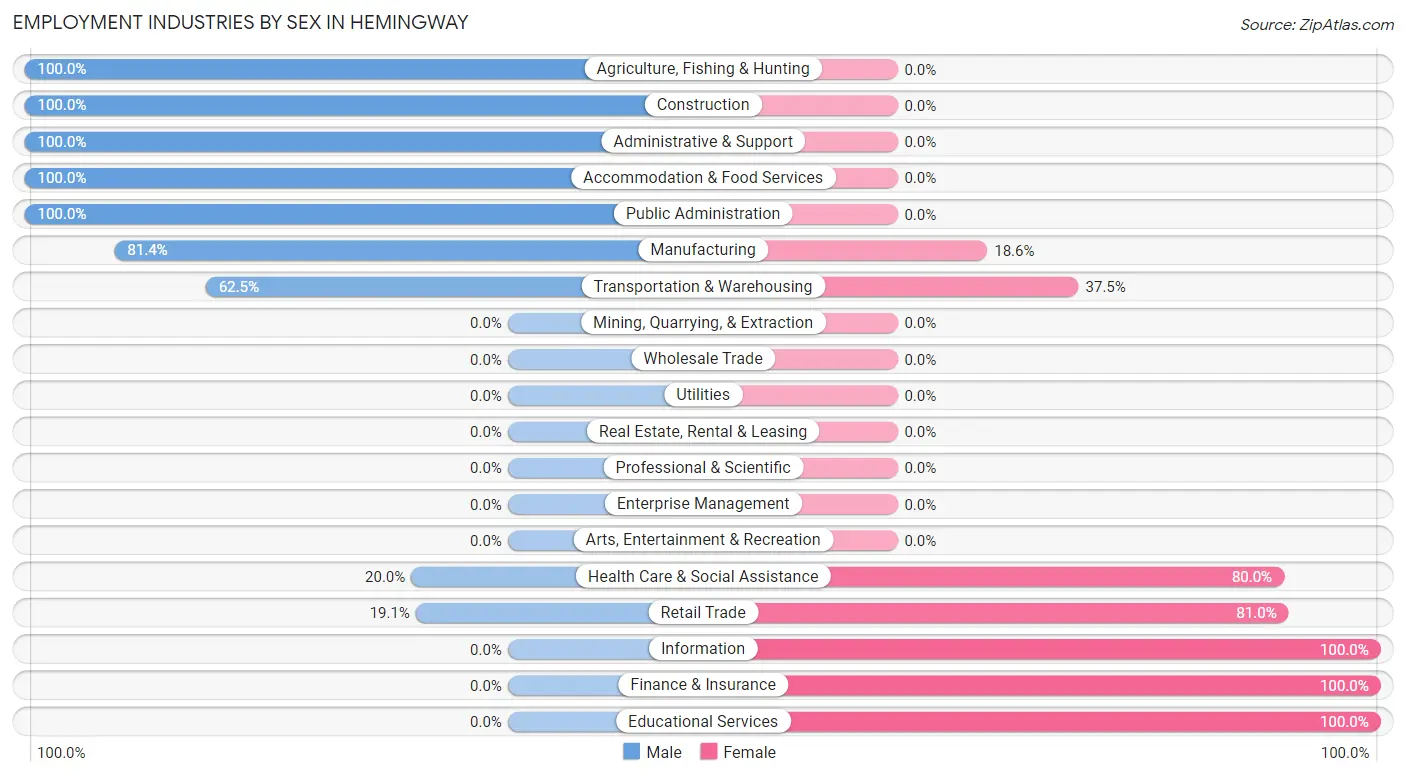
| Industry | Male | Female |
| Agriculture, Fishing & Hunting | 2 (100.0%) | 0 (0.0%) |
| Mining, Quarrying, & Extraction | 0 (0.0%) | 0 (0.0%) |
| Construction | 3 (100.0%) | 0 (0.0%) |
| Manufacturing | 35 (81.4%) | 8 (18.6%) |
| Wholesale Trade | 0 (0.0%) | 0 (0.0%) |
| Retail Trade | 4 (19.1%) | 17 (80.9%) |
| Transportation & Warehousing | 10 (62.5%) | 6 (37.5%) |
| Utilities | 0 (0.0%) | 0 (0.0%) |
| Information | 0 (0.0%) | 19 (100.0%) |
| Finance & Insurance | 0 (0.0%) | 3 (100.0%) |
| Real Estate, Rental & Leasing | 0 (0.0%) | 0 (0.0%) |
| Professional & Scientific | 0 (0.0%) | 0 (0.0%) |
| Enterprise Management | 0 (0.0%) | 0 (0.0%) |
| Administrative & Support | 9 (100.0%) | 0 (0.0%) |
| Educational Services | 0 (0.0%) | 16 (100.0%) |
| Health Care & Social Assistance | 3 (20.0%) | 12 (80.0%) |
| Arts, Entertainment & Recreation | 0 (0.0%) | 0 (0.0%) |
| Accommodation & Food Services | 3 (100.0%) | 0 (0.0%) |
| Public Administration | 4 (100.0%) | 0 (0.0%) |
| Total | 73 (47.4%) | 81 (52.6%) |
Education in Hemingway
School Enrollment in Hemingway
The most common levels of schooling among the 97 students in Hemingway are high school (50 | 51.5%), college / undergraduate (17 | 17.5%), and graduate / professional (14 | 14.4%).
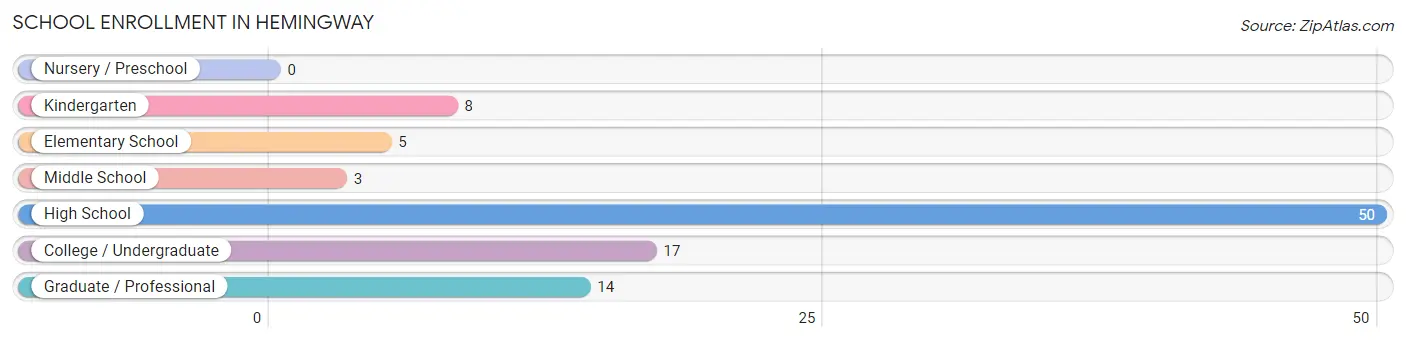
| School Level | # Students | % Students |
| Nursery / Preschool | 0 | 0.0% |
| Kindergarten | 8 | 8.3% |
| Elementary School | 5 | 5.1% |
| Middle School | 3 | 3.1% |
| High School | 50 | 51.5% |
| College / Undergraduate | 17 | 17.5% |
| Graduate / Professional | 14 | 14.4% |
| Total | 97 | 100.0% |
School Enrollment by Age by Funding Source in Hemingway
Out of a total of 97 students who are enrolled in schools in Hemingway, 4 (4.1%) attend a private institution, while the remaining 93 (95.9%) are enrolled in public schools. The age group of 20 to 24 year olds has the highest likelihood of being enrolled in private schools, with 4 (36.4% in the age bracket) enrolled. Conversely, the age group of 5 to 9 year old has the lowest likelihood of being enrolled in a private school, with 13 (100.0% in the age bracket) attending a public institution.
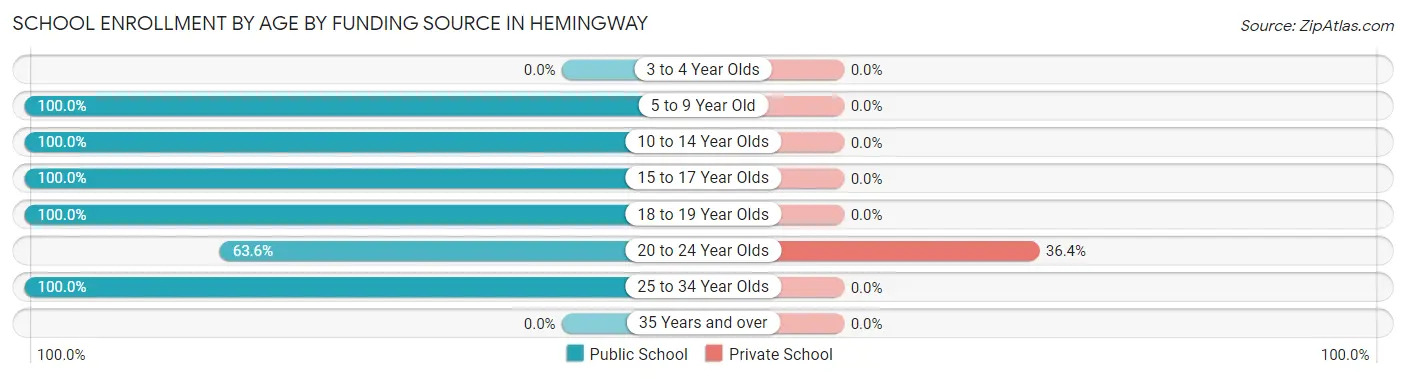
| Age Bracket | Public School | Private School |
| 3 to 4 Year Olds | 0 (0.0%) | 0 (0.0%) |
| 5 to 9 Year Old | 13 (100.0%) | 0 (0.0%) |
| 10 to 14 Year Olds | 15 (100.0%) | 0 (0.0%) |
| 15 to 17 Year Olds | 27 (100.0%) | 0 (0.0%) |
| 18 to 19 Year Olds | 25 (100.0%) | 0 (0.0%) |
| 20 to 24 Year Olds | 7 (63.6%) | 4 (36.4%) |
| 25 to 34 Year Olds | 6 (100.0%) | 0 (0.0%) |
| 35 Years and over | 0 (0.0%) | 0 (0.0%) |
| Total | 93 (95.9%) | 4 (4.1%) |
Educational Attainment by Field of Study in Hemingway
Business (24 | 31.6%), literature & languages (17 | 22.4%), education (11 | 14.5%), communications (8 | 10.5%), and engineering (5 | 6.6%) are the most common fields of study among 76 individuals in Hemingway who have obtained a bachelor's degree or higher.
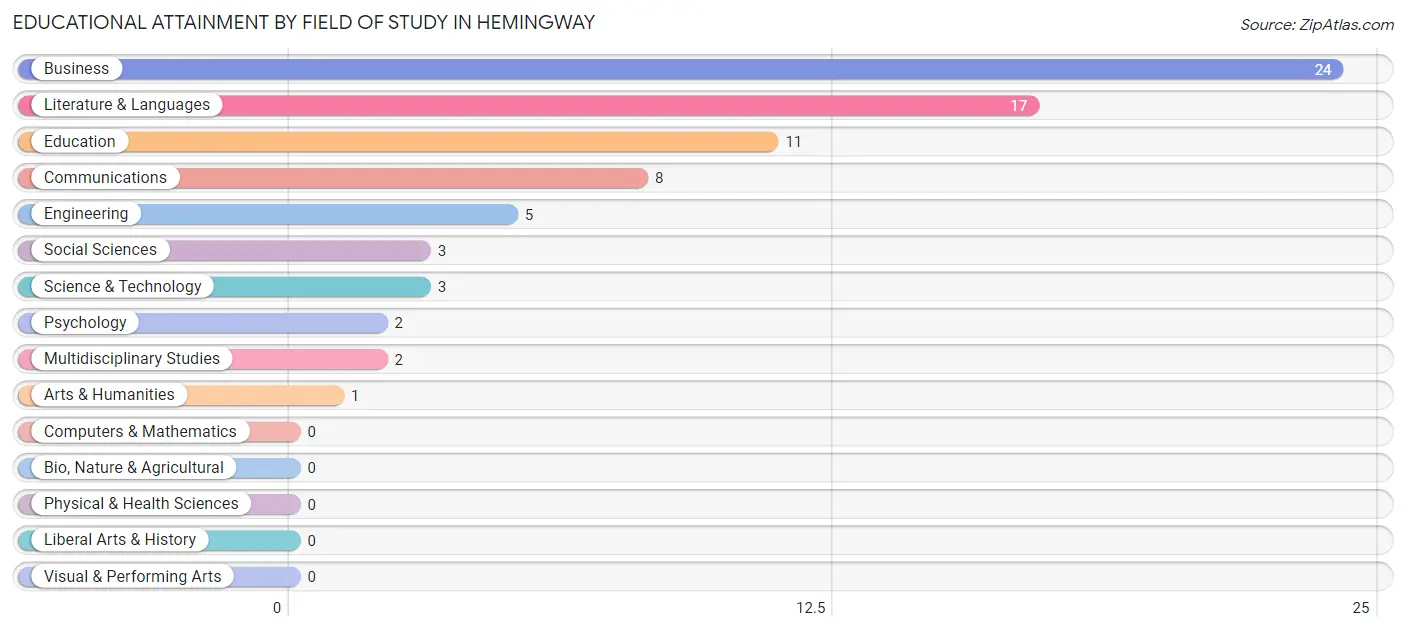
| Field of Study | # Graduates | % Graduates |
| Computers & Mathematics | 0 | 0.0% |
| Bio, Nature & Agricultural | 0 | 0.0% |
| Physical & Health Sciences | 0 | 0.0% |
| Psychology | 2 | 2.6% |
| Social Sciences | 3 | 4.0% |
| Engineering | 5 | 6.6% |
| Multidisciplinary Studies | 2 | 2.6% |
| Science & Technology | 3 | 4.0% |
| Business | 24 | 31.6% |
| Education | 11 | 14.5% |
| Literature & Languages | 17 | 22.4% |
| Liberal Arts & History | 0 | 0.0% |
| Visual & Performing Arts | 0 | 0.0% |
| Communications | 8 | 10.5% |
| Arts & Humanities | 1 | 1.3% |
| Total | 76 | 100.0% |
Transportation & Commute in Hemingway
Vehicle Availability by Sex in Hemingway
The most prevalent vehicle ownership categories in Hemingway are males with 2 vehicles (24, accounting for 30.8%) and females with 2 vehicles (20, making up 29.6%).
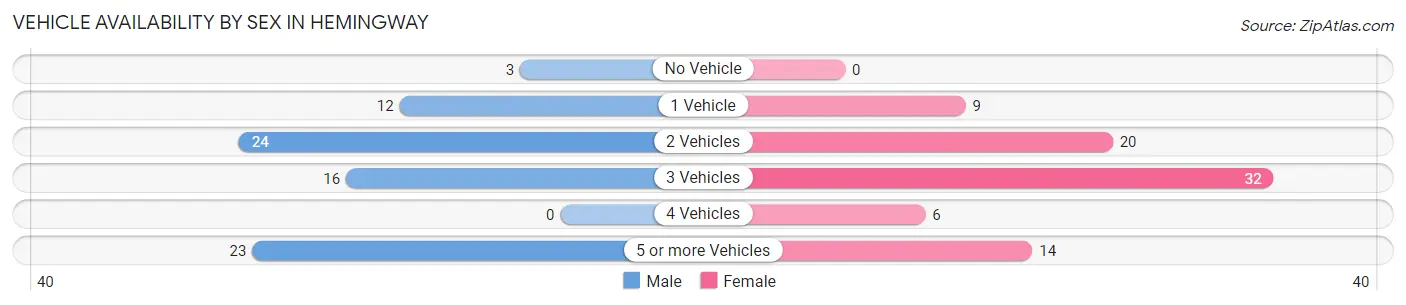
| Vehicles Available | Male | Female |
| No Vehicle | 3 (3.8%) | 0 (0.0%) |
| 1 Vehicle | 12 (15.4%) | 9 (11.1%) |
| 2 Vehicles | 24 (30.8%) | 20 (24.7%) |
| 3 Vehicles | 16 (20.5%) | 32 (39.5%) |
| 4 Vehicles | 0 (0.0%) | 6 (7.4%) |
| 5 or more Vehicles | 23 (29.5%) | 14 (17.3%) |
| Total | 78 (100.0%) | 81 (100.0%) |
Commute Time in Hemingway
The most frequently occuring commute durations in Hemingway are 30 to 34 minutes (48 commuters, 30.2%), 60 to 89 minutes (21 commuters, 13.2%), and 45 to 59 minutes (20 commuters, 12.6%).
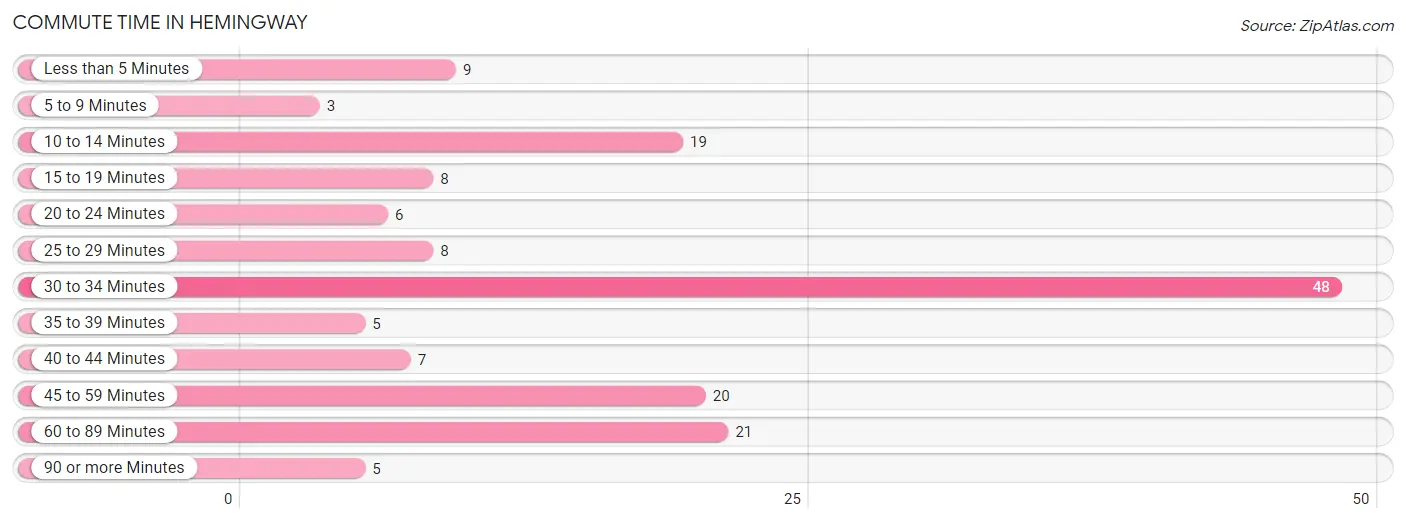
| Commute Time | # Commuters | % Commuters |
| Less than 5 Minutes | 9 | 5.7% |
| 5 to 9 Minutes | 3 | 1.9% |
| 10 to 14 Minutes | 19 | 11.9% |
| 15 to 19 Minutes | 8 | 5.0% |
| 20 to 24 Minutes | 6 | 3.8% |
| 25 to 29 Minutes | 8 | 5.0% |
| 30 to 34 Minutes | 48 | 30.2% |
| 35 to 39 Minutes | 5 | 3.1% |
| 40 to 44 Minutes | 7 | 4.4% |
| 45 to 59 Minutes | 20 | 12.6% |
| 60 to 89 Minutes | 21 | 13.2% |
| 90 or more Minutes | 5 | 3.1% |
Commute Time by Sex in Hemingway
The most common commute times in Hemingway are 30 to 34 minutes (28 commuters, 35.9%) for males and 30 to 34 minutes (20 commuters, 24.7%) for females.
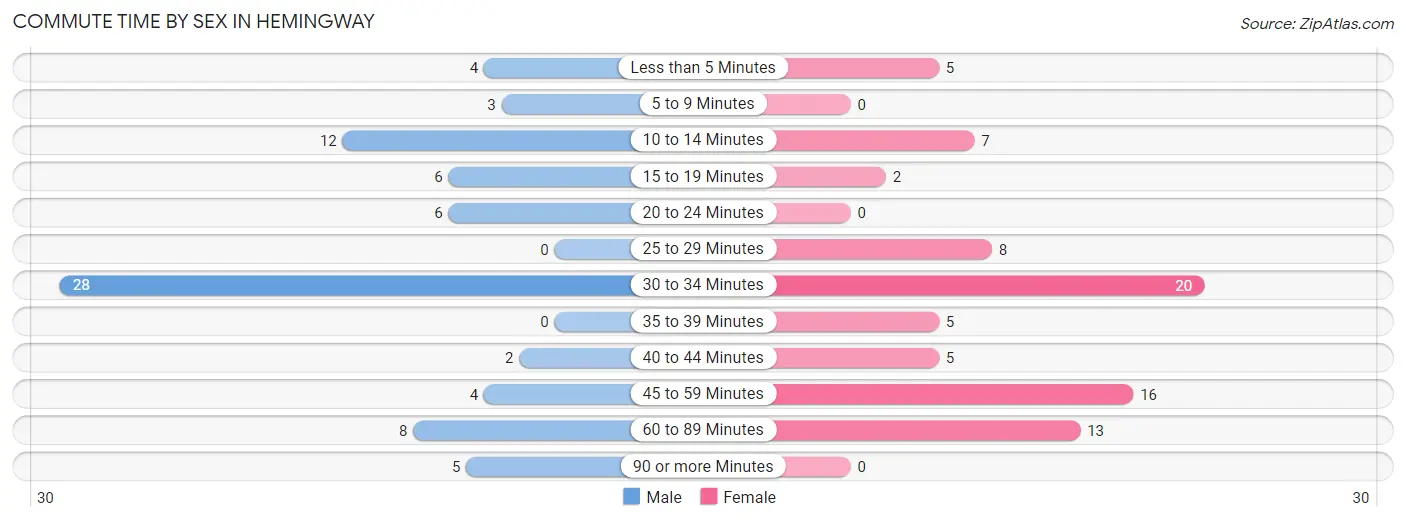
| Commute Time | Male | Female |
| Less than 5 Minutes | 4 (5.1%) | 5 (6.2%) |
| 5 to 9 Minutes | 3 (3.8%) | 0 (0.0%) |
| 10 to 14 Minutes | 12 (15.4%) | 7 (8.6%) |
| 15 to 19 Minutes | 6 (7.7%) | 2 (2.5%) |
| 20 to 24 Minutes | 6 (7.7%) | 0 (0.0%) |
| 25 to 29 Minutes | 0 (0.0%) | 8 (9.9%) |
| 30 to 34 Minutes | 28 (35.9%) | 20 (24.7%) |
| 35 to 39 Minutes | 0 (0.0%) | 5 (6.2%) |
| 40 to 44 Minutes | 2 (2.6%) | 5 (6.2%) |
| 45 to 59 Minutes | 4 (5.1%) | 16 (19.8%) |
| 60 to 89 Minutes | 8 (10.3%) | 13 (16.1%) |
| 90 or more Minutes | 5 (6.4%) | 0 (0.0%) |
Time of Departure to Work by Sex in Hemingway
The most frequent times of departure to work in Hemingway are 5:00 AM to 5:29 AM (15, 19.2%) for males and 7:00 AM to 7:29 AM (27, 33.3%) for females.
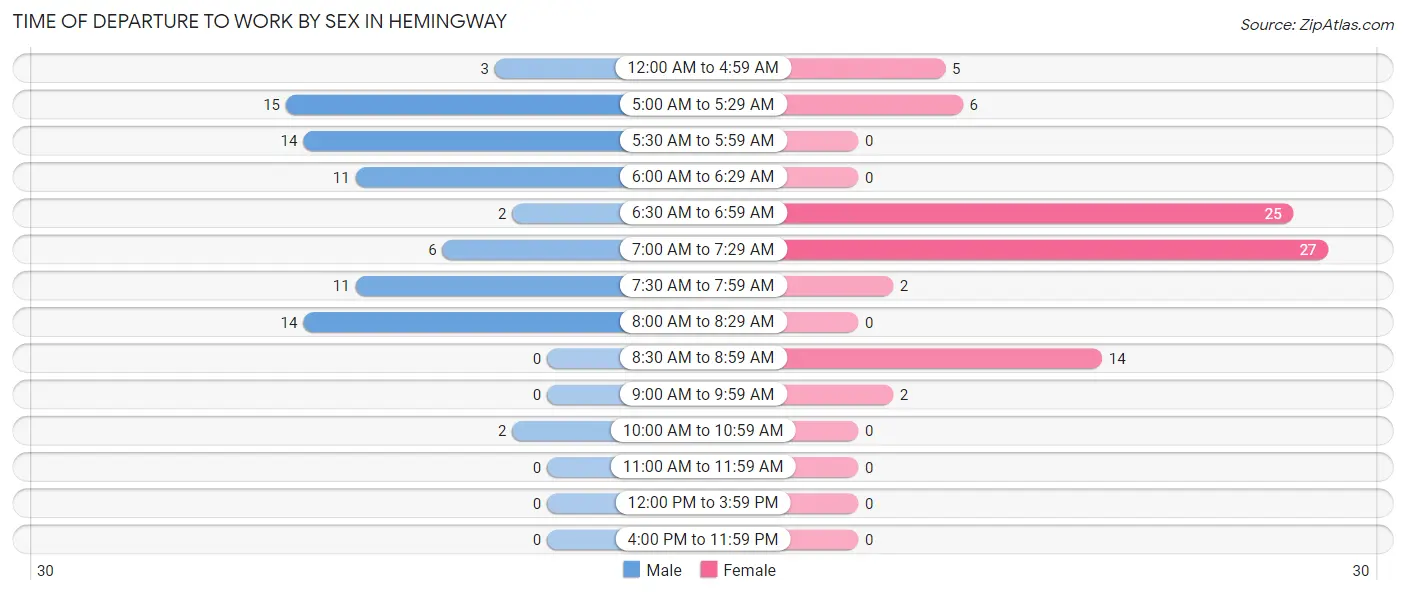
| Time of Departure | Male | Female |
| 12:00 AM to 4:59 AM | 3 (3.8%) | 5 (6.2%) |
| 5:00 AM to 5:29 AM | 15 (19.2%) | 6 (7.4%) |
| 5:30 AM to 5:59 AM | 14 (17.9%) | 0 (0.0%) |
| 6:00 AM to 6:29 AM | 11 (14.1%) | 0 (0.0%) |
| 6:30 AM to 6:59 AM | 2 (2.6%) | 25 (30.9%) |
| 7:00 AM to 7:29 AM | 6 (7.7%) | 27 (33.3%) |
| 7:30 AM to 7:59 AM | 11 (14.1%) | 2 (2.5%) |
| 8:00 AM to 8:29 AM | 14 (17.9%) | 0 (0.0%) |
| 8:30 AM to 8:59 AM | 0 (0.0%) | 14 (17.3%) |
| 9:00 AM to 9:59 AM | 0 (0.0%) | 2 (2.5%) |
| 10:00 AM to 10:59 AM | 2 (2.6%) | 0 (0.0%) |
| 11:00 AM to 11:59 AM | 0 (0.0%) | 0 (0.0%) |
| 12:00 PM to 3:59 PM | 0 (0.0%) | 0 (0.0%) |
| 4:00 PM to 11:59 PM | 0 (0.0%) | 0 (0.0%) |
| Total | 78 (100.0%) | 81 (100.0%) |
Housing Occupancy in Hemingway
Occupancy by Ownership in Hemingway
Of the total 162 dwellings in Hemingway, owner-occupied units account for 109 (67.3%), while renter-occupied units make up 53 (32.7%).
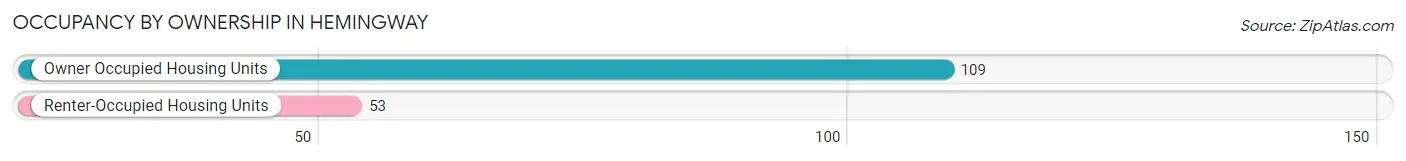
| Occupancy | # Housing Units | % Housing Units |
| Owner Occupied Housing Units | 109 | 67.3% |
| Renter-Occupied Housing Units | 53 | 32.7% |
| Total Occupied Housing Units | 162 | 100.0% |
Occupancy by Household Size in Hemingway
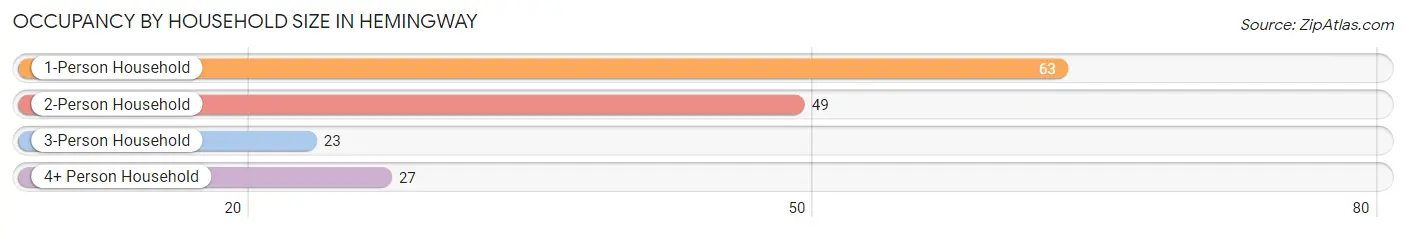
| Household Size | # Housing Units | % Housing Units |
| 1-Person Household | 63 | 38.9% |
| 2-Person Household | 49 | 30.2% |
| 3-Person Household | 23 | 14.2% |
| 4+ Person Household | 27 | 16.7% |
| Total Housing Units | 162 | 100.0% |
Occupancy by Ownership by Household Size in Hemingway
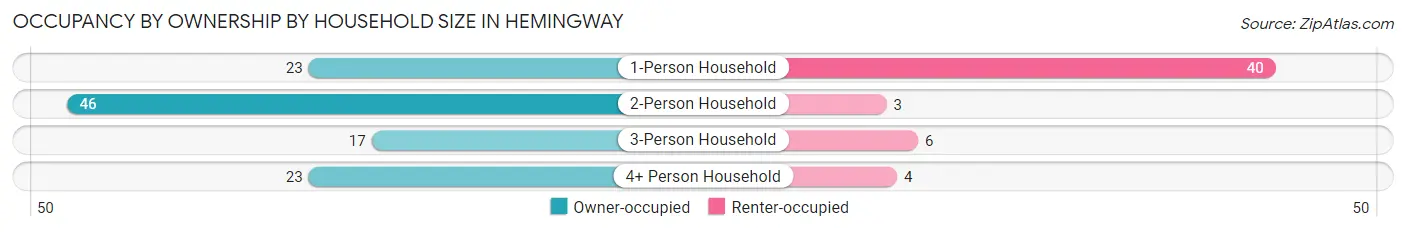
| Household Size | Owner-occupied | Renter-occupied |
| 1-Person Household | 23 (36.5%) | 40 (63.5%) |
| 2-Person Household | 46 (93.9%) | 3 (6.1%) |
| 3-Person Household | 17 (73.9%) | 6 (26.1%) |
| 4+ Person Household | 23 (85.2%) | 4 (14.8%) |
| Total Housing Units | 109 (67.3%) | 53 (32.7%) |
Occupancy by Educational Attainment in Hemingway
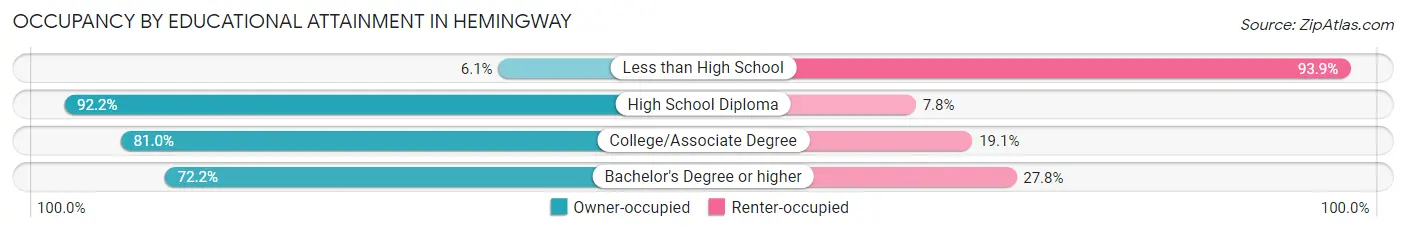
| Household Size | Owner-occupied | Renter-occupied |
| Less than High School | 2 (6.1%) | 31 (93.9%) |
| High School Diploma | 47 (92.2%) | 4 (7.8%) |
| College/Associate Degree | 34 (80.9%) | 8 (19.1%) |
| Bachelor's Degree or higher | 26 (72.2%) | 10 (27.8%) |
Occupancy by Age of Householder in Hemingway
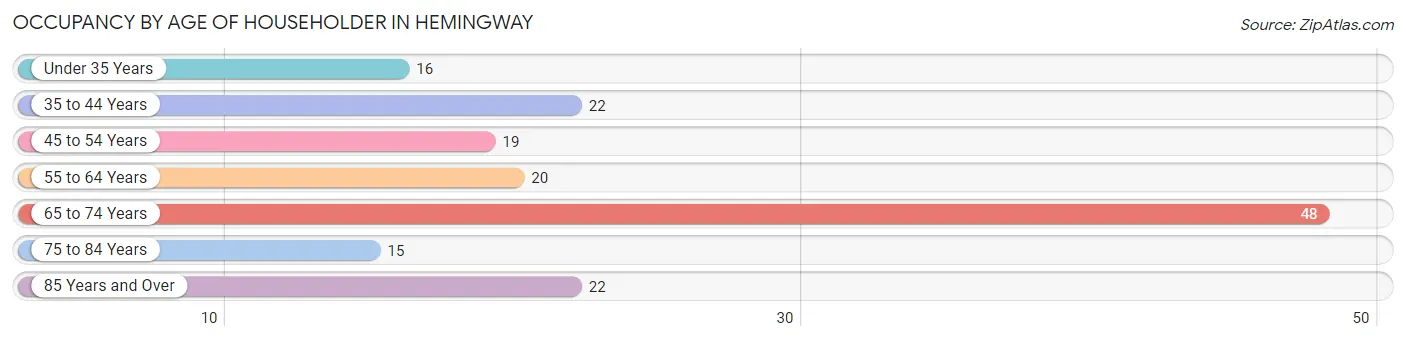
| Age Bracket | # Households | % Households |
| Under 35 Years | 16 | 9.9% |
| 35 to 44 Years | 22 | 13.6% |
| 45 to 54 Years | 19 | 11.7% |
| 55 to 64 Years | 20 | 12.3% |
| 65 to 74 Years | 48 | 29.6% |
| 75 to 84 Years | 15 | 9.3% |
| 85 Years and Over | 22 | 13.6% |
| Total | 162 | 100.0% |
Housing Finances in Hemingway
Median Income by Occupancy in Hemingway
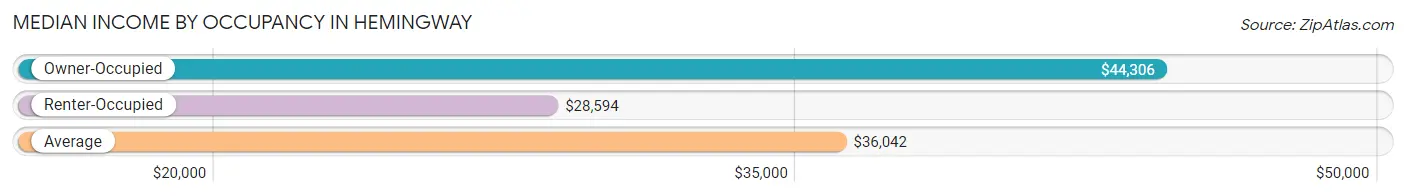
| Occupancy Type | # Households | Median Income |
| Owner-Occupied | 109 (67.3%) | $44,306 |
| Renter-Occupied | 53 (32.7%) | $28,594 |
| Average | 162 (100.0%) | $36,042 |
Occupancy by Householder Income Bracket in Hemingway
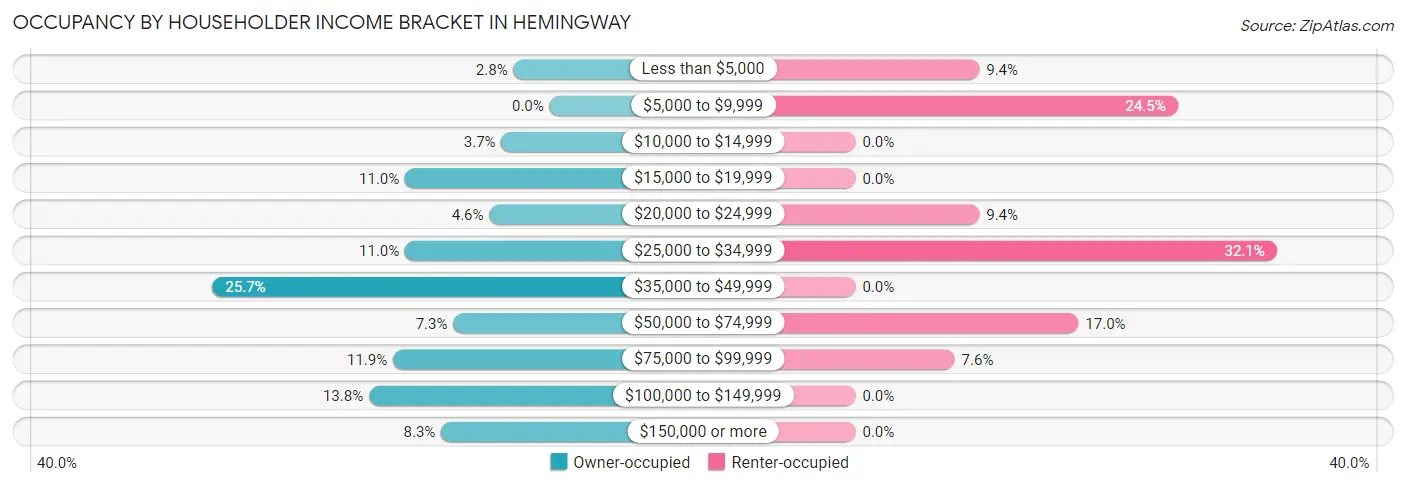
| Income Bracket | Owner-occupied | Renter-occupied |
| Less than $5,000 | 3 (2.8%) | 5 (9.4%) |
| $5,000 to $9,999 | 0 (0.0%) | 13 (24.5%) |
| $10,000 to $14,999 | 4 (3.7%) | 0 (0.0%) |
| $15,000 to $19,999 | 12 (11.0%) | 0 (0.0%) |
| $20,000 to $24,999 | 5 (4.6%) | 5 (9.4%) |
| $25,000 to $34,999 | 12 (11.0%) | 17 (32.1%) |
| $35,000 to $49,999 | 28 (25.7%) | 0 (0.0%) |
| $50,000 to $74,999 | 8 (7.3%) | 9 (17.0%) |
| $75,000 to $99,999 | 13 (11.9%) | 4 (7.5%) |
| $100,000 to $149,999 | 15 (13.8%) | 0 (0.0%) |
| $150,000 or more | 9 (8.3%) | 0 (0.0%) |
| Total | 109 (100.0%) | 53 (100.0%) |
Monthly Housing Cost Tiers in Hemingway
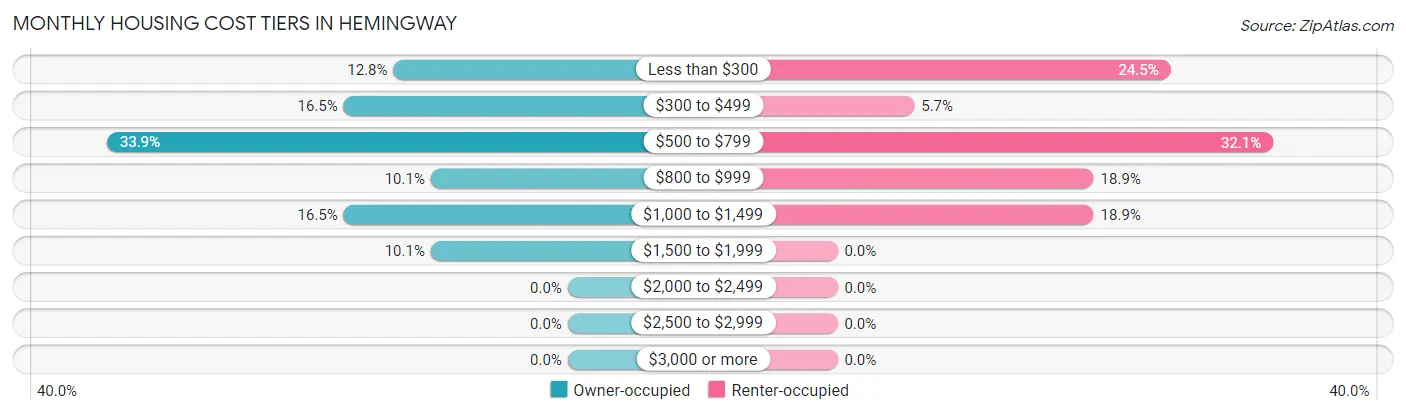
| Monthly Cost | Owner-occupied | Renter-occupied |
| Less than $300 | 14 (12.8%) | 13 (24.5%) |
| $300 to $499 | 18 (16.5%) | 3 (5.7%) |
| $500 to $799 | 37 (33.9%) | 17 (32.1%) |
| $800 to $999 | 11 (10.1%) | 10 (18.9%) |
| $1,000 to $1,499 | 18 (16.5%) | 10 (18.9%) |
| $1,500 to $1,999 | 11 (10.1%) | 0 (0.0%) |
| $2,000 to $2,499 | 0 (0.0%) | 0 (0.0%) |
| $2,500 to $2,999 | 0 (0.0%) | 0 (0.0%) |
| $3,000 or more | 0 (0.0%) | 0 (0.0%) |
| Total | 109 (100.0%) | 53 (100.0%) |
Physical Housing Characteristics in Hemingway
Housing Structures in Hemingway
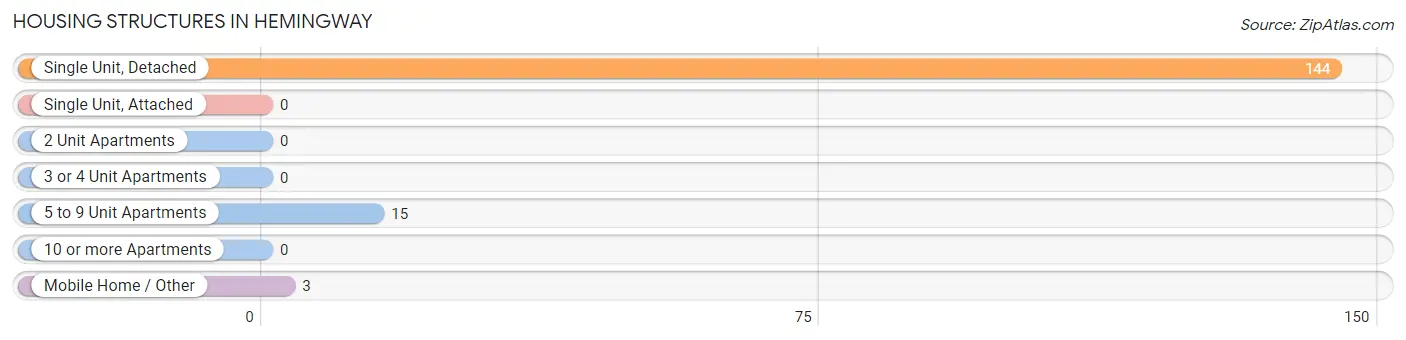
| Structure Type | # Housing Units | % Housing Units |
| Single Unit, Detached | 144 | 88.9% |
| Single Unit, Attached | 0 | 0.0% |
| 2 Unit Apartments | 0 | 0.0% |
| 3 or 4 Unit Apartments | 0 | 0.0% |
| 5 to 9 Unit Apartments | 15 | 9.3% |
| 10 or more Apartments | 0 | 0.0% |
| Mobile Home / Other | 3 | 1.8% |
| Total | 162 | 100.0% |
Housing Structures by Occupancy in Hemingway
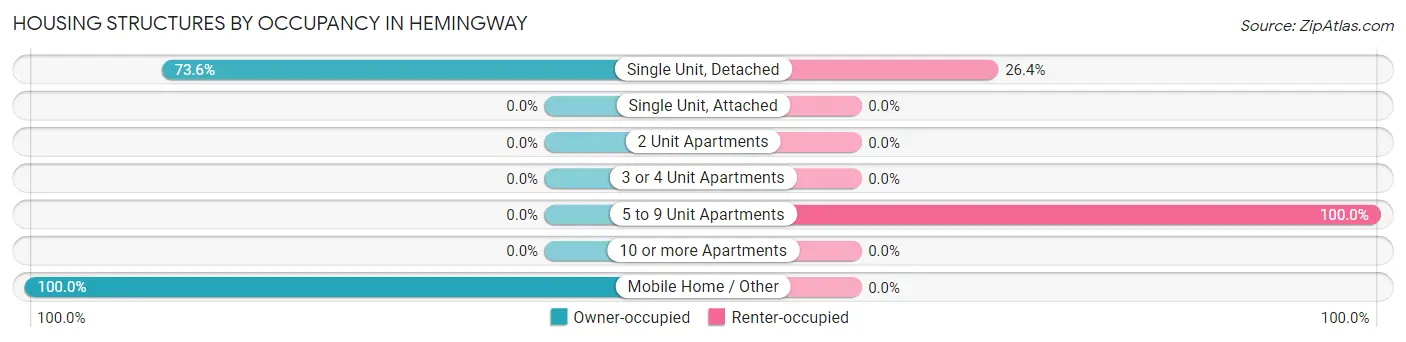
| Structure Type | Owner-occupied | Renter-occupied |
| Single Unit, Detached | 106 (73.6%) | 38 (26.4%) |
| Single Unit, Attached | 0 (0.0%) | 0 (0.0%) |
| 2 Unit Apartments | 0 (0.0%) | 0 (0.0%) |
| 3 or 4 Unit Apartments | 0 (0.0%) | 0 (0.0%) |
| 5 to 9 Unit Apartments | 0 (0.0%) | 15 (100.0%) |
| 10 or more Apartments | 0 (0.0%) | 0 (0.0%) |
| Mobile Home / Other | 3 (100.0%) | 0 (0.0%) |
| Total | 109 (67.3%) | 53 (32.7%) |
Housing Structures by Number of Rooms in Hemingway
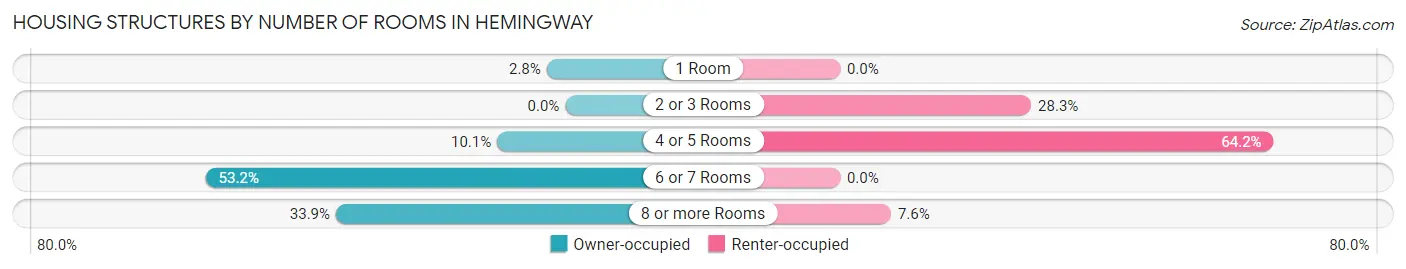
| Number of Rooms | Owner-occupied | Renter-occupied |
| 1 Room | 3 (2.8%) | 0 (0.0%) |
| 2 or 3 Rooms | 0 (0.0%) | 15 (28.3%) |
| 4 or 5 Rooms | 11 (10.1%) | 34 (64.1%) |
| 6 or 7 Rooms | 58 (53.2%) | 0 (0.0%) |
| 8 or more Rooms | 37 (33.9%) | 4 (7.5%) |
| Total | 109 (100.0%) | 53 (100.0%) |
Housing Structure by Heating Type in Hemingway
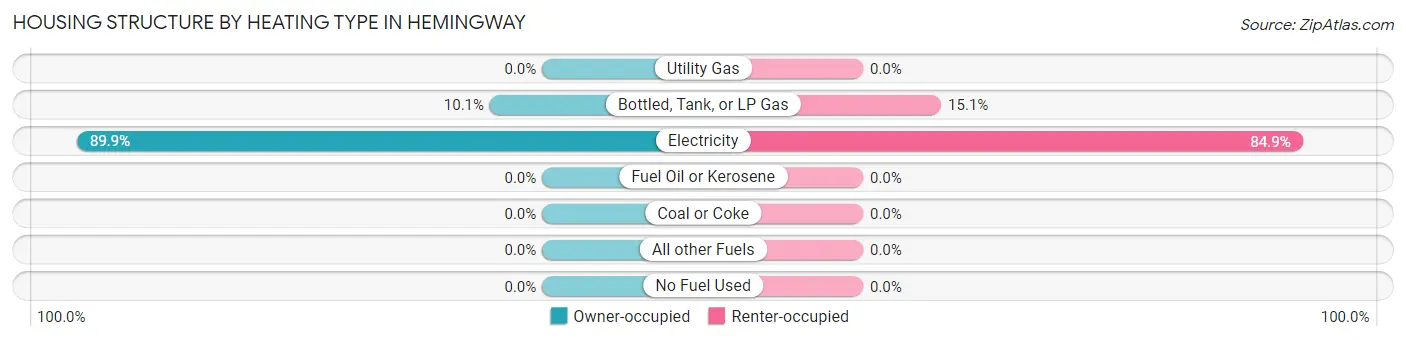
| Heating Type | Owner-occupied | Renter-occupied |
| Utility Gas | 0 (0.0%) | 0 (0.0%) |
| Bottled, Tank, or LP Gas | 11 (10.1%) | 8 (15.1%) |
| Electricity | 98 (89.9%) | 45 (84.9%) |
| Fuel Oil or Kerosene | 0 (0.0%) | 0 (0.0%) |
| Coal or Coke | 0 (0.0%) | 0 (0.0%) |
| All other Fuels | 0 (0.0%) | 0 (0.0%) |
| No Fuel Used | 0 (0.0%) | 0 (0.0%) |
| Total | 109 (100.0%) | 53 (100.0%) |
Household Vehicle Usage in Hemingway
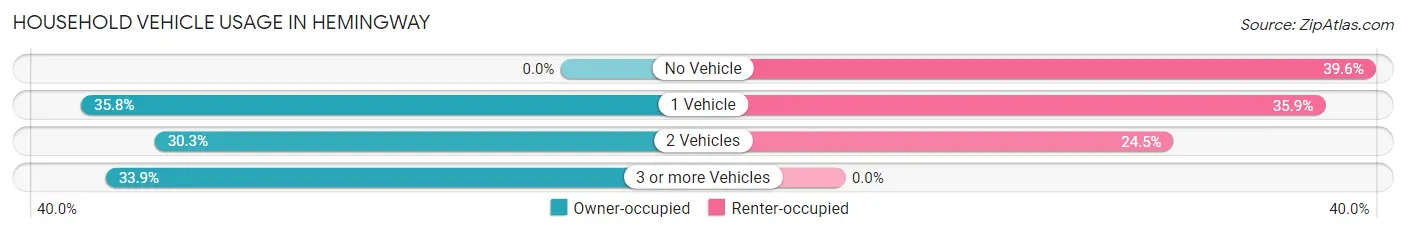
| Vehicles per Household | Owner-occupied | Renter-occupied |
| No Vehicle | 0 (0.0%) | 21 (39.6%) |
| 1 Vehicle | 39 (35.8%) | 19 (35.8%) |
| 2 Vehicles | 33 (30.3%) | 13 (24.5%) |
| 3 or more Vehicles | 37 (33.9%) | 0 (0.0%) |
| Total | 109 (100.0%) | 53 (100.0%) |
Real Estate & Mortgages in Hemingway
Real Estate and Mortgage Overview in Hemingway
| Characteristic | Without Mortgage | With Mortgage |
| Housing Units | 63 | 46 |
| Median Property Value | $128,100 | $152,800 |
| Median Household Income | $42,639 | $7 |
| Monthly Housing Costs | $496 | $0 |
| Real Estate Taxes | $979 | $3 |
Property Value by Mortgage Status in Hemingway
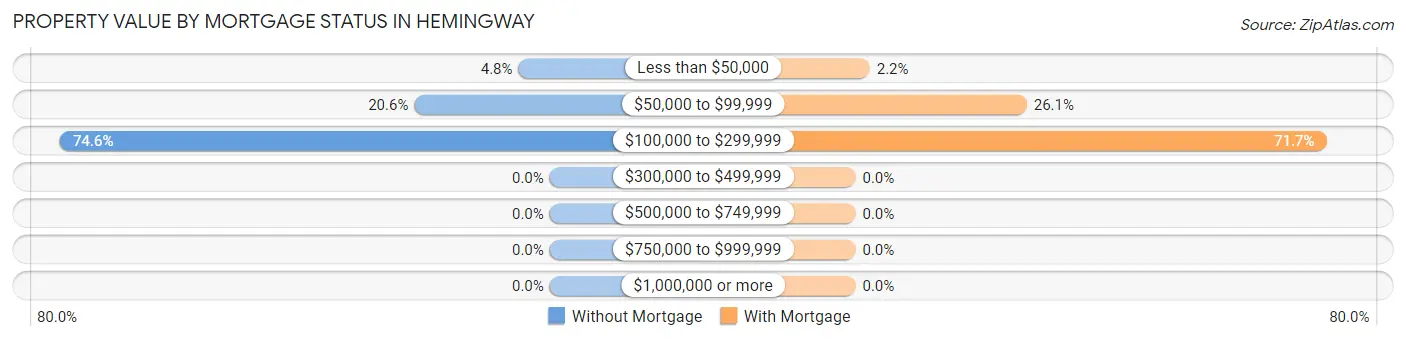
| Property Value | Without Mortgage | With Mortgage |
| Less than $50,000 | 3 (4.8%) | 1 (2.2%) |
| $50,000 to $99,999 | 13 (20.6%) | 12 (26.1%) |
| $100,000 to $299,999 | 47 (74.6%) | 33 (71.7%) |
| $300,000 to $499,999 | 0 (0.0%) | 0 (0.0%) |
| $500,000 to $749,999 | 0 (0.0%) | 0 (0.0%) |
| $750,000 to $999,999 | 0 (0.0%) | 0 (0.0%) |
| $1,000,000 or more | 0 (0.0%) | 0 (0.0%) |
| Total | 63 (100.0%) | 46 (100.0%) |
Household Income by Mortgage Status in Hemingway
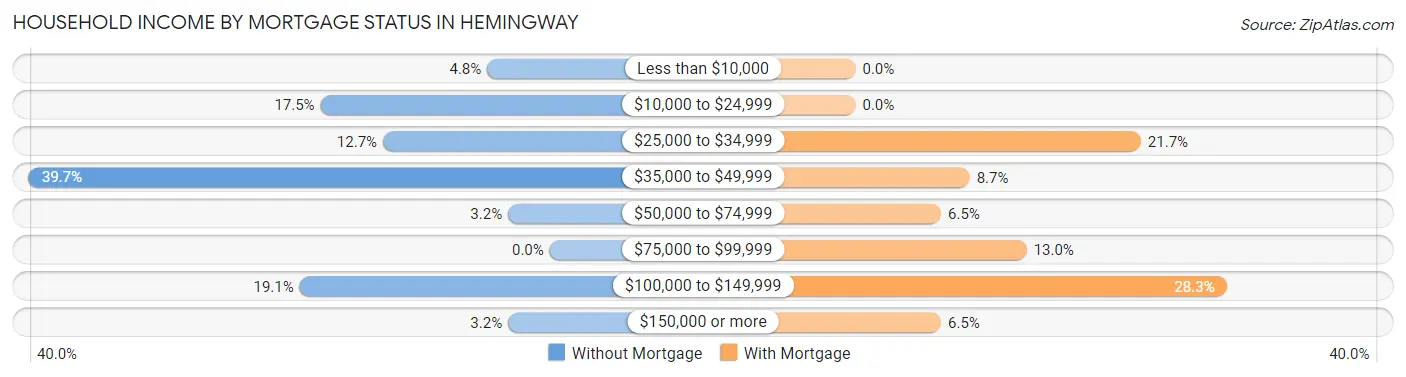
| Household Income | Without Mortgage | With Mortgage |
| Less than $10,000 | 3 (4.8%) | 0 (0.0%) |
| $10,000 to $24,999 | 11 (17.5%) | 0 (0.0%) |
| $25,000 to $34,999 | 8 (12.7%) | 10 (21.7%) |
| $35,000 to $49,999 | 25 (39.7%) | 4 (8.7%) |
| $50,000 to $74,999 | 2 (3.2%) | 3 (6.5%) |
| $75,000 to $99,999 | 0 (0.0%) | 6 (13.0%) |
| $100,000 to $149,999 | 12 (19.1%) | 13 (28.3%) |
| $150,000 or more | 2 (3.2%) | 3 (6.5%) |
| Total | 63 (100.0%) | 46 (100.0%) |
Property Value to Household Income Ratio in Hemingway
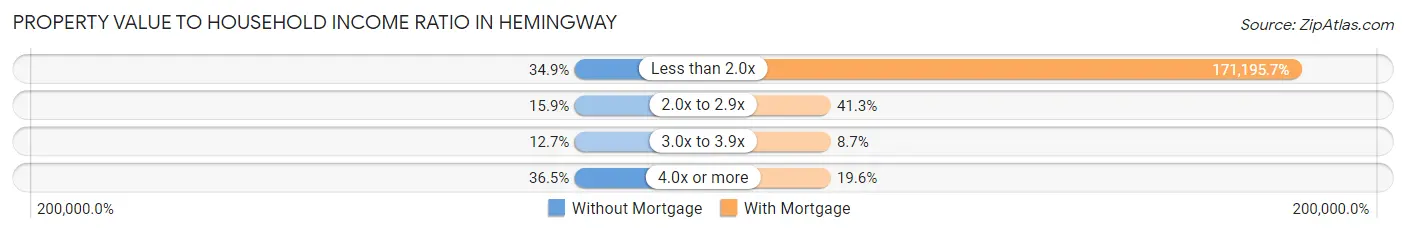
| Value-to-Income Ratio | Without Mortgage | With Mortgage |
| Less than 2.0x | 22 (34.9%) | 78,750 (171,195.7%) |
| 2.0x to 2.9x | 10 (15.9%) | 19 (41.3%) |
| 3.0x to 3.9x | 8 (12.7%) | 4 (8.7%) |
| 4.0x or more | 23 (36.5%) | 9 (19.6%) |
| Total | 63 (100.0%) | 46 (100.0%) |
Real Estate Taxes by Mortgage Status in Hemingway
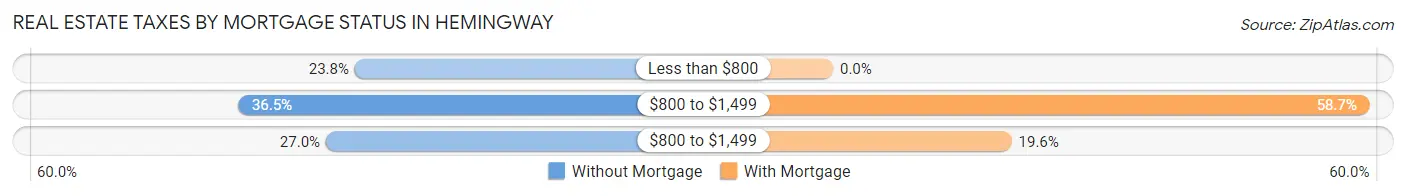
| Property Taxes | Without Mortgage | With Mortgage |
| Less than $800 | 15 (23.8%) | 0 (0.0%) |
| $800 to $1,499 | 23 (36.5%) | 27 (58.7%) |
| $800 to $1,499 | 17 (27.0%) | 9 (19.6%) |
| Total | 63 (100.0%) | 46 (100.0%) |
Health & Disability in Hemingway
Health Insurance Coverage by Age in Hemingway
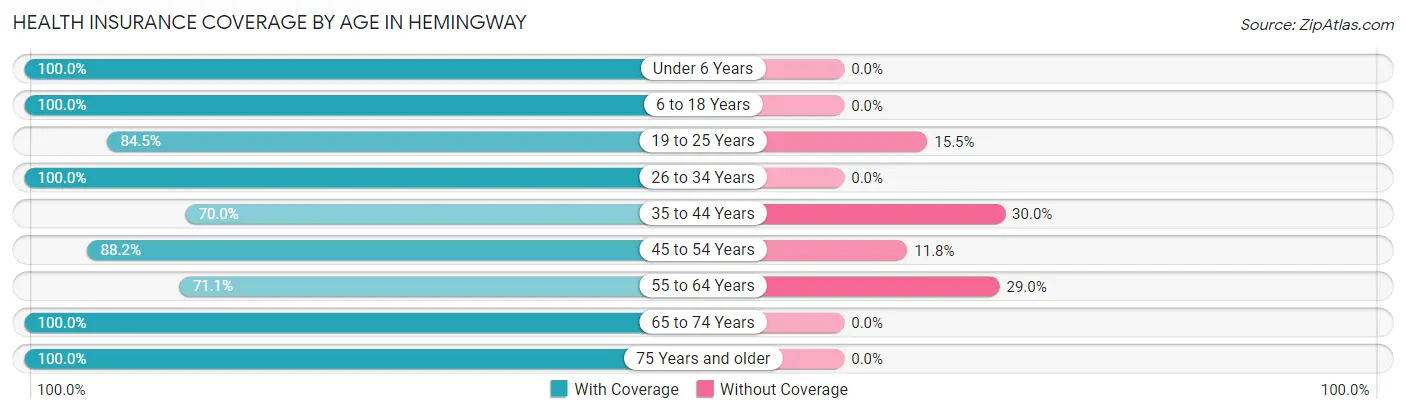
| Age Bracket | With Coverage | Without Coverage |
| Under 6 Years | 27 (100.0%) | 0 (0.0%) |
| 6 to 18 Years | 62 (100.0%) | 0 (0.0%) |
| 19 to 25 Years | 60 (84.5%) | 11 (15.5%) |
| 26 to 34 Years | 12 (100.0%) | 0 (0.0%) |
| 35 to 44 Years | 35 (70.0%) | 15 (30.0%) |
| 45 to 54 Years | 45 (88.2%) | 6 (11.8%) |
| 55 to 64 Years | 27 (71.1%) | 11 (28.9%) |
| 65 to 74 Years | 65 (100.0%) | 0 (0.0%) |
| 75 Years and older | 40 (100.0%) | 0 (0.0%) |
| Total | 373 (89.7%) | 43 (10.3%) |
Health Insurance Coverage by Citizenship Status in Hemingway
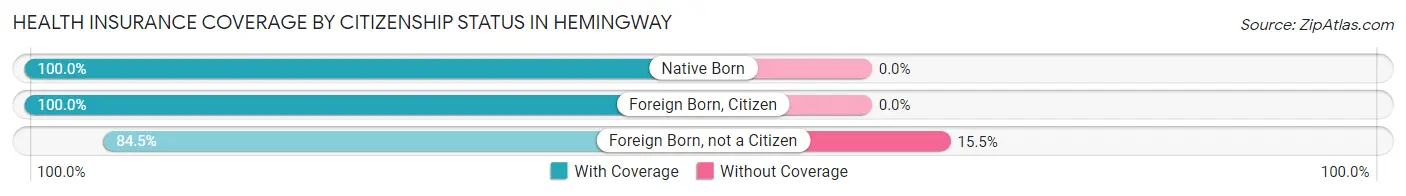
| Citizenship Status | With Coverage | Without Coverage |
| Native Born | 27 (100.0%) | 0 (0.0%) |
| Foreign Born, Citizen | 62 (100.0%) | 0 (0.0%) |
| Foreign Born, not a Citizen | 60 (84.5%) | 11 (15.5%) |
Health Insurance Coverage by Household Income in Hemingway
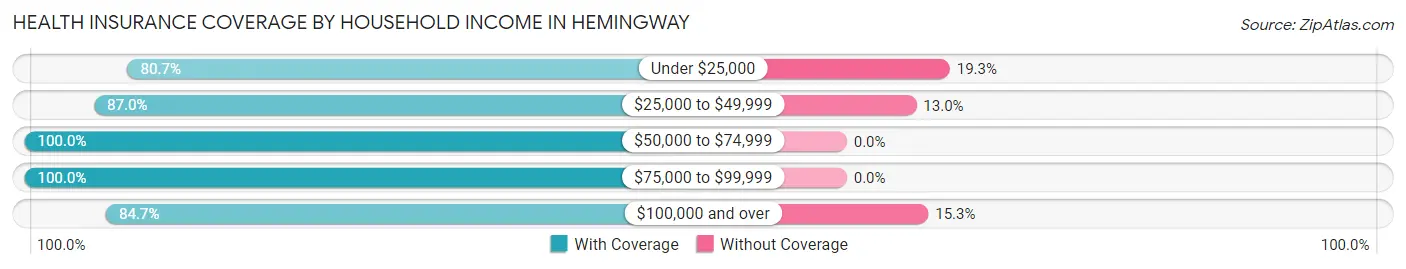
| Household Income | With Coverage | Without Coverage |
| Under $25,000 | 46 (80.7%) | 11 (19.3%) |
| $25,000 to $49,999 | 80 (87.0%) | 12 (13.0%) |
| $50,000 to $74,999 | 47 (100.0%) | 0 (0.0%) |
| $75,000 to $99,999 | 89 (100.0%) | 0 (0.0%) |
| $100,000 and over | 111 (84.7%) | 20 (15.3%) |
Public vs Private Health Insurance Coverage by Age in Hemingway
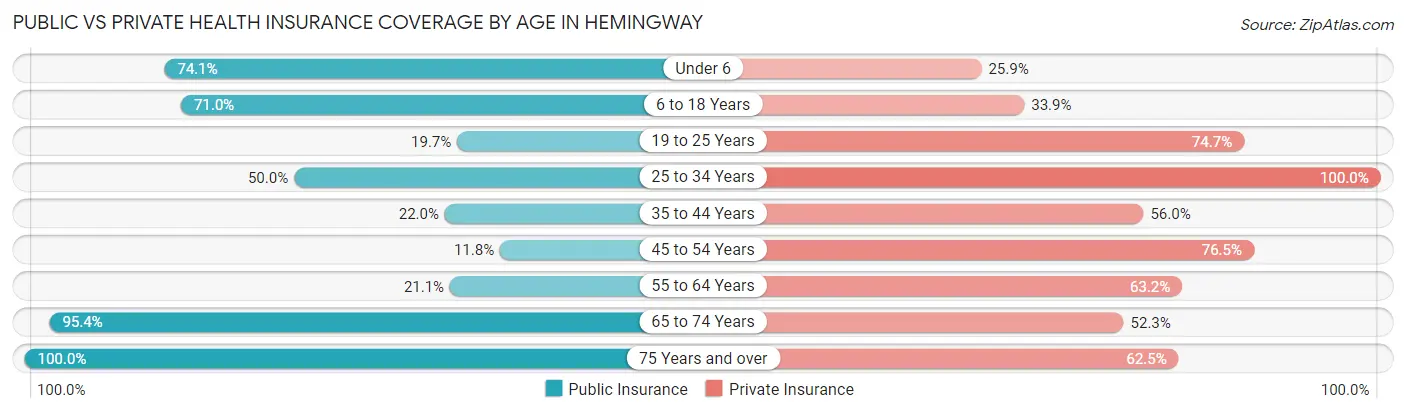
| Age Bracket | Public Insurance | Private Insurance |
| Under 6 | 20 (74.1%) | 7 (25.9%) |
| 6 to 18 Years | 44 (71.0%) | 21 (33.9%) |
| 19 to 25 Years | 14 (19.7%) | 53 (74.7%) |
| 25 to 34 Years | 6 (50.0%) | 12 (100.0%) |
| 35 to 44 Years | 11 (22.0%) | 28 (56.0%) |
| 45 to 54 Years | 6 (11.8%) | 39 (76.5%) |
| 55 to 64 Years | 8 (21.0%) | 24 (63.2%) |
| 65 to 74 Years | 62 (95.4%) | 34 (52.3%) |
| 75 Years and over | 40 (100.0%) | 25 (62.5%) |
| Total | 211 (50.7%) | 243 (58.4%) |
Disability Status by Sex by Age in Hemingway
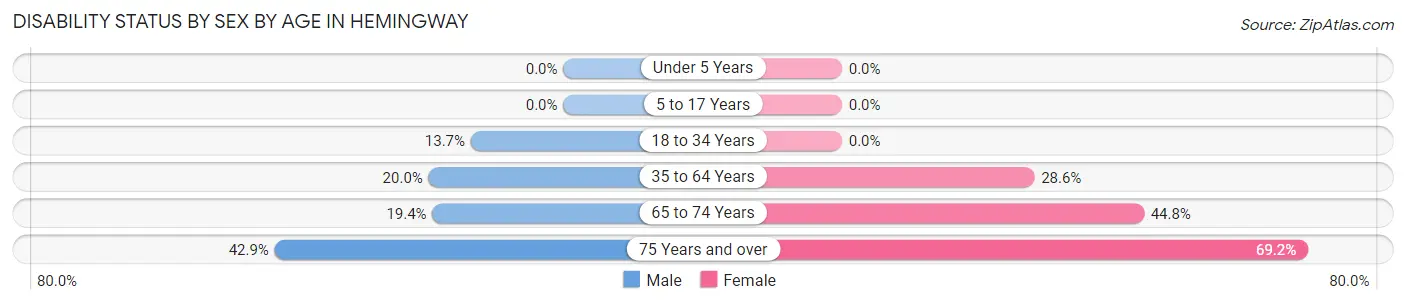
| Age Bracket | Male | Female |
| Under 5 Years | 0 (0.0%) | 0 (0.0%) |
| 5 to 17 Years | 0 (0.0%) | 0 (0.0%) |
| 18 to 34 Years | 7 (13.7%) | 0 (0.0%) |
| 35 to 64 Years | 11 (20.0%) | 24 (28.6%) |
| 65 to 74 Years | 7 (19.4%) | 13 (44.8%) |
| 75 Years and over | 6 (42.9%) | 18 (69.2%) |
Disability Class by Sex by Age in Hemingway
Disability Class: Hearing Difficulty
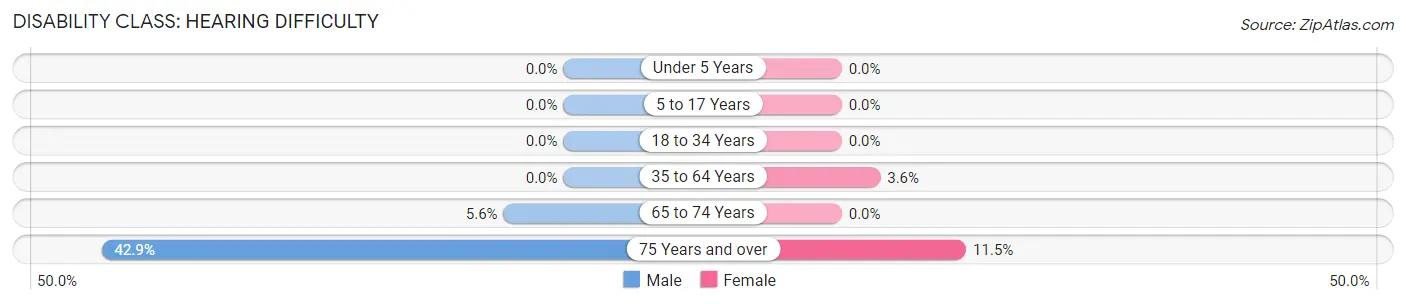
| Age Bracket | Male | Female |
| Under 5 Years | 0 (0.0%) | 0 (0.0%) |
| 5 to 17 Years | 0 (0.0%) | 0 (0.0%) |
| 18 to 34 Years | 0 (0.0%) | 0 (0.0%) |
| 35 to 64 Years | 0 (0.0%) | 3 (3.6%) |
| 65 to 74 Years | 2 (5.6%) | 0 (0.0%) |
| 75 Years and over | 6 (42.9%) | 3 (11.5%) |
Disability Class: Vision Difficulty
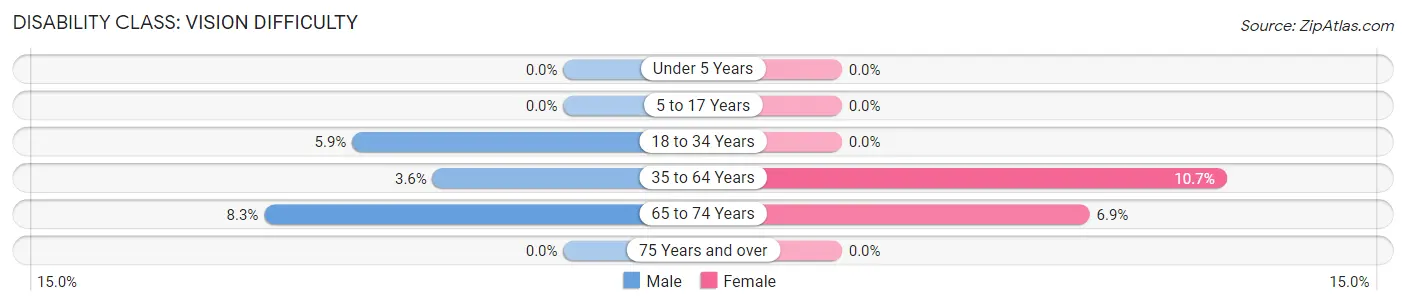
| Age Bracket | Male | Female |
| Under 5 Years | 0 (0.0%) | 0 (0.0%) |
| 5 to 17 Years | 0 (0.0%) | 0 (0.0%) |
| 18 to 34 Years | 3 (5.9%) | 0 (0.0%) |
| 35 to 64 Years | 2 (3.6%) | 9 (10.7%) |
| 65 to 74 Years | 3 (8.3%) | 2 (6.9%) |
| 75 Years and over | 0 (0.0%) | 0 (0.0%) |
Disability Class: Cognitive Difficulty
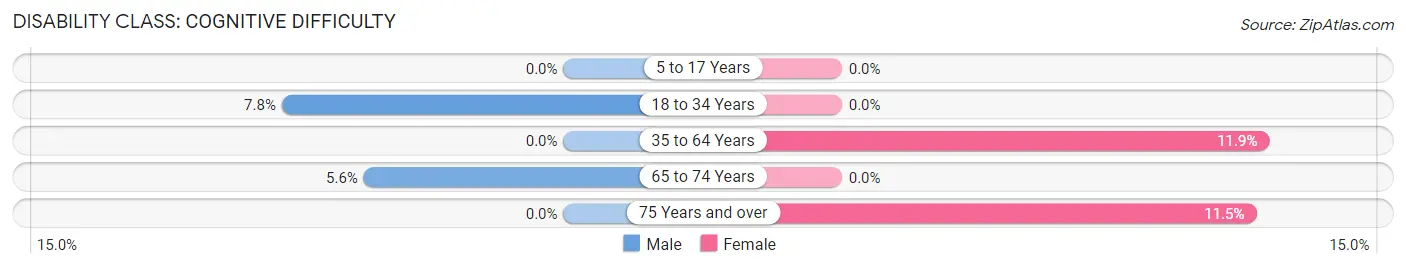
| Age Bracket | Male | Female |
| 5 to 17 Years | 0 (0.0%) | 0 (0.0%) |
| 18 to 34 Years | 4 (7.8%) | 0 (0.0%) |
| 35 to 64 Years | 0 (0.0%) | 10 (11.9%) |
| 65 to 74 Years | 2 (5.6%) | 0 (0.0%) |
| 75 Years and over | 0 (0.0%) | 3 (11.5%) |
Disability Class: Ambulatory Difficulty
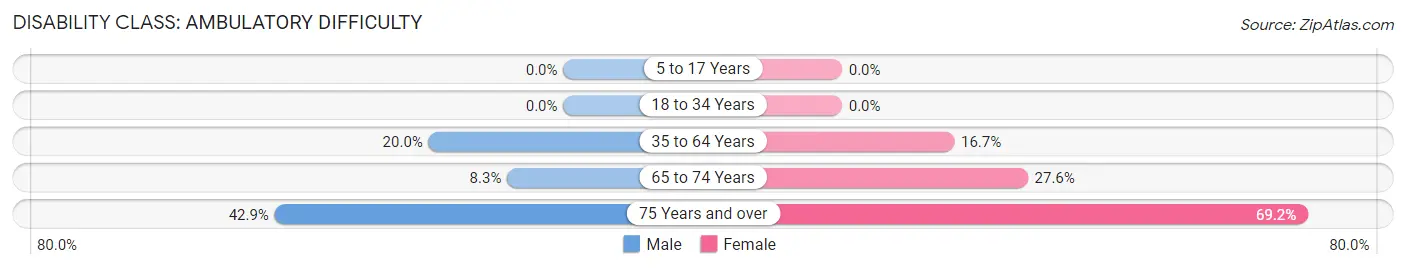
| Age Bracket | Male | Female |
| 5 to 17 Years | 0 (0.0%) | 0 (0.0%) |
| 18 to 34 Years | 0 (0.0%) | 0 (0.0%) |
| 35 to 64 Years | 11 (20.0%) | 14 (16.7%) |
| 65 to 74 Years | 3 (8.3%) | 8 (27.6%) |
| 75 Years and over | 6 (42.9%) | 18 (69.2%) |
Disability Class: Self-Care Difficulty
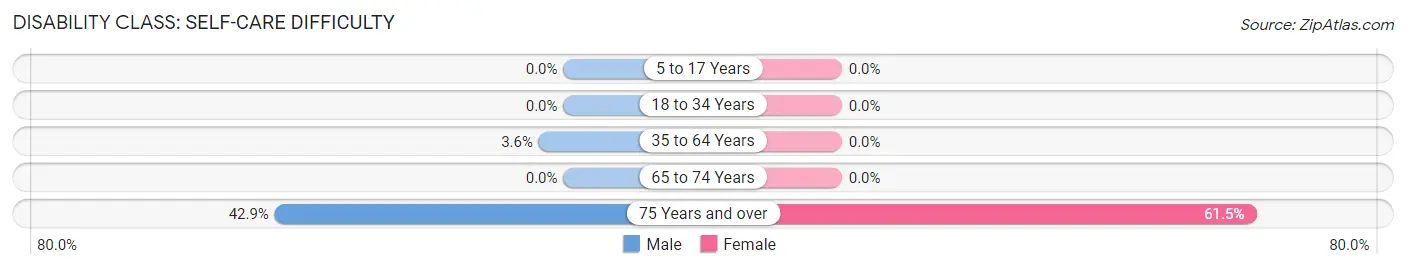
| Age Bracket | Male | Female |
| 5 to 17 Years | 0 (0.0%) | 0 (0.0%) |
| 18 to 34 Years | 0 (0.0%) | 0 (0.0%) |
| 35 to 64 Years | 2 (3.6%) | 0 (0.0%) |
| 65 to 74 Years | 0 (0.0%) | 0 (0.0%) |
| 75 Years and over | 6 (42.9%) | 16 (61.5%) |
Technology Access in Hemingway
Computing Device Access in Hemingway
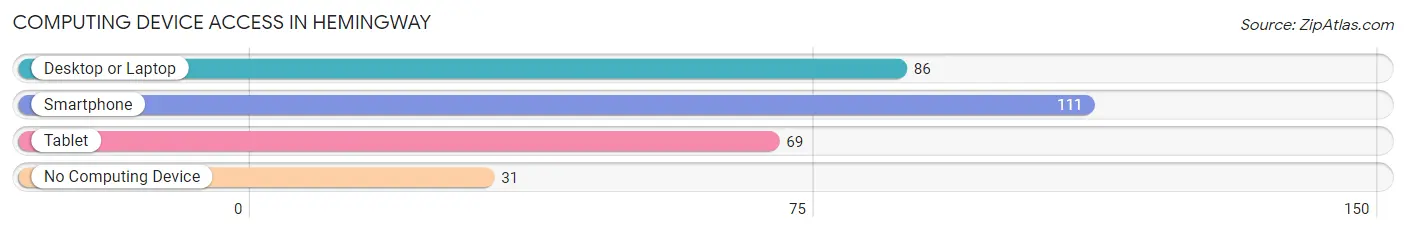
| Device Type | # Households | % Households |
| Desktop or Laptop | 86 | 53.1% |
| Smartphone | 111 | 68.5% |
| Tablet | 69 | 42.6% |
| No Computing Device | 31 | 19.1% |
| Total | 162 | 100.0% |
Internet Access in Hemingway
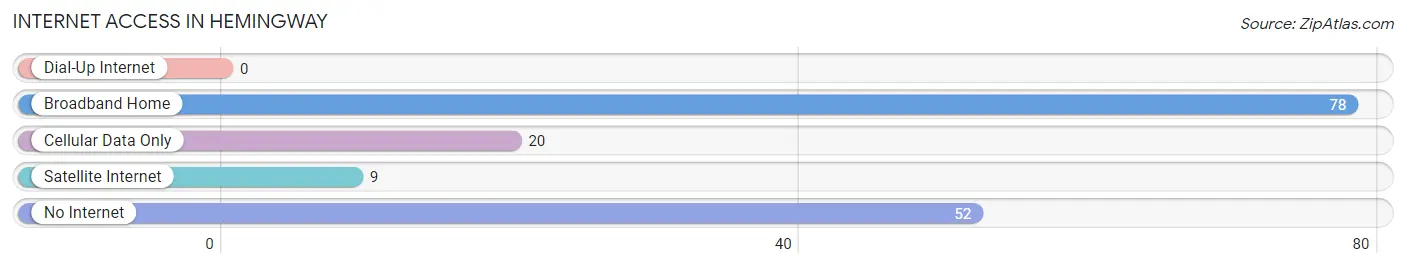
| Internet Type | # Households | % Households |
| Dial-Up Internet | 0 | 0.0% |
| Broadband Home | 78 | 48.1% |
| Cellular Data Only | 20 | 12.3% |
| Satellite Internet | 9 | 5.6% |
| No Internet | 52 | 32.1% |
| Total | 162 | 100.0% |
Hemingway Summary
Hemingway is a small town located in the northeastern corner of South Carolina, in the United States. It is situated in the Pee Dee region of the state, and is part of the Florence Metropolitan Statistical Area. The town has a population of approximately 1,500 people, and is known for its rural charm and friendly atmosphere.
History
Hemingway was founded in 1883 by a group of settlers from the nearby town of Florence. The town was named after the famous American author Ernest Hemingway, who was born in nearby Oak Grove. The town was originally a farming community, and the main crops grown were cotton, corn, and tobacco. The town also had a sawmill and a gristmill, which provided employment for many of the town's residents.
In the early 1900s, the town began to grow and develop. The first school was built in 1910, and the first bank opened in 1912. The town also had a post office, a general store, and a few other businesses. In the 1920s, the town began to attract more visitors, and the population began to grow.
Geography
Hemingway is located in the northeastern corner of South Carolina, in the Pee Dee region of the state. The town is situated on the banks of the Great Pee Dee River, and is surrounded by the Francis Marion National Forest. The town is located about 25 miles from the city of Florence, and about 50 miles from the city of Myrtle Beach.
The town has a total area of 1.2 square miles, all of which is land. The town is located at an elevation of approximately 100 feet above sea level. The climate in Hemingway is humid subtropical, with hot, humid summers and mild winters.
Economy
The economy of Hemingway is largely based on agriculture. The town is home to several farms, which produce a variety of crops, including cotton, corn, soybeans, and tobacco. The town also has a few small businesses, including a general store, a post office, and a few restaurants.
Demographics
As of the 2010 census, the population of Hemingway was 1,521. The racial makeup of the town was 79.3% White, 17.2% African American, 0.3% Native American, 0.3% Asian, 0.1% Pacific Islander, 1.2% from other races, and 1.7% from two or more races. Hispanic or Latino of any race were 2.2% of the population.
The median household income in Hemingway was $30,938, and the median family income was $37,500. The per capita income for the town was $15,945. About 17.2% of the population was below the poverty line.
Conclusion
Hemingway is a small town located in the northeastern corner of South Carolina. The town has a population of approximately 1,500 people, and is known for its rural charm and friendly atmosphere. The economy of Hemingway is largely based on agriculture, and the town is home to several farms. The racial makeup of the town is mostly White, with a small percentage of African Americans, Native Americans, Asians, and Pacific Islanders. The median household income in Hemingway is $30,938, and the per capita income is $15,945.
Common Questions
What is Per Capita Income in Hemingway?
Per Capita income in Hemingway is $26,541.
What is the Median Family Income in Hemingway?
Median Family Income in Hemingway is $66,875.
What is the Median Household income in Hemingway?
Median Household Income in Hemingway is $36,042.
What is Income or Wage Gap in Hemingway?
Income or Wage Gap in Hemingway is 29.0%.
Women in Hemingway earn 71.0 cents for every dollar earned by a man.
What is Inequality or Gini Index in Hemingway?
Inequality or Gini Index in Hemingway is 0.45.
What is the Total Population of Hemingway?
Total Population of Hemingway is 421.
What is the Total Male Population of Hemingway?
Total Male Population of Hemingway is 196.
What is the Total Female Population of Hemingway?
Total Female Population of Hemingway is 225.
What is the Ratio of Males per 100 Females in Hemingway?
There are 87.11 Males per 100 Females in Hemingway.
What is the Ratio of Females per 100 Males in Hemingway?
There are 114.80 Females per 100 Males in Hemingway.
What is the Median Population Age in Hemingway?
Median Population Age in Hemingway is 43.6 Years.
What is the Average Family Size in Hemingway
Average Family Size in Hemingway is 3.4 People.
What is the Average Household Size in Hemingway
Average Household Size in Hemingway is 2.6 People.
How Large is the Labor Force in Hemingway?
There are 165 People in the Labor Forcein in Hemingway.
What is the Percentage of People in the Labor Force in Hemingway?
45.0% of People are in the Labor Force in Hemingway.
What is the Unemployment Rate in Hemingway?
Unemployment Rate in Hemingway is 3.8%.