Folly Beach, SC Map & Demographics
Folly Beach Map
Folly Beach Overview
$61,847
PER CAPITA INCOME
$102,198
AVG FAMILY INCOME
$88,424
AVG HOUSEHOLD INCOME
50.7%
WAGE / INCOME GAP [ % ]
49.3¢/ $1
WAGE / INCOME GAP [ $ ]
0.46
INEQUALITY / GINI INDEX
1,020
TOTAL POPULATION
530
MALE POPULATION
490
FEMALE POPULATION
108.16
MALES / 100 FEMALES
92.45
FEMALES / 100 MALES
63.6
MEDIAN AGE
2.3
AVG FAMILY SIZE
1.6
AVG HOUSEHOLD SIZE
490
LABOR FORCE [ PEOPLE ]
49.6%
PERCENT IN LABOR FORCE
Folly Beach Zip Codes
Folly Beach Area Codes
Income in Folly Beach
Income Overview in Folly Beach
Per Capita Income in Folly Beach is $61,847, while median incomes of families and households are $102,198 and $88,424 respectively.
| Characteristic | Number | Measure |
| Per Capita Income | 1,020 | $61,847 |
| Median Family Income | 267 | $102,198 |
| Mean Family Income | 267 | $122,480 |
| Median Household Income | 641 | $88,424 |
| Mean Household Income | 641 | $95,827 |
| Income Deficit | 267 | $0 |
| Wage / Income Gap (%) | 1,020 | 50.65% |
| Wage / Income Gap ($) | 1,020 | 49.35¢ per $1 |
| Gini / Inequality Index | 1,020 | 0.46 |
Earnings by Sex in Folly Beach
Average Earnings in Folly Beach are $71,875, $101,603 for men and $50,139 for women, a difference of 50.6%.
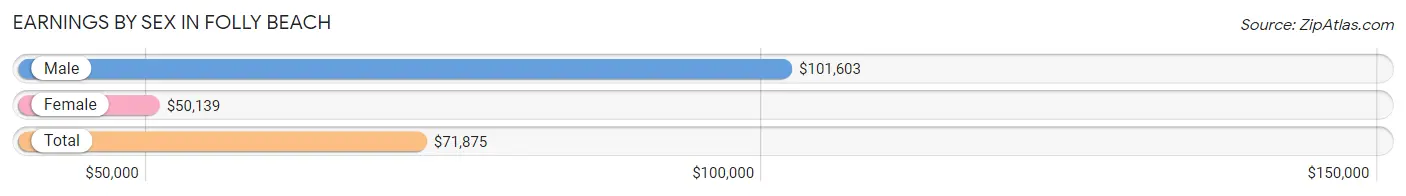
| Sex | Number | Average Earnings |
| Male | 306 (60.6%) | $101,603 |
| Female | 199 (39.4%) | $50,139 |
| Total | 505 (100.0%) | $71,875 |
Earnings by Sex by Income Bracket in Folly Beach
The most common earnings brackets in Folly Beach are $100,000+ for men (178 | 58.2%) and $45,000 to $49,999 for women (44 | 22.1%).
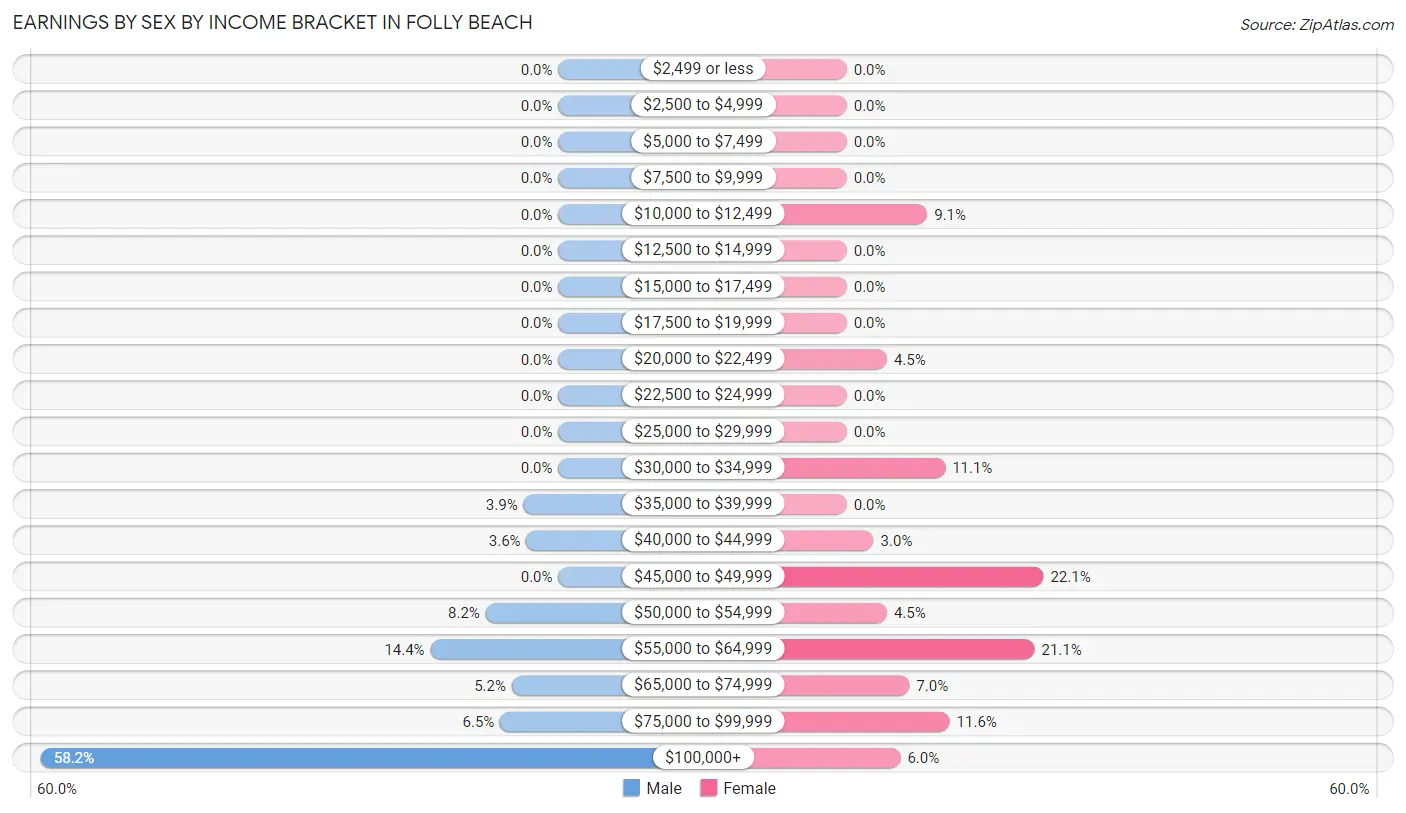
| Income | Male | Female |
| $2,499 or less | 0 (0.0%) | 0 (0.0%) |
| $2,500 to $4,999 | 0 (0.0%) | 0 (0.0%) |
| $5,000 to $7,499 | 0 (0.0%) | 0 (0.0%) |
| $7,500 to $9,999 | 0 (0.0%) | 0 (0.0%) |
| $10,000 to $12,499 | 0 (0.0%) | 18 (9.0%) |
| $12,500 to $14,999 | 0 (0.0%) | 0 (0.0%) |
| $15,000 to $17,499 | 0 (0.0%) | 0 (0.0%) |
| $17,500 to $19,999 | 0 (0.0%) | 0 (0.0%) |
| $20,000 to $22,499 | 0 (0.0%) | 9 (4.5%) |
| $22,500 to $24,999 | 0 (0.0%) | 0 (0.0%) |
| $25,000 to $29,999 | 0 (0.0%) | 0 (0.0%) |
| $30,000 to $34,999 | 0 (0.0%) | 22 (11.1%) |
| $35,000 to $39,999 | 12 (3.9%) | 0 (0.0%) |
| $40,000 to $44,999 | 11 (3.6%) | 6 (3.0%) |
| $45,000 to $49,999 | 0 (0.0%) | 44 (22.1%) |
| $50,000 to $54,999 | 25 (8.2%) | 9 (4.5%) |
| $55,000 to $64,999 | 44 (14.4%) | 42 (21.1%) |
| $65,000 to $74,999 | 16 (5.2%) | 14 (7.0%) |
| $75,000 to $99,999 | 20 (6.5%) | 23 (11.6%) |
| $100,000+ | 178 (58.2%) | 12 (6.0%) |
| Total | 306 (100.0%) | 199 (100.0%) |
Earnings by Sex by Educational Attainment in Folly Beach
Average earnings in Folly Beach are $101,603 for men and $50,139 for women, a difference of 50.6%. Men with an educational attainment of graduate degree enjoy the highest average annual earnings of $116,266, while those with high school diploma education earn the least with $56,940. Women with an educational attainment of college or associate's degree earn the most with the average annual earnings of $55,573, while those with college or associate's degree education have the smallest earnings of $55,573.
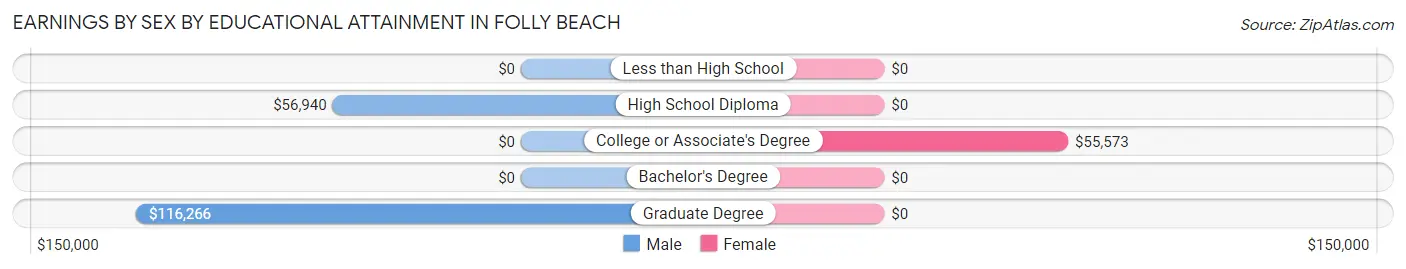
| Educational Attainment | Male Income | Female Income |
| Less than High School | - | - |
| High School Diploma | $56,940 | $0 |
| College or Associate's Degree | - | - |
| Bachelor's Degree | - | - |
| Graduate Degree | $116,266 | $0 |
| Total | $101,603 | $50,139 |
Family Income in Folly Beach
Family Income Brackets in Folly Beach
According to the Folly Beach family income data, there are 70 families falling into the $100,000 to $149,999 income range, which is the most common income bracket and makes up 26.2% of all families.
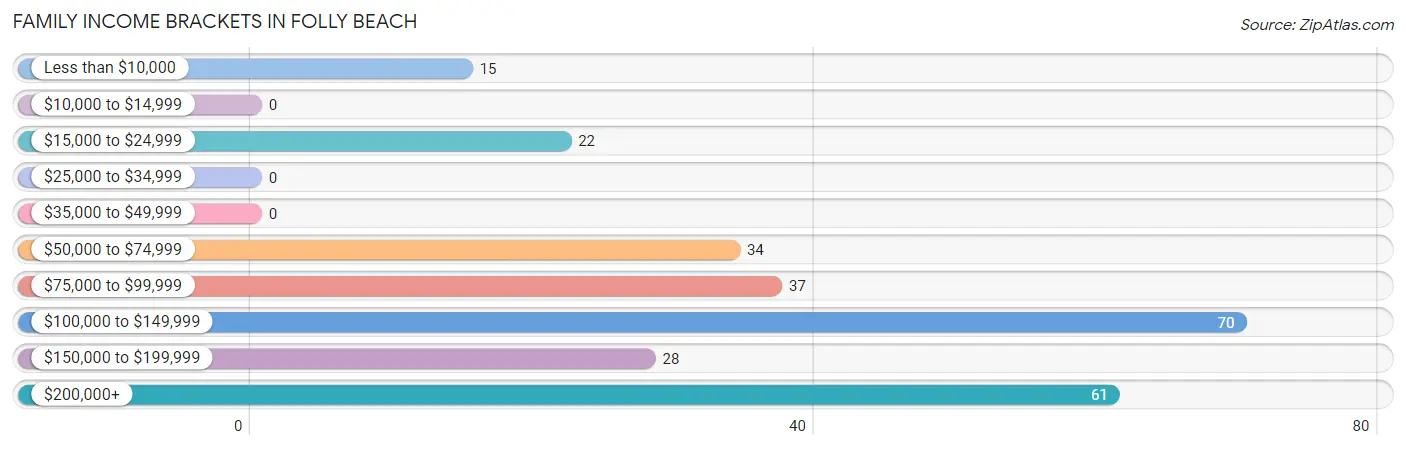
| Income Bracket | # Families | % Families |
| Less than $10,000 | 15 | 5.6% |
| $10,000 to $14,999 | 0 | 0.0% |
| $15,000 to $24,999 | 22 | 8.2% |
| $25,000 to $34,999 | 0 | 0.0% |
| $35,000 to $49,999 | 0 | 0.0% |
| $50,000 to $74,999 | 34 | 12.7% |
| $75,000 to $99,999 | 37 | 13.9% |
| $100,000 to $149,999 | 70 | 26.2% |
| $150,000 to $199,999 | 28 | 10.5% |
| $200,000+ | 61 | 22.8% |
Family Income by Famaliy Size in Folly Beach
2-person families (229 | 85.8%) account for the highest median family income in Folly Beach with $102,026 per family, while 2-person families (229 | 85.8%) have the highest median income of $51,013 per family member.
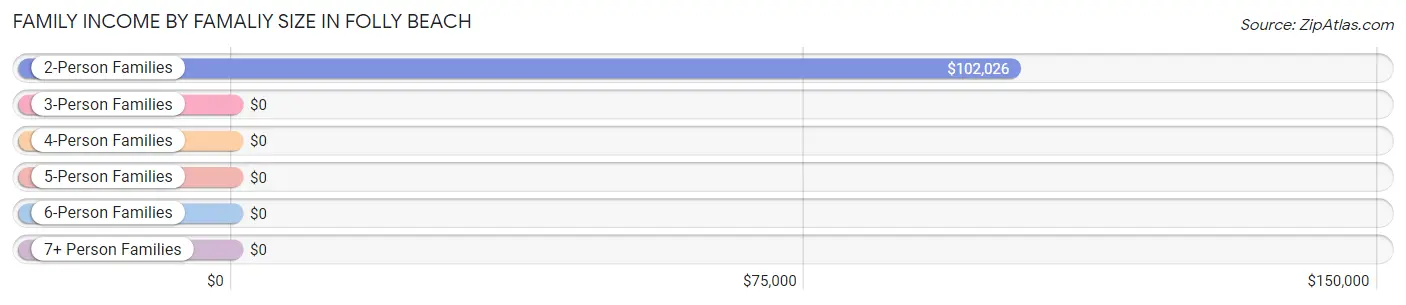
| Income Bracket | # Families | Median Income |
| 2-Person Families | 229 (85.8%) | $102,026 |
| 3-Person Families | 14 (5.2%) | $0 |
| 4-Person Families | 24 (9.0%) | $0 |
| 5-Person Families | 0 (0.0%) | $0 |
| 6-Person Families | 0 (0.0%) | $0 |
| 7+ Person Families | 0 (0.0%) | $0 |
| Total | 267 (100.0%) | $102,198 |
Family Income by Number of Earners in Folly Beach
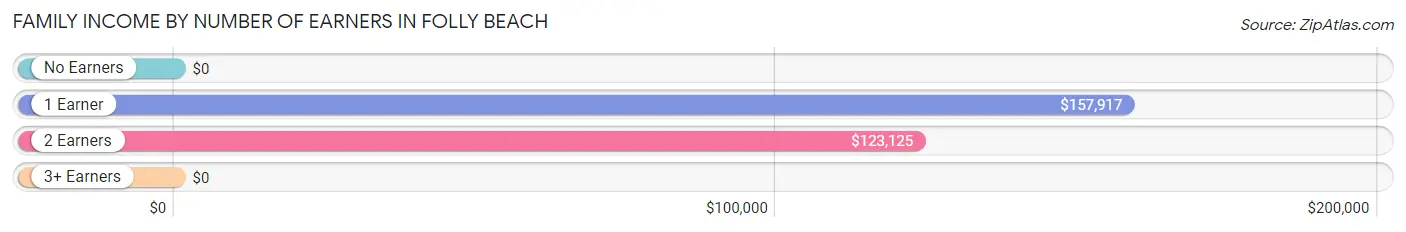
| Number of Earners | # Families | Median Income |
| No Earners | 83 (31.1%) | $0 |
| 1 Earner | 118 (44.2%) | $157,917 |
| 2 Earners | 66 (24.7%) | $123,125 |
| 3+ Earners | 0 (0.0%) | $0 |
| Total | 267 (100.0%) | $102,198 |
Household Income in Folly Beach
Household Income Brackets in Folly Beach
With 176 households falling in the category, the $100,000 to $149,999 income range is the most frequent in Folly Beach, accounting for 27.5% of all households. In contrast, only 17 households (2.6%) fall into the $10,000 to $14,999 income bracket, making it the least populous group.
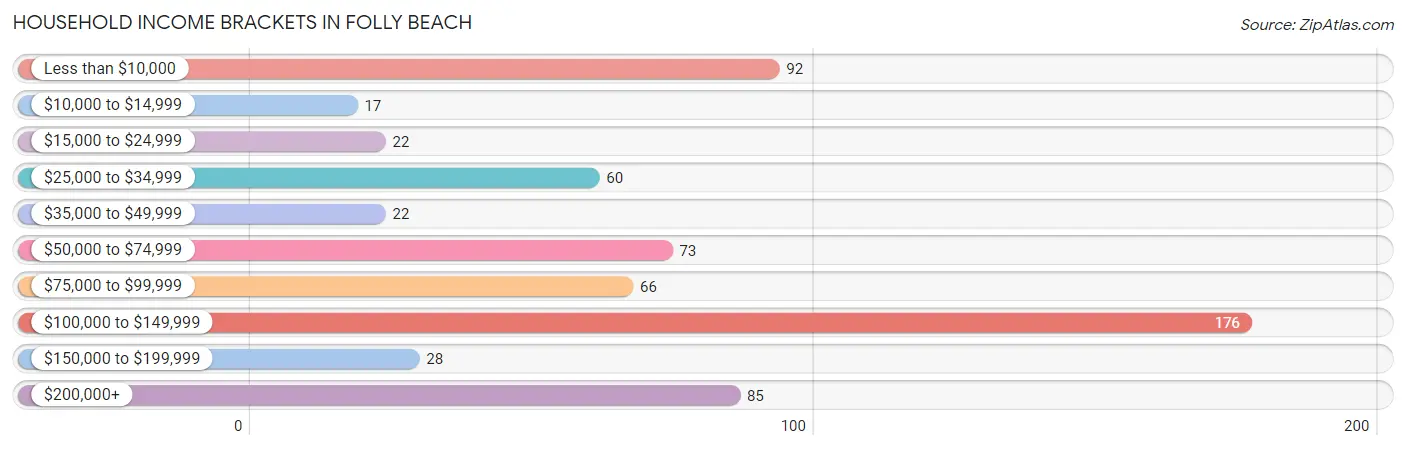
| Income Bracket | # Households | % Households |
| Less than $10,000 | 92 | 14.4% |
| $10,000 to $14,999 | 17 | 2.7% |
| $15,000 to $24,999 | 22 | 3.4% |
| $25,000 to $34,999 | 60 | 9.4% |
| $35,000 to $49,999 | 22 | 3.4% |
| $50,000 to $74,999 | 73 | 11.4% |
| $75,000 to $99,999 | 66 | 10.3% |
| $100,000 to $149,999 | 176 | 27.5% |
| $150,000 to $199,999 | 28 | 4.4% |
| $200,000+ | 85 | 13.3% |
Household Income by Householder Age in Folly Beach
The median household income in Folly Beach is $88,424, with the highest median household income of $105,573 found in the 45 to 64 years age bracket for the primary householder. A total of 331 households (51.6%) fall into this category.
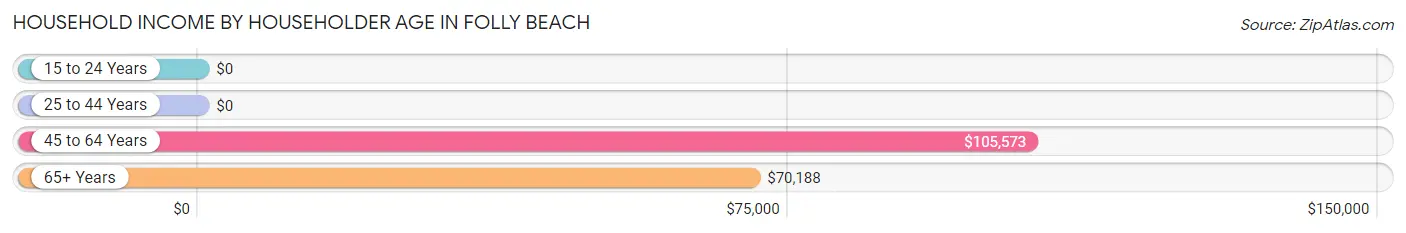
| Income Bracket | # Households | Median Income |
| 15 to 24 Years | 0 (0.0%) | $0 |
| 25 to 44 Years | 49 (7.6%) | $0 |
| 45 to 64 Years | 331 (51.6%) | $105,573 |
| 65+ Years | 261 (40.7%) | $70,188 |
| Total | 641 (100.0%) | $88,424 |
Poverty in Folly Beach
Income Below Poverty by Sex and Age in Folly Beach
With 10.6% poverty level for males and 23.3% for females among the residents of Folly Beach, 75 year old and over males and 55 to 64 year old females are the most vulnerable to poverty, with 17 males (33.3%) and 114 females (75.0%) in their respective age groups living below the poverty level.
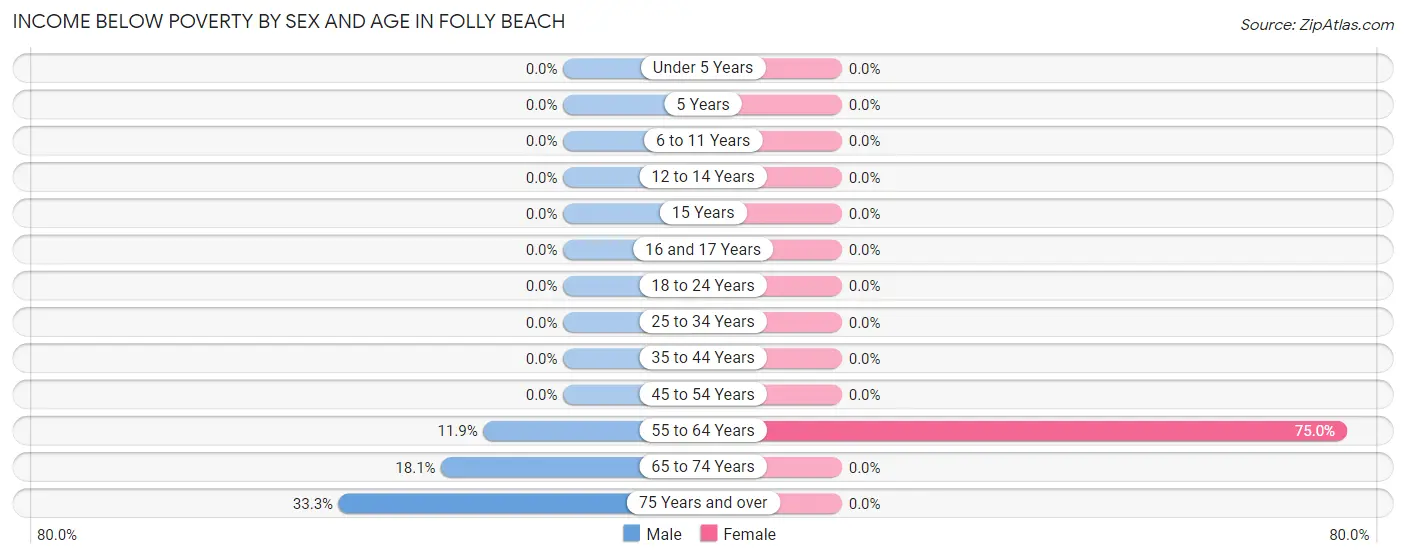
| Age Bracket | Male | Female |
| Under 5 Years | 0 (0.0%) | 0 (0.0%) |
| 5 Years | 0 (0.0%) | 0 (0.0%) |
| 6 to 11 Years | 0 (0.0%) | 0 (0.0%) |
| 12 to 14 Years | 0 (0.0%) | 0 (0.0%) |
| 15 Years | 0 (0.0%) | 0 (0.0%) |
| 16 and 17 Years | 0 (0.0%) | 0 (0.0%) |
| 18 to 24 Years | 0 (0.0%) | 0 (0.0%) |
| 25 to 34 Years | 0 (0.0%) | 0 (0.0%) |
| 35 to 44 Years | 0 (0.0%) | 0 (0.0%) |
| 45 to 54 Years | 0 (0.0%) | 0 (0.0%) |
| 55 to 64 Years | 16 (11.8%) | 114 (75.0%) |
| 65 to 74 Years | 23 (18.1%) | 0 (0.0%) |
| 75 Years and over | 17 (33.3%) | 0 (0.0%) |
| Total | 56 (10.6%) | 114 (23.3%) |
Income Above Poverty by Sex and Age in Folly Beach
According to the poverty statistics in Folly Beach, males aged under 5 years and females aged 12 to 14 years are the age groups that are most secure financially, with 100.0% of males and 100.0% of females in these age groups living above the poverty line.
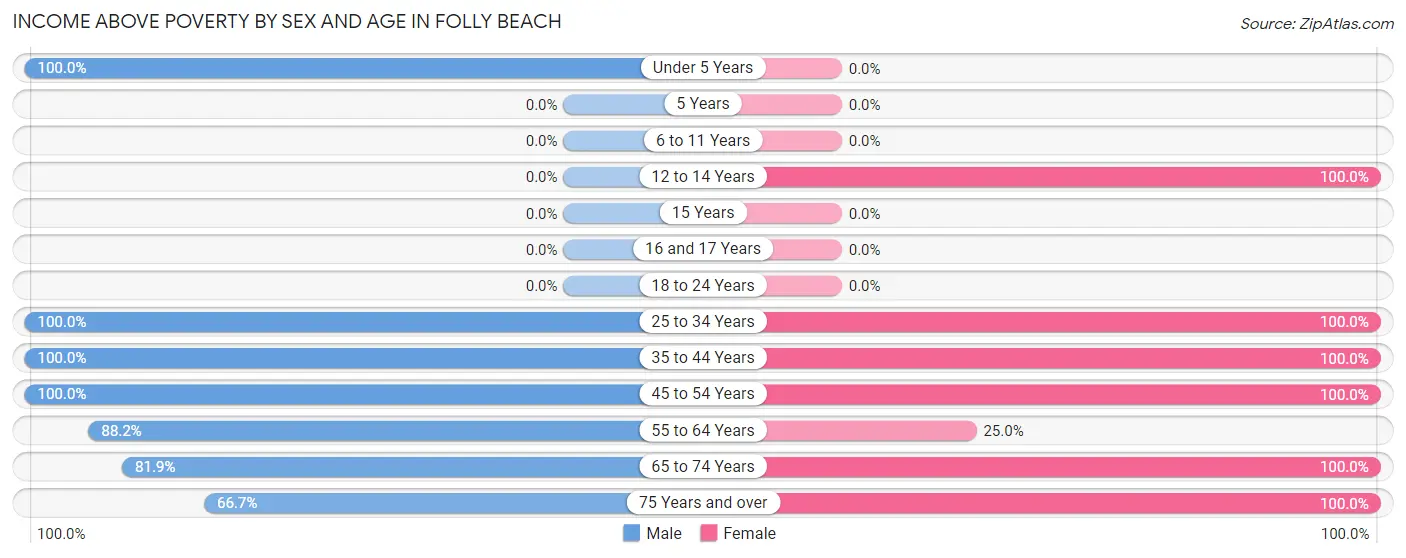
| Age Bracket | Male | Female |
| Under 5 Years | 15 (100.0%) | 0 (0.0%) |
| 5 Years | 0 (0.0%) | 0 (0.0%) |
| 6 to 11 Years | 0 (0.0%) | 0 (0.0%) |
| 12 to 14 Years | 0 (0.0%) | 18 (100.0%) |
| 15 Years | 0 (0.0%) | 0 (0.0%) |
| 16 and 17 Years | 0 (0.0%) | 0 (0.0%) |
| 18 to 24 Years | 0 (0.0%) | 0 (0.0%) |
| 25 to 34 Years | 23 (100.0%) | 20 (100.0%) |
| 35 to 44 Years | 57 (100.0%) | 28 (100.0%) |
| 45 to 54 Years | 122 (100.0%) | 36 (100.0%) |
| 55 to 64 Years | 119 (88.1%) | 38 (25.0%) |
| 65 to 74 Years | 104 (81.9%) | 205 (100.0%) |
| 75 Years and over | 34 (66.7%) | 31 (100.0%) |
| Total | 474 (89.4%) | 376 (76.7%) |
Income Below Poverty Among Married-Couple Families in Folly Beach
The poverty statistics for married-couple families in Folly Beach show that 13.9% or 37 of the total 267 families live below the poverty line. Families with no children have the highest poverty rate of 15.7%, comprising of 37 families. On the other hand, families with 1 or 2 children have the lowest poverty rate of 0.0%, which includes 0 families.
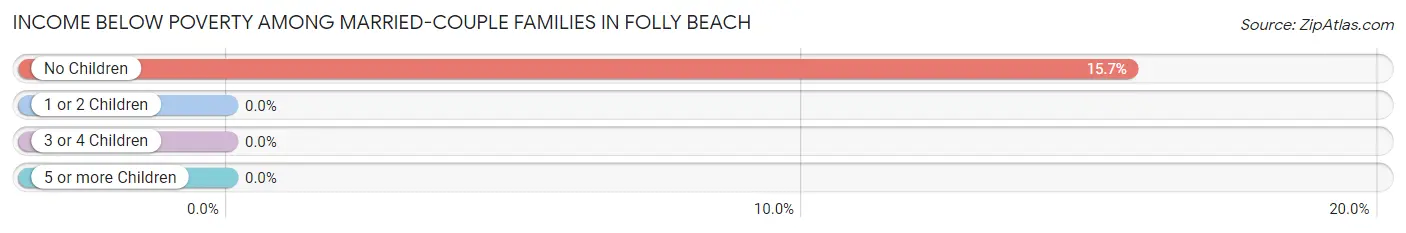
| Children | Above Poverty | Below Poverty |
| No Children | 199 (84.3%) | 37 (15.7%) |
| 1 or 2 Children | 31 (100.0%) | 0 (0.0%) |
| 3 or 4 Children | 0 (0.0%) | 0 (0.0%) |
| 5 or more Children | 0 (0.0%) | 0 (0.0%) |
| Total | 230 (86.1%) | 37 (13.9%) |
Income Below Poverty Among Single-Parent Households in Folly Beach
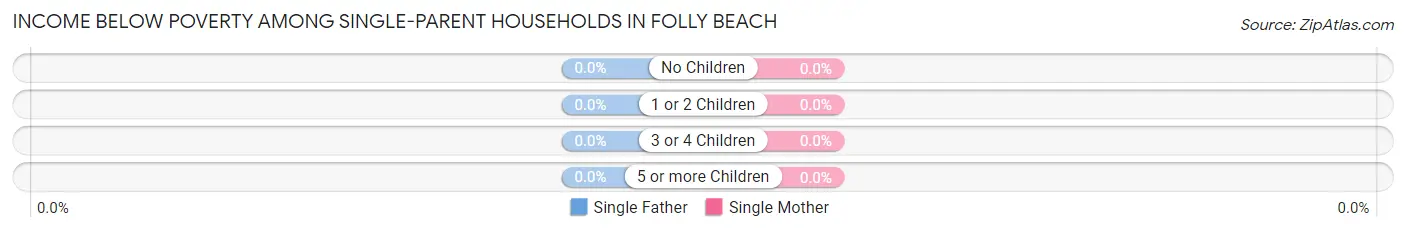
| Children | Single Father | Single Mother |
| No Children | 0 (0.0%) | 0 (0.0%) |
| 1 or 2 Children | 0 (0.0%) | 0 (0.0%) |
| 3 or 4 Children | 0 (0.0%) | 0 (0.0%) |
| 5 or more Children | 0 (0.0%) | 0 (0.0%) |
| Total | 0 (0.0%) | 0 (0.0%) |
Income Below Poverty Among Married-Couple vs Single-Parent Households in Folly Beach
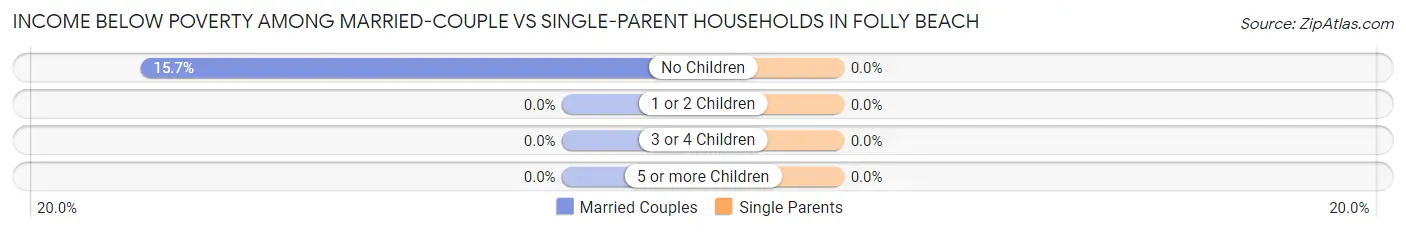
| Children | Married-Couple Families | Single-Parent Households |
| No Children | 37 (15.7%) | 0 (0.0%) |
| 1 or 2 Children | 0 (0.0%) | 0 (0.0%) |
| 3 or 4 Children | 0 (0.0%) | 0 (0.0%) |
| 5 or more Children | 0 (0.0%) | 0 (0.0%) |
| Total | 37 (13.9%) | 0 (0.0%) |
Race in Folly Beach
The most populous races in Folly Beach are , and White / Caucasian (1,020 | 100.0%).
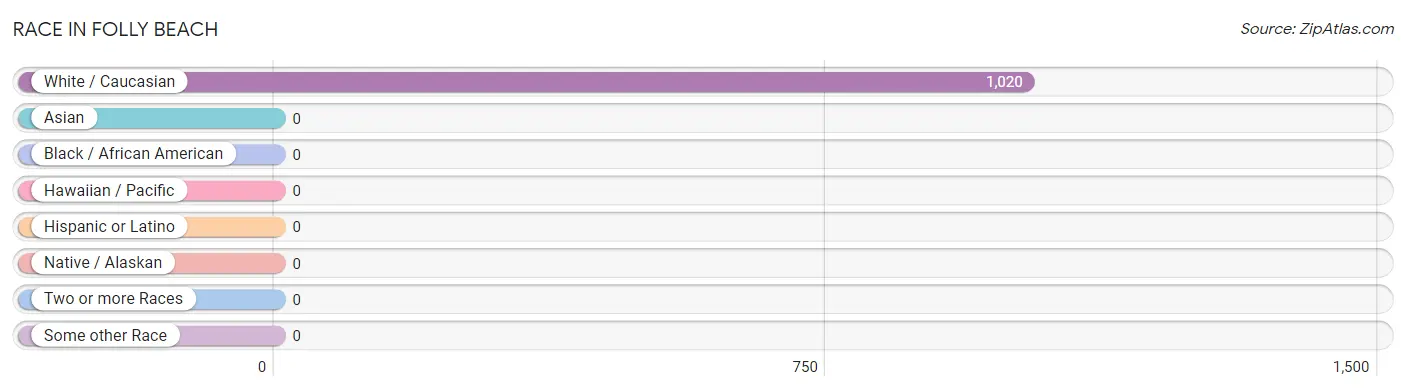
| Race | # Population | % Population |
| Asian | 0 | 0.0% |
| Black / African American | 0 | 0.0% |
| Hawaiian / Pacific | 0 | 0.0% |
| Hispanic or Latino | 0 | 0.0% |
| Native / Alaskan | 0 | 0.0% |
| White / Caucasian | 1,020 | 100.0% |
| Two or more Races | 0 | 0.0% |
| Some other Race | 0 | 0.0% |
| Total | 1,020 | 100.0% |
Ancestry in Folly Beach
The most populous ancestries reported in Folly Beach are American (441 | 43.2%), German (137 | 13.4%), English (116 | 11.4%), Irish (116 | 11.4%), and Italian (80 | 7.8%), together accounting for 87.3% of all Folly Beach residents.
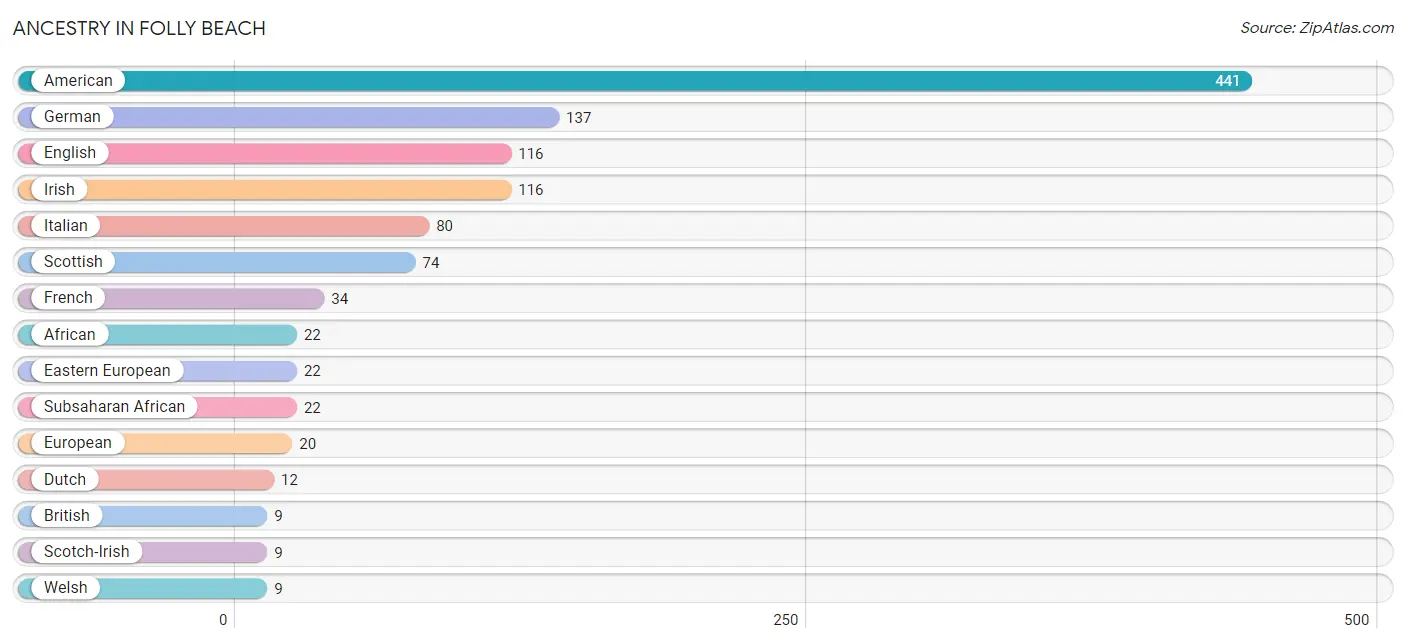
| Ancestry | # Population | % Population |
| African | 22 | 2.2% |
| American | 441 | 43.2% |
| British | 9 | 0.9% |
| Dutch | 12 | 1.2% |
| Eastern European | 22 | 2.2% |
| English | 116 | 11.4% |
| European | 20 | 2.0% |
| French | 34 | 3.3% |
| German | 137 | 13.4% |
| Irish | 116 | 11.4% |
| Italian | 80 | 7.8% |
| Polish | 5 | 0.5% |
| Scotch-Irish | 9 | 0.9% |
| Scottish | 74 | 7.2% |
| Subsaharan African | 22 | 2.2% |
| Welsh | 9 | 0.9% | View All 16 Rows |
Immigrants in Folly Beach

| Immigration Origin | # Population | % Population | View All 0 Rows |
Sex and Age in Folly Beach
Sex and Age in Folly Beach
The most populous age groups in Folly Beach are 60 to 64 Years (124 | 23.4%) for men and 60 to 64 Years (130 | 26.5%) for women.
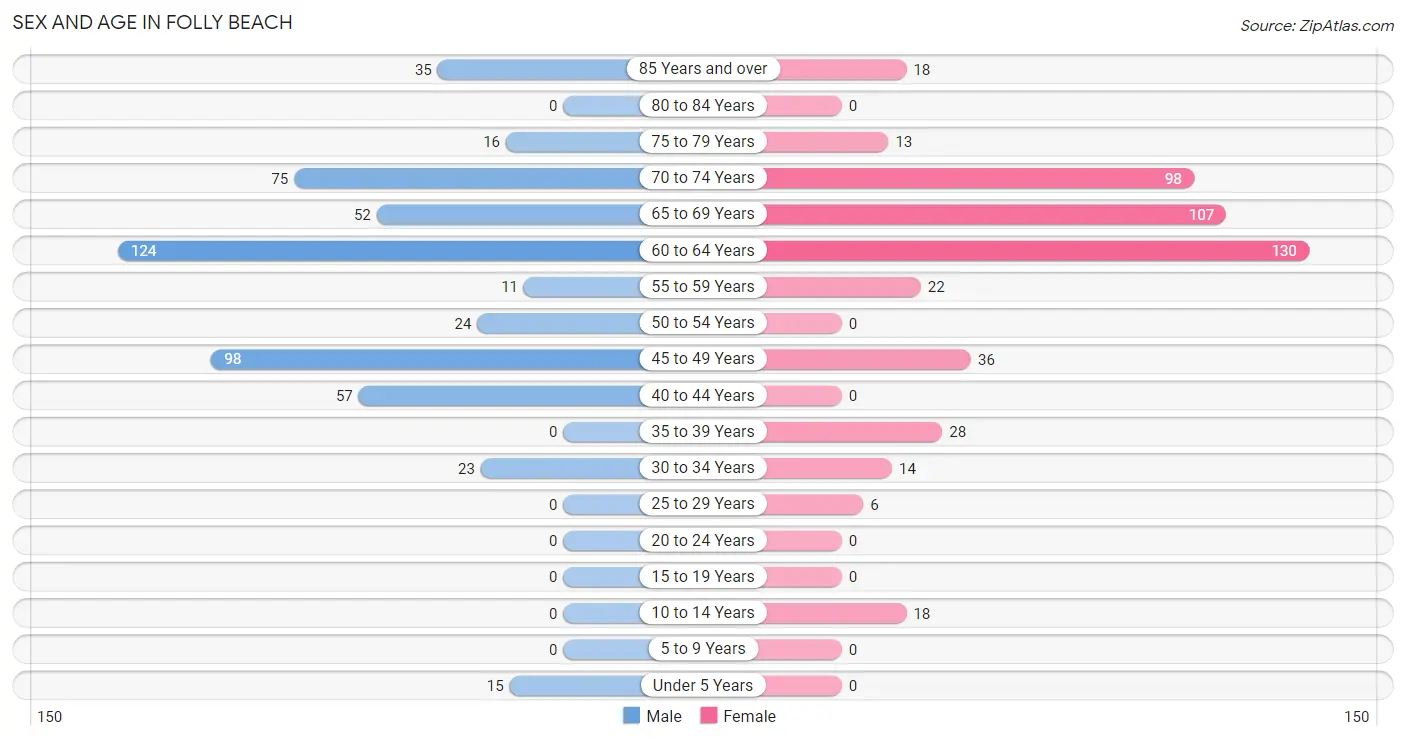
| Age Bracket | Male | Female |
| Under 5 Years | 15 (2.8%) | 0 (0.0%) |
| 5 to 9 Years | 0 (0.0%) | 0 (0.0%) |
| 10 to 14 Years | 0 (0.0%) | 18 (3.7%) |
| 15 to 19 Years | 0 (0.0%) | 0 (0.0%) |
| 20 to 24 Years | 0 (0.0%) | 0 (0.0%) |
| 25 to 29 Years | 0 (0.0%) | 6 (1.2%) |
| 30 to 34 Years | 23 (4.3%) | 14 (2.9%) |
| 35 to 39 Years | 0 (0.0%) | 28 (5.7%) |
| 40 to 44 Years | 57 (10.7%) | 0 (0.0%) |
| 45 to 49 Years | 98 (18.5%) | 36 (7.3%) |
| 50 to 54 Years | 24 (4.5%) | 0 (0.0%) |
| 55 to 59 Years | 11 (2.1%) | 22 (4.5%) |
| 60 to 64 Years | 124 (23.4%) | 130 (26.5%) |
| 65 to 69 Years | 52 (9.8%) | 107 (21.8%) |
| 70 to 74 Years | 75 (14.1%) | 98 (20.0%) |
| 75 to 79 Years | 16 (3.0%) | 13 (2.6%) |
| 80 to 84 Years | 0 (0.0%) | 0 (0.0%) |
| 85 Years and over | 35 (6.6%) | 18 (3.7%) |
| Total | 530 (100.0%) | 490 (100.0%) |
Families and Households in Folly Beach
Median Family Size in Folly Beach
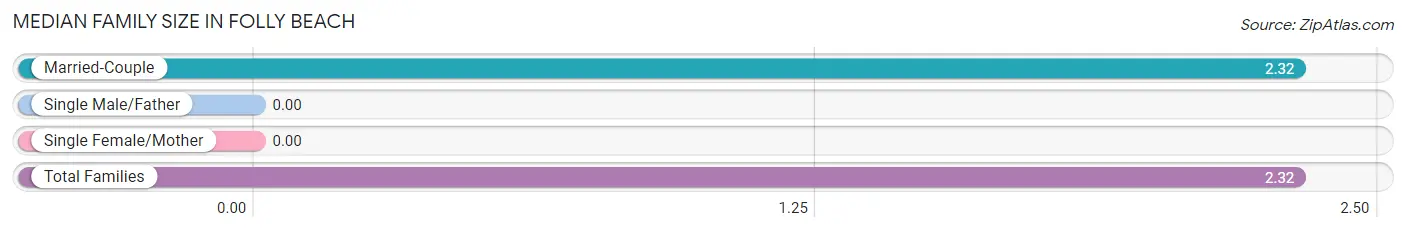
| Family Type | # Families | Family Size |
| Married-Couple | 267 (100.0%) | 2.32 |
| Single Male/Father | 0 (0.0%) | - |
| Single Female/Mother | 0 (0.0%) | - |
| Total Families | 267 (100.0%) | 2.32 |
Median Household Size in Folly Beach
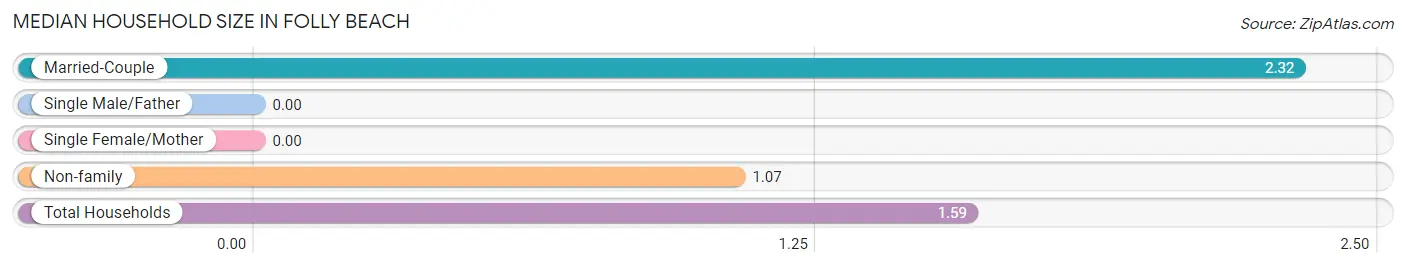
| Household Type | # Households | Household Size |
| Married-Couple | 267 (41.6%) | 2.32 |
| Single Male/Father | 0 (0.0%) | - |
| Single Female/Mother | 0 (0.0%) | - |
| Non-family | 374 (58.4%) | 1.07 |
| Total Households | 641 (100.0%) | 1.59 |
Household Size by Marriage Status in Folly Beach
Out of a total of 641 households in Folly Beach, 267 (41.6%) are family households, while 374 (58.4%) are nonfamily households. The most numerous type of family households are 2-person households, comprising 229, and the most common type of nonfamily households are 1-person households, comprising 344.
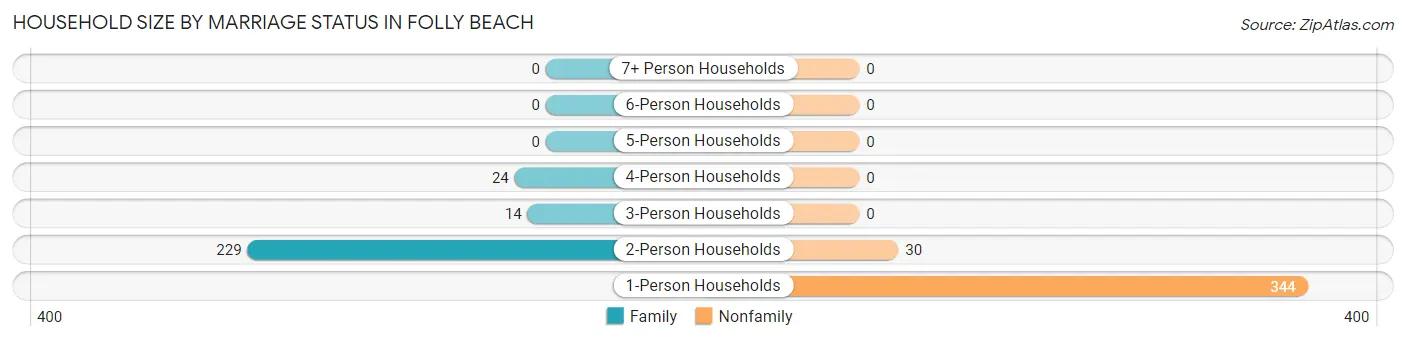
| Household Size | Family Households | Nonfamily Households |
| 1-Person Households | - | 344 (53.7%) |
| 2-Person Households | 229 (35.7%) | 30 (4.7%) |
| 3-Person Households | 14 (2.2%) | 0 (0.0%) |
| 4-Person Households | 24 (3.7%) | 0 (0.0%) |
| 5-Person Households | 0 (0.0%) | 0 (0.0%) |
| 6-Person Households | 0 (0.0%) | 0 (0.0%) |
| 7+ Person Households | 0 (0.0%) | 0 (0.0%) |
| Total | 267 (41.6%) | 374 (58.4%) |
Female Fertility in Folly Beach
Fertility by Age in Folly Beach
Average fertility rate in Folly Beach is 167.0 births per 1,000 women. Women in the age bracket of 20 to 34 years have the highest fertility rate with 700.0 births per 1,000 women. Women in the age bracket of 20 to 34 years acount for 100.0% of all women with births.
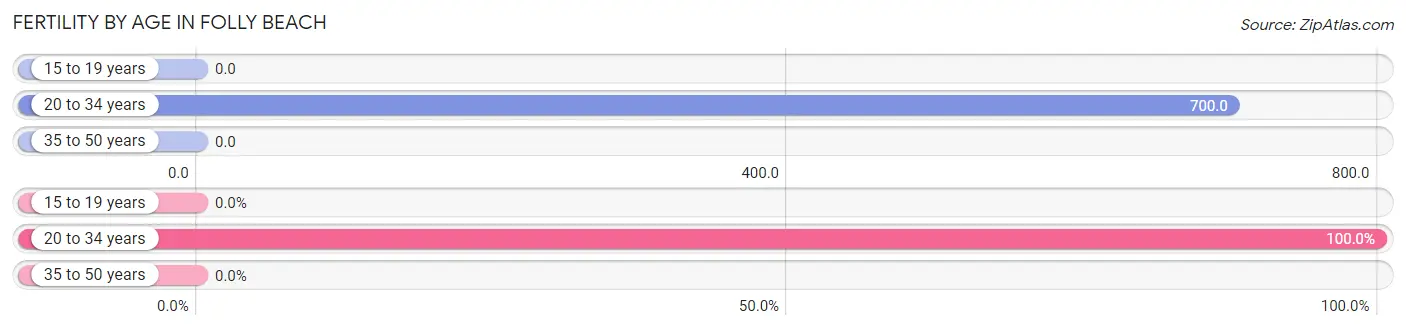
| Age Bracket | Women with Births | Births / 1,000 Women |
| 15 to 19 years | 0 (0.0%) | 0.0 |
| 20 to 34 years | 14 (100.0%) | 700.0 |
| 35 to 50 years | 0 (0.0%) | 0.0 |
| Total | 14 (100.0%) | 167.0 |
Fertility by Age by Marriage Status in Folly Beach
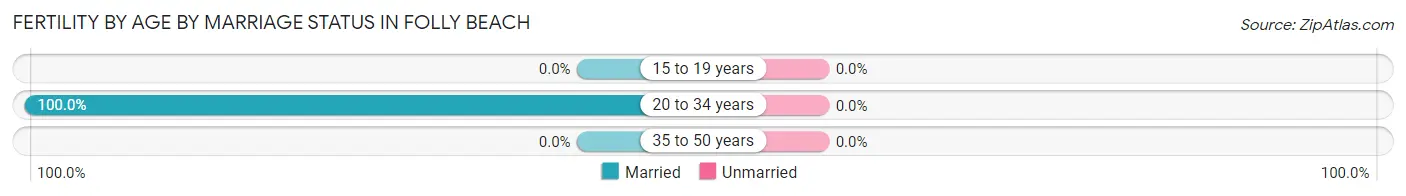
| Age Bracket | Married | Unmarried |
| 15 to 19 years | 0 (0.0%) | 0 (0.0%) |
| 20 to 34 years | 14 (100.0%) | 0 (0.0%) |
| 35 to 50 years | 0 (0.0%) | 0 (0.0%) |
| Total | 14 (100.0%) | 0 (0.0%) |
Fertility by Education in Folly Beach
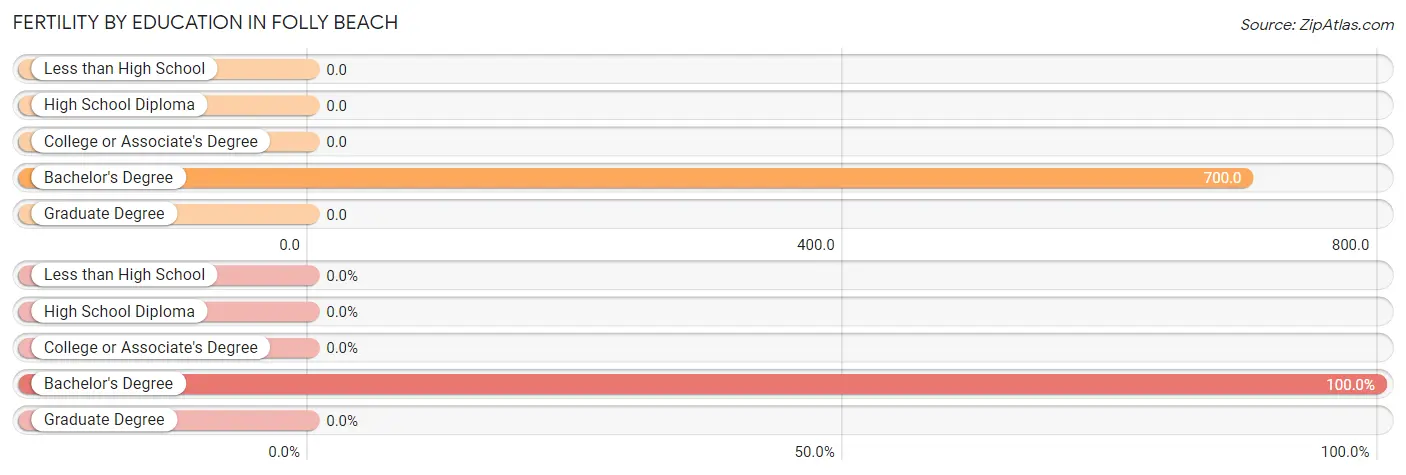
| Educational Attainment | Women with Births | Births / 1,000 Women |
| Less than High School | 0 (0.0%) | 0.0 |
| High School Diploma | 0 (0.0%) | 0.0 |
| College or Associate's Degree | 0 (0.0%) | 0.0 |
| Bachelor's Degree | 14 (100.0%) | 700.0 |
| Graduate Degree | 0 (0.0%) | 0.0 |
| Total | 14 (100.0%) | 167.0 |
Fertility by Education by Marriage Status in Folly Beach
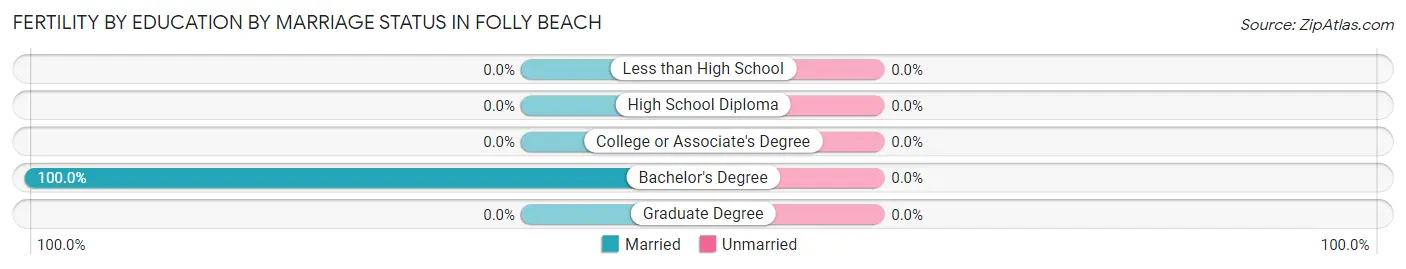
| Educational Attainment | Married | Unmarried |
| Less than High School | 0 (0.0%) | 0 (0.0%) |
| High School Diploma | 0 (0.0%) | 0 (0.0%) |
| College or Associate's Degree | 0 (0.0%) | 0 (0.0%) |
| Bachelor's Degree | 14 (100.0%) | 0 (0.0%) |
| Graduate Degree | 0 (0.0%) | 0 (0.0%) |
| Total | 14 (100.0%) | 0 (0.0%) |
Employment Characteristics in Folly Beach
Employment by Class of Employer in Folly Beach
Among the 490 employed individuals in Folly Beach, private company employees (228 | 46.5%), self-employed (incorporated) (146 | 29.8%), and not-for-profit organizations (83 | 16.9%) make up the most common classes of employment.
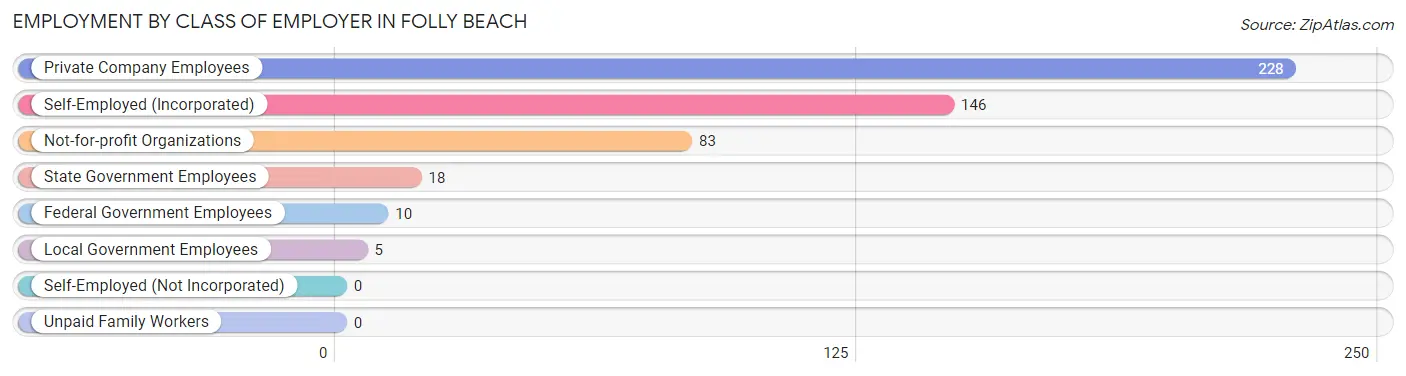
| Employer Class | # Employees | % Employees |
| Private Company Employees | 228 | 46.5% |
| Self-Employed (Incorporated) | 146 | 29.8% |
| Self-Employed (Not Incorporated) | 0 | 0.0% |
| Not-for-profit Organizations | 83 | 16.9% |
| Local Government Employees | 5 | 1.0% |
| State Government Employees | 18 | 3.7% |
| Federal Government Employees | 10 | 2.0% |
| Unpaid Family Workers | 0 | 0.0% |
| Total | 490 | 100.0% |
Employment Status by Age in Folly Beach
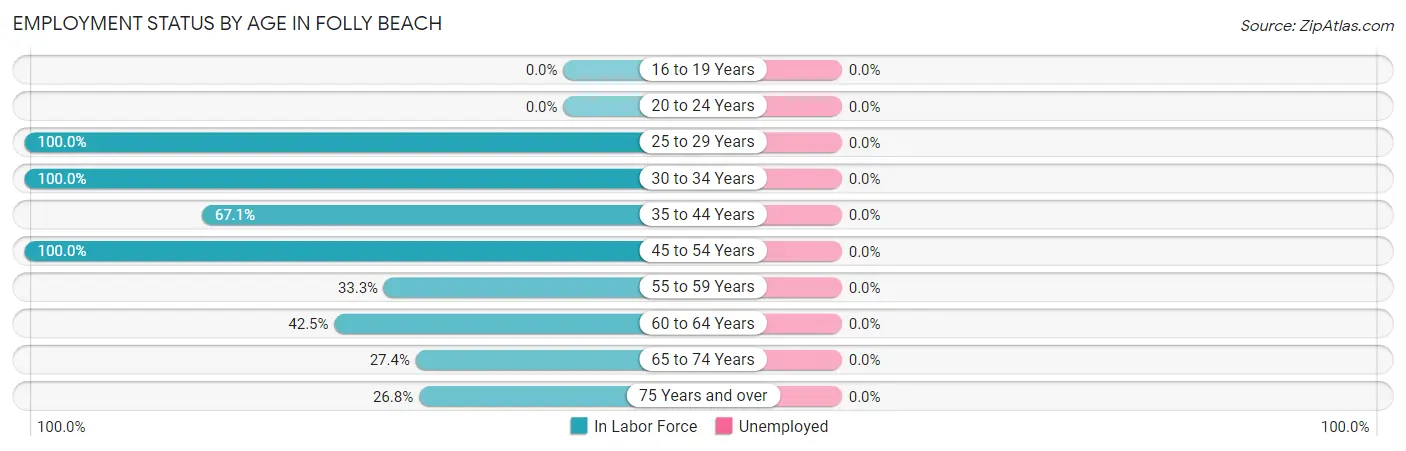
| Age Bracket | In Labor Force | Unemployed |
| 16 to 19 Years | 0 (0.0%) | 0 (0.0%) |
| 20 to 24 Years | 0 (0.0%) | 0 (0.0%) |
| 25 to 29 Years | 6 (100.0%) | 0 (0.0%) |
| 30 to 34 Years | 37 (100.0%) | 0 (0.0%) |
| 35 to 44 Years | 57 (67.1%) | 0 (0.0%) |
| 45 to 54 Years | 158 (100.0%) | 0 (0.0%) |
| 55 to 59 Years | 11 (33.3%) | 0 (0.0%) |
| 60 to 64 Years | 108 (42.5%) | 0 (0.0%) |
| 65 to 74 Years | 91 (27.4%) | 0 (0.0%) |
| 75 Years and over | 22 (26.8%) | 0 (0.0%) |
| Total | 490 (49.6%) | 0 (0.0%) |
Employment Status by Educational Attainment in Folly Beach
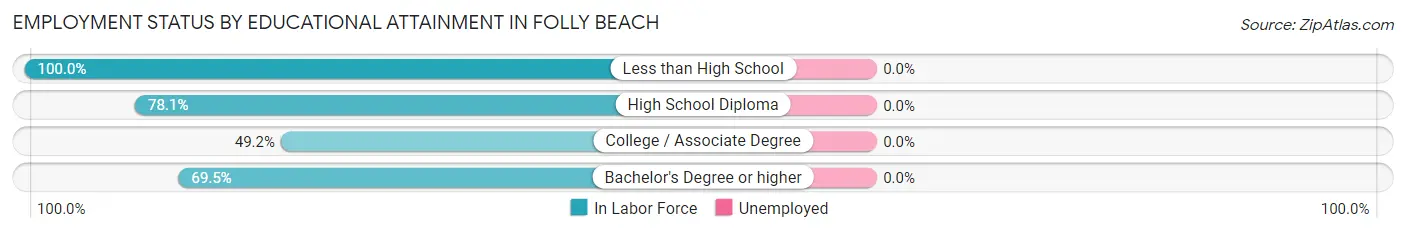
| Educational Attainment | In Labor Force | Unemployed |
| Less than High School | 24 (100.0%) | 0 (0.0%) |
| High School Diploma | 100 (78.1%) | 0 (0.0%) |
| College / Associate Degree | 96 (49.2%) | 0 (0.0%) |
| Bachelor's Degree or higher | 157 (69.5%) | 0 (0.0%) |
| Total | 377 (65.8%) | 0 (0.0%) |
Employment Occupations by Sex in Folly Beach
Management, Business, Science and Arts Occupations
The most common Management, Business, Science and Arts occupations in Folly Beach are Community & Social Service (144 | 29.4%), Legal Services & Support (94 | 19.2%), Management (49 | 10.0%), Education Instruction & Library (22 | 4.5%), and Health Diagnosing & Treating (18 | 3.7%).
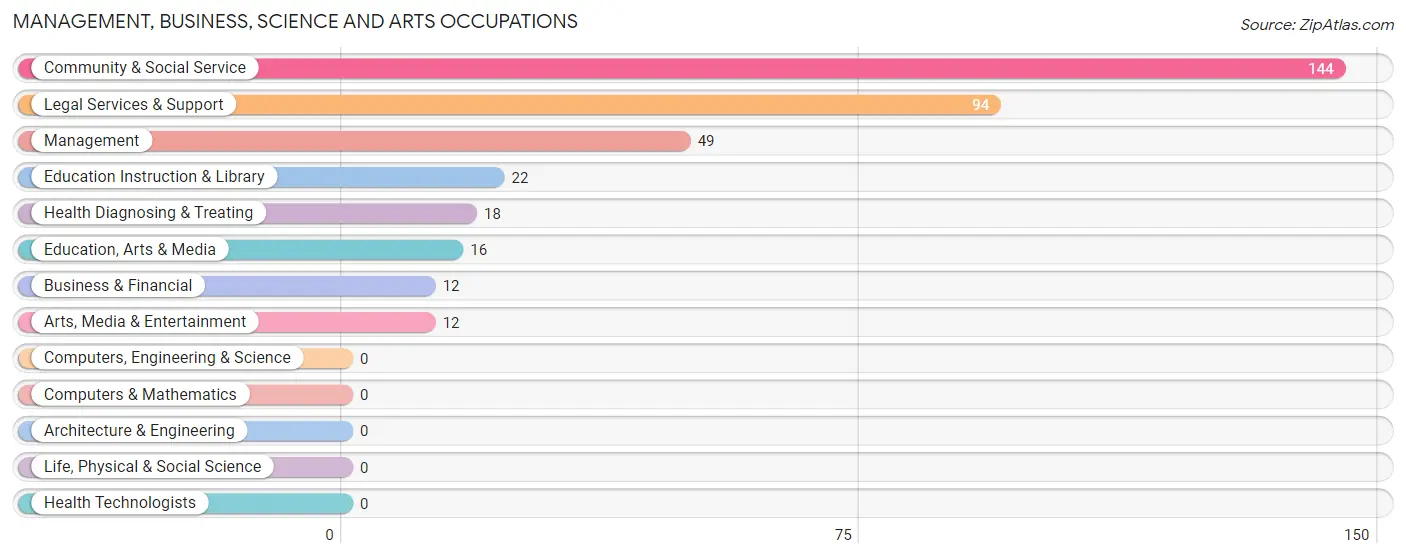
Management, Business, Science and Arts Occupations by Sex
Within the Management, Business, Science and Arts occupations in Folly Beach, the most male-oriented occupations are Management (100.0%), Education, Arts & Media (100.0%), and Legal Services & Support (100.0%), while the most female-oriented occupations are Business & Financial (100.0%), Education Instruction & Library (100.0%), and Health Diagnosing & Treating (100.0%).
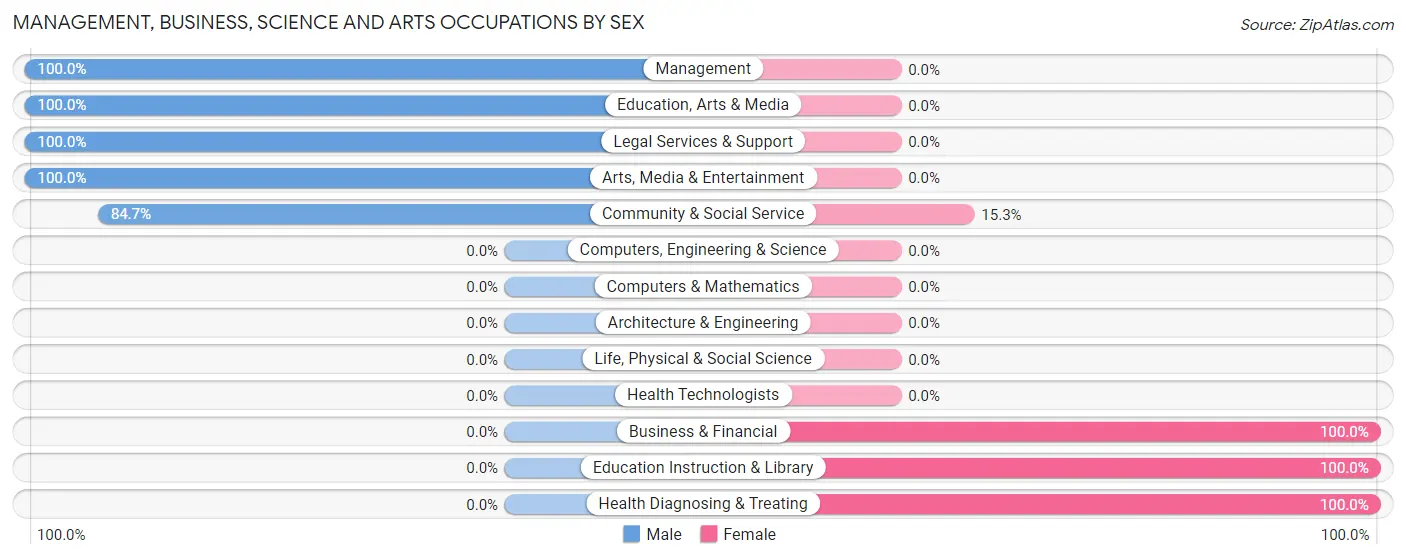
| Occupation | Male | Female |
| Management | 49 (100.0%) | 0 (0.0%) |
| Business & Financial | 0 (0.0%) | 12 (100.0%) |
| Computers, Engineering & Science | 0 (0.0%) | 0 (0.0%) |
| Computers & Mathematics | 0 (0.0%) | 0 (0.0%) |
| Architecture & Engineering | 0 (0.0%) | 0 (0.0%) |
| Life, Physical & Social Science | 0 (0.0%) | 0 (0.0%) |
| Community & Social Service | 122 (84.7%) | 22 (15.3%) |
| Education, Arts & Media | 16 (100.0%) | 0 (0.0%) |
| Legal Services & Support | 94 (100.0%) | 0 (0.0%) |
| Education Instruction & Library | 0 (0.0%) | 22 (100.0%) |
| Arts, Media & Entertainment | 12 (100.0%) | 0 (0.0%) |
| Health Diagnosing & Treating | 0 (0.0%) | 18 (100.0%) |
| Health Technologists | 0 (0.0%) | 0 (0.0%) |
| Total (Category) | 171 (76.7%) | 52 (23.3%) |
| Total (Overall) | 291 (59.4%) | 199 (40.6%) |
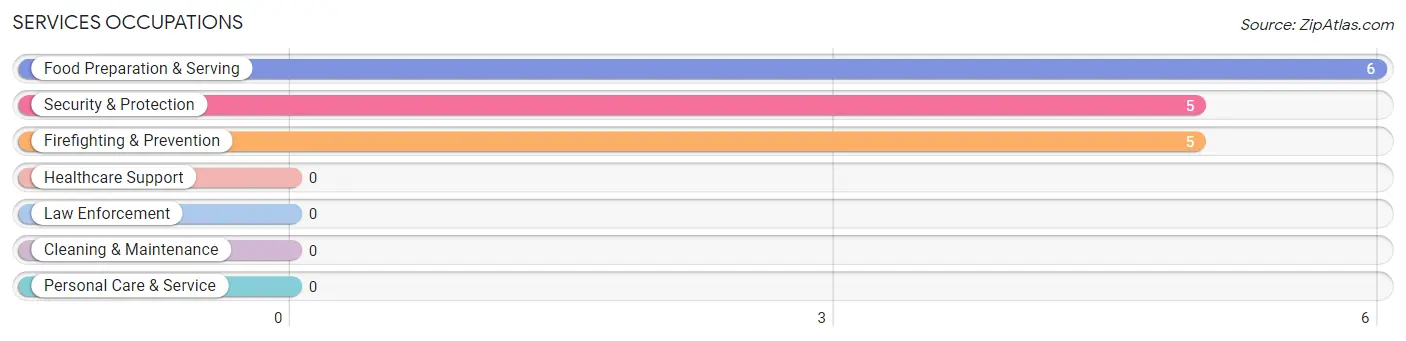
Services Occupations
The most common Services occupations in Folly Beach are Food Preparation & Serving (6 | 1.2%), Security & Protection (5 | 1.0%), and Firefighting & Prevention (5 | 1.0%).
Services Occupations by Sex
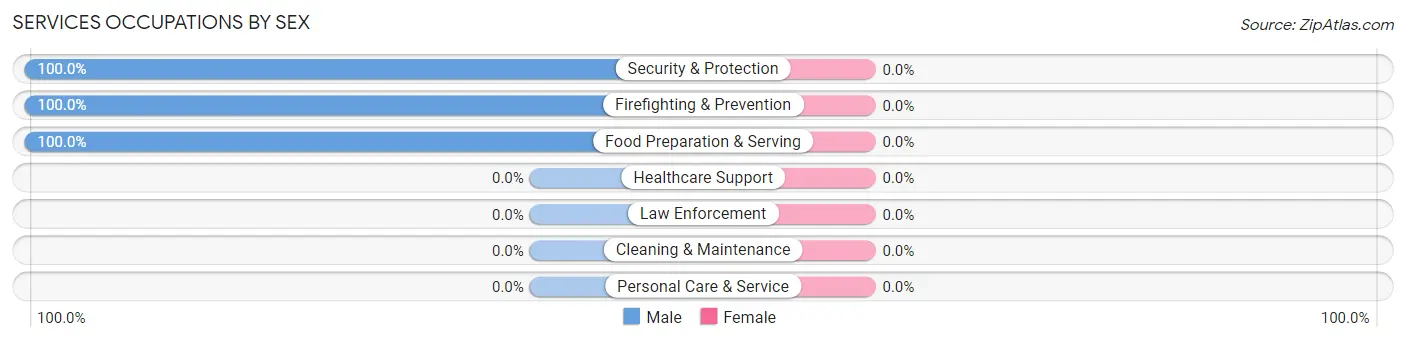
| Occupation | Male | Female |
| Healthcare Support | 0 (0.0%) | 0 (0.0%) |
| Security & Protection | 5 (100.0%) | 0 (0.0%) |
| Firefighting & Prevention | 5 (100.0%) | 0 (0.0%) |
| Law Enforcement | 0 (0.0%) | 0 (0.0%) |
| Food Preparation & Serving | 6 (100.0%) | 0 (0.0%) |
| Cleaning & Maintenance | 0 (0.0%) | 0 (0.0%) |
| Personal Care & Service | 0 (0.0%) | 0 (0.0%) |
| Total (Category) | 11 (100.0%) | 0 (0.0%) |
| Total (Overall) | 291 (59.4%) | 199 (40.6%) |
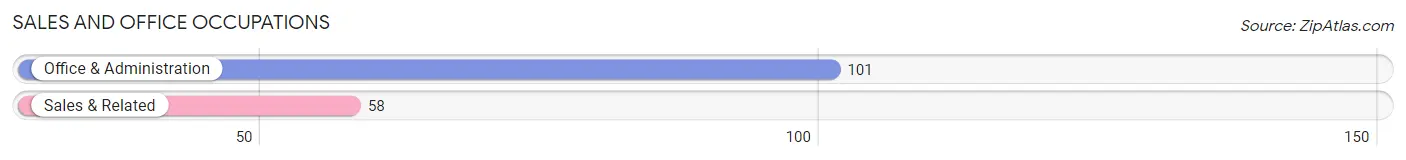
Sales and Office Occupations
The most common Sales and Office occupations in Folly Beach are Office & Administration (101 | 20.6%), and Sales & Related (58 | 11.8%).
Sales and Office Occupations by Sex
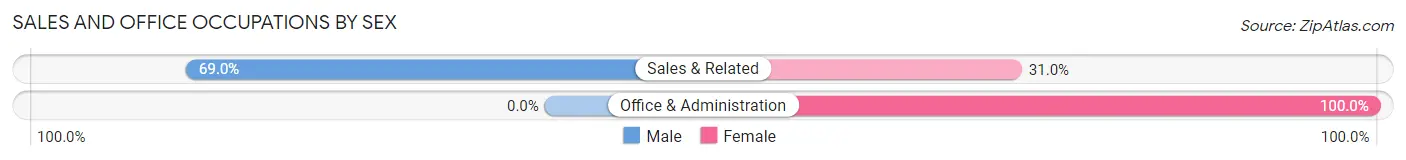
| Occupation | Male | Female |
| Sales & Related | 40 (69.0%) | 18 (31.0%) |
| Office & Administration | 0 (0.0%) | 101 (100.0%) |
| Total (Category) | 40 (25.2%) | 119 (74.8%) |
| Total (Overall) | 291 (59.4%) | 199 (40.6%) |
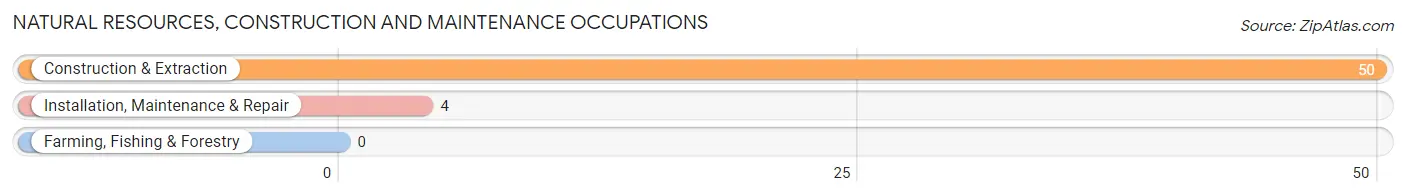
Natural Resources, Construction and Maintenance Occupations
The most common Natural Resources, Construction and Maintenance occupations in Folly Beach are Construction & Extraction (50 | 10.2%), and Installation, Maintenance & Repair (4 | 0.8%).
Natural Resources, Construction and Maintenance Occupations by Sex
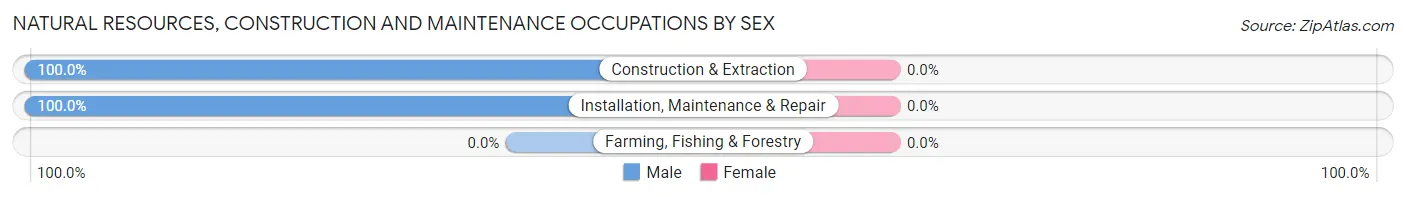
| Occupation | Male | Female |
| Farming, Fishing & Forestry | 0 (0.0%) | 0 (0.0%) |
| Construction & Extraction | 50 (100.0%) | 0 (0.0%) |
| Installation, Maintenance & Repair | 4 (100.0%) | 0 (0.0%) |
| Total (Category) | 54 (100.0%) | 0 (0.0%) |
| Total (Overall) | 291 (59.4%) | 199 (40.6%) |
Production, Transportation and Moving Occupations
The most common Production, Transportation and Moving occupations in Folly Beach are , and Material Moving (43 | 8.8%).
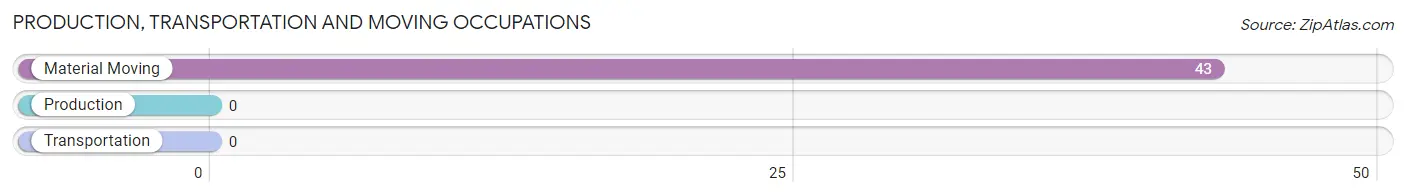
Production, Transportation and Moving Occupations by Sex
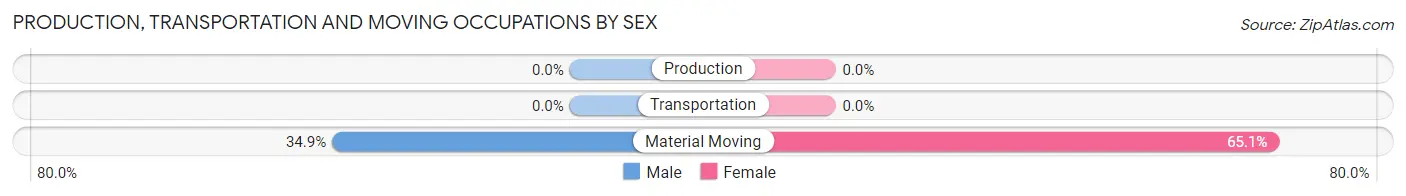
| Occupation | Male | Female |
| Production | 0 (0.0%) | 0 (0.0%) |
| Transportation | 0 (0.0%) | 0 (0.0%) |
| Material Moving | 15 (34.9%) | 28 (65.1%) |
| Total (Category) | 15 (34.9%) | 28 (65.1%) |
| Total (Overall) | 291 (59.4%) | 199 (40.6%) |
Employment Industries by Sex in Folly Beach
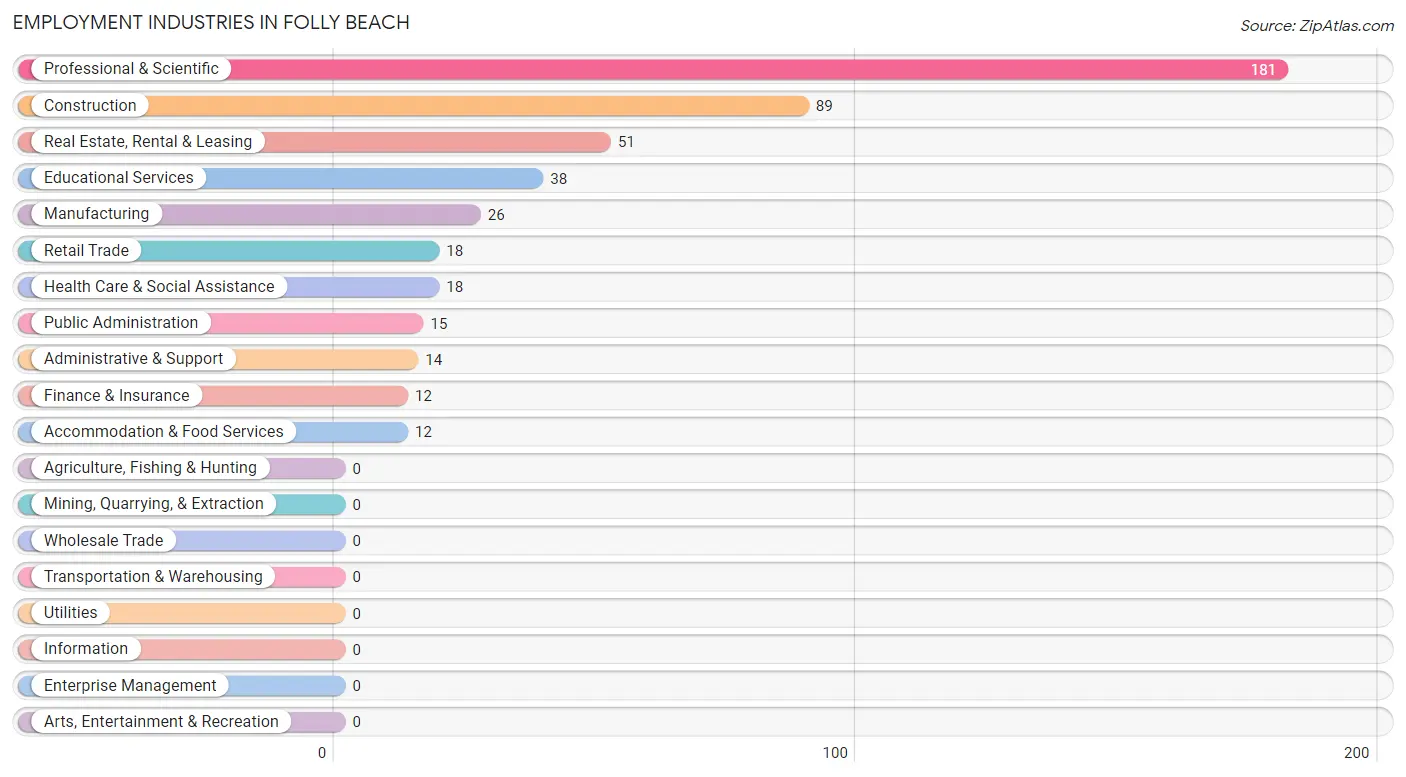
Employment Industries in Folly Beach
The major employment industries in Folly Beach include Professional & Scientific (181 | 36.9%), Construction (89 | 18.2%), Real Estate, Rental & Leasing (51 | 10.4%), Educational Services (38 | 7.8%), and Manufacturing (26 | 5.3%).
Employment Industries by Sex in Folly Beach
The Folly Beach industries that see more men than women are Construction (100.0%), Manufacturing (100.0%), and Public Administration (100.0%), whereas the industries that tend to have a higher number of women are Finance & Insurance (100.0%), Administrative & Support (100.0%), and Educational Services (100.0%).
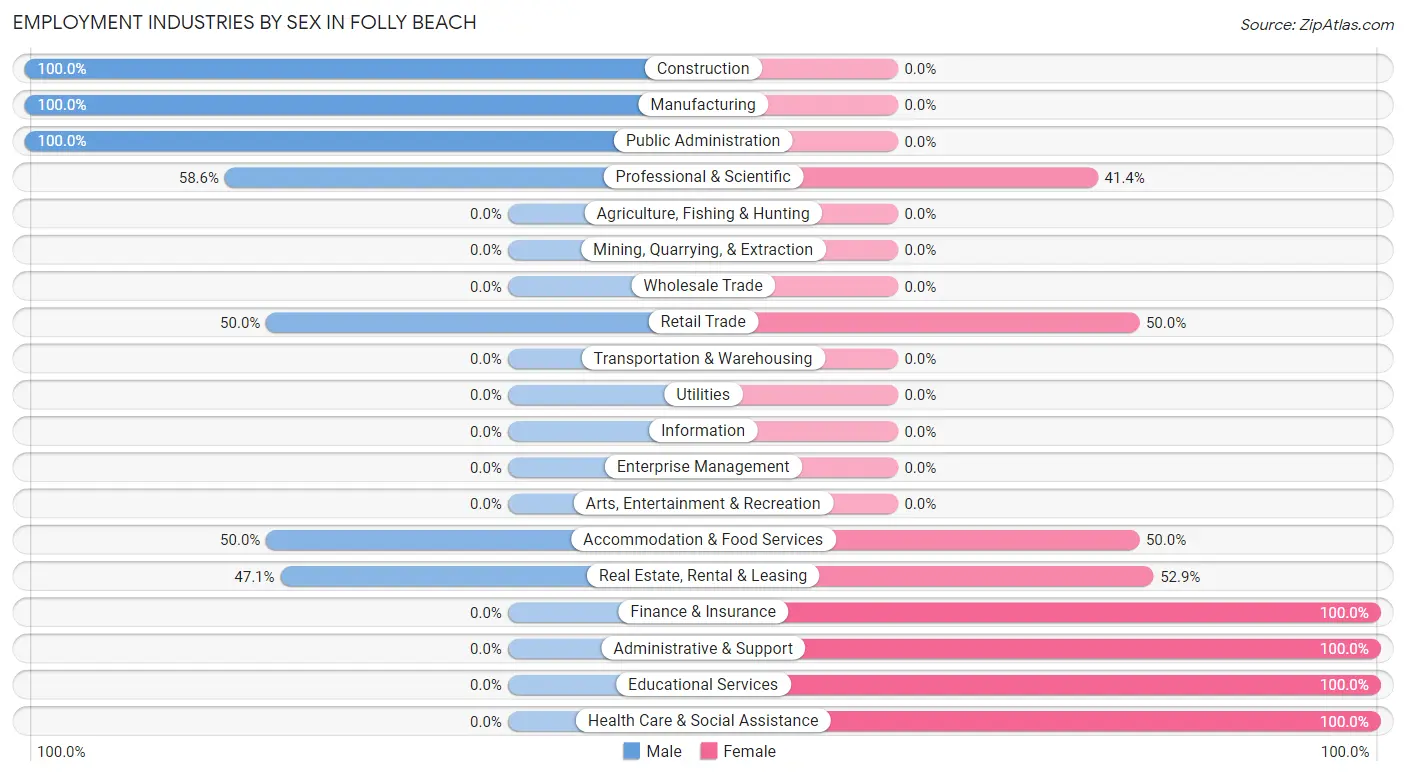
| Industry | Male | Female |
| Agriculture, Fishing & Hunting | 0 (0.0%) | 0 (0.0%) |
| Mining, Quarrying, & Extraction | 0 (0.0%) | 0 (0.0%) |
| Construction | 89 (100.0%) | 0 (0.0%) |
| Manufacturing | 26 (100.0%) | 0 (0.0%) |
| Wholesale Trade | 0 (0.0%) | 0 (0.0%) |
| Retail Trade | 9 (50.0%) | 9 (50.0%) |
| Transportation & Warehousing | 0 (0.0%) | 0 (0.0%) |
| Utilities | 0 (0.0%) | 0 (0.0%) |
| Information | 0 (0.0%) | 0 (0.0%) |
| Finance & Insurance | 0 (0.0%) | 12 (100.0%) |
| Real Estate, Rental & Leasing | 24 (47.1%) | 27 (52.9%) |
| Professional & Scientific | 106 (58.6%) | 75 (41.4%) |
| Enterprise Management | 0 (0.0%) | 0 (0.0%) |
| Administrative & Support | 0 (0.0%) | 14 (100.0%) |
| Educational Services | 0 (0.0%) | 38 (100.0%) |
| Health Care & Social Assistance | 0 (0.0%) | 18 (100.0%) |
| Arts, Entertainment & Recreation | 0 (0.0%) | 0 (0.0%) |
| Accommodation & Food Services | 6 (50.0%) | 6 (50.0%) |
| Public Administration | 15 (100.0%) | 0 (0.0%) |
| Total | 291 (59.4%) | 199 (40.6%) |
Education in Folly Beach
School Enrollment in Folly Beach
The most common levels of schooling among the 40 students in Folly Beach are middle school (18 | 45.0%), college / undergraduate (16 | 40.0%), and graduate / professional (6 | 15.0%).
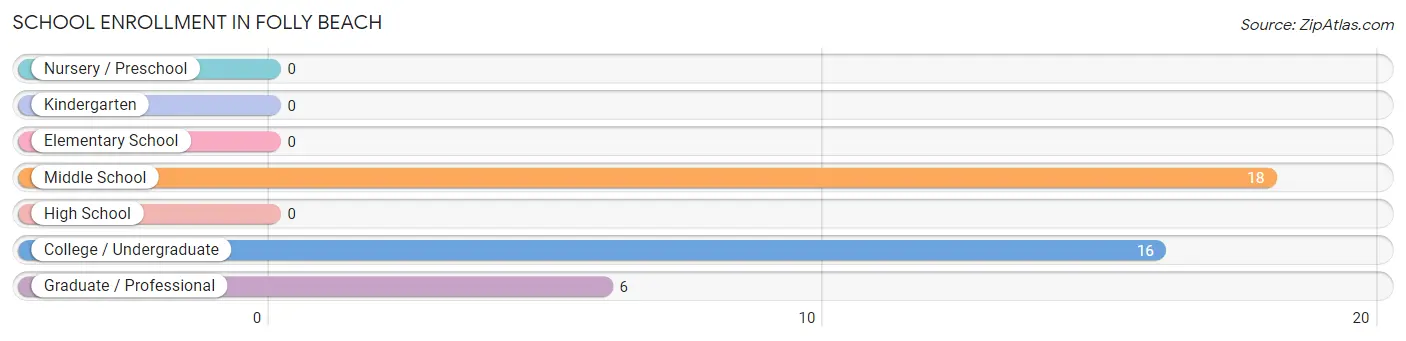
| School Level | # Students | % Students |
| Nursery / Preschool | 0 | 0.0% |
| Kindergarten | 0 | 0.0% |
| Elementary School | 0 | 0.0% |
| Middle School | 18 | 45.0% |
| High School | 0 | 0.0% |
| College / Undergraduate | 16 | 40.0% |
| Graduate / Professional | 6 | 15.0% |
| Total | 40 | 100.0% |
School Enrollment by Age by Funding Source in Folly Beach
Out of a total of 40 students who are enrolled in schools in Folly Beach, 16 (40.0%) attend a private institution, while the remaining 24 (60.0%) are enrolled in public schools. The age group of 35 years and over has the highest likelihood of being enrolled in private schools, with 16 (100.0% in the age bracket) enrolled. Conversely, the age group of 10 to 14 year olds has the lowest likelihood of being enrolled in a private school, with 18 (100.0% in the age bracket) attending a public institution.
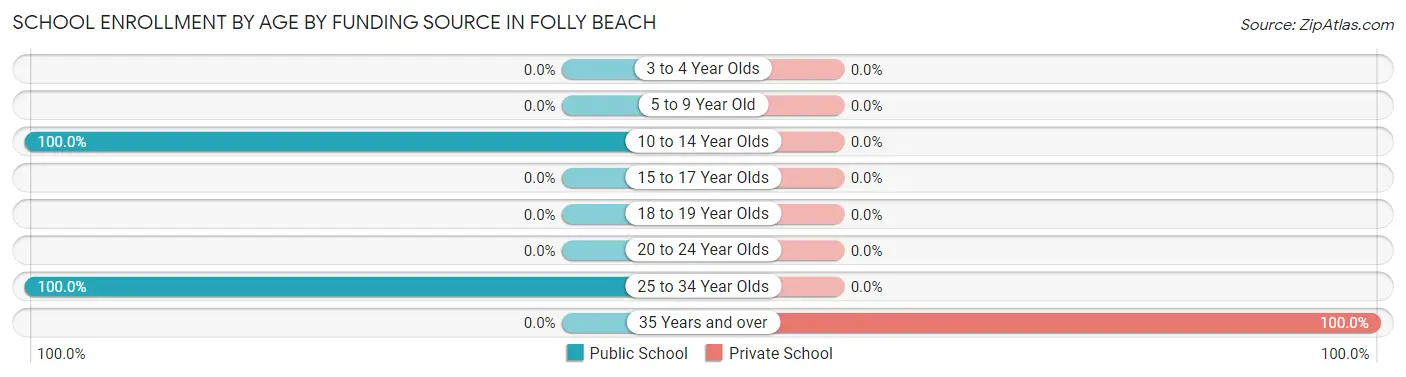
| Age Bracket | Public School | Private School |
| 3 to 4 Year Olds | 0 (0.0%) | 0 (0.0%) |
| 5 to 9 Year Old | 0 (0.0%) | 0 (0.0%) |
| 10 to 14 Year Olds | 18 (100.0%) | 0 (0.0%) |
| 15 to 17 Year Olds | 0 (0.0%) | 0 (0.0%) |
| 18 to 19 Year Olds | 0 (0.0%) | 0 (0.0%) |
| 20 to 24 Year Olds | 0 (0.0%) | 0 (0.0%) |
| 25 to 34 Year Olds | 6 (100.0%) | 0 (0.0%) |
| 35 Years and over | 0 (0.0%) | 16 (100.0%) |
| Total | 24 (60.0%) | 16 (40.0%) |
Educational Attainment by Field of Study in Folly Beach
Business (170 | 34.8%), liberal arts & history (63 | 12.9%), bio, nature & agricultural (54 | 11.0%), science & technology (43 | 8.8%), and literature & languages (37 | 7.6%) are the most common fields of study among 489 individuals in Folly Beach who have obtained a bachelor's degree or higher.
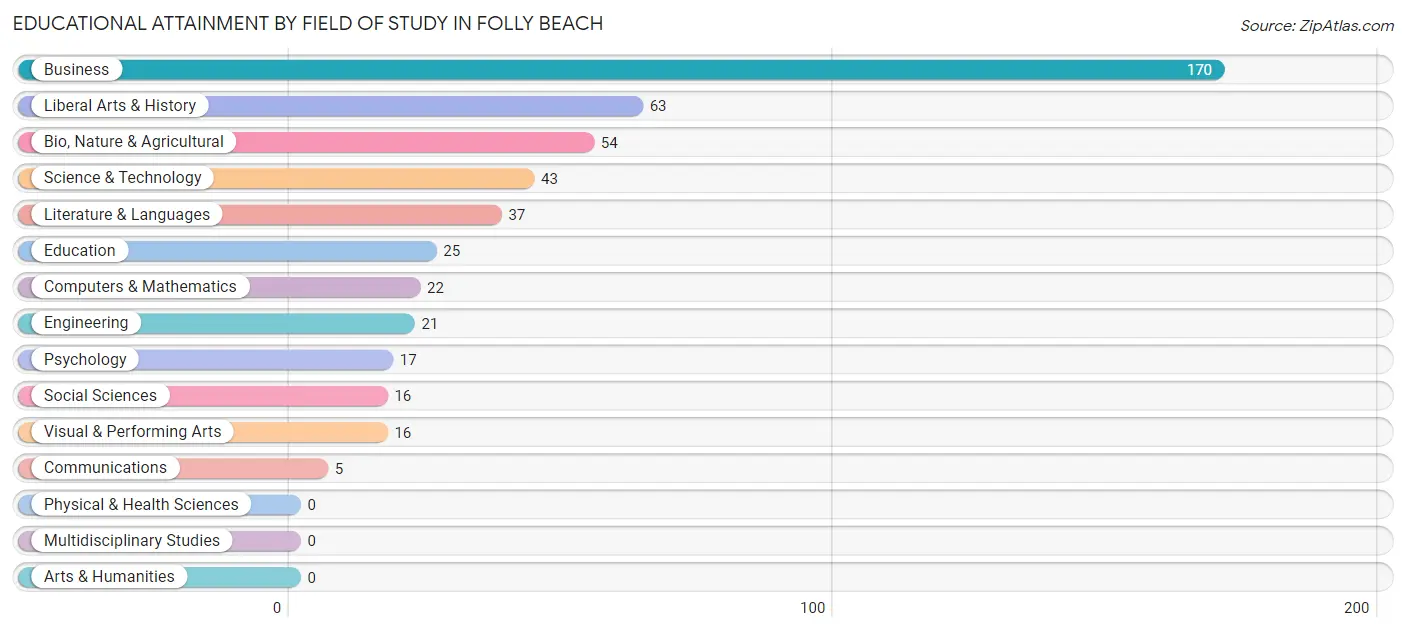
| Field of Study | # Graduates | % Graduates |
| Computers & Mathematics | 22 | 4.5% |
| Bio, Nature & Agricultural | 54 | 11.0% |
| Physical & Health Sciences | 0 | 0.0% |
| Psychology | 17 | 3.5% |
| Social Sciences | 16 | 3.3% |
| Engineering | 21 | 4.3% |
| Multidisciplinary Studies | 0 | 0.0% |
| Science & Technology | 43 | 8.8% |
| Business | 170 | 34.8% |
| Education | 25 | 5.1% |
| Literature & Languages | 37 | 7.6% |
| Liberal Arts & History | 63 | 12.9% |
| Visual & Performing Arts | 16 | 3.3% |
| Communications | 5 | 1.0% |
| Arts & Humanities | 0 | 0.0% |
| Total | 489 | 100.0% |
Transportation & Commute in Folly Beach
Vehicle Availability by Sex in Folly Beach
The most prevalent vehicle ownership categories in Folly Beach are males with 1 vehicle (167, accounting for 57.4%) and females with 1 vehicle (45, making up 83.9%).
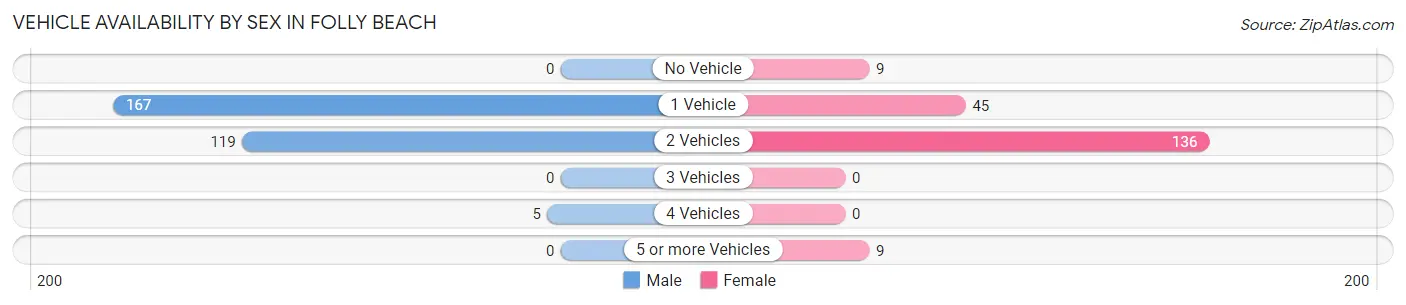
| Vehicles Available | Male | Female |
| No Vehicle | 0 (0.0%) | 9 (4.5%) |
| 1 Vehicle | 167 (57.4%) | 45 (22.6%) |
| 2 Vehicles | 119 (40.9%) | 136 (68.3%) |
| 3 Vehicles | 0 (0.0%) | 0 (0.0%) |
| 4 Vehicles | 5 (1.7%) | 0 (0.0%) |
| 5 or more Vehicles | 0 (0.0%) | 9 (4.5%) |
| Total | 291 (100.0%) | 199 (100.0%) |
Commute Time in Folly Beach
The most frequently occuring commute durations in Folly Beach are 30 to 34 minutes (124 commuters, 35.4%), 20 to 24 minutes (59 commuters, 16.9%), and 35 to 39 minutes (52 commuters, 14.9%).
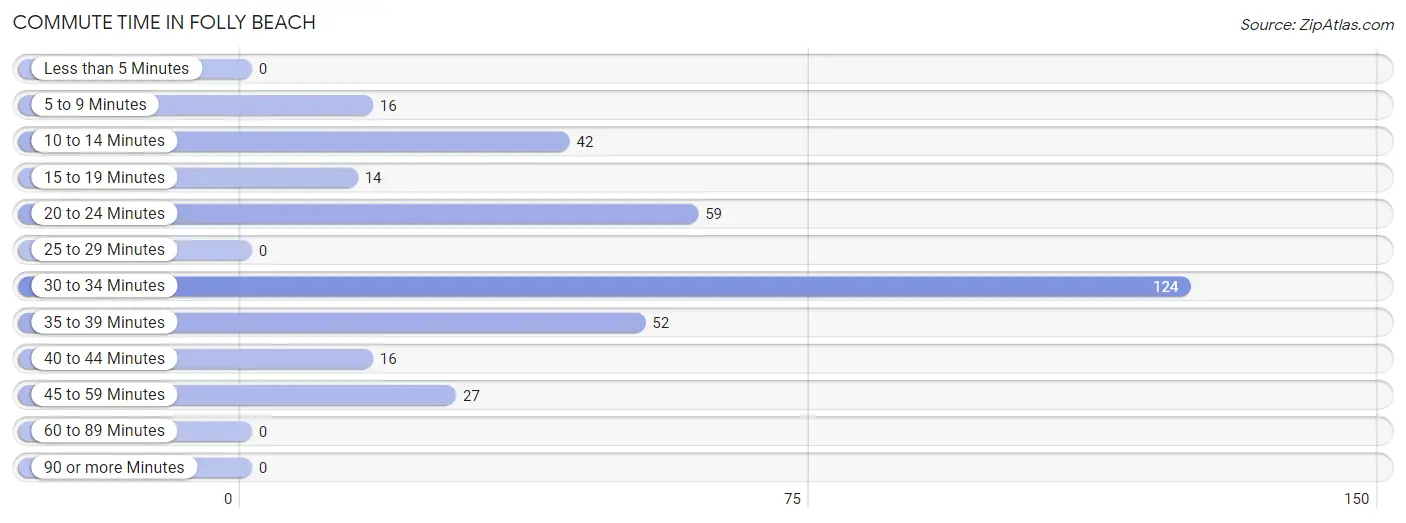
| Commute Time | # Commuters | % Commuters |
| Less than 5 Minutes | 0 | 0.0% |
| 5 to 9 Minutes | 16 | 4.6% |
| 10 to 14 Minutes | 42 | 12.0% |
| 15 to 19 Minutes | 14 | 4.0% |
| 20 to 24 Minutes | 59 | 16.9% |
| 25 to 29 Minutes | 0 | 0.0% |
| 30 to 34 Minutes | 124 | 35.4% |
| 35 to 39 Minutes | 52 | 14.9% |
| 40 to 44 Minutes | 16 | 4.6% |
| 45 to 59 Minutes | 27 | 7.7% |
| 60 to 89 Minutes | 0 | 0.0% |
| 90 or more Minutes | 0 | 0.0% |
Commute Time by Sex in Folly Beach
The most common commute times in Folly Beach are 30 to 34 minutes (112 commuters, 61.5%) for males and 20 to 24 minutes (59 commuters, 35.1%) for females.
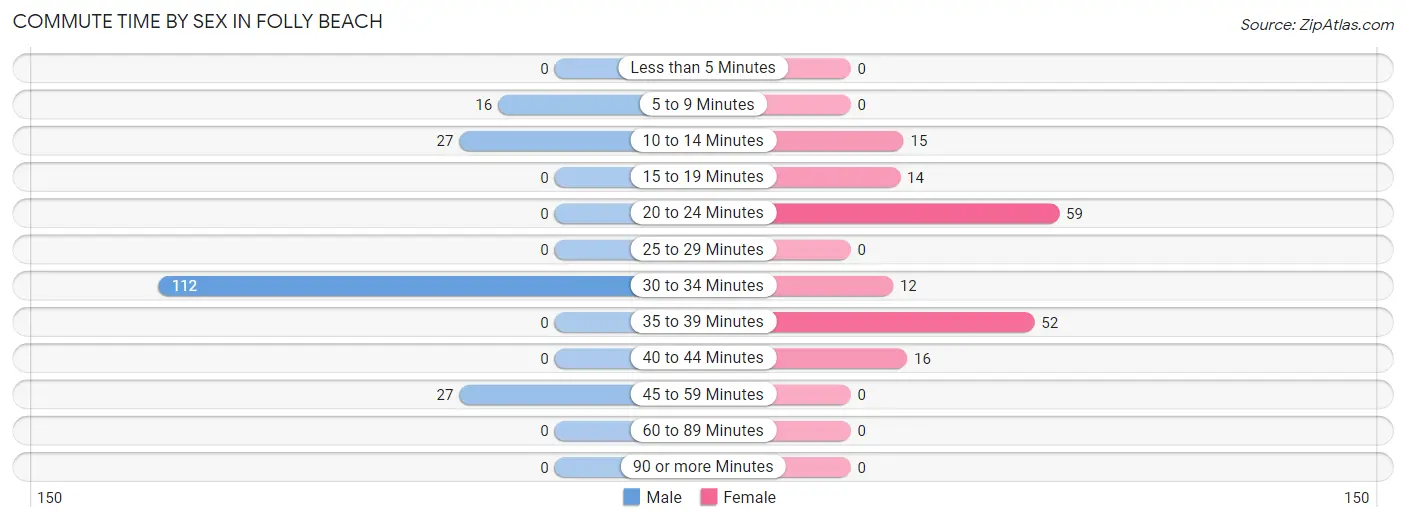
| Commute Time | Male | Female |
| Less than 5 Minutes | 0 (0.0%) | 0 (0.0%) |
| 5 to 9 Minutes | 16 (8.8%) | 0 (0.0%) |
| 10 to 14 Minutes | 27 (14.8%) | 15 (8.9%) |
| 15 to 19 Minutes | 0 (0.0%) | 14 (8.3%) |
| 20 to 24 Minutes | 0 (0.0%) | 59 (35.1%) |
| 25 to 29 Minutes | 0 (0.0%) | 0 (0.0%) |
| 30 to 34 Minutes | 112 (61.5%) | 12 (7.1%) |
| 35 to 39 Minutes | 0 (0.0%) | 52 (30.9%) |
| 40 to 44 Minutes | 0 (0.0%) | 16 (9.5%) |
| 45 to 59 Minutes | 27 (14.8%) | 0 (0.0%) |
| 60 to 89 Minutes | 0 (0.0%) | 0 (0.0%) |
| 90 or more Minutes | 0 (0.0%) | 0 (0.0%) |
Time of Departure to Work by Sex in Folly Beach
The most frequent times of departure to work in Folly Beach are 7:30 AM to 7:59 AM (43, 23.6%) for males and 8:30 AM to 8:59 AM (33, 19.6%) for females.
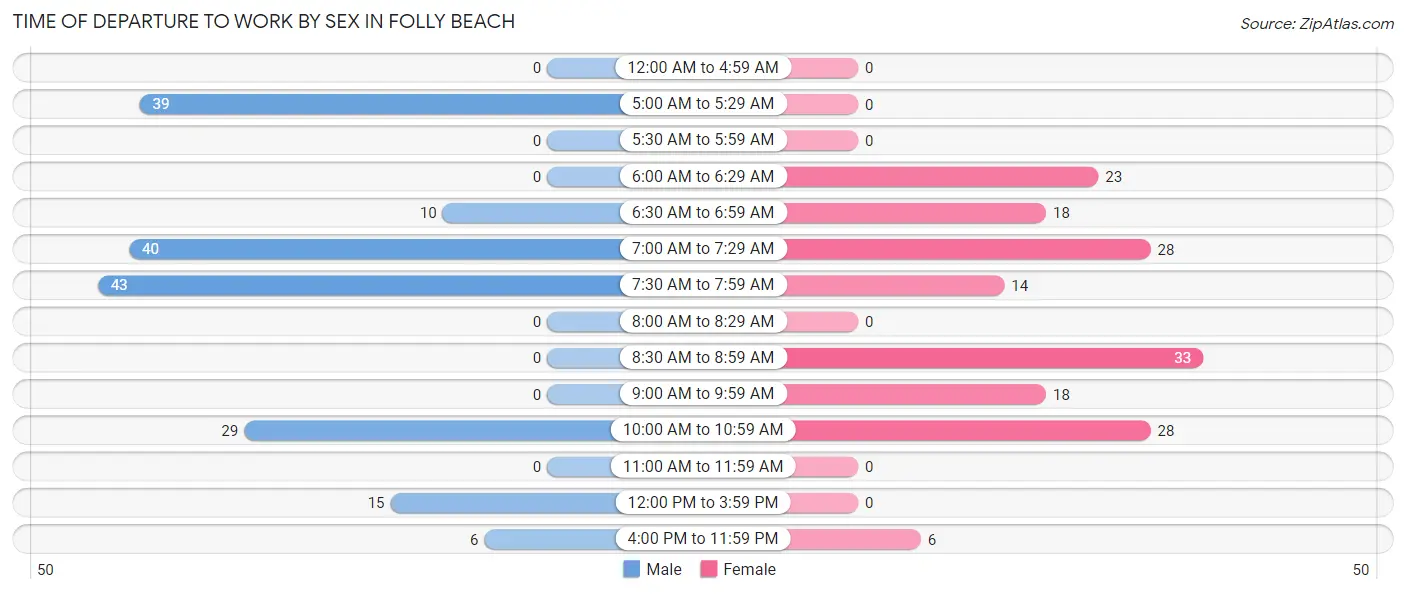
| Time of Departure | Male | Female |
| 12:00 AM to 4:59 AM | 0 (0.0%) | 0 (0.0%) |
| 5:00 AM to 5:29 AM | 39 (21.4%) | 0 (0.0%) |
| 5:30 AM to 5:59 AM | 0 (0.0%) | 0 (0.0%) |
| 6:00 AM to 6:29 AM | 0 (0.0%) | 23 (13.7%) |
| 6:30 AM to 6:59 AM | 10 (5.5%) | 18 (10.7%) |
| 7:00 AM to 7:29 AM | 40 (22.0%) | 28 (16.7%) |
| 7:30 AM to 7:59 AM | 43 (23.6%) | 14 (8.3%) |
| 8:00 AM to 8:29 AM | 0 (0.0%) | 0 (0.0%) |
| 8:30 AM to 8:59 AM | 0 (0.0%) | 33 (19.6%) |
| 9:00 AM to 9:59 AM | 0 (0.0%) | 18 (10.7%) |
| 10:00 AM to 10:59 AM | 29 (15.9%) | 28 (16.7%) |
| 11:00 AM to 11:59 AM | 0 (0.0%) | 0 (0.0%) |
| 12:00 PM to 3:59 PM | 15 (8.2%) | 0 (0.0%) |
| 4:00 PM to 11:59 PM | 6 (3.3%) | 6 (3.6%) |
| Total | 182 (100.0%) | 168 (100.0%) |
Housing Occupancy in Folly Beach
Occupancy by Ownership in Folly Beach
Of the total 641 dwellings in Folly Beach, owner-occupied units account for 481 (75.0%), while renter-occupied units make up 160 (25.0%).
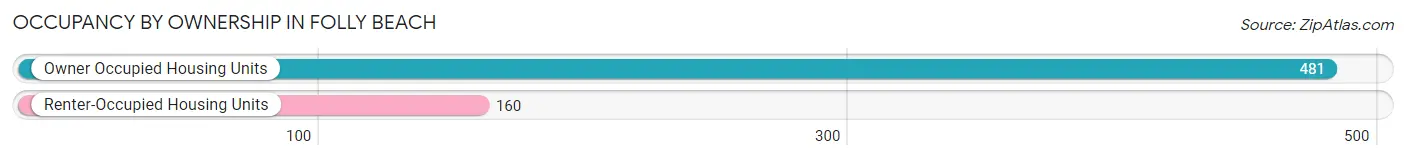
| Occupancy | # Housing Units | % Housing Units |
| Owner Occupied Housing Units | 481 | 75.0% |
| Renter-Occupied Housing Units | 160 | 25.0% |
| Total Occupied Housing Units | 641 | 100.0% |
Occupancy by Household Size in Folly Beach
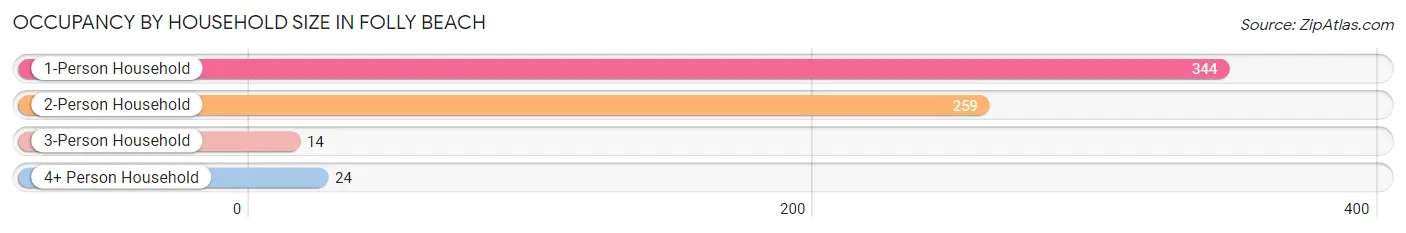
| Household Size | # Housing Units | % Housing Units |
| 1-Person Household | 344 | 53.7% |
| 2-Person Household | 259 | 40.4% |
| 3-Person Household | 14 | 2.2% |
| 4+ Person Household | 24 | 3.7% |
| Total Housing Units | 641 | 100.0% |
Occupancy by Ownership by Household Size in Folly Beach
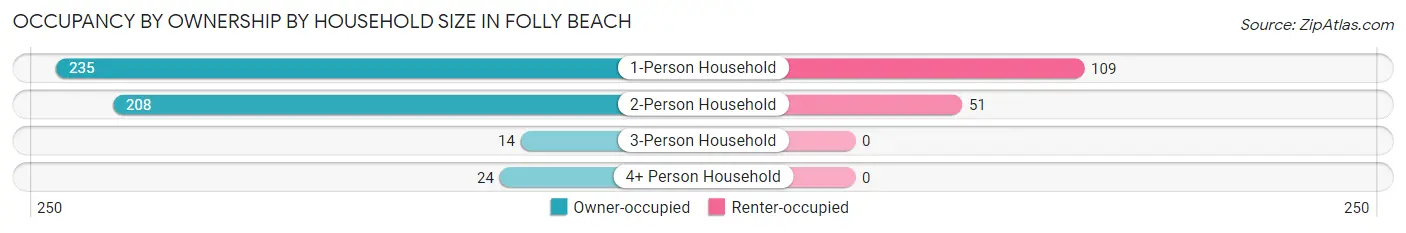
| Household Size | Owner-occupied | Renter-occupied |
| 1-Person Household | 235 (68.3%) | 109 (31.7%) |
| 2-Person Household | 208 (80.3%) | 51 (19.7%) |
| 3-Person Household | 14 (100.0%) | 0 (0.0%) |
| 4+ Person Household | 24 (100.0%) | 0 (0.0%) |
| Total Housing Units | 481 (75.0%) | 160 (25.0%) |
Occupancy by Educational Attainment in Folly Beach
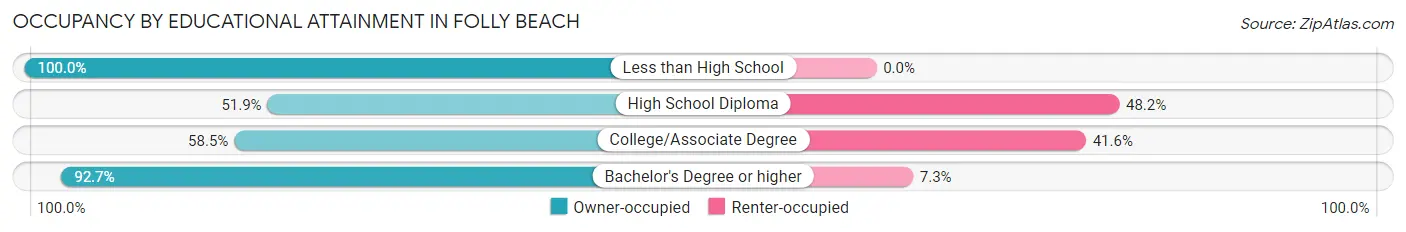
| Household Size | Owner-occupied | Renter-occupied |
| Less than High School | 24 (100.0%) | 0 (0.0%) |
| High School Diploma | 56 (51.8%) | 52 (48.1%) |
| College/Associate Degree | 121 (58.5%) | 86 (41.5%) |
| Bachelor's Degree or higher | 280 (92.7%) | 22 (7.3%) |
Occupancy by Age of Householder in Folly Beach
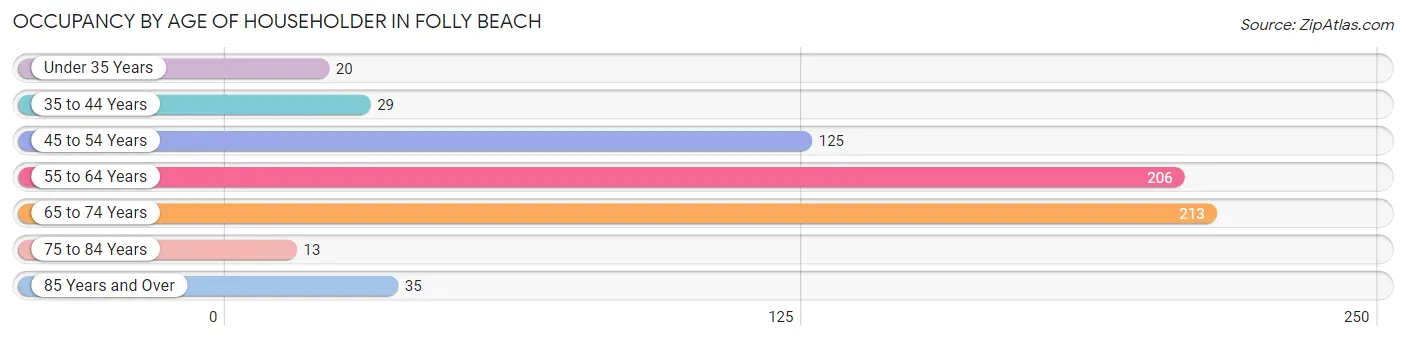
| Age Bracket | # Households | % Households |
| Under 35 Years | 20 | 3.1% |
| 35 to 44 Years | 29 | 4.5% |
| 45 to 54 Years | 125 | 19.5% |
| 55 to 64 Years | 206 | 32.1% |
| 65 to 74 Years | 213 | 33.2% |
| 75 to 84 Years | 13 | 2.0% |
| 85 Years and Over | 35 | 5.5% |
| Total | 641 | 100.0% |
Housing Finances in Folly Beach
Median Income by Occupancy in Folly Beach
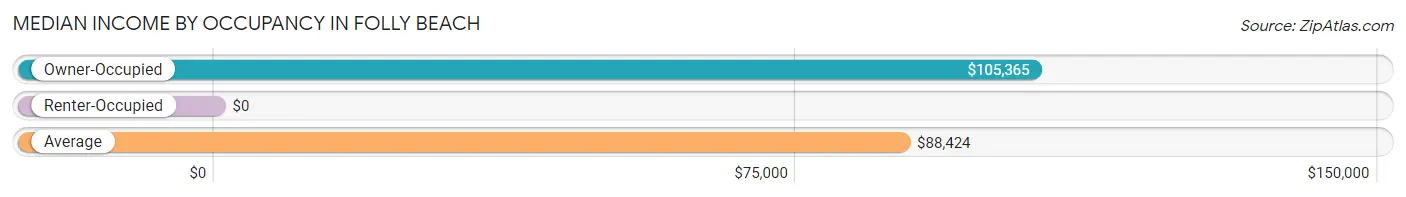
| Occupancy Type | # Households | Median Income |
| Owner-Occupied | 481 (75.0%) | $105,365 |
| Renter-Occupied | 160 (25.0%) | $0 |
| Average | 641 (100.0%) | $88,424 |
Occupancy by Householder Income Bracket in Folly Beach
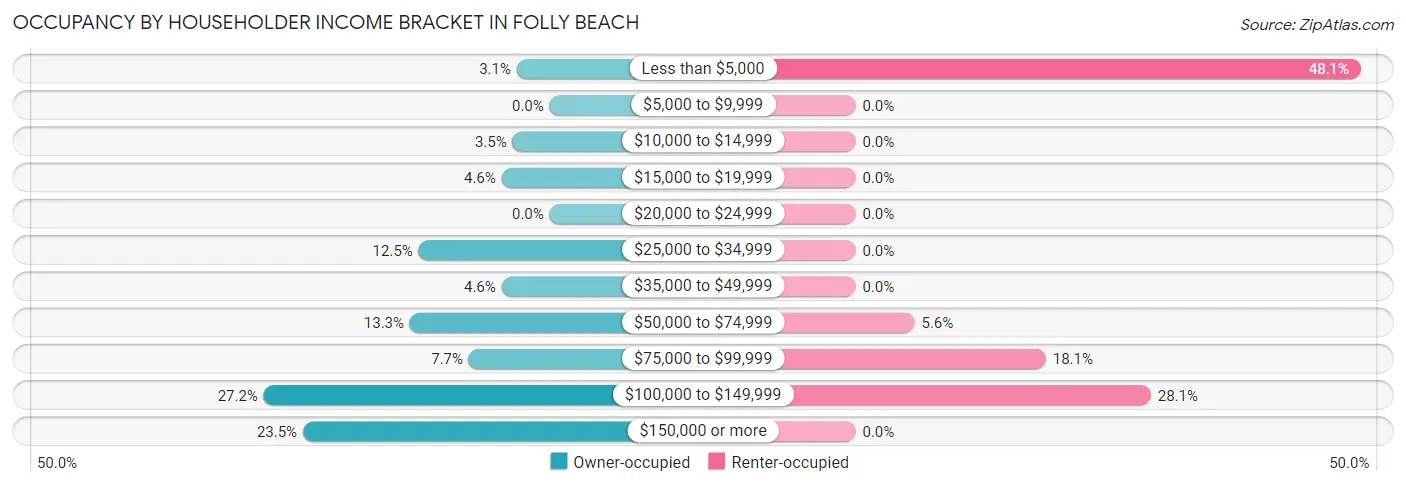
| Income Bracket | Owner-occupied | Renter-occupied |
| Less than $5,000 | 15 (3.1%) | 77 (48.1%) |
| $5,000 to $9,999 | 0 (0.0%) | 0 (0.0%) |
| $10,000 to $14,999 | 17 (3.5%) | 0 (0.0%) |
| $15,000 to $19,999 | 22 (4.6%) | 0 (0.0%) |
| $20,000 to $24,999 | 0 (0.0%) | 0 (0.0%) |
| $25,000 to $34,999 | 60 (12.5%) | 0 (0.0%) |
| $35,000 to $49,999 | 22 (4.6%) | 0 (0.0%) |
| $50,000 to $74,999 | 64 (13.3%) | 9 (5.6%) |
| $75,000 to $99,999 | 37 (7.7%) | 29 (18.1%) |
| $100,000 to $149,999 | 131 (27.2%) | 45 (28.1%) |
| $150,000 or more | 113 (23.5%) | 0 (0.0%) |
| Total | 481 (100.0%) | 160 (100.0%) |
Monthly Housing Cost Tiers in Folly Beach
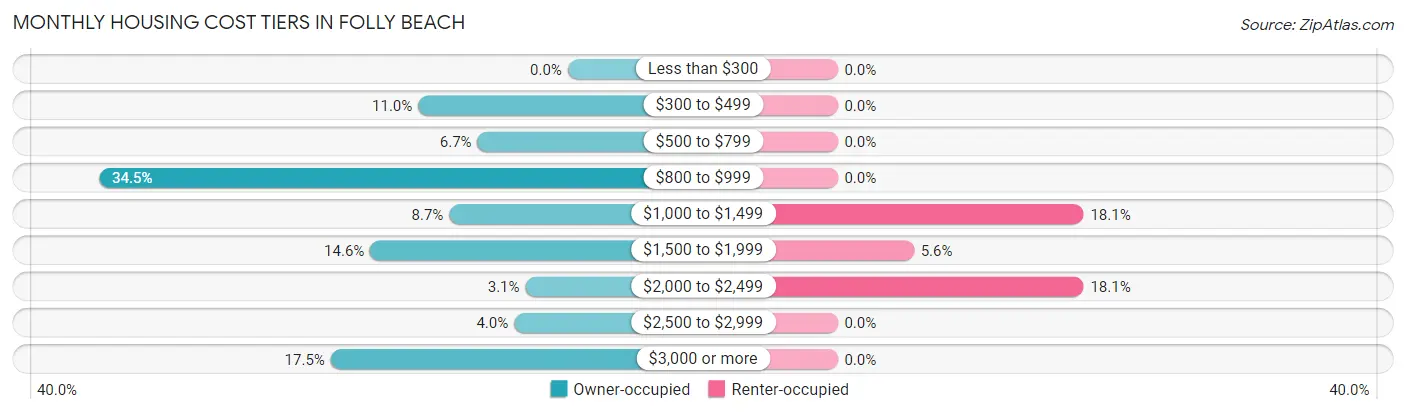
| Monthly Cost | Owner-occupied | Renter-occupied |
| Less than $300 | 0 (0.0%) | 0 (0.0%) |
| $300 to $499 | 53 (11.0%) | 0 (0.0%) |
| $500 to $799 | 32 (6.7%) | 0 (0.0%) |
| $800 to $999 | 166 (34.5%) | 0 (0.0%) |
| $1,000 to $1,499 | 42 (8.7%) | 29 (18.1%) |
| $1,500 to $1,999 | 70 (14.5%) | 9 (5.6%) |
| $2,000 to $2,499 | 15 (3.1%) | 29 (18.1%) |
| $2,500 to $2,999 | 19 (4.0%) | 0 (0.0%) |
| $3,000 or more | 84 (17.5%) | 0 (0.0%) |
| Total | 481 (100.0%) | 160 (100.0%) |
Physical Housing Characteristics in Folly Beach
Housing Structures in Folly Beach
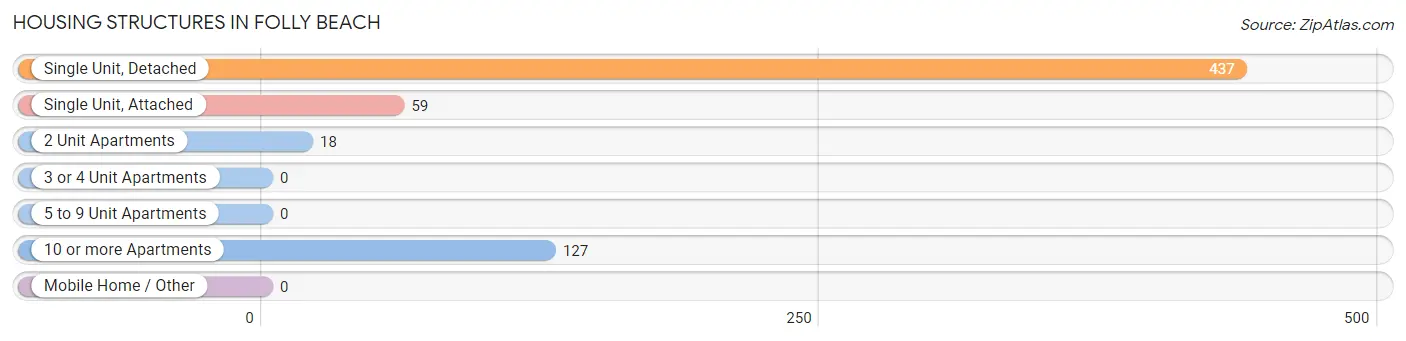
| Structure Type | # Housing Units | % Housing Units |
| Single Unit, Detached | 437 | 68.2% |
| Single Unit, Attached | 59 | 9.2% |
| 2 Unit Apartments | 18 | 2.8% |
| 3 or 4 Unit Apartments | 0 | 0.0% |
| 5 to 9 Unit Apartments | 0 | 0.0% |
| 10 or more Apartments | 127 | 19.8% |
| Mobile Home / Other | 0 | 0.0% |
| Total | 641 | 100.0% |
Housing Structures by Occupancy in Folly Beach
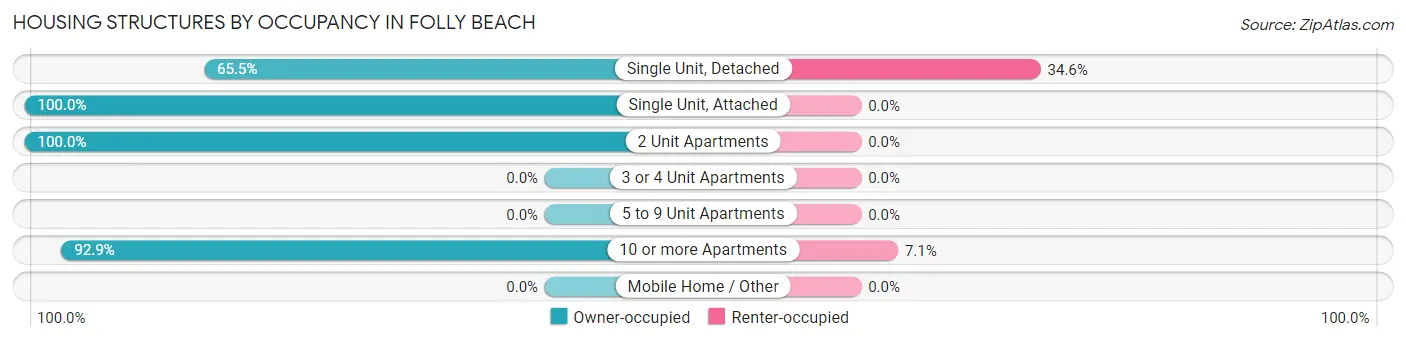
| Structure Type | Owner-occupied | Renter-occupied |
| Single Unit, Detached | 286 (65.4%) | 151 (34.5%) |
| Single Unit, Attached | 59 (100.0%) | 0 (0.0%) |
| 2 Unit Apartments | 18 (100.0%) | 0 (0.0%) |
| 3 or 4 Unit Apartments | 0 (0.0%) | 0 (0.0%) |
| 5 to 9 Unit Apartments | 0 (0.0%) | 0 (0.0%) |
| 10 or more Apartments | 118 (92.9%) | 9 (7.1%) |
| Mobile Home / Other | 0 (0.0%) | 0 (0.0%) |
| Total | 481 (75.0%) | 160 (25.0%) |
Housing Structures by Number of Rooms in Folly Beach
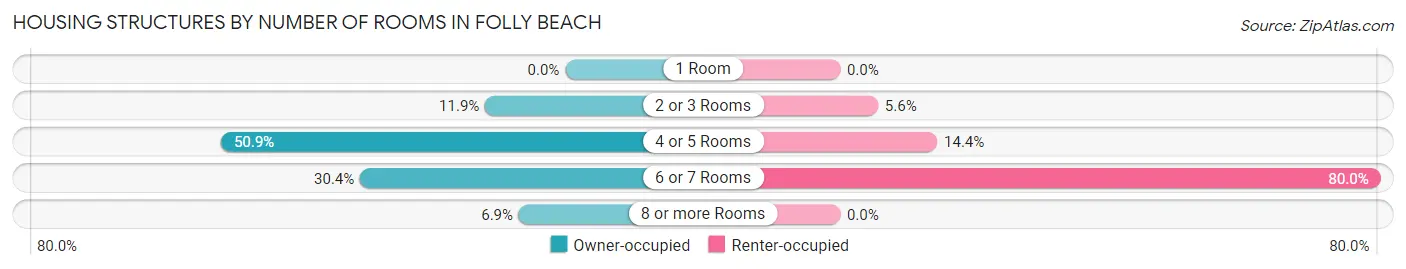
| Number of Rooms | Owner-occupied | Renter-occupied |
| 1 Room | 0 (0.0%) | 0 (0.0%) |
| 2 or 3 Rooms | 57 (11.8%) | 9 (5.6%) |
| 4 or 5 Rooms | 245 (50.9%) | 23 (14.4%) |
| 6 or 7 Rooms | 146 (30.3%) | 128 (80.0%) |
| 8 or more Rooms | 33 (6.9%) | 0 (0.0%) |
| Total | 481 (100.0%) | 160 (100.0%) |
Housing Structure by Heating Type in Folly Beach
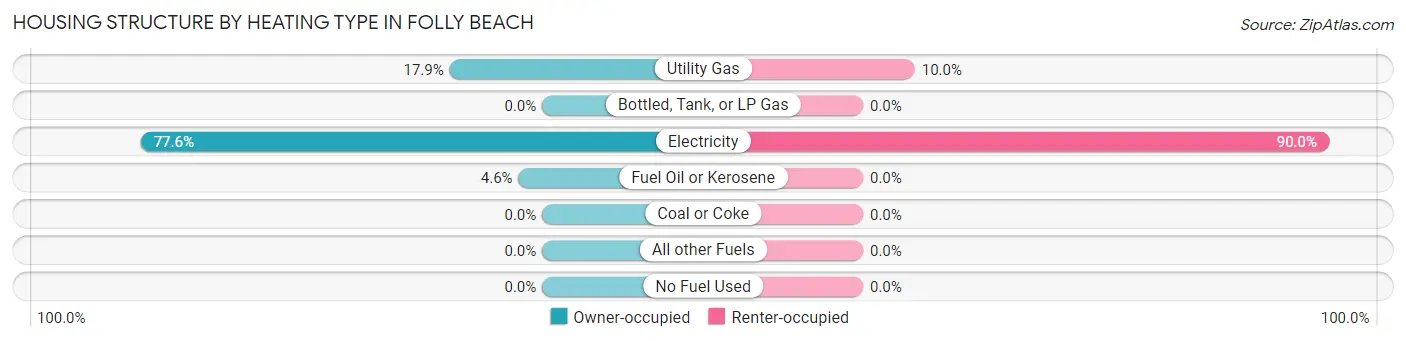
| Heating Type | Owner-occupied | Renter-occupied |
| Utility Gas | 86 (17.9%) | 16 (10.0%) |
| Bottled, Tank, or LP Gas | 0 (0.0%) | 0 (0.0%) |
| Electricity | 373 (77.5%) | 144 (90.0%) |
| Fuel Oil or Kerosene | 22 (4.6%) | 0 (0.0%) |
| Coal or Coke | 0 (0.0%) | 0 (0.0%) |
| All other Fuels | 0 (0.0%) | 0 (0.0%) |
| No Fuel Used | 0 (0.0%) | 0 (0.0%) |
| Total | 481 (100.0%) | 160 (100.0%) |
Household Vehicle Usage in Folly Beach
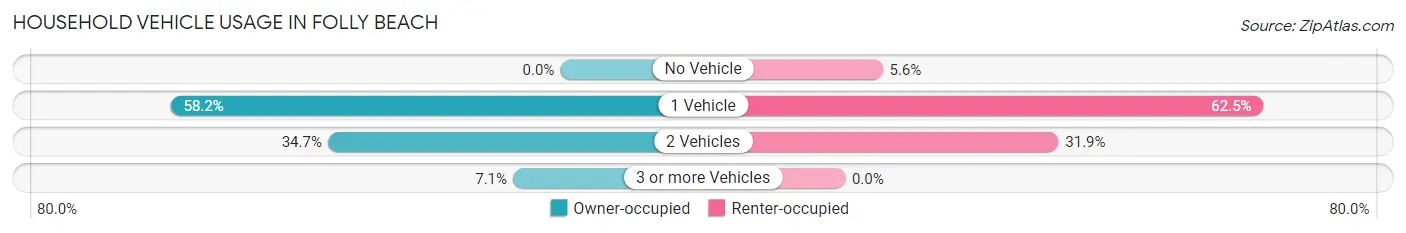
| Vehicles per Household | Owner-occupied | Renter-occupied |
| No Vehicle | 0 (0.0%) | 9 (5.6%) |
| 1 Vehicle | 280 (58.2%) | 100 (62.5%) |
| 2 Vehicles | 167 (34.7%) | 51 (31.9%) |
| 3 or more Vehicles | 34 (7.1%) | 0 (0.0%) |
| Total | 481 (100.0%) | 160 (100.0%) |
Real Estate & Mortgages in Folly Beach
Real Estate and Mortgage Overview in Folly Beach
| Characteristic | Without Mortgage | With Mortgage |
| Housing Units | 205 | 276 |
| Median Property Value | $809,800 | $0 |
| Median Household Income | - | - |
| Monthly Housing Costs | $841 | $84 |
| Real Estate Taxes | $2,638 | $0 |
Property Value by Mortgage Status in Folly Beach
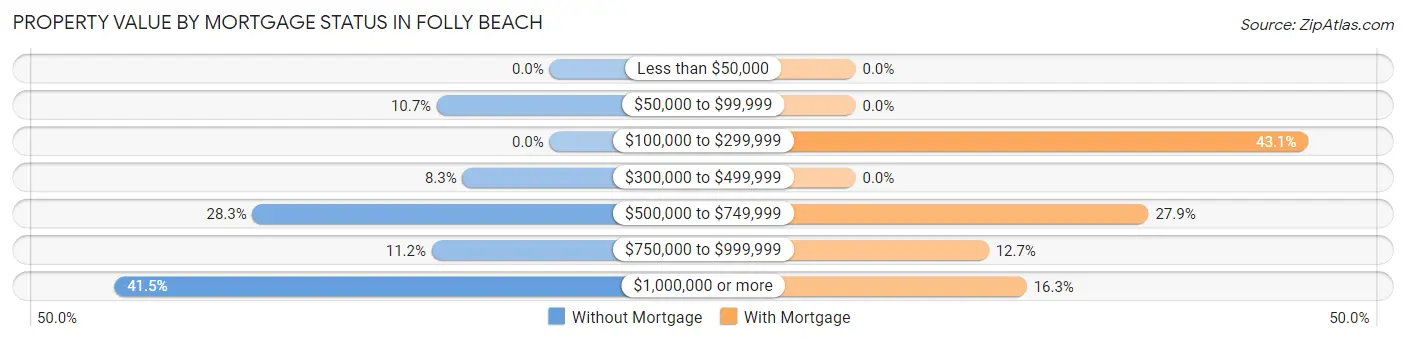
| Property Value | Without Mortgage | With Mortgage |
| Less than $50,000 | 0 (0.0%) | 0 (0.0%) |
| $50,000 to $99,999 | 22 (10.7%) | 0 (0.0%) |
| $100,000 to $299,999 | 0 (0.0%) | 119 (43.1%) |
| $300,000 to $499,999 | 17 (8.3%) | 0 (0.0%) |
| $500,000 to $749,999 | 58 (28.3%) | 77 (27.9%) |
| $750,000 to $999,999 | 23 (11.2%) | 35 (12.7%) |
| $1,000,000 or more | 85 (41.5%) | 45 (16.3%) |
| Total | 205 (100.0%) | 276 (100.0%) |
Household Income by Mortgage Status in Folly Beach
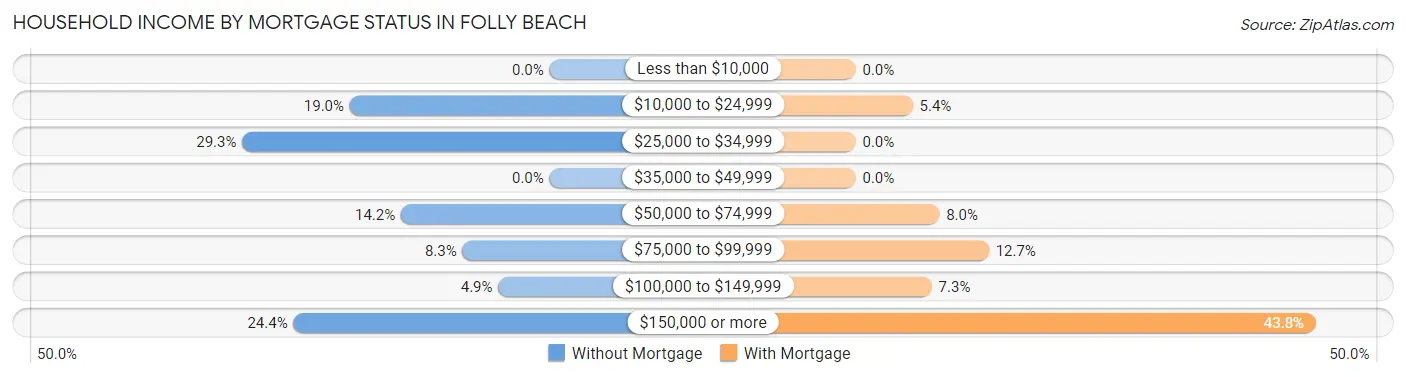
| Household Income | Without Mortgage | With Mortgage |
| Less than $10,000 | 0 (0.0%) | 0 (0.0%) |
| $10,000 to $24,999 | 39 (19.0%) | 15 (5.4%) |
| $25,000 to $34,999 | 60 (29.3%) | 0 (0.0%) |
| $35,000 to $49,999 | 0 (0.0%) | 0 (0.0%) |
| $50,000 to $74,999 | 29 (14.1%) | 22 (8.0%) |
| $75,000 to $99,999 | 17 (8.3%) | 35 (12.7%) |
| $100,000 to $149,999 | 10 (4.9%) | 20 (7.2%) |
| $150,000 or more | 50 (24.4%) | 121 (43.8%) |
| Total | 205 (100.0%) | 276 (100.0%) |
Property Value to Household Income Ratio in Folly Beach
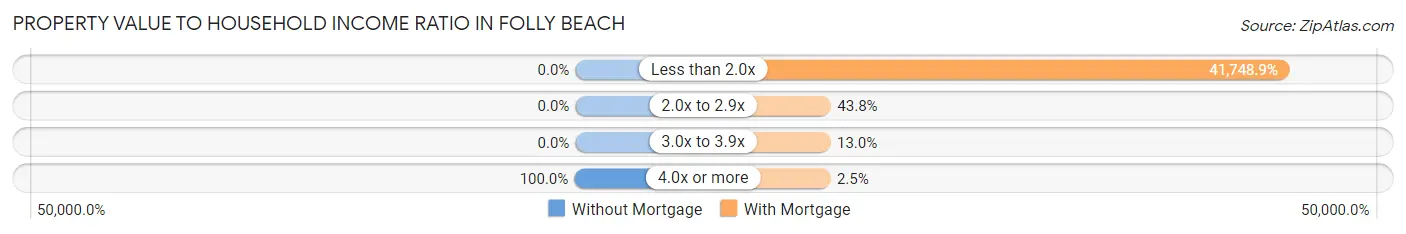
| Value-to-Income Ratio | Without Mortgage | With Mortgage |
| Less than 2.0x | 0 (0.0%) | 115,227 (41,748.9%) |
| 2.0x to 2.9x | 0 (0.0%) | 121 (43.8%) |
| 3.0x to 3.9x | 0 (0.0%) | 36 (13.0%) |
| 4.0x or more | 205 (100.0%) | 7 (2.5%) |
| Total | 205 (100.0%) | 276 (100.0%) |
Real Estate Taxes by Mortgage Status in Folly Beach
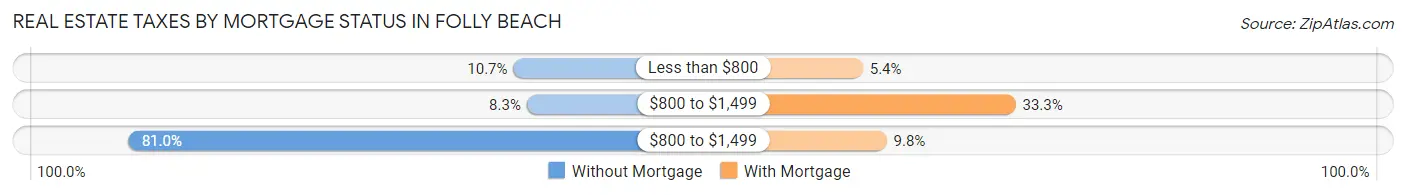
| Property Taxes | Without Mortgage | With Mortgage |
| Less than $800 | 22 (10.7%) | 15 (5.4%) |
| $800 to $1,499 | 17 (8.3%) | 92 (33.3%) |
| $800 to $1,499 | 166 (81.0%) | 27 (9.8%) |
| Total | 205 (100.0%) | 276 (100.0%) |
Health & Disability in Folly Beach
Health Insurance Coverage by Age in Folly Beach
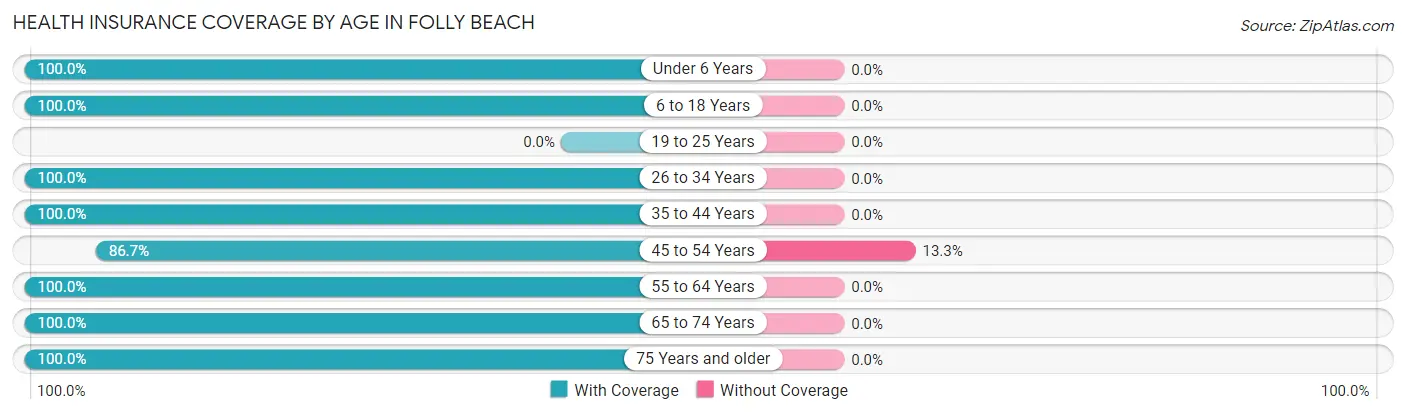
| Age Bracket | With Coverage | Without Coverage |
| Under 6 Years | 15 (100.0%) | 0 (0.0%) |
| 6 to 18 Years | 18 (100.0%) | 0 (0.0%) |
| 19 to 25 Years | 0 (0.0%) | 0 (0.0%) |
| 26 to 34 Years | 43 (100.0%) | 0 (0.0%) |
| 35 to 44 Years | 85 (100.0%) | 0 (0.0%) |
| 45 to 54 Years | 137 (86.7%) | 21 (13.3%) |
| 55 to 64 Years | 287 (100.0%) | 0 (0.0%) |
| 65 to 74 Years | 332 (100.0%) | 0 (0.0%) |
| 75 Years and older | 82 (100.0%) | 0 (0.0%) |
| Total | 999 (97.9%) | 21 (2.1%) |
Health Insurance Coverage by Citizenship Status in Folly Beach
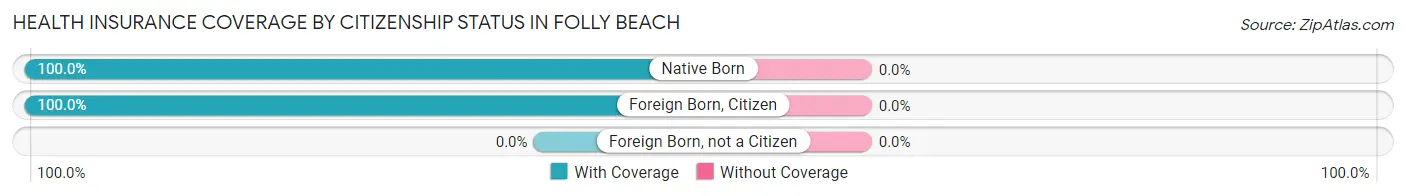
| Citizenship Status | With Coverage | Without Coverage |
| Native Born | 15 (100.0%) | 0 (0.0%) |
| Foreign Born, Citizen | 18 (100.0%) | 0 (0.0%) |
| Foreign Born, not a Citizen | 0 (0.0%) | 0 (0.0%) |
Health Insurance Coverage by Household Income in Folly Beach
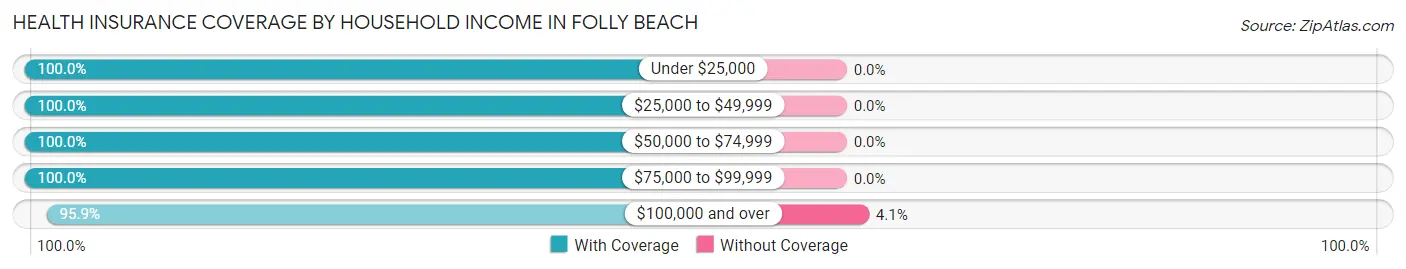
| Household Income | With Coverage | Without Coverage |
| Under $25,000 | 170 (100.0%) | 0 (0.0%) |
| $25,000 to $49,999 | 82 (100.0%) | 0 (0.0%) |
| $50,000 to $74,999 | 108 (100.0%) | 0 (0.0%) |
| $75,000 to $99,999 | 153 (100.0%) | 0 (0.0%) |
| $100,000 and over | 486 (95.9%) | 21 (4.1%) |
Public vs Private Health Insurance Coverage by Age in Folly Beach
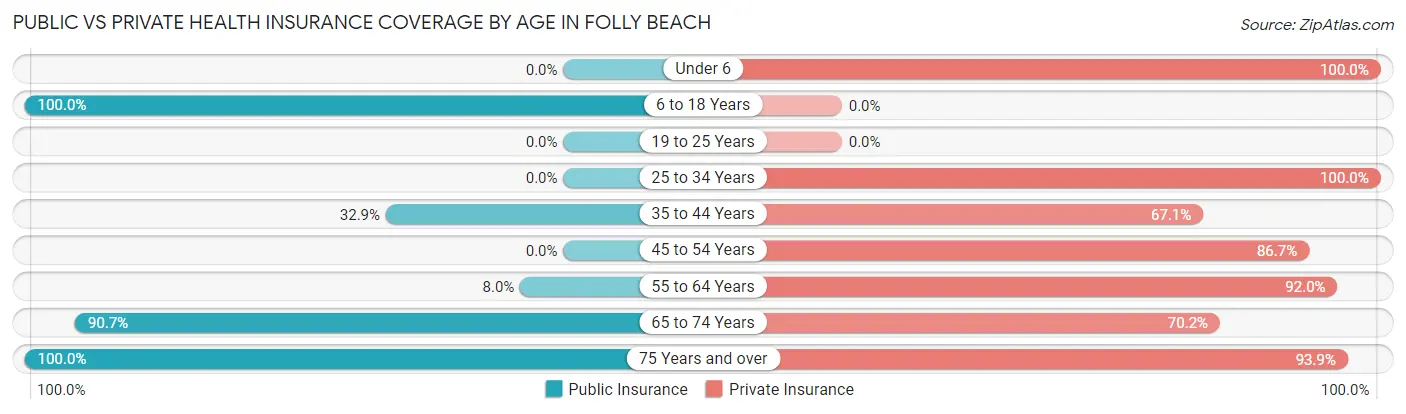
| Age Bracket | Public Insurance | Private Insurance |
| Under 6 | 0 (0.0%) | 15 (100.0%) |
| 6 to 18 Years | 18 (100.0%) | 0 (0.0%) |
| 19 to 25 Years | 0 (0.0%) | 0 (0.0%) |
| 25 to 34 Years | 0 (0.0%) | 43 (100.0%) |
| 35 to 44 Years | 28 (32.9%) | 57 (67.1%) |
| 45 to 54 Years | 0 (0.0%) | 137 (86.7%) |
| 55 to 64 Years | 23 (8.0%) | 264 (92.0%) |
| 65 to 74 Years | 301 (90.7%) | 233 (70.2%) |
| 75 Years and over | 82 (100.0%) | 77 (93.9%) |
| Total | 452 (44.3%) | 826 (81.0%) |
Disability Status by Sex by Age in Folly Beach
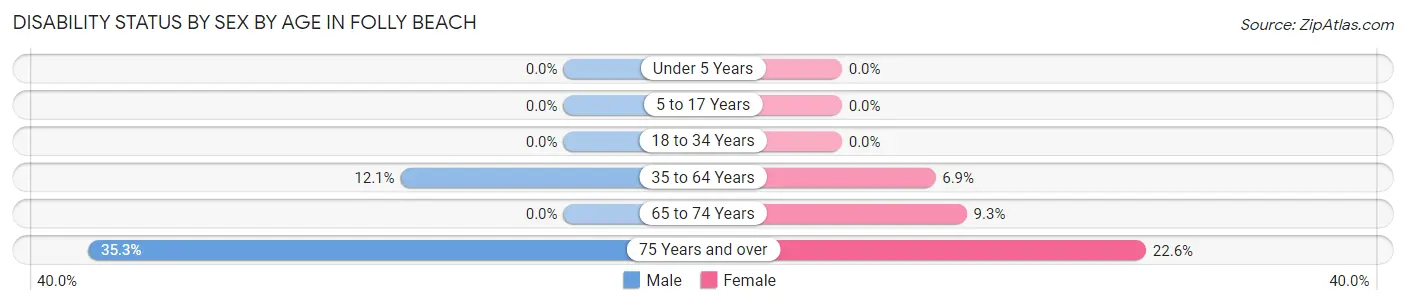
| Age Bracket | Male | Female |
| Under 5 Years | 0 (0.0%) | 0 (0.0%) |
| 5 to 17 Years | 0 (0.0%) | 0 (0.0%) |
| 18 to 34 Years | 0 (0.0%) | 0 (0.0%) |
| 35 to 64 Years | 38 (12.1%) | 15 (6.9%) |
| 65 to 74 Years | 0 (0.0%) | 19 (9.3%) |
| 75 Years and over | 18 (35.3%) | 7 (22.6%) |
Disability Class by Sex by Age in Folly Beach
Disability Class: Hearing Difficulty
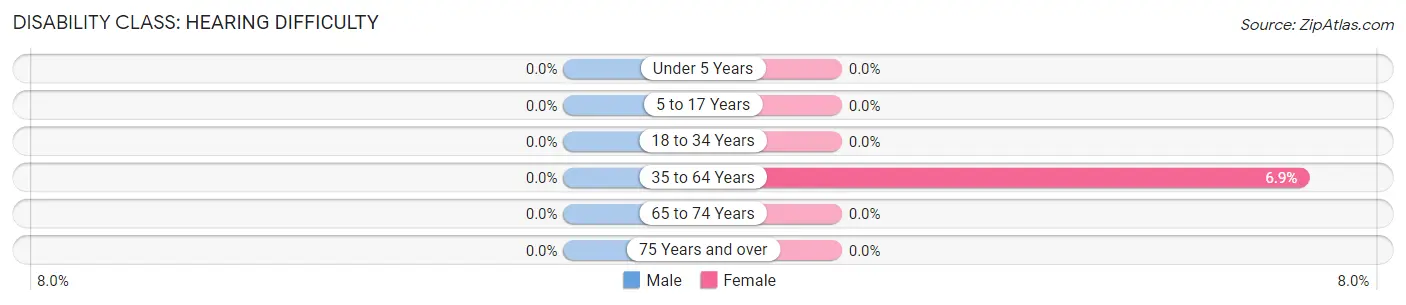
| Age Bracket | Male | Female |
| Under 5 Years | 0 (0.0%) | 0 (0.0%) |
| 5 to 17 Years | 0 (0.0%) | 0 (0.0%) |
| 18 to 34 Years | 0 (0.0%) | 0 (0.0%) |
| 35 to 64 Years | 0 (0.0%) | 15 (6.9%) |
| 65 to 74 Years | 0 (0.0%) | 0 (0.0%) |
| 75 Years and over | 0 (0.0%) | 0 (0.0%) |
Disability Class: Vision Difficulty
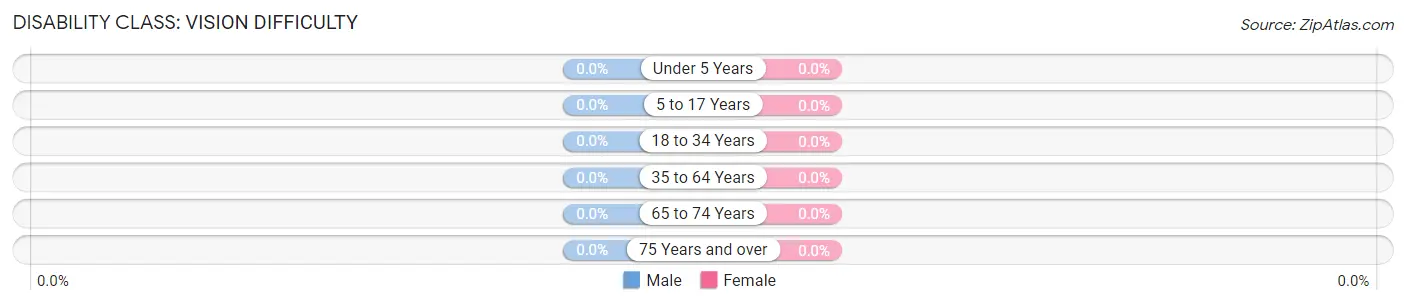
| Age Bracket | Male | Female |
| Under 5 Years | 0 (0.0%) | 0 (0.0%) |
| 5 to 17 Years | 0 (0.0%) | 0 (0.0%) |
| 18 to 34 Years | 0 (0.0%) | 0 (0.0%) |
| 35 to 64 Years | 0 (0.0%) | 0 (0.0%) |
| 65 to 74 Years | 0 (0.0%) | 0 (0.0%) |
| 75 Years and over | 0 (0.0%) | 0 (0.0%) |
Disability Class: Cognitive Difficulty
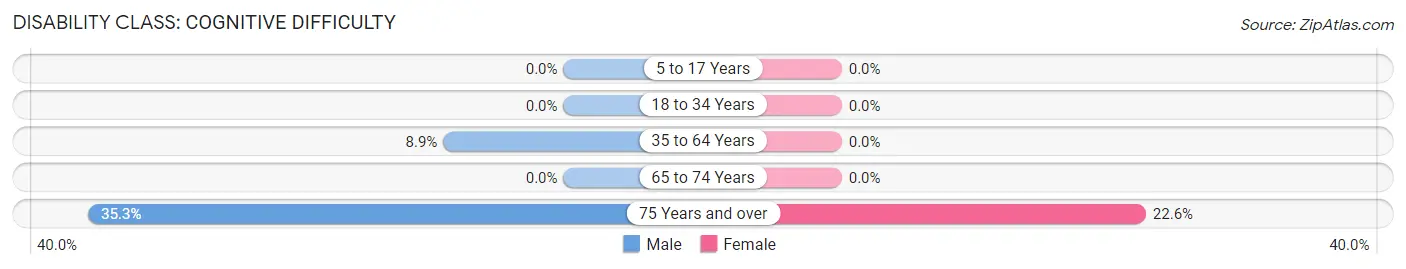
| Age Bracket | Male | Female |
| 5 to 17 Years | 0 (0.0%) | 0 (0.0%) |
| 18 to 34 Years | 0 (0.0%) | 0 (0.0%) |
| 35 to 64 Years | 28 (8.9%) | 0 (0.0%) |
| 65 to 74 Years | 0 (0.0%) | 0 (0.0%) |
| 75 Years and over | 18 (35.3%) | 7 (22.6%) |
Disability Class: Ambulatory Difficulty
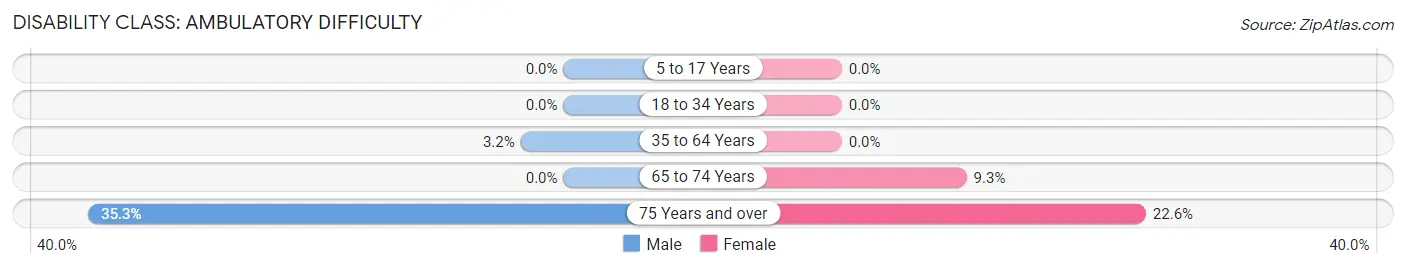
| Age Bracket | Male | Female |
| 5 to 17 Years | 0 (0.0%) | 0 (0.0%) |
| 18 to 34 Years | 0 (0.0%) | 0 (0.0%) |
| 35 to 64 Years | 10 (3.2%) | 0 (0.0%) |
| 65 to 74 Years | 0 (0.0%) | 19 (9.3%) |
| 75 Years and over | 18 (35.3%) | 7 (22.6%) |
Disability Class: Self-Care Difficulty
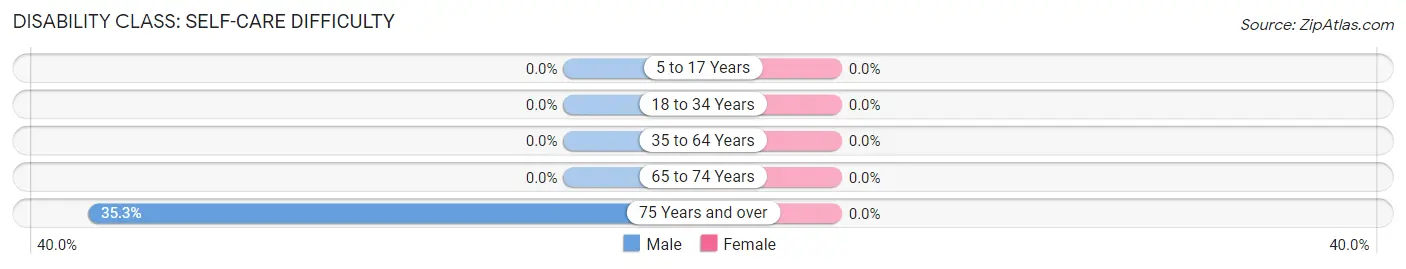
| Age Bracket | Male | Female |
| 5 to 17 Years | 0 (0.0%) | 0 (0.0%) |
| 18 to 34 Years | 0 (0.0%) | 0 (0.0%) |
| 35 to 64 Years | 0 (0.0%) | 0 (0.0%) |
| 65 to 74 Years | 0 (0.0%) | 0 (0.0%) |
| 75 Years and over | 18 (35.3%) | 0 (0.0%) |
Technology Access in Folly Beach
Computing Device Access in Folly Beach
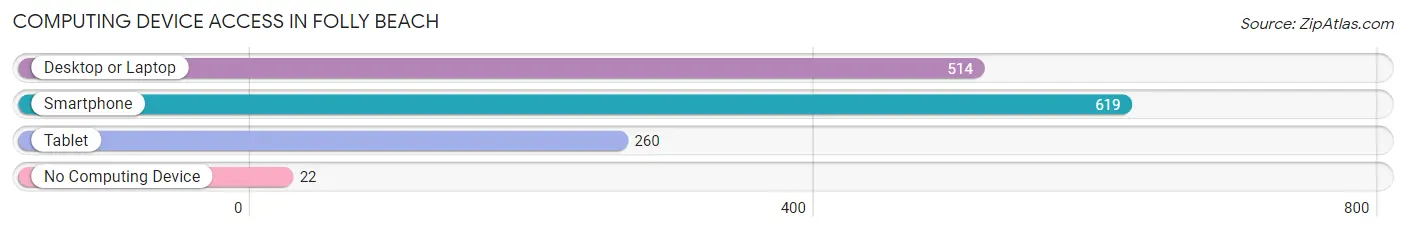
| Device Type | # Households | % Households |
| Desktop or Laptop | 514 | 80.2% |
| Smartphone | 619 | 96.6% |
| Tablet | 260 | 40.6% |
| No Computing Device | 22 | 3.4% |
| Total | 641 | 100.0% |
Internet Access in Folly Beach
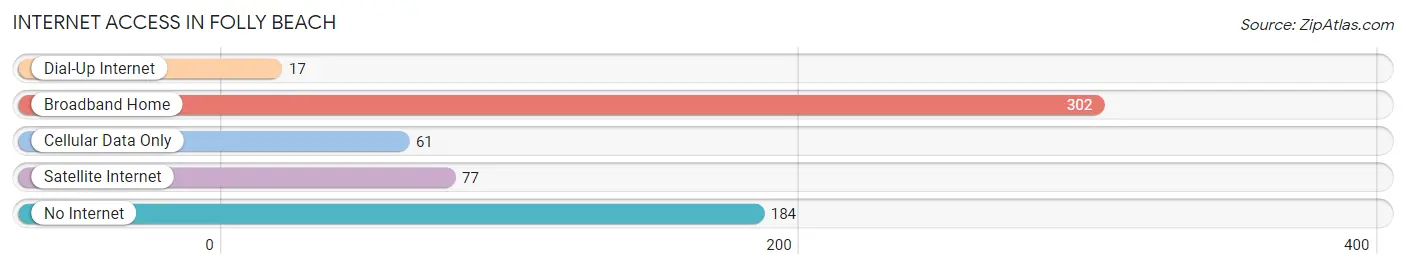
| Internet Type | # Households | % Households |
| Dial-Up Internet | 17 | 2.6% |
| Broadband Home | 302 | 47.1% |
| Cellular Data Only | 61 | 9.5% |
| Satellite Internet | 77 | 12.0% |
| No Internet | 184 | 28.7% |
| Total | 641 | 100.0% |
Folly Beach Summary
Folly Beach is a barrier island located in Charleston County, South Carolina. It is situated between the Folly River and the Atlantic Ocean, and is approximately seven miles long and one mile wide. The island is known for its laid-back atmosphere, beautiful beaches, and vibrant nightlife.
History
Folly Beach has a long and storied history. The island was first inhabited by Native Americans, who used it as a fishing and hunting ground. In the late 1600s, the island was settled by English colonists, who named it Folly Island. The island was used for farming and fishing, and was home to a small community of settlers.
In the late 1800s, the island began to attract tourists, who were drawn to its beautiful beaches and laid-back atmosphere. In the early 1900s, the island was developed as a resort destination, and the first hotel was built in 1911.
In the 1950s, the island was connected to the mainland by a bridge, and the population began to grow. In the 1960s, the island became a popular destination for college students, and the nightlife scene began to develop.
Geography
Folly Beach is located on the southeastern coast of South Carolina, between the Folly River and the Atlantic Ocean. The island is approximately seven miles long and one mile wide. It is bordered by the Folly River to the north, the Atlantic Ocean to the east, and the Morris Island Lighthouse to the south.
The island is composed of a variety of habitats, including salt marshes, maritime forests, and sand dunes. The island is home to a variety of wildlife, including sea turtles, dolphins, and a variety of birds.
Economy
Folly Beach is a popular tourist destination, and the island’s economy is largely driven by tourism. The island is home to a variety of hotels, restaurants, bars, and shops, which cater to tourists and locals alike.
The island is also home to a variety of businesses, including boat charters, fishing charters, and water sports companies. In addition, the island is home to a number of art galleries, which showcase the work of local artists.
Demographics
As of the 2010 census, the population of Folly Beach was 2,617. The population is largely white (90.2%), with a small percentage of African Americans (4.2%) and Hispanics (2.2%). The median household income is $50,945, and the median age is 44.
Conclusion
Folly Beach is a beautiful barrier island located in Charleston County, South Carolina. It is known for its laid-back atmosphere, beautiful beaches, and vibrant nightlife. The island has a long and storied history, and is home to a variety of habitats and wildlife. The economy of the island is largely driven by tourism, and the population is largely white. Folly Beach is a popular destination for tourists and locals alike, and is a great place to visit.
Common Questions
What is Per Capita Income in Folly Beach?
Per Capita income in Folly Beach is $61,847.
What is the Median Family Income in Folly Beach?
Median Family Income in Folly Beach is $102,198.
What is the Median Household income in Folly Beach?
Median Household Income in Folly Beach is $88,424.
What is Income or Wage Gap in Folly Beach?
Income or Wage Gap in Folly Beach is 50.7%.
Women in Folly Beach earn 49.3 cents for every dollar earned by a man.
What is Inequality or Gini Index in Folly Beach?
Inequality or Gini Index in Folly Beach is 0.46.
What is the Total Population of Folly Beach?
Total Population of Folly Beach is 1,020.
What is the Total Male Population of Folly Beach?
Total Male Population of Folly Beach is 530.
What is the Total Female Population of Folly Beach?
Total Female Population of Folly Beach is 490.
What is the Ratio of Males per 100 Females in Folly Beach?
There are 108.16 Males per 100 Females in Folly Beach.
What is the Ratio of Females per 100 Males in Folly Beach?
There are 92.45 Females per 100 Males in Folly Beach.
What is the Median Population Age in Folly Beach?
Median Population Age in Folly Beach is 63.6 Years.
What is the Average Family Size in Folly Beach
Average Family Size in Folly Beach is 2.3 People.
What is the Average Household Size in Folly Beach
Average Household Size in Folly Beach is 1.6 People.
How Large is the Labor Force in Folly Beach?
There are 490 People in the Labor Forcein in Folly Beach.
What is the Percentage of People in the Labor Force in Folly Beach?
49.6% of People are in the Labor Force in Folly Beach.