Blenheim, SC Map & Demographics
Blenheim Map
Blenheim Overview
$36,517
PER CAPITA INCOME
$103,214
AVG FAMILY INCOME
0.45
INEQUALITY / GINI INDEX
63
TOTAL POPULATION
27
MALE POPULATION
36
FEMALE POPULATION
75.00
MALES / 100 FEMALES
133.33
FEMALES / 100 MALES
53.9
MEDIAN AGE
2.5
AVG FAMILY SIZE
2.1
AVG HOUSEHOLD SIZE
33
LABOR FORCE [ PEOPLE ]
61.1%
PERCENT IN LABOR FORCE
Blenheim Zip Codes
Blenheim Area Codes
Income in Blenheim
Income Overview in Blenheim
| Characteristic | Number | Measure |
| Per Capita Income | 63 | $36,517 |
| Median Family Income | 22 | $103,214 |
| Mean Family Income | 22 | $94,405 |
| Median Household Income | 30 | $0 |
| Mean Household Income | 30 | $74,727 |
| Income Deficit | 22 | $0 |
| Wage / Income Gap (%) | 63 | 0.00% |
| Wage / Income Gap ($) | 63 | 100.00¢ per $1 |
| Gini / Inequality Index | 63 | 0.45 |
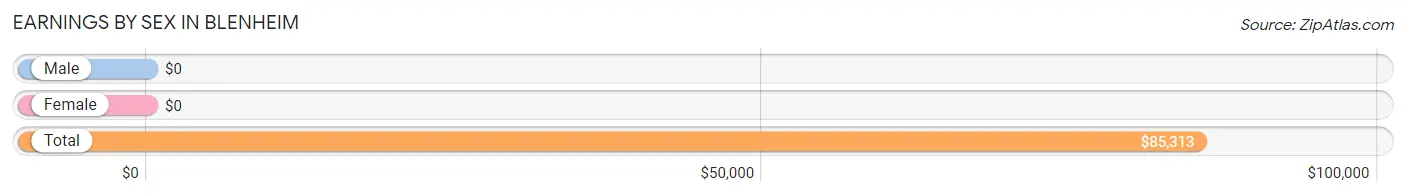
Earnings by Sex in Blenheim
| Sex | Number | Average Earnings |
| Male | 14 (42.4%) | $0 |
| Female | 19 (57.6%) | $0 |
| Total | 33 (100.0%) | $85,313 |
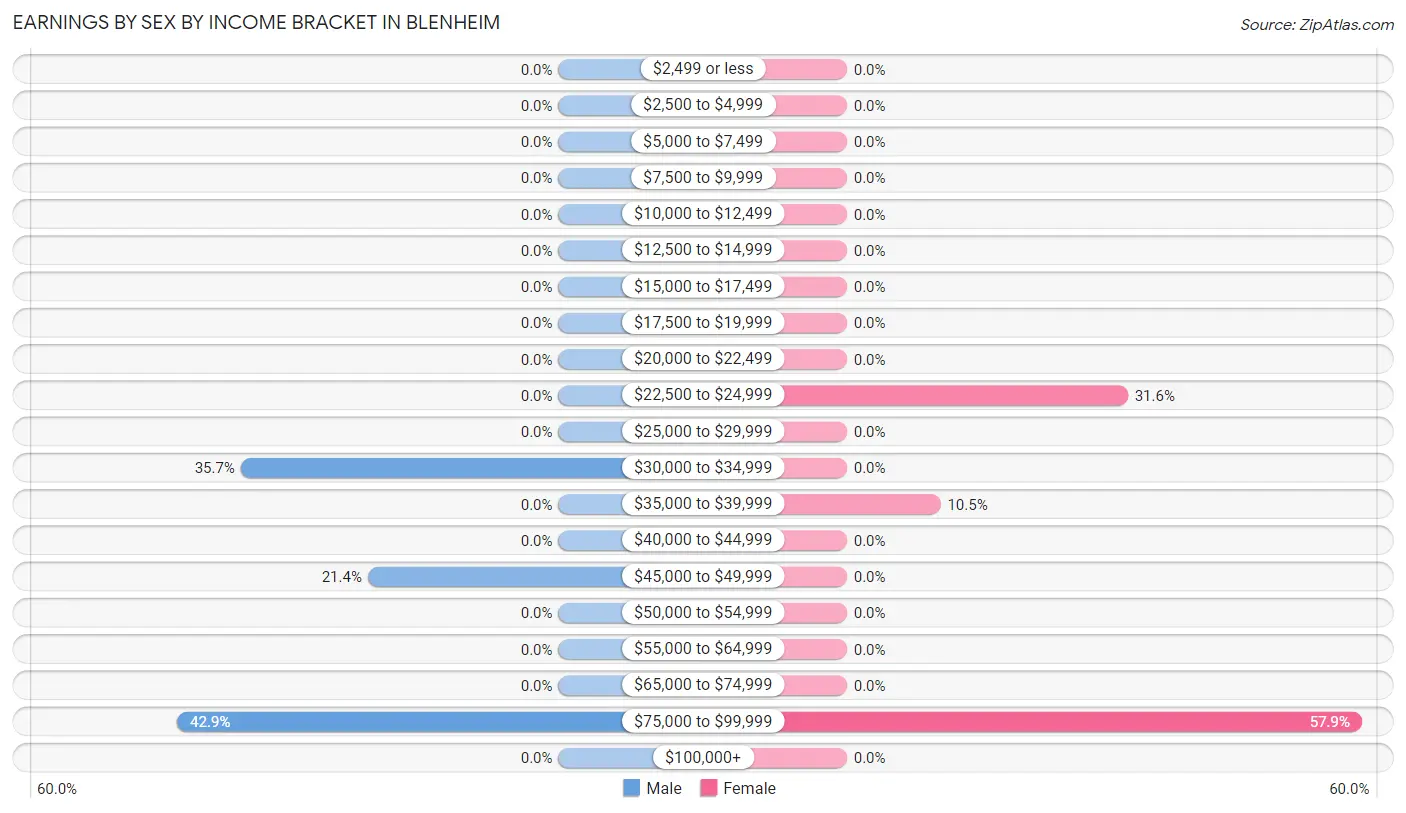
Earnings by Sex by Income Bracket in Blenheim
The most common earnings brackets in Blenheim are $75,000 to $99,999 for men (6 | 42.9%) and $75,000 to $99,999 for women (11 | 57.9%).
| Income | Male | Female |
| $2,499 or less | 0 (0.0%) | 0 (0.0%) |
| $2,500 to $4,999 | 0 (0.0%) | 0 (0.0%) |
| $5,000 to $7,499 | 0 (0.0%) | 0 (0.0%) |
| $7,500 to $9,999 | 0 (0.0%) | 0 (0.0%) |
| $10,000 to $12,499 | 0 (0.0%) | 0 (0.0%) |
| $12,500 to $14,999 | 0 (0.0%) | 0 (0.0%) |
| $15,000 to $17,499 | 0 (0.0%) | 0 (0.0%) |
| $17,500 to $19,999 | 0 (0.0%) | 0 (0.0%) |
| $20,000 to $22,499 | 0 (0.0%) | 0 (0.0%) |
| $22,500 to $24,999 | 0 (0.0%) | 6 (31.6%) |
| $25,000 to $29,999 | 0 (0.0%) | 0 (0.0%) |
| $30,000 to $34,999 | 5 (35.7%) | 0 (0.0%) |
| $35,000 to $39,999 | 0 (0.0%) | 2 (10.5%) |
| $40,000 to $44,999 | 0 (0.0%) | 0 (0.0%) |
| $45,000 to $49,999 | 3 (21.4%) | 0 (0.0%) |
| $50,000 to $54,999 | 0 (0.0%) | 0 (0.0%) |
| $55,000 to $64,999 | 0 (0.0%) | 0 (0.0%) |
| $65,000 to $74,999 | 0 (0.0%) | 0 (0.0%) |
| $75,000 to $99,999 | 6 (42.9%) | 11 (57.9%) |
| $100,000+ | 0 (0.0%) | 0 (0.0%) |
| Total | 14 (100.0%) | 19 (100.0%) |
Earnings by Sex by Educational Attainment in Blenheim
| Educational Attainment | Male Income | Female Income |
| Less than High School | - | - |
| High School Diploma | - | - |
| College or Associate's Degree | - | - |
| Bachelor's Degree | - | - |
| Graduate Degree | - | - |
| Total | - | - |
Family Income in Blenheim
Family Income Brackets in Blenheim
According to the Blenheim family income data, there are 9 families falling into the $100,000 to $149,999 income range, which is the most common income bracket and makes up 40.9% of all families.
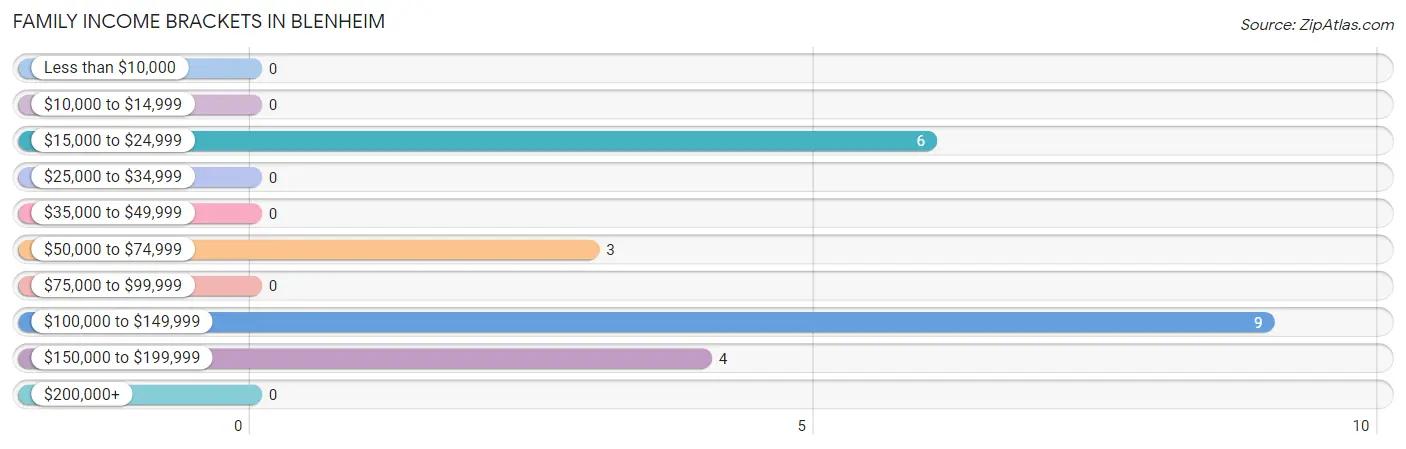
| Income Bracket | # Families | % Families |
| Less than $10,000 | 0 | 0.0% |
| $10,000 to $14,999 | 0 | 0.0% |
| $15,000 to $24,999 | 6 | 27.3% |
| $25,000 to $34,999 | 0 | 0.0% |
| $35,000 to $49,999 | 0 | 0.0% |
| $50,000 to $74,999 | 3 | 13.6% |
| $75,000 to $99,999 | 0 | 0.0% |
| $100,000 to $149,999 | 9 | 40.9% |
| $150,000 to $199,999 | 4 | 18.2% |
| $200,000+ | 0 | 0.0% |
Family Income by Famaliy Size in Blenheim
| Income Bracket | # Families | Median Income |
| 2-Person Families | 11 (50.0%) | $0 |
| 3-Person Families | 11 (50.0%) | $0 |
| 4-Person Families | 0 (0.0%) | $0 |
| 5-Person Families | 0 (0.0%) | $0 |
| 6-Person Families | 0 (0.0%) | $0 |
| 7+ Person Families | 0 (0.0%) | $0 |
| Total | 22 (100.0%) | $103,214 |
Family Income by Number of Earners in Blenheim
| Number of Earners | # Families | Median Income |
| No Earners | 0 (0.0%) | $0 |
| 1 Earner | 16 (72.7%) | $0 |
| 2 Earners | 6 (27.3%) | $0 |
| 3+ Earners | 0 (0.0%) | $0 |
| Total | 22 (100.0%) | $103,214 |
Household Income in Blenheim
Household Income Brackets in Blenheim
With 9 households falling in the category, the $100,000 to $149,999 income range is the most frequent in Blenheim, accounting for 30.0% of all households.
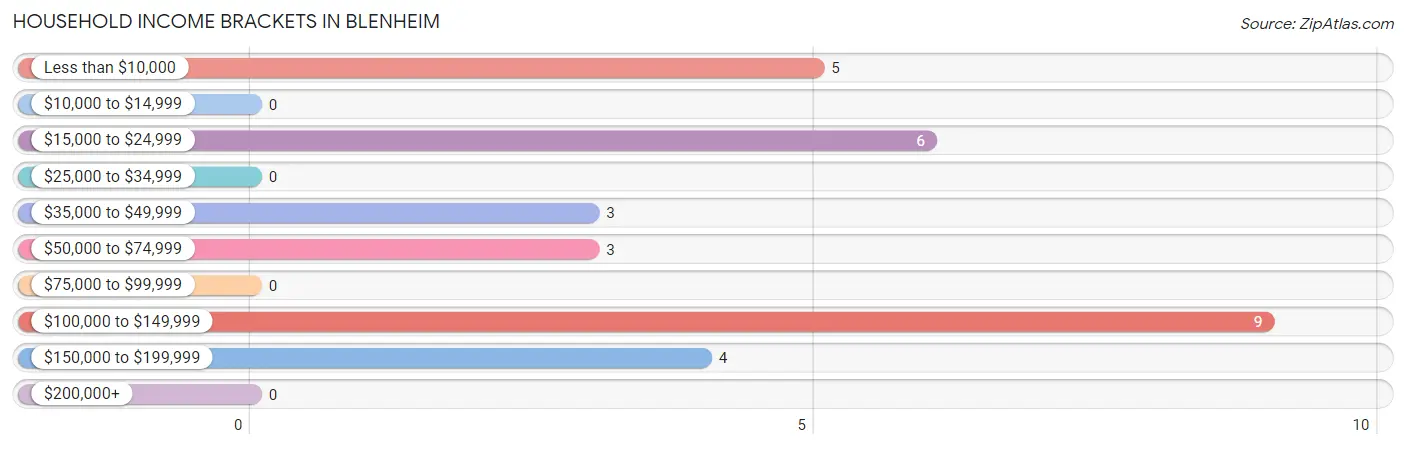
| Income Bracket | # Households | % Households |
| Less than $10,000 | 5 | 16.7% |
| $10,000 to $14,999 | 0 | 0.0% |
| $15,000 to $24,999 | 6 | 20.0% |
| $25,000 to $34,999 | 0 | 0.0% |
| $35,000 to $49,999 | 3 | 10.0% |
| $50,000 to $74,999 | 3 | 10.0% |
| $75,000 to $99,999 | 0 | 0.0% |
| $100,000 to $149,999 | 9 | 30.0% |
| $150,000 to $199,999 | 4 | 13.3% |
| $200,000+ | 0 | 0.0% |
Household Income by Householder Age in Blenheim
The median household income in Blenheim is $0, with the highest median household income of $104,821 found in the 45 to 64 years age bracket for the primary householder. A total of 13 households (43.3%) fall into this category.
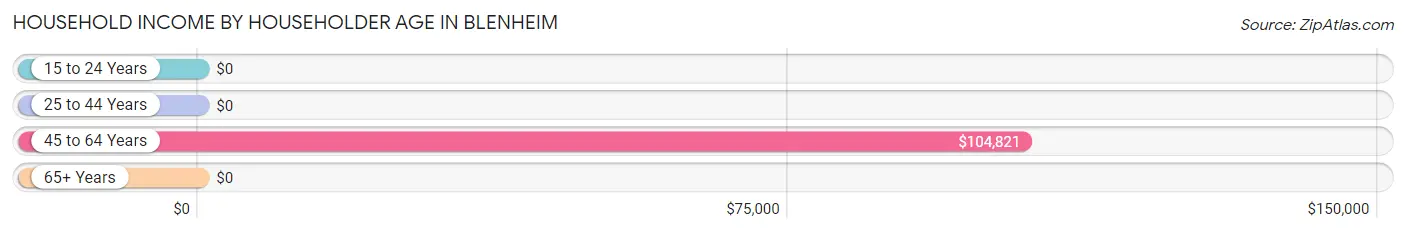
| Income Bracket | # Households | Median Income |
| 15 to 24 Years | 0 (0.0%) | $0 |
| 25 to 44 Years | 9 (30.0%) | $0 |
| 45 to 64 Years | 13 (43.3%) | $104,821 |
| 65+ Years | 8 (26.7%) | $0 |
| Total | 30 (100.0%) | $0 |
Poverty in Blenheim
Income Below Poverty by Sex and Age in Blenheim
With 22.2% poverty level for males and 41.7% for females among the residents of Blenheim, 16 and 17 year old males and 15 year old females are the most vulnerable to poverty, with 6 males (100.0%) and 4 females (100.0%) in their respective age groups living below the poverty level.
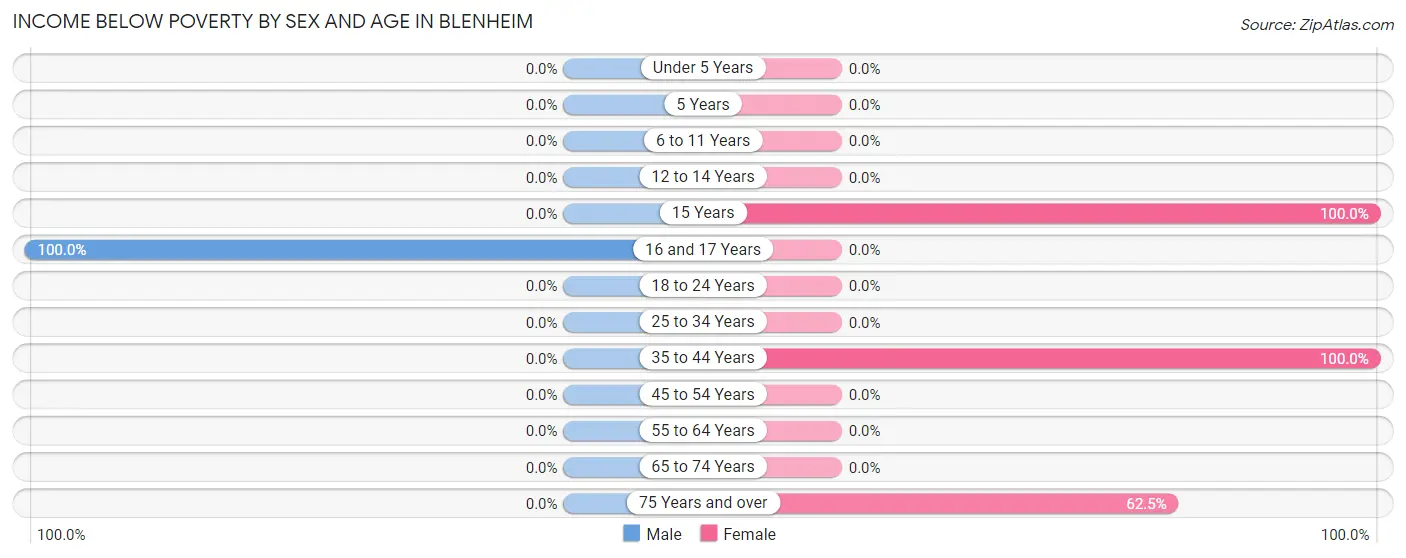
| Age Bracket | Male | Female |
| Under 5 Years | 0 (0.0%) | 0 (0.0%) |
| 5 Years | 0 (0.0%) | 0 (0.0%) |
| 6 to 11 Years | 0 (0.0%) | 0 (0.0%) |
| 12 to 14 Years | 0 (0.0%) | 0 (0.0%) |
| 15 Years | 0 (0.0%) | 4 (100.0%) |
| 16 and 17 Years | 6 (100.0%) | 0 (0.0%) |
| 18 to 24 Years | 0 (0.0%) | 0 (0.0%) |
| 25 to 34 Years | 0 (0.0%) | 0 (0.0%) |
| 35 to 44 Years | 0 (0.0%) | 6 (100.0%) |
| 45 to 54 Years | 0 (0.0%) | 0 (0.0%) |
| 55 to 64 Years | 0 (0.0%) | 0 (0.0%) |
| 65 to 74 Years | 0 (0.0%) | 0 (0.0%) |
| 75 Years and over | 0 (0.0%) | 5 (62.5%) |
| Total | 6 (22.2%) | 15 (41.7%) |
Income Above Poverty by Sex and Age in Blenheim
According to the poverty statistics in Blenheim, males aged 25 to 34 years and females aged 6 to 11 years are the age groups that are most secure financially, with 100.0% of males and 100.0% of females in these age groups living above the poverty line.
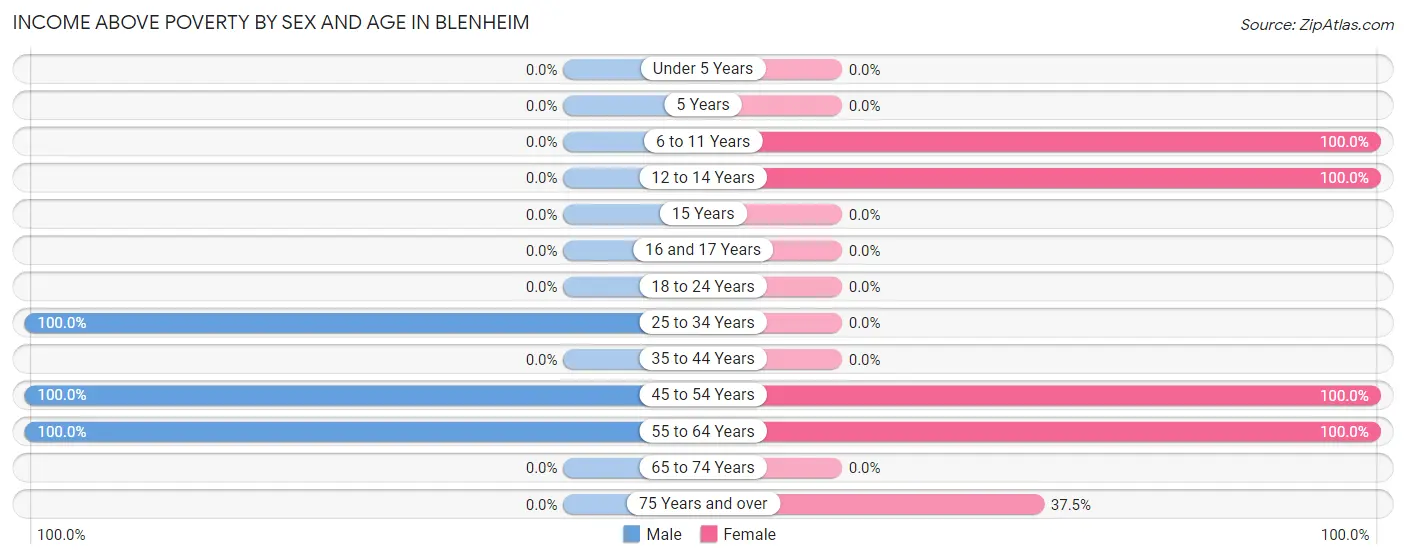
| Age Bracket | Male | Female |
| Under 5 Years | 0 (0.0%) | 0 (0.0%) |
| 5 Years | 0 (0.0%) | 0 (0.0%) |
| 6 to 11 Years | 0 (0.0%) | 3 (100.0%) |
| 12 to 14 Years | 0 (0.0%) | 2 (100.0%) |
| 15 Years | 0 (0.0%) | 0 (0.0%) |
| 16 and 17 Years | 0 (0.0%) | 0 (0.0%) |
| 18 to 24 Years | 0 (0.0%) | 0 (0.0%) |
| 25 to 34 Years | 3 (100.0%) | 0 (0.0%) |
| 35 to 44 Years | 0 (0.0%) | 0 (0.0%) |
| 45 to 54 Years | 2 (100.0%) | 6 (100.0%) |
| 55 to 64 Years | 16 (100.0%) | 7 (100.0%) |
| 65 to 74 Years | 0 (0.0%) | 0 (0.0%) |
| 75 Years and over | 0 (0.0%) | 3 (37.5%) |
| Total | 21 (77.8%) | 21 (58.3%) |
Income Below Poverty Among Married-Couple Families in Blenheim
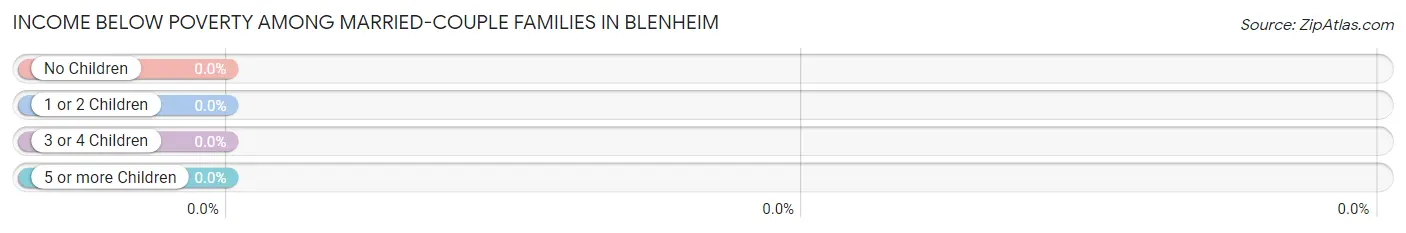
| Children | Above Poverty | Below Poverty |
| No Children | 11 (100.0%) | 0 (0.0%) |
| 1 or 2 Children | 2 (100.0%) | 0 (0.0%) |
| 3 or 4 Children | 0 (0.0%) | 0 (0.0%) |
| 5 or more Children | 0 (0.0%) | 0 (0.0%) |
| Total | 13 (100.0%) | 0 (0.0%) |
Income Below Poverty Among Single-Parent Households in Blenheim
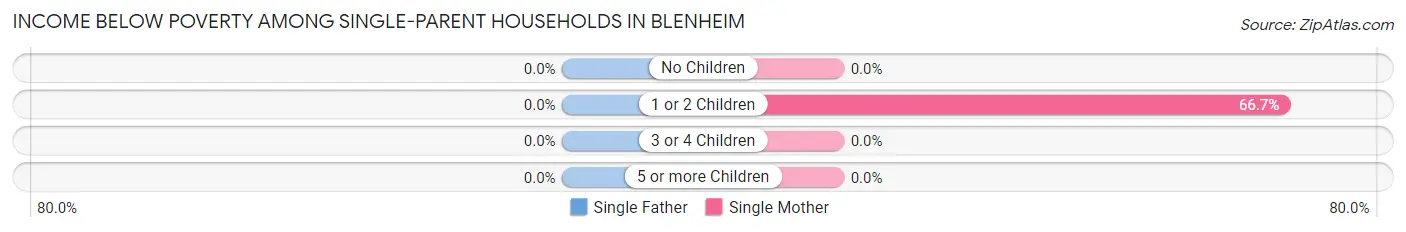
| Children | Single Father | Single Mother |
| No Children | 0 (0.0%) | 0 (0.0%) |
| 1 or 2 Children | 0 (0.0%) | 6 (66.7%) |
| 3 or 4 Children | 0 (0.0%) | 0 (0.0%) |
| 5 or more Children | 0 (0.0%) | 0 (0.0%) |
| Total | 0 (0.0%) | 6 (66.7%) |
Income Below Poverty Among Married-Couple vs Single-Parent Households in Blenheim
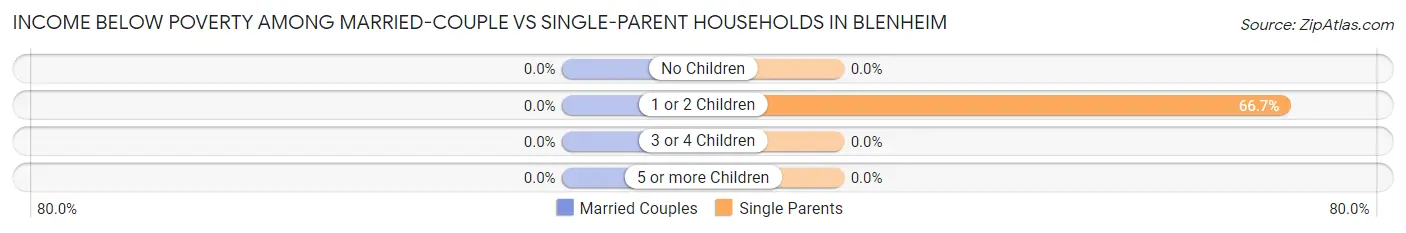
| Children | Married-Couple Families | Single-Parent Households |
| No Children | 0 (0.0%) | 0 (0.0%) |
| 1 or 2 Children | 0 (0.0%) | 6 (66.7%) |
| 3 or 4 Children | 0 (0.0%) | 0 (0.0%) |
| 5 or more Children | 0 (0.0%) | 0 (0.0%) |
| Total | 0 (0.0%) | 6 (66.7%) |
Race in Blenheim
The most populous races in Blenheim are White / Caucasian (47 | 74.6%), and Black / African American (16 | 25.4%).
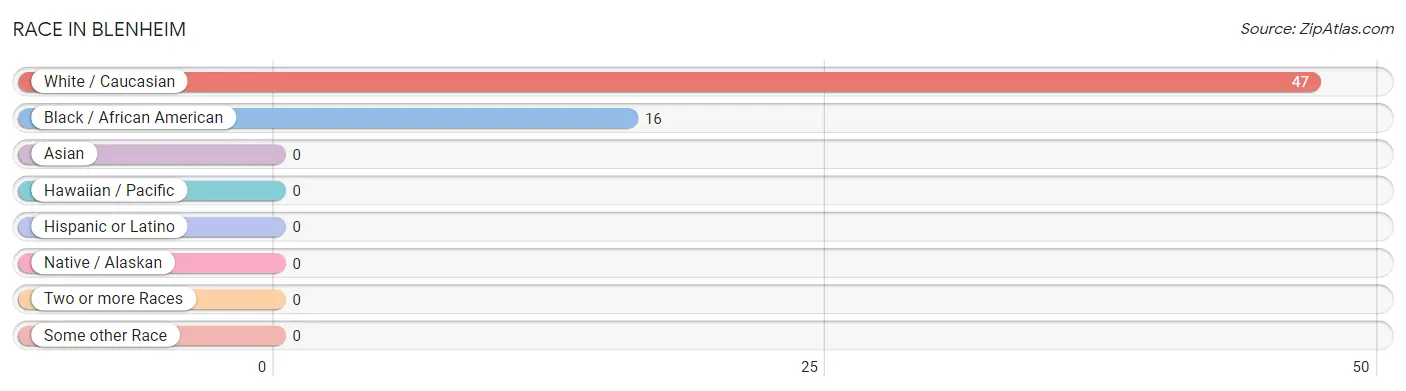
| Race | # Population | % Population |
| Asian | 0 | 0.0% |
| Black / African American | 16 | 25.4% |
| Hawaiian / Pacific | 0 | 0.0% |
| Hispanic or Latino | 0 | 0.0% |
| Native / Alaskan | 0 | 0.0% |
| White / Caucasian | 47 | 74.6% |
| Two or more Races | 0 | 0.0% |
| Some other Race | 0 | 0.0% |
| Total | 63 | 100.0% |
Ancestry in Blenheim
The most populous ancestries reported in Blenheim are African (7 | 11.1%), Subsaharan African (7 | 11.1%), and American (4 | 6.4%), together accounting for 28.6% of all Blenheim residents.
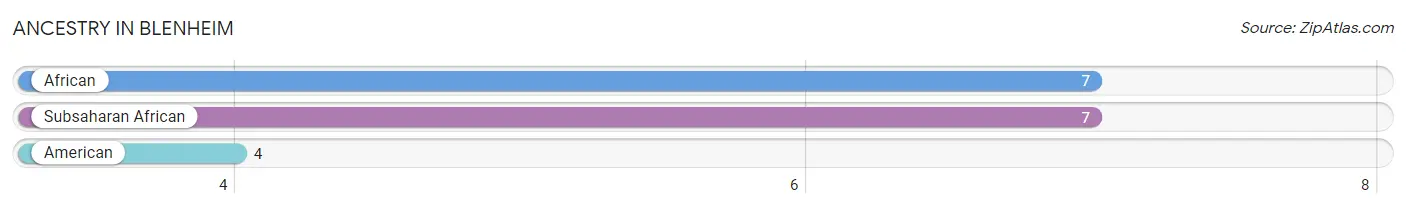
| Ancestry | # Population | % Population |
| African | 7 | 11.1% |
| American | 4 | 6.4% |
| Subsaharan African | 7 | 11.1% | View All 3 Rows |
Immigrants in Blenheim

| Immigration Origin | # Population | % Population | View All 0 Rows |
Sex and Age in Blenheim
Sex and Age in Blenheim
The most populous age groups in Blenheim are 55 to 59 Years (9 | 33.3%) for men and 75 to 79 Years (7 | 19.4%) for women.
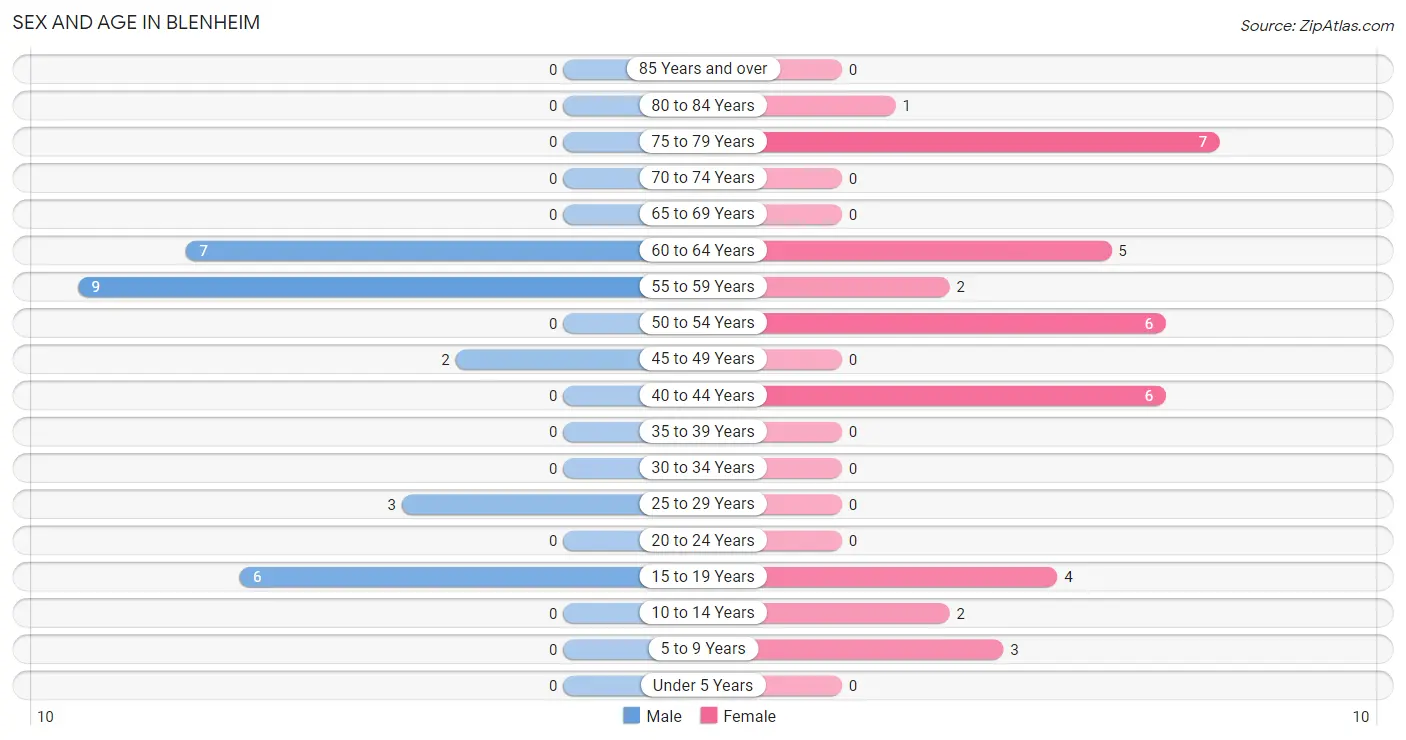
| Age Bracket | Male | Female |
| Under 5 Years | 0 (0.0%) | 0 (0.0%) |
| 5 to 9 Years | 0 (0.0%) | 3 (8.3%) |
| 10 to 14 Years | 0 (0.0%) | 2 (5.6%) |
| 15 to 19 Years | 6 (22.2%) | 4 (11.1%) |
| 20 to 24 Years | 0 (0.0%) | 0 (0.0%) |
| 25 to 29 Years | 3 (11.1%) | 0 (0.0%) |
| 30 to 34 Years | 0 (0.0%) | 0 (0.0%) |
| 35 to 39 Years | 0 (0.0%) | 0 (0.0%) |
| 40 to 44 Years | 0 (0.0%) | 6 (16.7%) |
| 45 to 49 Years | 2 (7.4%) | 0 (0.0%) |
| 50 to 54 Years | 0 (0.0%) | 6 (16.7%) |
| 55 to 59 Years | 9 (33.3%) | 2 (5.6%) |
| 60 to 64 Years | 7 (25.9%) | 5 (13.9%) |
| 65 to 69 Years | 0 (0.0%) | 0 (0.0%) |
| 70 to 74 Years | 0 (0.0%) | 0 (0.0%) |
| 75 to 79 Years | 0 (0.0%) | 7 (19.4%) |
| 80 to 84 Years | 0 (0.0%) | 1 (2.8%) |
| 85 Years and over | 0 (0.0%) | 0 (0.0%) |
| Total | 27 (100.0%) | 36 (100.0%) |
Families and Households in Blenheim
Median Family Size in Blenheim
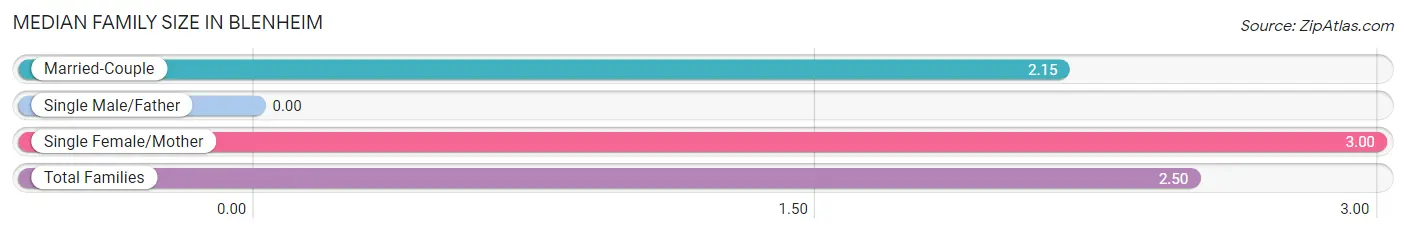
| Family Type | # Families | Family Size |
| Married-Couple | 13 (59.1%) | 2.15 |
| Single Male/Father | 0 (0.0%) | - |
| Single Female/Mother | 9 (40.9%) | 3.00 |
| Total Families | 22 (100.0%) | 2.50 |
Median Household Size in Blenheim
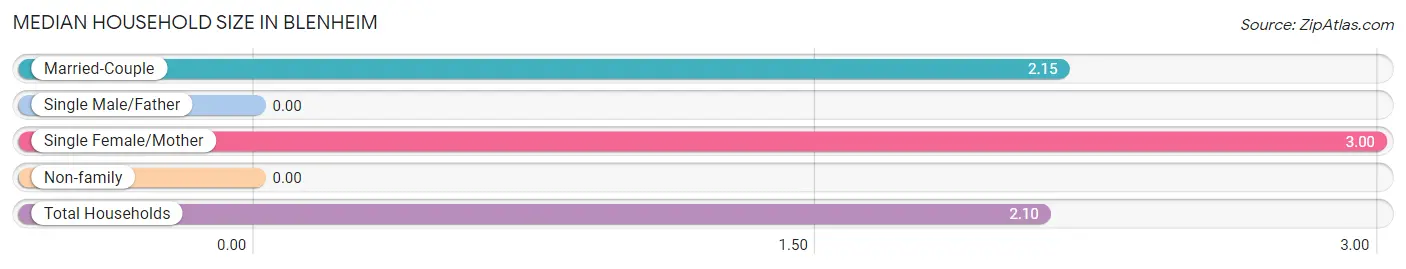
| Household Type | # Households | Household Size |
| Married-Couple | 13 (43.3%) | 2.15 |
| Single Male/Father | 0 (0.0%) | - |
| Single Female/Mother | 9 (30.0%) | 3.00 |
| Non-family | 8 (26.7%) | - |
| Total Households | 30 (100.0%) | 2.10 |
Household Size by Marriage Status in Blenheim
Out of a total of 30 households in Blenheim, 22 (73.3%) are family households, while 8 (26.7%) are nonfamily households. The most numerous type of family households are 2-person households, comprising 11, and the most common type of nonfamily households are 1-person households, comprising 8.
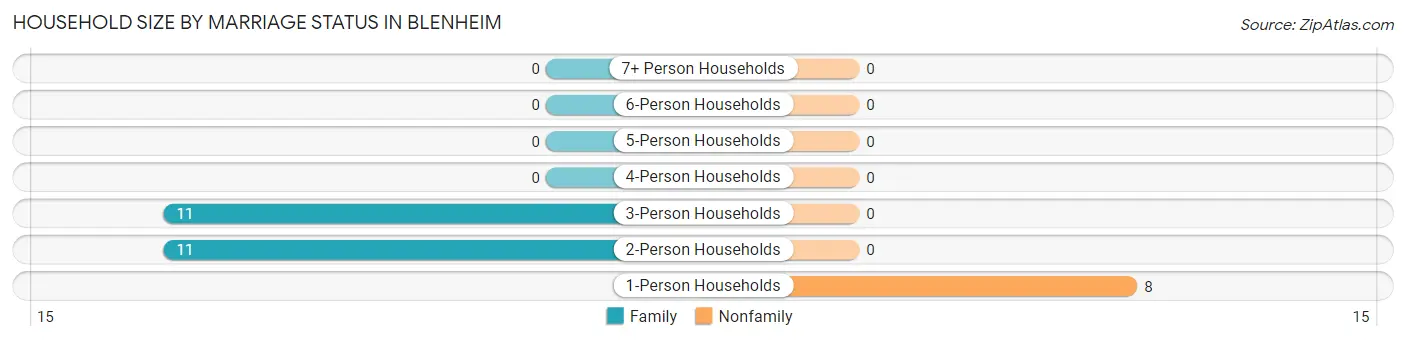
| Household Size | Family Households | Nonfamily Households |
| 1-Person Households | - | 8 (26.7%) |
| 2-Person Households | 11 (36.7%) | 0 (0.0%) |
| 3-Person Households | 11 (36.7%) | 0 (0.0%) |
| 4-Person Households | 0 (0.0%) | 0 (0.0%) |
| 5-Person Households | 0 (0.0%) | 0 (0.0%) |
| 6-Person Households | 0 (0.0%) | 0 (0.0%) |
| 7+ Person Households | 0 (0.0%) | 0 (0.0%) |
| Total | 22 (73.3%) | 8 (26.7%) |
Female Fertility in Blenheim
Fertility by Age in Blenheim
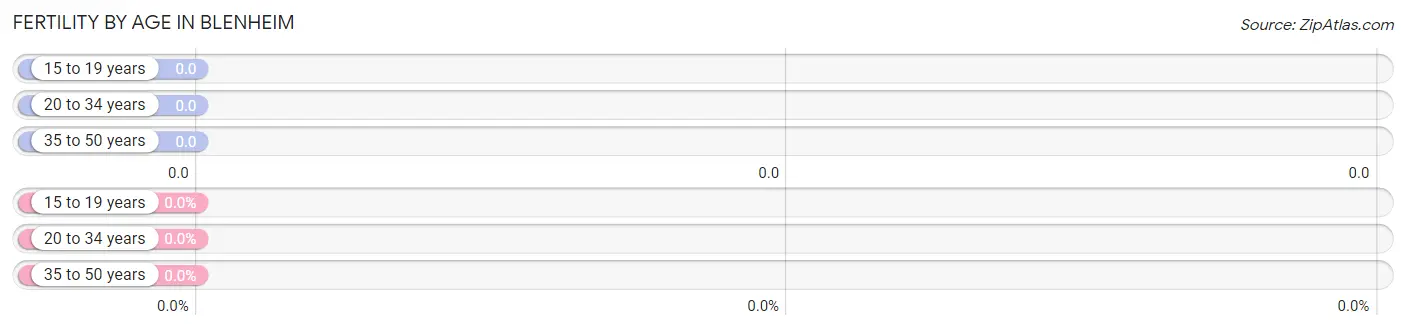
| Age Bracket | Women with Births | Births / 1,000 Women |
| 15 to 19 years | 0 (0.0%) | 0.0 |
| 20 to 34 years | 0 (0.0%) | 0.0 |
| 35 to 50 years | 0 (0.0%) | 0.0 |
| Total | 0 (0.0%) | 0.0 |
Fertility by Age by Marriage Status in Blenheim
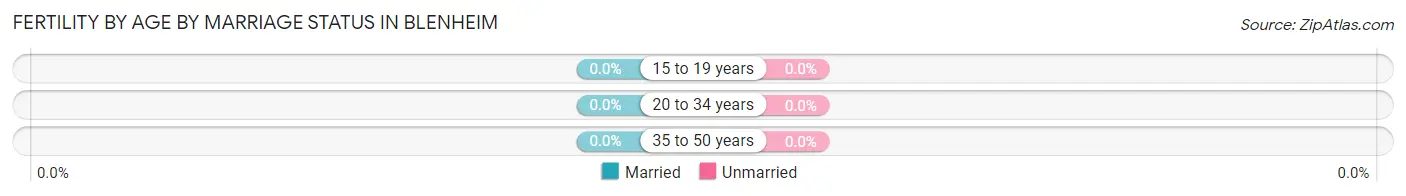
| Age Bracket | Married | Unmarried |
| 15 to 19 years | 0 (0.0%) | 0 (0.0%) |
| 20 to 34 years | 0 (0.0%) | 0 (0.0%) |
| 35 to 50 years | 0 (0.0%) | 0 (0.0%) |
| Total | 0 (0.0%) | 0 (0.0%) |
Fertility by Education in Blenheim
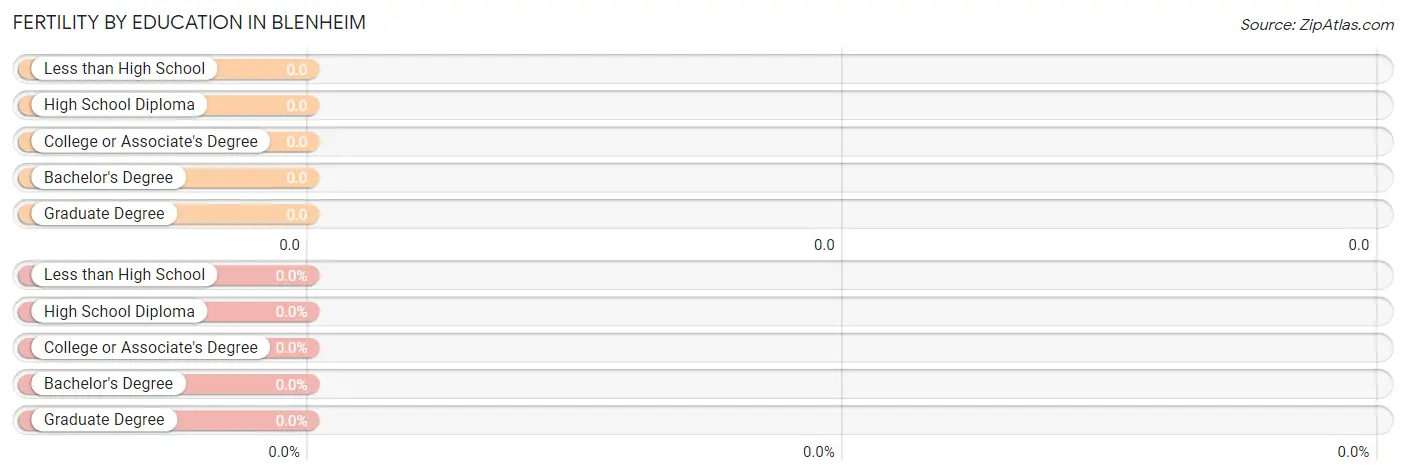
| Educational Attainment | Women with Births | Births / 1,000 Women |
| Less than High School | 0 (0.0%) | 0.0 |
| High School Diploma | 0 (0.0%) | 0.0 |
| College or Associate's Degree | 0 (0.0%) | 0.0 |
| Bachelor's Degree | 0 (0.0%) | 0.0 |
| Graduate Degree | 0 (0.0%) | 0.0 |
| Total | 0 (0.0%) | 0.0 |
Fertility by Education by Marriage Status in Blenheim
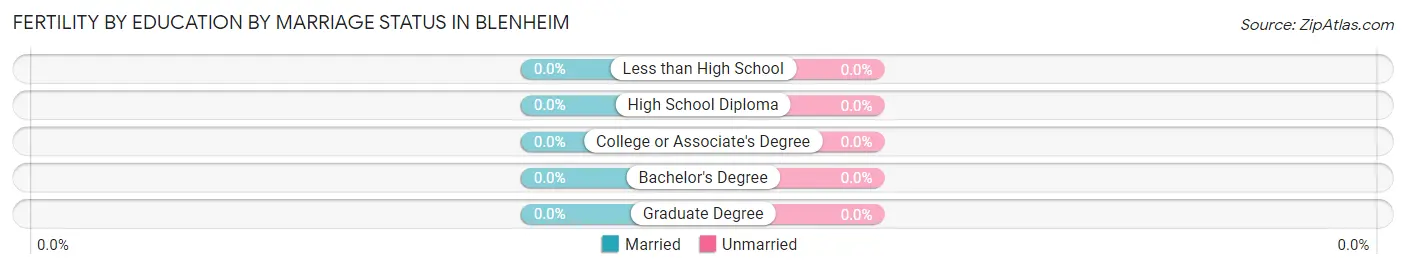
| Educational Attainment | Married | Unmarried |
| Less than High School | 0 (0.0%) | 0 (0.0%) |
| High School Diploma | 0 (0.0%) | 0 (0.0%) |
| College or Associate's Degree | 0 (0.0%) | 0 (0.0%) |
| Bachelor's Degree | 0 (0.0%) | 0 (0.0%) |
| Graduate Degree | 0 (0.0%) | 0 (0.0%) |
| Total | 0 (0.0%) | 0 (0.0%) |
Employment Characteristics in Blenheim
Employment by Class of Employer in Blenheim
Among the 33 employed individuals in Blenheim, private company employees (16 | 48.5%), state government employees (8 | 24.2%), and local government employees (5 | 15.1%) make up the most common classes of employment.
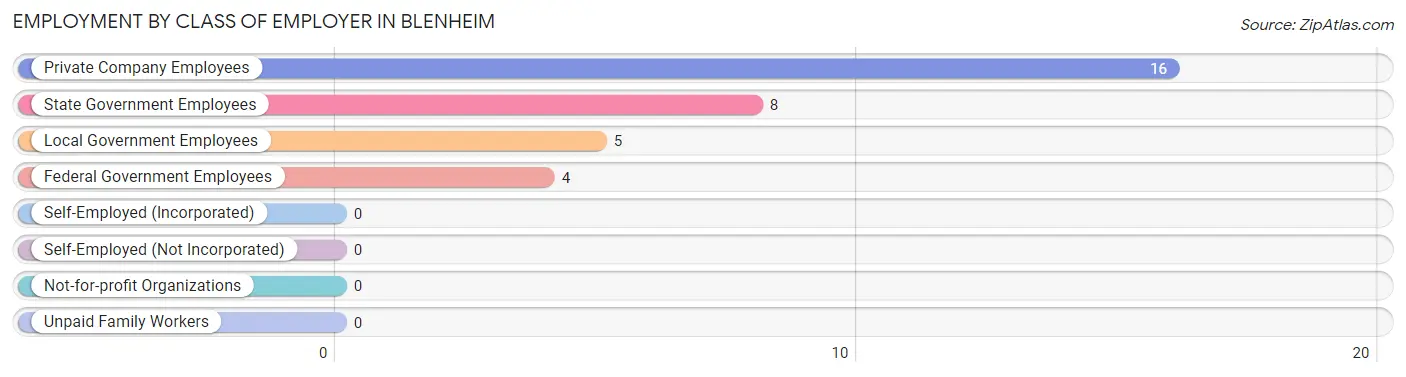
| Employer Class | # Employees | % Employees |
| Private Company Employees | 16 | 48.5% |
| Self-Employed (Incorporated) | 0 | 0.0% |
| Self-Employed (Not Incorporated) | 0 | 0.0% |
| Not-for-profit Organizations | 0 | 0.0% |
| Local Government Employees | 5 | 15.1% |
| State Government Employees | 8 | 24.2% |
| Federal Government Employees | 4 | 12.1% |
| Unpaid Family Workers | 0 | 0.0% |
| Total | 33 | 100.0% |
Employment Status by Age in Blenheim
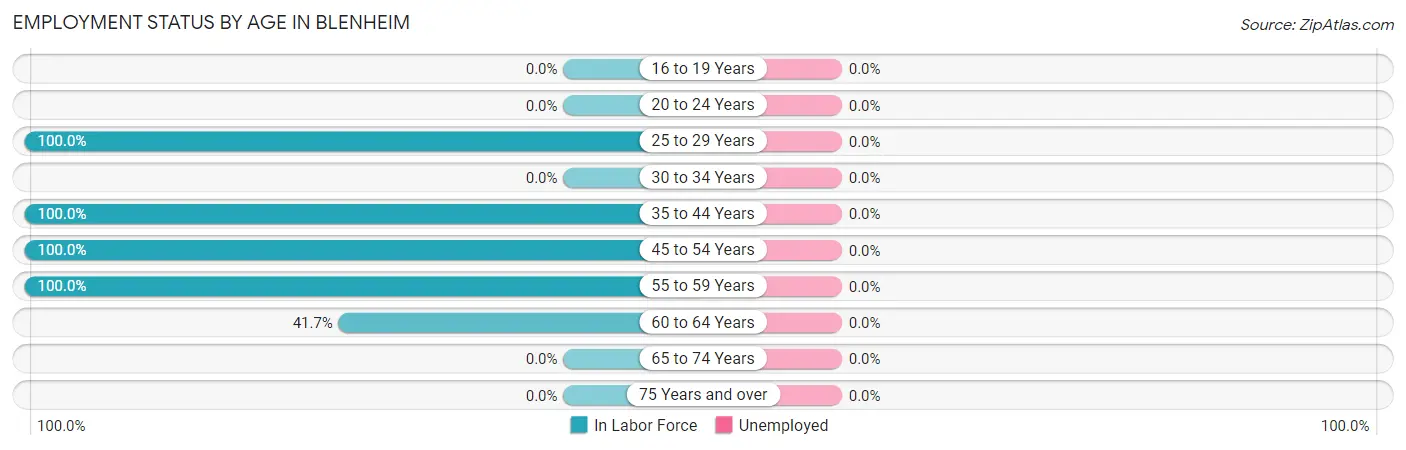
| Age Bracket | In Labor Force | Unemployed |
| 16 to 19 Years | 0 (0.0%) | 0 (0.0%) |
| 20 to 24 Years | 0 (0.0%) | 0 (0.0%) |
| 25 to 29 Years | 3 (100.0%) | 0 (0.0%) |
| 30 to 34 Years | 0 (0.0%) | 0 (0.0%) |
| 35 to 44 Years | 6 (100.0%) | 0 (0.0%) |
| 45 to 54 Years | 8 (100.0%) | 0 (0.0%) |
| 55 to 59 Years | 11 (100.0%) | 0 (0.0%) |
| 60 to 64 Years | 5 (41.7%) | 0 (0.0%) |
| 65 to 74 Years | 0 (0.0%) | 0 (0.0%) |
| 75 Years and over | 0 (0.0%) | 0 (0.0%) |
| Total | 33 (61.1%) | 0 (0.0%) |
Employment Status by Educational Attainment in Blenheim
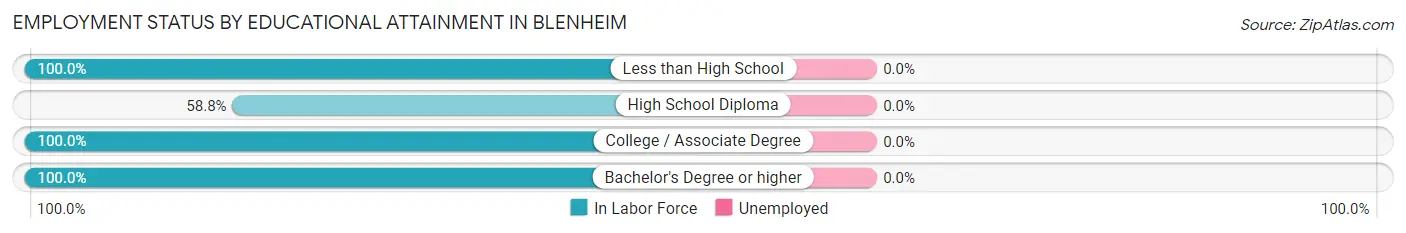
| Educational Attainment | In Labor Force | Unemployed |
| Less than High School | 6 (100.0%) | 0 (0.0%) |
| High School Diploma | 10 (58.8%) | 0 (0.0%) |
| College / Associate Degree | 7 (100.0%) | 0 (0.0%) |
| Bachelor's Degree or higher | 10 (100.0%) | 0 (0.0%) |
| Total | 33 (82.5%) | 0 (0.0%) |
Employment Occupations by Sex in Blenheim
Management, Business, Science and Arts Occupations
The most common Management, Business, Science and Arts occupations in Blenheim are Management (6 | 20.7%), Community & Social Service (2 | 6.9%), and Legal Services & Support (2 | 6.9%).
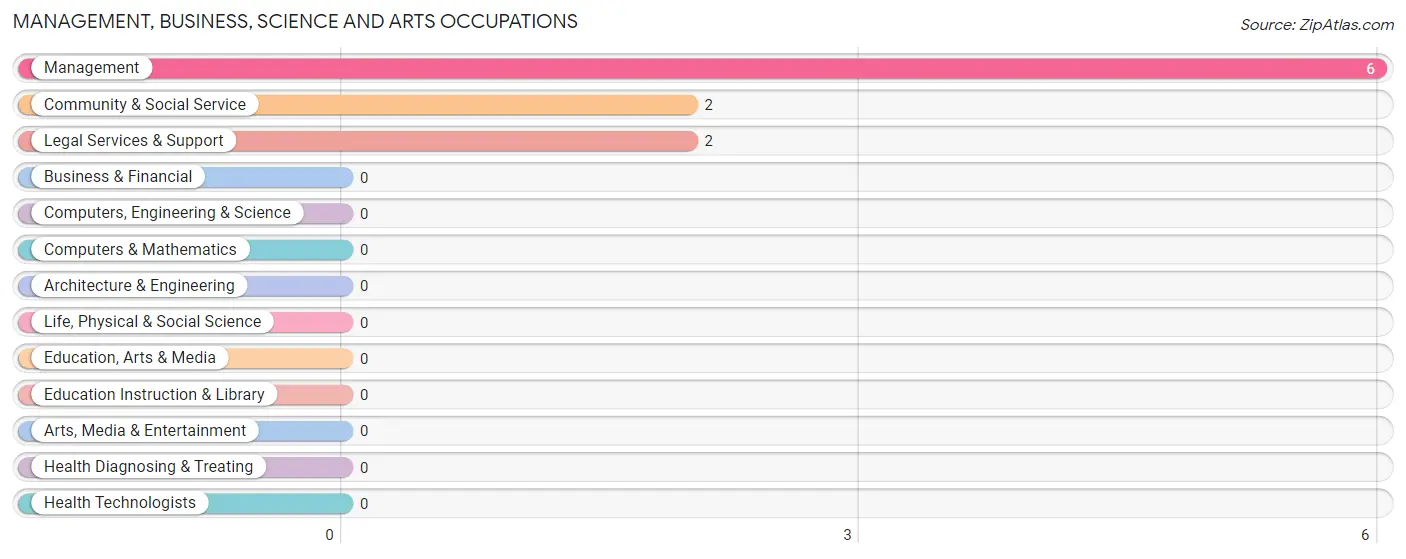
Management, Business, Science and Arts Occupations by Sex
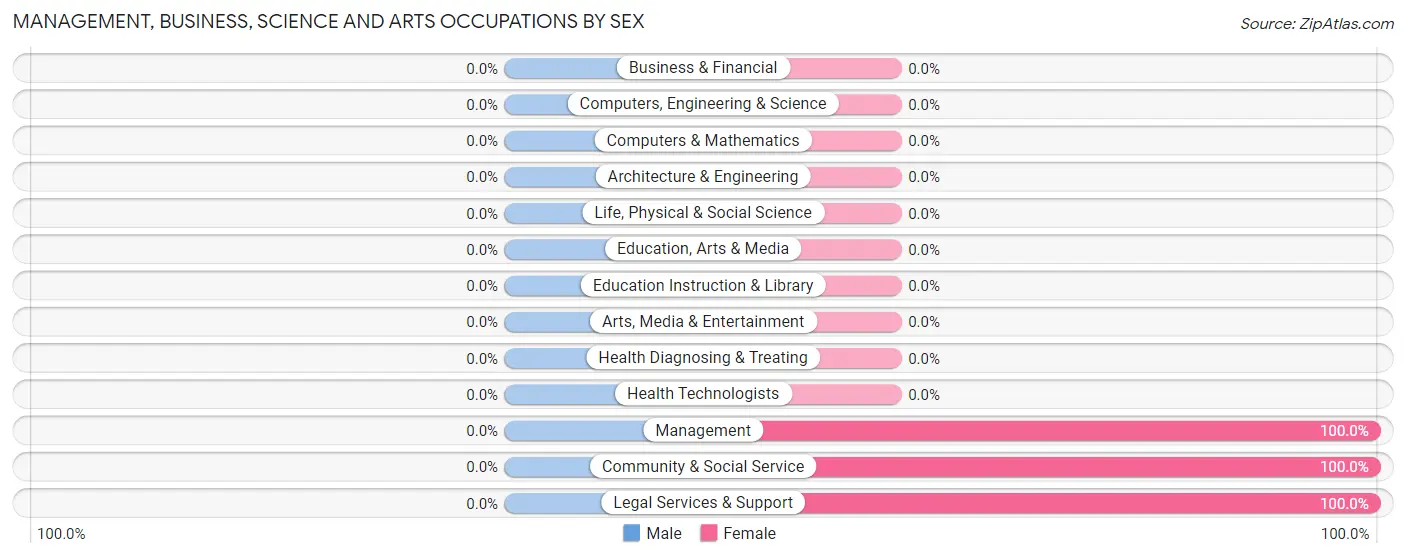
| Occupation | Male | Female |
| Management | 0 (0.0%) | 6 (100.0%) |
| Business & Financial | 0 (0.0%) | 0 (0.0%) |
| Computers, Engineering & Science | 0 (0.0%) | 0 (0.0%) |
| Computers & Mathematics | 0 (0.0%) | 0 (0.0%) |
| Architecture & Engineering | 0 (0.0%) | 0 (0.0%) |
| Life, Physical & Social Science | 0 (0.0%) | 0 (0.0%) |
| Community & Social Service | 0 (0.0%) | 2 (100.0%) |
| Education, Arts & Media | 0 (0.0%) | 0 (0.0%) |
| Legal Services & Support | 0 (0.0%) | 2 (100.0%) |
| Education Instruction & Library | 0 (0.0%) | 0 (0.0%) |
| Arts, Media & Entertainment | 0 (0.0%) | 0 (0.0%) |
| Health Diagnosing & Treating | 0 (0.0%) | 0 (0.0%) |
| Health Technologists | 0 (0.0%) | 0 (0.0%) |
| Total (Category) | 0 (0.0%) | 8 (100.0%) |
| Total (Overall) | 10 (34.5%) | 19 (65.5%) |
Services Occupations
The most common Services occupations in Blenheim are Security & Protection (5 | 17.2%), and Law Enforcement (5 | 17.2%).
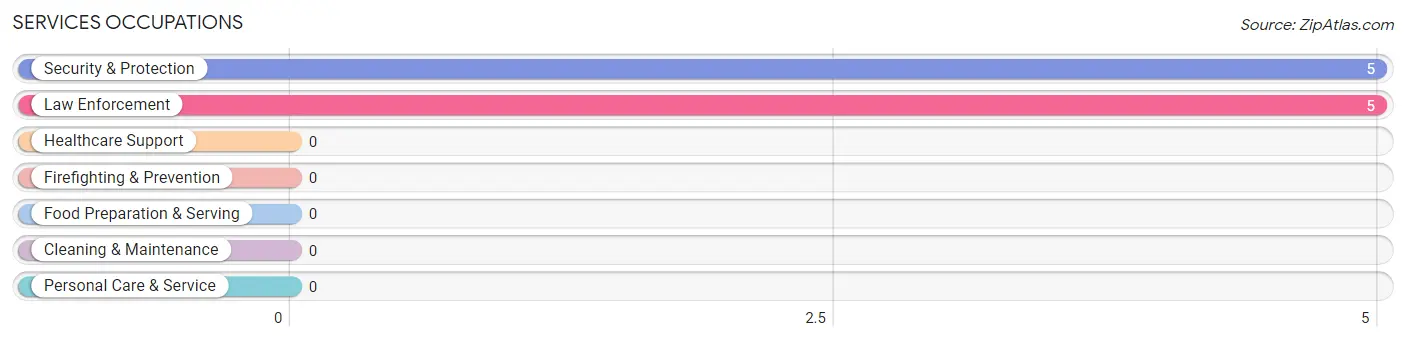
Services Occupations by Sex
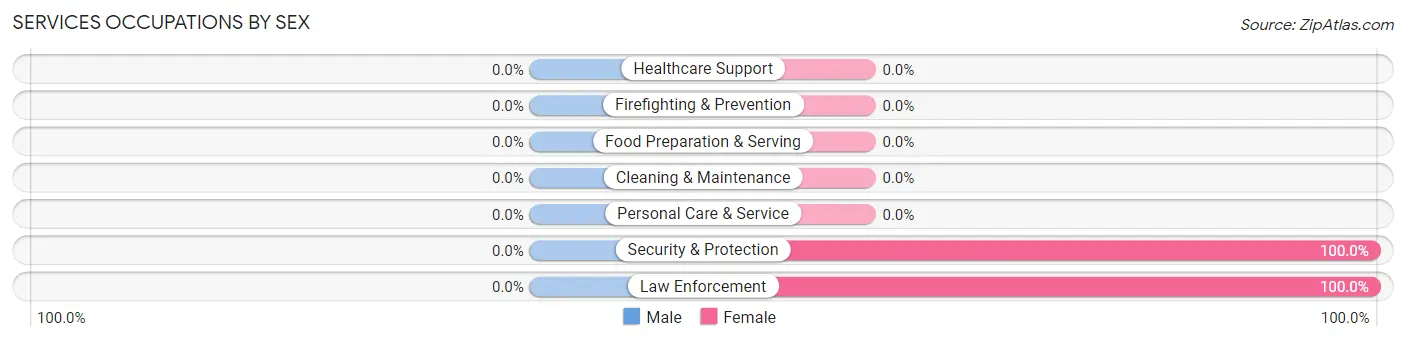
| Occupation | Male | Female |
| Healthcare Support | 0 (0.0%) | 0 (0.0%) |
| Security & Protection | 0 (0.0%) | 5 (100.0%) |
| Firefighting & Prevention | 0 (0.0%) | 0 (0.0%) |
| Law Enforcement | 0 (0.0%) | 5 (100.0%) |
| Food Preparation & Serving | 0 (0.0%) | 0 (0.0%) |
| Cleaning & Maintenance | 0 (0.0%) | 0 (0.0%) |
| Personal Care & Service | 0 (0.0%) | 0 (0.0%) |
| Total (Category) | 0 (0.0%) | 5 (100.0%) |
| Total (Overall) | 10 (34.5%) | 19 (65.5%) |
Sales and Office Occupations
The most common Sales and Office occupations in Blenheim are , and Office & Administration (3 | 10.3%).
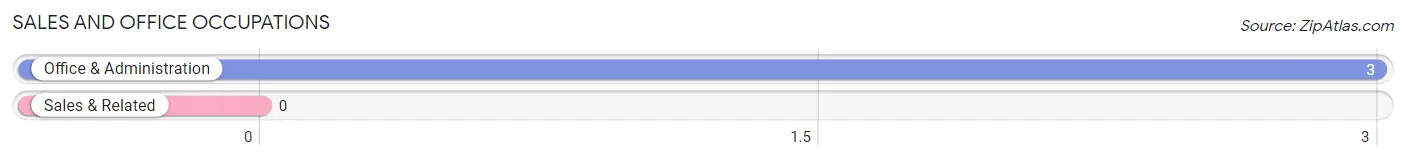
Sales and Office Occupations by Sex
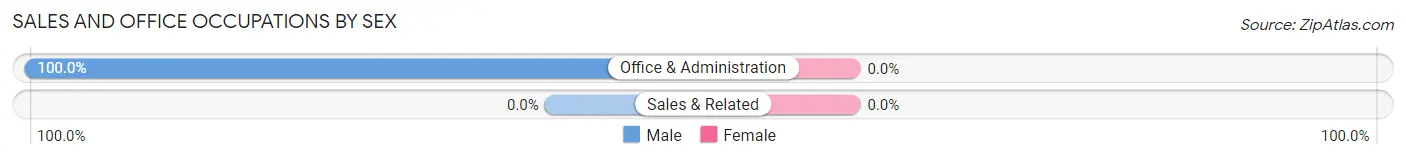
| Occupation | Male | Female |
| Sales & Related | 0 (0.0%) | 0 (0.0%) |
| Office & Administration | 3 (100.0%) | 0 (0.0%) |
| Total (Category) | 3 (100.0%) | 0 (0.0%) |
| Total (Overall) | 10 (34.5%) | 19 (65.5%) |
Natural Resources, Construction and Maintenance Occupations
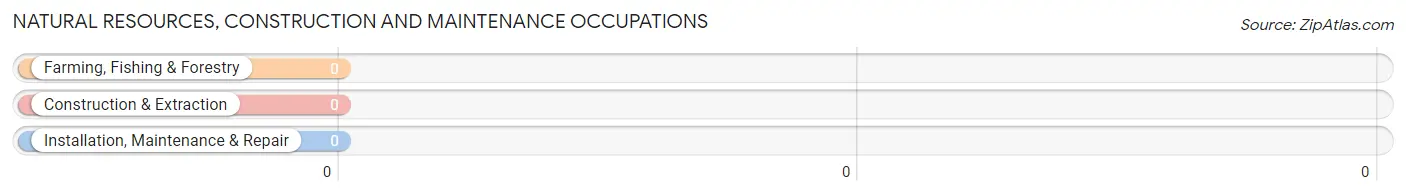
Natural Resources, Construction and Maintenance Occupations by Sex
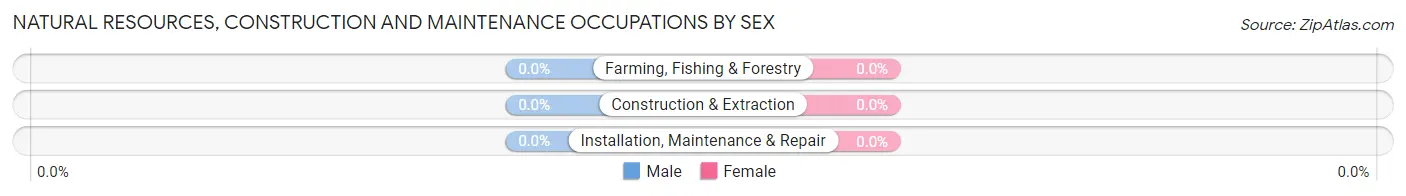
| Occupation | Male | Female |
| Farming, Fishing & Forestry | 0 (0.0%) | 0 (0.0%) |
| Construction & Extraction | 0 (0.0%) | 0 (0.0%) |
| Installation, Maintenance & Repair | 0 (0.0%) | 0 (0.0%) |
| Total (Category) | 0 (0.0%) | 0 (0.0%) |
| Total (Overall) | 10 (34.5%) | 19 (65.5%) |
Production, Transportation and Moving Occupations
The most common Production, Transportation and Moving occupations in Blenheim are , and Production (13 | 44.8%).
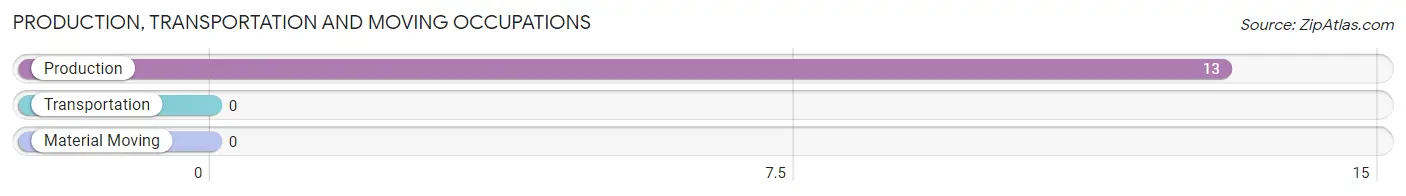
Production, Transportation and Moving Occupations by Sex
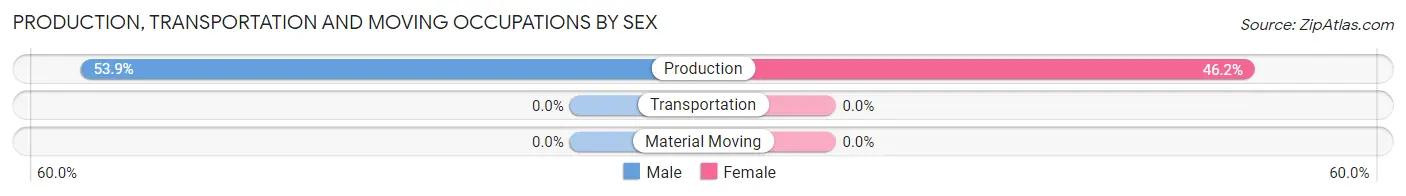
| Occupation | Male | Female |
| Production | 7 (53.8%) | 6 (46.2%) |
| Transportation | 0 (0.0%) | 0 (0.0%) |
| Material Moving | 0 (0.0%) | 0 (0.0%) |
| Total (Category) | 7 (53.8%) | 6 (46.2%) |
| Total (Overall) | 10 (34.5%) | 19 (65.5%) |
Employment Industries by Sex in Blenheim
Employment Industries in Blenheim
The major employment industries in Blenheim include Manufacturing (16 | 55.2%), Educational Services (6 | 20.7%), Public Administration (5 | 17.2%), and Professional & Scientific (2 | 6.9%).
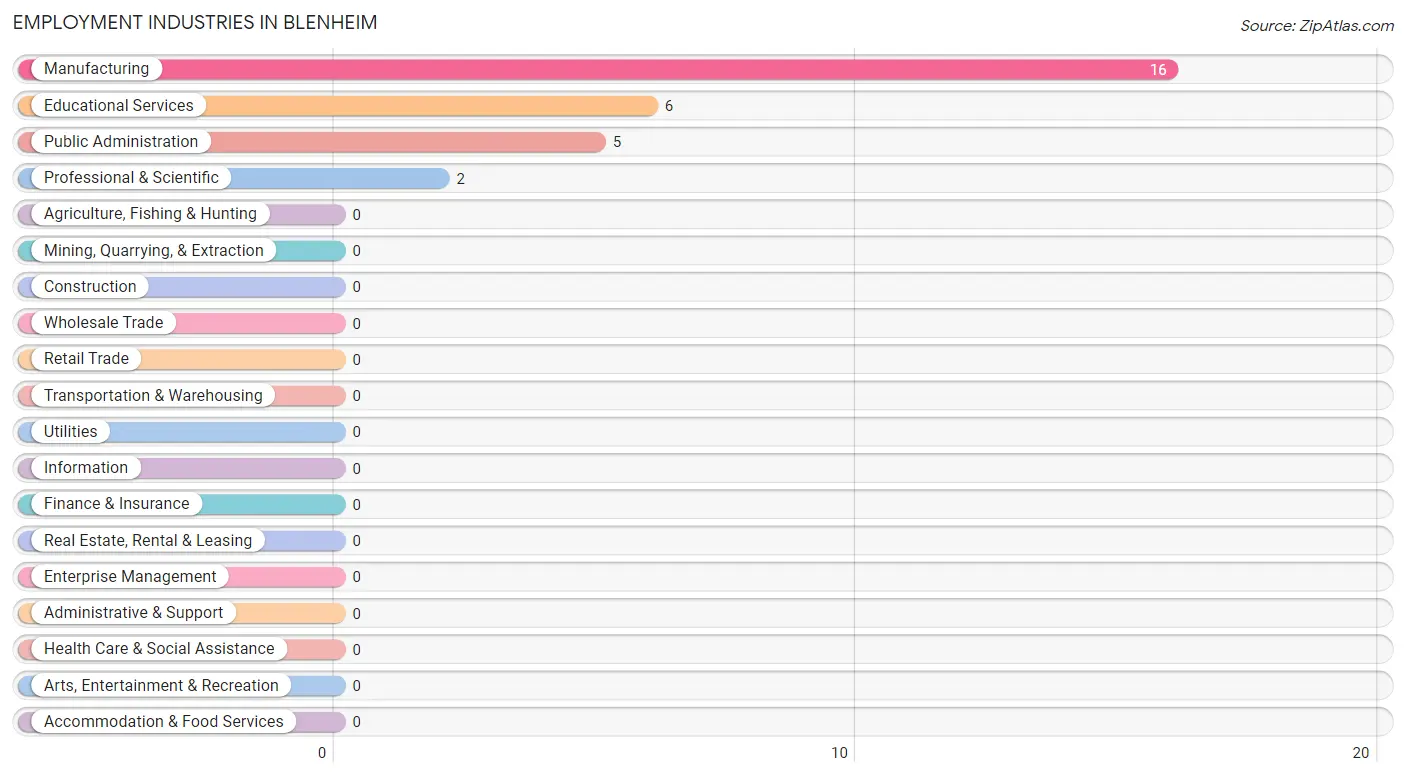
Employment Industries by Sex in Blenheim
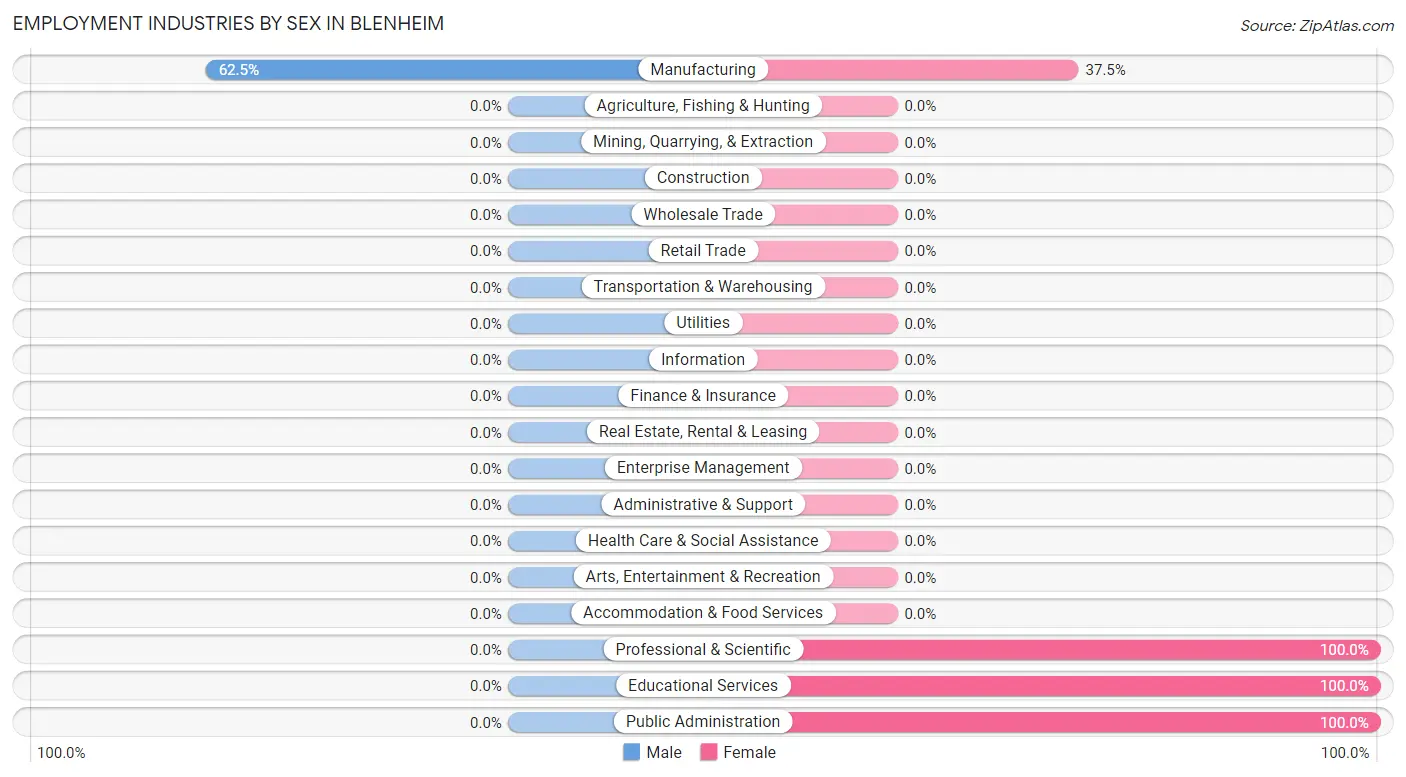
| Industry | Male | Female |
| Agriculture, Fishing & Hunting | 0 (0.0%) | 0 (0.0%) |
| Mining, Quarrying, & Extraction | 0 (0.0%) | 0 (0.0%) |
| Construction | 0 (0.0%) | 0 (0.0%) |
| Manufacturing | 10 (62.5%) | 6 (37.5%) |
| Wholesale Trade | 0 (0.0%) | 0 (0.0%) |
| Retail Trade | 0 (0.0%) | 0 (0.0%) |
| Transportation & Warehousing | 0 (0.0%) | 0 (0.0%) |
| Utilities | 0 (0.0%) | 0 (0.0%) |
| Information | 0 (0.0%) | 0 (0.0%) |
| Finance & Insurance | 0 (0.0%) | 0 (0.0%) |
| Real Estate, Rental & Leasing | 0 (0.0%) | 0 (0.0%) |
| Professional & Scientific | 0 (0.0%) | 2 (100.0%) |
| Enterprise Management | 0 (0.0%) | 0 (0.0%) |
| Administrative & Support | 0 (0.0%) | 0 (0.0%) |
| Educational Services | 0 (0.0%) | 6 (100.0%) |
| Health Care & Social Assistance | 0 (0.0%) | 0 (0.0%) |
| Arts, Entertainment & Recreation | 0 (0.0%) | 0 (0.0%) |
| Accommodation & Food Services | 0 (0.0%) | 0 (0.0%) |
| Public Administration | 0 (0.0%) | 5 (100.0%) |
| Total | 10 (34.5%) | 19 (65.5%) |
Education in Blenheim
School Enrollment in Blenheim
The most common levels of schooling among the 15 students in Blenheim are high school (8 | 53.3%), middle school (4 | 26.7%), and elementary school (3 | 20.0%).
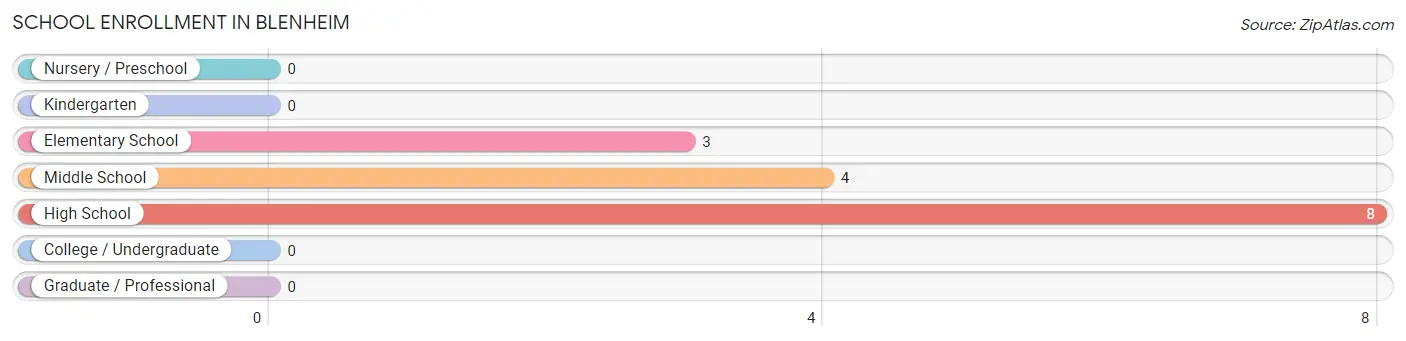
| School Level | # Students | % Students |
| Nursery / Preschool | 0 | 0.0% |
| Kindergarten | 0 | 0.0% |
| Elementary School | 3 | 20.0% |
| Middle School | 4 | 26.7% |
| High School | 8 | 53.3% |
| College / Undergraduate | 0 | 0.0% |
| Graduate / Professional | 0 | 0.0% |
| Total | 15 | 100.0% |
School Enrollment by Age by Funding Source in Blenheim
Out of a total of 15 students who are enrolled in schools in Blenheim, 2 (13.3%) attend a private institution, while the remaining 13 (86.7%) are enrolled in public schools. The age group of 10 to 14 year olds has the highest likelihood of being enrolled in private schools, with 2 (100.0% in the age bracket) enrolled. Conversely, the age group of 5 to 9 year old has the lowest likelihood of being enrolled in a private school, with 3 (100.0% in the age bracket) attending a public institution.
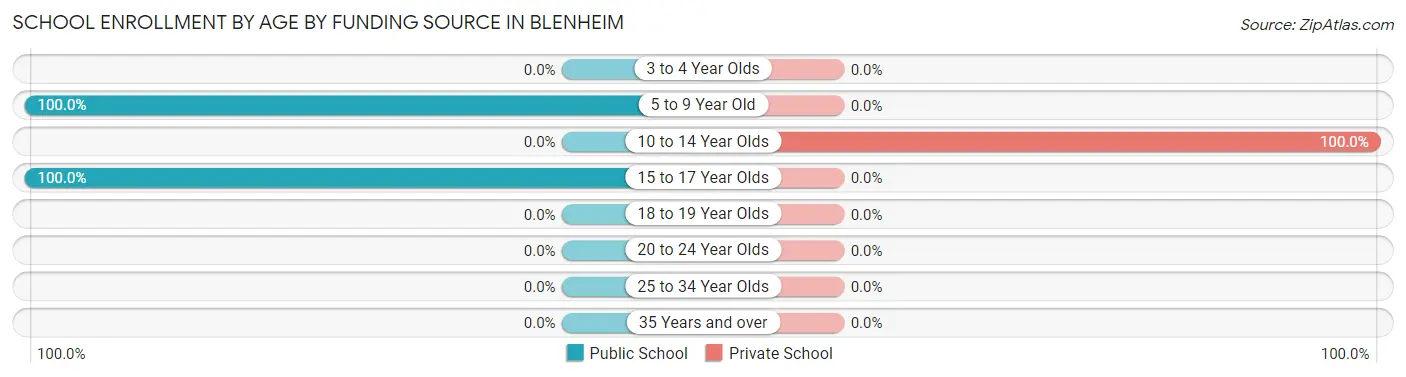
| Age Bracket | Public School | Private School |
| 3 to 4 Year Olds | 0 (0.0%) | 0 (0.0%) |
| 5 to 9 Year Old | 3 (100.0%) | 0 (0.0%) |
| 10 to 14 Year Olds | 0 (0.0%) | 2 (100.0%) |
| 15 to 17 Year Olds | 10 (100.0%) | 0 (0.0%) |
| 18 to 19 Year Olds | 0 (0.0%) | 0 (0.0%) |
| 20 to 24 Year Olds | 0 (0.0%) | 0 (0.0%) |
| 25 to 34 Year Olds | 0 (0.0%) | 0 (0.0%) |
| 35 Years and over | 0 (0.0%) | 0 (0.0%) |
| Total | 13 (86.7%) | 2 (13.3%) |
Educational Attainment by Field of Study in Blenheim
Education (6 | 46.2%), business (4 | 30.8%), and science & technology (3 | 23.1%) are the most common fields of study among 13 individuals in Blenheim who have obtained a bachelor's degree or higher.
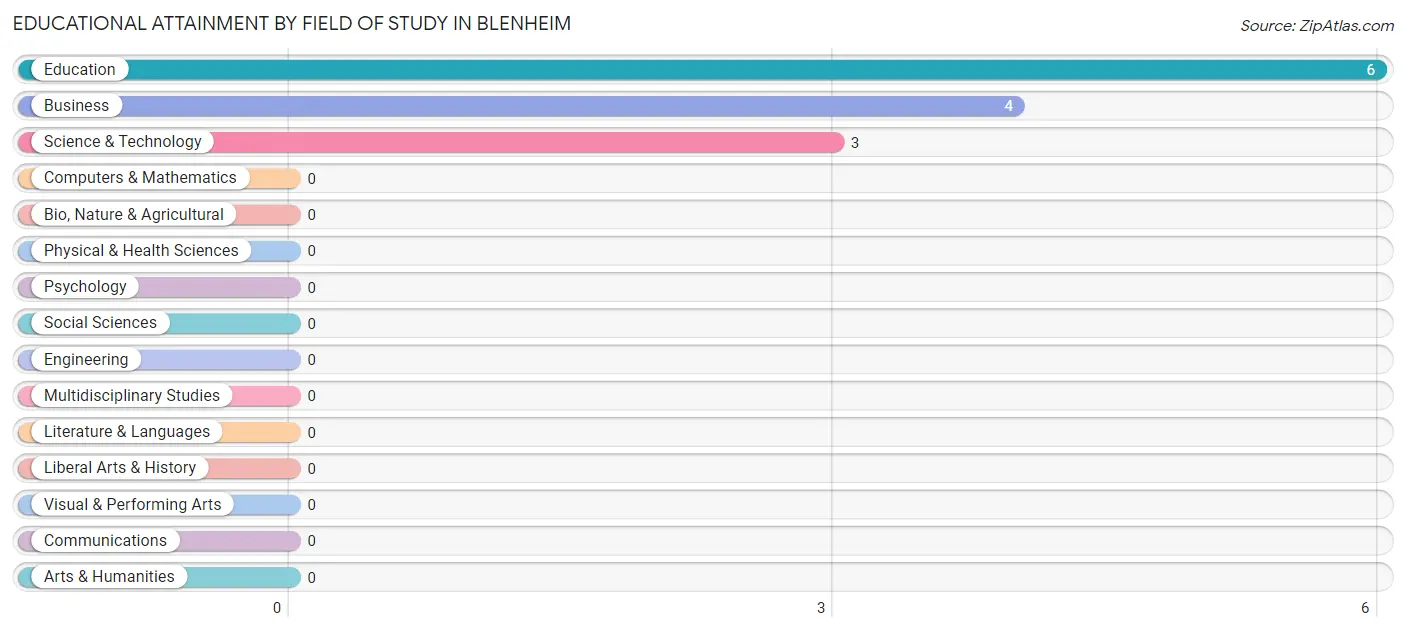
| Field of Study | # Graduates | % Graduates |
| Computers & Mathematics | 0 | 0.0% |
| Bio, Nature & Agricultural | 0 | 0.0% |
| Physical & Health Sciences | 0 | 0.0% |
| Psychology | 0 | 0.0% |
| Social Sciences | 0 | 0.0% |
| Engineering | 0 | 0.0% |
| Multidisciplinary Studies | 0 | 0.0% |
| Science & Technology | 3 | 23.1% |
| Business | 4 | 30.8% |
| Education | 6 | 46.2% |
| Literature & Languages | 0 | 0.0% |
| Liberal Arts & History | 0 | 0.0% |
| Visual & Performing Arts | 0 | 0.0% |
| Communications | 0 | 0.0% |
| Arts & Humanities | 0 | 0.0% |
| Total | 13 | 100.0% |
Transportation & Commute in Blenheim
Vehicle Availability by Sex in Blenheim
The most prevalent vehicle ownership categories in Blenheim are males with 2 vehicles (5, accounting for 35.7%) and females with 2 vehicles (5, making up 26.3%).
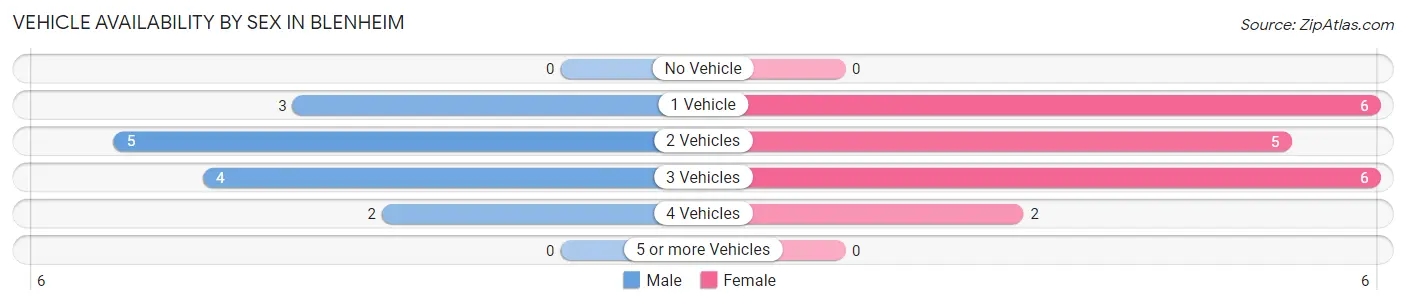
| Vehicles Available | Male | Female |
| No Vehicle | 0 (0.0%) | 0 (0.0%) |
| 1 Vehicle | 3 (21.4%) | 6 (31.6%) |
| 2 Vehicles | 5 (35.7%) | 5 (26.3%) |
| 3 Vehicles | 4 (28.6%) | 6 (31.6%) |
| 4 Vehicles | 2 (14.3%) | 2 (10.5%) |
| 5 or more Vehicles | 0 (0.0%) | 0 (0.0%) |
| Total | 14 (100.0%) | 19 (100.0%) |
Commute Time in Blenheim
The most frequently occuring commute durations in Blenheim are 15 to 19 minutes (11 commuters, 33.3%), 45 to 59 minutes (8 commuters, 24.2%), and 10 to 14 minutes (5 commuters, 15.1%).
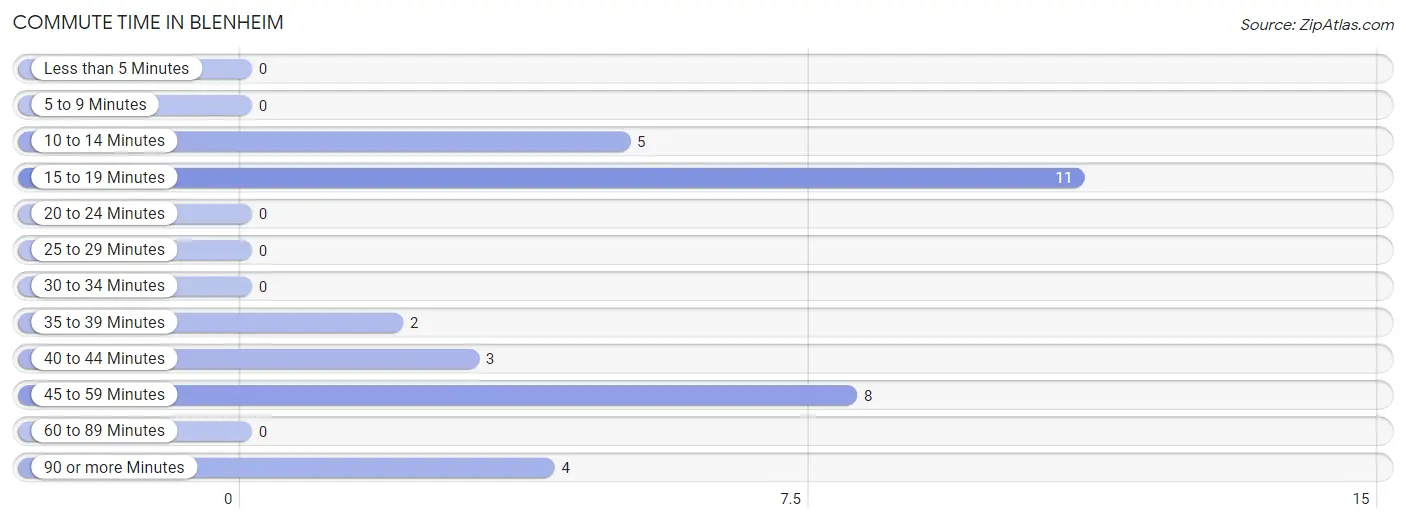
| Commute Time | # Commuters | % Commuters |
| Less than 5 Minutes | 0 | 0.0% |
| 5 to 9 Minutes | 0 | 0.0% |
| 10 to 14 Minutes | 5 | 15.1% |
| 15 to 19 Minutes | 11 | 33.3% |
| 20 to 24 Minutes | 0 | 0.0% |
| 25 to 29 Minutes | 0 | 0.0% |
| 30 to 34 Minutes | 0 | 0.0% |
| 35 to 39 Minutes | 2 | 6.1% |
| 40 to 44 Minutes | 3 | 9.1% |
| 45 to 59 Minutes | 8 | 24.2% |
| 60 to 89 Minutes | 0 | 0.0% |
| 90 or more Minutes | 4 | 12.1% |
Commute Time by Sex in Blenheim
The most common commute times in Blenheim are 15 to 19 minutes (5 commuters, 35.7%) for males and 45 to 59 minutes (8 commuters, 42.1%) for females.
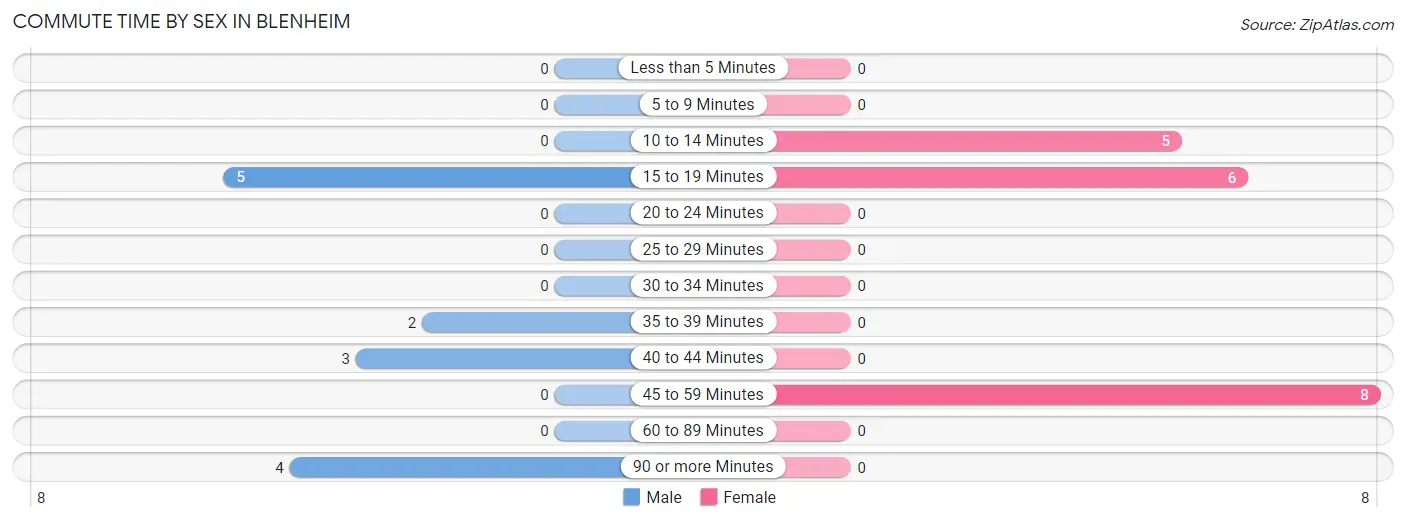
| Commute Time | Male | Female |
| Less than 5 Minutes | 0 (0.0%) | 0 (0.0%) |
| 5 to 9 Minutes | 0 (0.0%) | 0 (0.0%) |
| 10 to 14 Minutes | 0 (0.0%) | 5 (26.3%) |
| 15 to 19 Minutes | 5 (35.7%) | 6 (31.6%) |
| 20 to 24 Minutes | 0 (0.0%) | 0 (0.0%) |
| 25 to 29 Minutes | 0 (0.0%) | 0 (0.0%) |
| 30 to 34 Minutes | 0 (0.0%) | 0 (0.0%) |
| 35 to 39 Minutes | 2 (14.3%) | 0 (0.0%) |
| 40 to 44 Minutes | 3 (21.4%) | 0 (0.0%) |
| 45 to 59 Minutes | 0 (0.0%) | 8 (42.1%) |
| 60 to 89 Minutes | 0 (0.0%) | 0 (0.0%) |
| 90 or more Minutes | 4 (28.6%) | 0 (0.0%) |
Time of Departure to Work by Sex in Blenheim
The most frequent times of departure to work in Blenheim are 12:00 AM to 4:59 AM (8, 57.1%) for males and 7:00 AM to 7:29 AM (8, 42.1%) for females.
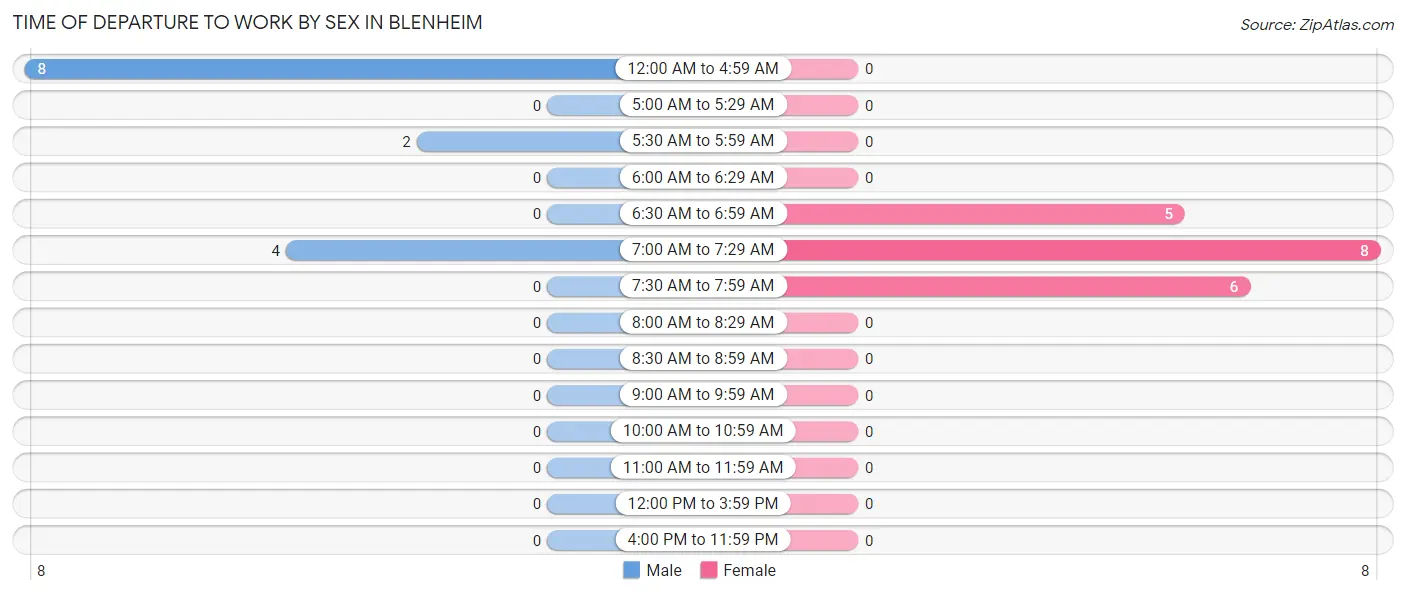
| Time of Departure | Male | Female |
| 12:00 AM to 4:59 AM | 8 (57.1%) | 0 (0.0%) |
| 5:00 AM to 5:29 AM | 0 (0.0%) | 0 (0.0%) |
| 5:30 AM to 5:59 AM | 2 (14.3%) | 0 (0.0%) |
| 6:00 AM to 6:29 AM | 0 (0.0%) | 0 (0.0%) |
| 6:30 AM to 6:59 AM | 0 (0.0%) | 5 (26.3%) |
| 7:00 AM to 7:29 AM | 4 (28.6%) | 8 (42.1%) |
| 7:30 AM to 7:59 AM | 0 (0.0%) | 6 (31.6%) |
| 8:00 AM to 8:29 AM | 0 (0.0%) | 0 (0.0%) |
| 8:30 AM to 8:59 AM | 0 (0.0%) | 0 (0.0%) |
| 9:00 AM to 9:59 AM | 0 (0.0%) | 0 (0.0%) |
| 10:00 AM to 10:59 AM | 0 (0.0%) | 0 (0.0%) |
| 11:00 AM to 11:59 AM | 0 (0.0%) | 0 (0.0%) |
| 12:00 PM to 3:59 PM | 0 (0.0%) | 0 (0.0%) |
| 4:00 PM to 11:59 PM | 0 (0.0%) | 0 (0.0%) |
| Total | 14 (100.0%) | 19 (100.0%) |
Housing Occupancy in Blenheim
Occupancy by Ownership in Blenheim
Of the total 30 dwellings in Blenheim, owner-occupied units account for 14 (46.7%), while renter-occupied units make up 16 (53.3%).
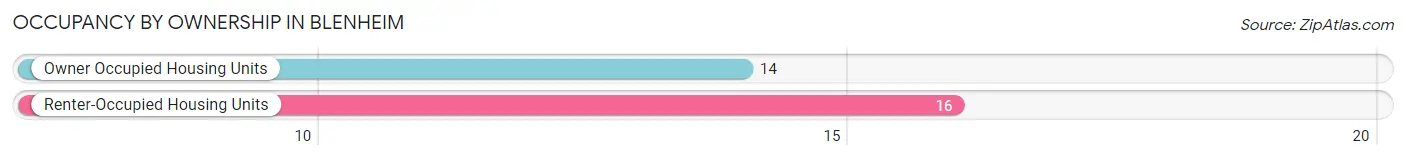
| Occupancy | # Housing Units | % Housing Units |
| Owner Occupied Housing Units | 14 | 46.7% |
| Renter-Occupied Housing Units | 16 | 53.3% |
| Total Occupied Housing Units | 30 | 100.0% |
Occupancy by Household Size in Blenheim
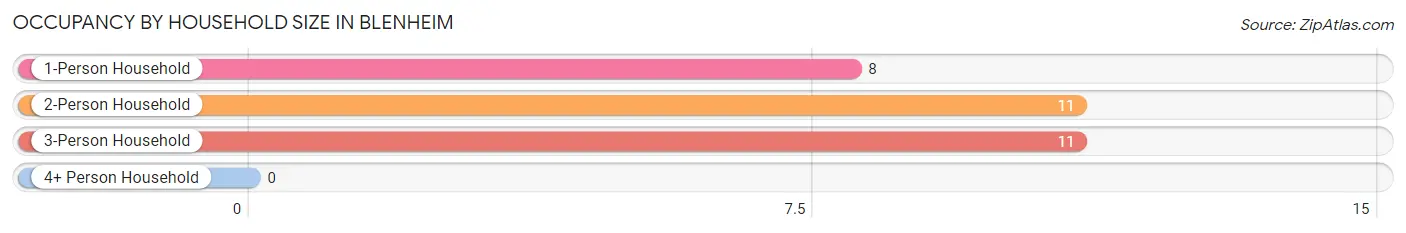
| Household Size | # Housing Units | % Housing Units |
| 1-Person Household | 8 | 26.7% |
| 2-Person Household | 11 | 36.7% |
| 3-Person Household | 11 | 36.7% |
| 4+ Person Household | 0 | 0.0% |
| Total Housing Units | 30 | 100.0% |
Occupancy by Ownership by Household Size in Blenheim
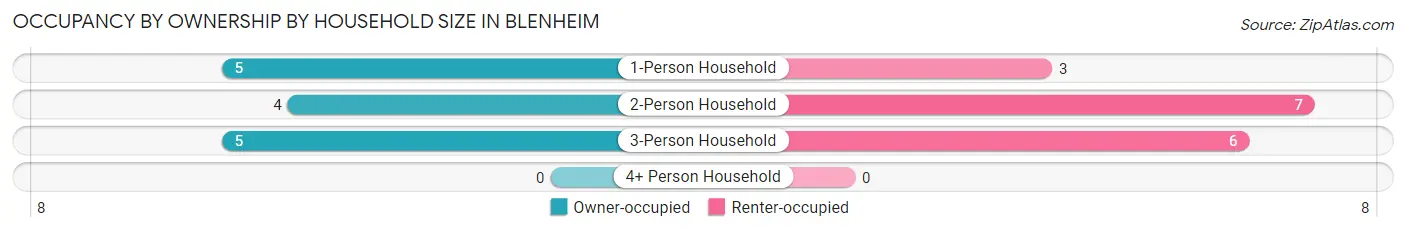
| Household Size | Owner-occupied | Renter-occupied |
| 1-Person Household | 5 (62.5%) | 3 (37.5%) |
| 2-Person Household | 4 (36.4%) | 7 (63.6%) |
| 3-Person Household | 5 (45.5%) | 6 (54.5%) |
| 4+ Person Household | 0 (0.0%) | 0 (0.0%) |
| Total Housing Units | 14 (46.7%) | 16 (53.3%) |
Occupancy by Educational Attainment in Blenheim
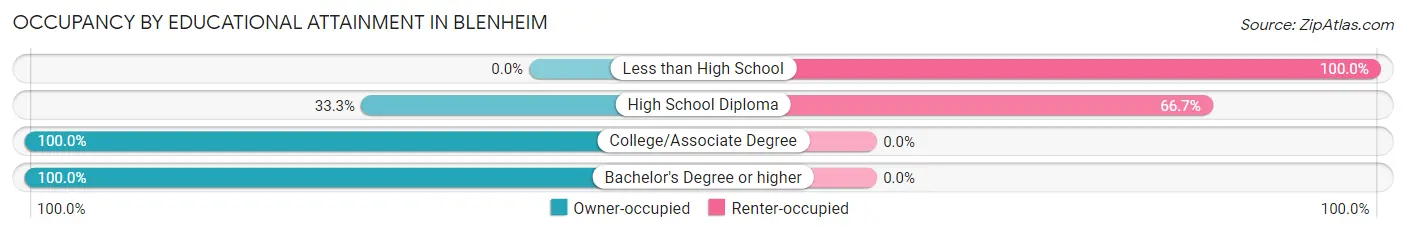
| Household Size | Owner-occupied | Renter-occupied |
| Less than High School | 0 (0.0%) | 6 (100.0%) |
| High School Diploma | 5 (33.3%) | 10 (66.7%) |
| College/Associate Degree | 2 (100.0%) | 0 (0.0%) |
| Bachelor's Degree or higher | 7 (100.0%) | 0 (0.0%) |
Occupancy by Age of Householder in Blenheim
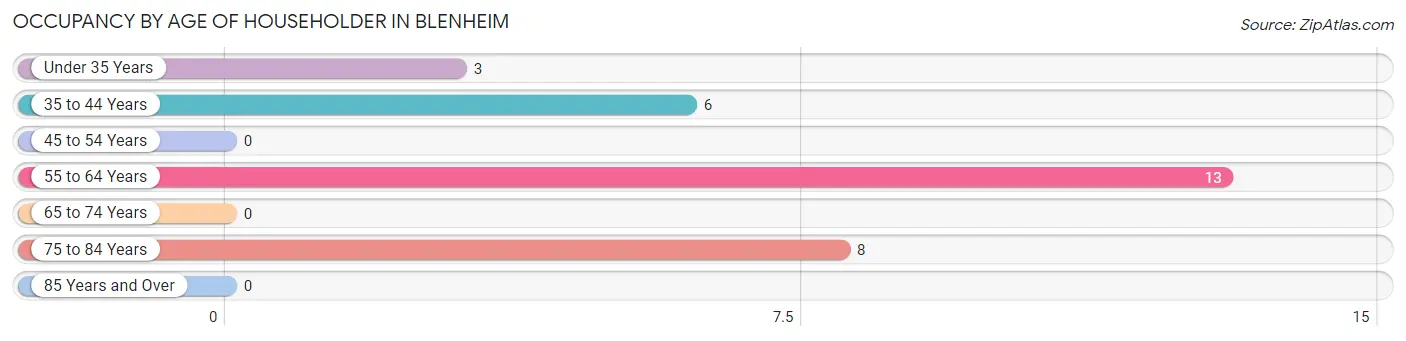
| Age Bracket | # Households | % Households |
| Under 35 Years | 3 | 10.0% |
| 35 to 44 Years | 6 | 20.0% |
| 45 to 54 Years | 0 | 0.0% |
| 55 to 64 Years | 13 | 43.3% |
| 65 to 74 Years | 0 | 0.0% |
| 75 to 84 Years | 8 | 26.7% |
| 85 Years and Over | 0 | 0.0% |
| Total | 30 | 100.0% |
Housing Finances in Blenheim
Median Income by Occupancy in Blenheim
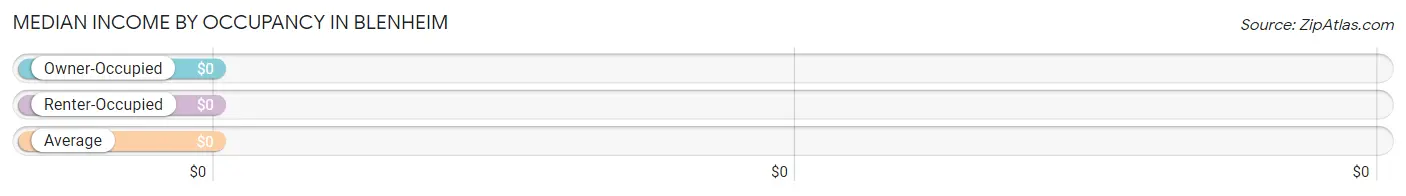
| Occupancy Type | # Households | Median Income |
| Owner-Occupied | 14 (46.7%) | $0 |
| Renter-Occupied | 16 (53.3%) | $0 |
| Average | 30 (100.0%) | $0 |
Occupancy by Householder Income Bracket in Blenheim
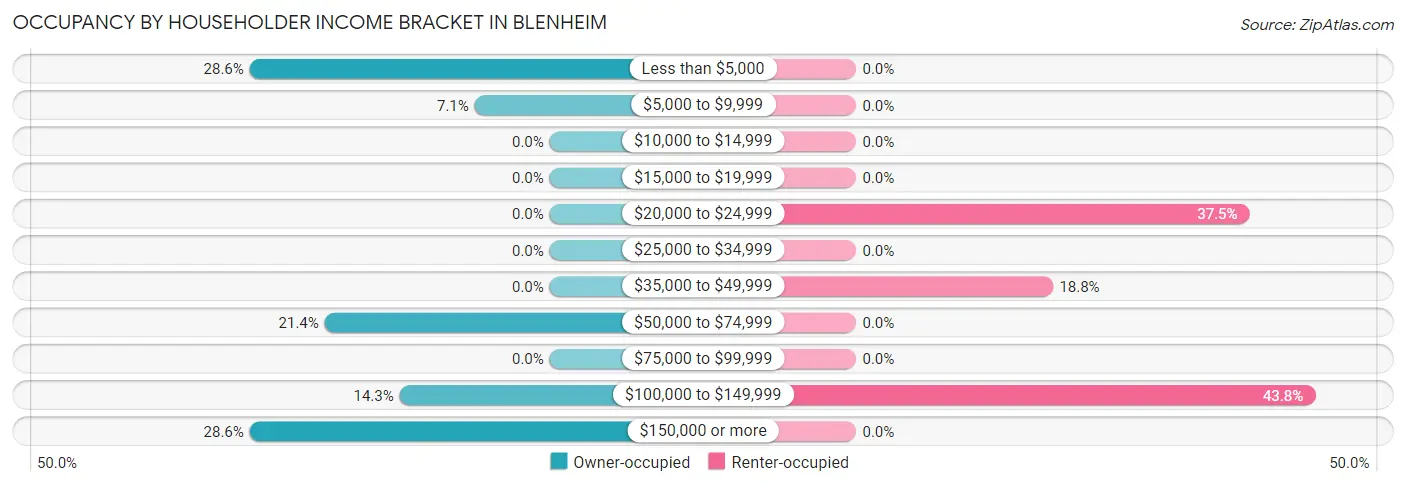
| Income Bracket | Owner-occupied | Renter-occupied |
| Less than $5,000 | 4 (28.6%) | 0 (0.0%) |
| $5,000 to $9,999 | 1 (7.1%) | 0 (0.0%) |
| $10,000 to $14,999 | 0 (0.0%) | 0 (0.0%) |
| $15,000 to $19,999 | 0 (0.0%) | 0 (0.0%) |
| $20,000 to $24,999 | 0 (0.0%) | 6 (37.5%) |
| $25,000 to $34,999 | 0 (0.0%) | 0 (0.0%) |
| $35,000 to $49,999 | 0 (0.0%) | 3 (18.8%) |
| $50,000 to $74,999 | 3 (21.4%) | 0 (0.0%) |
| $75,000 to $99,999 | 0 (0.0%) | 0 (0.0%) |
| $100,000 to $149,999 | 2 (14.3%) | 7 (43.8%) |
| $150,000 or more | 4 (28.6%) | 0 (0.0%) |
| Total | 14 (100.0%) | 16 (100.0%) |
Monthly Housing Cost Tiers in Blenheim
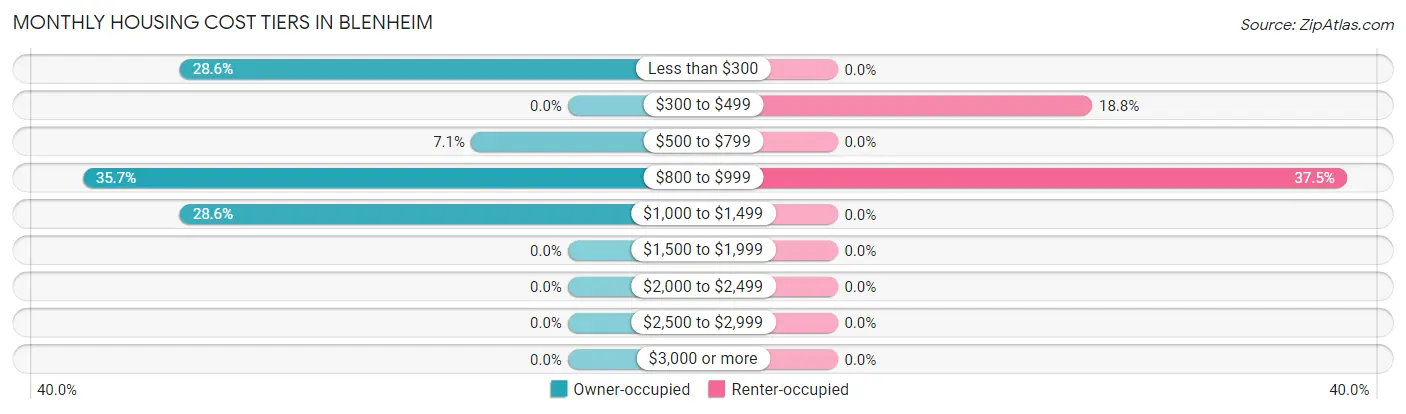
| Monthly Cost | Owner-occupied | Renter-occupied |
| Less than $300 | 4 (28.6%) | 0 (0.0%) |
| $300 to $499 | 0 (0.0%) | 3 (18.8%) |
| $500 to $799 | 1 (7.1%) | 0 (0.0%) |
| $800 to $999 | 5 (35.7%) | 6 (37.5%) |
| $1,000 to $1,499 | 4 (28.6%) | 0 (0.0%) |
| $1,500 to $1,999 | 0 (0.0%) | 0 (0.0%) |
| $2,000 to $2,499 | 0 (0.0%) | 0 (0.0%) |
| $2,500 to $2,999 | 0 (0.0%) | 0 (0.0%) |
| $3,000 or more | 0 (0.0%) | 0 (0.0%) |
| Total | 14 (100.0%) | 16 (100.0%) |
Physical Housing Characteristics in Blenheim
Housing Structures in Blenheim
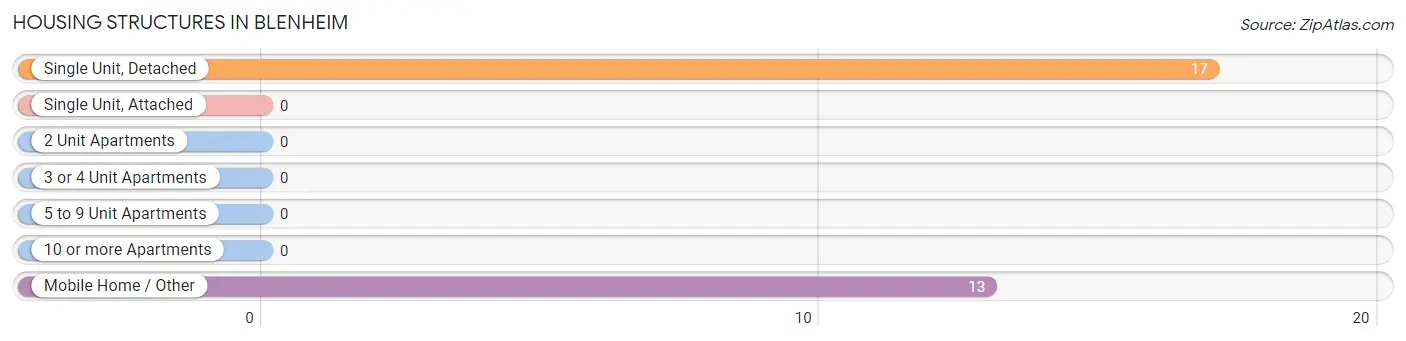
| Structure Type | # Housing Units | % Housing Units |
| Single Unit, Detached | 17 | 56.7% |
| Single Unit, Attached | 0 | 0.0% |
| 2 Unit Apartments | 0 | 0.0% |
| 3 or 4 Unit Apartments | 0 | 0.0% |
| 5 to 9 Unit Apartments | 0 | 0.0% |
| 10 or more Apartments | 0 | 0.0% |
| Mobile Home / Other | 13 | 43.3% |
| Total | 30 | 100.0% |
Housing Structures by Occupancy in Blenheim
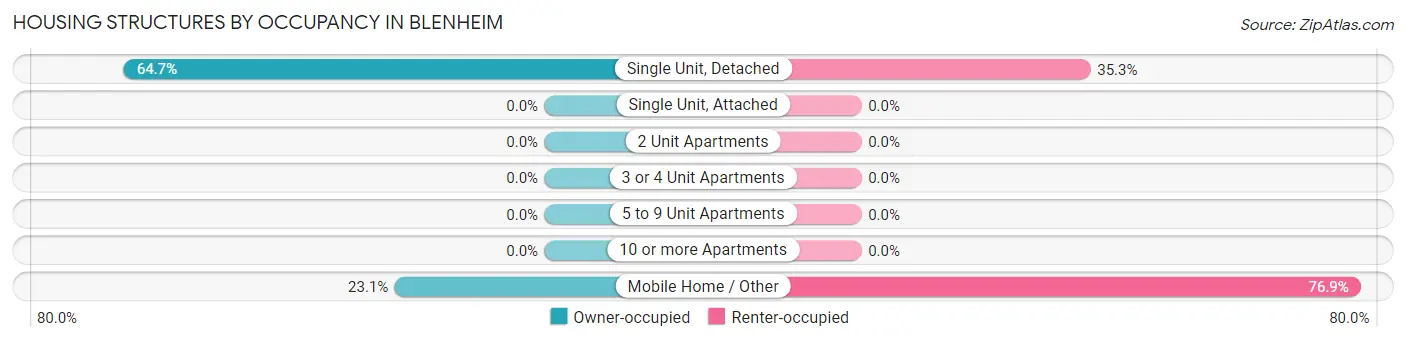
| Structure Type | Owner-occupied | Renter-occupied |
| Single Unit, Detached | 11 (64.7%) | 6 (35.3%) |
| Single Unit, Attached | 0 (0.0%) | 0 (0.0%) |
| 2 Unit Apartments | 0 (0.0%) | 0 (0.0%) |
| 3 or 4 Unit Apartments | 0 (0.0%) | 0 (0.0%) |
| 5 to 9 Unit Apartments | 0 (0.0%) | 0 (0.0%) |
| 10 or more Apartments | 0 (0.0%) | 0 (0.0%) |
| Mobile Home / Other | 3 (23.1%) | 10 (76.9%) |
| Total | 14 (46.7%) | 16 (53.3%) |
Housing Structures by Number of Rooms in Blenheim
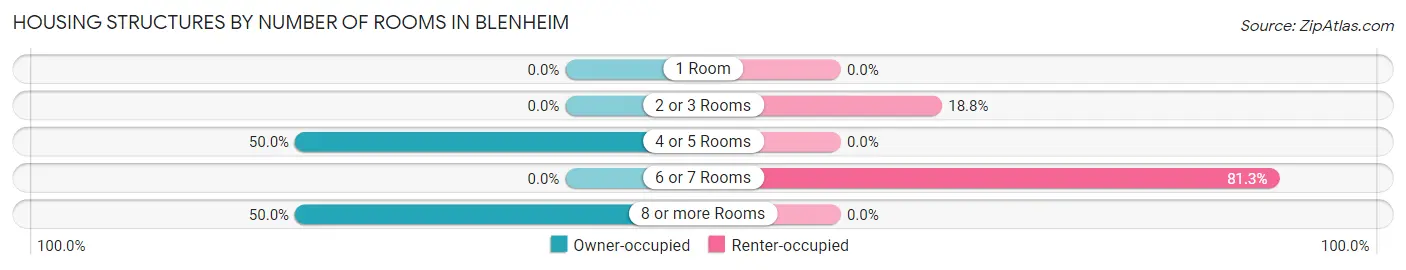
| Number of Rooms | Owner-occupied | Renter-occupied |
| 1 Room | 0 (0.0%) | 0 (0.0%) |
| 2 or 3 Rooms | 0 (0.0%) | 3 (18.8%) |
| 4 or 5 Rooms | 7 (50.0%) | 0 (0.0%) |
| 6 or 7 Rooms | 0 (0.0%) | 13 (81.2%) |
| 8 or more Rooms | 7 (50.0%) | 0 (0.0%) |
| Total | 14 (100.0%) | 16 (100.0%) |
Housing Structure by Heating Type in Blenheim
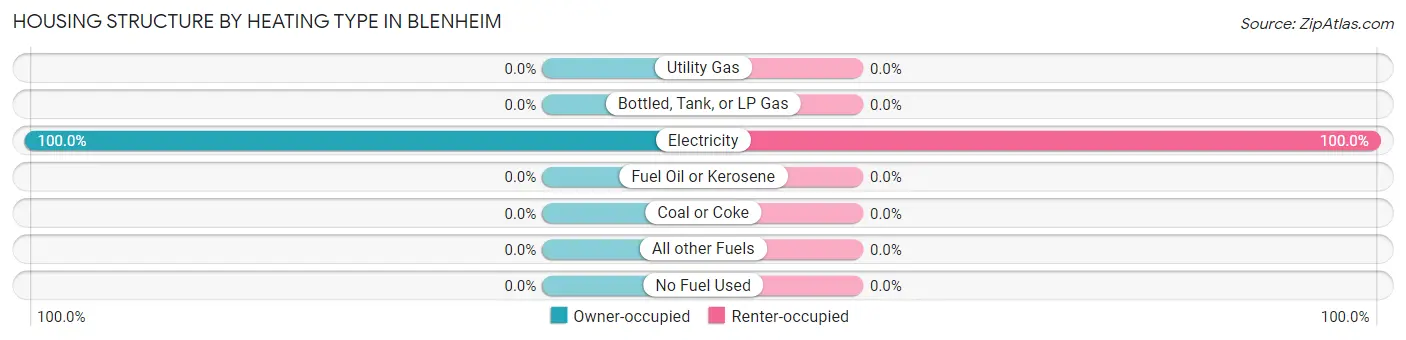
| Heating Type | Owner-occupied | Renter-occupied |
| Utility Gas | 0 (0.0%) | 0 (0.0%) |
| Bottled, Tank, or LP Gas | 0 (0.0%) | 0 (0.0%) |
| Electricity | 14 (100.0%) | 16 (100.0%) |
| Fuel Oil or Kerosene | 0 (0.0%) | 0 (0.0%) |
| Coal or Coke | 0 (0.0%) | 0 (0.0%) |
| All other Fuels | 0 (0.0%) | 0 (0.0%) |
| No Fuel Used | 0 (0.0%) | 0 (0.0%) |
| Total | 14 (100.0%) | 16 (100.0%) |
Household Vehicle Usage in Blenheim
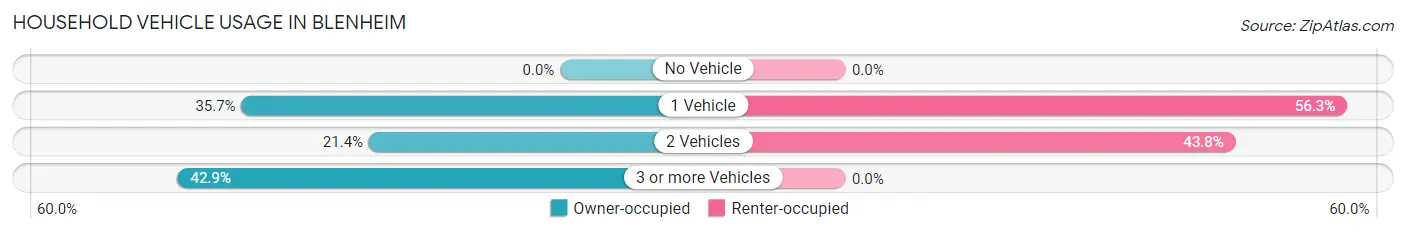
| Vehicles per Household | Owner-occupied | Renter-occupied |
| No Vehicle | 0 (0.0%) | 0 (0.0%) |
| 1 Vehicle | 5 (35.7%) | 9 (56.2%) |
| 2 Vehicles | 3 (21.4%) | 7 (43.8%) |
| 3 or more Vehicles | 6 (42.9%) | 0 (0.0%) |
| Total | 14 (100.0%) | 16 (100.0%) |
Real Estate & Mortgages in Blenheim
Real Estate and Mortgage Overview in Blenheim
| Characteristic | Without Mortgage | With Mortgage |
| Housing Units | 4 | 10 |
| Median Property Value | - | - |
| Median Household Income | - | - |
| Monthly Housing Costs | - | - |
| Real Estate Taxes | - | - |
Property Value by Mortgage Status in Blenheim
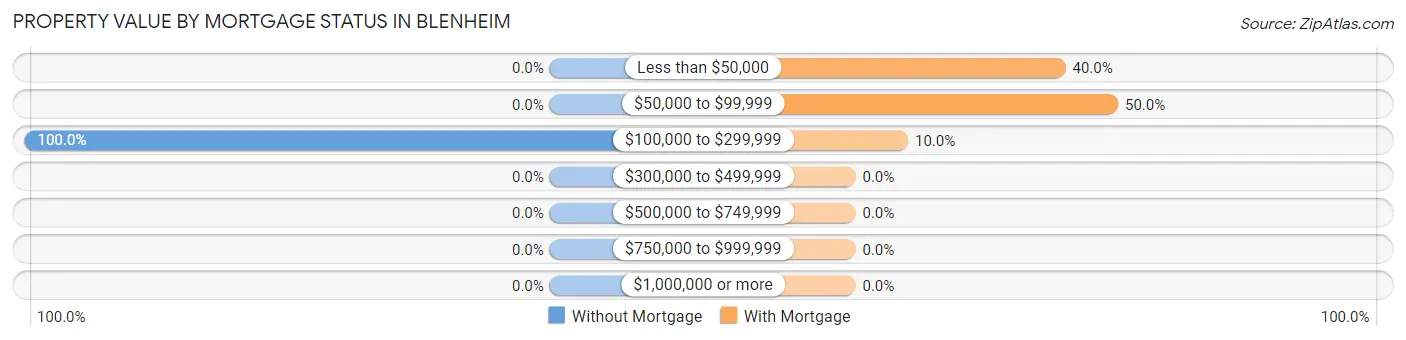
| Property Value | Without Mortgage | With Mortgage |
| Less than $50,000 | 0 (0.0%) | 4 (40.0%) |
| $50,000 to $99,999 | 0 (0.0%) | 5 (50.0%) |
| $100,000 to $299,999 | 4 (100.0%) | 1 (10.0%) |
| $300,000 to $499,999 | 0 (0.0%) | 0 (0.0%) |
| $500,000 to $749,999 | 0 (0.0%) | 0 (0.0%) |
| $750,000 to $999,999 | 0 (0.0%) | 0 (0.0%) |
| $1,000,000 or more | 0 (0.0%) | 0 (0.0%) |
| Total | 4 (100.0%) | 10 (100.0%) |
Household Income by Mortgage Status in Blenheim
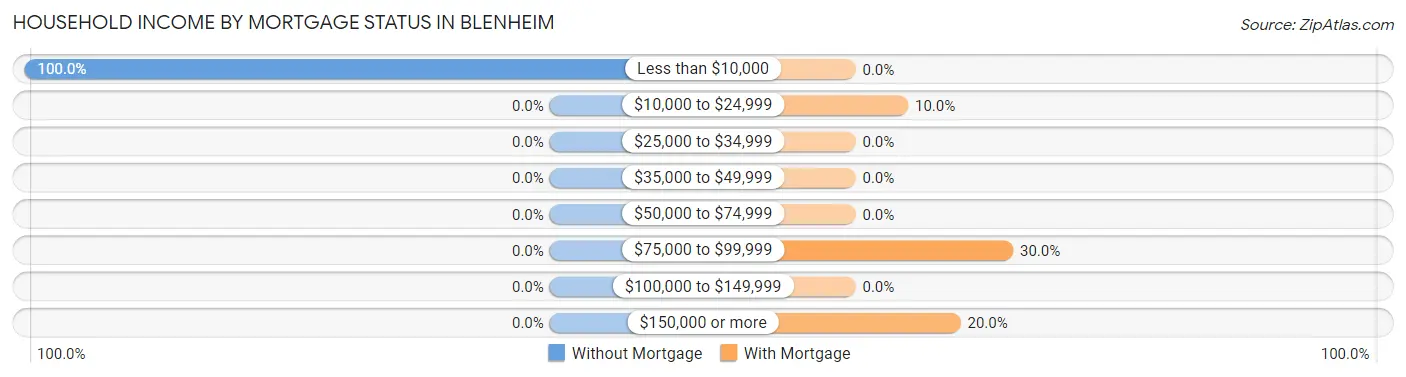
| Household Income | Without Mortgage | With Mortgage |
| Less than $10,000 | 4 (100.0%) | 0 (0.0%) |
| $10,000 to $24,999 | 0 (0.0%) | 1 (10.0%) |
| $25,000 to $34,999 | 0 (0.0%) | 0 (0.0%) |
| $35,000 to $49,999 | 0 (0.0%) | 0 (0.0%) |
| $50,000 to $74,999 | 0 (0.0%) | 0 (0.0%) |
| $75,000 to $99,999 | 0 (0.0%) | 3 (30.0%) |
| $100,000 to $149,999 | 0 (0.0%) | 0 (0.0%) |
| $150,000 or more | 0 (0.0%) | 2 (20.0%) |
| Total | 4 (100.0%) | 10 (100.0%) |
Property Value to Household Income Ratio in Blenheim
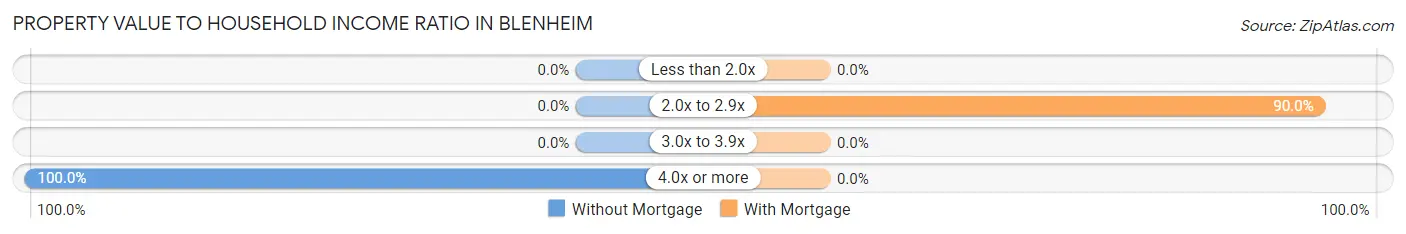
| Value-to-Income Ratio | Without Mortgage | With Mortgage |
| Less than 2.0x | 0 (0.0%) | 0 (0.0%) |
| 2.0x to 2.9x | 0 (0.0%) | 9 (90.0%) |
| 3.0x to 3.9x | 0 (0.0%) | 0 (0.0%) |
| 4.0x or more | 4 (100.0%) | 0 (0.0%) |
| Total | 4 (100.0%) | 10 (100.0%) |
Real Estate Taxes by Mortgage Status in Blenheim
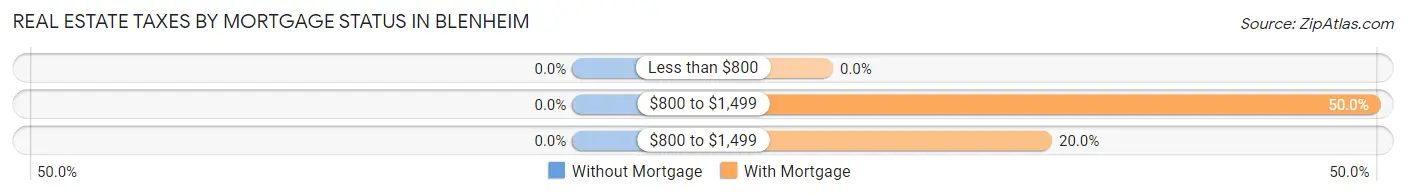
| Property Taxes | Without Mortgage | With Mortgage |
| Less than $800 | 0 (0.0%) | 0 (0.0%) |
| $800 to $1,499 | 0 (0.0%) | 5 (50.0%) |
| $800 to $1,499 | 0 (0.0%) | 2 (20.0%) |
| Total | 4 (100.0%) | 10 (100.0%) |
Health & Disability in Blenheim
Health Insurance Coverage by Age in Blenheim
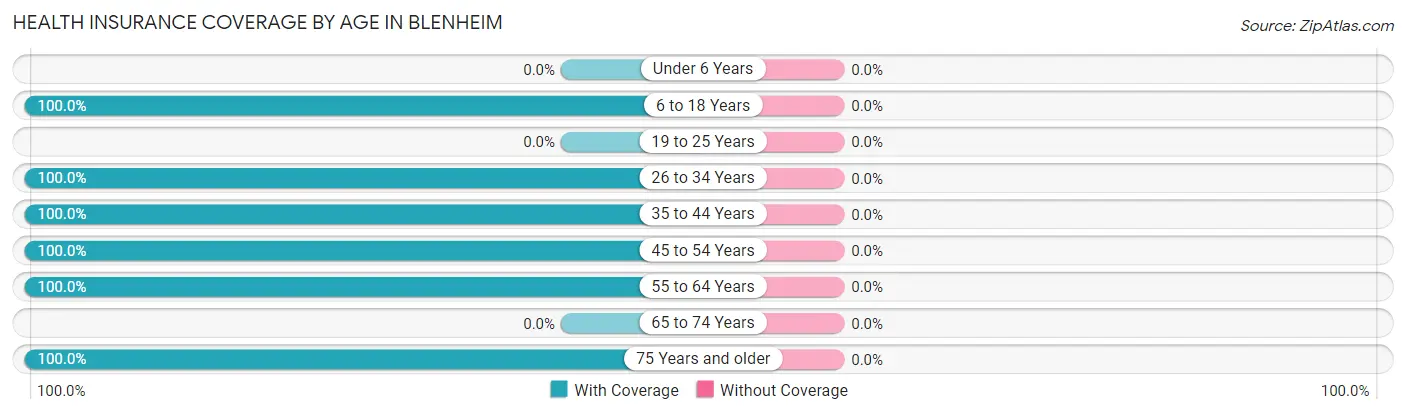
| Age Bracket | With Coverage | Without Coverage |
| Under 6 Years | 0 (0.0%) | 0 (0.0%) |
| 6 to 18 Years | 15 (100.0%) | 0 (0.0%) |
| 19 to 25 Years | 0 (0.0%) | 0 (0.0%) |
| 26 to 34 Years | 3 (100.0%) | 0 (0.0%) |
| 35 to 44 Years | 6 (100.0%) | 0 (0.0%) |
| 45 to 54 Years | 8 (100.0%) | 0 (0.0%) |
| 55 to 64 Years | 19 (100.0%) | 0 (0.0%) |
| 65 to 74 Years | 0 (0.0%) | 0 (0.0%) |
| 75 Years and older | 8 (100.0%) | 0 (0.0%) |
| Total | 59 (100.0%) | 0 (0.0%) |
Health Insurance Coverage by Citizenship Status in Blenheim
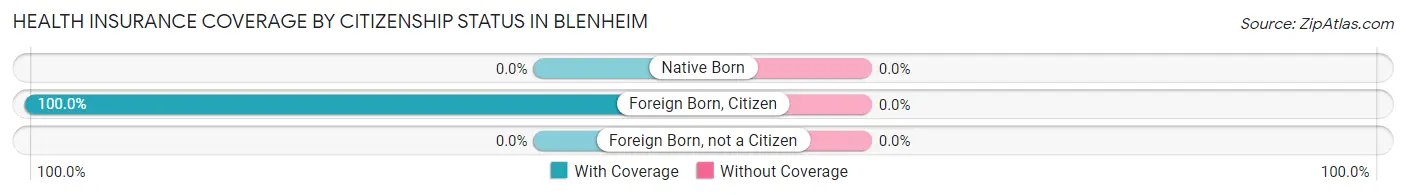
| Citizenship Status | With Coverage | Without Coverage |
| Native Born | 0 (0.0%) | 0 (0.0%) |
| Foreign Born, Citizen | 15 (100.0%) | 0 (0.0%) |
| Foreign Born, not a Citizen | 0 (0.0%) | 0 (0.0%) |
Health Insurance Coverage by Household Income in Blenheim
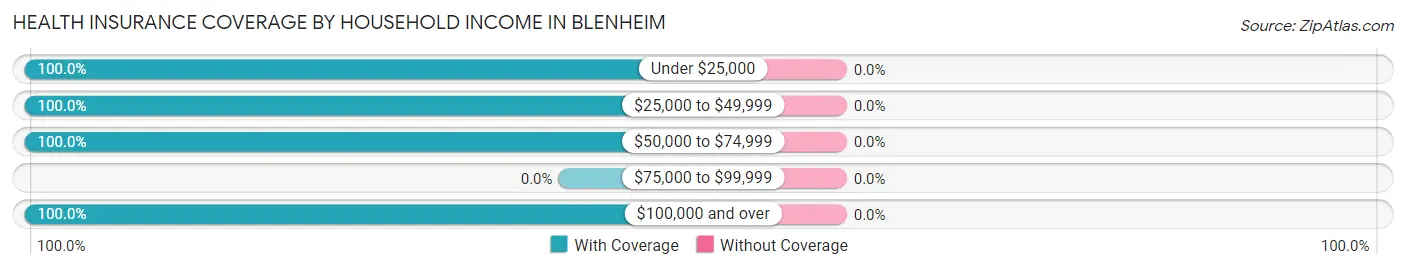
| Household Income | With Coverage | Without Coverage |
| Under $25,000 | 21 (100.0%) | 0 (0.0%) |
| $25,000 to $49,999 | 3 (100.0%) | 0 (0.0%) |
| $50,000 to $74,999 | 11 (100.0%) | 0 (0.0%) |
| $75,000 to $99,999 | 0 (0.0%) | 0 (0.0%) |
| $100,000 and over | 24 (100.0%) | 0 (0.0%) |
Public vs Private Health Insurance Coverage by Age in Blenheim
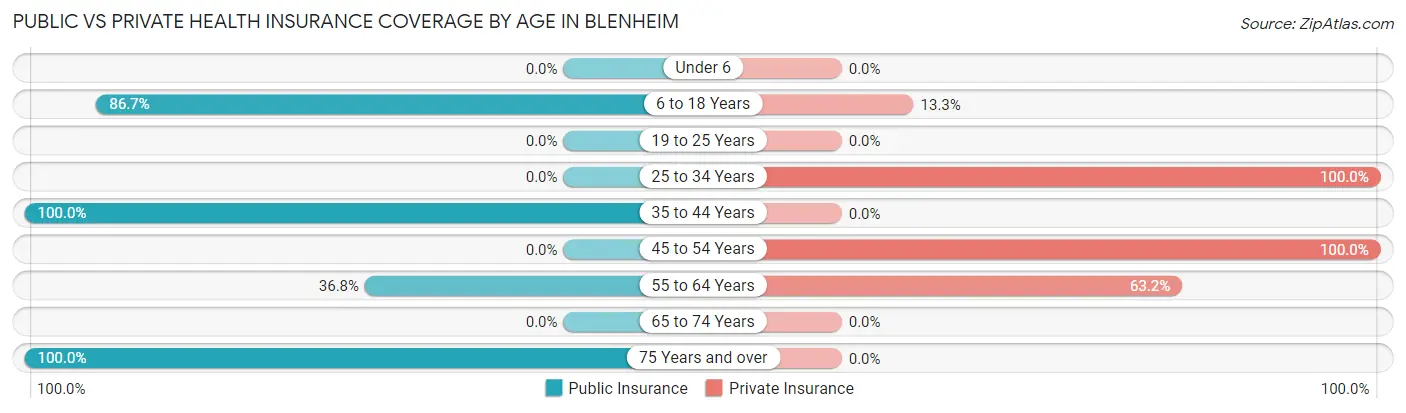
| Age Bracket | Public Insurance | Private Insurance |
| Under 6 | 0 (0.0%) | 0 (0.0%) |
| 6 to 18 Years | 13 (86.7%) | 2 (13.3%) |
| 19 to 25 Years | 0 (0.0%) | 0 (0.0%) |
| 25 to 34 Years | 0 (0.0%) | 3 (100.0%) |
| 35 to 44 Years | 6 (100.0%) | 0 (0.0%) |
| 45 to 54 Years | 0 (0.0%) | 8 (100.0%) |
| 55 to 64 Years | 7 (36.8%) | 12 (63.2%) |
| 65 to 74 Years | 0 (0.0%) | 0 (0.0%) |
| 75 Years and over | 8 (100.0%) | 0 (0.0%) |
| Total | 34 (57.6%) | 25 (42.4%) |
Disability Status by Sex by Age in Blenheim
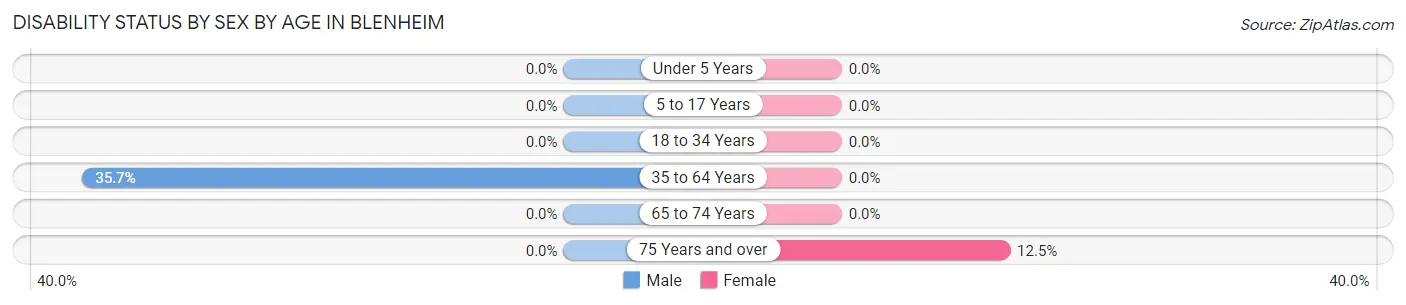
| Age Bracket | Male | Female |
| Under 5 Years | 0 (0.0%) | 0 (0.0%) |
| 5 to 17 Years | 0 (0.0%) | 0 (0.0%) |
| 18 to 34 Years | 0 (0.0%) | 0 (0.0%) |
| 35 to 64 Years | 5 (35.7%) | 0 (0.0%) |
| 65 to 74 Years | 0 (0.0%) | 0 (0.0%) |
| 75 Years and over | 0 (0.0%) | 1 (12.5%) |
Disability Class by Sex by Age in Blenheim
Disability Class: Hearing Difficulty
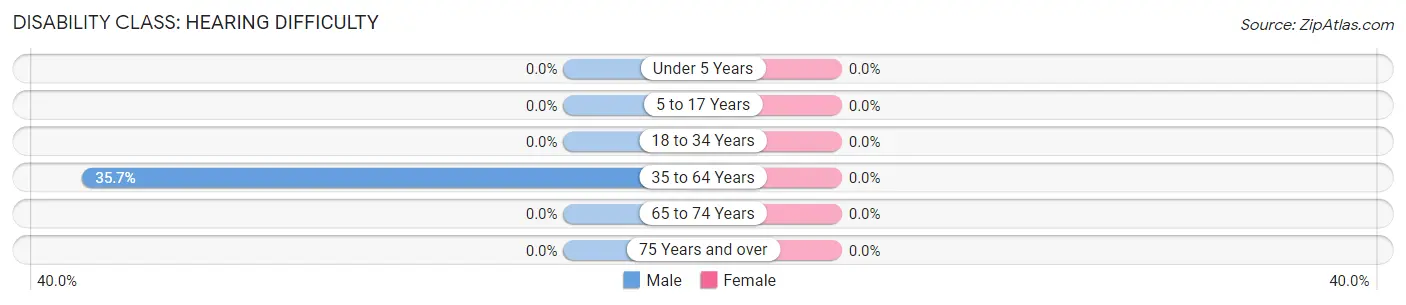
| Age Bracket | Male | Female |
| Under 5 Years | 0 (0.0%) | 0 (0.0%) |
| 5 to 17 Years | 0 (0.0%) | 0 (0.0%) |
| 18 to 34 Years | 0 (0.0%) | 0 (0.0%) |
| 35 to 64 Years | 5 (35.7%) | 0 (0.0%) |
| 65 to 74 Years | 0 (0.0%) | 0 (0.0%) |
| 75 Years and over | 0 (0.0%) | 0 (0.0%) |
Disability Class: Vision Difficulty
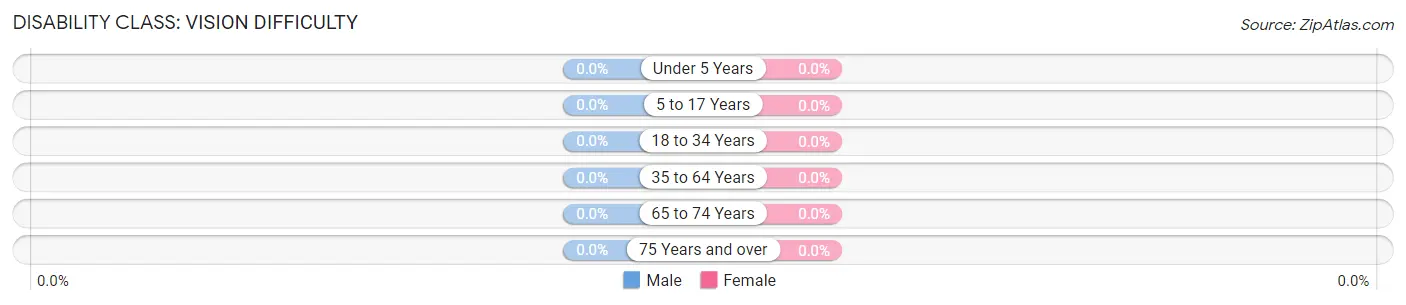
| Age Bracket | Male | Female |
| Under 5 Years | 0 (0.0%) | 0 (0.0%) |
| 5 to 17 Years | 0 (0.0%) | 0 (0.0%) |
| 18 to 34 Years | 0 (0.0%) | 0 (0.0%) |
| 35 to 64 Years | 0 (0.0%) | 0 (0.0%) |
| 65 to 74 Years | 0 (0.0%) | 0 (0.0%) |
| 75 Years and over | 0 (0.0%) | 0 (0.0%) |
Disability Class: Cognitive Difficulty
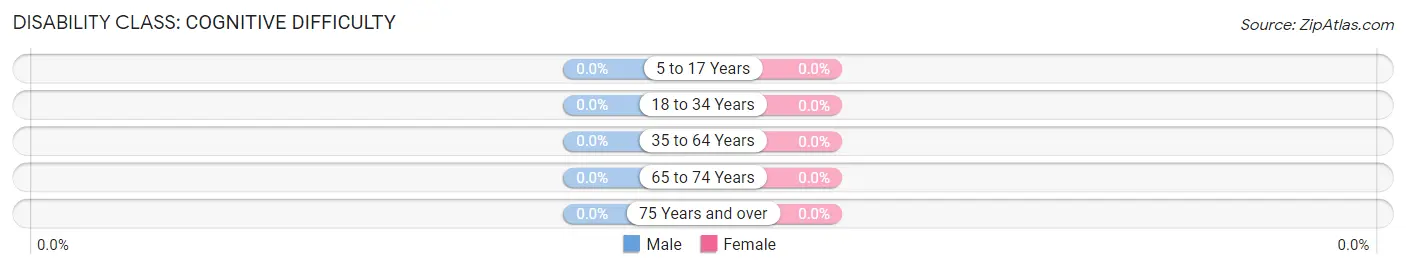
| Age Bracket | Male | Female |
| 5 to 17 Years | 0 (0.0%) | 0 (0.0%) |
| 18 to 34 Years | 0 (0.0%) | 0 (0.0%) |
| 35 to 64 Years | 0 (0.0%) | 0 (0.0%) |
| 65 to 74 Years | 0 (0.0%) | 0 (0.0%) |
| 75 Years and over | 0 (0.0%) | 0 (0.0%) |
Disability Class: Ambulatory Difficulty
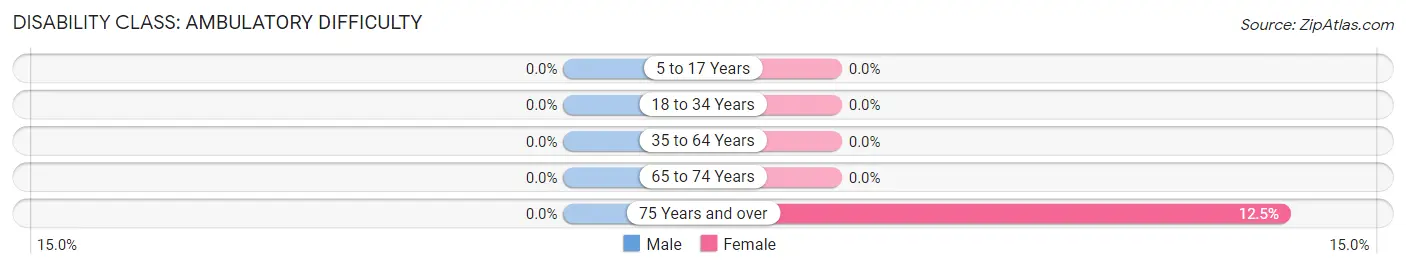
| Age Bracket | Male | Female |
| 5 to 17 Years | 0 (0.0%) | 0 (0.0%) |
| 18 to 34 Years | 0 (0.0%) | 0 (0.0%) |
| 35 to 64 Years | 0 (0.0%) | 0 (0.0%) |
| 65 to 74 Years | 0 (0.0%) | 0 (0.0%) |
| 75 Years and over | 0 (0.0%) | 1 (12.5%) |
Disability Class: Self-Care Difficulty
| Age Bracket | Male | Female |
| 5 to 17 Years | 0 (0.0%) | 0 (0.0%) |
| 18 to 34 Years | 0 (0.0%) | 0 (0.0%) |
| 35 to 64 Years | 0 (0.0%) | 0 (0.0%) |
| 65 to 74 Years | 0 (0.0%) | 0 (0.0%) |
| 75 Years and over | 0 (0.0%) | 0 (0.0%) |
Technology Access in Blenheim
Computing Device Access in Blenheim
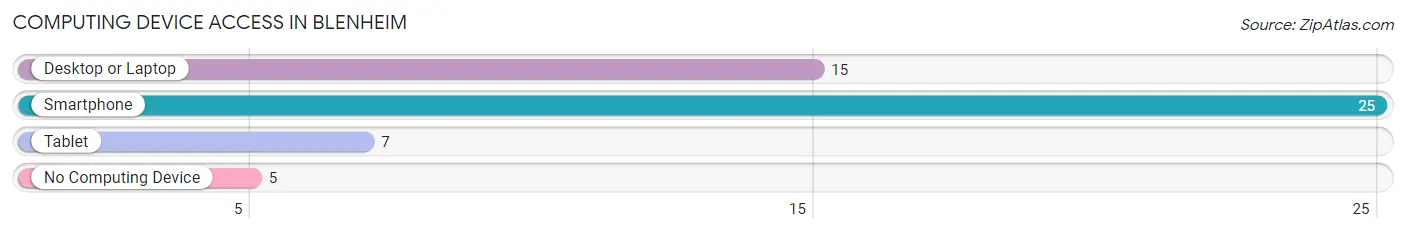
| Device Type | # Households | % Households |
| Desktop or Laptop | 15 | 50.0% |
| Smartphone | 25 | 83.3% |
| Tablet | 7 | 23.3% |
| No Computing Device | 5 | 16.7% |
| Total | 30 | 100.0% |
Internet Access in Blenheim
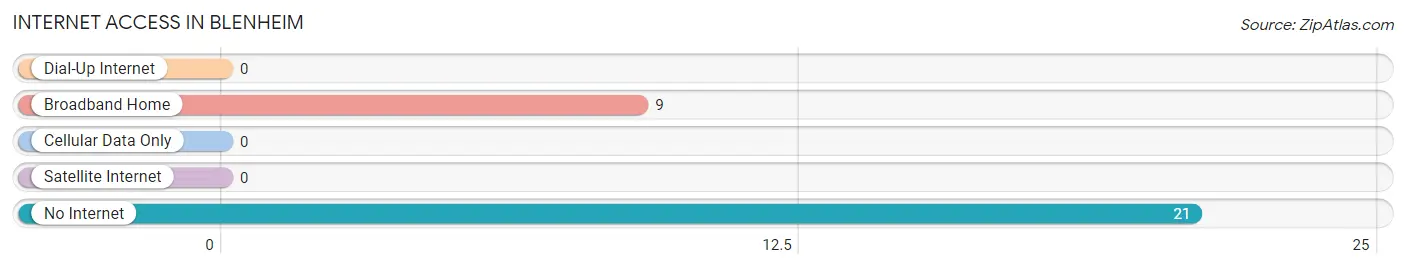
| Internet Type | # Households | % Households |
| Dial-Up Internet | 0 | 0.0% |
| Broadband Home | 9 | 30.0% |
| Cellular Data Only | 0 | 0.0% |
| Satellite Internet | 0 | 0.0% |
| No Internet | 21 | 70.0% |
| Total | 30 | 100.0% |
Blenheim Summary
Blenheim is a small town located in Marlboro County, South Carolina. It is situated in the northeastern corner of the state, near the border with North Carolina. The town has a population of approximately 1,500 people and is part of the Florence Metropolitan Statistical Area.
History
Blenheim was founded in 1790 by a group of settlers from Scotland. The town was named after the Battle of Blenheim, which was fought in 1704 during the War of the Spanish Succession. The town was incorporated in 1820 and has remained relatively unchanged since then.
Geography
Blenheim is located in the northeastern corner of South Carolina, near the border with North Carolina. The town is situated in the Pee Dee region of the state, which is known for its flat terrain and sandy soil. The town is located on the banks of the Great Pee Dee River, which is a major tributary of the Atlantic Ocean. The town is also located near the Waccamaw National Wildlife Refuge, which is a popular destination for birdwatchers and nature enthusiasts.
Economy
The economy of Blenheim is largely based on agriculture. The town is home to several farms, which produce a variety of crops, including corn, soybeans, cotton, and peanuts. The town also has a thriving timber industry, which produces lumber for the construction industry. In addition, the town is home to several small businesses, including restaurants, retail stores, and service providers.
Demographics
As of the 2010 census, the population of Blenheim was 1,500. The racial makeup of the town was 79.2% White, 17.3% African American, 0.7% Native American, 0.3% Asian, and 2.5% from other races. The median household income was $30,938, and the median family income was $37,500. The per capita income was $15,945.
Conclusion
Blenheim is a small town located in Marlboro County, South Carolina. It has a population of approximately 1,500 people and is part of the Florence Metropolitan Statistical Area. The town was founded in 1790 by a group of settlers from Scotland and has remained relatively unchanged since then. The economy of Blenheim is largely based on agriculture, timber, and small businesses. The racial makeup of the town is 79.2% White, 17.3% African American, 0.7% Native American, 0.3% Asian, and 2.5% from other races. The median household income was $30,938, and the median family income was $37,500.
Common Questions
What is Per Capita Income in Blenheim?
Per Capita income in Blenheim is $36,517.
What is the Median Family Income in Blenheim?
Median Family Income in Blenheim is $103,214.
What is Inequality or Gini Index in Blenheim?
Inequality or Gini Index in Blenheim is 0.45.
What is the Total Population of Blenheim?
Total Population of Blenheim is 63.
What is the Total Male Population of Blenheim?
Total Male Population of Blenheim is 27.
What is the Total Female Population of Blenheim?
Total Female Population of Blenheim is 36.
What is the Ratio of Males per 100 Females in Blenheim?
There are 75.00 Males per 100 Females in Blenheim.
What is the Ratio of Females per 100 Males in Blenheim?
There are 133.33 Females per 100 Males in Blenheim.
What is the Median Population Age in Blenheim?
Median Population Age in Blenheim is 53.9 Years.
What is the Average Family Size in Blenheim
Average Family Size in Blenheim is 2.5 People.
What is the Average Household Size in Blenheim
Average Household Size in Blenheim is 2.1 People.
How Large is the Labor Force in Blenheim?
There are 33 People in the Labor Forcein in Blenheim.
What is the Percentage of People in the Labor Force in Blenheim?
61.1% of People are in the Labor Force in Blenheim.