Abbeville, SC Map & Demographics
Abbeville Map
Abbeville Overview
$32,207
PER CAPITA INCOME
$50,461
AVG FAMILY INCOME
$41,025
AVG HOUSEHOLD INCOME
27.5%
WAGE / INCOME GAP [ % ]
72.5¢/ $1
WAGE / INCOME GAP [ $ ]
0.62
INEQUALITY / GINI INDEX
4,892
TOTAL POPULATION
2,422
MALE POPULATION
2,470
FEMALE POPULATION
98.06
MALES / 100 FEMALES
101.98
FEMALES / 100 MALES
38.1
MEDIAN AGE
3.5
AVG FAMILY SIZE
2.4
AVG HOUSEHOLD SIZE
1,975
LABOR FORCE [ PEOPLE ]
54.7%
PERCENT IN LABOR FORCE
4.7%
UNEMPLOYMENT RATE
Abbeville Zip Codes
Abbeville Area Codes
Income in Abbeville
Income Overview in Abbeville
Per Capita Income in Abbeville is $32,207, while median incomes of families and households are $50,461 and $41,025 respectively.
| Characteristic | Number | Measure |
| Per Capita Income | 4,892 | $32,207 |
| Median Family Income | 1,035 | $50,461 |
| Mean Family Income | 1,035 | $61,521 |
| Median Household Income | 2,013 | $41,025 |
| Mean Household Income | 2,013 | $73,822 |
| Income Deficit | 1,035 | $0 |
| Wage / Income Gap (%) | 4,892 | 27.46% |
| Wage / Income Gap ($) | 4,892 | 72.54¢ per $1 |
| Gini / Inequality Index | 4,892 | 0.62 |
Earnings by Sex in Abbeville
Average Earnings in Abbeville are $32,809, $34,306 for men and $24,886 for women, a difference of 27.5%.
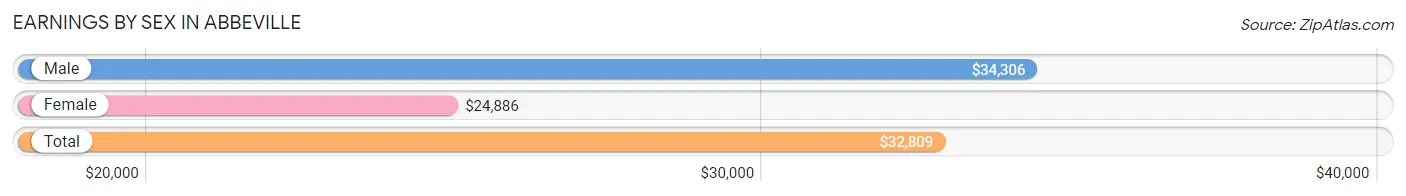
| Sex | Number | Average Earnings |
| Male | 1,104 (53.0%) | $34,306 |
| Female | 978 (47.0%) | $24,886 |
| Total | 2,082 (100.0%) | $32,809 |
Earnings by Sex by Income Bracket in Abbeville
The most common earnings brackets in Abbeville are $35,000 to $39,999 for men (215 | 19.5%) and $40,000 to $44,999 for women (90 | 9.2%).
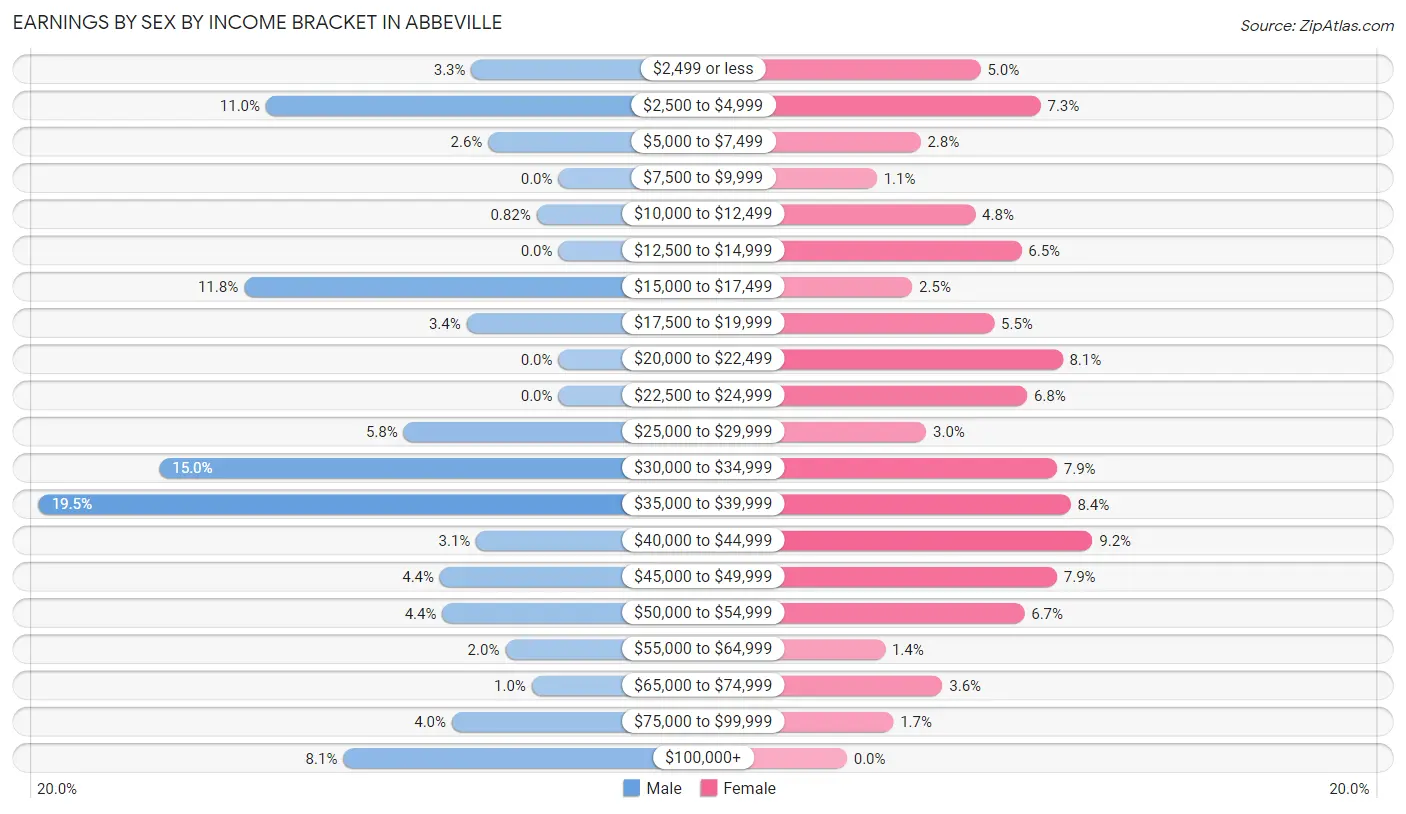
| Income | Male | Female |
| $2,499 or less | 36 (3.3%) | 49 (5.0%) |
| $2,500 to $4,999 | 121 (11.0%) | 71 (7.3%) |
| $5,000 to $7,499 | 29 (2.6%) | 27 (2.8%) |
| $7,500 to $9,999 | 0 (0.0%) | 11 (1.1%) |
| $10,000 to $12,499 | 9 (0.8%) | 47 (4.8%) |
| $12,500 to $14,999 | 0 (0.0%) | 64 (6.5%) |
| $15,000 to $17,499 | 130 (11.8%) | 24 (2.5%) |
| $17,500 to $19,999 | 38 (3.4%) | 54 (5.5%) |
| $20,000 to $22,499 | 0 (0.0%) | 79 (8.1%) |
| $22,500 to $24,999 | 0 (0.0%) | 66 (6.8%) |
| $25,000 to $29,999 | 64 (5.8%) | 29 (3.0%) |
| $30,000 to $34,999 | 165 (14.9%) | 77 (7.9%) |
| $35,000 to $39,999 | 215 (19.5%) | 82 (8.4%) |
| $40,000 to $44,999 | 34 (3.1%) | 90 (9.2%) |
| $45,000 to $49,999 | 49 (4.4%) | 77 (7.9%) |
| $50,000 to $54,999 | 48 (4.3%) | 65 (6.7%) |
| $55,000 to $64,999 | 22 (2.0%) | 14 (1.4%) |
| $65,000 to $74,999 | 11 (1.0%) | 35 (3.6%) |
| $75,000 to $99,999 | 44 (4.0%) | 17 (1.7%) |
| $100,000+ | 89 (8.1%) | 0 (0.0%) |
| Total | 1,104 (100.0%) | 978 (100.0%) |
Earnings by Sex by Educational Attainment in Abbeville
Average earnings in Abbeville are $34,583 for men and $31,642 for women, a difference of 8.5%. Men with an educational attainment of bachelor's degree enjoy the highest average annual earnings of $43,750, while those with high school diploma education earn the least with $33,420. Women with an educational attainment of graduate degree earn the most with the average annual earnings of $43,611, while those with high school diploma education have the smallest earnings of $20,565.
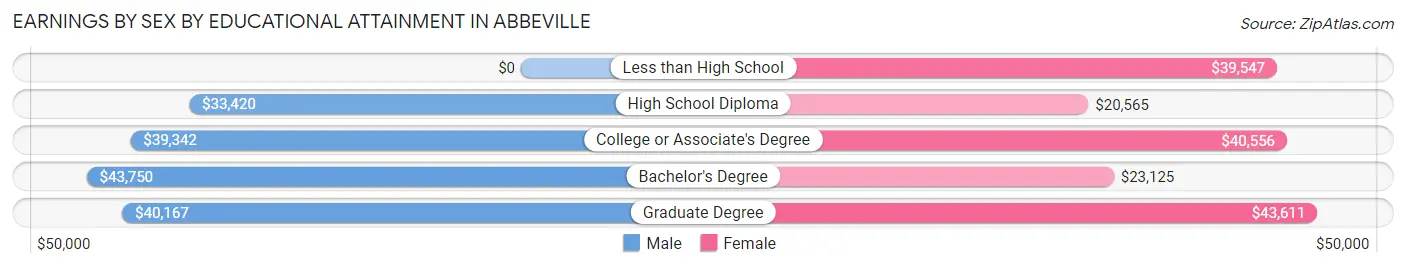
| Educational Attainment | Male Income | Female Income |
| Less than High School | - | - |
| High School Diploma | $33,420 | $20,565 |
| College or Associate's Degree | $39,342 | $40,556 |
| Bachelor's Degree | $43,750 | $23,125 |
| Graduate Degree | $40,167 | $43,611 |
| Total | $34,583 | $31,642 |
Family Income in Abbeville
Family Income Brackets in Abbeville
According to the Abbeville family income data, there are 193 families falling into the $50,000 to $74,999 income range, which is the most common income bracket and makes up 18.6% of all families. Conversely, the $200,000+ income bracket is the least frequent group with only 20 families (1.9%) belonging to this category.
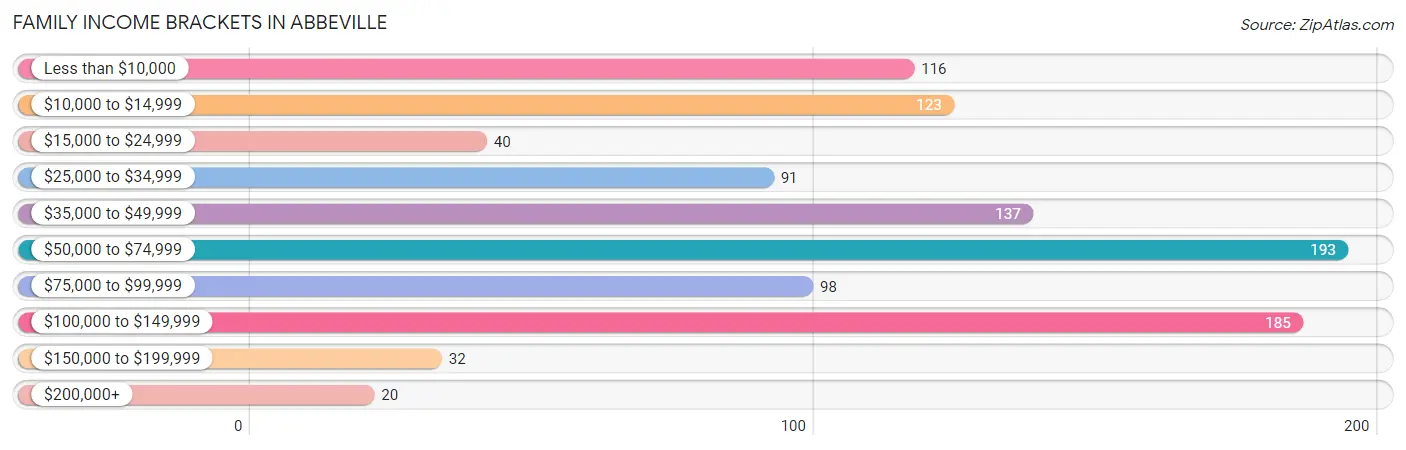
| Income Bracket | # Families | % Families |
| Less than $10,000 | 116 | 11.2% |
| $10,000 to $14,999 | 123 | 11.9% |
| $15,000 to $24,999 | 40 | 3.9% |
| $25,000 to $34,999 | 91 | 8.8% |
| $35,000 to $49,999 | 137 | 13.2% |
| $50,000 to $74,999 | 193 | 18.6% |
| $75,000 to $99,999 | 98 | 9.5% |
| $100,000 to $149,999 | 185 | 17.9% |
| $150,000 to $199,999 | 32 | 3.1% |
| $200,000+ | 20 | 1.9% |
Family Income by Famaliy Size in Abbeville
4-person families (133 | 12.9%) account for the highest median family income in Abbeville with $75,868 per family, while 2-person families (606 | 58.6%) have the highest median income of $25,441 per family member.
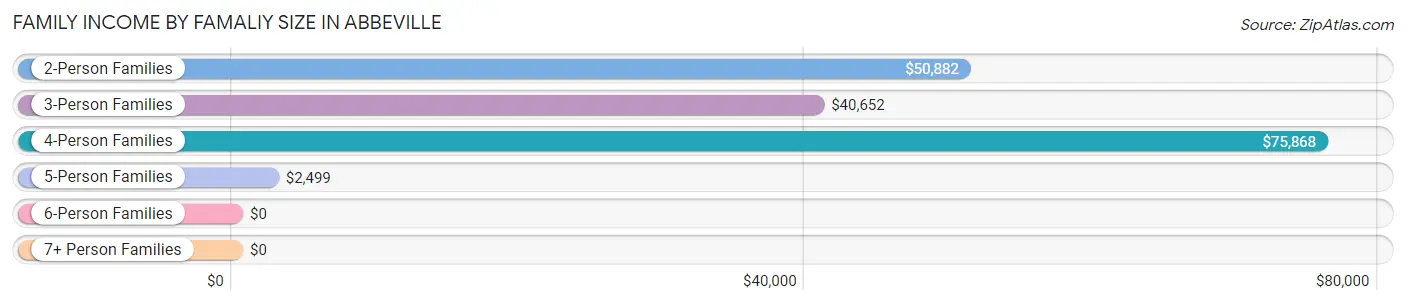
| Income Bracket | # Families | Median Income |
| 2-Person Families | 606 (58.6%) | $50,882 |
| 3-Person Families | 152 (14.7%) | $40,652 |
| 4-Person Families | 133 (12.9%) | $75,868 |
| 5-Person Families | 68 (6.6%) | $2,499 |
| 6-Person Families | 0 (0.0%) | $0 |
| 7+ Person Families | 76 (7.3%) | $0 |
| Total | 1,035 (100.0%) | $50,461 |
Family Income by Number of Earners in Abbeville
The median family income in Abbeville is $50,461, with families comprising 3+ earners (107) having the highest median family income of $112,019, while families with 1 earner (320) have the lowest median family income of $25,250, accounting for 10.3% and 30.9% of families, respectively.
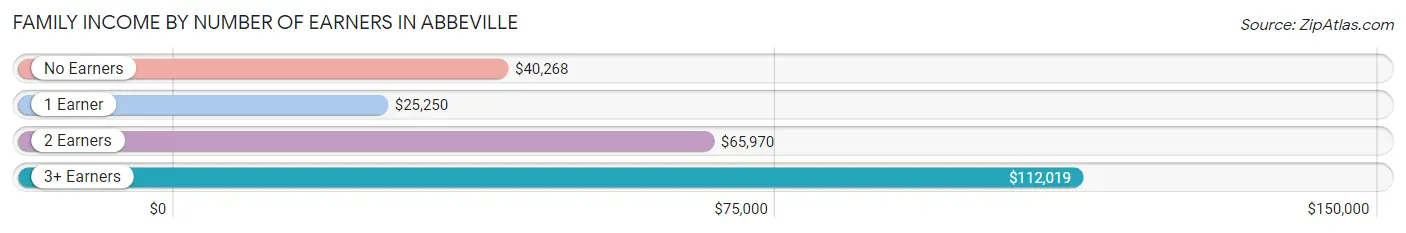
| Number of Earners | # Families | Median Income |
| No Earners | 293 (28.3%) | $40,268 |
| 1 Earner | 320 (30.9%) | $25,250 |
| 2 Earners | 315 (30.4%) | $65,970 |
| 3+ Earners | 107 (10.3%) | $112,019 |
| Total | 1,035 (100.0%) | $50,461 |
Household Income in Abbeville
Household Income Brackets in Abbeville
With 411 households falling in the category, the $35,000 to $49,999 income range is the most frequent in Abbeville, accounting for 20.4% of all households. In contrast, only 32 households (1.6%) fall into the $150,000 to $199,999 income bracket, making it the least populous group.
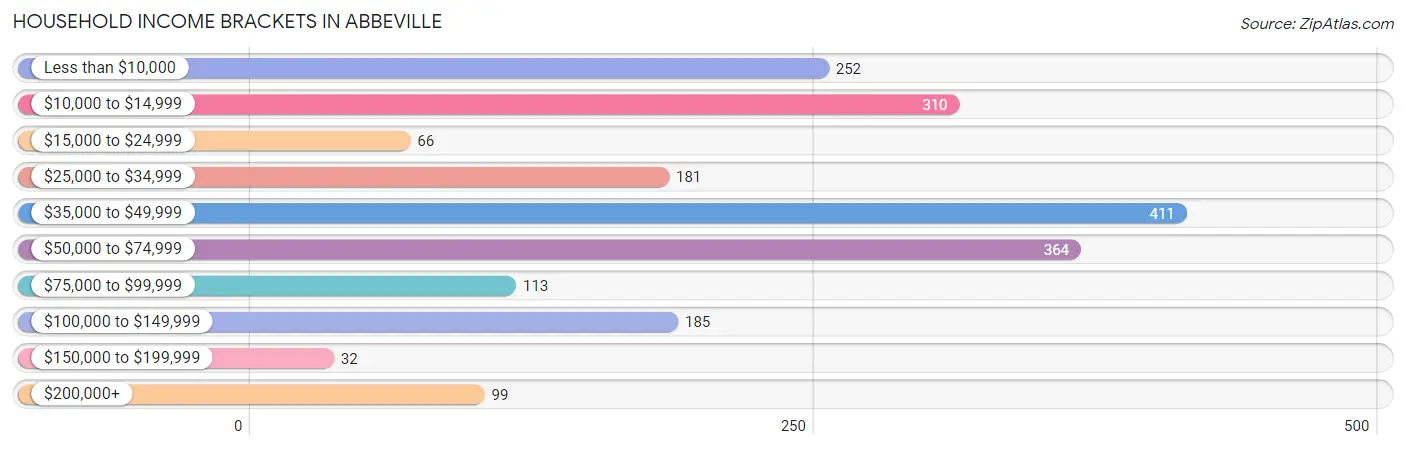
| Income Bracket | # Households | % Households |
| Less than $10,000 | 252 | 12.5% |
| $10,000 to $14,999 | 310 | 15.4% |
| $15,000 to $24,999 | 66 | 3.3% |
| $25,000 to $34,999 | 181 | 9.0% |
| $35,000 to $49,999 | 411 | 20.4% |
| $50,000 to $74,999 | 364 | 18.1% |
| $75,000 to $99,999 | 113 | 5.6% |
| $100,000 to $149,999 | 185 | 9.2% |
| $150,000 to $199,999 | 32 | 1.6% |
| $200,000+ | 99 | 4.9% |
Household Income by Householder Age in Abbeville
The median household income in Abbeville is $41,025, with the highest median household income of $65,474 found in the 45 to 64 years age bracket for the primary householder. A total of 556 households (27.6%) fall into this category. Meanwhile, the 15 to 24 years age bracket for the primary householder has the lowest median household income of $0, with 18 households (0.9%) in this group.
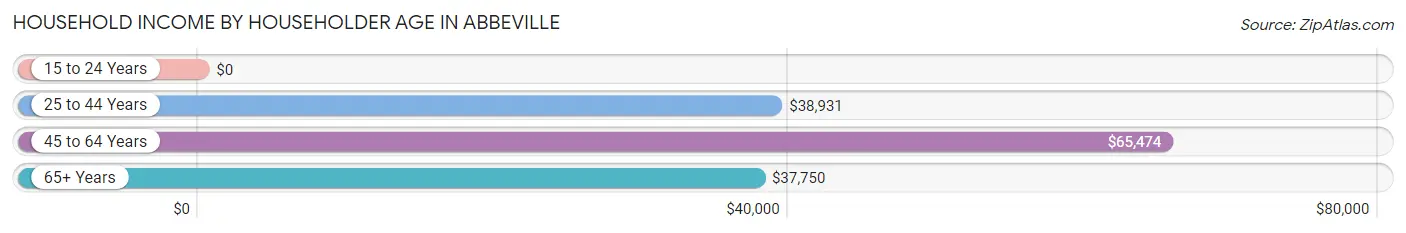
| Income Bracket | # Households | Median Income |
| 15 to 24 Years | 18 (0.9%) | $0 |
| 25 to 44 Years | 745 (37.0%) | $38,931 |
| 45 to 64 Years | 556 (27.6%) | $65,474 |
| 65+ Years | 694 (34.5%) | $37,750 |
| Total | 2,013 (100.0%) | $41,025 |
Poverty in Abbeville
Income Below Poverty by Sex and Age in Abbeville
With 24.0% poverty level for males and 35.5% for females among the residents of Abbeville, 15 year old males and under 5 year old females are the most vulnerable to poverty, with 68 males (100.0%) and 45 females (100.0%) in their respective age groups living below the poverty level.
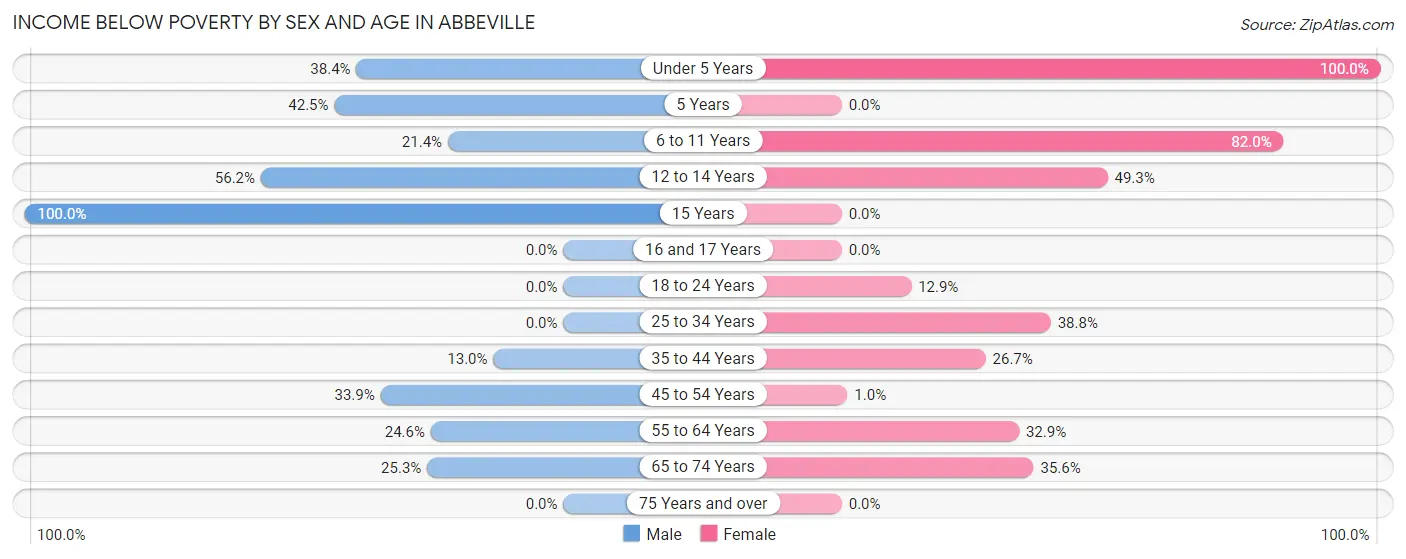
| Age Bracket | Male | Female |
| Under 5 Years | 53 (38.4%) | 45 (100.0%) |
| 5 Years | 17 (42.5%) | 0 (0.0%) |
| 6 to 11 Years | 78 (21.4%) | 273 (82.0%) |
| 12 to 14 Years | 73 (56.1%) | 73 (49.3%) |
| 15 Years | 68 (100.0%) | 0 (0.0%) |
| 16 and 17 Years | 0 (0.0%) | 0 (0.0%) |
| 18 to 24 Years | 0 (0.0%) | 21 (12.9%) |
| 25 to 34 Years | 0 (0.0%) | 140 (38.8%) |
| 35 to 44 Years | 66 (13.0%) | 94 (26.7%) |
| 45 to 54 Years | 57 (33.9%) | 2 (1.0%) |
| 55 to 64 Years | 79 (24.6%) | 74 (32.9%) |
| 65 to 74 Years | 91 (25.3%) | 121 (35.6%) |
| 75 Years and over | 0 (0.0%) | 0 (0.0%) |
| Total | 582 (24.0%) | 843 (35.5%) |
Income Above Poverty by Sex and Age in Abbeville
According to the poverty statistics in Abbeville, males aged 16 and 17 years and females aged 5 years are the age groups that are most secure financially, with 100.0% of males and 100.0% of females in these age groups living above the poverty line.
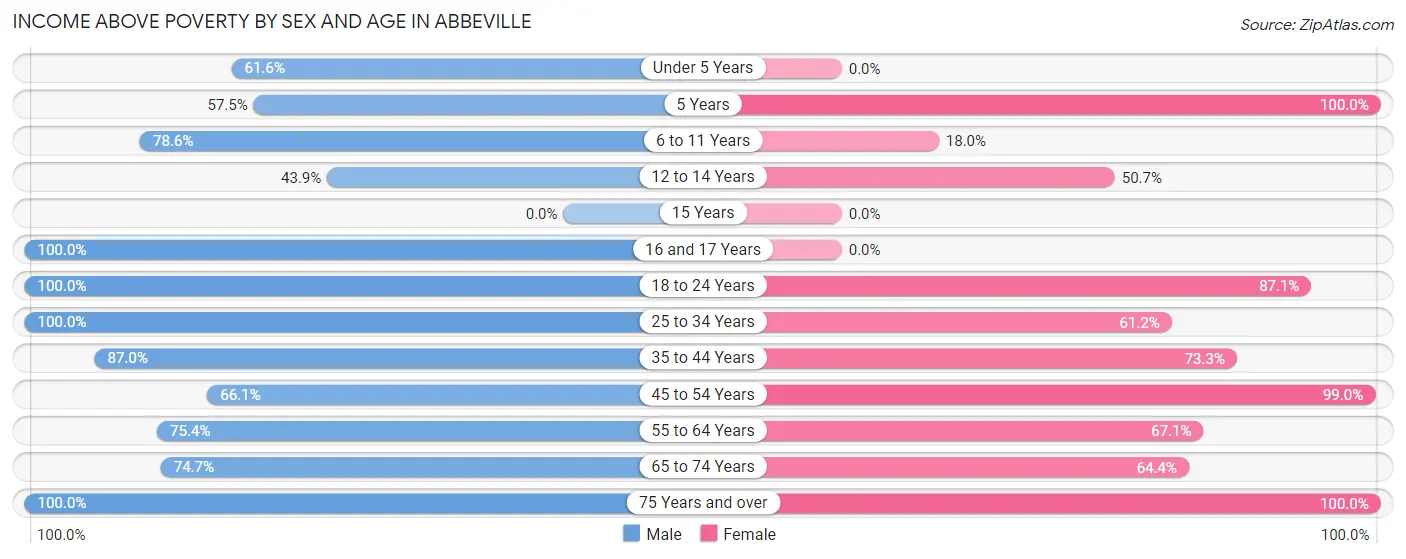
| Age Bracket | Male | Female |
| Under 5 Years | 85 (61.6%) | 0 (0.0%) |
| 5 Years | 23 (57.5%) | 16 (100.0%) |
| 6 to 11 Years | 286 (78.6%) | 60 (18.0%) |
| 12 to 14 Years | 57 (43.9%) | 75 (50.7%) |
| 15 Years | 0 (0.0%) | 0 (0.0%) |
| 16 and 17 Years | 20 (100.0%) | 0 (0.0%) |
| 18 to 24 Years | 32 (100.0%) | 142 (87.1%) |
| 25 to 34 Years | 162 (100.0%) | 221 (61.2%) |
| 35 to 44 Years | 442 (87.0%) | 258 (73.3%) |
| 45 to 54 Years | 111 (66.1%) | 190 (99.0%) |
| 55 to 64 Years | 242 (75.4%) | 151 (67.1%) |
| 65 to 74 Years | 269 (74.7%) | 219 (64.4%) |
| 75 Years and over | 111 (100.0%) | 198 (100.0%) |
| Total | 1,840 (76.0%) | 1,530 (64.5%) |
Income Below Poverty Among Married-Couple Families in Abbeville
The poverty statistics for married-couple families in Abbeville show that 10.3% or 50 of the total 485 families live below the poverty line. Families with 3 or 4 children have the highest poverty rate of 80.0%, comprising of 44 families. On the other hand, families with no children have the lowest poverty rate of 0.0%, which includes 0 families.
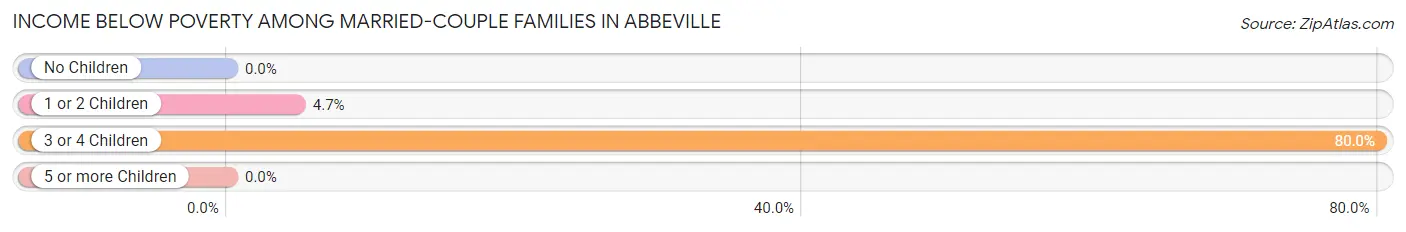
| Children | Above Poverty | Below Poverty |
| No Children | 303 (100.0%) | 0 (0.0%) |
| 1 or 2 Children | 121 (95.3%) | 6 (4.7%) |
| 3 or 4 Children | 11 (20.0%) | 44 (80.0%) |
| 5 or more Children | 0 (0.0%) | 0 (0.0%) |
| Total | 435 (89.7%) | 50 (10.3%) |
Income Below Poverty Among Single-Parent Households in Abbeville
According to the poverty data in Abbeville, 46.9% or 38 single-father households and 42.0% or 197 single-mother households are living below the poverty line. Among single-father households, those with 1 or 2 children have the highest poverty rate, with 38 households (100.0%) experiencing poverty. Likewise, among single-mother households, those with 1 or 2 children have the highest poverty rate, with 126 households (64.0%) falling below the poverty line.
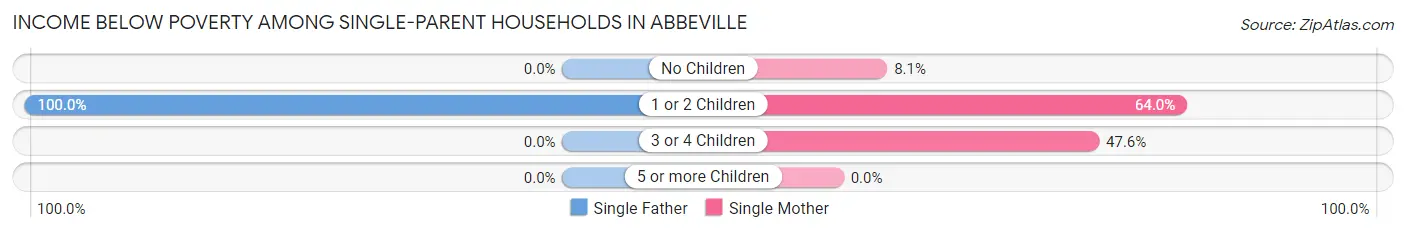
| Children | Single Father | Single Mother |
| No Children | 0 (0.0%) | 12 (8.1%) |
| 1 or 2 Children | 38 (100.0%) | 126 (64.0%) |
| 3 or 4 Children | 0 (0.0%) | 59 (47.6%) |
| 5 or more Children | 0 (0.0%) | 0 (0.0%) |
| Total | 38 (46.9%) | 197 (42.0%) |
Income Below Poverty Among Married-Couple vs Single-Parent Households in Abbeville
The poverty data for Abbeville shows that 50 of the married-couple family households (10.3%) and 235 of the single-parent households (42.7%) are living below the poverty level. Within the married-couple family households, those with 3 or 4 children have the highest poverty rate, with 44 households (80.0%) falling below the poverty line. Among the single-parent households, those with 1 or 2 children have the highest poverty rate, with 164 household (69.8%) living below poverty.
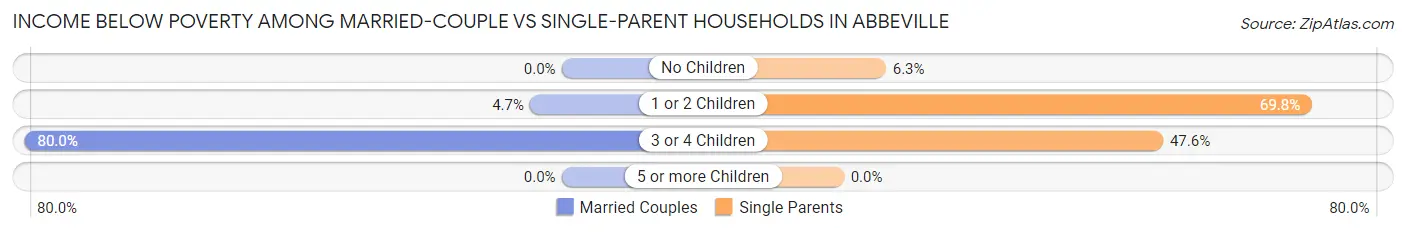
| Children | Married-Couple Families | Single-Parent Households |
| No Children | 0 (0.0%) | 12 (6.3%) |
| 1 or 2 Children | 6 (4.7%) | 164 (69.8%) |
| 3 or 4 Children | 44 (80.0%) | 59 (47.6%) |
| 5 or more Children | 0 (0.0%) | 0 (0.0%) |
| Total | 50 (10.3%) | 235 (42.7%) |
Race in Abbeville
The most populous races in Abbeville are Black / African American (2,505 | 51.2%), White / Caucasian (2,189 | 44.8%), and Two or more Races (173 | 3.5%).
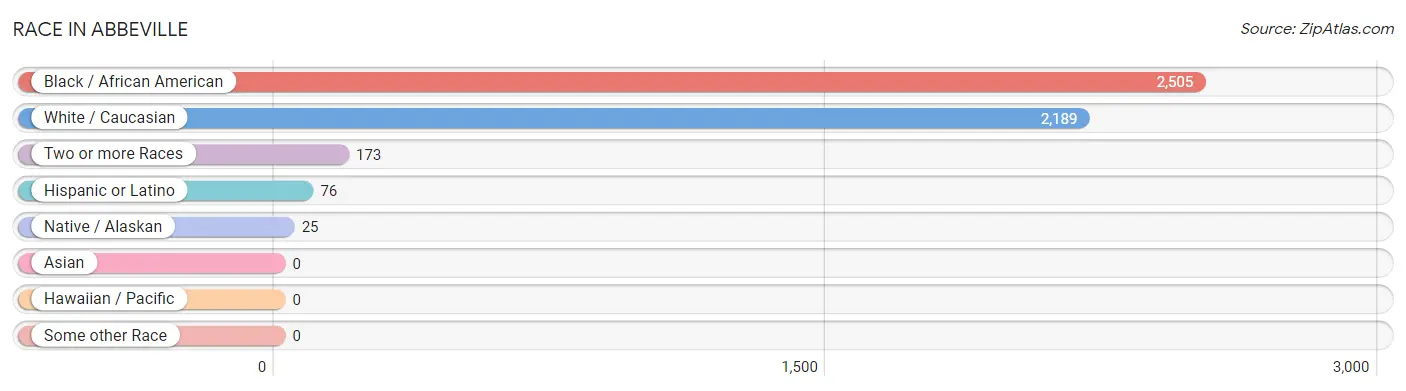
| Race | # Population | % Population |
| Asian | 0 | 0.0% |
| Black / African American | 2,505 | 51.2% |
| Hawaiian / Pacific | 0 | 0.0% |
| Hispanic or Latino | 76 | 1.5% |
| Native / Alaskan | 25 | 0.5% |
| White / Caucasian | 2,189 | 44.8% |
| Two or more Races | 173 | 3.5% |
| Some other Race | 0 | 0.0% |
| Total | 4,892 | 100.0% |
Ancestry in Abbeville
The most populous ancestries reported in Abbeville are English (334 | 6.8%), American (226 | 4.6%), African (222 | 4.5%), Subsaharan African (222 | 4.5%), and Scotch-Irish (158 | 3.2%), together accounting for 23.8% of all Abbeville residents.
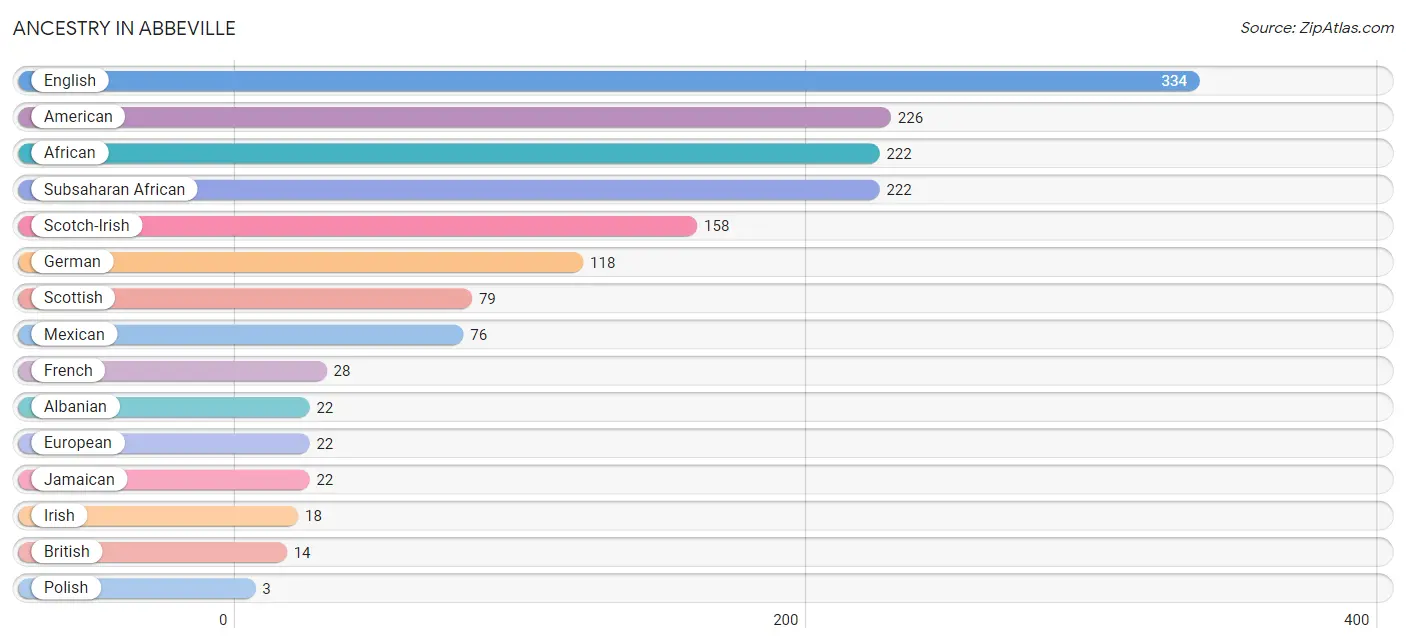
| Ancestry | # Population | % Population |
| African | 222 | 4.5% |
| Albanian | 22 | 0.4% |
| American | 226 | 4.6% |
| British | 14 | 0.3% |
| English | 334 | 6.8% |
| European | 22 | 0.4% |
| French | 28 | 0.6% |
| German | 118 | 2.4% |
| Irish | 18 | 0.4% |
| Italian | 1 | 0.0% |
| Jamaican | 22 | 0.4% |
| Mexican | 76 | 1.5% |
| Polish | 3 | 0.1% |
| Scotch-Irish | 158 | 3.2% |
| Scottish | 79 | 1.6% |
| Subsaharan African | 222 | 4.5% | View All 16 Rows |
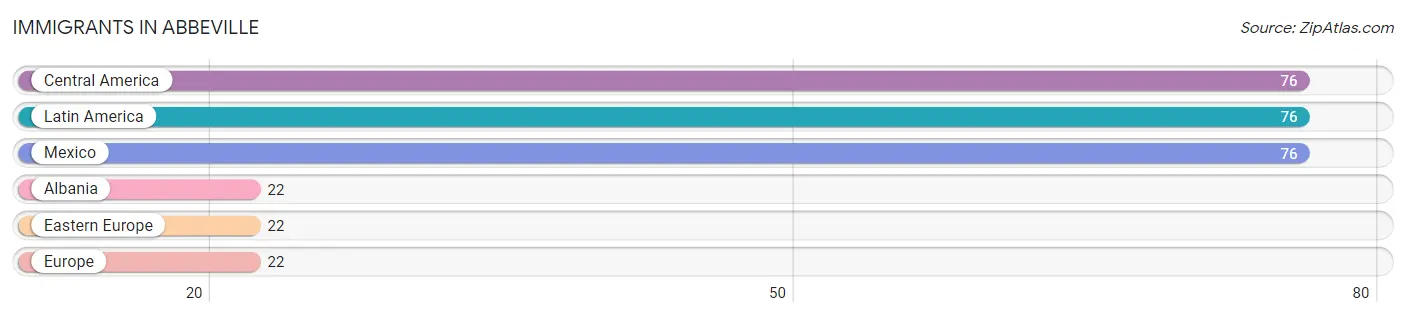
Immigrants in Abbeville
The most numerous immigrant groups reported in Abbeville came from Central America (76 | 1.5%), Latin America (76 | 1.5%), Mexico (76 | 1.5%), Albania (22 | 0.4%), and Eastern Europe (22 | 0.4%), together accounting for 5.5% of all Abbeville residents.
| Immigration Origin | # Population | % Population |
| Albania | 22 | 0.4% |
| Central America | 76 | 1.5% |
| Eastern Europe | 22 | 0.4% |
| Europe | 22 | 0.4% |
| Latin America | 76 | 1.5% |
| Mexico | 76 | 1.5% | View All 6 Rows |
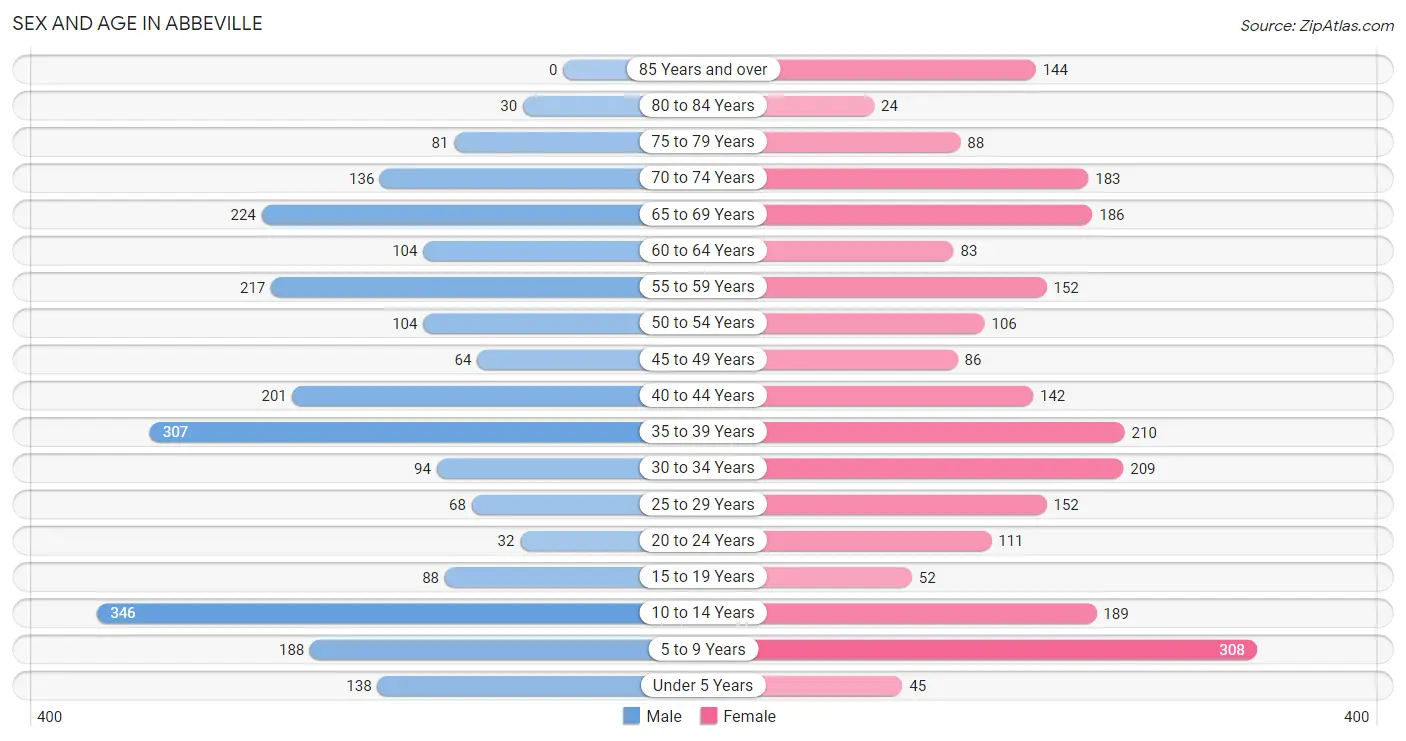
Sex and Age in Abbeville
Sex and Age in Abbeville
The most populous age groups in Abbeville are 10 to 14 Years (346 | 14.3%) for men and 5 to 9 Years (308 | 12.5%) for women.
| Age Bracket | Male | Female |
| Under 5 Years | 138 (5.7%) | 45 (1.8%) |
| 5 to 9 Years | 188 (7.8%) | 308 (12.5%) |
| 10 to 14 Years | 346 (14.3%) | 189 (7.6%) |
| 15 to 19 Years | 88 (3.6%) | 52 (2.1%) |
| 20 to 24 Years | 32 (1.3%) | 111 (4.5%) |
| 25 to 29 Years | 68 (2.8%) | 152 (6.1%) |
| 30 to 34 Years | 94 (3.9%) | 209 (8.5%) |
| 35 to 39 Years | 307 (12.7%) | 210 (8.5%) |
| 40 to 44 Years | 201 (8.3%) | 142 (5.8%) |
| 45 to 49 Years | 64 (2.6%) | 86 (3.5%) |
| 50 to 54 Years | 104 (4.3%) | 106 (4.3%) |
| 55 to 59 Years | 217 (9.0%) | 152 (6.1%) |
| 60 to 64 Years | 104 (4.3%) | 83 (3.4%) |
| 65 to 69 Years | 224 (9.2%) | 186 (7.5%) |
| 70 to 74 Years | 136 (5.6%) | 183 (7.4%) |
| 75 to 79 Years | 81 (3.3%) | 88 (3.6%) |
| 80 to 84 Years | 30 (1.2%) | 24 (1.0%) |
| 85 Years and over | 0 (0.0%) | 144 (5.8%) |
| Total | 2,422 (100.0%) | 2,470 (100.0%) |
Families and Households in Abbeville
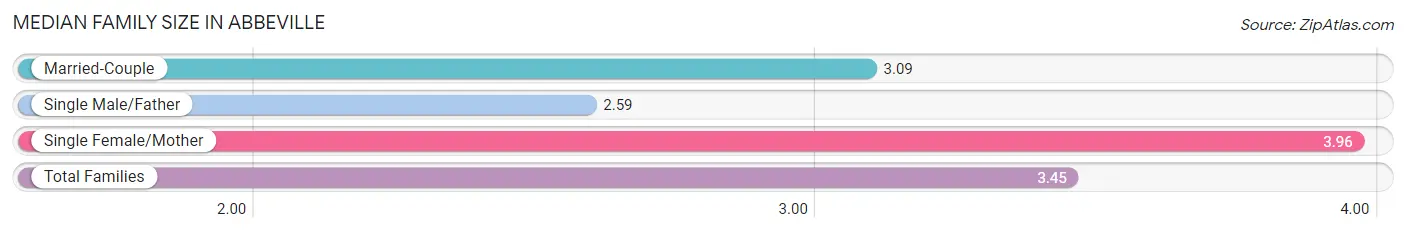
Median Family Size in Abbeville
The median family size in Abbeville is 3.45 persons per family, with single female/mother families (469 | 45.3%) accounting for the largest median family size of 3.96 persons per family. On the other hand, single male/father families (81 | 7.8%) represent the smallest median family size with 2.59 persons per family.
| Family Type | # Families | Family Size |
| Married-Couple | 485 (46.9%) | 3.09 |
| Single Male/Father | 81 (7.8%) | 2.59 |
| Single Female/Mother | 469 (45.3%) | 3.96 |
| Total Families | 1,035 (100.0%) | 3.45 |
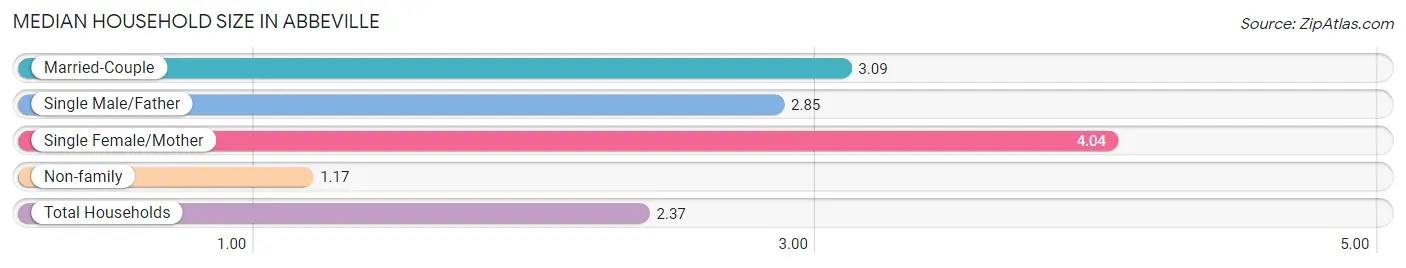
Median Household Size in Abbeville
The median household size in Abbeville is 2.37 persons per household, with single female/mother households (469 | 23.3%) accounting for the largest median household size of 4.04 persons per household. non-family households (978 | 48.6%) represent the smallest median household size with 1.17 persons per household.
| Household Type | # Households | Household Size |
| Married-Couple | 485 (24.1%) | 3.09 |
| Single Male/Father | 81 (4.0%) | 2.85 |
| Single Female/Mother | 469 (23.3%) | 4.04 |
| Non-family | 978 (48.6%) | 1.17 |
| Total Households | 2,013 (100.0%) | 2.37 |
Household Size by Marriage Status in Abbeville
Out of a total of 2,013 households in Abbeville, 1,035 (51.4%) are family households, while 978 (48.6%) are nonfamily households. The most numerous type of family households are 2-person households, comprising 606, and the most common type of nonfamily households are 1-person households, comprising 774.
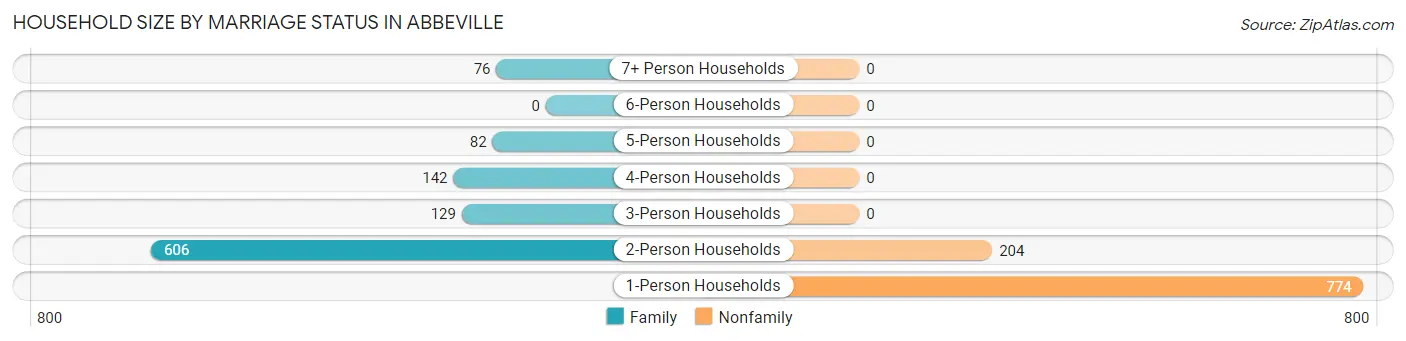
| Household Size | Family Households | Nonfamily Households |
| 1-Person Households | - | 774 (38.5%) |
| 2-Person Households | 606 (30.1%) | 204 (10.1%) |
| 3-Person Households | 129 (6.4%) | 0 (0.0%) |
| 4-Person Households | 142 (7.0%) | 0 (0.0%) |
| 5-Person Households | 82 (4.1%) | 0 (0.0%) |
| 6-Person Households | 0 (0.0%) | 0 (0.0%) |
| 7+ Person Households | 76 (3.8%) | 0 (0.0%) |
| Total | 1,035 (51.4%) | 978 (48.6%) |
Female Fertility in Abbeville
Fertility by Age in Abbeville
Average fertility rate in Abbeville is 89.0 births per 1,000 women. Women in the age bracket of 35 to 50 years have the highest fertility rate with 157.0 births per 1,000 women. Women in the age bracket of 35 to 50 years acount for 80.2% of all women with births.
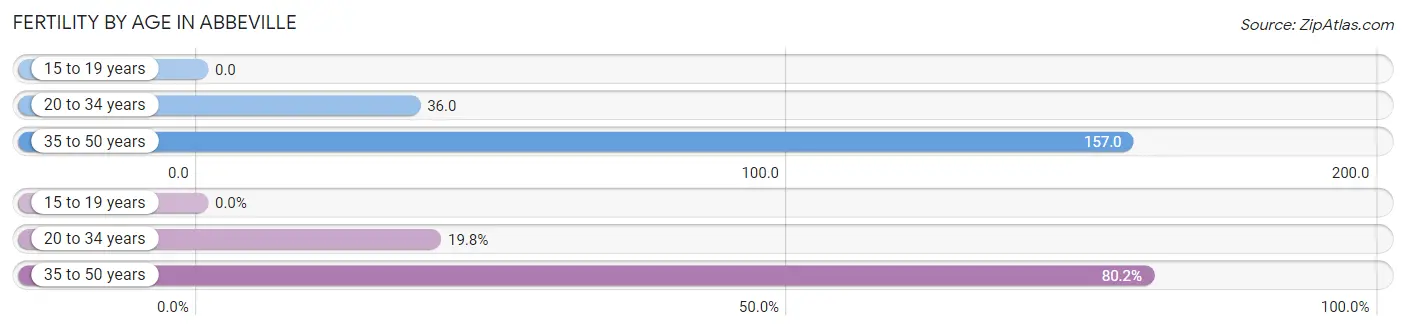
| Age Bracket | Women with Births | Births / 1,000 Women |
| 15 to 19 years | 0 (0.0%) | 0.0 |
| 20 to 34 years | 17 (19.8%) | 36.0 |
| 35 to 50 years | 69 (80.2%) | 157.0 |
| Total | 86 (100.0%) | 89.0 |
Fertility by Age by Marriage Status in Abbeville
80.2% of women with births (86) in Abbeville are married. The highest percentage of unmarried women with births falls into 20 to 34 years age bracket with 100.0% of them unmarried at the time of birth, while the lowest percentage of unmarried women with births belong to 35 to 50 years age bracket with 0.0% of them unmarried.
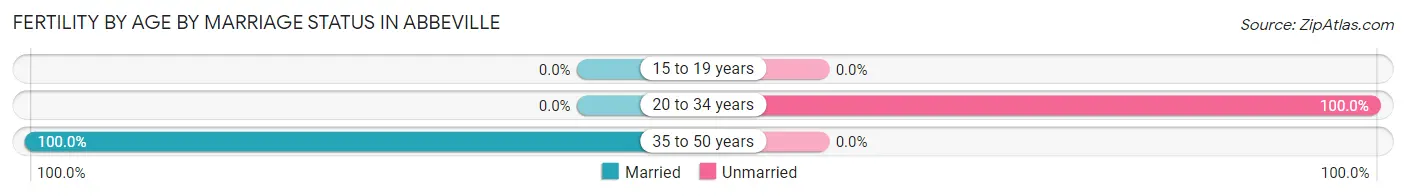
| Age Bracket | Married | Unmarried |
| 15 to 19 years | 0 (0.0%) | 0 (0.0%) |
| 20 to 34 years | 0 (0.0%) | 17 (100.0%) |
| 35 to 50 years | 69 (100.0%) | 0 (0.0%) |
| Total | 69 (80.2%) | 17 (19.8%) |
Fertility by Education in Abbeville
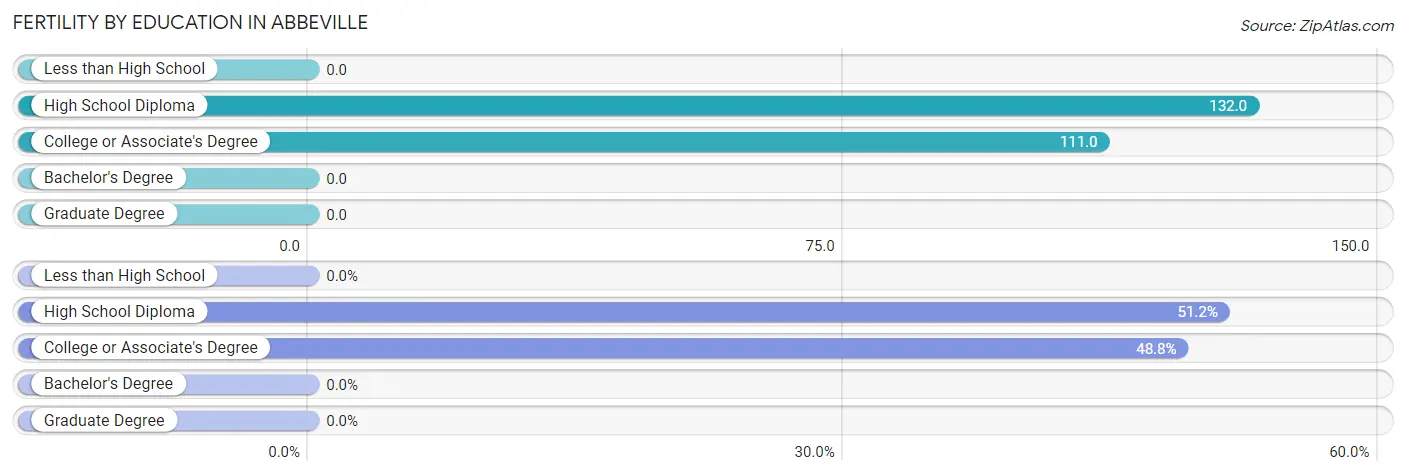
| Educational Attainment | Women with Births | Births / 1,000 Women |
| Less than High School | 0 (0.0%) | 0.0 |
| High School Diploma | 44 (51.2%) | 132.0 |
| College or Associate's Degree | 42 (48.8%) | 111.0 |
| Bachelor's Degree | 0 (0.0%) | 0.0 |
| Graduate Degree | 0 (0.0%) | 0.0 |
| Total | 86 (100.0%) | 89.0 |
Fertility by Education by Marriage Status in Abbeville
19.8% of women with births in Abbeville are unmarried. Women with the educational attainment of high school diploma are most likely to be married with 100.0% of them married at childbirth, while women with the educational attainment of college or associate's degree are least likely to be married with 40.5% of them unmarried at childbirth.
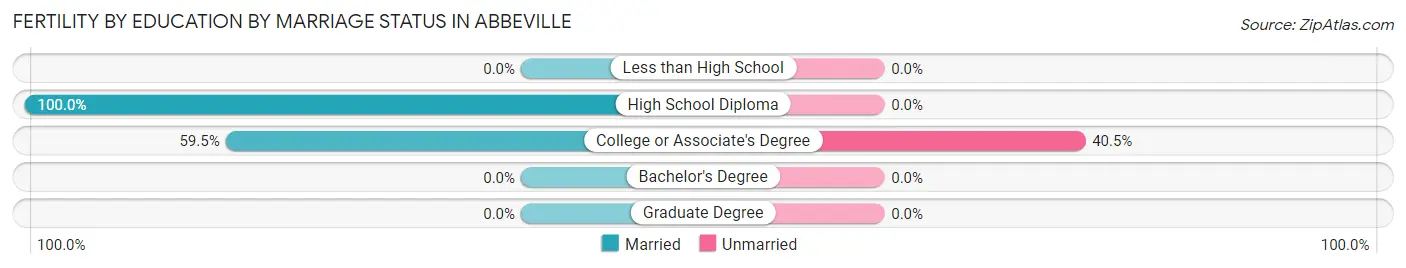
| Educational Attainment | Married | Unmarried |
| Less than High School | 0 (0.0%) | 0 (0.0%) |
| High School Diploma | 44 (100.0%) | 0 (0.0%) |
| College or Associate's Degree | 25 (59.5%) | 17 (40.5%) |
| Bachelor's Degree | 0 (0.0%) | 0 (0.0%) |
| Graduate Degree | 0 (0.0%) | 0 (0.0%) |
| Total | 69 (80.2%) | 17 (19.8%) |
Employment Characteristics in Abbeville
Employment by Class of Employer in Abbeville
Among the 1,761 employed individuals in Abbeville, private company employees (1,323 | 75.1%), local government employees (173 | 9.8%), and self-employed (not incorporated) (81 | 4.6%) make up the most common classes of employment.
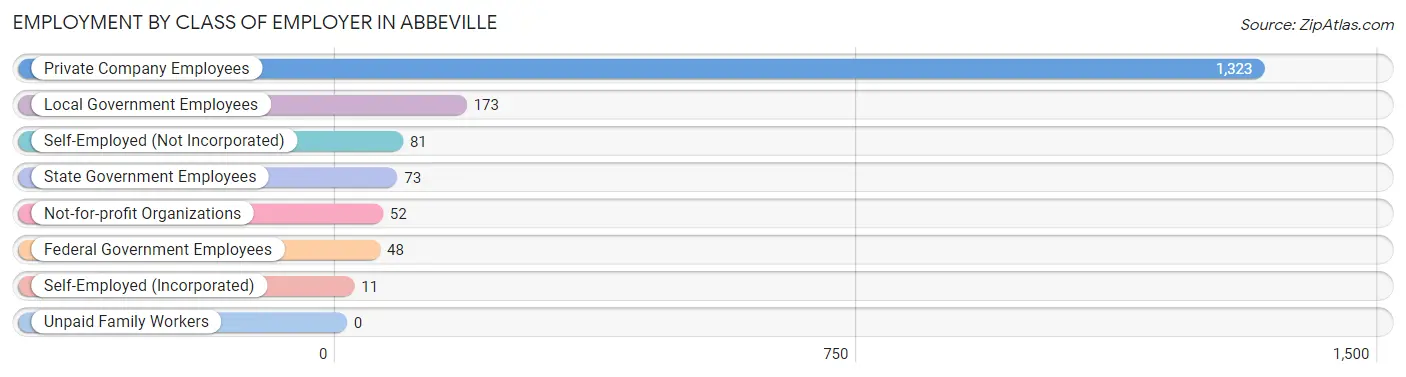
| Employer Class | # Employees | % Employees |
| Private Company Employees | 1,323 | 75.1% |
| Self-Employed (Incorporated) | 11 | 0.6% |
| Self-Employed (Not Incorporated) | 81 | 4.6% |
| Not-for-profit Organizations | 52 | 2.9% |
| Local Government Employees | 173 | 9.8% |
| State Government Employees | 73 | 4.2% |
| Federal Government Employees | 48 | 2.7% |
| Unpaid Family Workers | 0 | 0.0% |
| Total | 1,761 | 100.0% |
Employment Status by Age in Abbeville
According to the labor force statistics for Abbeville, out of the total population over 16 years of age (3,610), 54.7% or 1,975 individuals are in the labor force, with 4.7% or 93 of them unemployed. The age group with the highest labor force participation rate is 30 to 34 years, with 96.0% or 291 individuals in the labor force. Within the labor force, the 30 to 34 years age range has the highest percentage of unemployed individuals, with 32.0% or 93 of them being unemployed.
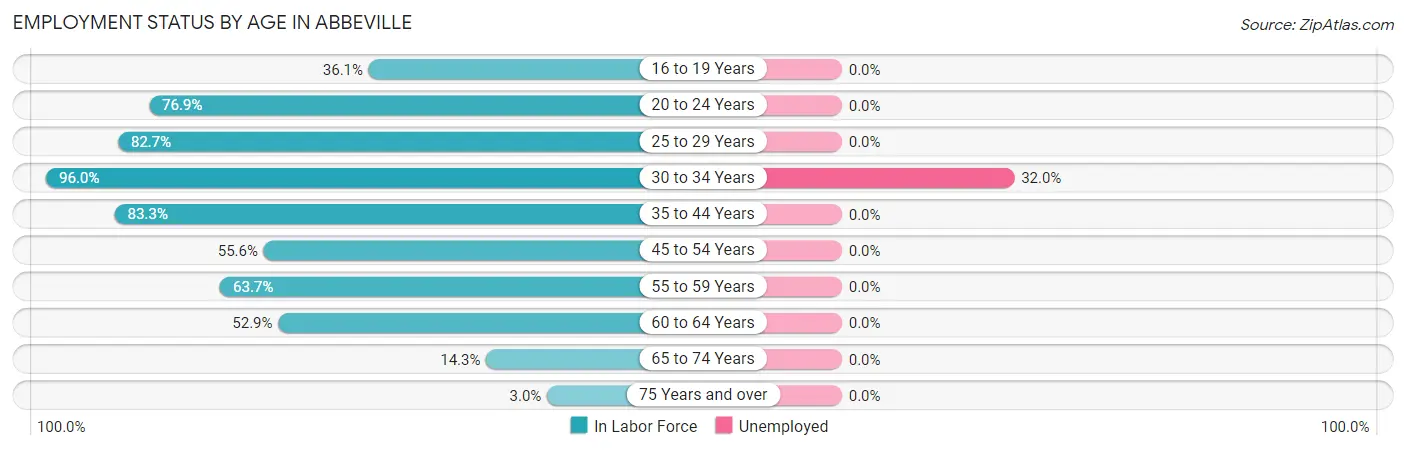
| Age Bracket | In Labor Force | Unemployed |
| 16 to 19 Years | 26 (36.1%) | 0 (0.0%) |
| 20 to 24 Years | 110 (76.9%) | 0 (0.0%) |
| 25 to 29 Years | 182 (82.7%) | 0 (0.0%) |
| 30 to 34 Years | 291 (96.0%) | 93 (32.0%) |
| 35 to 44 Years | 716 (83.3%) | 0 (0.0%) |
| 45 to 54 Years | 200 (55.6%) | 0 (0.0%) |
| 55 to 59 Years | 235 (63.7%) | 0 (0.0%) |
| 60 to 64 Years | 99 (52.9%) | 0 (0.0%) |
| 65 to 74 Years | 104 (14.3%) | 0 (0.0%) |
| 75 Years and over | 11 (3.0%) | 0 (0.0%) |
| Total | 1,975 (54.7%) | 93 (4.7%) |
Employment Status by Educational Attainment in Abbeville
According to labor force statistics for Abbeville, 74.9% of individuals (1,722) out of the total population between 25 and 64 years of age (2,299) are in the labor force, with 5.4% or 93 of them being unemployed. The group with the highest labor force participation rate are those with the educational attainment of high school diploma, with 78.4% or 725 individuals in the labor force. Within the labor force, individuals with less than high school education have the highest percentage of unemployment, with 24.5% or 74 of them being unemployed.
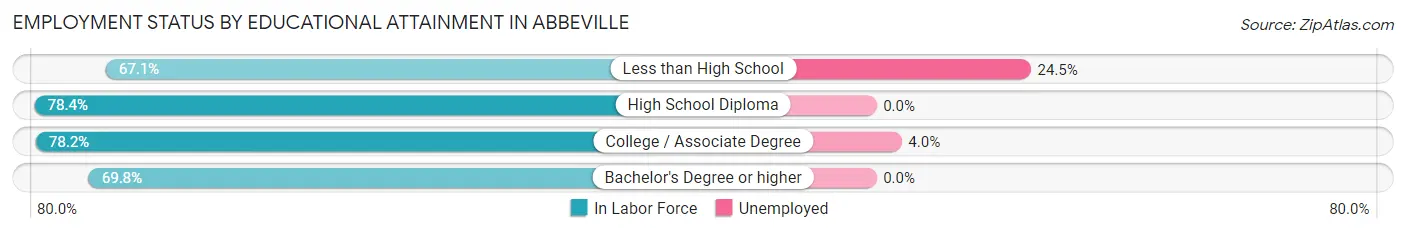
| Educational Attainment | In Labor Force | Unemployed |
| Less than High School | 302 (67.1%) | 110 (24.5%) |
| High School Diploma | 725 (78.4%) | 0 (0.0%) |
| College / Associate Degree | 474 (78.2%) | 24 (4.0%) |
| Bachelor's Degree or higher | 222 (69.8%) | 0 (0.0%) |
| Total | 1,722 (74.9%) | 124 (5.4%) |
Employment Occupations by Sex in Abbeville
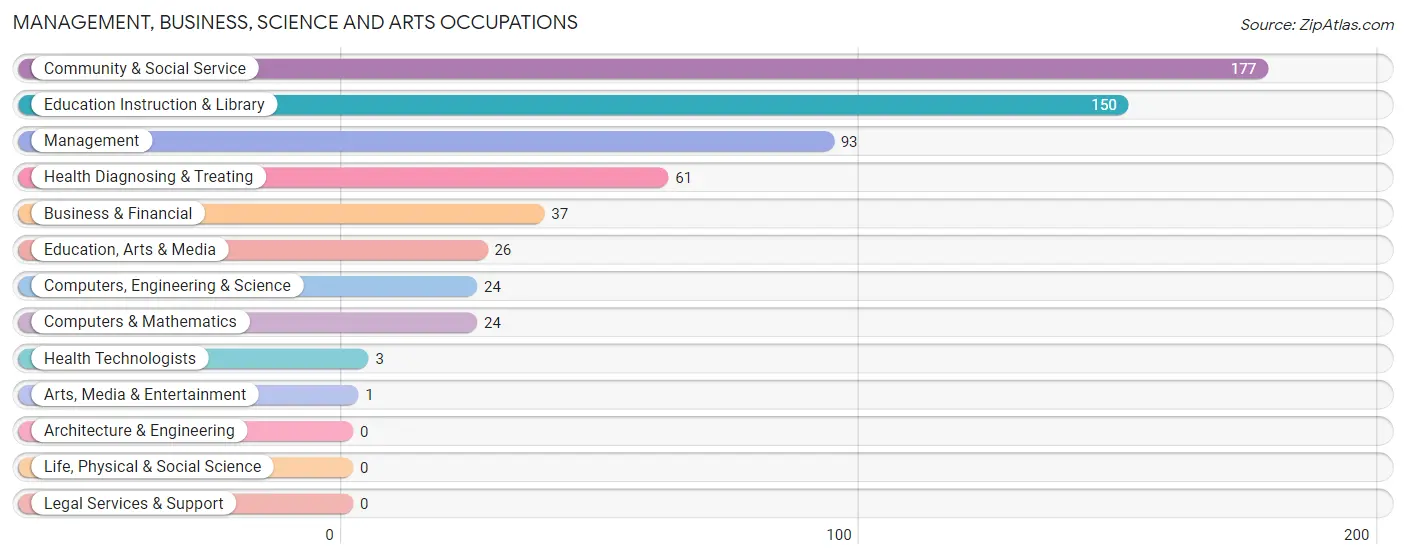
Management, Business, Science and Arts Occupations
The most common Management, Business, Science and Arts occupations in Abbeville are Community & Social Service (177 | 9.4%), Education Instruction & Library (150 | 8.0%), Management (93 | 4.9%), Health Diagnosing & Treating (61 | 3.2%), and Business & Financial (37 | 2.0%).
Management, Business, Science and Arts Occupations by Sex
Within the Management, Business, Science and Arts occupations in Abbeville, the most male-oriented occupations are Computers, Engineering & Science (100.0%), Computers & Mathematics (100.0%), and Education, Arts & Media (65.4%), while the most female-oriented occupations are Arts, Media & Entertainment (100.0%), Health Diagnosing & Treating (100.0%), and Health Technologists (100.0%).
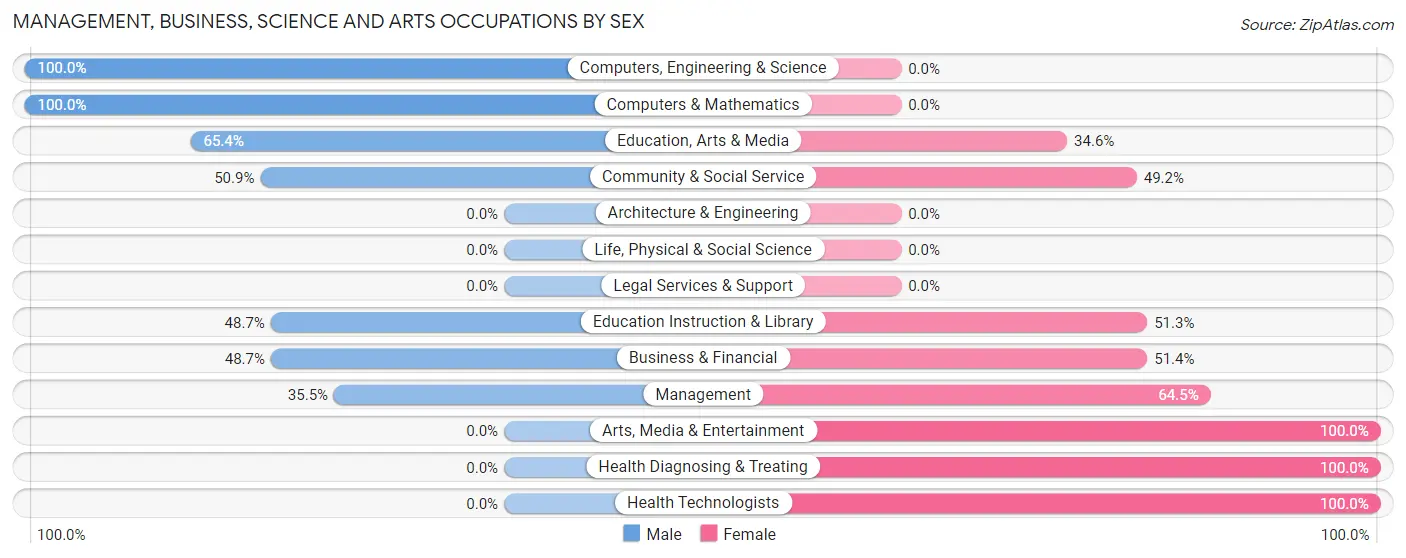
| Occupation | Male | Female |
| Management | 33 (35.5%) | 60 (64.5%) |
| Business & Financial | 18 (48.6%) | 19 (51.3%) |
| Computers, Engineering & Science | 24 (100.0%) | 0 (0.0%) |
| Computers & Mathematics | 24 (100.0%) | 0 (0.0%) |
| Architecture & Engineering | 0 (0.0%) | 0 (0.0%) |
| Life, Physical & Social Science | 0 (0.0%) | 0 (0.0%) |
| Community & Social Service | 90 (50.8%) | 87 (49.1%) |
| Education, Arts & Media | 17 (65.4%) | 9 (34.6%) |
| Legal Services & Support | 0 (0.0%) | 0 (0.0%) |
| Education Instruction & Library | 73 (48.7%) | 77 (51.3%) |
| Arts, Media & Entertainment | 0 (0.0%) | 1 (100.0%) |
| Health Diagnosing & Treating | 0 (0.0%) | 61 (100.0%) |
| Health Technologists | 0 (0.0%) | 3 (100.0%) |
| Total (Category) | 165 (42.1%) | 227 (57.9%) |
| Total (Overall) | 1,090 (58.0%) | 791 (42.0%) |
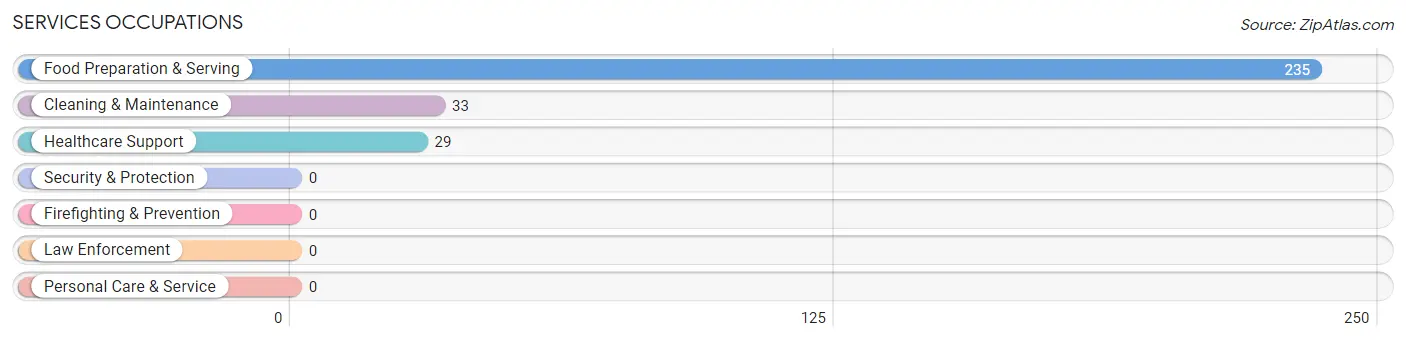
Services Occupations
The most common Services occupations in Abbeville are Food Preparation & Serving (235 | 12.5%), Cleaning & Maintenance (33 | 1.8%), and Healthcare Support (29 | 1.5%).
Services Occupations by Sex
Within the Services occupations in Abbeville, the most male-oriented occupations are Cleaning & Maintenance (100.0%), and Food Preparation & Serving (60.9%), while the most female-oriented occupations are Healthcare Support (100.0%), and Food Preparation & Serving (39.2%).
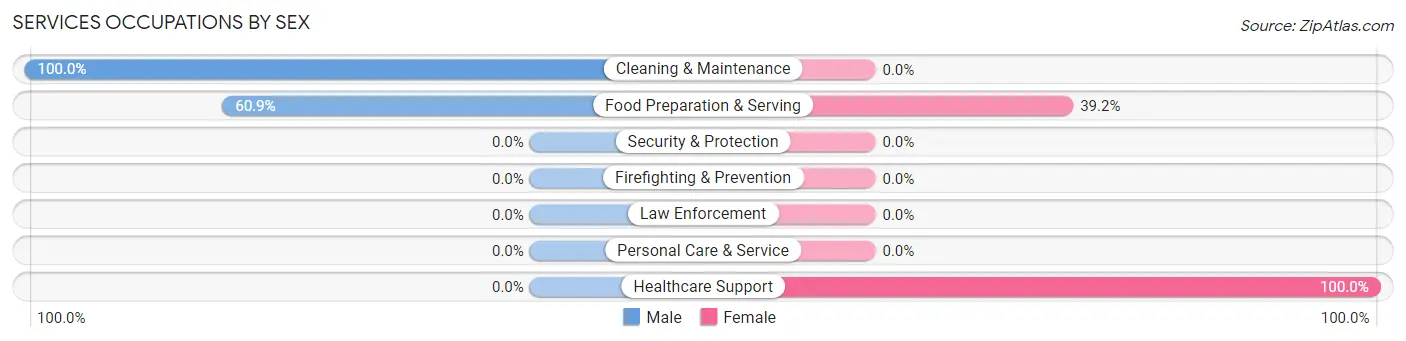
| Occupation | Male | Female |
| Healthcare Support | 0 (0.0%) | 29 (100.0%) |
| Security & Protection | 0 (0.0%) | 0 (0.0%) |
| Firefighting & Prevention | 0 (0.0%) | 0 (0.0%) |
| Law Enforcement | 0 (0.0%) | 0 (0.0%) |
| Food Preparation & Serving | 143 (60.9%) | 92 (39.2%) |
| Cleaning & Maintenance | 33 (100.0%) | 0 (0.0%) |
| Personal Care & Service | 0 (0.0%) | 0 (0.0%) |
| Total (Category) | 176 (59.3%) | 121 (40.7%) |
| Total (Overall) | 1,090 (58.0%) | 791 (42.0%) |
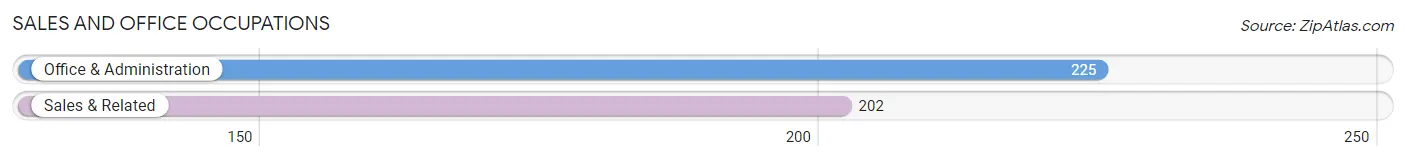
Sales and Office Occupations
The most common Sales and Office occupations in Abbeville are Office & Administration (225 | 12.0%), and Sales & Related (202 | 10.7%).
Sales and Office Occupations by Sex
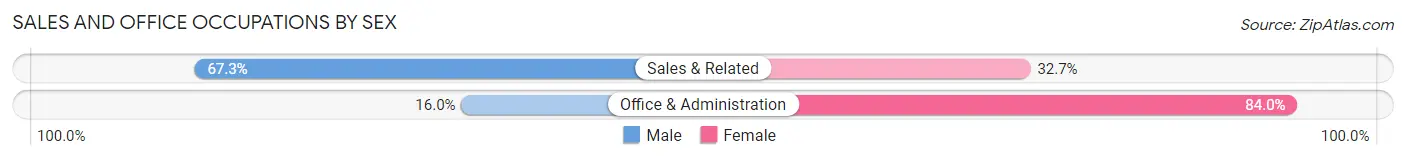
| Occupation | Male | Female |
| Sales & Related | 136 (67.3%) | 66 (32.7%) |
| Office & Administration | 36 (16.0%) | 189 (84.0%) |
| Total (Category) | 172 (40.3%) | 255 (59.7%) |
| Total (Overall) | 1,090 (58.0%) | 791 (42.0%) |
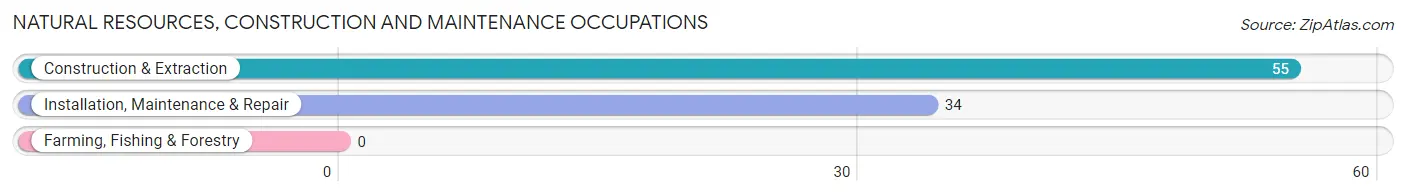
Natural Resources, Construction and Maintenance Occupations
The most common Natural Resources, Construction and Maintenance occupations in Abbeville are Construction & Extraction (55 | 2.9%), and Installation, Maintenance & Repair (34 | 1.8%).
Natural Resources, Construction and Maintenance Occupations by Sex

| Occupation | Male | Female |
| Farming, Fishing & Forestry | 0 (0.0%) | 0 (0.0%) |
| Construction & Extraction | 55 (100.0%) | 0 (0.0%) |
| Installation, Maintenance & Repair | 34 (100.0%) | 0 (0.0%) |
| Total (Category) | 89 (100.0%) | 0 (0.0%) |
| Total (Overall) | 1,090 (58.0%) | 791 (42.0%) |
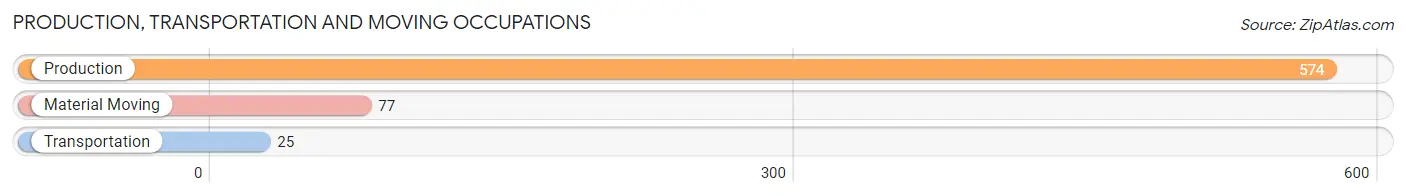
Production, Transportation and Moving Occupations
The most common Production, Transportation and Moving occupations in Abbeville are Production (574 | 30.5%), Material Moving (77 | 4.1%), and Transportation (25 | 1.3%).
Production, Transportation and Moving Occupations by Sex
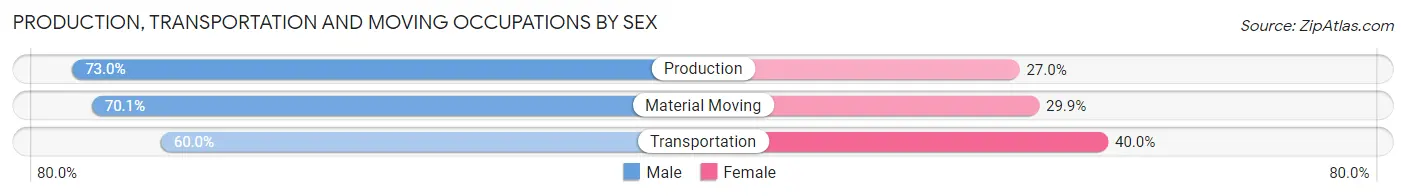
| Occupation | Male | Female |
| Production | 419 (73.0%) | 155 (27.0%) |
| Transportation | 15 (60.0%) | 10 (40.0%) |
| Material Moving | 54 (70.1%) | 23 (29.9%) |
| Total (Category) | 488 (72.2%) | 188 (27.8%) |
| Total (Overall) | 1,090 (58.0%) | 791 (42.0%) |
Employment Industries by Sex in Abbeville
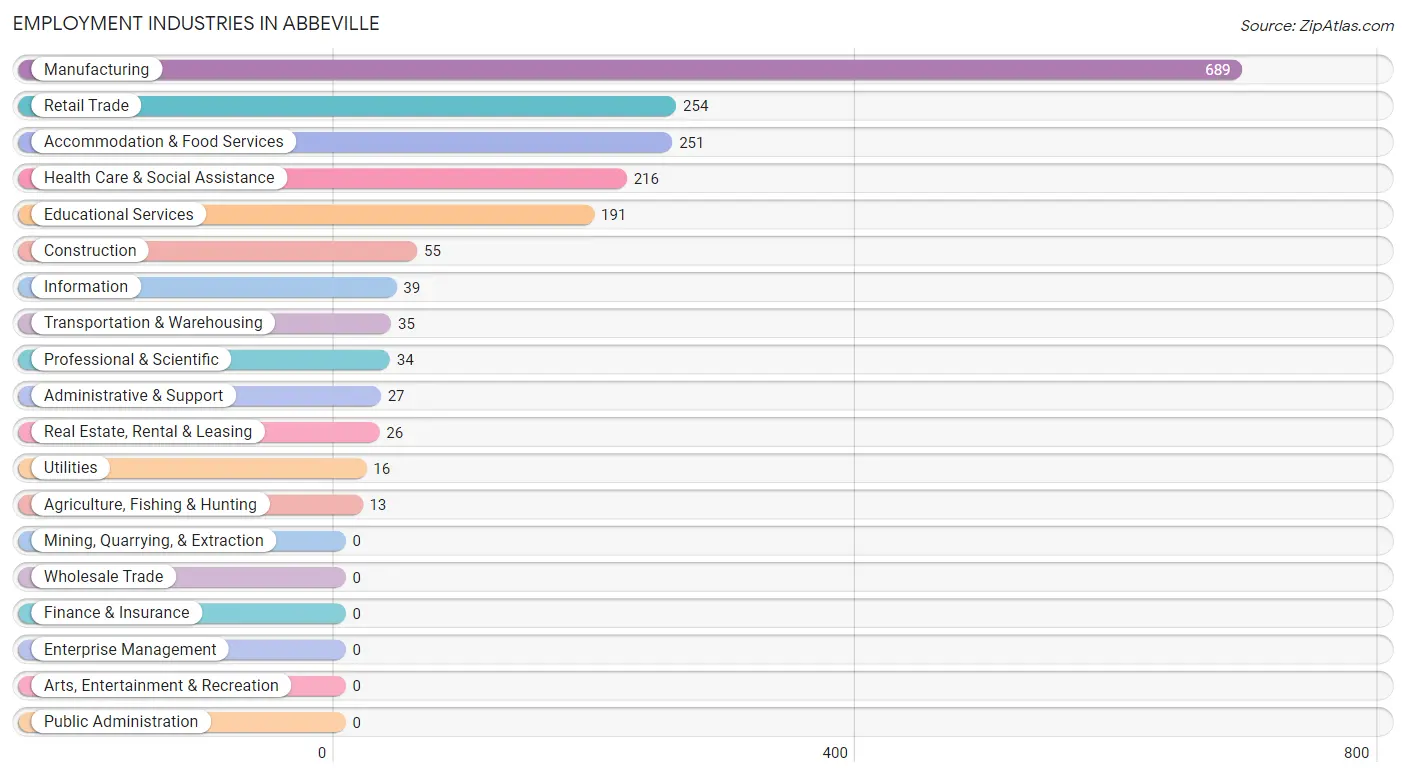
Employment Industries in Abbeville
The major employment industries in Abbeville include Manufacturing (689 | 36.6%), Retail Trade (254 | 13.5%), Accommodation & Food Services (251 | 13.3%), Health Care & Social Assistance (216 | 11.5%), and Educational Services (191 | 10.2%).
Employment Industries by Sex in Abbeville
The Abbeville industries that see more men than women are Agriculture, Fishing & Hunting (100.0%), Construction (100.0%), and Real Estate, Rental & Leasing (100.0%), whereas the industries that tend to have a higher number of women are Utilities (100.0%), Health Care & Social Assistance (76.8%), and Educational Services (69.6%).
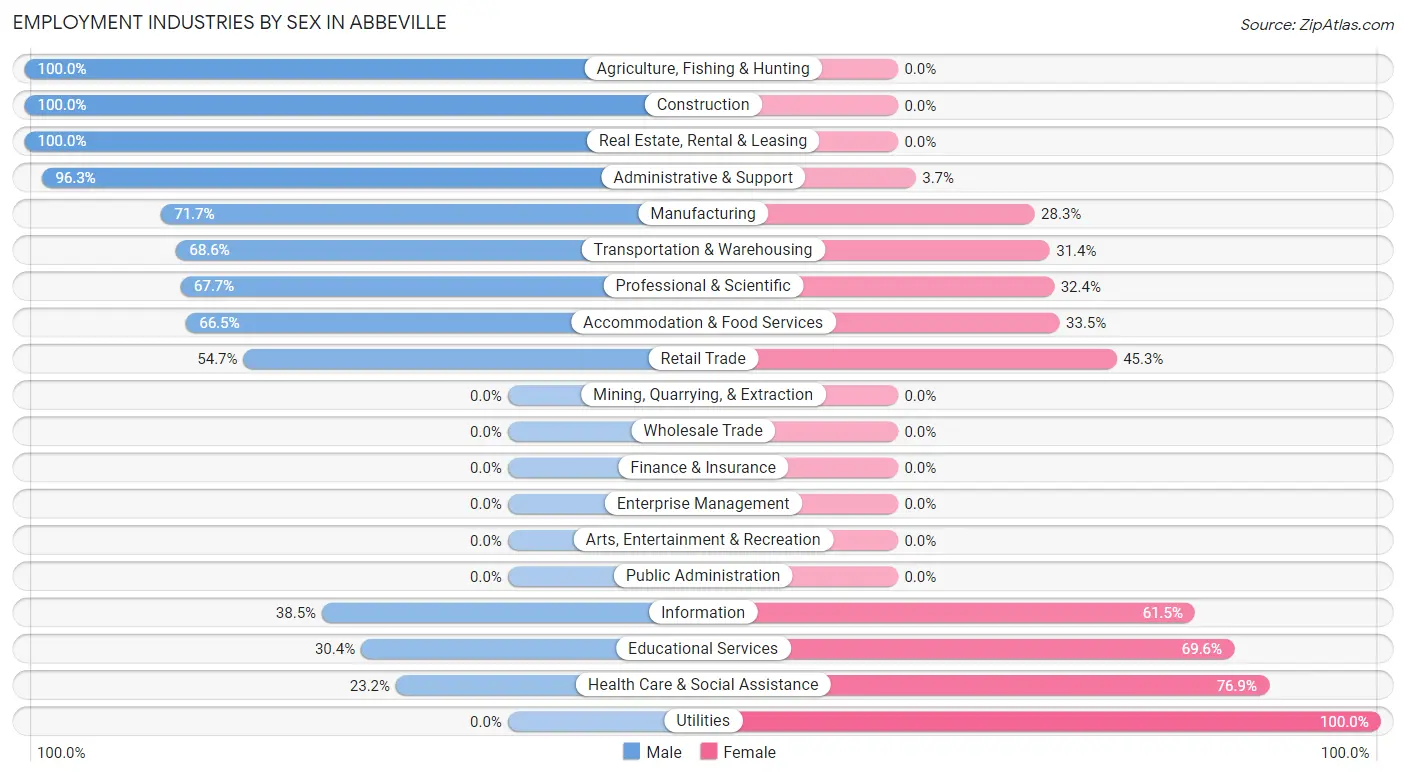
| Industry | Male | Female |
| Agriculture, Fishing & Hunting | 13 (100.0%) | 0 (0.0%) |
| Mining, Quarrying, & Extraction | 0 (0.0%) | 0 (0.0%) |
| Construction | 55 (100.0%) | 0 (0.0%) |
| Manufacturing | 494 (71.7%) | 195 (28.3%) |
| Wholesale Trade | 0 (0.0%) | 0 (0.0%) |
| Retail Trade | 139 (54.7%) | 115 (45.3%) |
| Transportation & Warehousing | 24 (68.6%) | 11 (31.4%) |
| Utilities | 0 (0.0%) | 16 (100.0%) |
| Information | 15 (38.5%) | 24 (61.5%) |
| Finance & Insurance | 0 (0.0%) | 0 (0.0%) |
| Real Estate, Rental & Leasing | 26 (100.0%) | 0 (0.0%) |
| Professional & Scientific | 23 (67.6%) | 11 (32.4%) |
| Enterprise Management | 0 (0.0%) | 0 (0.0%) |
| Administrative & Support | 26 (96.3%) | 1 (3.7%) |
| Educational Services | 58 (30.4%) | 133 (69.6%) |
| Health Care & Social Assistance | 50 (23.2%) | 166 (76.8%) |
| Arts, Entertainment & Recreation | 0 (0.0%) | 0 (0.0%) |
| Accommodation & Food Services | 167 (66.5%) | 84 (33.5%) |
| Public Administration | 0 (0.0%) | 0 (0.0%) |
| Total | 1,090 (58.0%) | 791 (42.0%) |
Education in Abbeville
School Enrollment in Abbeville
The most common levels of schooling among the 1,267 students in Abbeville are elementary school (359 | 28.3%), middle school (312 | 24.6%), and high school (214 | 16.9%).
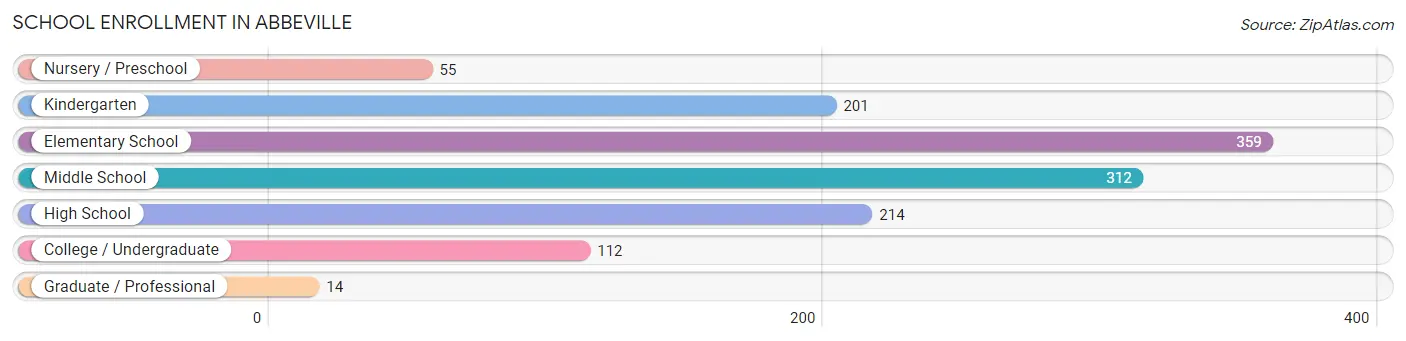
| School Level | # Students | % Students |
| Nursery / Preschool | 55 | 4.3% |
| Kindergarten | 201 | 15.9% |
| Elementary School | 359 | 28.3% |
| Middle School | 312 | 24.6% |
| High School | 214 | 16.9% |
| College / Undergraduate | 112 | 8.8% |
| Graduate / Professional | 14 | 1.1% |
| Total | 1,267 | 100.0% |
School Enrollment by Age by Funding Source in Abbeville
Out of a total of 1,267 students who are enrolled in schools in Abbeville, 188 (14.8%) attend a private institution, while the remaining 1,079 (85.2%) are enrolled in public schools. The age group of 15 to 17 year olds has the highest likelihood of being enrolled in private schools, with 49 (55.7% in the age bracket) enrolled. Conversely, the age group of 3 to 4 year olds has the lowest likelihood of being enrolled in a private school, with 37 (100.0% in the age bracket) attending a public institution.
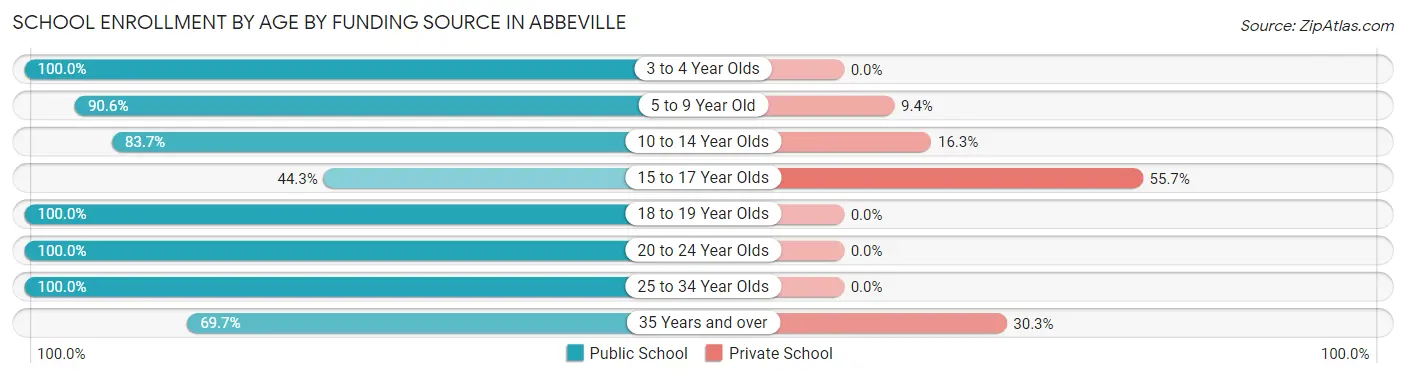
| Age Bracket | Public School | Private School |
| 3 to 4 Year Olds | 37 (100.0%) | 0 (0.0%) |
| 5 to 9 Year Old | 434 (90.6%) | 45 (9.4%) |
| 10 to 14 Year Olds | 427 (83.7%) | 83 (16.3%) |
| 15 to 17 Year Olds | 39 (44.3%) | 49 (55.7%) |
| 18 to 19 Year Olds | 52 (100.0%) | 0 (0.0%) |
| 20 to 24 Year Olds | 32 (100.0%) | 0 (0.0%) |
| 25 to 34 Year Olds | 36 (100.0%) | 0 (0.0%) |
| 35 Years and over | 23 (69.7%) | 10 (30.3%) |
| Total | 1,079 (85.2%) | 188 (14.8%) |
Educational Attainment by Field of Study in Abbeville
Business (173 | 27.9%), education (84 | 13.6%), psychology (71 | 11.5%), liberal arts & history (69 | 11.1%), and literature & languages (65 | 10.5%) are the most common fields of study among 620 individuals in Abbeville who have obtained a bachelor's degree or higher.
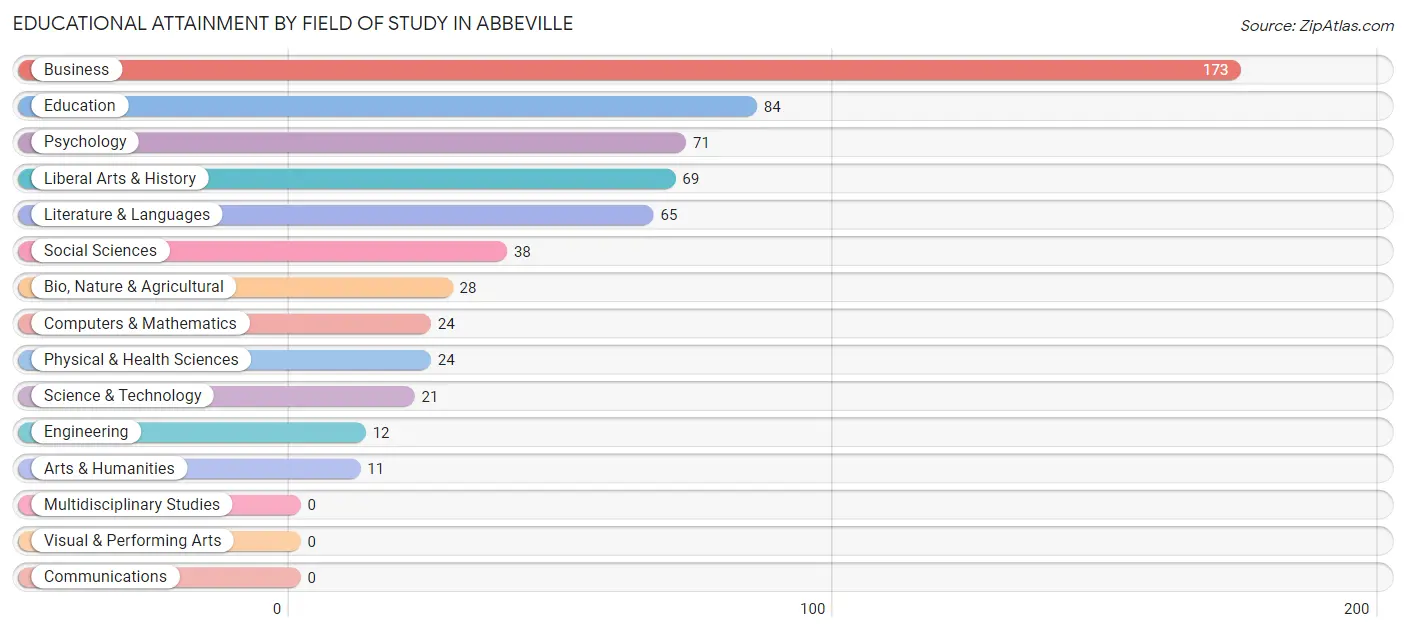
| Field of Study | # Graduates | % Graduates |
| Computers & Mathematics | 24 | 3.9% |
| Bio, Nature & Agricultural | 28 | 4.5% |
| Physical & Health Sciences | 24 | 3.9% |
| Psychology | 71 | 11.5% |
| Social Sciences | 38 | 6.1% |
| Engineering | 12 | 1.9% |
| Multidisciplinary Studies | 0 | 0.0% |
| Science & Technology | 21 | 3.4% |
| Business | 173 | 27.9% |
| Education | 84 | 13.6% |
| Literature & Languages | 65 | 10.5% |
| Liberal Arts & History | 69 | 11.1% |
| Visual & Performing Arts | 0 | 0.0% |
| Communications | 0 | 0.0% |
| Arts & Humanities | 11 | 1.8% |
| Total | 620 | 100.0% |
Transportation & Commute in Abbeville
Vehicle Availability by Sex in Abbeville
The most prevalent vehicle ownership categories in Abbeville are males with 2 vehicles (496, accounting for 49.7%) and females with 2 vehicles (275, making up 65.7%).
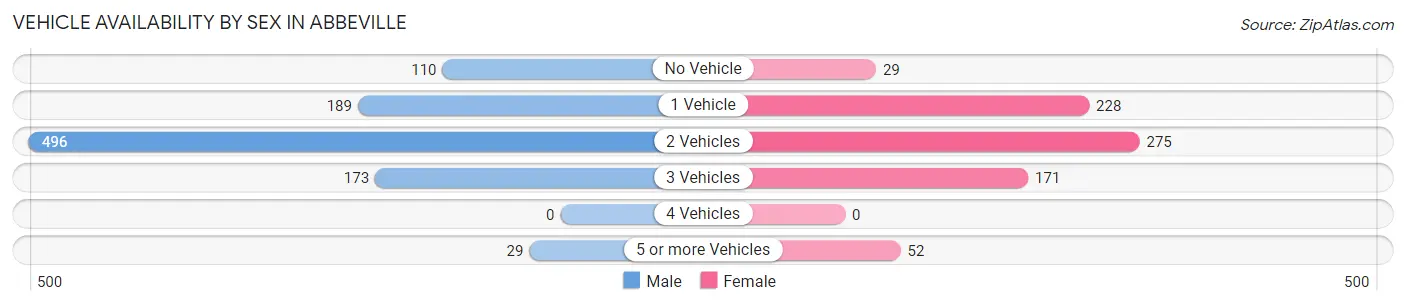
| Vehicles Available | Male | Female |
| No Vehicle | 110 (11.0%) | 29 (3.8%) |
| 1 Vehicle | 189 (19.0%) | 228 (30.2%) |
| 2 Vehicles | 496 (49.7%) | 275 (36.4%) |
| 3 Vehicles | 173 (17.3%) | 171 (22.7%) |
| 4 Vehicles | 0 (0.0%) | 0 (0.0%) |
| 5 or more Vehicles | 29 (2.9%) | 52 (6.9%) |
| Total | 997 (100.0%) | 755 (100.0%) |
Commute Time in Abbeville
The most frequently occuring commute durations in Abbeville are 10 to 14 minutes (312 commuters, 19.2%), 15 to 19 minutes (298 commuters, 18.3%), and 5 to 9 minutes (233 commuters, 14.3%).
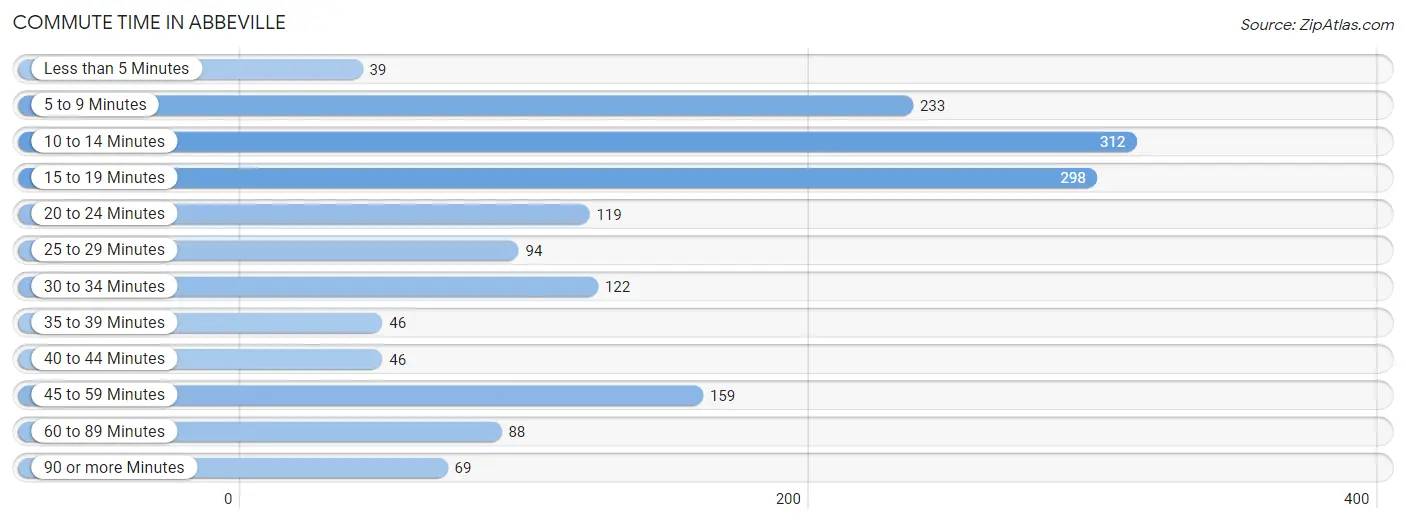
| Commute Time | # Commuters | % Commuters |
| Less than 5 Minutes | 39 | 2.4% |
| 5 to 9 Minutes | 233 | 14.3% |
| 10 to 14 Minutes | 312 | 19.2% |
| 15 to 19 Minutes | 298 | 18.3% |
| 20 to 24 Minutes | 119 | 7.3% |
| 25 to 29 Minutes | 94 | 5.8% |
| 30 to 34 Minutes | 122 | 7.5% |
| 35 to 39 Minutes | 46 | 2.8% |
| 40 to 44 Minutes | 46 | 2.8% |
| 45 to 59 Minutes | 159 | 9.8% |
| 60 to 89 Minutes | 88 | 5.4% |
| 90 or more Minutes | 69 | 4.3% |
Commute Time by Sex in Abbeville
The most common commute times in Abbeville are 15 to 19 minutes (223 commuters, 23.6%) for males and 5 to 9 minutes (156 commuters, 22.9%) for females.
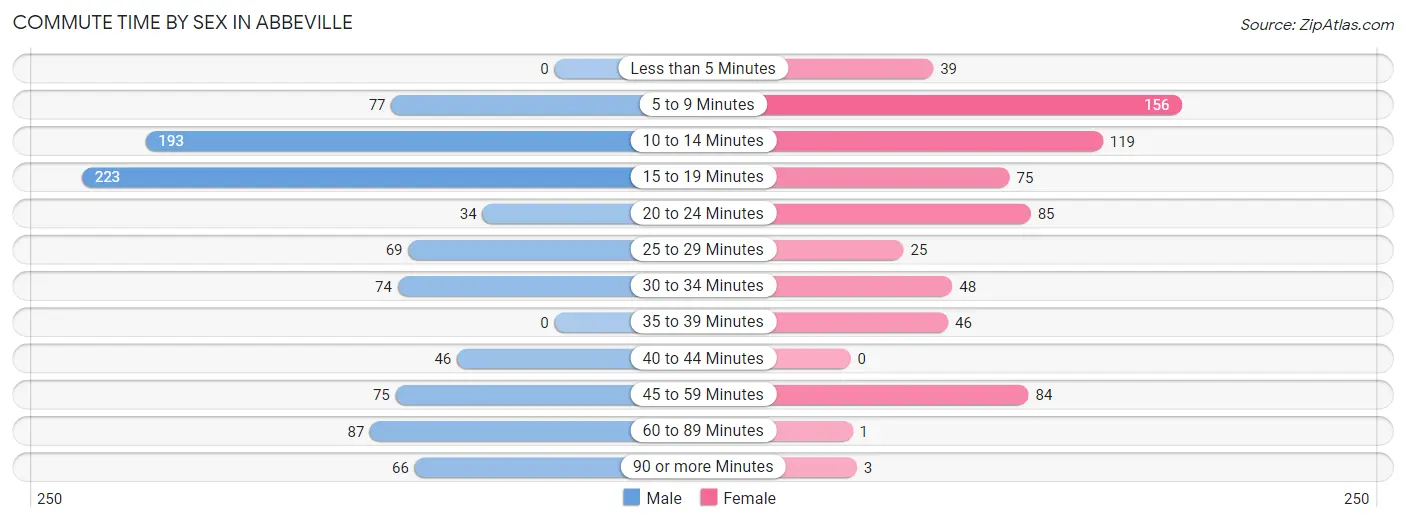
| Commute Time | Male | Female |
| Less than 5 Minutes | 0 (0.0%) | 39 (5.7%) |
| 5 to 9 Minutes | 77 (8.2%) | 156 (22.9%) |
| 10 to 14 Minutes | 193 (20.4%) | 119 (17.5%) |
| 15 to 19 Minutes | 223 (23.6%) | 75 (11.0%) |
| 20 to 24 Minutes | 34 (3.6%) | 85 (12.5%) |
| 25 to 29 Minutes | 69 (7.3%) | 25 (3.7%) |
| 30 to 34 Minutes | 74 (7.8%) | 48 (7.0%) |
| 35 to 39 Minutes | 0 (0.0%) | 46 (6.8%) |
| 40 to 44 Minutes | 46 (4.9%) | 0 (0.0%) |
| 45 to 59 Minutes | 75 (7.9%) | 84 (12.3%) |
| 60 to 89 Minutes | 87 (9.2%) | 1 (0.2%) |
| 90 or more Minutes | 66 (7.0%) | 3 (0.4%) |
Time of Departure to Work by Sex in Abbeville
The most frequent times of departure to work in Abbeville are 7:00 AM to 7:29 AM (280, 29.7%) for males and 7:00 AM to 7:29 AM (161, 23.6%) for females.
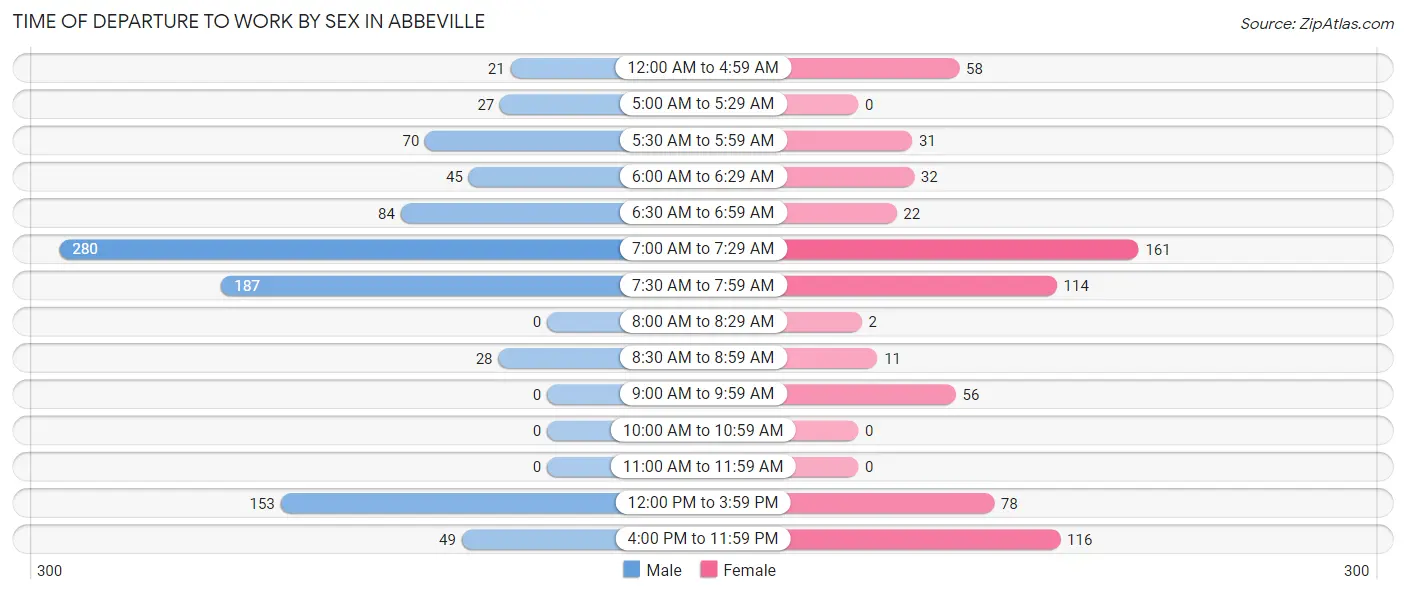
| Time of Departure | Male | Female |
| 12:00 AM to 4:59 AM | 21 (2.2%) | 58 (8.5%) |
| 5:00 AM to 5:29 AM | 27 (2.9%) | 0 (0.0%) |
| 5:30 AM to 5:59 AM | 70 (7.4%) | 31 (4.5%) |
| 6:00 AM to 6:29 AM | 45 (4.8%) | 32 (4.7%) |
| 6:30 AM to 6:59 AM | 84 (8.9%) | 22 (3.2%) |
| 7:00 AM to 7:29 AM | 280 (29.7%) | 161 (23.6%) |
| 7:30 AM to 7:59 AM | 187 (19.8%) | 114 (16.7%) |
| 8:00 AM to 8:29 AM | 0 (0.0%) | 2 (0.3%) |
| 8:30 AM to 8:59 AM | 28 (3.0%) | 11 (1.6%) |
| 9:00 AM to 9:59 AM | 0 (0.0%) | 56 (8.2%) |
| 10:00 AM to 10:59 AM | 0 (0.0%) | 0 (0.0%) |
| 11:00 AM to 11:59 AM | 0 (0.0%) | 0 (0.0%) |
| 12:00 PM to 3:59 PM | 153 (16.2%) | 78 (11.5%) |
| 4:00 PM to 11:59 PM | 49 (5.2%) | 116 (17.0%) |
| Total | 944 (100.0%) | 681 (100.0%) |
Housing Occupancy in Abbeville
Occupancy by Ownership in Abbeville
Of the total 2,013 dwellings in Abbeville, owner-occupied units account for 980 (48.7%), while renter-occupied units make up 1,033 (51.3%).
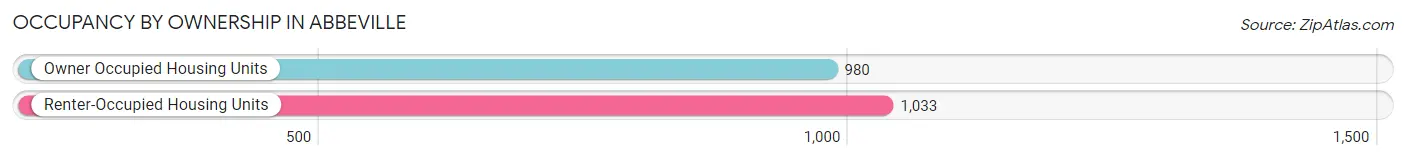
| Occupancy | # Housing Units | % Housing Units |
| Owner Occupied Housing Units | 980 | 48.7% |
| Renter-Occupied Housing Units | 1,033 | 51.3% |
| Total Occupied Housing Units | 2,013 | 100.0% |
Occupancy by Household Size in Abbeville
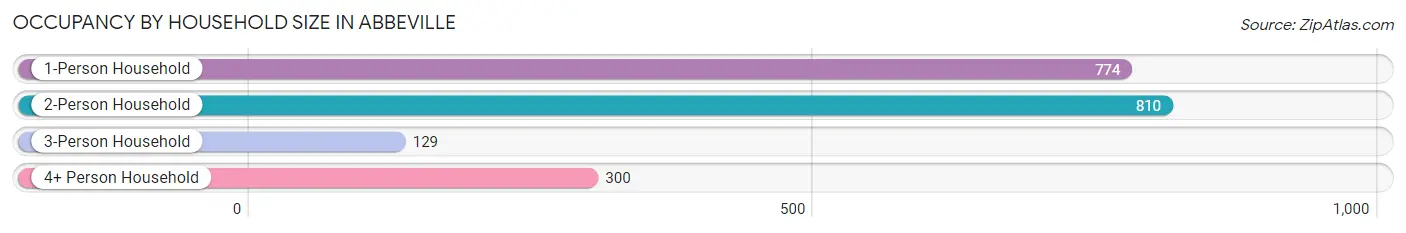
| Household Size | # Housing Units | % Housing Units |
| 1-Person Household | 774 | 38.5% |
| 2-Person Household | 810 | 40.2% |
| 3-Person Household | 129 | 6.4% |
| 4+ Person Household | 300 | 14.9% |
| Total Housing Units | 2,013 | 100.0% |
Occupancy by Ownership by Household Size in Abbeville
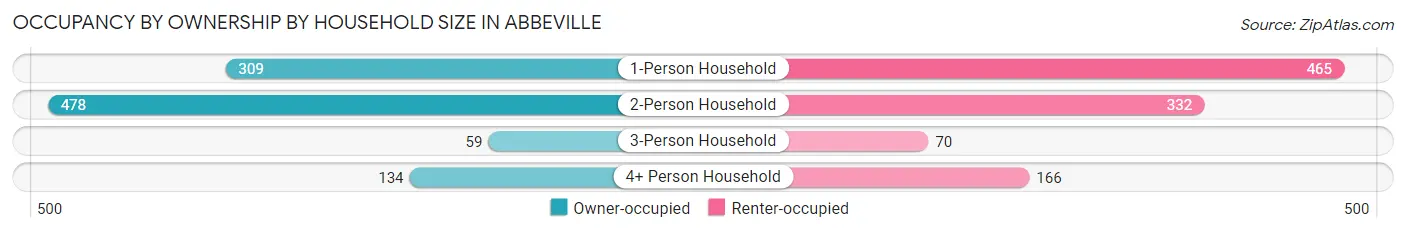
| Household Size | Owner-occupied | Renter-occupied |
| 1-Person Household | 309 (39.9%) | 465 (60.1%) |
| 2-Person Household | 478 (59.0%) | 332 (41.0%) |
| 3-Person Household | 59 (45.7%) | 70 (54.3%) |
| 4+ Person Household | 134 (44.7%) | 166 (55.3%) |
| Total Housing Units | 980 (48.7%) | 1,033 (51.3%) |
Occupancy by Educational Attainment in Abbeville
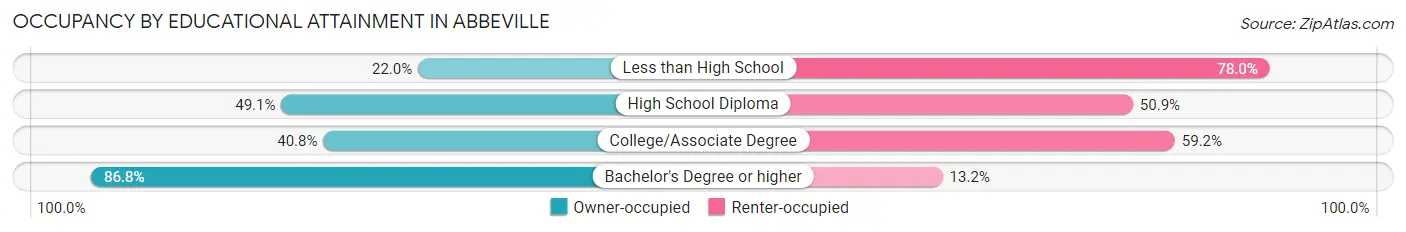
| Household Size | Owner-occupied | Renter-occupied |
| Less than High School | 95 (22.0%) | 337 (78.0%) |
| High School Diploma | 326 (49.1%) | 338 (50.9%) |
| College/Associate Degree | 210 (40.8%) | 305 (59.2%) |
| Bachelor's Degree or higher | 349 (86.8%) | 53 (13.2%) |
Occupancy by Age of Householder in Abbeville
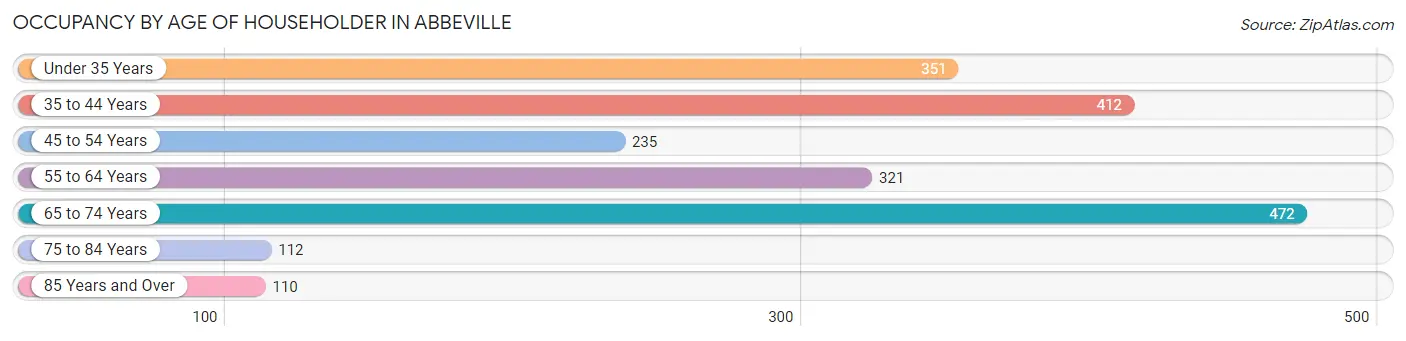
| Age Bracket | # Households | % Households |
| Under 35 Years | 351 | 17.4% |
| 35 to 44 Years | 412 | 20.5% |
| 45 to 54 Years | 235 | 11.7% |
| 55 to 64 Years | 321 | 16.0% |
| 65 to 74 Years | 472 | 23.4% |
| 75 to 84 Years | 112 | 5.6% |
| 85 Years and Over | 110 | 5.5% |
| Total | 2,013 | 100.0% |
Housing Finances in Abbeville
Median Income by Occupancy in Abbeville
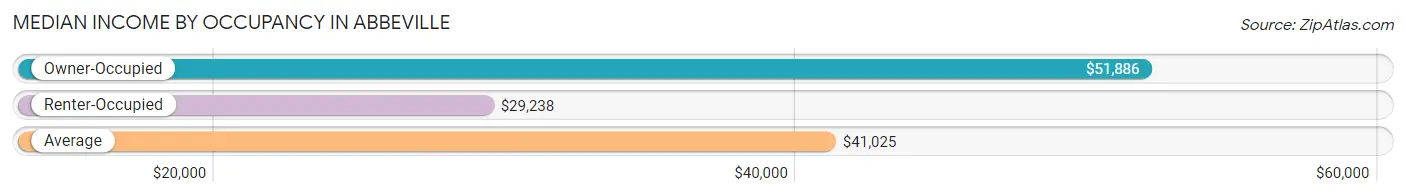
| Occupancy Type | # Households | Median Income |
| Owner-Occupied | 980 (48.7%) | $51,886 |
| Renter-Occupied | 1,033 (51.3%) | $29,238 |
| Average | 2,013 (100.0%) | $41,025 |
Occupancy by Householder Income Bracket in Abbeville
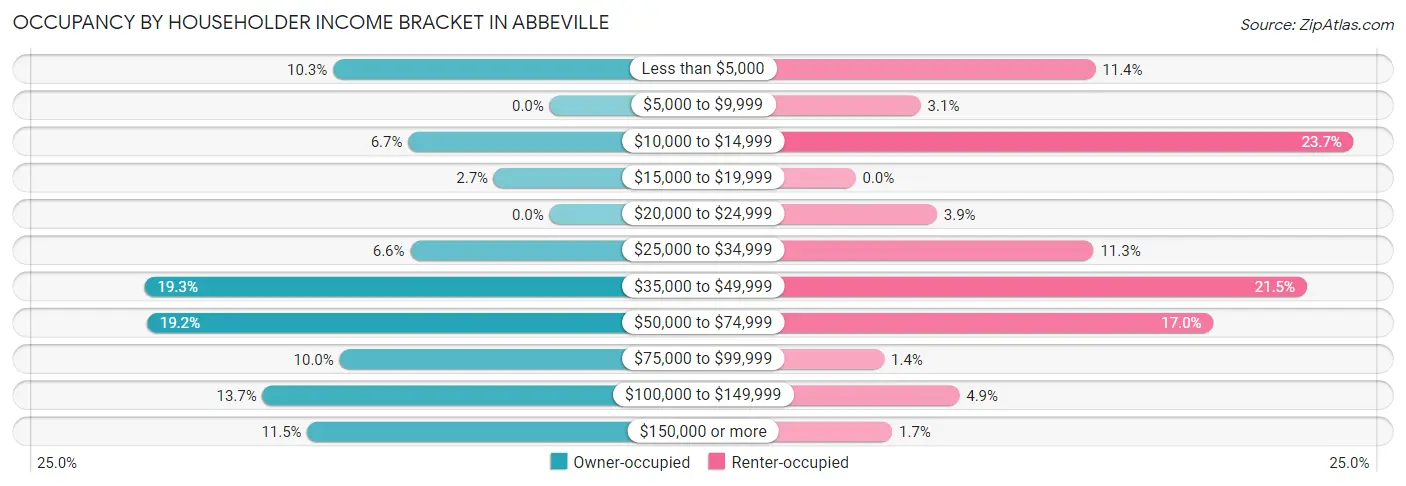
| Income Bracket | Owner-occupied | Renter-occupied |
| Less than $5,000 | 101 (10.3%) | 118 (11.4%) |
| $5,000 to $9,999 | 0 (0.0%) | 32 (3.1%) |
| $10,000 to $14,999 | 66 (6.7%) | 245 (23.7%) |
| $15,000 to $19,999 | 26 (2.6%) | 0 (0.0%) |
| $20,000 to $24,999 | 0 (0.0%) | 40 (3.9%) |
| $25,000 to $34,999 | 65 (6.6%) | 117 (11.3%) |
| $35,000 to $49,999 | 189 (19.3%) | 222 (21.5%) |
| $50,000 to $74,999 | 188 (19.2%) | 176 (17.0%) |
| $75,000 to $99,999 | 98 (10.0%) | 14 (1.4%) |
| $100,000 to $149,999 | 134 (13.7%) | 51 (4.9%) |
| $150,000 or more | 113 (11.5%) | 18 (1.7%) |
| Total | 980 (100.0%) | 1,033 (100.0%) |
Monthly Housing Cost Tiers in Abbeville
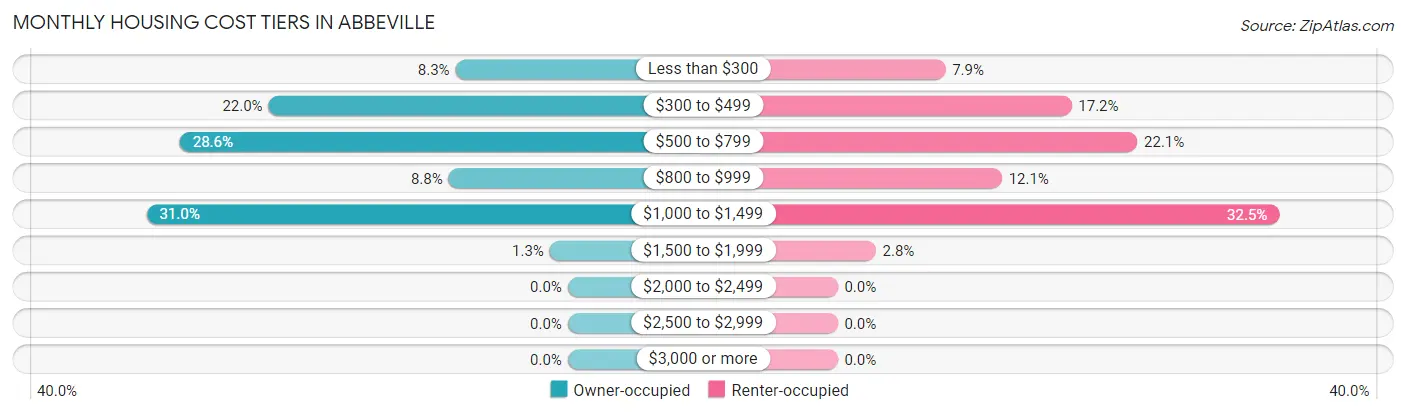
| Monthly Cost | Owner-occupied | Renter-occupied |
| Less than $300 | 81 (8.3%) | 82 (7.9%) |
| $300 to $499 | 216 (22.0%) | 178 (17.2%) |
| $500 to $799 | 280 (28.6%) | 228 (22.1%) |
| $800 to $999 | 86 (8.8%) | 125 (12.1%) |
| $1,000 to $1,499 | 304 (31.0%) | 336 (32.5%) |
| $1,500 to $1,999 | 13 (1.3%) | 29 (2.8%) |
| $2,000 to $2,499 | 0 (0.0%) | 0 (0.0%) |
| $2,500 to $2,999 | 0 (0.0%) | 0 (0.0%) |
| $3,000 or more | 0 (0.0%) | 0 (0.0%) |
| Total | 980 (100.0%) | 1,033 (100.0%) |
Physical Housing Characteristics in Abbeville
Housing Structures in Abbeville
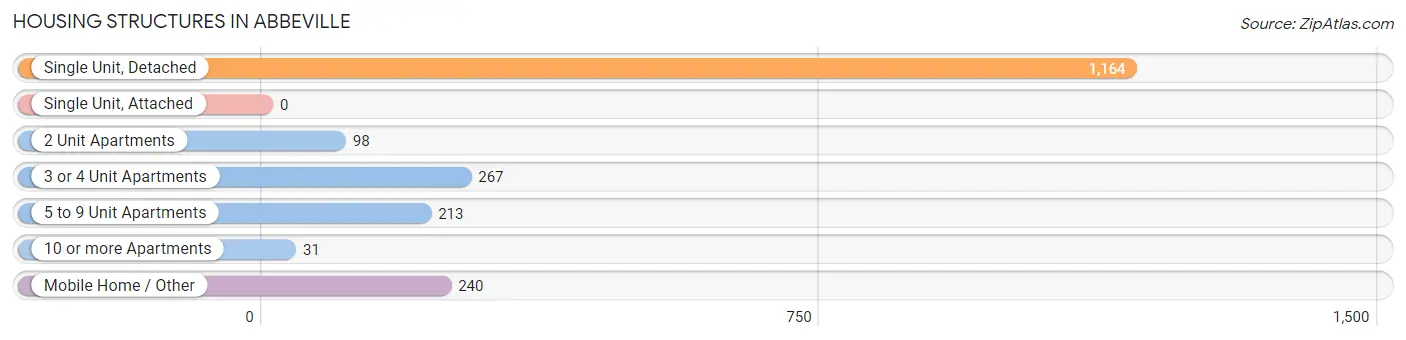
| Structure Type | # Housing Units | % Housing Units |
| Single Unit, Detached | 1,164 | 57.8% |
| Single Unit, Attached | 0 | 0.0% |
| 2 Unit Apartments | 98 | 4.9% |
| 3 or 4 Unit Apartments | 267 | 13.3% |
| 5 to 9 Unit Apartments | 213 | 10.6% |
| 10 or more Apartments | 31 | 1.5% |
| Mobile Home / Other | 240 | 11.9% |
| Total | 2,013 | 100.0% |
Housing Structures by Occupancy in Abbeville
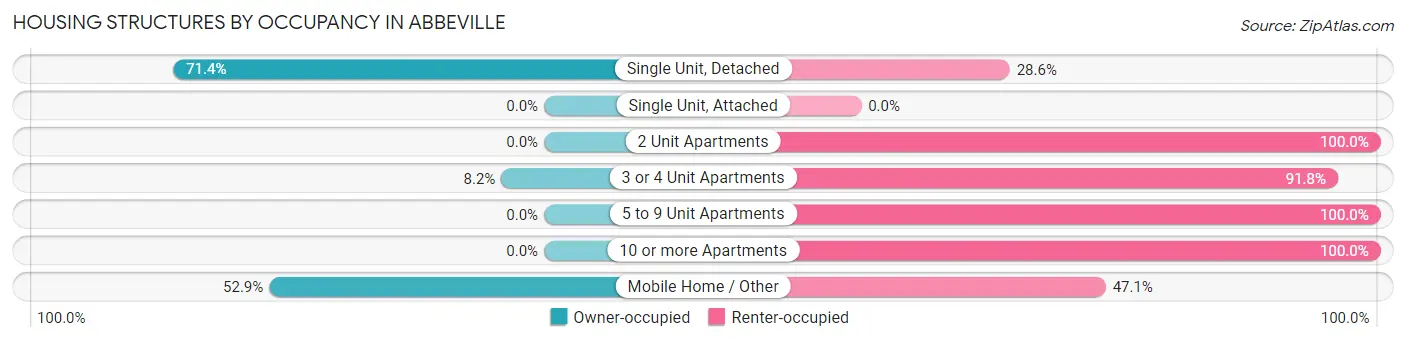
| Structure Type | Owner-occupied | Renter-occupied |
| Single Unit, Detached | 831 (71.4%) | 333 (28.6%) |
| Single Unit, Attached | 0 (0.0%) | 0 (0.0%) |
| 2 Unit Apartments | 0 (0.0%) | 98 (100.0%) |
| 3 or 4 Unit Apartments | 22 (8.2%) | 245 (91.8%) |
| 5 to 9 Unit Apartments | 0 (0.0%) | 213 (100.0%) |
| 10 or more Apartments | 0 (0.0%) | 31 (100.0%) |
| Mobile Home / Other | 127 (52.9%) | 113 (47.1%) |
| Total | 980 (48.7%) | 1,033 (51.3%) |
Housing Structures by Number of Rooms in Abbeville
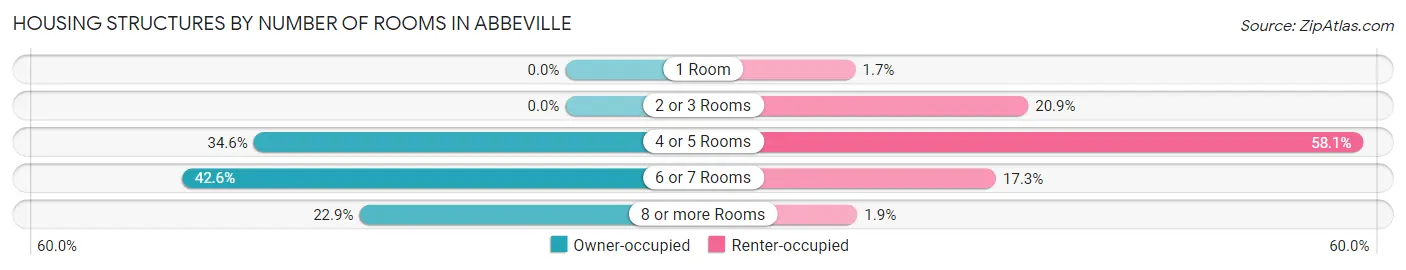
| Number of Rooms | Owner-occupied | Renter-occupied |
| 1 Room | 0 (0.0%) | 18 (1.7%) |
| 2 or 3 Rooms | 0 (0.0%) | 216 (20.9%) |
| 4 or 5 Rooms | 339 (34.6%) | 600 (58.1%) |
| 6 or 7 Rooms | 417 (42.5%) | 179 (17.3%) |
| 8 or more Rooms | 224 (22.9%) | 20 (1.9%) |
| Total | 980 (100.0%) | 1,033 (100.0%) |
Housing Structure by Heating Type in Abbeville
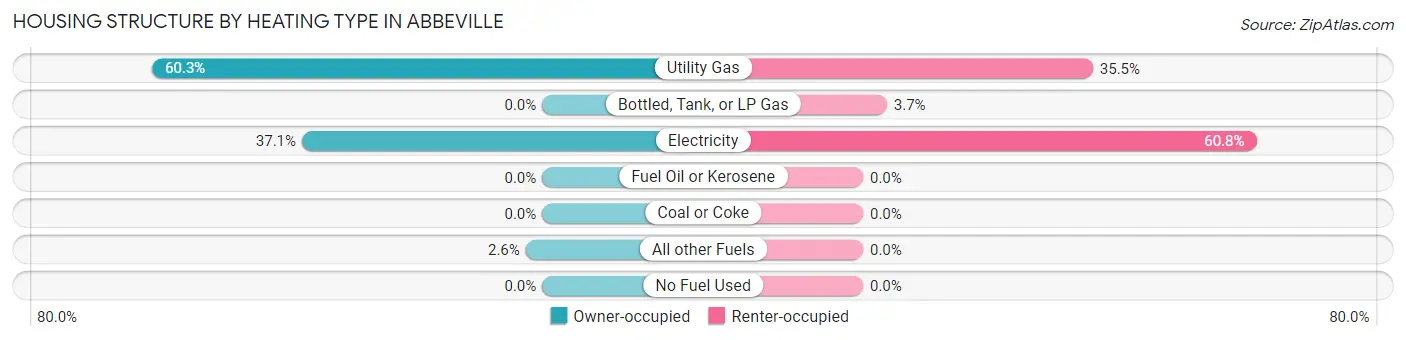
| Heating Type | Owner-occupied | Renter-occupied |
| Utility Gas | 591 (60.3%) | 367 (35.5%) |
| Bottled, Tank, or LP Gas | 0 (0.0%) | 38 (3.7%) |
| Electricity | 364 (37.1%) | 628 (60.8%) |
| Fuel Oil or Kerosene | 0 (0.0%) | 0 (0.0%) |
| Coal or Coke | 0 (0.0%) | 0 (0.0%) |
| All other Fuels | 25 (2.5%) | 0 (0.0%) |
| No Fuel Used | 0 (0.0%) | 0 (0.0%) |
| Total | 980 (100.0%) | 1,033 (100.0%) |
Household Vehicle Usage in Abbeville
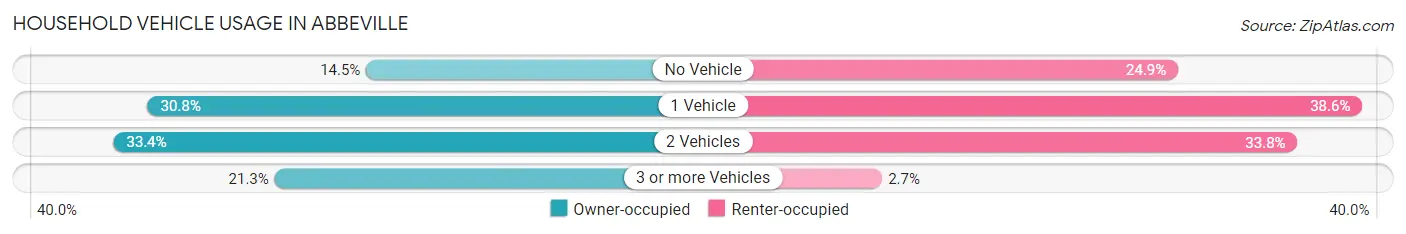
| Vehicles per Household | Owner-occupied | Renter-occupied |
| No Vehicle | 142 (14.5%) | 257 (24.9%) |
| 1 Vehicle | 302 (30.8%) | 399 (38.6%) |
| 2 Vehicles | 327 (33.4%) | 349 (33.8%) |
| 3 or more Vehicles | 209 (21.3%) | 28 (2.7%) |
| Total | 980 (100.0%) | 1,033 (100.0%) |
Real Estate & Mortgages in Abbeville
Real Estate and Mortgage Overview in Abbeville
| Characteristic | Without Mortgage | With Mortgage |
| Housing Units | 613 | 367 |
| Median Property Value | $87,600 | $151,200 |
| Median Household Income | $50,066 | $38 |
| Monthly Housing Costs | $513 | $0 |
| Real Estate Taxes | $658 | $0 |
Property Value by Mortgage Status in Abbeville
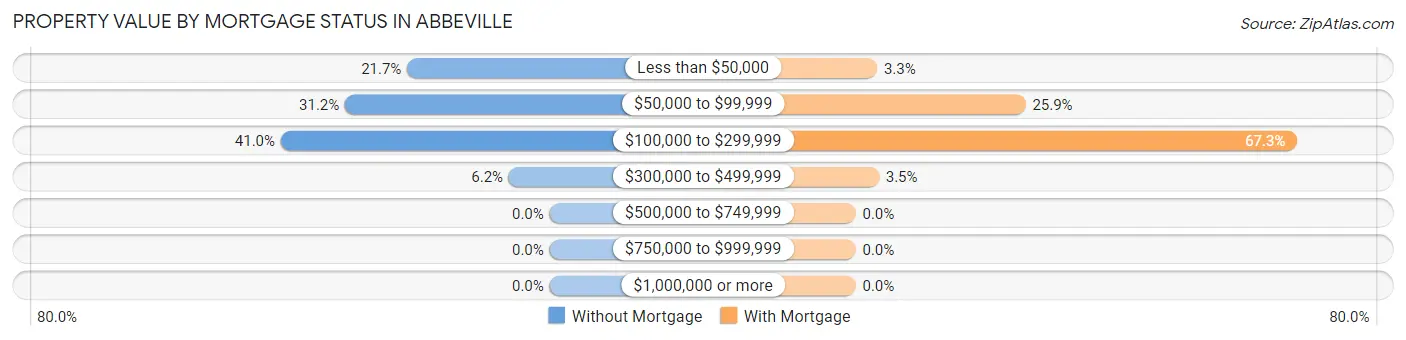
| Property Value | Without Mortgage | With Mortgage |
| Less than $50,000 | 133 (21.7%) | 12 (3.3%) |
| $50,000 to $99,999 | 191 (31.2%) | 95 (25.9%) |
| $100,000 to $299,999 | 251 (40.9%) | 247 (67.3%) |
| $300,000 to $499,999 | 38 (6.2%) | 13 (3.5%) |
| $500,000 to $749,999 | 0 (0.0%) | 0 (0.0%) |
| $750,000 to $999,999 | 0 (0.0%) | 0 (0.0%) |
| $1,000,000 or more | 0 (0.0%) | 0 (0.0%) |
| Total | 613 (100.0%) | 367 (100.0%) |
Household Income by Mortgage Status in Abbeville
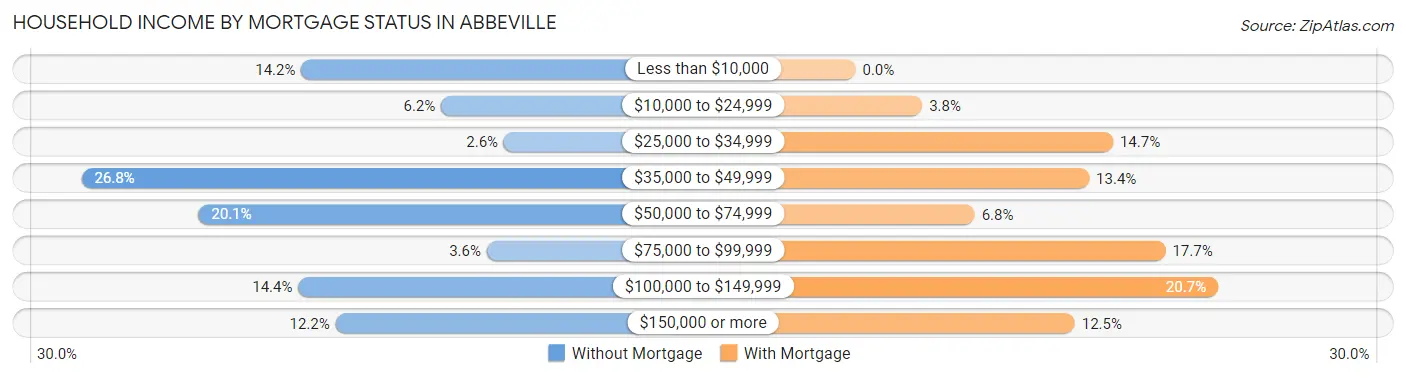
| Household Income | Without Mortgage | With Mortgage |
| Less than $10,000 | 87 (14.2%) | 0 (0.0%) |
| $10,000 to $24,999 | 38 (6.2%) | 14 (3.8%) |
| $25,000 to $34,999 | 16 (2.6%) | 54 (14.7%) |
| $35,000 to $49,999 | 164 (26.8%) | 49 (13.4%) |
| $50,000 to $74,999 | 123 (20.1%) | 25 (6.8%) |
| $75,000 to $99,999 | 22 (3.6%) | 65 (17.7%) |
| $100,000 to $149,999 | 88 (14.4%) | 76 (20.7%) |
| $150,000 or more | 75 (12.2%) | 46 (12.5%) |
| Total | 613 (100.0%) | 367 (100.0%) |
Property Value to Household Income Ratio in Abbeville
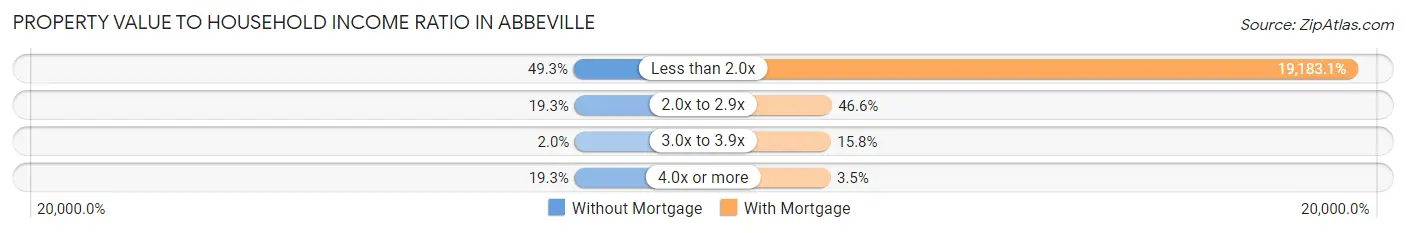
| Value-to-Income Ratio | Without Mortgage | With Mortgage |
| Less than 2.0x | 302 (49.3%) | 70,402 (19,183.1%) |
| 2.0x to 2.9x | 118 (19.3%) | 171 (46.6%) |
| 3.0x to 3.9x | 12 (2.0%) | 58 (15.8%) |
| 4.0x or more | 118 (19.3%) | 13 (3.5%) |
| Total | 613 (100.0%) | 367 (100.0%) |
Real Estate Taxes by Mortgage Status in Abbeville
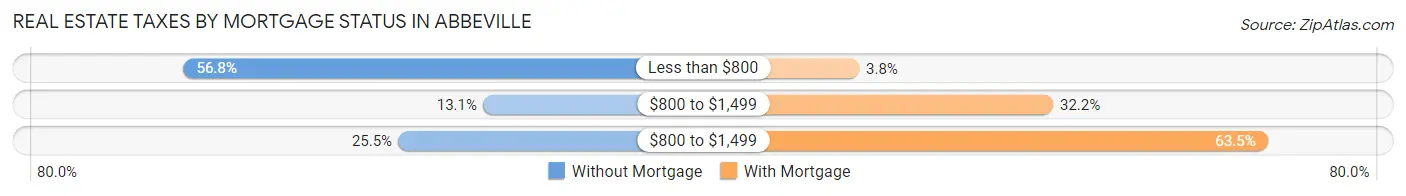
| Property Taxes | Without Mortgage | With Mortgage |
| Less than $800 | 348 (56.8%) | 14 (3.8%) |
| $800 to $1,499 | 80 (13.1%) | 118 (32.2%) |
| $800 to $1,499 | 156 (25.5%) | 233 (63.5%) |
| Total | 613 (100.0%) | 367 (100.0%) |
Health & Disability in Abbeville
Health Insurance Coverage by Age in Abbeville
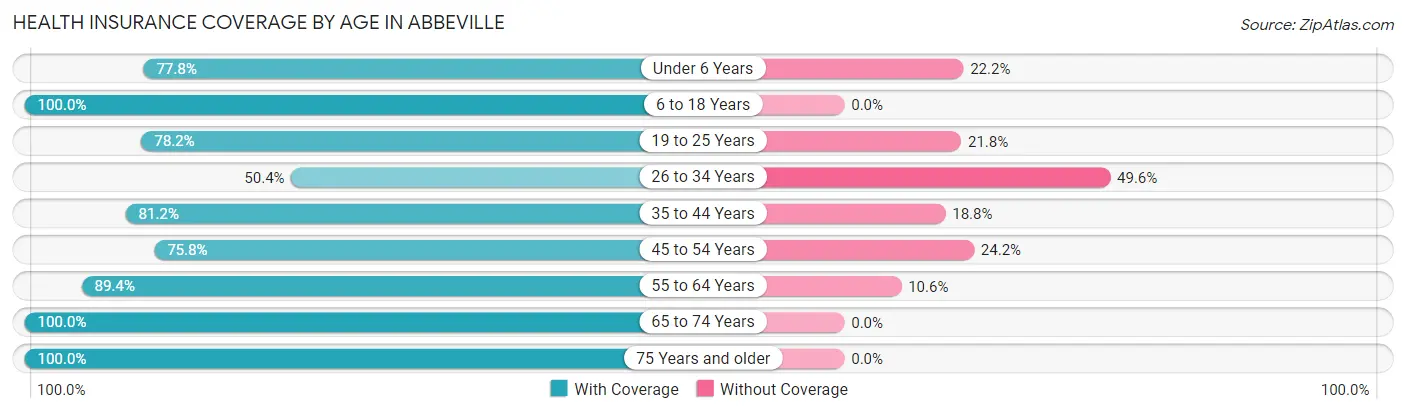
| Age Bracket | With Coverage | Without Coverage |
| Under 6 Years | 186 (77.8%) | 53 (22.2%) |
| 6 to 18 Years | 1,115 (100.0%) | 0 (0.0%) |
| 19 to 25 Years | 158 (78.2%) | 44 (21.8%) |
| 26 to 34 Years | 234 (50.4%) | 230 (49.6%) |
| 35 to 44 Years | 698 (81.2%) | 162 (18.8%) |
| 45 to 54 Years | 273 (75.8%) | 87 (24.2%) |
| 55 to 64 Years | 488 (89.4%) | 58 (10.6%) |
| 65 to 74 Years | 700 (100.0%) | 0 (0.0%) |
| 75 Years and older | 309 (100.0%) | 0 (0.0%) |
| Total | 4,161 (86.8%) | 634 (13.2%) |
Health Insurance Coverage by Citizenship Status in Abbeville
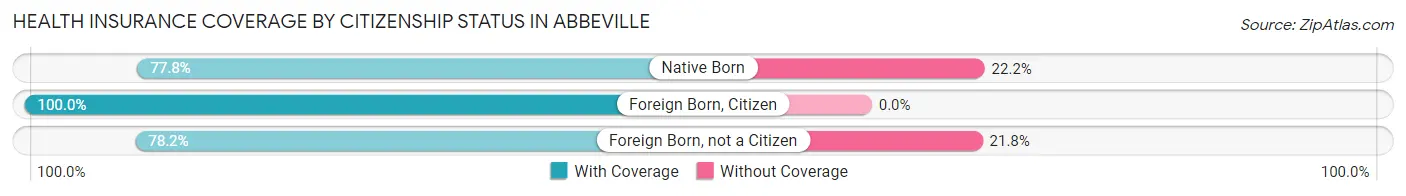
| Citizenship Status | With Coverage | Without Coverage |
| Native Born | 186 (77.8%) | 53 (22.2%) |
| Foreign Born, Citizen | 1,115 (100.0%) | 0 (0.0%) |
| Foreign Born, not a Citizen | 158 (78.2%) | 44 (21.8%) |
Health Insurance Coverage by Household Income in Abbeville
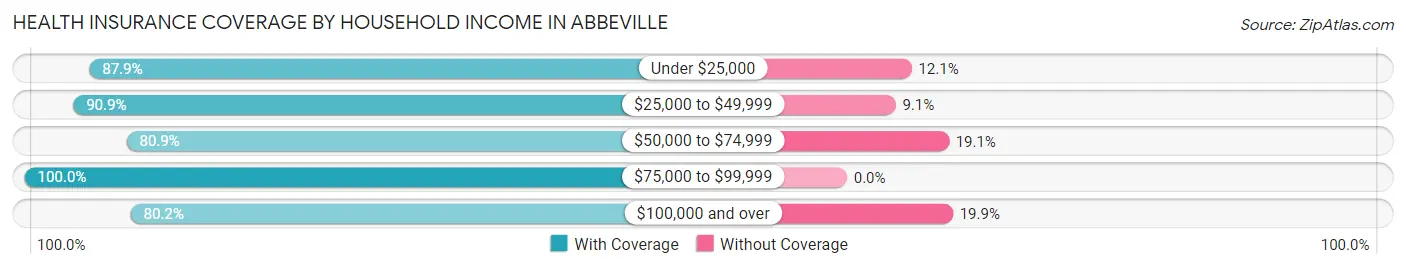
| Household Income | With Coverage | Without Coverage |
| Under $25,000 | 1,051 (87.9%) | 145 (12.1%) |
| $25,000 to $49,999 | 1,056 (90.9%) | 106 (9.1%) |
| $50,000 to $74,999 | 551 (80.9%) | 130 (19.1%) |
| $75,000 to $99,999 | 497 (100.0%) | 0 (0.0%) |
| $100,000 and over | 985 (80.1%) | 244 (19.9%) |
Public vs Private Health Insurance Coverage by Age in Abbeville
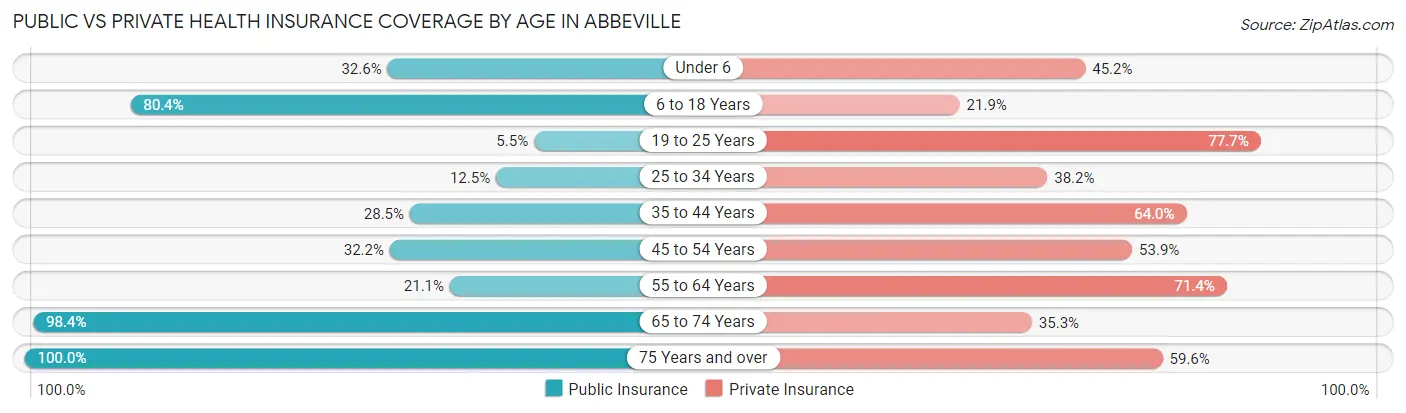
| Age Bracket | Public Insurance | Private Insurance |
| Under 6 | 78 (32.6%) | 108 (45.2%) |
| 6 to 18 Years | 896 (80.4%) | 244 (21.9%) |
| 19 to 25 Years | 11 (5.4%) | 157 (77.7%) |
| 25 to 34 Years | 58 (12.5%) | 177 (38.2%) |
| 35 to 44 Years | 245 (28.5%) | 550 (63.9%) |
| 45 to 54 Years | 116 (32.2%) | 194 (53.9%) |
| 55 to 64 Years | 115 (21.1%) | 390 (71.4%) |
| 65 to 74 Years | 689 (98.4%) | 247 (35.3%) |
| 75 Years and over | 309 (100.0%) | 184 (59.6%) |
| Total | 2,517 (52.5%) | 2,251 (46.9%) |
Disability Status by Sex by Age in Abbeville
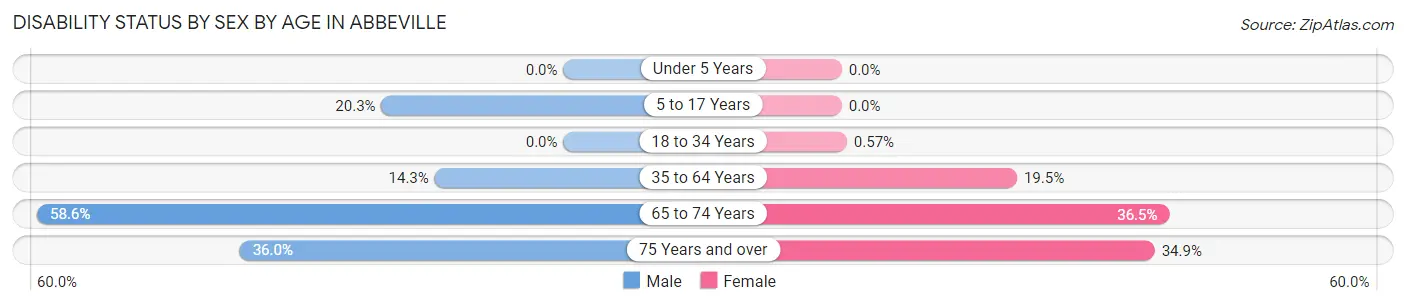
| Age Bracket | Male | Female |
| Under 5 Years | 0 (0.0%) | 0 (0.0%) |
| 5 to 17 Years | 126 (20.3%) | 0 (0.0%) |
| 18 to 34 Years | 0 (0.0%) | 3 (0.6%) |
| 35 to 64 Years | 143 (14.3%) | 150 (19.5%) |
| 65 to 74 Years | 211 (58.6%) | 124 (36.5%) |
| 75 Years and over | 40 (36.0%) | 69 (34.8%) |
Disability Class by Sex by Age in Abbeville
Disability Class: Hearing Difficulty
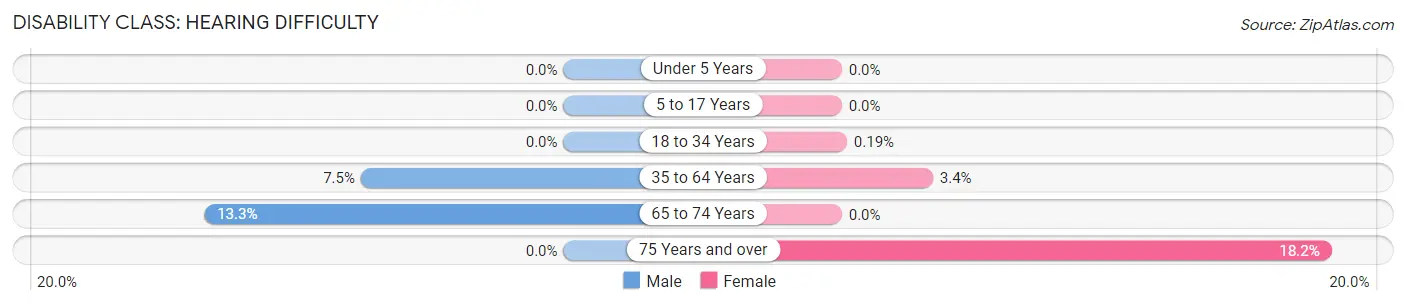
| Age Bracket | Male | Female |
| Under 5 Years | 0 (0.0%) | 0 (0.0%) |
| 5 to 17 Years | 0 (0.0%) | 0 (0.0%) |
| 18 to 34 Years | 0 (0.0%) | 1 (0.2%) |
| 35 to 64 Years | 75 (7.5%) | 26 (3.4%) |
| 65 to 74 Years | 48 (13.3%) | 0 (0.0%) |
| 75 Years and over | 0 (0.0%) | 36 (18.2%) |
Disability Class: Vision Difficulty
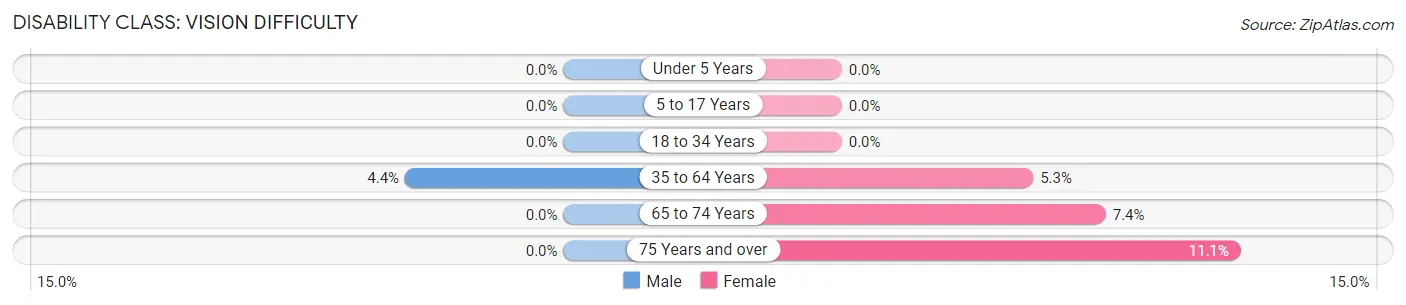
| Age Bracket | Male | Female |
| Under 5 Years | 0 (0.0%) | 0 (0.0%) |
| 5 to 17 Years | 0 (0.0%) | 0 (0.0%) |
| 18 to 34 Years | 0 (0.0%) | 0 (0.0%) |
| 35 to 64 Years | 44 (4.4%) | 41 (5.3%) |
| 65 to 74 Years | 0 (0.0%) | 25 (7.3%) |
| 75 Years and over | 0 (0.0%) | 22 (11.1%) |
Disability Class: Cognitive Difficulty
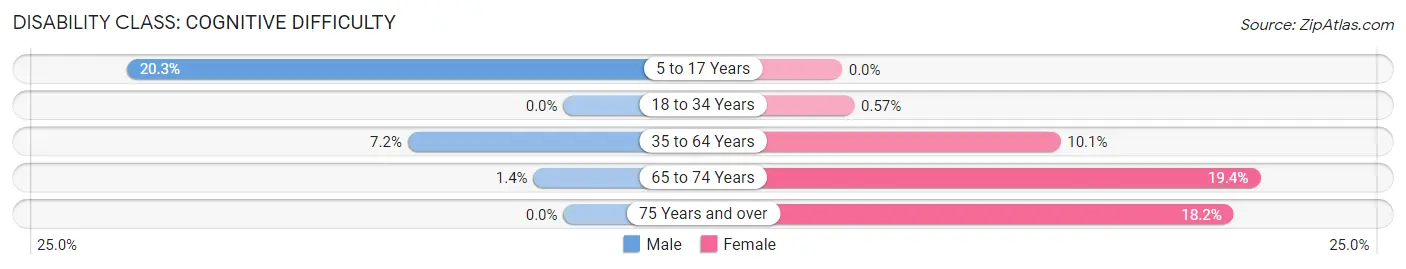
| Age Bracket | Male | Female |
| 5 to 17 Years | 126 (20.3%) | 0 (0.0%) |
| 18 to 34 Years | 0 (0.0%) | 3 (0.6%) |
| 35 to 64 Years | 72 (7.2%) | 78 (10.1%) |
| 65 to 74 Years | 5 (1.4%) | 66 (19.4%) |
| 75 Years and over | 0 (0.0%) | 36 (18.2%) |
Disability Class: Ambulatory Difficulty
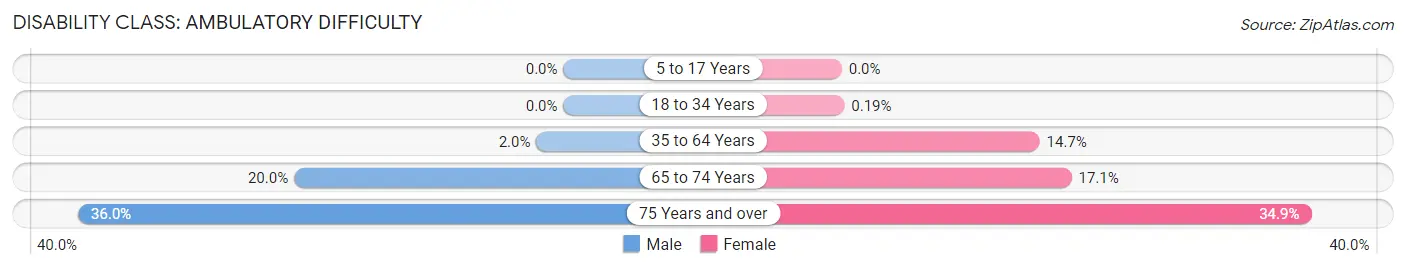
| Age Bracket | Male | Female |
| 5 to 17 Years | 0 (0.0%) | 0 (0.0%) |
| 18 to 34 Years | 0 (0.0%) | 1 (0.2%) |
| 35 to 64 Years | 20 (2.0%) | 113 (14.7%) |
| 65 to 74 Years | 72 (20.0%) | 58 (17.1%) |
| 75 Years and over | 40 (36.0%) | 69 (34.8%) |
Disability Class: Self-Care Difficulty
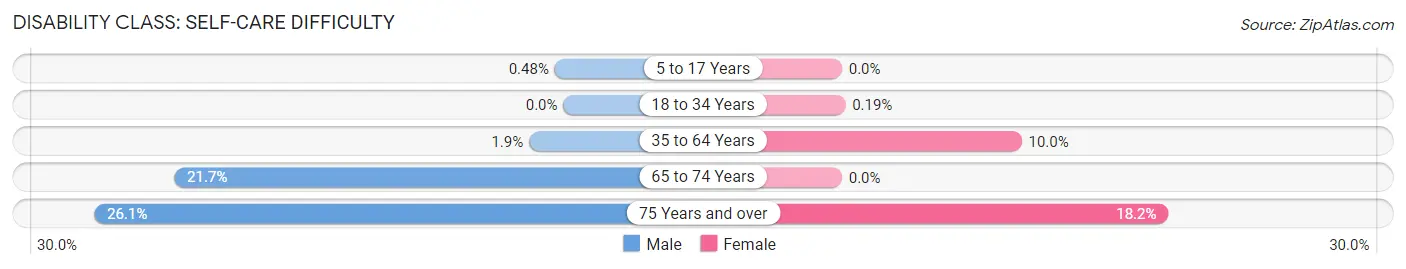
| Age Bracket | Male | Female |
| 5 to 17 Years | 3 (0.5%) | 0 (0.0%) |
| 18 to 34 Years | 0 (0.0%) | 1 (0.2%) |
| 35 to 64 Years | 19 (1.9%) | 77 (10.0%) |
| 65 to 74 Years | 78 (21.7%) | 0 (0.0%) |
| 75 Years and over | 29 (26.1%) | 36 (18.2%) |
Technology Access in Abbeville
Computing Device Access in Abbeville
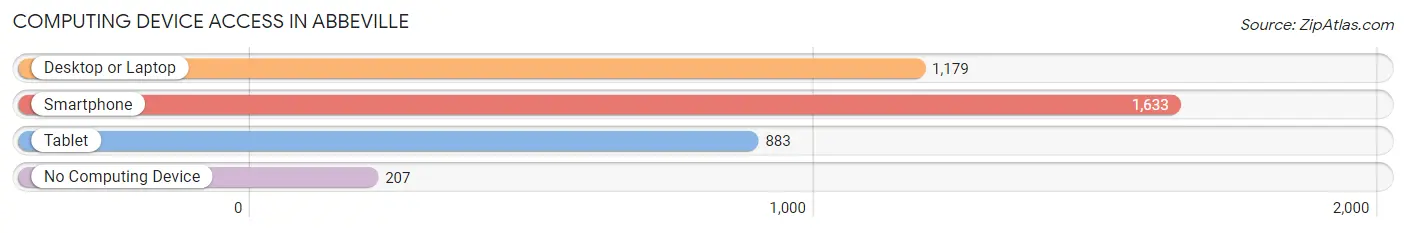
| Device Type | # Households | % Households |
| Desktop or Laptop | 1,179 | 58.6% |
| Smartphone | 1,633 | 81.1% |
| Tablet | 883 | 43.9% |
| No Computing Device | 207 | 10.3% |
| Total | 2,013 | 100.0% |
Internet Access in Abbeville
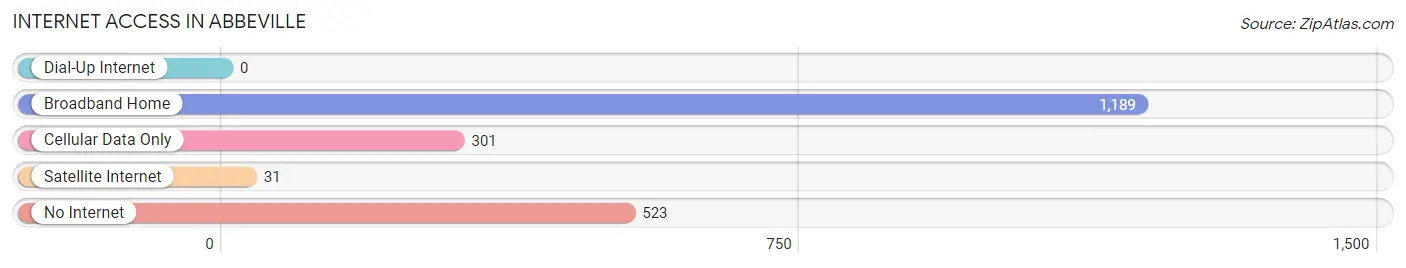
| Internet Type | # Households | % Households |
| Dial-Up Internet | 0 | 0.0% |
| Broadband Home | 1,189 | 59.1% |
| Cellular Data Only | 301 | 14.9% |
| Satellite Internet | 31 | 1.5% |
| No Internet | 523 | 26.0% |
| Total | 2,013 | 100.0% |
Abbeville Summary
Abbeville, South Carolina is a small town located in the western part of the state, about an hour and a half from the state capital of Columbia. It is the county seat of Abbeville County, and is home to a population of approximately 5,237 people. The town was founded in 1764 and is one of the oldest towns in the state.
History
Abbeville was founded in 1764 by French Huguenots who had fled religious persecution in France. The town was named after the French city of Abbeville, and was the first settlement in the area. The town was incorporated in 1839 and was the site of the first Confederate capital of South Carolina during the Civil War. After the war, the town was rebuilt and the economy began to grow. The town was home to several cotton mills and other industries, and was a major center for the production of textiles.
Geography
Abbeville is located in the western part of South Carolina, about an hour and a half from the state capital of Columbia. The town is situated on the Savannah River, and is surrounded by rolling hills and forests. The town is located in the Piedmont region of the state, and has a humid subtropical climate. The average temperature in the summer is around 80 degrees Fahrenheit, and the average temperature in the winter is around 50 degrees Fahrenheit.
Economy
The economy of Abbeville is largely based on agriculture and manufacturing. The town is home to several cotton mills and other industries, and is a major center for the production of textiles. The town is also home to several small businesses, including restaurants, retail stores, and other services. The town is also home to several historic sites, including the Abbeville Opera House, the Abbeville County Courthouse, and the Abbeville Historic District.
Demographics
As of the 2010 census, the population of Abbeville was 5,237. The racial makeup of the town was 79.3% White, 17.7% African American, 0.3% Native American, 0.4% Asian, 0.1% Pacific Islander, 1.2% from other races, and 1.1% from two or more races. The median household income in the town was $30,945, and the median family income was $37,917. The per capita income in the town was $17,845. The town has a poverty rate of 22.3%.
Abbeville is a small town with a rich history and a vibrant economy. The town is home to several historic sites, and is a major center for the production of textiles. The town is also home to a diverse population, with a median household income that is slightly below the state average. Abbeville is a great place to live and work, and is a great example of the beauty and charm of small town life in South Carolina.
Common Questions
What is Per Capita Income in Abbeville?
Per Capita income in Abbeville is $32,207.
What is the Median Family Income in Abbeville?
Median Family Income in Abbeville is $50,461.
What is the Median Household income in Abbeville?
Median Household Income in Abbeville is $41,025.
What is Income or Wage Gap in Abbeville?
Income or Wage Gap in Abbeville is 27.5%.
Women in Abbeville earn 72.5 cents for every dollar earned by a man.
What is Inequality or Gini Index in Abbeville?
Inequality or Gini Index in Abbeville is 0.62.
What is the Total Population of Abbeville?
Total Population of Abbeville is 4,892.
What is the Total Male Population of Abbeville?
Total Male Population of Abbeville is 2,422.
What is the Total Female Population of Abbeville?
Total Female Population of Abbeville is 2,470.
What is the Ratio of Males per 100 Females in Abbeville?
There are 98.06 Males per 100 Females in Abbeville.
What is the Ratio of Females per 100 Males in Abbeville?
There are 101.98 Females per 100 Males in Abbeville.
What is the Median Population Age in Abbeville?
Median Population Age in Abbeville is 38.1 Years.
What is the Average Family Size in Abbeville
Average Family Size in Abbeville is 3.5 People.
What is the Average Household Size in Abbeville
Average Household Size in Abbeville is 2.4 People.
How Large is the Labor Force in Abbeville?
There are 1,975 People in the Labor Forcein in Abbeville.
What is the Percentage of People in the Labor Force in Abbeville?
54.7% of People are in the Labor Force in Abbeville.
What is the Unemployment Rate in Abbeville?
Unemployment Rate in Abbeville is 4.7%.