Bowman, SC Map & Demographics
Bowman Map
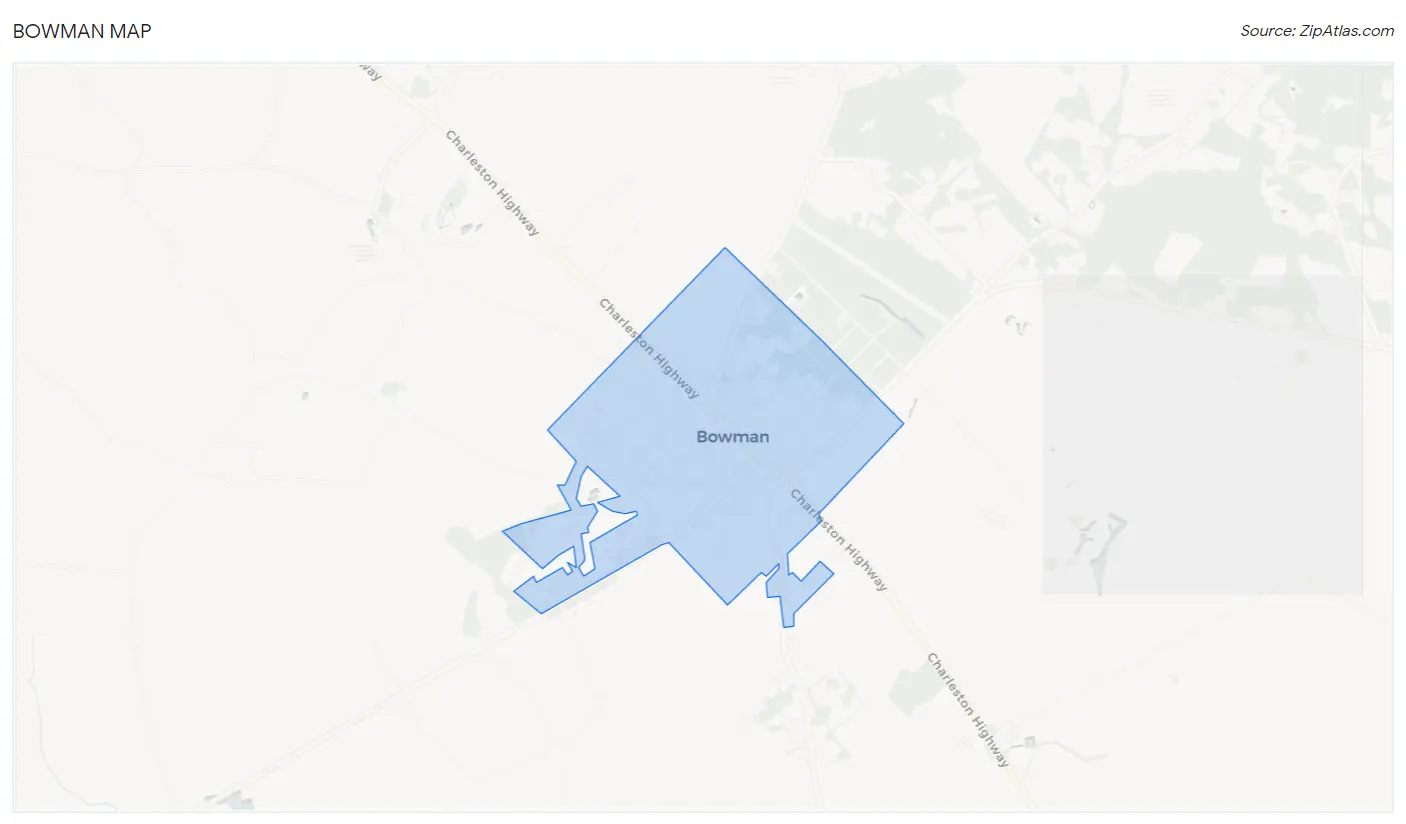
Bowman Overview
$19,643
PER CAPITA INCOME
$33,929
AVG FAMILY INCOME
$33,250
AVG HOUSEHOLD INCOME
0.6%
WAGE / INCOME GAP [ % ]
99.4¢/ $1
WAGE / INCOME GAP [ $ ]
0.45
INEQUALITY / GINI INDEX
652
TOTAL POPULATION
238
MALE POPULATION
414
FEMALE POPULATION
57.49
MALES / 100 FEMALES
173.95
FEMALES / 100 MALES
47.2
MEDIAN AGE
3.2
AVG FAMILY SIZE
2.2
AVG HOUSEHOLD SIZE
201
LABOR FORCE [ PEOPLE ]
41.3%
PERCENT IN LABOR FORCE
2.5%
UNEMPLOYMENT RATE
Bowman Zip Codes
Bowman Area Codes
Income in Bowman
Income Overview in Bowman
Per Capita Income in Bowman is $19,643, while median incomes of families and households are $33,929 and $33,250 respectively.
| Characteristic | Number | Measure |
| Per Capita Income | 652 | $19,643 |
| Median Family Income | 160 | $33,929 |
| Mean Family Income | 160 | $47,798 |
| Median Household Income | 293 | $33,250 |
| Mean Household Income | 293 | $42,045 |
| Income Deficit | 160 | $0 |
| Wage / Income Gap (%) | 652 | 0.64% |
| Wage / Income Gap ($) | 652 | 99.36¢ per $1 |
| Gini / Inequality Index | 652 | 0.45 |
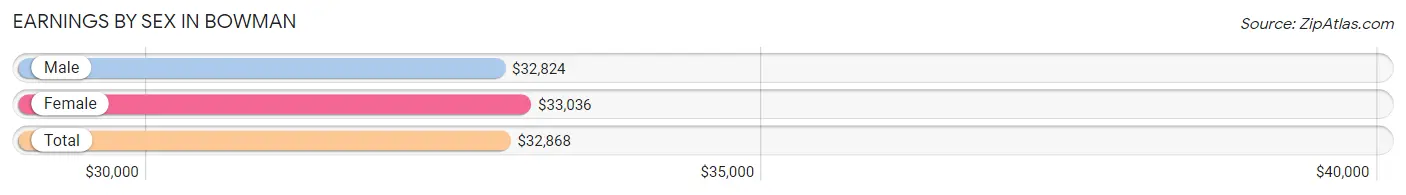
Earnings by Sex in Bowman
Average Earnings in Bowman are $32,868, $32,824 for men and $33,036 for women, a difference of 0.6%.
| Sex | Number | Average Earnings |
| Male | 81 (36.5%) | $32,824 |
| Female | 141 (63.5%) | $33,036 |
| Total | 222 (100.0%) | $32,868 |
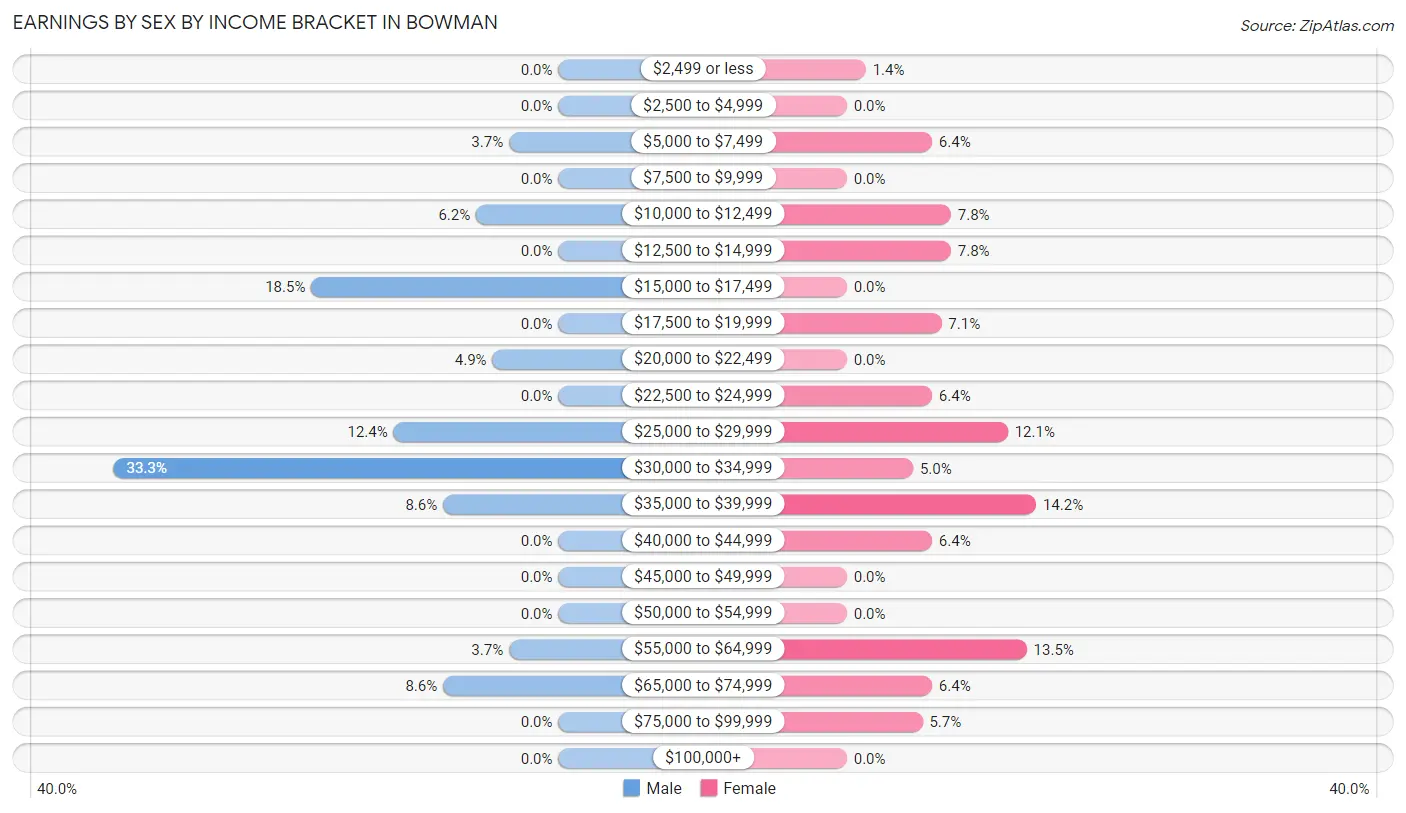
Earnings by Sex by Income Bracket in Bowman
The most common earnings brackets in Bowman are $30,000 to $34,999 for men (27 | 33.3%) and $35,000 to $39,999 for women (20 | 14.2%).
| Income | Male | Female |
| $2,499 or less | 0 (0.0%) | 2 (1.4%) |
| $2,500 to $4,999 | 0 (0.0%) | 0 (0.0%) |
| $5,000 to $7,499 | 3 (3.7%) | 9 (6.4%) |
| $7,500 to $9,999 | 0 (0.0%) | 0 (0.0%) |
| $10,000 to $12,499 | 5 (6.2%) | 11 (7.8%) |
| $12,500 to $14,999 | 0 (0.0%) | 11 (7.8%) |
| $15,000 to $17,499 | 15 (18.5%) | 0 (0.0%) |
| $17,500 to $19,999 | 0 (0.0%) | 10 (7.1%) |
| $20,000 to $22,499 | 4 (4.9%) | 0 (0.0%) |
| $22,500 to $24,999 | 0 (0.0%) | 9 (6.4%) |
| $25,000 to $29,999 | 10 (12.3%) | 17 (12.1%) |
| $30,000 to $34,999 | 27 (33.3%) | 7 (5.0%) |
| $35,000 to $39,999 | 7 (8.6%) | 20 (14.2%) |
| $40,000 to $44,999 | 0 (0.0%) | 9 (6.4%) |
| $45,000 to $49,999 | 0 (0.0%) | 0 (0.0%) |
| $50,000 to $54,999 | 0 (0.0%) | 0 (0.0%) |
| $55,000 to $64,999 | 3 (3.7%) | 19 (13.5%) |
| $65,000 to $74,999 | 7 (8.6%) | 9 (6.4%) |
| $75,000 to $99,999 | 0 (0.0%) | 8 (5.7%) |
| $100,000+ | 0 (0.0%) | 0 (0.0%) |
| Total | 81 (100.0%) | 141 (100.0%) |
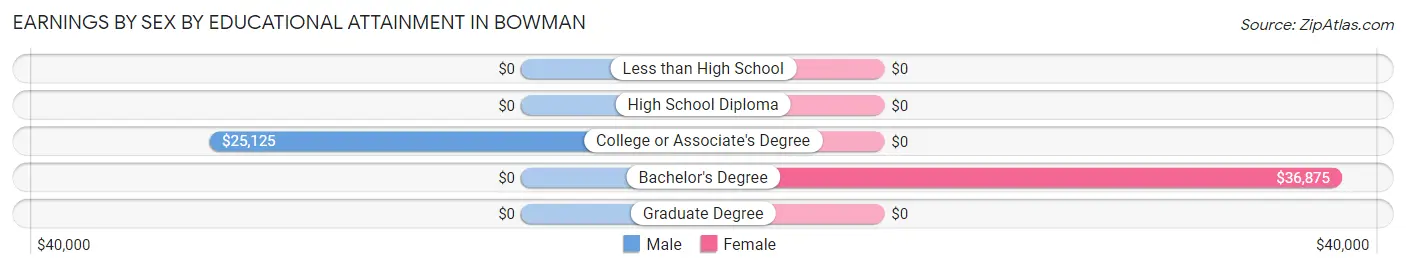
Earnings by Sex by Educational Attainment in Bowman
Average earnings in Bowman are $32,560 for men and $33,393 for women, a difference of 2.5%. Men with an educational attainment of college or associate's degree enjoy the highest average annual earnings of $25,125, while those with college or associate's degree education earn the least with $25,125. Women with an educational attainment of bachelor's degree earn the most with the average annual earnings of $36,875, while those with bachelor's degree education have the smallest earnings of $36,875.
| Educational Attainment | Male Income | Female Income |
| Less than High School | - | - |
| High School Diploma | - | - |
| College or Associate's Degree | $25,125 | $0 |
| Bachelor's Degree | - | - |
| Graduate Degree | - | - |
| Total | $32,560 | $33,393 |
Family Income in Bowman
Family Income Brackets in Bowman
According to the Bowman family income data, there are 40 families falling into the $25,000 to $34,999 income range, which is the most common income bracket and makes up 25.0% of all families.
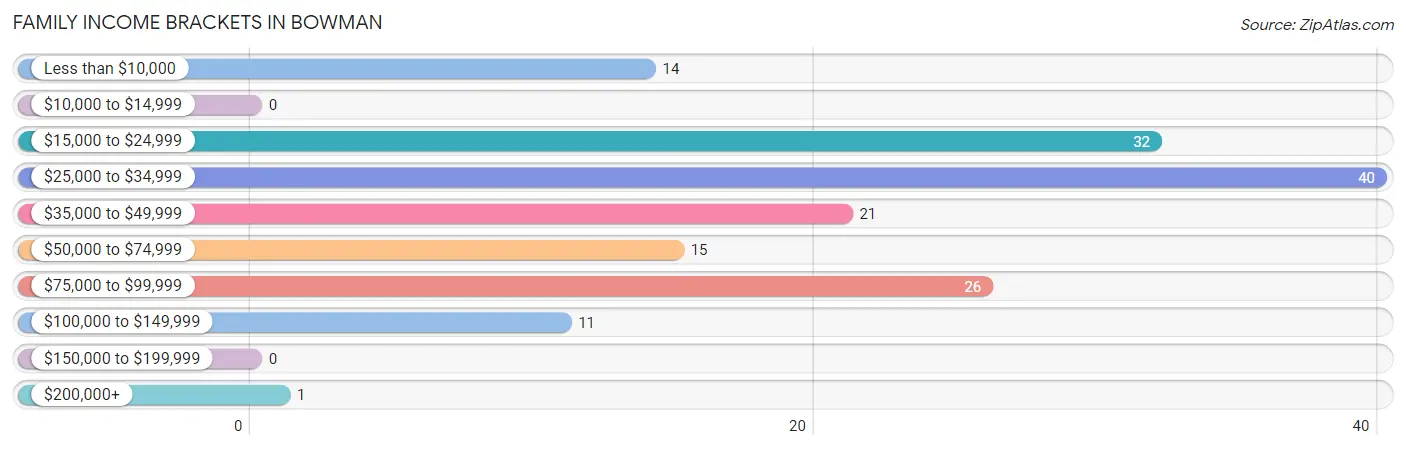
| Income Bracket | # Families | % Families |
| Less than $10,000 | 14 | 8.8% |
| $10,000 to $14,999 | 0 | 0.0% |
| $15,000 to $24,999 | 32 | 20.0% |
| $25,000 to $34,999 | 40 | 25.0% |
| $35,000 to $49,999 | 21 | 13.1% |
| $50,000 to $74,999 | 15 | 9.4% |
| $75,000 to $99,999 | 26 | 16.3% |
| $100,000 to $149,999 | 11 | 6.9% |
| $150,000 to $199,999 | 0 | 0.0% |
| $200,000+ | 1 | 0.6% |
Family Income by Famaliy Size in Bowman
2-person families (95 | 59.4%) account for the highest median family income in Bowman with $37,768 per family, while 2-person families (95 | 59.4%) have the highest median income of $18,884 per family member.
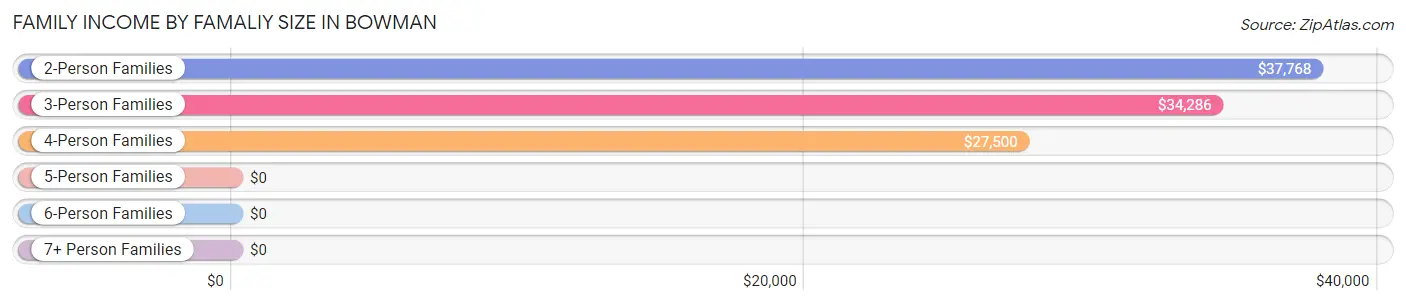
| Income Bracket | # Families | Median Income |
| 2-Person Families | 95 (59.4%) | $37,768 |
| 3-Person Families | 10 (6.2%) | $34,286 |
| 4-Person Families | 38 (23.7%) | $27,500 |
| 5-Person Families | 7 (4.4%) | $0 |
| 6-Person Families | 10 (6.2%) | $0 |
| 7+ Person Families | 0 (0.0%) | $0 |
| Total | 160 (100.0%) | $33,929 |
Family Income by Number of Earners in Bowman
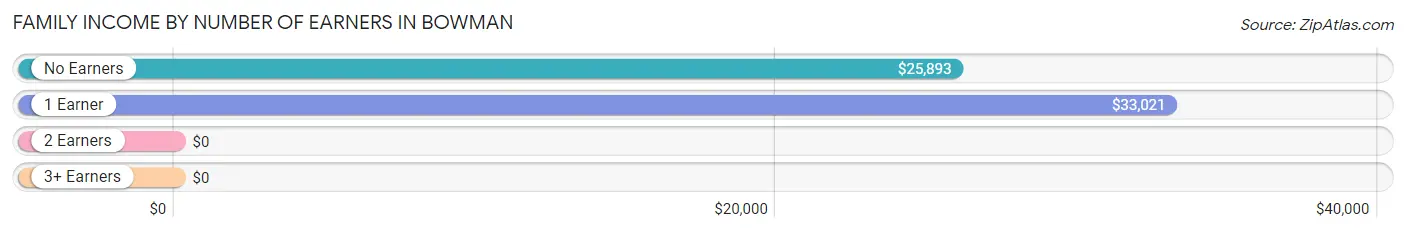
| Number of Earners | # Families | Median Income |
| No Earners | 59 (36.9%) | $25,893 |
| 1 Earner | 75 (46.9%) | $33,021 |
| 2 Earners | 14 (8.7%) | $0 |
| 3+ Earners | 12 (7.5%) | $0 |
| Total | 160 (100.0%) | $33,929 |
Household Income in Bowman
Household Income Brackets in Bowman
With 54 households falling in the category, the $15,000 to $24,999 income range is the most frequent in Bowman, accounting for 18.4% of all households.
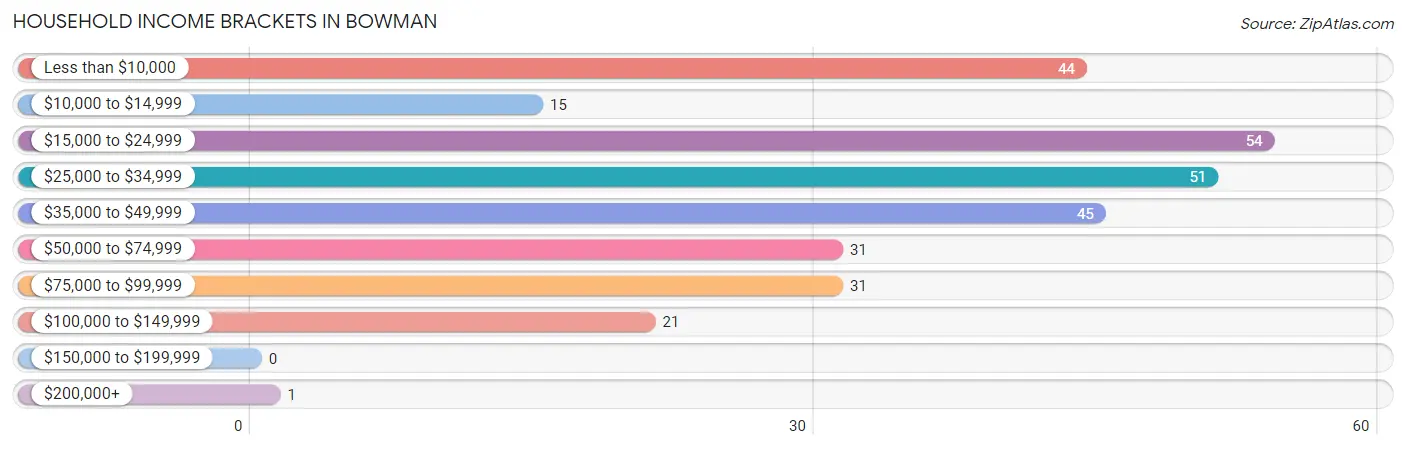
| Income Bracket | # Households | % Households |
| Less than $10,000 | 44 | 15.0% |
| $10,000 to $14,999 | 15 | 5.1% |
| $15,000 to $24,999 | 54 | 18.4% |
| $25,000 to $34,999 | 51 | 17.4% |
| $35,000 to $49,999 | 45 | 15.4% |
| $50,000 to $74,999 | 31 | 10.6% |
| $75,000 to $99,999 | 31 | 10.6% |
| $100,000 to $149,999 | 21 | 7.2% |
| $150,000 to $199,999 | 0 | 0.0% |
| $200,000+ | 1 | 0.3% |
Household Income by Householder Age in Bowman
The median household income in Bowman is $33,250, with the highest median household income of $41,944 found in the 45 to 64 years age bracket for the primary householder. A total of 132 households (45.1%) fall into this category.
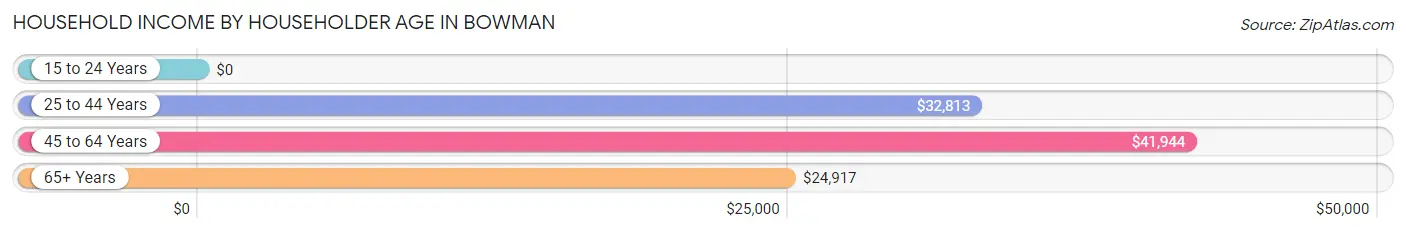
| Income Bracket | # Households | Median Income |
| 15 to 24 Years | 0 (0.0%) | $0 |
| 25 to 44 Years | 56 (19.1%) | $32,813 |
| 45 to 64 Years | 132 (45.1%) | $41,944 |
| 65+ Years | 105 (35.8%) | $24,917 |
| Total | 293 (100.0%) | $33,250 |
Poverty in Bowman
Income Below Poverty by Sex and Age in Bowman
With 35.3% poverty level for males and 35.5% for females among the residents of Bowman, under 5 year old males and under 5 year old females are the most vulnerable to poverty, with 20 males (100.0%) and 29 females (100.0%) in their respective age groups living below the poverty level.
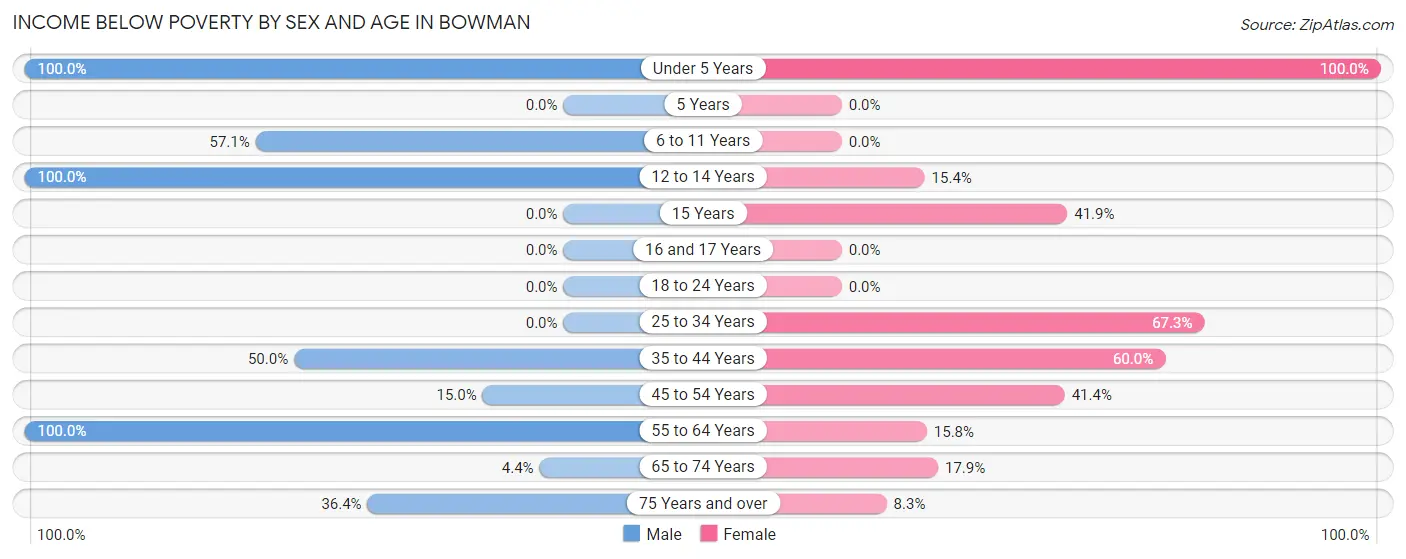
| Age Bracket | Male | Female |
| Under 5 Years | 20 (100.0%) | 29 (100.0%) |
| 5 Years | 0 (0.0%) | 0 (0.0%) |
| 6 to 11 Years | 16 (57.1%) | 0 (0.0%) |
| 12 to 14 Years | 20 (100.0%) | 2 (15.4%) |
| 15 Years | 0 (0.0%) | 18 (41.9%) |
| 16 and 17 Years | 0 (0.0%) | 0 (0.0%) |
| 18 to 24 Years | 0 (0.0%) | 0 (0.0%) |
| 25 to 34 Years | 0 (0.0%) | 37 (67.3%) |
| 35 to 44 Years | 9 (50.0%) | 9 (60.0%) |
| 45 to 54 Years | 3 (15.0%) | 24 (41.4%) |
| 55 to 64 Years | 6 (100.0%) | 15 (15.8%) |
| 65 to 74 Years | 2 (4.4%) | 10 (17.9%) |
| 75 Years and over | 8 (36.4%) | 3 (8.3%) |
| Total | 84 (35.3%) | 147 (35.5%) |
Income Above Poverty by Sex and Age in Bowman
According to the poverty statistics in Bowman, males aged 18 to 24 years and females aged 6 to 11 years are the age groups that are most secure financially, with 100.0% of males and 100.0% of females in these age groups living above the poverty line.
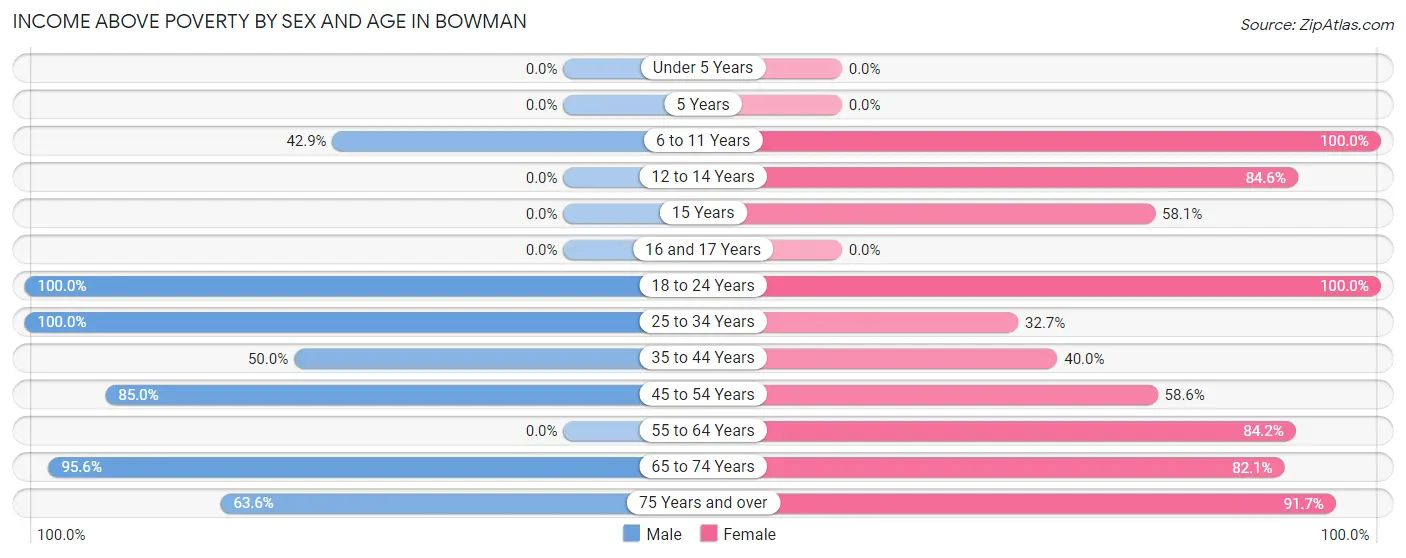
| Age Bracket | Male | Female |
| Under 5 Years | 0 (0.0%) | 0 (0.0%) |
| 5 Years | 0 (0.0%) | 0 (0.0%) |
| 6 to 11 Years | 12 (42.9%) | 12 (100.0%) |
| 12 to 14 Years | 0 (0.0%) | 11 (84.6%) |
| 15 Years | 0 (0.0%) | 25 (58.1%) |
| 16 and 17 Years | 0 (0.0%) | 0 (0.0%) |
| 18 to 24 Years | 6 (100.0%) | 2 (100.0%) |
| 25 to 34 Years | 53 (100.0%) | 18 (32.7%) |
| 35 to 44 Years | 9 (50.0%) | 6 (40.0%) |
| 45 to 54 Years | 17 (85.0%) | 34 (58.6%) |
| 55 to 64 Years | 0 (0.0%) | 80 (84.2%) |
| 65 to 74 Years | 43 (95.6%) | 46 (82.1%) |
| 75 Years and over | 14 (63.6%) | 33 (91.7%) |
| Total | 154 (64.7%) | 267 (64.5%) |
Income Below Poverty Among Married-Couple Families in Bowman
The poverty statistics for married-couple families in Bowman show that 11.8% or 9 of the total 76 families live below the poverty line. Families with 1 or 2 children have the highest poverty rate of 29.0%, comprising of 9 families. On the other hand, families with no children have the lowest poverty rate of 0.0%, which includes 0 families.
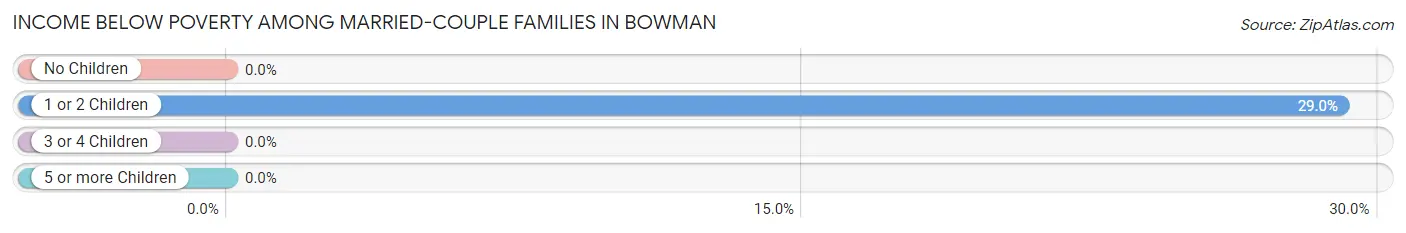
| Children | Above Poverty | Below Poverty |
| No Children | 45 (100.0%) | 0 (0.0%) |
| 1 or 2 Children | 22 (71.0%) | 9 (29.0%) |
| 3 or 4 Children | 0 (0.0%) | 0 (0.0%) |
| 5 or more Children | 0 (0.0%) | 0 (0.0%) |
| Total | 67 (88.2%) | 9 (11.8%) |
Income Below Poverty Among Single-Parent Households in Bowman
According to the poverty data in Bowman, 12.0% or 3 single-father households and 59.3% or 35 single-mother households are living below the poverty line. Among single-father households, those with 1 or 2 children have the highest poverty rate, with 3 households (100.0%) experiencing poverty. Likewise, among single-mother households, those with 3 or 4 children have the highest poverty rate, with 14 households (100.0%) falling below the poverty line.
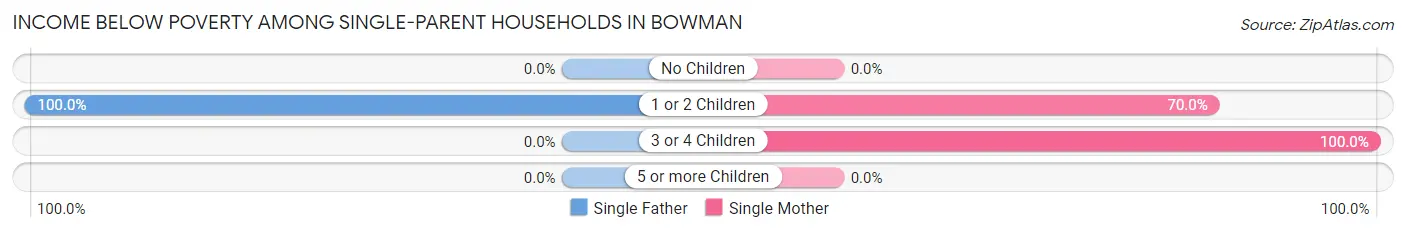
| Children | Single Father | Single Mother |
| No Children | 0 (0.0%) | 0 (0.0%) |
| 1 or 2 Children | 3 (100.0%) | 21 (70.0%) |
| 3 or 4 Children | 0 (0.0%) | 14 (100.0%) |
| 5 or more Children | 0 (0.0%) | 0 (0.0%) |
| Total | 3 (12.0%) | 35 (59.3%) |
Income Below Poverty Among Married-Couple vs Single-Parent Households in Bowman
The poverty data for Bowman shows that 9 of the married-couple family households (11.8%) and 38 of the single-parent households (45.2%) are living below the poverty level. Within the married-couple family households, those with 1 or 2 children have the highest poverty rate, with 9 households (29.0%) falling below the poverty line. Among the single-parent households, those with 3 or 4 children have the highest poverty rate, with 14 household (100.0%) living below poverty.
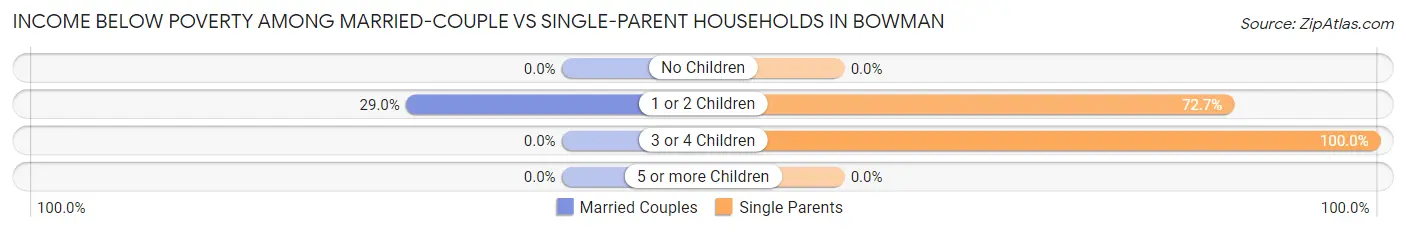
| Children | Married-Couple Families | Single-Parent Households |
| No Children | 0 (0.0%) | 0 (0.0%) |
| 1 or 2 Children | 9 (29.0%) | 24 (72.7%) |
| 3 or 4 Children | 0 (0.0%) | 14 (100.0%) |
| 5 or more Children | 0 (0.0%) | 0 (0.0%) |
| Total | 9 (11.8%) | 38 (45.2%) |
Race in Bowman
The most populous races in Bowman are Black / African American (511 | 78.4%), White / Caucasian (134 | 20.5%), and Two or more Races (7 | 1.1%).
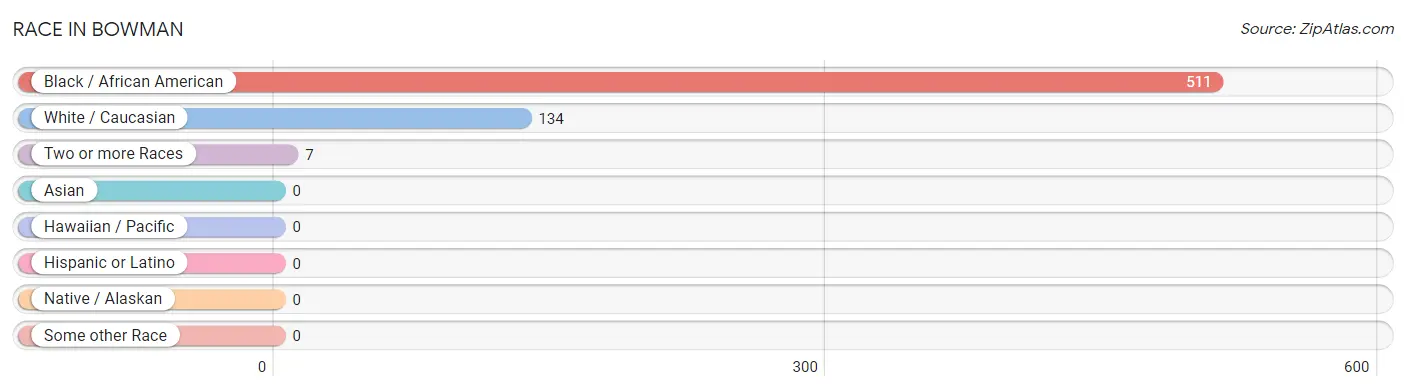
| Race | # Population | % Population |
| Asian | 0 | 0.0% |
| Black / African American | 511 | 78.4% |
| Hawaiian / Pacific | 0 | 0.0% |
| Hispanic or Latino | 0 | 0.0% |
| Native / Alaskan | 0 | 0.0% |
| White / Caucasian | 134 | 20.5% |
| Two or more Races | 7 | 1.1% |
| Some other Race | 0 | 0.0% |
| Total | 652 | 100.0% |
Ancestry in Bowman
The most populous ancestries reported in Bowman are English (17 | 2.6%), American (12 | 1.8%), German (8 | 1.2%), Blackfeet (7 | 1.1%), and European (5 | 0.8%), together accounting for 7.5% of all Bowman residents.
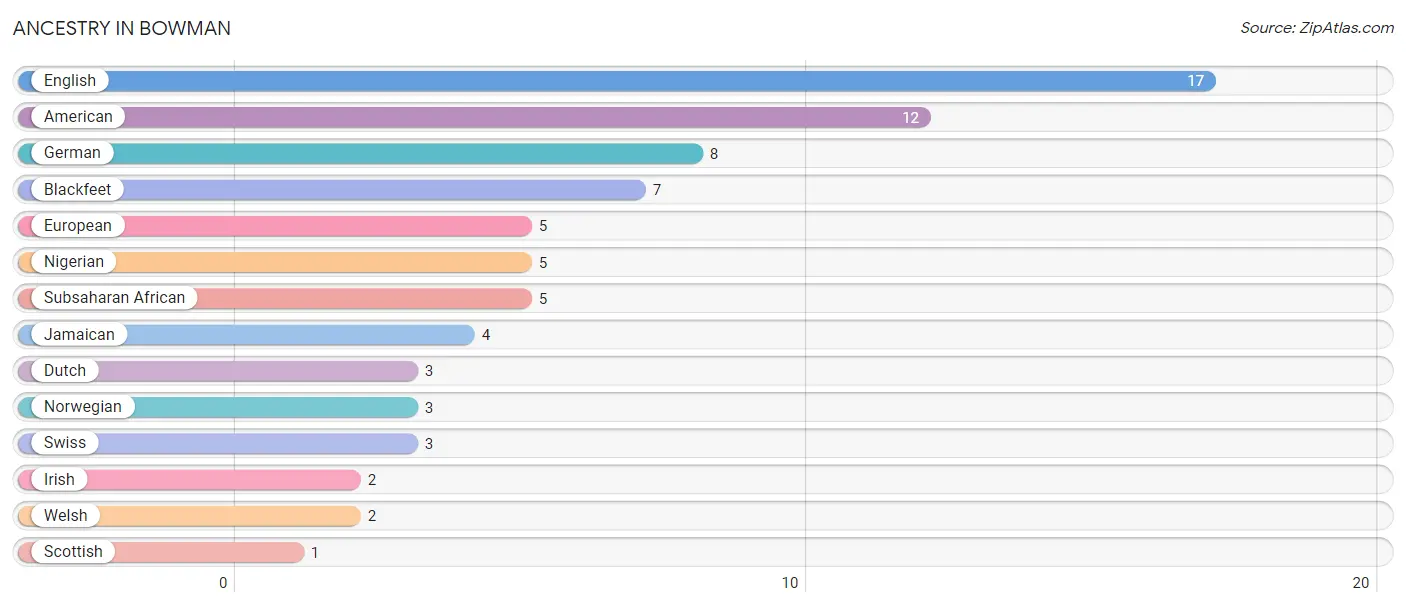
| Ancestry | # Population | % Population |
| American | 12 | 1.8% |
| Blackfeet | 7 | 1.1% |
| Dutch | 3 | 0.5% |
| English | 17 | 2.6% |
| European | 5 | 0.8% |
| German | 8 | 1.2% |
| Irish | 2 | 0.3% |
| Jamaican | 4 | 0.6% |
| Nigerian | 5 | 0.8% |
| Norwegian | 3 | 0.5% |
| Scottish | 1 | 0.2% |
| Subsaharan African | 5 | 0.8% |
| Swiss | 3 | 0.5% |
| Welsh | 2 | 0.3% | View All 14 Rows |
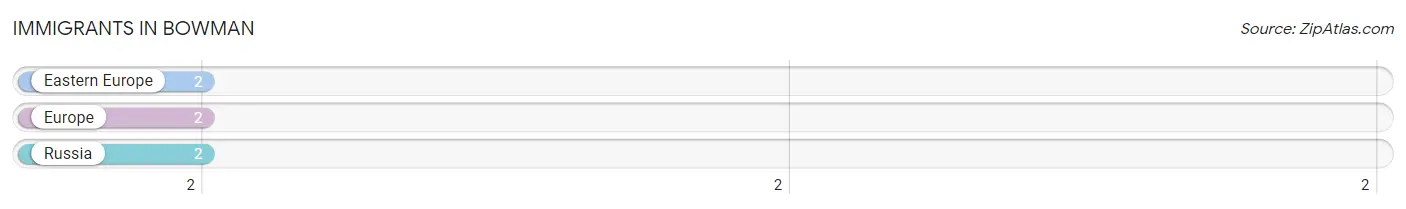
Immigrants in Bowman
The most numerous immigrant groups reported in Bowman came from Eastern Europe (2 | 0.3%), Europe (2 | 0.3%), and Russia (2 | 0.3%), together accounting for 0.9% of all Bowman residents.
| Immigration Origin | # Population | % Population |
| Eastern Europe | 2 | 0.3% |
| Europe | 2 | 0.3% |
| Russia | 2 | 0.3% | View All 3 Rows |
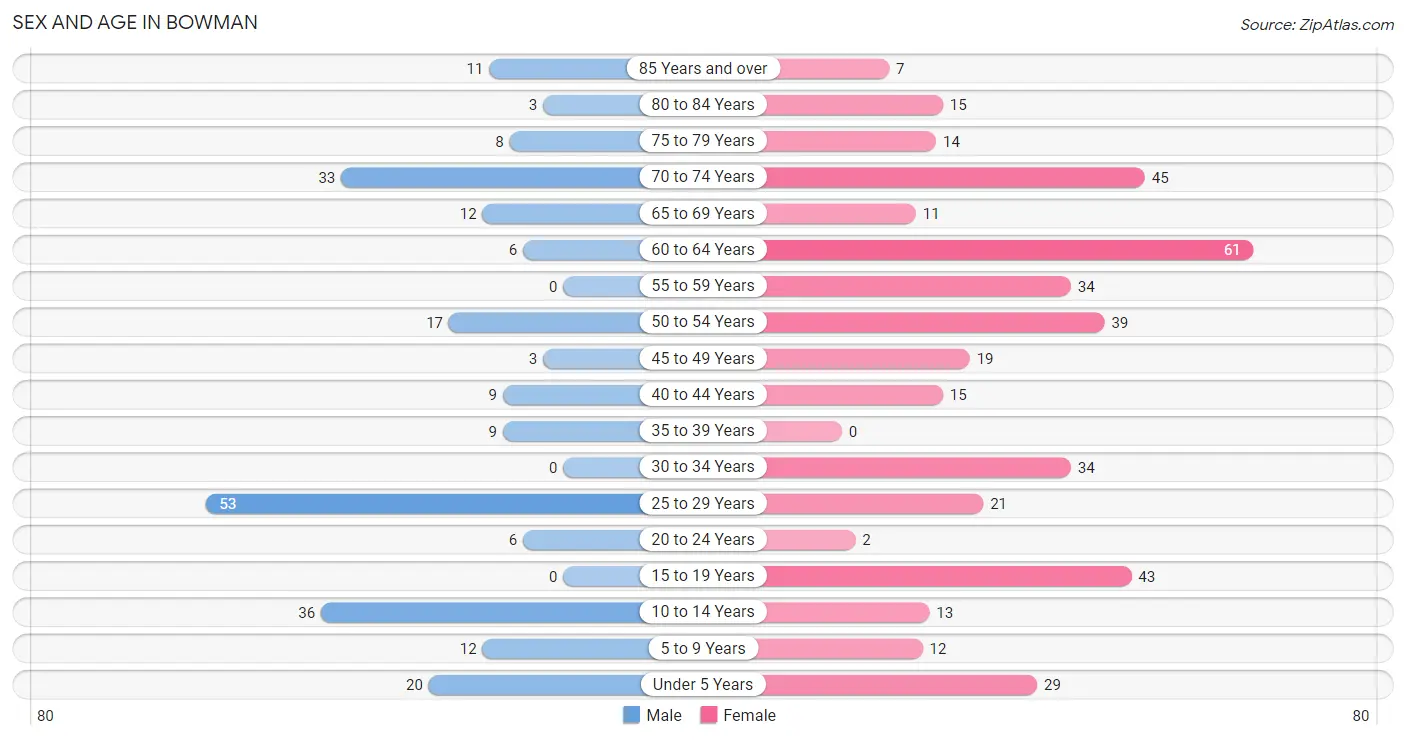
Sex and Age in Bowman
Sex and Age in Bowman
The most populous age groups in Bowman are 25 to 29 Years (53 | 22.3%) for men and 60 to 64 Years (61 | 14.7%) for women.
| Age Bracket | Male | Female |
| Under 5 Years | 20 (8.4%) | 29 (7.0%) |
| 5 to 9 Years | 12 (5.0%) | 12 (2.9%) |
| 10 to 14 Years | 36 (15.1%) | 13 (3.1%) |
| 15 to 19 Years | 0 (0.0%) | 43 (10.4%) |
| 20 to 24 Years | 6 (2.5%) | 2 (0.5%) |
| 25 to 29 Years | 53 (22.3%) | 21 (5.1%) |
| 30 to 34 Years | 0 (0.0%) | 34 (8.2%) |
| 35 to 39 Years | 9 (3.8%) | 0 (0.0%) |
| 40 to 44 Years | 9 (3.8%) | 15 (3.6%) |
| 45 to 49 Years | 3 (1.3%) | 19 (4.6%) |
| 50 to 54 Years | 17 (7.1%) | 39 (9.4%) |
| 55 to 59 Years | 0 (0.0%) | 34 (8.2%) |
| 60 to 64 Years | 6 (2.5%) | 61 (14.7%) |
| 65 to 69 Years | 12 (5.0%) | 11 (2.7%) |
| 70 to 74 Years | 33 (13.9%) | 45 (10.9%) |
| 75 to 79 Years | 8 (3.4%) | 14 (3.4%) |
| 80 to 84 Years | 3 (1.3%) | 15 (3.6%) |
| 85 Years and over | 11 (4.6%) | 7 (1.7%) |
| Total | 238 (100.0%) | 414 (100.0%) |
Families and Households in Bowman
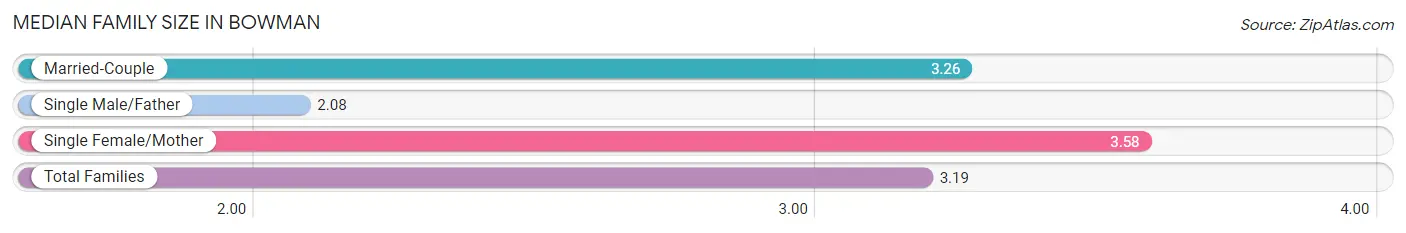
Median Family Size in Bowman
The median family size in Bowman is 3.19 persons per family, with single female/mother families (59 | 36.9%) accounting for the largest median family size of 3.58 persons per family. On the other hand, single male/father families (25 | 15.6%) represent the smallest median family size with 2.08 persons per family.
| Family Type | # Families | Family Size |
| Married-Couple | 76 (47.5%) | 3.26 |
| Single Male/Father | 25 (15.6%) | 2.08 |
| Single Female/Mother | 59 (36.9%) | 3.58 |
| Total Families | 160 (100.0%) | 3.19 |
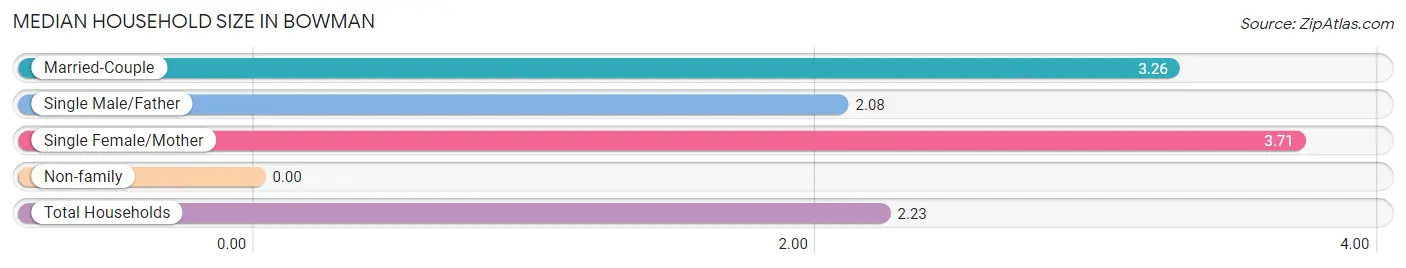
Median Household Size in Bowman
| Household Type | # Households | Household Size |
| Married-Couple | 76 (25.9%) | 3.26 |
| Single Male/Father | 25 (8.5%) | 2.08 |
| Single Female/Mother | 59 (20.1%) | 3.71 |
| Non-family | 133 (45.4%) | - |
| Total Households | 293 (100.0%) | 2.23 |
Household Size by Marriage Status in Bowman
Out of a total of 293 households in Bowman, 160 (54.6%) are family households, while 133 (45.4%) are nonfamily households. The most numerous type of family households are 2-person households, comprising 84, and the most common type of nonfamily households are 1-person households, comprising 133.
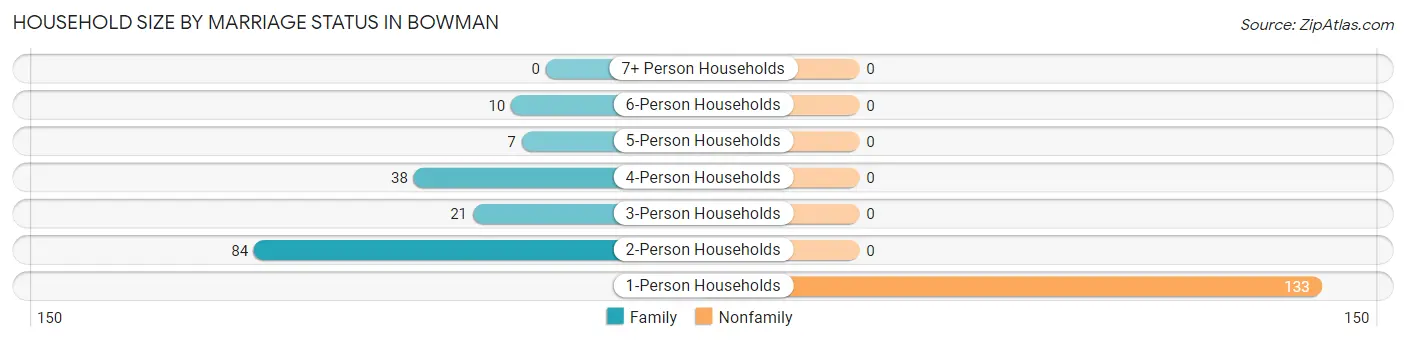
| Household Size | Family Households | Nonfamily Households |
| 1-Person Households | - | 133 (45.4%) |
| 2-Person Households | 84 (28.7%) | 0 (0.0%) |
| 3-Person Households | 21 (7.2%) | 0 (0.0%) |
| 4-Person Households | 38 (13.0%) | 0 (0.0%) |
| 5-Person Households | 7 (2.4%) | 0 (0.0%) |
| 6-Person Households | 10 (3.4%) | 0 (0.0%) |
| 7+ Person Households | 0 (0.0%) | 0 (0.0%) |
| Total | 160 (54.6%) | 133 (45.4%) |
Female Fertility in Bowman
Fertility by Age in Bowman
Average fertility rate in Bowman is 76.0 births per 1,000 women. Women in the age bracket of 20 to 34 years have the highest fertility rate with 193.0 births per 1,000 women. Women in the age bracket of 20 to 34 years acount for 100.0% of all women with births.
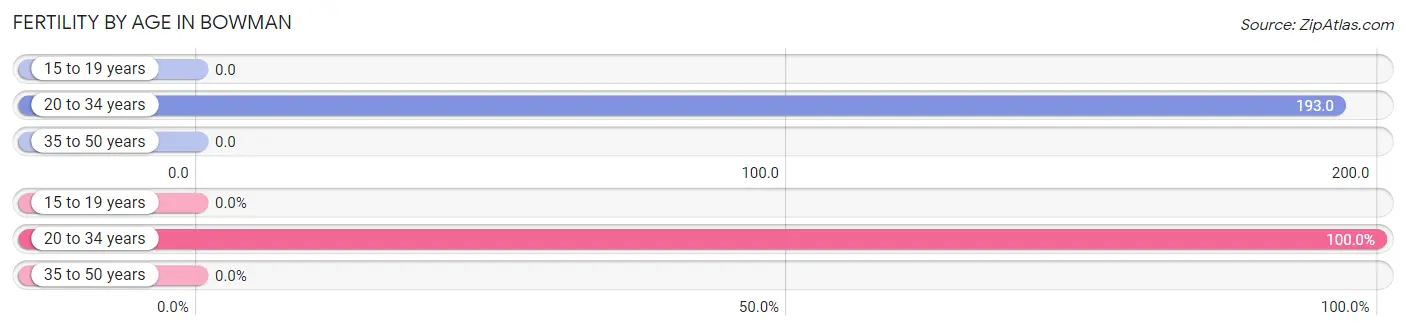
| Age Bracket | Women with Births | Births / 1,000 Women |
| 15 to 19 years | 0 (0.0%) | 0.0 |
| 20 to 34 years | 11 (100.0%) | 193.0 |
| 35 to 50 years | 0 (0.0%) | 0.0 |
| Total | 11 (100.0%) | 76.0 |
Fertility by Age by Marriage Status in Bowman
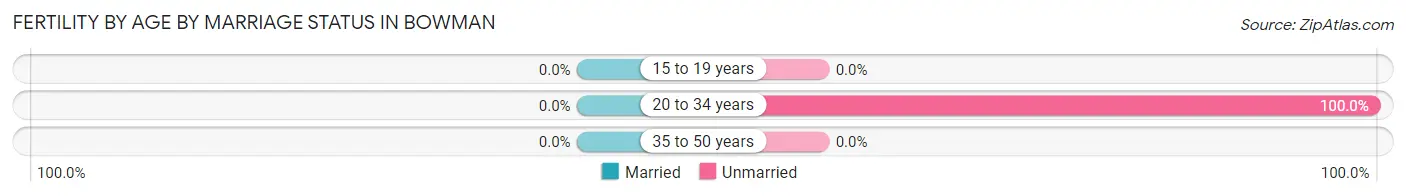
| Age Bracket | Married | Unmarried |
| 15 to 19 years | 0 (0.0%) | 0 (0.0%) |
| 20 to 34 years | 0 (0.0%) | 11 (100.0%) |
| 35 to 50 years | 0 (0.0%) | 0 (0.0%) |
| Total | 0 (0.0%) | 11 (100.0%) |
Fertility by Education in Bowman
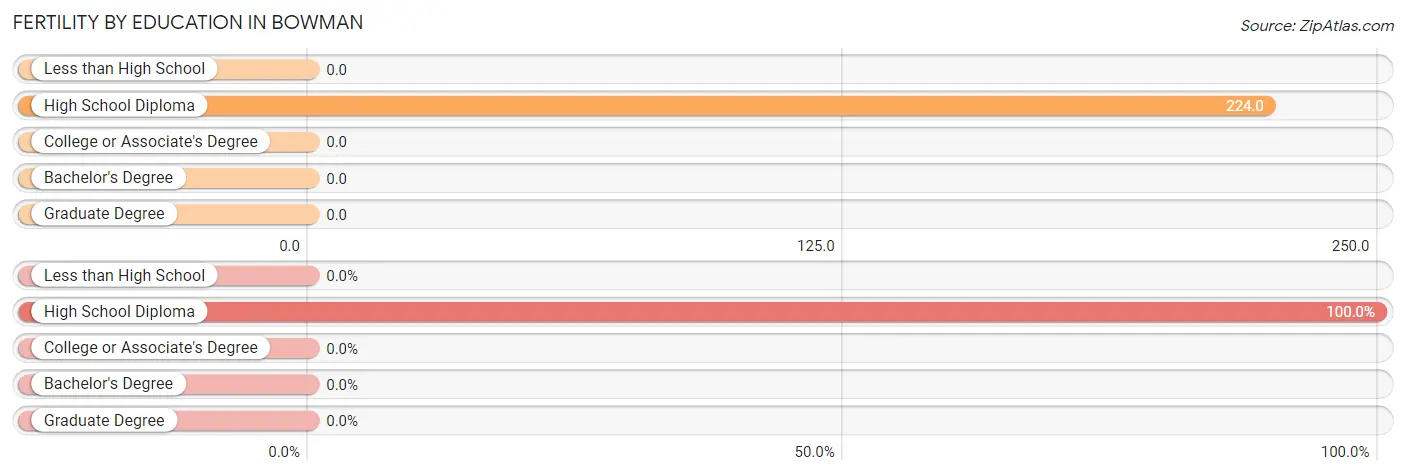
| Educational Attainment | Women with Births | Births / 1,000 Women |
| Less than High School | 0 (0.0%) | 0.0 |
| High School Diploma | 11 (100.0%) | 224.0 |
| College or Associate's Degree | 0 (0.0%) | 0.0 |
| Bachelor's Degree | 0 (0.0%) | 0.0 |
| Graduate Degree | 0 (0.0%) | 0.0 |
| Total | 11 (100.0%) | 76.0 |
Fertility by Education by Marriage Status in Bowman
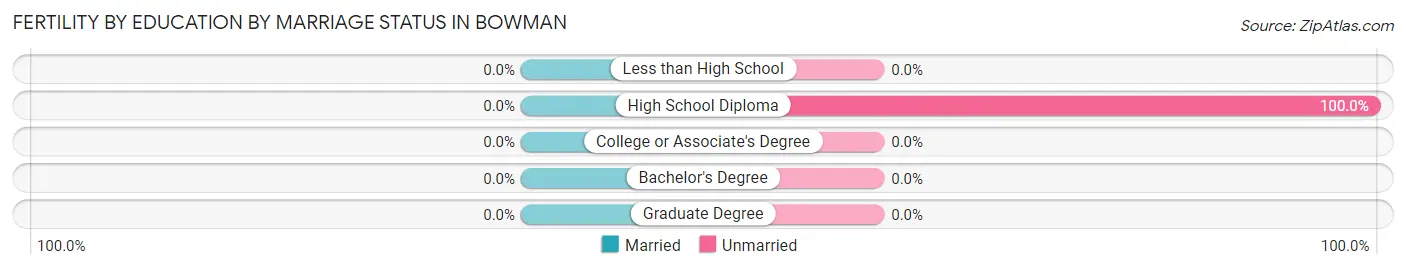
| Educational Attainment | Married | Unmarried |
| Less than High School | 0 (0.0%) | 0 (0.0%) |
| High School Diploma | 0 (0.0%) | 11 (100.0%) |
| College or Associate's Degree | 0 (0.0%) | 0 (0.0%) |
| Bachelor's Degree | 0 (0.0%) | 0 (0.0%) |
| Graduate Degree | 0 (0.0%) | 0 (0.0%) |
| Total | 0 (0.0%) | 11 (100.0%) |
Employment Characteristics in Bowman
Employment by Class of Employer in Bowman
Among the 193 employed individuals in Bowman, private company employees (117 | 60.6%), state government employees (36 | 18.6%), and self-employed (not incorporated) (13 | 6.7%) make up the most common classes of employment.
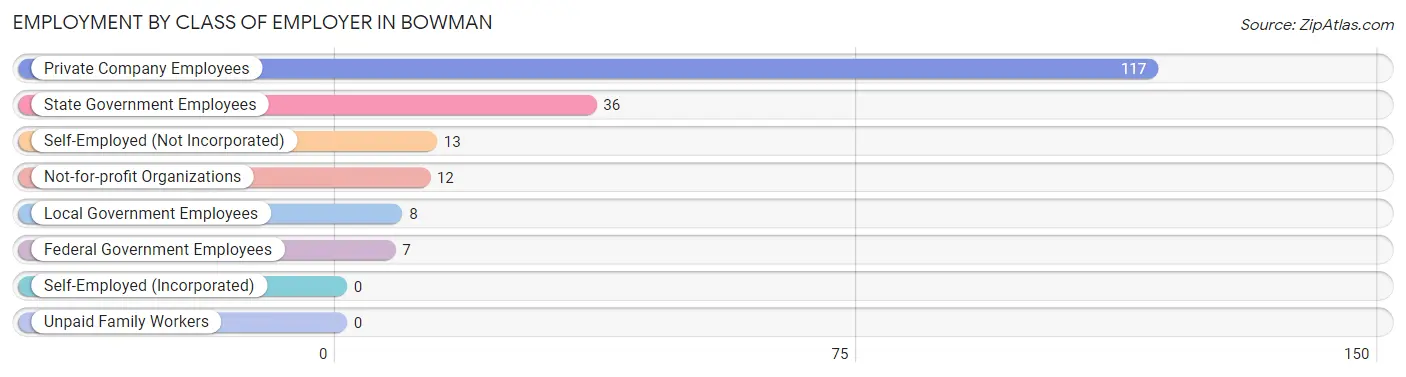
| Employer Class | # Employees | % Employees |
| Private Company Employees | 117 | 60.6% |
| Self-Employed (Incorporated) | 0 | 0.0% |
| Self-Employed (Not Incorporated) | 13 | 6.7% |
| Not-for-profit Organizations | 12 | 6.2% |
| Local Government Employees | 8 | 4.2% |
| State Government Employees | 36 | 18.6% |
| Federal Government Employees | 7 | 3.6% |
| Unpaid Family Workers | 0 | 0.0% |
| Total | 193 | 100.0% |
Employment Status by Age in Bowman
According to the labor force statistics for Bowman, out of the total population over 16 years of age (487), 41.3% or 201 individuals are in the labor force, with 2.5% or 5 of them unemployed. The age group with the highest labor force participation rate is 30 to 34 years, with 100.0% or 34 individuals in the labor force. Within the labor force, the 35 to 44 years age range has the highest percentage of unemployed individuals, with 27.8% or 5 of them being unemployed.
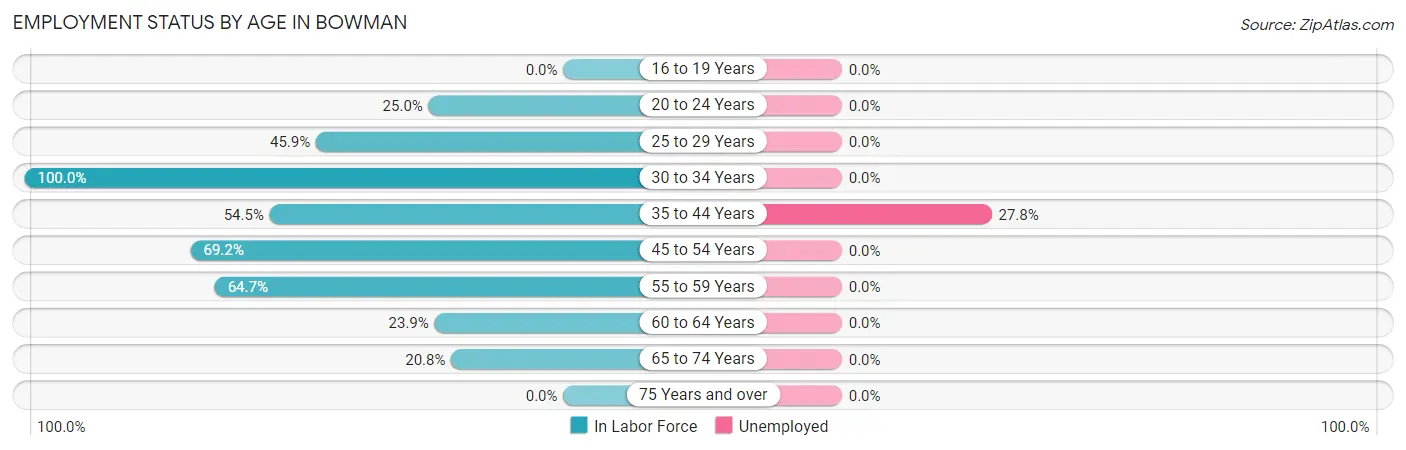
| Age Bracket | In Labor Force | Unemployed |
| 16 to 19 Years | 0 (0.0%) | 0 (0.0%) |
| 20 to 24 Years | 2 (25.0%) | 0 (0.0%) |
| 25 to 29 Years | 34 (45.9%) | 0 (0.0%) |
| 30 to 34 Years | 34 (100.0%) | 0 (0.0%) |
| 35 to 44 Years | 18 (54.5%) | 5 (27.8%) |
| 45 to 54 Years | 54 (69.2%) | 0 (0.0%) |
| 55 to 59 Years | 22 (64.7%) | 0 (0.0%) |
| 60 to 64 Years | 16 (23.9%) | 0 (0.0%) |
| 65 to 74 Years | 21 (20.8%) | 0 (0.0%) |
| 75 Years and over | 0 (0.0%) | 0 (0.0%) |
| Total | 201 (41.3%) | 5 (2.5%) |
Employment Status by Educational Attainment in Bowman
According to labor force statistics for Bowman, 55.6% of individuals (178) out of the total population between 25 and 64 years of age (320) are in the labor force, with 2.8% or 5 of them being unemployed. The group with the highest labor force participation rate are those with the educational attainment of less than high school, with 100.0% or 17 individuals in the labor force. Within the labor force, individuals with high school diploma education have the highest percentage of unemployment, with 6.5% or 5 of them being unemployed.
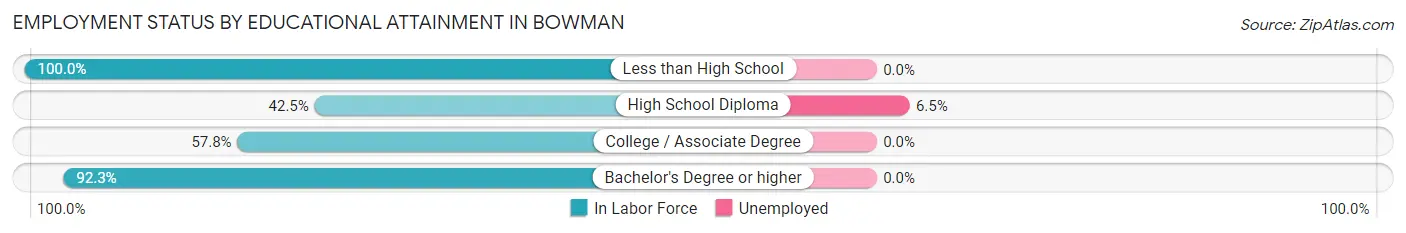
| Educational Attainment | In Labor Force | Unemployed |
| Less than High School | 17 (100.0%) | 0 (0.0%) |
| High School Diploma | 77 (42.5%) | 12 (6.5%) |
| College / Associate Degree | 48 (57.8%) | 0 (0.0%) |
| Bachelor's Degree or higher | 36 (92.3%) | 0 (0.0%) |
| Total | 178 (55.6%) | 9 (2.8%) |
Employment Occupations by Sex in Bowman
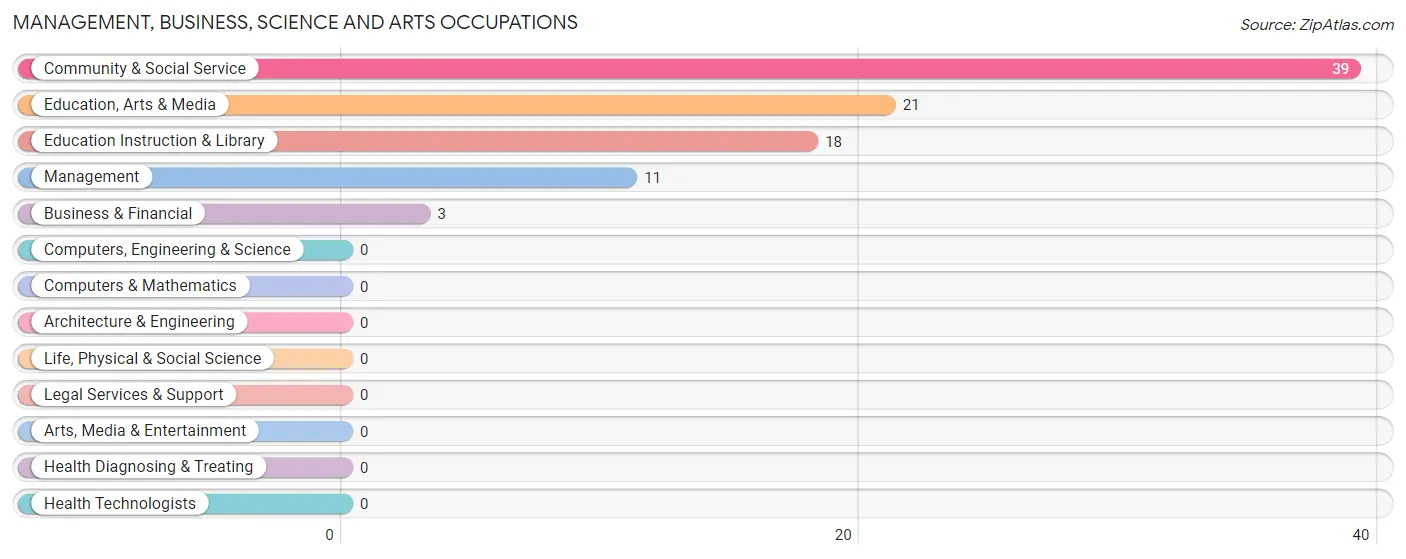
Management, Business, Science and Arts Occupations
The most common Management, Business, Science and Arts occupations in Bowman are Community & Social Service (39 | 19.9%), Education, Arts & Media (21 | 10.7%), Education Instruction & Library (18 | 9.2%), Management (11 | 5.6%), and Business & Financial (3 | 1.5%).
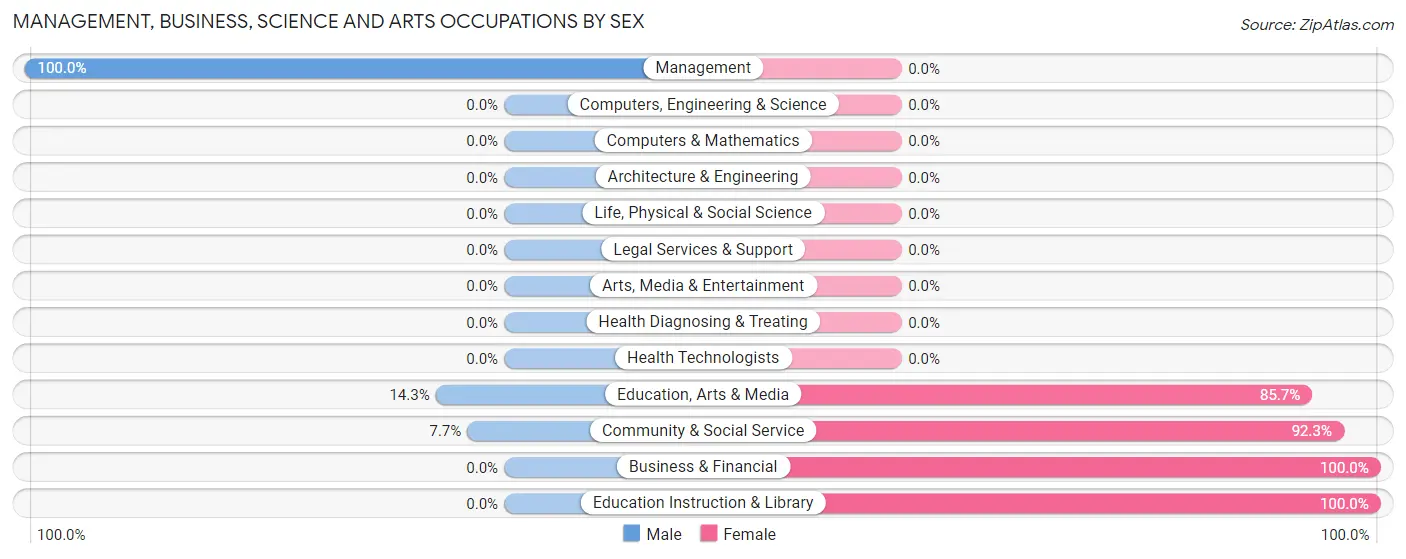
Management, Business, Science and Arts Occupations by Sex
Within the Management, Business, Science and Arts occupations in Bowman, the most male-oriented occupations are Management (100.0%), Education, Arts & Media (14.3%), and Community & Social Service (7.7%), while the most female-oriented occupations are Business & Financial (100.0%), Education Instruction & Library (100.0%), and Community & Social Service (92.3%).
| Occupation | Male | Female |
| Management | 11 (100.0%) | 0 (0.0%) |
| Business & Financial | 0 (0.0%) | 3 (100.0%) |
| Computers, Engineering & Science | 0 (0.0%) | 0 (0.0%) |
| Computers & Mathematics | 0 (0.0%) | 0 (0.0%) |
| Architecture & Engineering | 0 (0.0%) | 0 (0.0%) |
| Life, Physical & Social Science | 0 (0.0%) | 0 (0.0%) |
| Community & Social Service | 3 (7.7%) | 36 (92.3%) |
| Education, Arts & Media | 3 (14.3%) | 18 (85.7%) |
| Legal Services & Support | 0 (0.0%) | 0 (0.0%) |
| Education Instruction & Library | 0 (0.0%) | 18 (100.0%) |
| Arts, Media & Entertainment | 0 (0.0%) | 0 (0.0%) |
| Health Diagnosing & Treating | 0 (0.0%) | 0 (0.0%) |
| Health Technologists | 0 (0.0%) | 0 (0.0%) |
| Total (Category) | 14 (26.4%) | 39 (73.6%) |
| Total (Overall) | 70 (35.7%) | 126 (64.3%) |
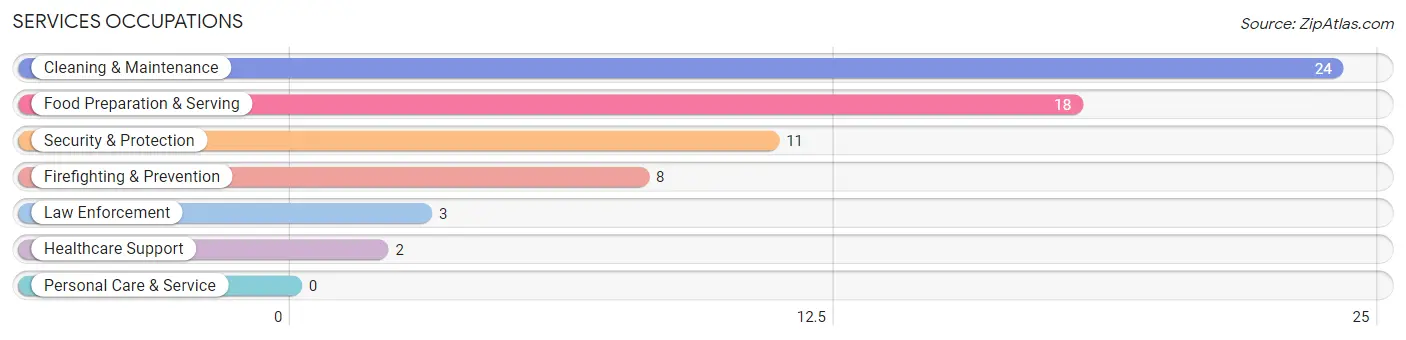
Services Occupations
The most common Services occupations in Bowman are Cleaning & Maintenance (24 | 12.2%), Food Preparation & Serving (18 | 9.2%), Security & Protection (11 | 5.6%), Firefighting & Prevention (8 | 4.1%), and Law Enforcement (3 | 1.5%).
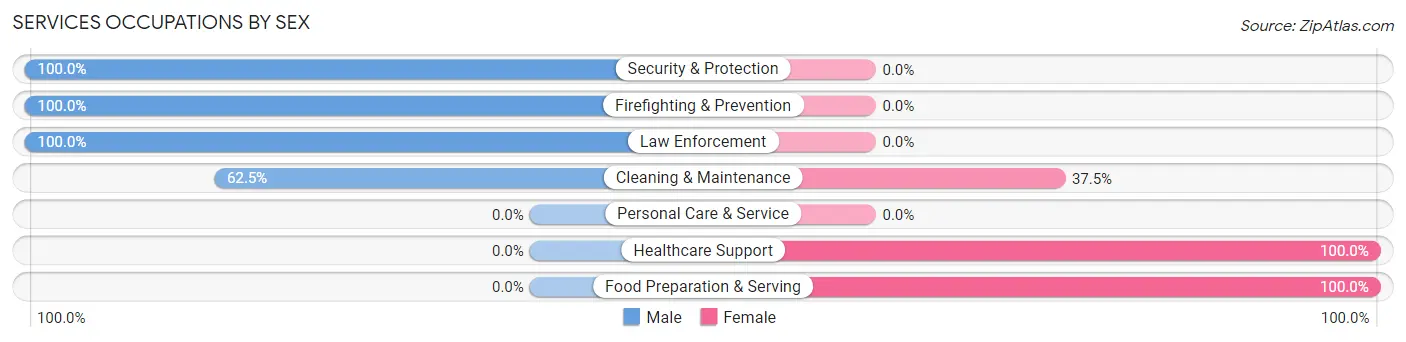
Services Occupations by Sex
Within the Services occupations in Bowman, the most male-oriented occupations are Security & Protection (100.0%), Firefighting & Prevention (100.0%), and Law Enforcement (100.0%), while the most female-oriented occupations are Healthcare Support (100.0%), Food Preparation & Serving (100.0%), and Cleaning & Maintenance (37.5%).
| Occupation | Male | Female |
| Healthcare Support | 0 (0.0%) | 2 (100.0%) |
| Security & Protection | 11 (100.0%) | 0 (0.0%) |
| Firefighting & Prevention | 8 (100.0%) | 0 (0.0%) |
| Law Enforcement | 3 (100.0%) | 0 (0.0%) |
| Food Preparation & Serving | 0 (0.0%) | 18 (100.0%) |
| Cleaning & Maintenance | 15 (62.5%) | 9 (37.5%) |
| Personal Care & Service | 0 (0.0%) | 0 (0.0%) |
| Total (Category) | 26 (47.3%) | 29 (52.7%) |
| Total (Overall) | 70 (35.7%) | 126 (64.3%) |
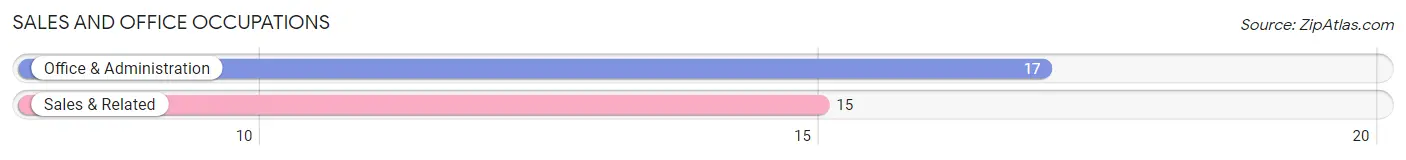
Sales and Office Occupations
The most common Sales and Office occupations in Bowman are Office & Administration (17 | 8.7%), and Sales & Related (15 | 7.6%).
Sales and Office Occupations by Sex
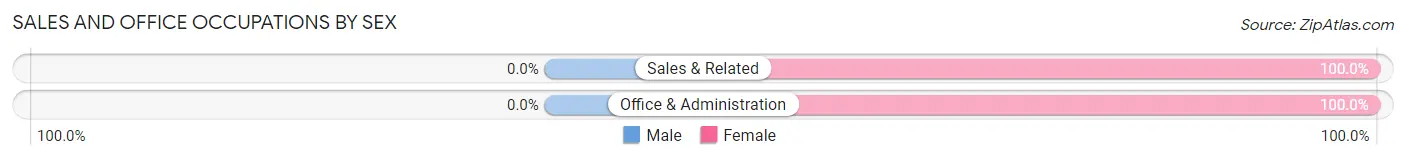
| Occupation | Male | Female |
| Sales & Related | 0 (0.0%) | 15 (100.0%) |
| Office & Administration | 0 (0.0%) | 17 (100.0%) |
| Total (Category) | 0 (0.0%) | 32 (100.0%) |
| Total (Overall) | 70 (35.7%) | 126 (64.3%) |
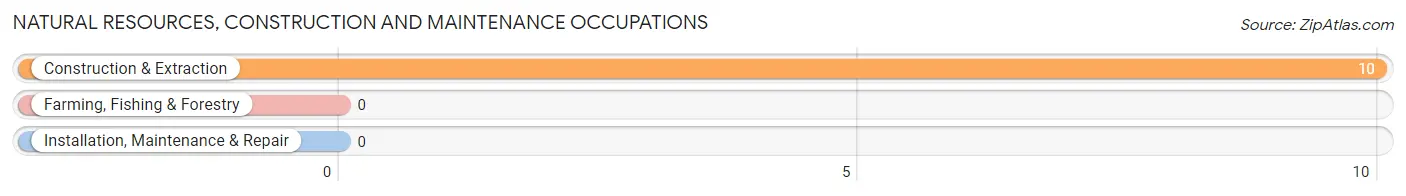
Natural Resources, Construction and Maintenance Occupations
The most common Natural Resources, Construction and Maintenance occupations in Bowman are , and Construction & Extraction (10 | 5.1%).
Natural Resources, Construction and Maintenance Occupations by Sex
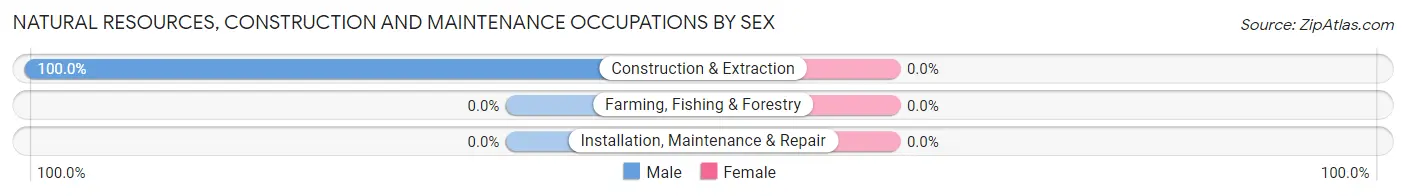
| Occupation | Male | Female |
| Farming, Fishing & Forestry | 0 (0.0%) | 0 (0.0%) |
| Construction & Extraction | 10 (100.0%) | 0 (0.0%) |
| Installation, Maintenance & Repair | 0 (0.0%) | 0 (0.0%) |
| Total (Category) | 10 (100.0%) | 0 (0.0%) |
| Total (Overall) | 70 (35.7%) | 126 (64.3%) |
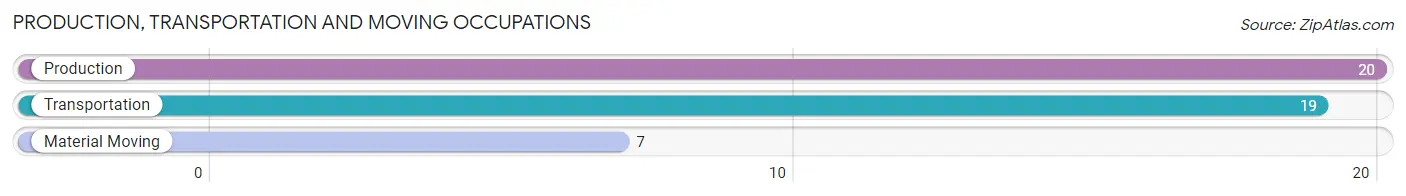
Production, Transportation and Moving Occupations
The most common Production, Transportation and Moving occupations in Bowman are Production (20 | 10.2%), Transportation (19 | 9.7%), and Material Moving (7 | 3.6%).
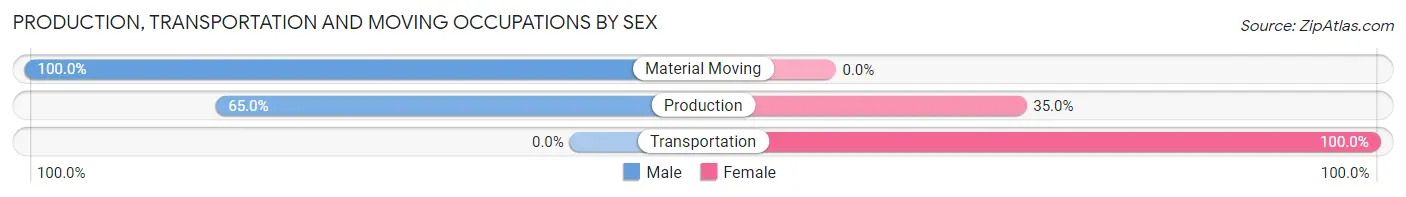
Production, Transportation and Moving Occupations by Sex
| Occupation | Male | Female |
| Production | 13 (65.0%) | 7 (35.0%) |
| Transportation | 0 (0.0%) | 19 (100.0%) |
| Material Moving | 7 (100.0%) | 0 (0.0%) |
| Total (Category) | 20 (43.5%) | 26 (56.5%) |
| Total (Overall) | 70 (35.7%) | 126 (64.3%) |
Employment Industries by Sex in Bowman
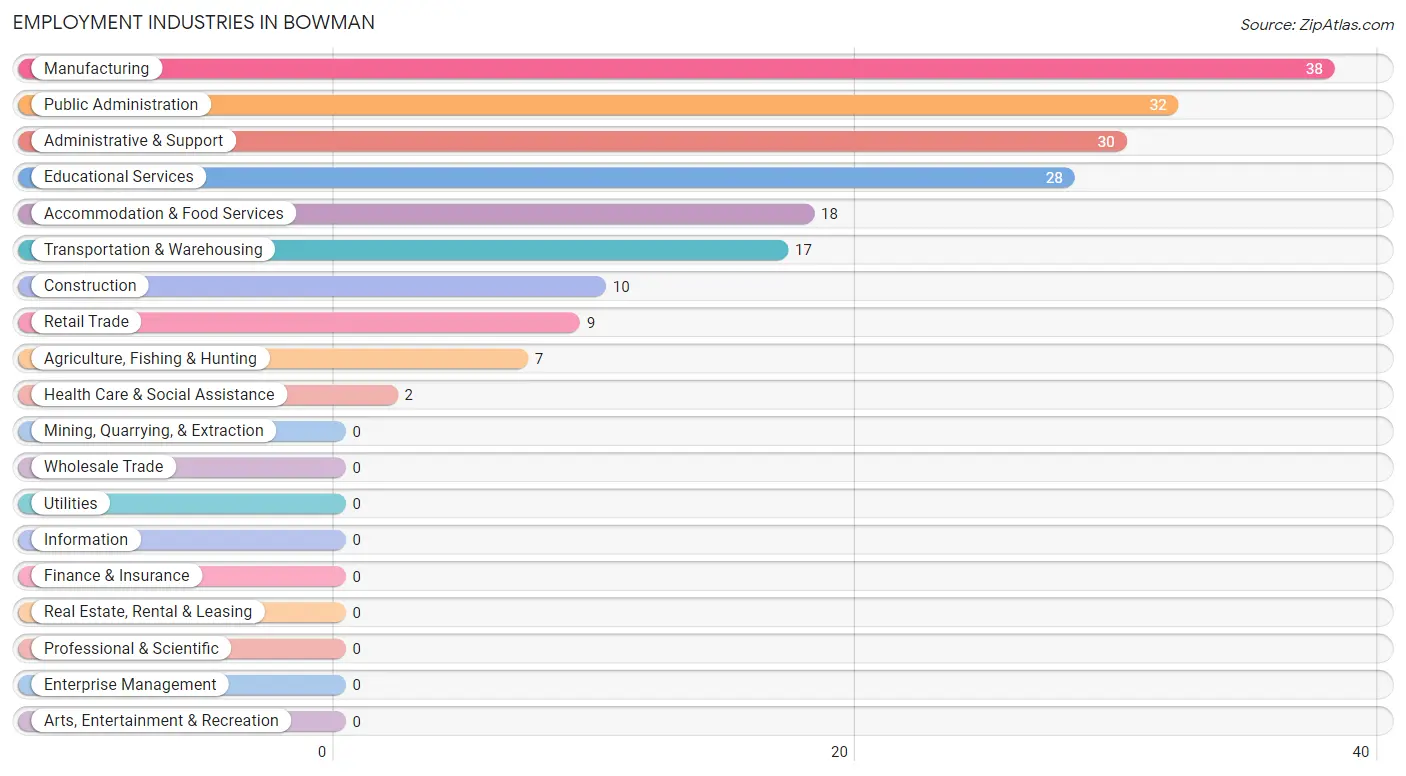
Employment Industries in Bowman
The major employment industries in Bowman include Manufacturing (38 | 19.4%), Public Administration (32 | 16.3%), Administrative & Support (30 | 15.3%), Educational Services (28 | 14.3%), and Accommodation & Food Services (18 | 9.2%).
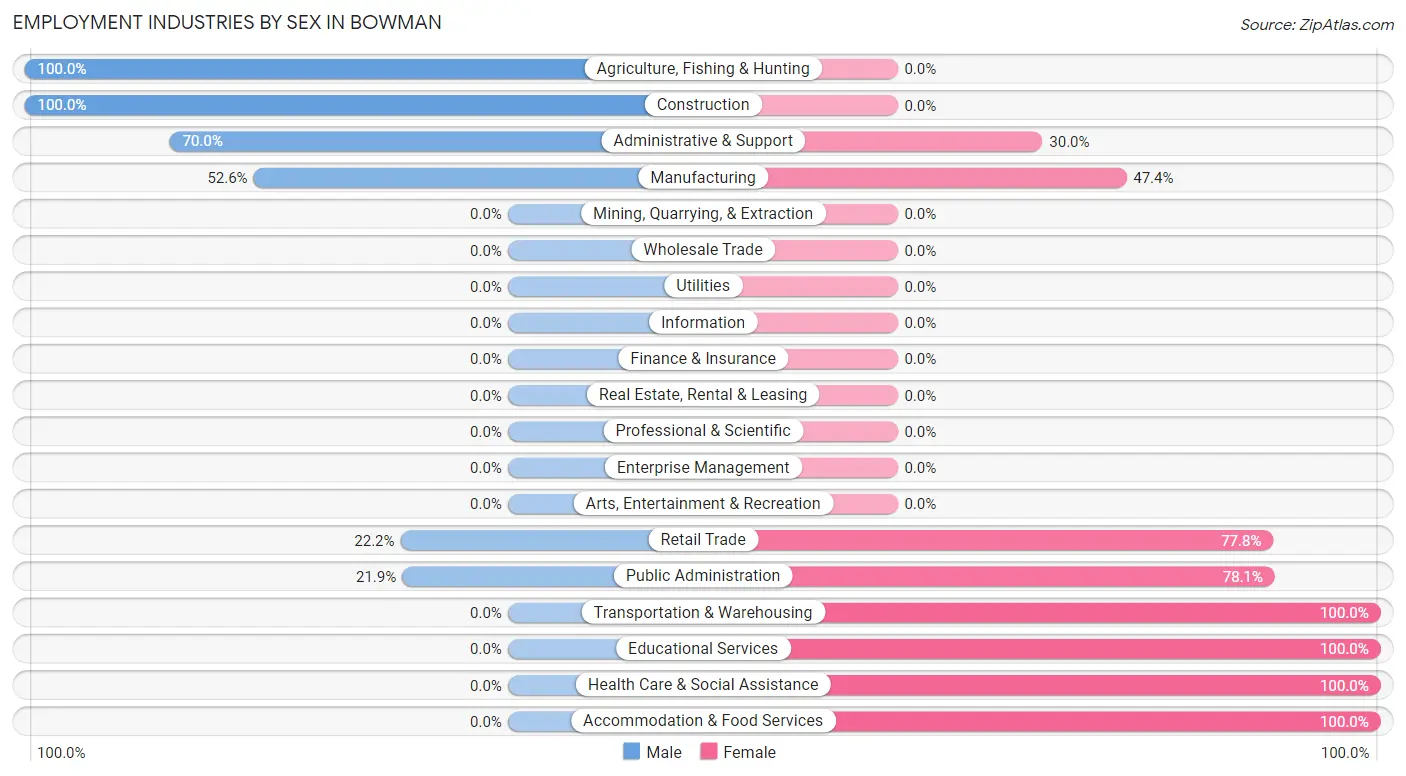
Employment Industries by Sex in Bowman
The Bowman industries that see more men than women are Agriculture, Fishing & Hunting (100.0%), Construction (100.0%), and Administrative & Support (70.0%), whereas the industries that tend to have a higher number of women are Transportation & Warehousing (100.0%), Educational Services (100.0%), and Health Care & Social Assistance (100.0%).
| Industry | Male | Female |
| Agriculture, Fishing & Hunting | 7 (100.0%) | 0 (0.0%) |
| Mining, Quarrying, & Extraction | 0 (0.0%) | 0 (0.0%) |
| Construction | 10 (100.0%) | 0 (0.0%) |
| Manufacturing | 20 (52.6%) | 18 (47.4%) |
| Wholesale Trade | 0 (0.0%) | 0 (0.0%) |
| Retail Trade | 2 (22.2%) | 7 (77.8%) |
| Transportation & Warehousing | 0 (0.0%) | 17 (100.0%) |
| Utilities | 0 (0.0%) | 0 (0.0%) |
| Information | 0 (0.0%) | 0 (0.0%) |
| Finance & Insurance | 0 (0.0%) | 0 (0.0%) |
| Real Estate, Rental & Leasing | 0 (0.0%) | 0 (0.0%) |
| Professional & Scientific | 0 (0.0%) | 0 (0.0%) |
| Enterprise Management | 0 (0.0%) | 0 (0.0%) |
| Administrative & Support | 21 (70.0%) | 9 (30.0%) |
| Educational Services | 0 (0.0%) | 28 (100.0%) |
| Health Care & Social Assistance | 0 (0.0%) | 2 (100.0%) |
| Arts, Entertainment & Recreation | 0 (0.0%) | 0 (0.0%) |
| Accommodation & Food Services | 0 (0.0%) | 18 (100.0%) |
| Public Administration | 7 (21.9%) | 25 (78.1%) |
| Total | 70 (35.7%) | 126 (64.3%) |
Education in Bowman
School Enrollment in Bowman
The most common levels of schooling among the 121 students in Bowman are middle school (51 | 42.1%), elementary school (33 | 27.3%), and high school (32 | 26.5%).
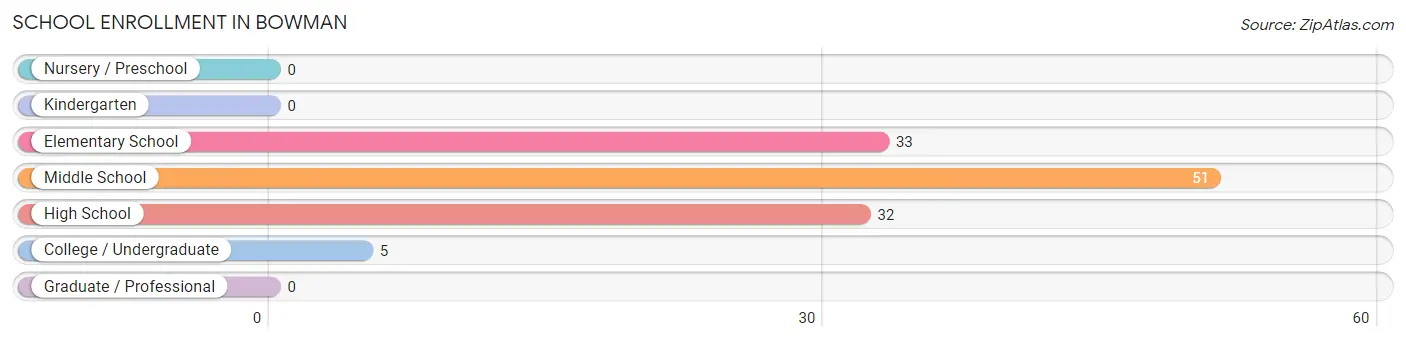
| School Level | # Students | % Students |
| Nursery / Preschool | 0 | 0.0% |
| Kindergarten | 0 | 0.0% |
| Elementary School | 33 | 27.3% |
| Middle School | 51 | 42.1% |
| High School | 32 | 26.5% |
| College / Undergraduate | 5 | 4.1% |
| Graduate / Professional | 0 | 0.0% |
| Total | 121 | 100.0% |
School Enrollment by Age by Funding Source in Bowman
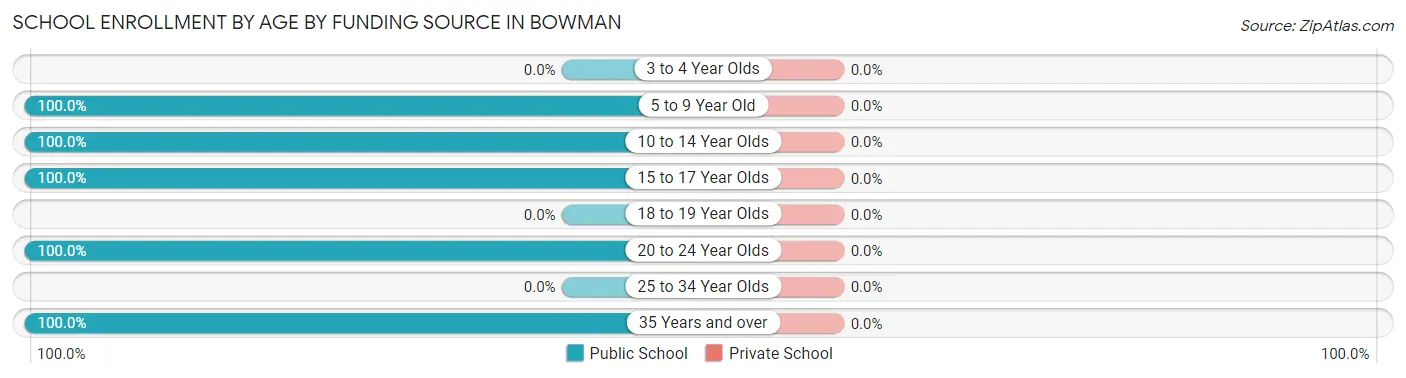
| Age Bracket | Public School | Private School |
| 3 to 4 Year Olds | 0 (0.0%) | 0 (0.0%) |
| 5 to 9 Year Old | 24 (100.0%) | 0 (0.0%) |
| 10 to 14 Year Olds | 49 (100.0%) | 0 (0.0%) |
| 15 to 17 Year Olds | 43 (100.0%) | 0 (0.0%) |
| 18 to 19 Year Olds | 0 (0.0%) | 0 (0.0%) |
| 20 to 24 Year Olds | 2 (100.0%) | 0 (0.0%) |
| 25 to 34 Year Olds | 0 (0.0%) | 0 (0.0%) |
| 35 Years and over | 3 (100.0%) | 0 (0.0%) |
| Total | 121 (100.0%) | 0 (0.0%) |
Educational Attainment by Field of Study in Bowman
Arts & humanities (18 | 28.6%), education (14 | 22.2%), business (9 | 14.3%), psychology (7 | 11.1%), and literature & languages (7 | 11.1%) are the most common fields of study among 63 individuals in Bowman who have obtained a bachelor's degree or higher.
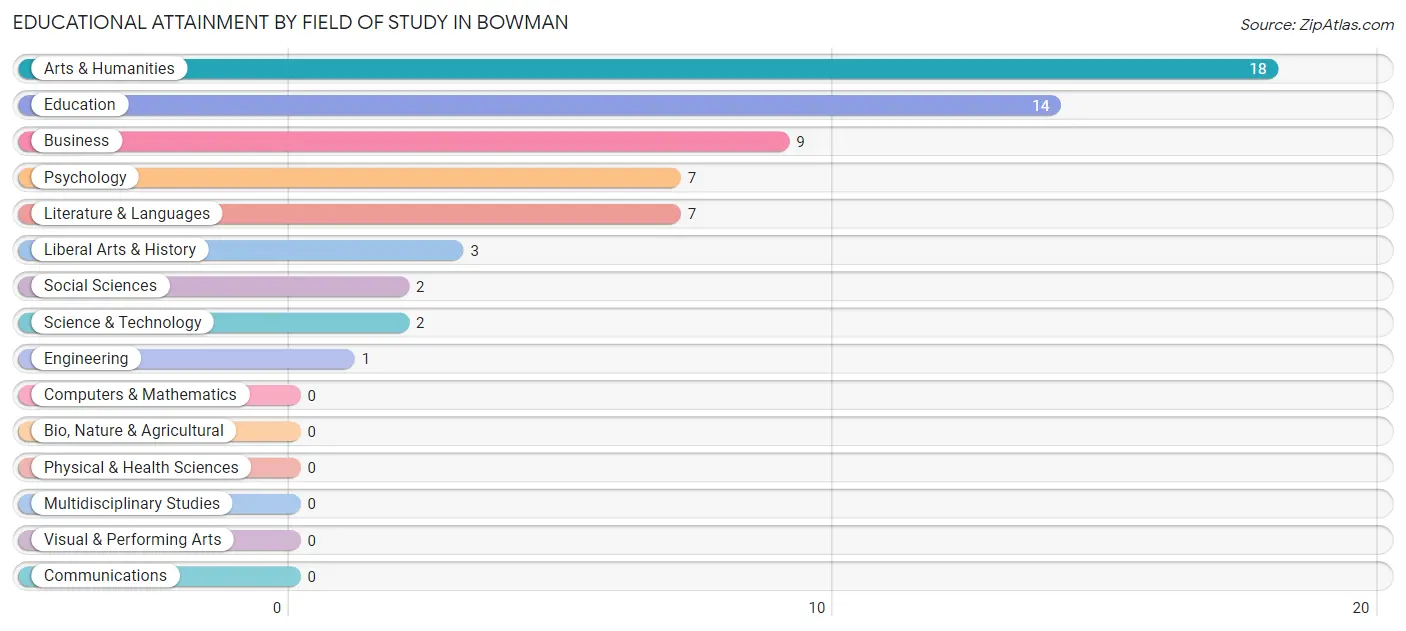
| Field of Study | # Graduates | % Graduates |
| Computers & Mathematics | 0 | 0.0% |
| Bio, Nature & Agricultural | 0 | 0.0% |
| Physical & Health Sciences | 0 | 0.0% |
| Psychology | 7 | 11.1% |
| Social Sciences | 2 | 3.2% |
| Engineering | 1 | 1.6% |
| Multidisciplinary Studies | 0 | 0.0% |
| Science & Technology | 2 | 3.2% |
| Business | 9 | 14.3% |
| Education | 14 | 22.2% |
| Literature & Languages | 7 | 11.1% |
| Liberal Arts & History | 3 | 4.8% |
| Visual & Performing Arts | 0 | 0.0% |
| Communications | 0 | 0.0% |
| Arts & Humanities | 18 | 28.6% |
| Total | 63 | 100.0% |
Transportation & Commute in Bowman
Vehicle Availability by Sex in Bowman
The most prevalent vehicle ownership categories in Bowman are males with 3 vehicles (36, accounting for 53.7%) and females with 3 vehicles (28, making up 28.6%).
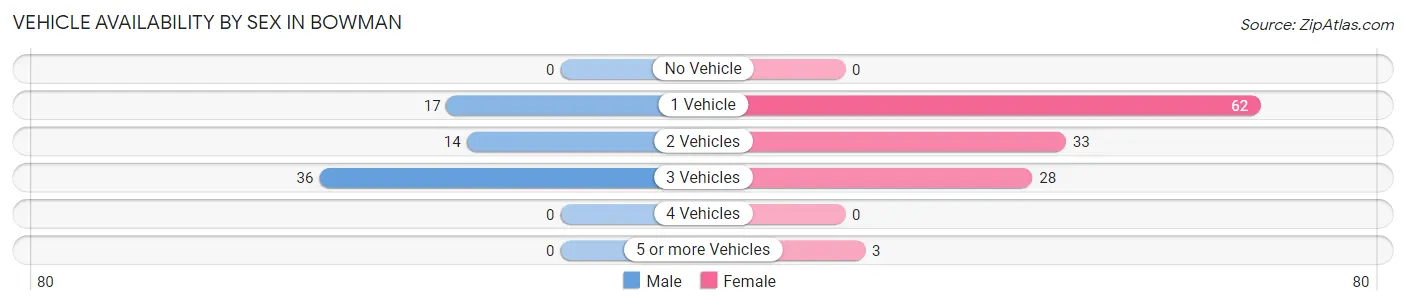
| Vehicles Available | Male | Female |
| No Vehicle | 0 (0.0%) | 0 (0.0%) |
| 1 Vehicle | 17 (25.4%) | 62 (49.2%) |
| 2 Vehicles | 14 (20.9%) | 33 (26.2%) |
| 3 Vehicles | 36 (53.7%) | 28 (22.2%) |
| 4 Vehicles | 0 (0.0%) | 0 (0.0%) |
| 5 or more Vehicles | 0 (0.0%) | 3 (2.4%) |
| Total | 67 (100.0%) | 126 (100.0%) |
Commute Time in Bowman
The most frequently occuring commute durations in Bowman are 30 to 34 minutes (49 commuters, 26.1%), 60 to 89 minutes (35 commuters, 18.6%), and 10 to 14 minutes (31 commuters, 16.5%).
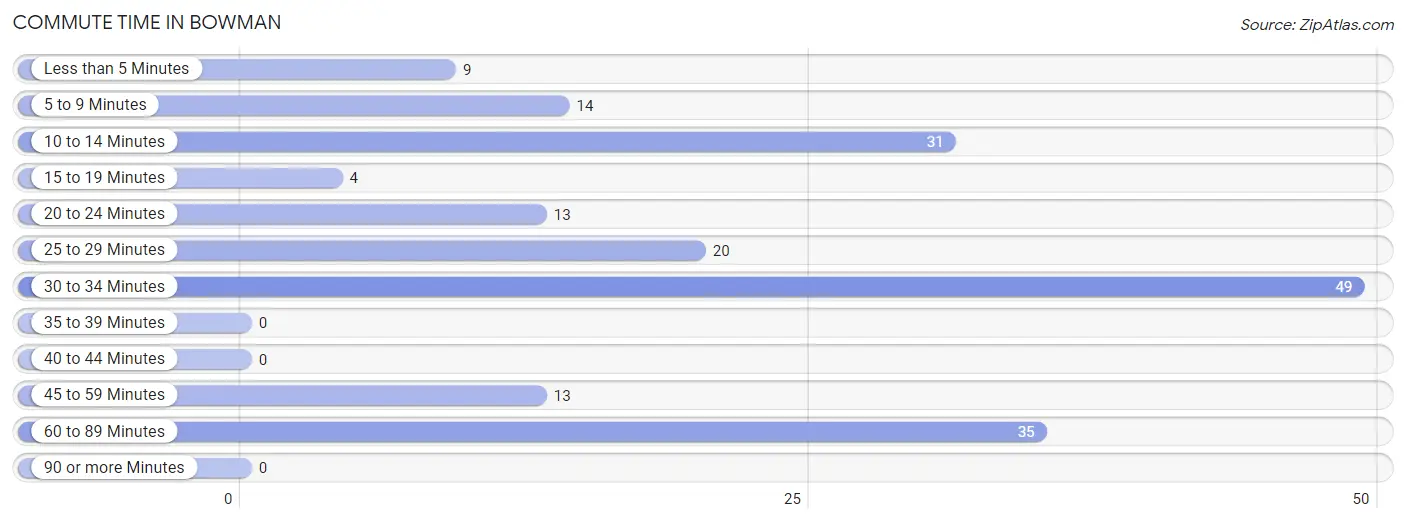
| Commute Time | # Commuters | % Commuters |
| Less than 5 Minutes | 9 | 4.8% |
| 5 to 9 Minutes | 14 | 7.4% |
| 10 to 14 Minutes | 31 | 16.5% |
| 15 to 19 Minutes | 4 | 2.1% |
| 20 to 24 Minutes | 13 | 6.9% |
| 25 to 29 Minutes | 20 | 10.6% |
| 30 to 34 Minutes | 49 | 26.1% |
| 35 to 39 Minutes | 0 | 0.0% |
| 40 to 44 Minutes | 0 | 0.0% |
| 45 to 59 Minutes | 13 | 6.9% |
| 60 to 89 Minutes | 35 | 18.6% |
| 90 or more Minutes | 0 | 0.0% |
Commute Time by Sex in Bowman
The most common commute times in Bowman are 20 to 24 minutes (13 commuters, 21.0%) for males and 30 to 34 minutes (36 commuters, 28.6%) for females.
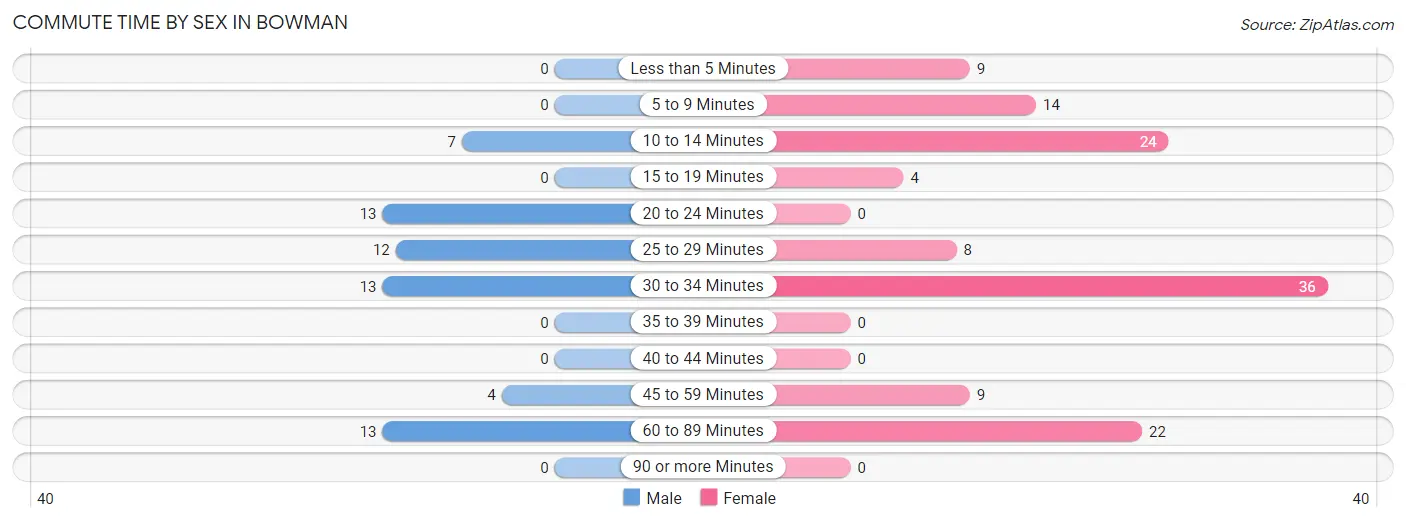
| Commute Time | Male | Female |
| Less than 5 Minutes | 0 (0.0%) | 9 (7.1%) |
| 5 to 9 Minutes | 0 (0.0%) | 14 (11.1%) |
| 10 to 14 Minutes | 7 (11.3%) | 24 (19.1%) |
| 15 to 19 Minutes | 0 (0.0%) | 4 (3.2%) |
| 20 to 24 Minutes | 13 (21.0%) | 0 (0.0%) |
| 25 to 29 Minutes | 12 (19.4%) | 8 (6.4%) |
| 30 to 34 Minutes | 13 (21.0%) | 36 (28.6%) |
| 35 to 39 Minutes | 0 (0.0%) | 0 (0.0%) |
| 40 to 44 Minutes | 0 (0.0%) | 0 (0.0%) |
| 45 to 59 Minutes | 4 (6.5%) | 9 (7.1%) |
| 60 to 89 Minutes | 13 (21.0%) | 22 (17.5%) |
| 90 or more Minutes | 0 (0.0%) | 0 (0.0%) |
Time of Departure to Work by Sex in Bowman
The most frequent times of departure to work in Bowman are 7:00 AM to 7:29 AM (26, 41.9%) for males and 5:00 AM to 5:29 AM (32, 25.4%) for females.
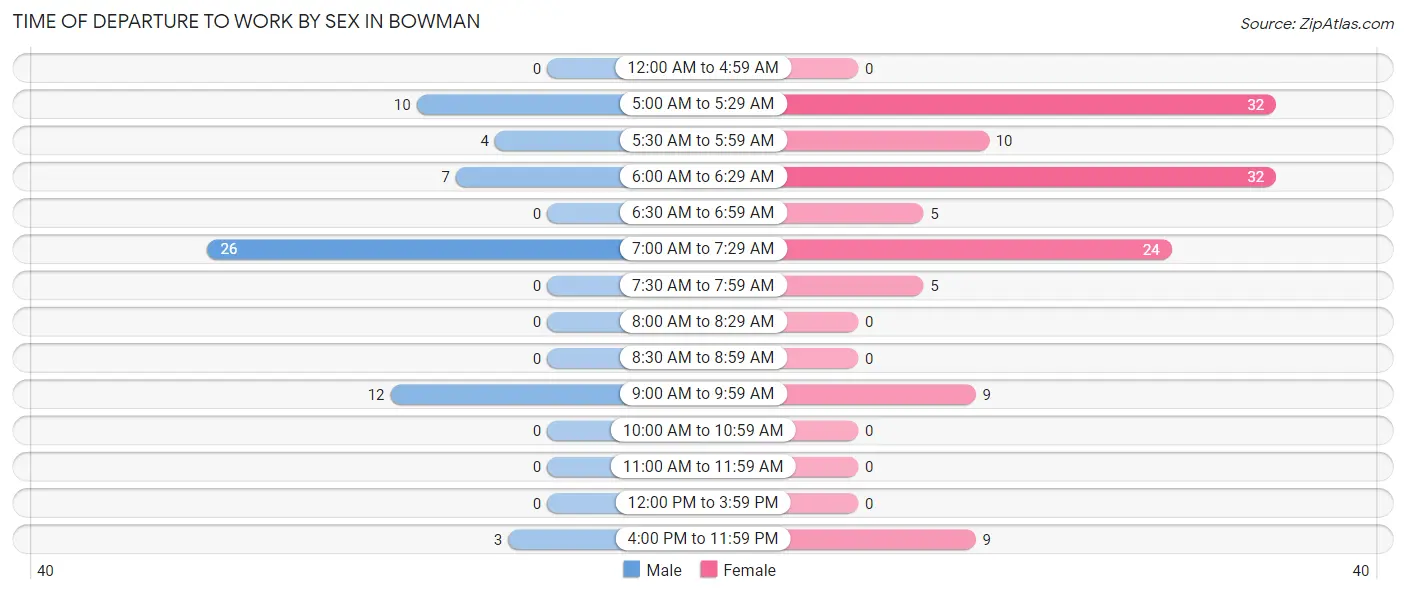
| Time of Departure | Male | Female |
| 12:00 AM to 4:59 AM | 0 (0.0%) | 0 (0.0%) |
| 5:00 AM to 5:29 AM | 10 (16.1%) | 32 (25.4%) |
| 5:30 AM to 5:59 AM | 4 (6.5%) | 10 (7.9%) |
| 6:00 AM to 6:29 AM | 7 (11.3%) | 32 (25.4%) |
| 6:30 AM to 6:59 AM | 0 (0.0%) | 5 (4.0%) |
| 7:00 AM to 7:29 AM | 26 (41.9%) | 24 (19.1%) |
| 7:30 AM to 7:59 AM | 0 (0.0%) | 5 (4.0%) |
| 8:00 AM to 8:29 AM | 0 (0.0%) | 0 (0.0%) |
| 8:30 AM to 8:59 AM | 0 (0.0%) | 0 (0.0%) |
| 9:00 AM to 9:59 AM | 12 (19.4%) | 9 (7.1%) |
| 10:00 AM to 10:59 AM | 0 (0.0%) | 0 (0.0%) |
| 11:00 AM to 11:59 AM | 0 (0.0%) | 0 (0.0%) |
| 12:00 PM to 3:59 PM | 0 (0.0%) | 0 (0.0%) |
| 4:00 PM to 11:59 PM | 3 (4.8%) | 9 (7.1%) |
| Total | 62 (100.0%) | 126 (100.0%) |
Housing Occupancy in Bowman
Occupancy by Ownership in Bowman
Of the total 293 dwellings in Bowman, owner-occupied units account for 193 (65.9%), while renter-occupied units make up 100 (34.1%).
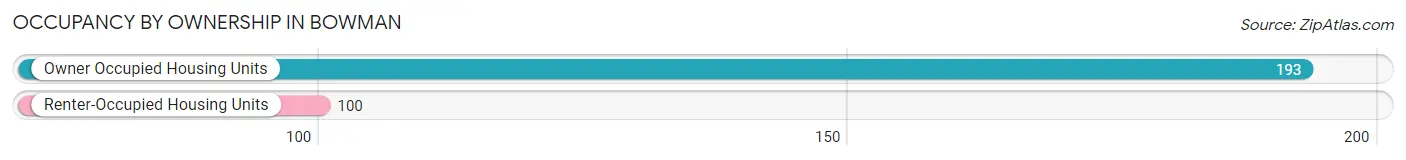
| Occupancy | # Housing Units | % Housing Units |
| Owner Occupied Housing Units | 193 | 65.9% |
| Renter-Occupied Housing Units | 100 | 34.1% |
| Total Occupied Housing Units | 293 | 100.0% |
Occupancy by Household Size in Bowman
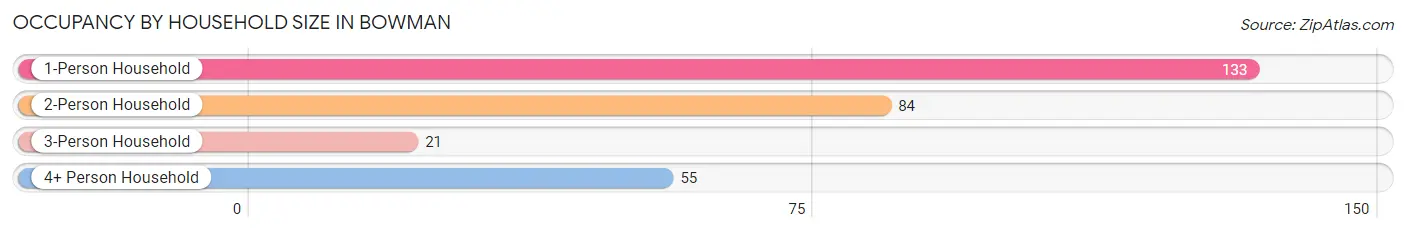
| Household Size | # Housing Units | % Housing Units |
| 1-Person Household | 133 | 45.4% |
| 2-Person Household | 84 | 28.7% |
| 3-Person Household | 21 | 7.2% |
| 4+ Person Household | 55 | 18.8% |
| Total Housing Units | 293 | 100.0% |
Occupancy by Ownership by Household Size in Bowman
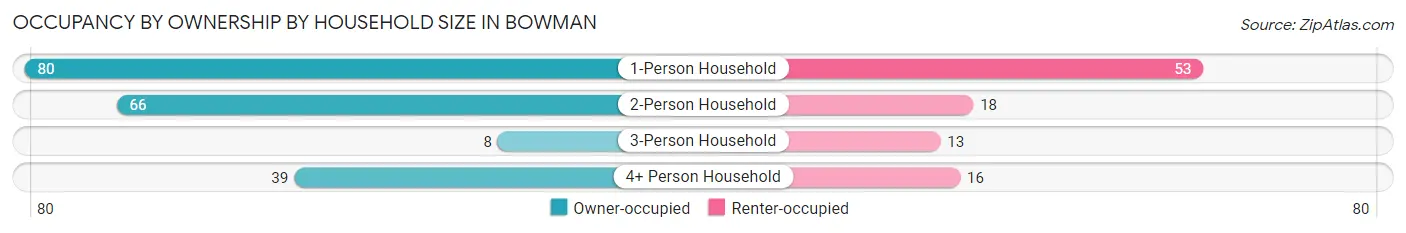
| Household Size | Owner-occupied | Renter-occupied |
| 1-Person Household | 80 (60.2%) | 53 (39.9%) |
| 2-Person Household | 66 (78.6%) | 18 (21.4%) |
| 3-Person Household | 8 (38.1%) | 13 (61.9%) |
| 4+ Person Household | 39 (70.9%) | 16 (29.1%) |
| Total Housing Units | 193 (65.9%) | 100 (34.1%) |
Occupancy by Educational Attainment in Bowman
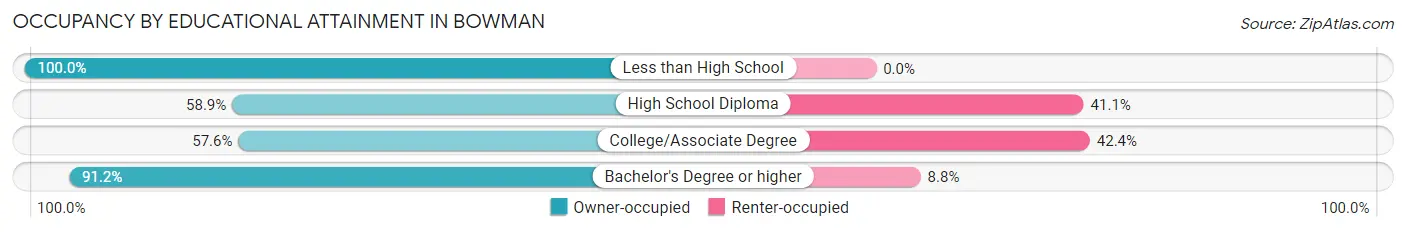
| Household Size | Owner-occupied | Renter-occupied |
| Less than High School | 25 (100.0%) | 0 (0.0%) |
| High School Diploma | 103 (58.9%) | 72 (41.1%) |
| College/Associate Degree | 34 (57.6%) | 25 (42.4%) |
| Bachelor's Degree or higher | 31 (91.2%) | 3 (8.8%) |
Occupancy by Age of Householder in Bowman
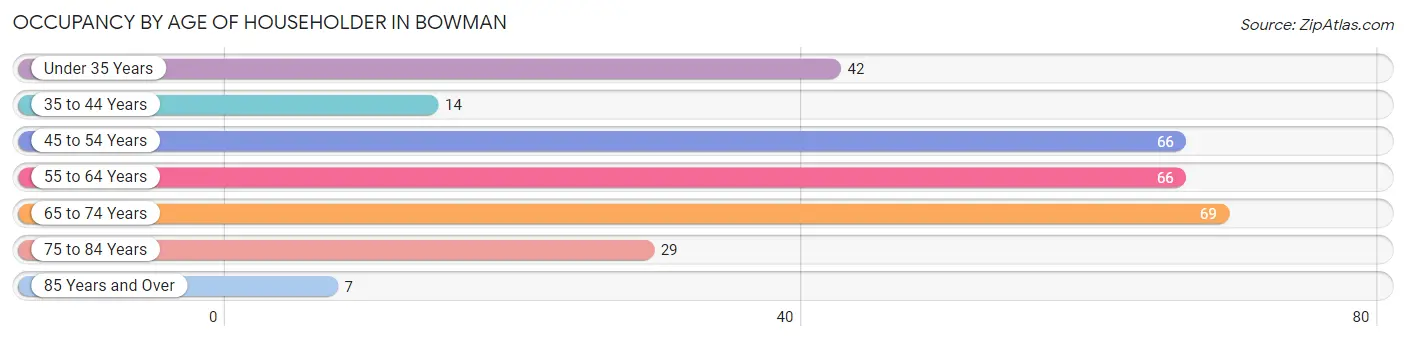
| Age Bracket | # Households | % Households |
| Under 35 Years | 42 | 14.3% |
| 35 to 44 Years | 14 | 4.8% |
| 45 to 54 Years | 66 | 22.5% |
| 55 to 64 Years | 66 | 22.5% |
| 65 to 74 Years | 69 | 23.5% |
| 75 to 84 Years | 29 | 9.9% |
| 85 Years and Over | 7 | 2.4% |
| Total | 293 | 100.0% |
Housing Finances in Bowman
Median Income by Occupancy in Bowman
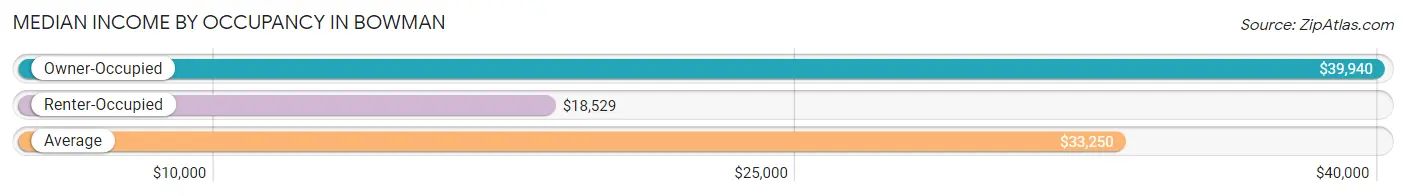
| Occupancy Type | # Households | Median Income |
| Owner-Occupied | 193 (65.9%) | $39,940 |
| Renter-Occupied | 100 (34.1%) | $18,529 |
| Average | 293 (100.0%) | $33,250 |
Occupancy by Householder Income Bracket in Bowman
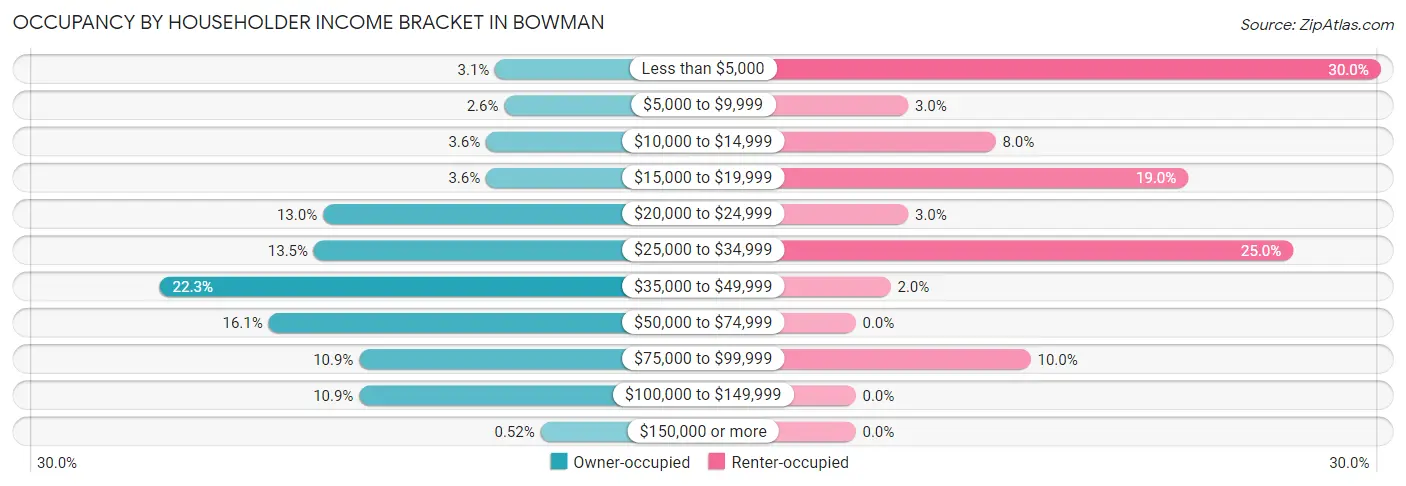
| Income Bracket | Owner-occupied | Renter-occupied |
| Less than $5,000 | 6 (3.1%) | 30 (30.0%) |
| $5,000 to $9,999 | 5 (2.6%) | 3 (3.0%) |
| $10,000 to $14,999 | 7 (3.6%) | 8 (8.0%) |
| $15,000 to $19,999 | 7 (3.6%) | 19 (19.0%) |
| $20,000 to $24,999 | 25 (13.0%) | 3 (3.0%) |
| $25,000 to $34,999 | 26 (13.5%) | 25 (25.0%) |
| $35,000 to $49,999 | 43 (22.3%) | 2 (2.0%) |
| $50,000 to $74,999 | 31 (16.1%) | 0 (0.0%) |
| $75,000 to $99,999 | 21 (10.9%) | 10 (10.0%) |
| $100,000 to $149,999 | 21 (10.9%) | 0 (0.0%) |
| $150,000 or more | 1 (0.5%) | 0 (0.0%) |
| Total | 193 (100.0%) | 100 (100.0%) |
Monthly Housing Cost Tiers in Bowman
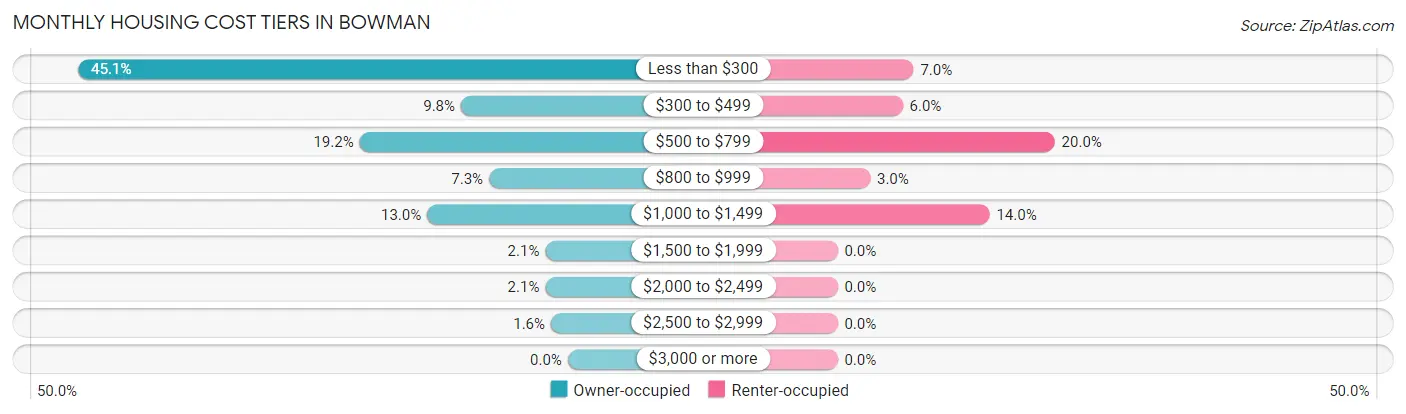
| Monthly Cost | Owner-occupied | Renter-occupied |
| Less than $300 | 87 (45.1%) | 7 (7.0%) |
| $300 to $499 | 19 (9.8%) | 6 (6.0%) |
| $500 to $799 | 37 (19.2%) | 20 (20.0%) |
| $800 to $999 | 14 (7.2%) | 3 (3.0%) |
| $1,000 to $1,499 | 25 (13.0%) | 14 (14.0%) |
| $1,500 to $1,999 | 4 (2.1%) | 0 (0.0%) |
| $2,000 to $2,499 | 4 (2.1%) | 0 (0.0%) |
| $2,500 to $2,999 | 3 (1.5%) | 0 (0.0%) |
| $3,000 or more | 0 (0.0%) | 0 (0.0%) |
| Total | 193 (100.0%) | 100 (100.0%) |
Physical Housing Characteristics in Bowman
Housing Structures in Bowman
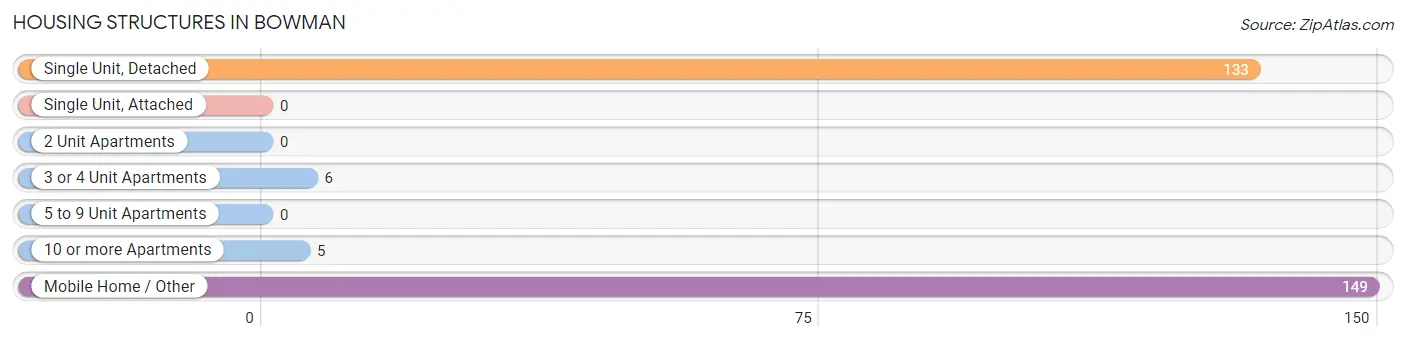
| Structure Type | # Housing Units | % Housing Units |
| Single Unit, Detached | 133 | 45.4% |
| Single Unit, Attached | 0 | 0.0% |
| 2 Unit Apartments | 0 | 0.0% |
| 3 or 4 Unit Apartments | 6 | 2.1% |
| 5 to 9 Unit Apartments | 0 | 0.0% |
| 10 or more Apartments | 5 | 1.7% |
| Mobile Home / Other | 149 | 50.8% |
| Total | 293 | 100.0% |
Housing Structures by Occupancy in Bowman
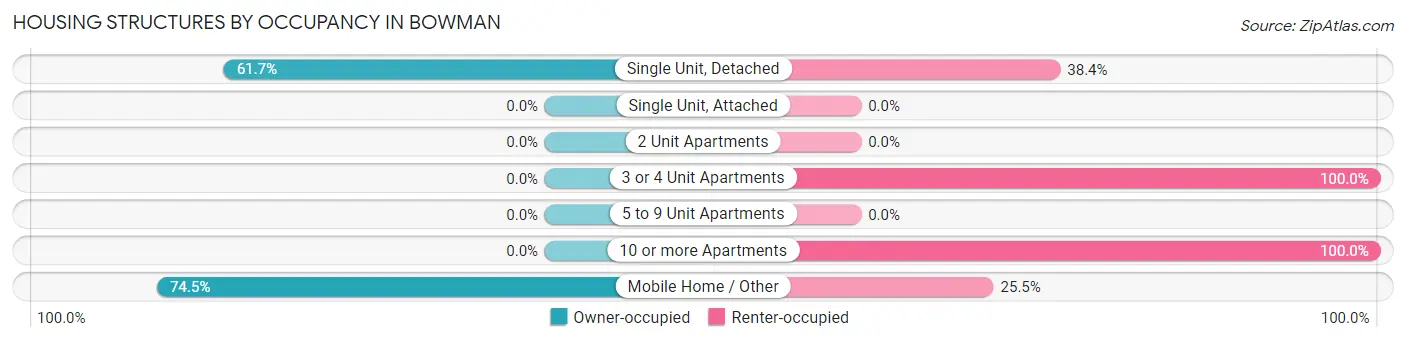
| Structure Type | Owner-occupied | Renter-occupied |
| Single Unit, Detached | 82 (61.7%) | 51 (38.4%) |
| Single Unit, Attached | 0 (0.0%) | 0 (0.0%) |
| 2 Unit Apartments | 0 (0.0%) | 0 (0.0%) |
| 3 or 4 Unit Apartments | 0 (0.0%) | 6 (100.0%) |
| 5 to 9 Unit Apartments | 0 (0.0%) | 0 (0.0%) |
| 10 or more Apartments | 0 (0.0%) | 5 (100.0%) |
| Mobile Home / Other | 111 (74.5%) | 38 (25.5%) |
| Total | 193 (65.9%) | 100 (34.1%) |
Housing Structures by Number of Rooms in Bowman
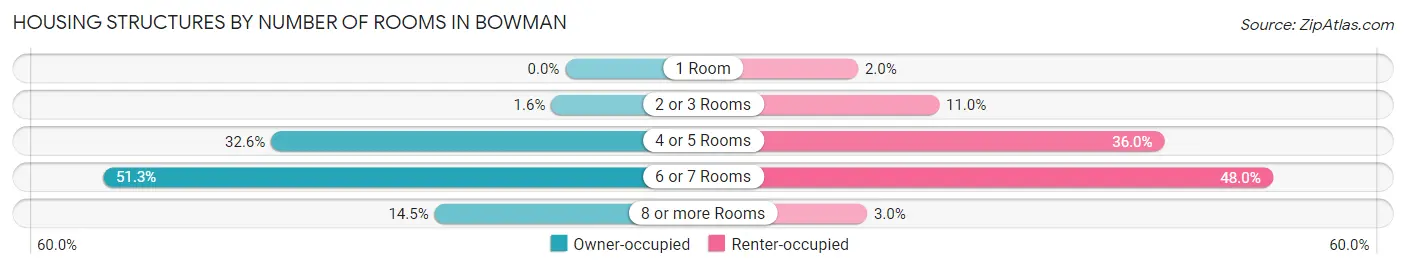
| Number of Rooms | Owner-occupied | Renter-occupied |
| 1 Room | 0 (0.0%) | 2 (2.0%) |
| 2 or 3 Rooms | 3 (1.5%) | 11 (11.0%) |
| 4 or 5 Rooms | 63 (32.6%) | 36 (36.0%) |
| 6 or 7 Rooms | 99 (51.3%) | 48 (48.0%) |
| 8 or more Rooms | 28 (14.5%) | 3 (3.0%) |
| Total | 193 (100.0%) | 100 (100.0%) |
Housing Structure by Heating Type in Bowman
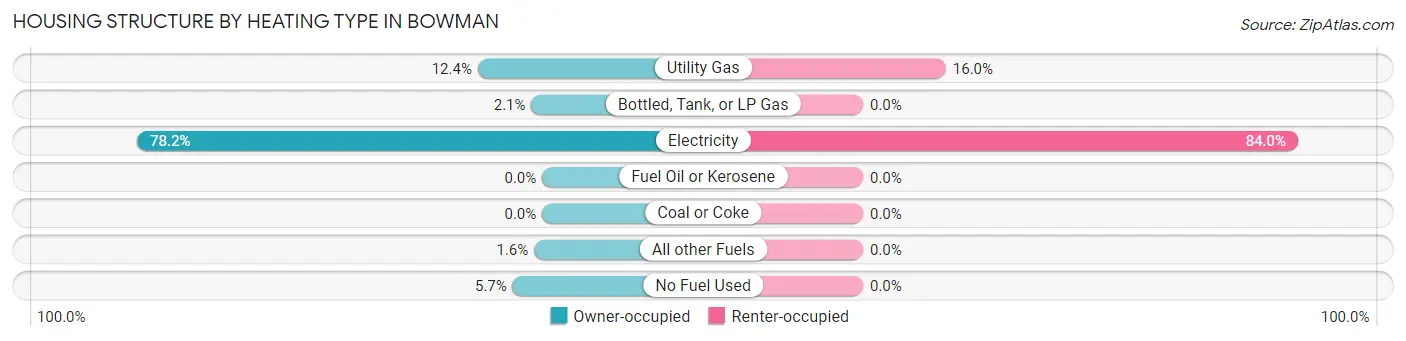
| Heating Type | Owner-occupied | Renter-occupied |
| Utility Gas | 24 (12.4%) | 16 (16.0%) |
| Bottled, Tank, or LP Gas | 4 (2.1%) | 0 (0.0%) |
| Electricity | 151 (78.2%) | 84 (84.0%) |
| Fuel Oil or Kerosene | 0 (0.0%) | 0 (0.0%) |
| Coal or Coke | 0 (0.0%) | 0 (0.0%) |
| All other Fuels | 3 (1.5%) | 0 (0.0%) |
| No Fuel Used | 11 (5.7%) | 0 (0.0%) |
| Total | 193 (100.0%) | 100 (100.0%) |
Household Vehicle Usage in Bowman
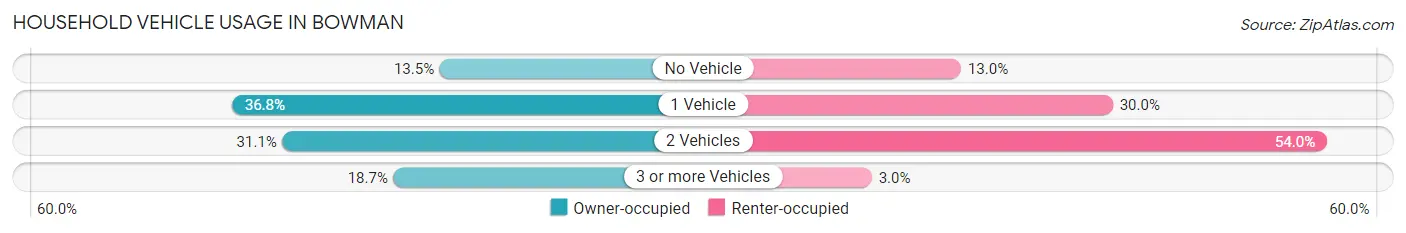
| Vehicles per Household | Owner-occupied | Renter-occupied |
| No Vehicle | 26 (13.5%) | 13 (13.0%) |
| 1 Vehicle | 71 (36.8%) | 30 (30.0%) |
| 2 Vehicles | 60 (31.1%) | 54 (54.0%) |
| 3 or more Vehicles | 36 (18.6%) | 3 (3.0%) |
| Total | 193 (100.0%) | 100 (100.0%) |
Real Estate & Mortgages in Bowman
Real Estate and Mortgage Overview in Bowman
| Characteristic | Without Mortgage | With Mortgage |
| Housing Units | 153 | 40 |
| Median Property Value | $70,900 | $93,000 |
| Median Household Income | $39,345 | $1 |
| Monthly Housing Costs | $290 | $0 |
| Real Estate Taxes | $418 | $0 |
Property Value by Mortgage Status in Bowman
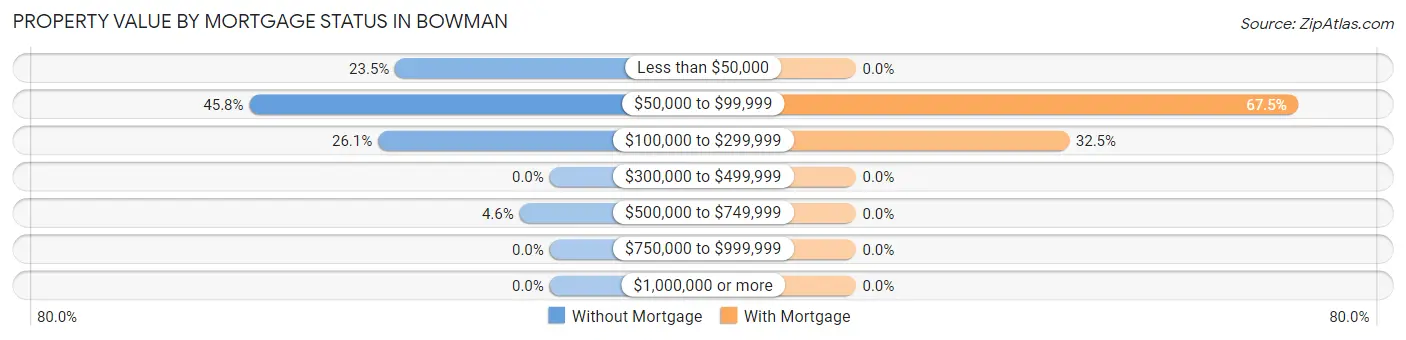
| Property Value | Without Mortgage | With Mortgage |
| Less than $50,000 | 36 (23.5%) | 0 (0.0%) |
| $50,000 to $99,999 | 70 (45.8%) | 27 (67.5%) |
| $100,000 to $299,999 | 40 (26.1%) | 13 (32.5%) |
| $300,000 to $499,999 | 0 (0.0%) | 0 (0.0%) |
| $500,000 to $749,999 | 7 (4.6%) | 0 (0.0%) |
| $750,000 to $999,999 | 0 (0.0%) | 0 (0.0%) |
| $1,000,000 or more | 0 (0.0%) | 0 (0.0%) |
| Total | 153 (100.0%) | 40 (100.0%) |
Household Income by Mortgage Status in Bowman
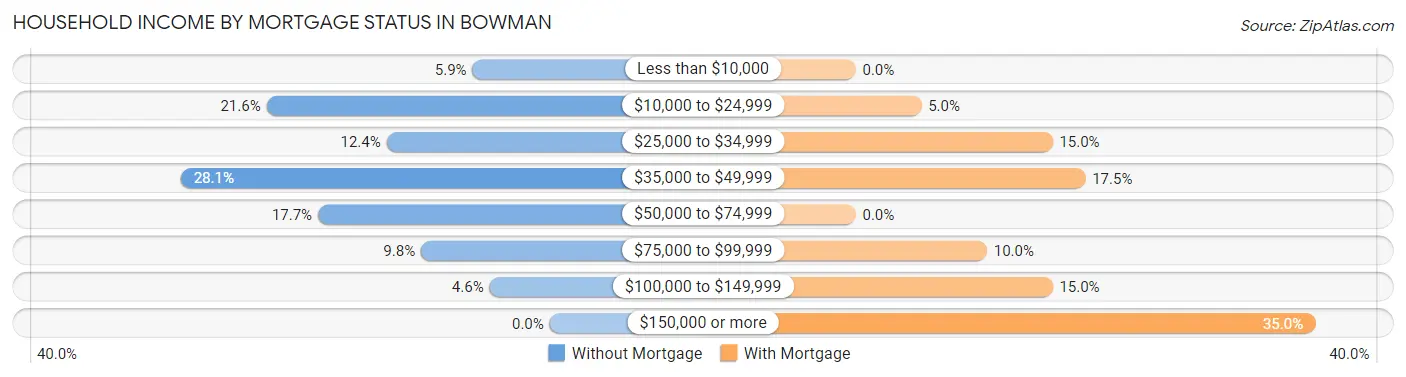
| Household Income | Without Mortgage | With Mortgage |
| Less than $10,000 | 9 (5.9%) | 0 (0.0%) |
| $10,000 to $24,999 | 33 (21.6%) | 2 (5.0%) |
| $25,000 to $34,999 | 19 (12.4%) | 6 (15.0%) |
| $35,000 to $49,999 | 43 (28.1%) | 7 (17.5%) |
| $50,000 to $74,999 | 27 (17.6%) | 0 (0.0%) |
| $75,000 to $99,999 | 15 (9.8%) | 4 (10.0%) |
| $100,000 to $149,999 | 7 (4.6%) | 6 (15.0%) |
| $150,000 or more | 0 (0.0%) | 14 (35.0%) |
| Total | 153 (100.0%) | 40 (100.0%) |
Property Value to Household Income Ratio in Bowman
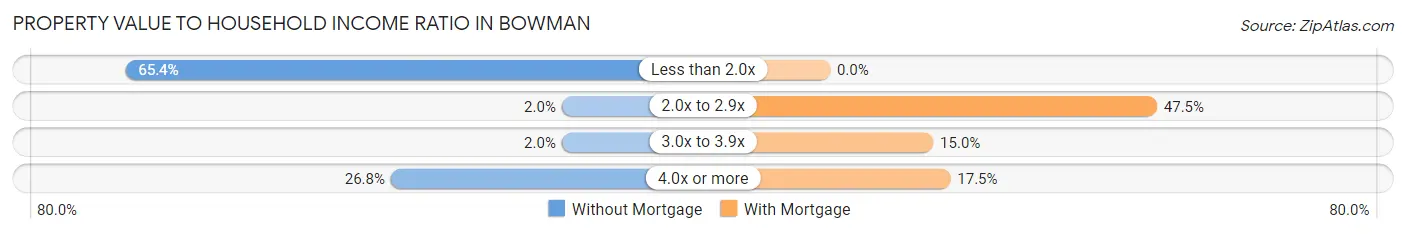
| Value-to-Income Ratio | Without Mortgage | With Mortgage |
| Less than 2.0x | 100 (65.4%) | 0 (0.0%) |
| 2.0x to 2.9x | 3 (2.0%) | 19 (47.5%) |
| 3.0x to 3.9x | 3 (2.0%) | 6 (15.0%) |
| 4.0x or more | 41 (26.8%) | 7 (17.5%) |
| Total | 153 (100.0%) | 40 (100.0%) |
Real Estate Taxes by Mortgage Status in Bowman
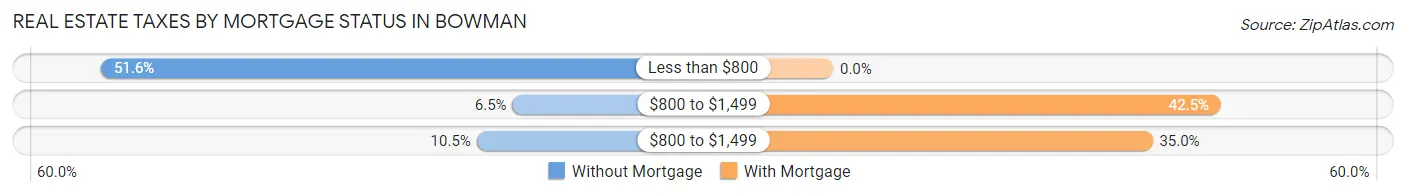
| Property Taxes | Without Mortgage | With Mortgage |
| Less than $800 | 79 (51.6%) | 0 (0.0%) |
| $800 to $1,499 | 10 (6.5%) | 17 (42.5%) |
| $800 to $1,499 | 16 (10.5%) | 14 (35.0%) |
| Total | 153 (100.0%) | 40 (100.0%) |
Health & Disability in Bowman
Health Insurance Coverage by Age in Bowman
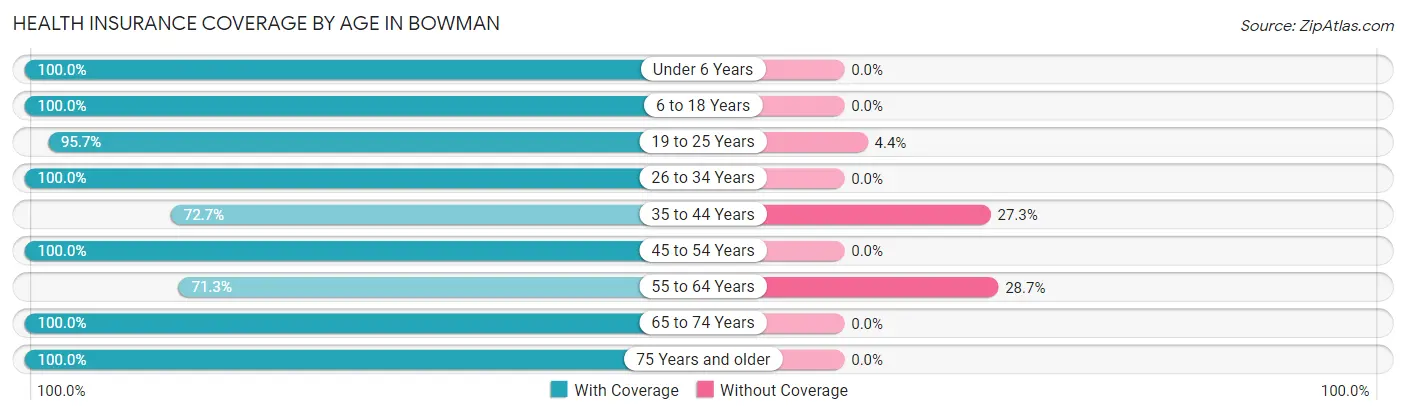
| Age Bracket | With Coverage | Without Coverage |
| Under 6 Years | 49 (100.0%) | 0 (0.0%) |
| 6 to 18 Years | 116 (100.0%) | 0 (0.0%) |
| 19 to 25 Years | 44 (95.7%) | 2 (4.3%) |
| 26 to 34 Years | 70 (100.0%) | 0 (0.0%) |
| 35 to 44 Years | 24 (72.7%) | 9 (27.3%) |
| 45 to 54 Years | 78 (100.0%) | 0 (0.0%) |
| 55 to 64 Years | 72 (71.3%) | 29 (28.7%) |
| 65 to 74 Years | 101 (100.0%) | 0 (0.0%) |
| 75 Years and older | 58 (100.0%) | 0 (0.0%) |
| Total | 612 (93.9%) | 40 (6.1%) |
Health Insurance Coverage by Citizenship Status in Bowman
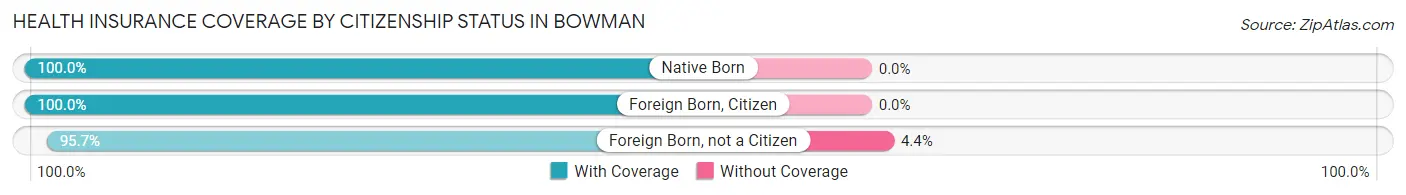
| Citizenship Status | With Coverage | Without Coverage |
| Native Born | 49 (100.0%) | 0 (0.0%) |
| Foreign Born, Citizen | 116 (100.0%) | 0 (0.0%) |
| Foreign Born, not a Citizen | 44 (95.7%) | 2 (4.3%) |
Health Insurance Coverage by Household Income in Bowman
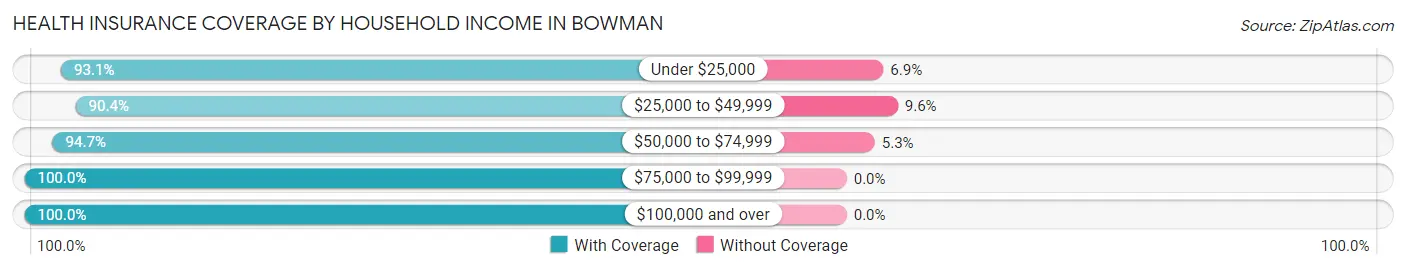
| Household Income | With Coverage | Without Coverage |
| Under $25,000 | 190 (93.1%) | 14 (6.9%) |
| $25,000 to $49,999 | 208 (90.4%) | 22 (9.6%) |
| $50,000 to $74,999 | 72 (94.7%) | 4 (5.3%) |
| $75,000 to $99,999 | 104 (100.0%) | 0 (0.0%) |
| $100,000 and over | 38 (100.0%) | 0 (0.0%) |
Public vs Private Health Insurance Coverage by Age in Bowman
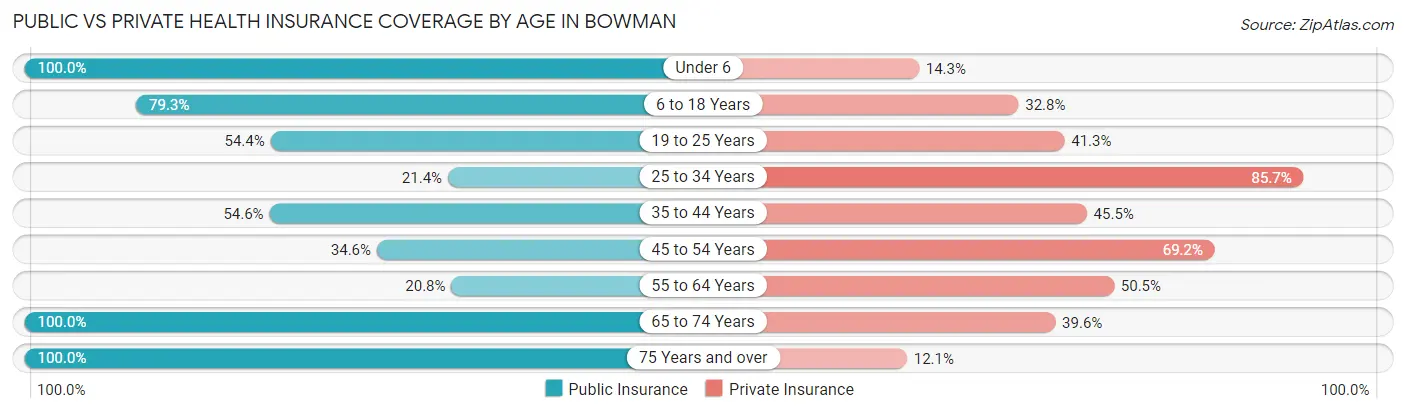
| Age Bracket | Public Insurance | Private Insurance |
| Under 6 | 49 (100.0%) | 7 (14.3%) |
| 6 to 18 Years | 92 (79.3%) | 38 (32.8%) |
| 19 to 25 Years | 25 (54.3%) | 19 (41.3%) |
| 25 to 34 Years | 15 (21.4%) | 60 (85.7%) |
| 35 to 44 Years | 18 (54.5%) | 15 (45.5%) |
| 45 to 54 Years | 27 (34.6%) | 54 (69.2%) |
| 55 to 64 Years | 21 (20.8%) | 51 (50.5%) |
| 65 to 74 Years | 101 (100.0%) | 40 (39.6%) |
| 75 Years and over | 58 (100.0%) | 7 (12.1%) |
| Total | 406 (62.3%) | 291 (44.6%) |
Disability Status by Sex by Age in Bowman
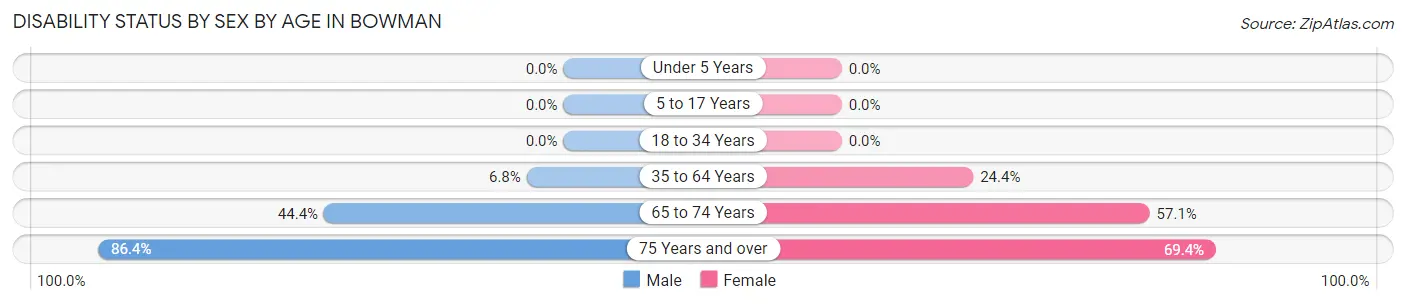
| Age Bracket | Male | Female |
| Under 5 Years | 0 (0.0%) | 0 (0.0%) |
| 5 to 17 Years | 0 (0.0%) | 0 (0.0%) |
| 18 to 34 Years | 0 (0.0%) | 0 (0.0%) |
| 35 to 64 Years | 3 (6.8%) | 41 (24.4%) |
| 65 to 74 Years | 20 (44.4%) | 32 (57.1%) |
| 75 Years and over | 19 (86.4%) | 25 (69.4%) |
Disability Class by Sex by Age in Bowman
Disability Class: Hearing Difficulty
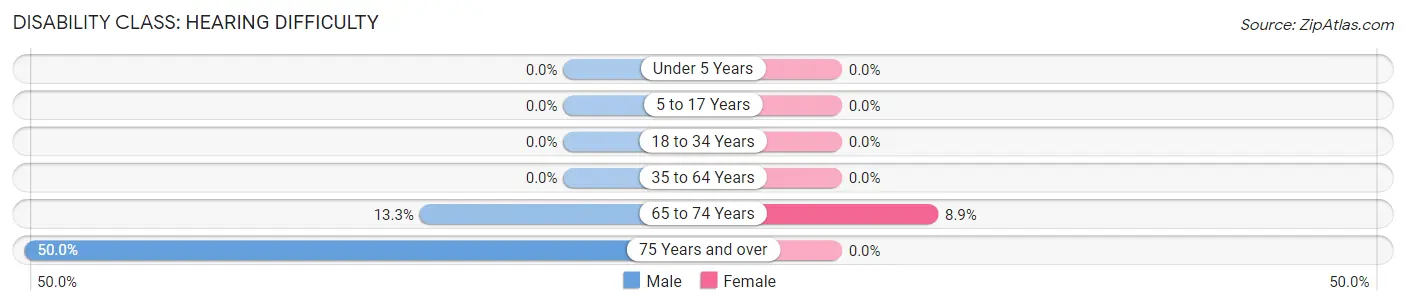
| Age Bracket | Male | Female |
| Under 5 Years | 0 (0.0%) | 0 (0.0%) |
| 5 to 17 Years | 0 (0.0%) | 0 (0.0%) |
| 18 to 34 Years | 0 (0.0%) | 0 (0.0%) |
| 35 to 64 Years | 0 (0.0%) | 0 (0.0%) |
| 65 to 74 Years | 6 (13.3%) | 5 (8.9%) |
| 75 Years and over | 11 (50.0%) | 0 (0.0%) |
Disability Class: Vision Difficulty
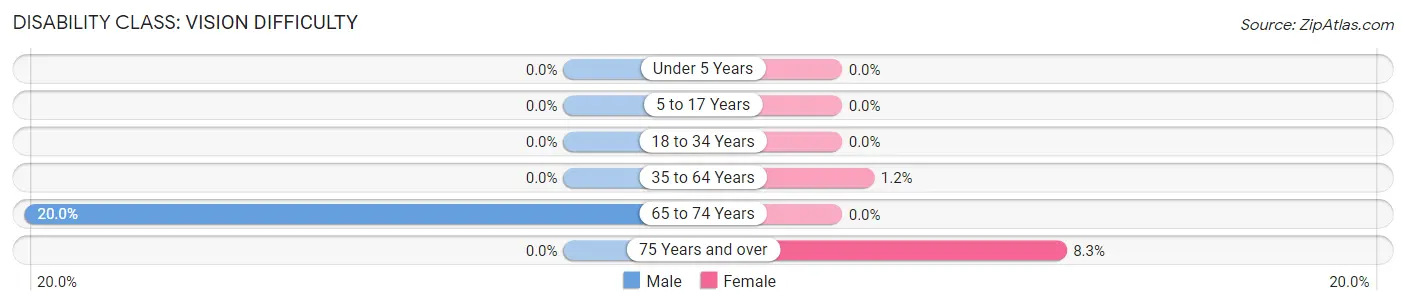
| Age Bracket | Male | Female |
| Under 5 Years | 0 (0.0%) | 0 (0.0%) |
| 5 to 17 Years | 0 (0.0%) | 0 (0.0%) |
| 18 to 34 Years | 0 (0.0%) | 0 (0.0%) |
| 35 to 64 Years | 0 (0.0%) | 2 (1.2%) |
| 65 to 74 Years | 9 (20.0%) | 0 (0.0%) |
| 75 Years and over | 0 (0.0%) | 3 (8.3%) |
Disability Class: Cognitive Difficulty
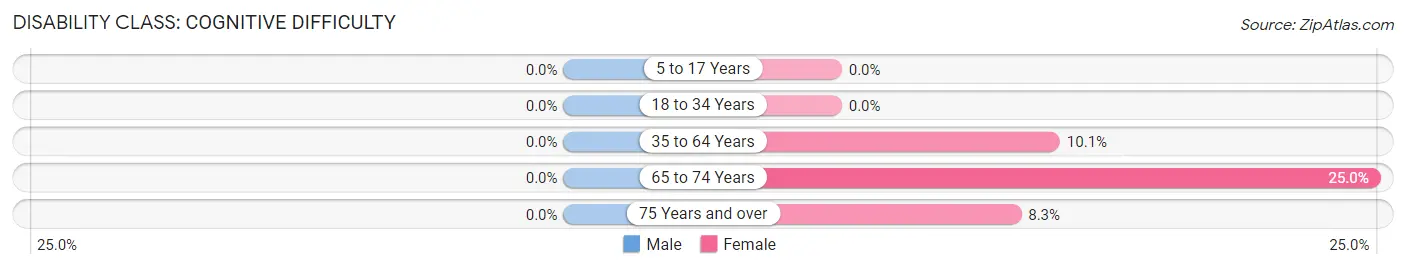
| Age Bracket | Male | Female |
| 5 to 17 Years | 0 (0.0%) | 0 (0.0%) |
| 18 to 34 Years | 0 (0.0%) | 0 (0.0%) |
| 35 to 64 Years | 0 (0.0%) | 17 (10.1%) |
| 65 to 74 Years | 0 (0.0%) | 14 (25.0%) |
| 75 Years and over | 0 (0.0%) | 3 (8.3%) |
Disability Class: Ambulatory Difficulty
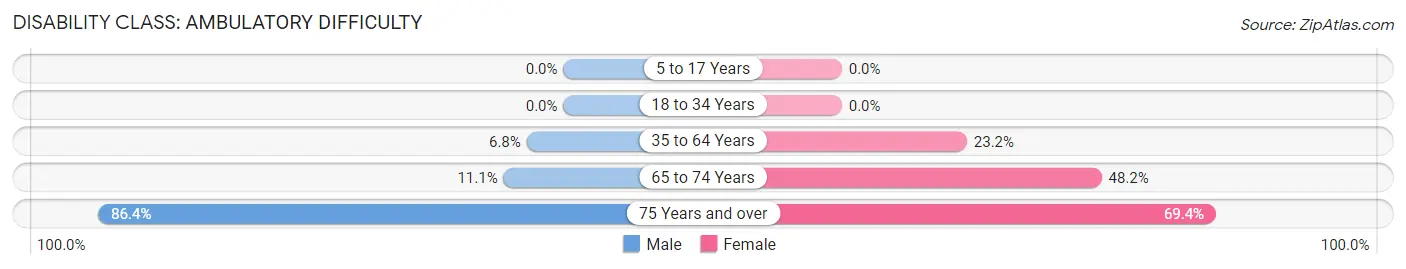
| Age Bracket | Male | Female |
| 5 to 17 Years | 0 (0.0%) | 0 (0.0%) |
| 18 to 34 Years | 0 (0.0%) | 0 (0.0%) |
| 35 to 64 Years | 3 (6.8%) | 39 (23.2%) |
| 65 to 74 Years | 5 (11.1%) | 27 (48.2%) |
| 75 Years and over | 19 (86.4%) | 25 (69.4%) |
Disability Class: Self-Care Difficulty
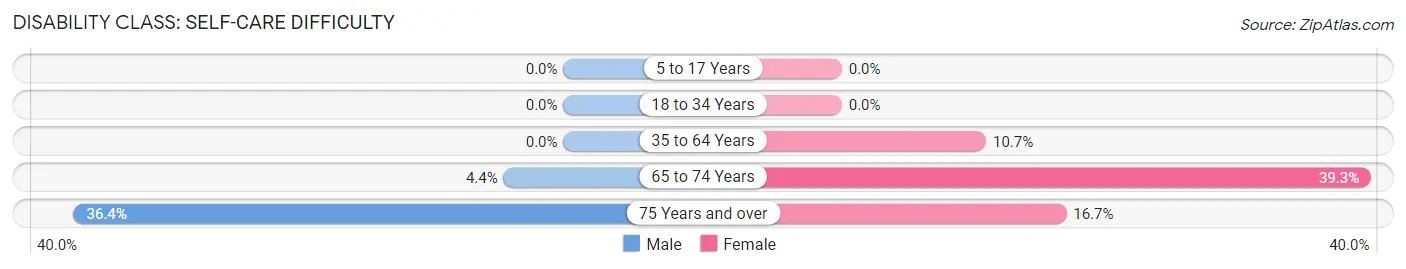
| Age Bracket | Male | Female |
| 5 to 17 Years | 0 (0.0%) | 0 (0.0%) |
| 18 to 34 Years | 0 (0.0%) | 0 (0.0%) |
| 35 to 64 Years | 0 (0.0%) | 18 (10.7%) |
| 65 to 74 Years | 2 (4.4%) | 22 (39.3%) |
| 75 Years and over | 8 (36.4%) | 6 (16.7%) |
Technology Access in Bowman
Computing Device Access in Bowman
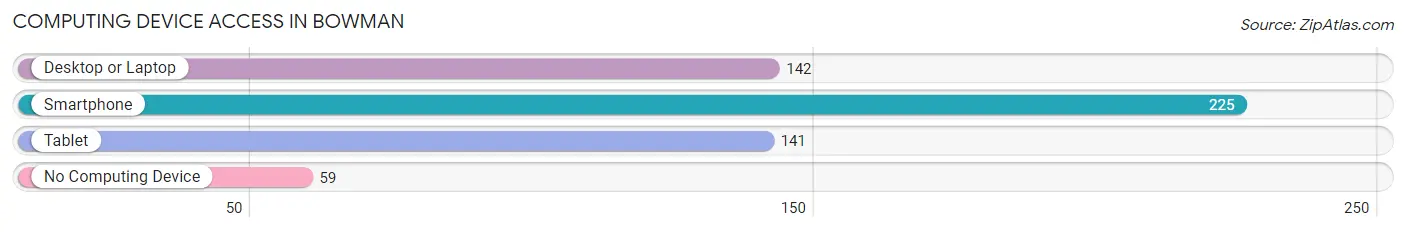
| Device Type | # Households | % Households |
| Desktop or Laptop | 142 | 48.5% |
| Smartphone | 225 | 76.8% |
| Tablet | 141 | 48.1% |
| No Computing Device | 59 | 20.1% |
| Total | 293 | 100.0% |
Internet Access in Bowman
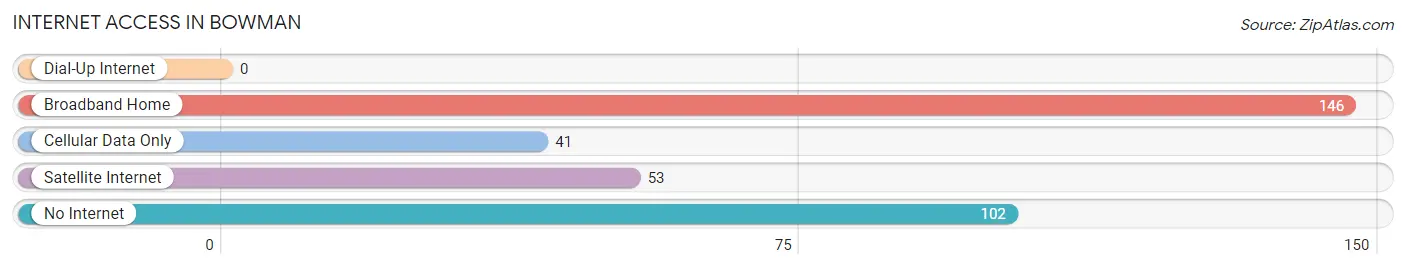
| Internet Type | # Households | % Households |
| Dial-Up Internet | 0 | 0.0% |
| Broadband Home | 146 | 49.8% |
| Cellular Data Only | 41 | 14.0% |
| Satellite Internet | 53 | 18.1% |
| No Internet | 102 | 34.8% |
| Total | 293 | 100.0% |
Bowman Summary
Bowman, South Carolina is a small town located in Orangeburg County, South Carolina. It is situated on the banks of the Edisto River, approximately 20 miles south of Orangeburg. The town was founded in 1872 and is named after the Bowman family, who were among the first settlers in the area.
History
The area that is now Bowman was originally inhabited by the Edisto Indians, who were part of the larger Creek Confederacy. The first European settlers arrived in the area in the late 1700s, and the town of Bowman was officially established in 1872. The town was named after the Bowman family, who were among the first settlers in the area.
The town was originally a farming community, and the main crops grown were cotton, corn, and tobacco. In the late 1800s, the town began to grow and develop, and a number of businesses were established. These included a general store, a blacksmith shop, a sawmill, and a gristmill.
In the early 1900s, the town began to experience a period of growth and development. The first school was built in 1910, and a number of churches were established in the area. The town also began to attract a number of new businesses, including a bank, a hotel, and a movie theater.
Geography
Bowman is located in Orangeburg County, South Carolina. It is situated on the banks of the Edisto River, approximately 20 miles south of Orangeburg. The town is located in a rural area, and the surrounding landscape is mostly flat. The town is located in the Piedmont region of South Carolina, and the climate is generally mild and humid.
Economy
The economy of Bowman is largely based on agriculture. The main crops grown in the area are cotton, corn, and tobacco. In addition, the town is home to a number of small businesses, including a general store, a blacksmith shop, a sawmill, and a gristmill.
Demographics
As of the 2010 census, the population of Bowman was 1,845. The racial makeup of the town was 79.3% African American, 19.2% White, 0.3% Native American, 0.2% Asian, and 0.9% from other races. The median household income was $25,938, and the median family income was $31,250.
Conclusion
Bowman, South Carolina is a small town located in Orangeburg County, South Carolina. It was founded in 1872 and is named after the Bowman family, who were among the first settlers in the area. The town is situated on the banks of the Edisto River, and the economy is largely based on agriculture. The population of Bowman was 1,845 as of the 2010 census, and the racial makeup of the town was 79.3% African American, 19.2% White, 0.3% Native American, 0.2% Asian, and 0.9% from other races.
Common Questions
What is Per Capita Income in Bowman?
Per Capita income in Bowman is $19,643.
What is the Median Family Income in Bowman?
Median Family Income in Bowman is $33,929.
What is the Median Household income in Bowman?
Median Household Income in Bowman is $33,250.
What is Income or Wage Gap in Bowman?
Income or Wage Gap in Bowman is 0.6%.
Women in Bowman earn 99.4 cents for every dollar earned by a man.
What is Inequality or Gini Index in Bowman?
Inequality or Gini Index in Bowman is 0.45.
What is the Total Population of Bowman?
Total Population of Bowman is 652.
What is the Total Male Population of Bowman?
Total Male Population of Bowman is 238.
What is the Total Female Population of Bowman?
Total Female Population of Bowman is 414.
What is the Ratio of Males per 100 Females in Bowman?
There are 57.49 Males per 100 Females in Bowman.
What is the Ratio of Females per 100 Males in Bowman?
There are 173.95 Females per 100 Males in Bowman.
What is the Median Population Age in Bowman?
Median Population Age in Bowman is 47.2 Years.
What is the Average Family Size in Bowman
Average Family Size in Bowman is 3.2 People.
What is the Average Household Size in Bowman
Average Household Size in Bowman is 2.2 People.
How Large is the Labor Force in Bowman?
There are 201 People in the Labor Forcein in Bowman.
What is the Percentage of People in the Labor Force in Bowman?
41.3% of People are in the Labor Force in Bowman.
What is the Unemployment Rate in Bowman?
Unemployment Rate in Bowman is 2.5%.