Brookeville, MD Map & Demographics
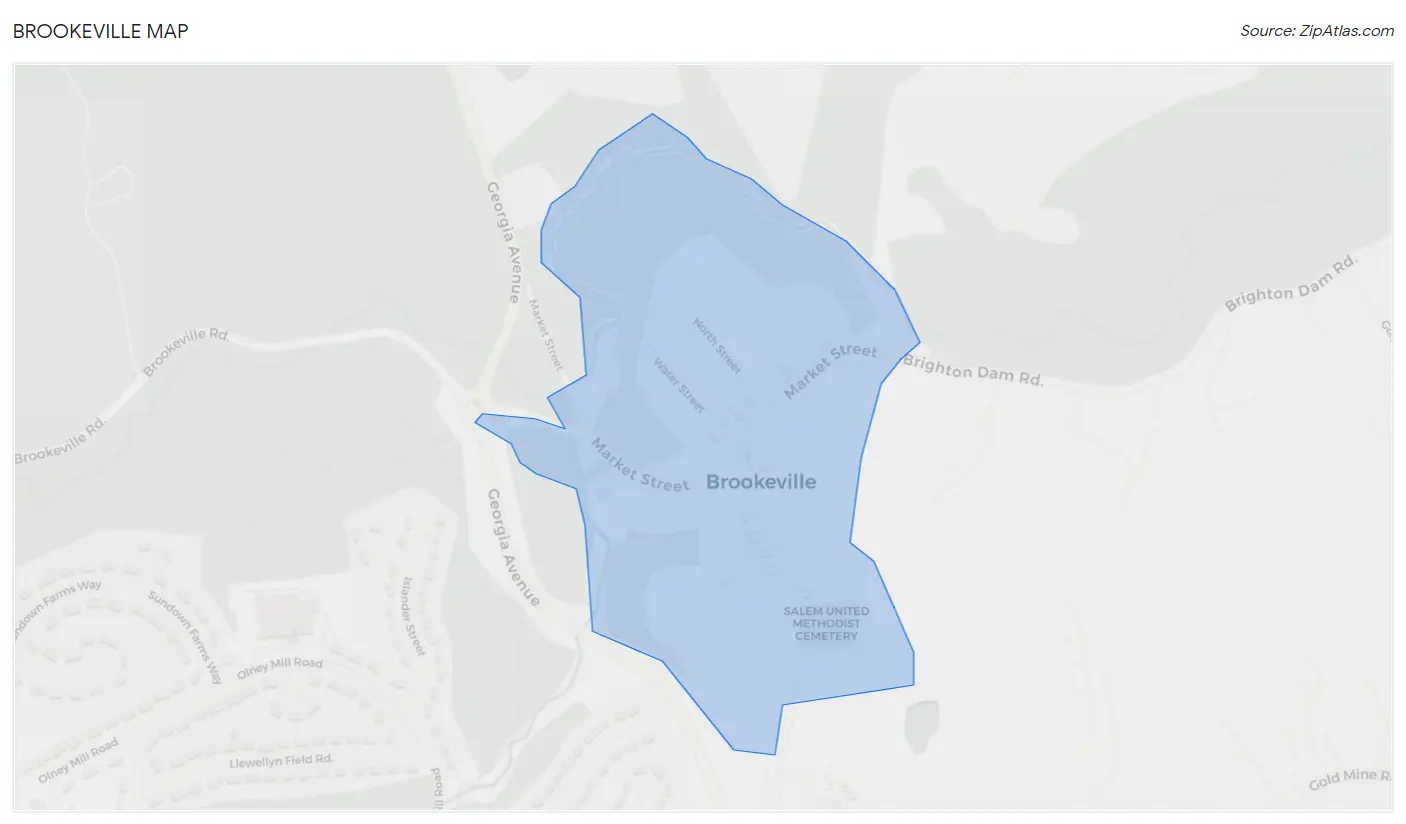
Brookeville Map
Brookeville Overview
$62,971
PER CAPITA INCOME
$188,750
AVG FAMILY INCOME
$182,188
AVG HOUSEHOLD INCOME
38.1%
WAGE / INCOME GAP [ % ]
61.9¢/ $1
WAGE / INCOME GAP [ $ ]
0.36
INEQUALITY / GINI INDEX
164
TOTAL POPULATION
80
MALE POPULATION
84
FEMALE POPULATION
95.24
MALES / 100 FEMALES
105.00
FEMALES / 100 MALES
41.3
MEDIAN AGE
3.2
AVG FAMILY SIZE
3.1
AVG HOUSEHOLD SIZE
99
LABOR FORCE [ PEOPLE ]
77.3%
PERCENT IN LABOR FORCE
Brookeville Zip Codes
Brookeville Area Codes
Income in Brookeville
Income Overview in Brookeville
Per Capita Income in Brookeville is $62,971, while median incomes of families and households are $188,750 and $182,188 respectively.
| Characteristic | Number | Measure |
| Per Capita Income | 164 | $62,971 |
| Median Family Income | 50 | $188,750 |
| Mean Family Income | 50 | $190,596 |
| Median Household Income | 53 | $182,188 |
| Mean Household Income | 53 | $183,651 |
| Income Deficit | 50 | $0 |
| Wage / Income Gap (%) | 164 | 38.10% |
| Wage / Income Gap ($) | 164 | 61.90¢ per $1 |
| Gini / Inequality Index | 164 | 0.36 |
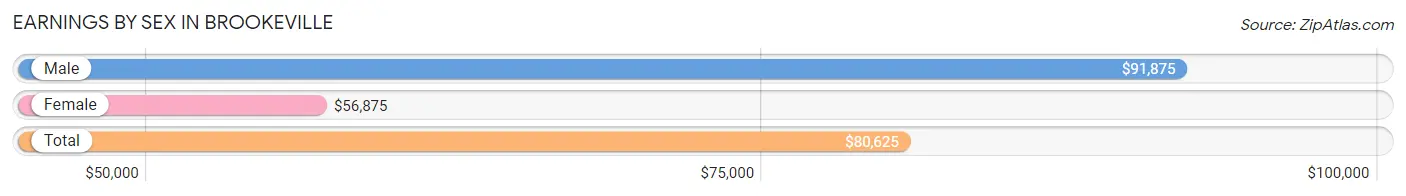
Earnings by Sex in Brookeville
Average Earnings in Brookeville are $80,625, $91,875 for men and $56,875 for women, a difference of 38.1%.
| Sex | Number | Average Earnings |
| Male | 52 (51.5%) | $91,875 |
| Female | 49 (48.5%) | $56,875 |
| Total | 101 (100.0%) | $80,625 |
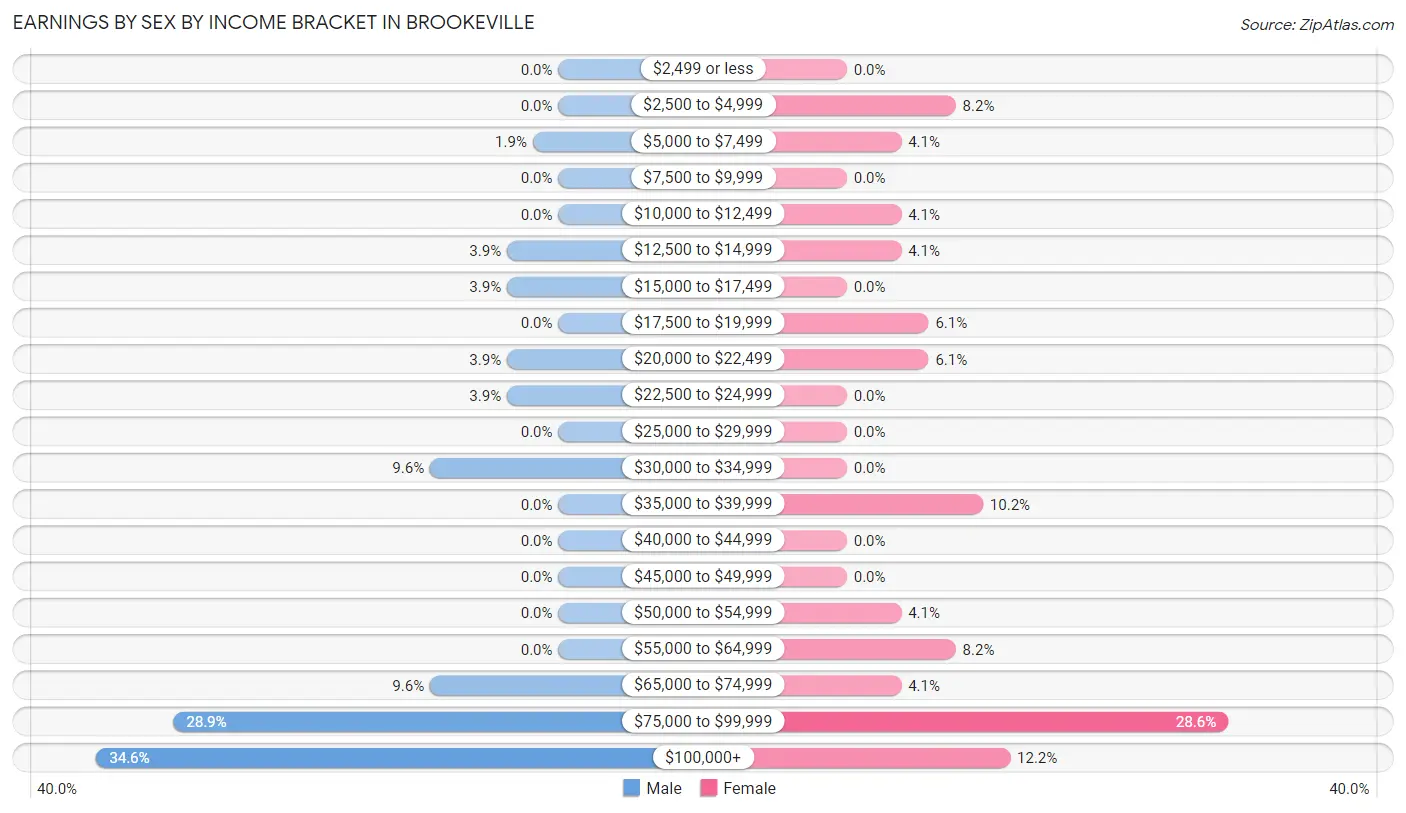
Earnings by Sex by Income Bracket in Brookeville
The most common earnings brackets in Brookeville are $100,000+ for men (18 | 34.6%) and $75,000 to $99,999 for women (14 | 28.6%).
| Income | Male | Female |
| $2,499 or less | 0 (0.0%) | 0 (0.0%) |
| $2,500 to $4,999 | 0 (0.0%) | 4 (8.2%) |
| $5,000 to $7,499 | 1 (1.9%) | 2 (4.1%) |
| $7,500 to $9,999 | 0 (0.0%) | 0 (0.0%) |
| $10,000 to $12,499 | 0 (0.0%) | 2 (4.1%) |
| $12,500 to $14,999 | 2 (3.8%) | 2 (4.1%) |
| $15,000 to $17,499 | 2 (3.8%) | 0 (0.0%) |
| $17,500 to $19,999 | 0 (0.0%) | 3 (6.1%) |
| $20,000 to $22,499 | 2 (3.8%) | 3 (6.1%) |
| $22,500 to $24,999 | 2 (3.8%) | 0 (0.0%) |
| $25,000 to $29,999 | 0 (0.0%) | 0 (0.0%) |
| $30,000 to $34,999 | 5 (9.6%) | 0 (0.0%) |
| $35,000 to $39,999 | 0 (0.0%) | 5 (10.2%) |
| $40,000 to $44,999 | 0 (0.0%) | 0 (0.0%) |
| $45,000 to $49,999 | 0 (0.0%) | 0 (0.0%) |
| $50,000 to $54,999 | 0 (0.0%) | 2 (4.1%) |
| $55,000 to $64,999 | 0 (0.0%) | 4 (8.2%) |
| $65,000 to $74,999 | 5 (9.6%) | 2 (4.1%) |
| $75,000 to $99,999 | 15 (28.8%) | 14 (28.6%) |
| $100,000+ | 18 (34.6%) | 6 (12.2%) |
| Total | 52 (100.0%) | 49 (100.0%) |
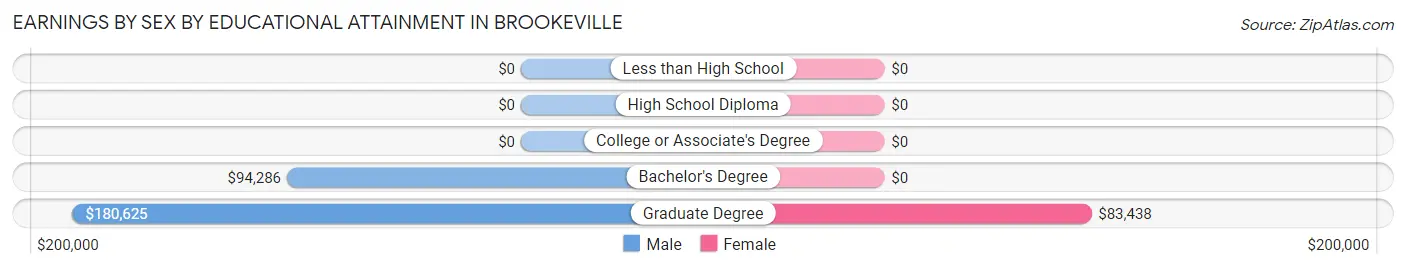
Earnings by Sex by Educational Attainment in Brookeville
Average earnings in Brookeville are $92,500 for men and $58,750 for women, a difference of 36.5%. Men with an educational attainment of graduate degree enjoy the highest average annual earnings of $180,625, while those with bachelor's degree education earn the least with $94,286. Women with an educational attainment of graduate degree earn the most with the average annual earnings of $83,438, while those with graduate degree education have the smallest earnings of $83,438.
| Educational Attainment | Male Income | Female Income |
| Less than High School | - | - |
| High School Diploma | - | - |
| College or Associate's Degree | - | - |
| Bachelor's Degree | $94,286 | $0 |
| Graduate Degree | $180,625 | $83,438 |
| Total | $92,500 | $58,750 |
Family Income in Brookeville
Family Income Brackets in Brookeville
According to the Brookeville family income data, there are 18 families falling into the $150,000 to $199,999 income range, which is the most common income bracket and makes up 36.0% of all families.
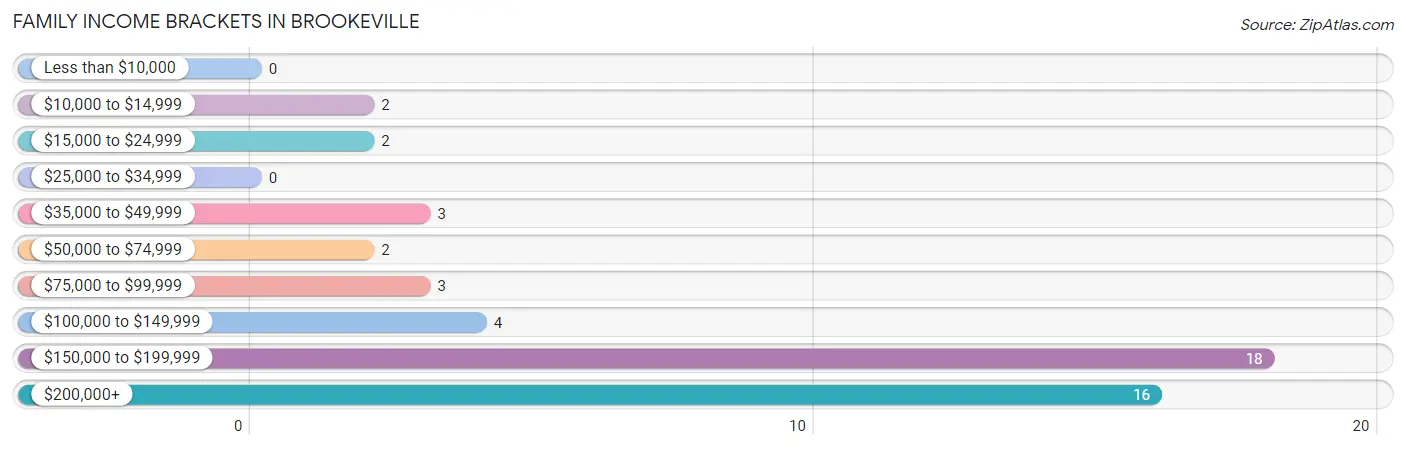
| Income Bracket | # Families | % Families |
| Less than $10,000 | 0 | 0.0% |
| $10,000 to $14,999 | 2 | 4.0% |
| $15,000 to $24,999 | 2 | 4.0% |
| $25,000 to $34,999 | 0 | 0.0% |
| $35,000 to $49,999 | 3 | 6.0% |
| $50,000 to $74,999 | 2 | 4.0% |
| $75,000 to $99,999 | 3 | 6.0% |
| $100,000 to $149,999 | 4 | 8.0% |
| $150,000 to $199,999 | 18 | 36.0% |
| $200,000+ | 16 | 32.0% |
Family Income by Famaliy Size in Brookeville
4-person families (6 | 12.0%) account for the highest median family income in Brookeville with $250,001 per family, while 3-person families (5 | 10.0%) have the highest median income of $71,458 per family member.
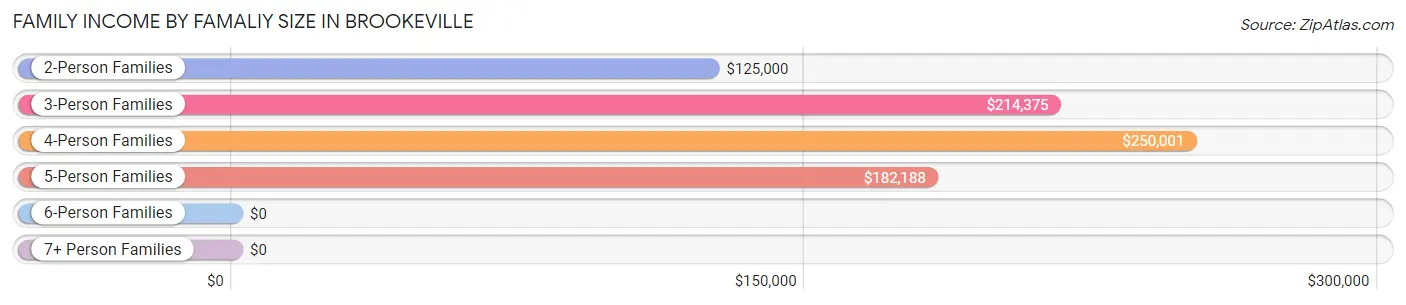
| Income Bracket | # Families | Median Income |
| 2-Person Families | 30 (60.0%) | $125,000 |
| 3-Person Families | 5 (10.0%) | $214,375 |
| 4-Person Families | 6 (12.0%) | $250,001 |
| 5-Person Families | 9 (18.0%) | $182,188 |
| 6-Person Families | 0 (0.0%) | $0 |
| 7+ Person Families | 0 (0.0%) | $0 |
| Total | 50 (100.0%) | $188,750 |
Family Income by Number of Earners in Brookeville
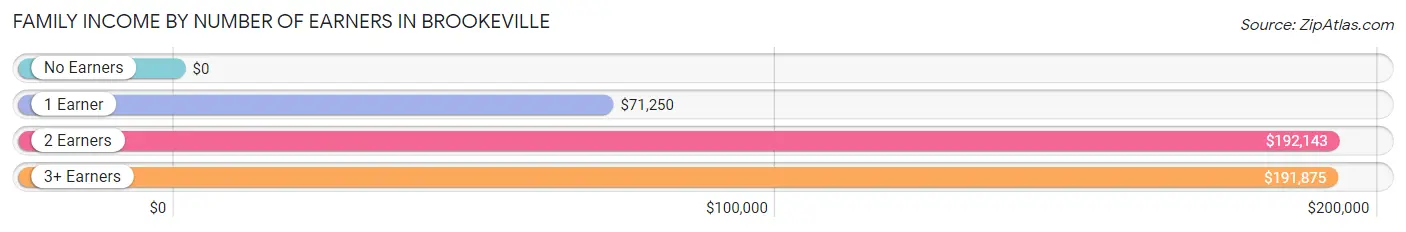
| Number of Earners | # Families | Median Income |
| No Earners | 7 (14.0%) | $0 |
| 1 Earner | 8 (16.0%) | $71,250 |
| 2 Earners | 30 (60.0%) | $192,143 |
| 3+ Earners | 5 (10.0%) | $191,875 |
| Total | 50 (100.0%) | $188,750 |
Household Income in Brookeville
Household Income Brackets in Brookeville
With 18 households falling in the category, the $150,000 to $199,999 income range is the most frequent in Brookeville, accounting for 34.0% of all households.
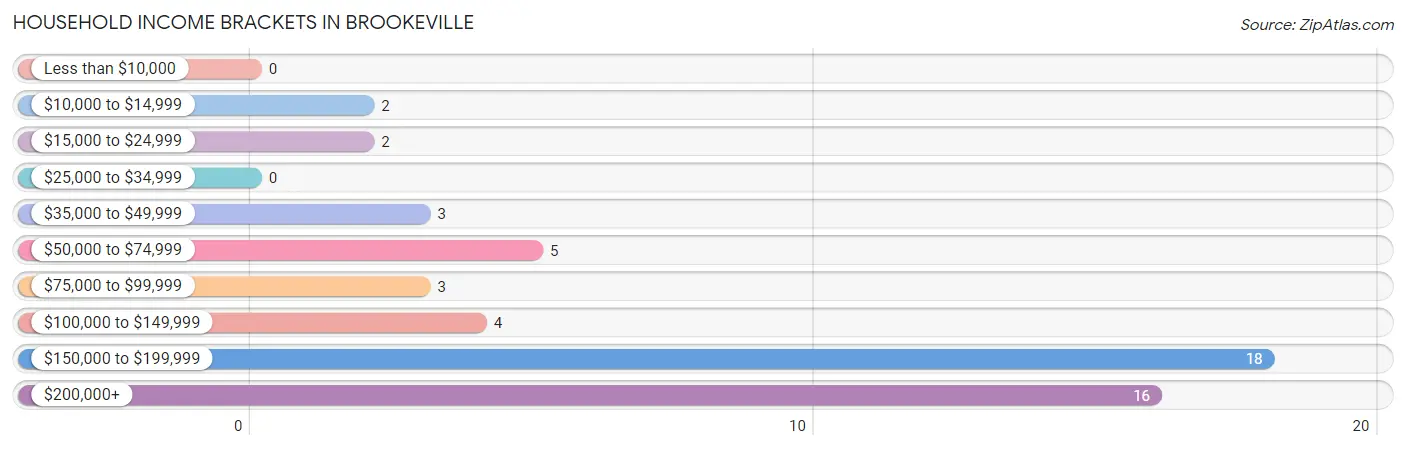
| Income Bracket | # Households | % Households |
| Less than $10,000 | 0 | 0.0% |
| $10,000 to $14,999 | 2 | 3.8% |
| $15,000 to $24,999 | 2 | 3.8% |
| $25,000 to $34,999 | 0 | 0.0% |
| $35,000 to $49,999 | 3 | 5.7% |
| $50,000 to $74,999 | 5 | 9.4% |
| $75,000 to $99,999 | 3 | 5.7% |
| $100,000 to $149,999 | 4 | 7.5% |
| $150,000 to $199,999 | 18 | 34.0% |
| $200,000+ | 16 | 30.2% |
Household Income by Householder Age in Brookeville
The median household income in Brookeville is $182,188, with the highest median household income of $192,321 found in the 25 to 44 years age bracket for the primary householder. A total of 15 households (28.3%) fall into this category.
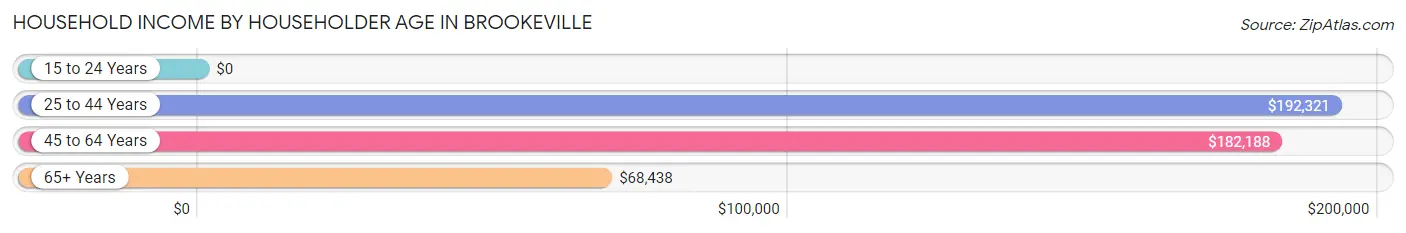
| Income Bracket | # Households | Median Income |
| 15 to 24 Years | 0 (0.0%) | $0 |
| 25 to 44 Years | 15 (28.3%) | $192,321 |
| 45 to 64 Years | 19 (35.8%) | $182,188 |
| 65+ Years | 19 (35.8%) | $68,438 |
| Total | 53 (100.0%) | $182,188 |
Poverty in Brookeville
Income Below Poverty by Sex and Age in Brookeville
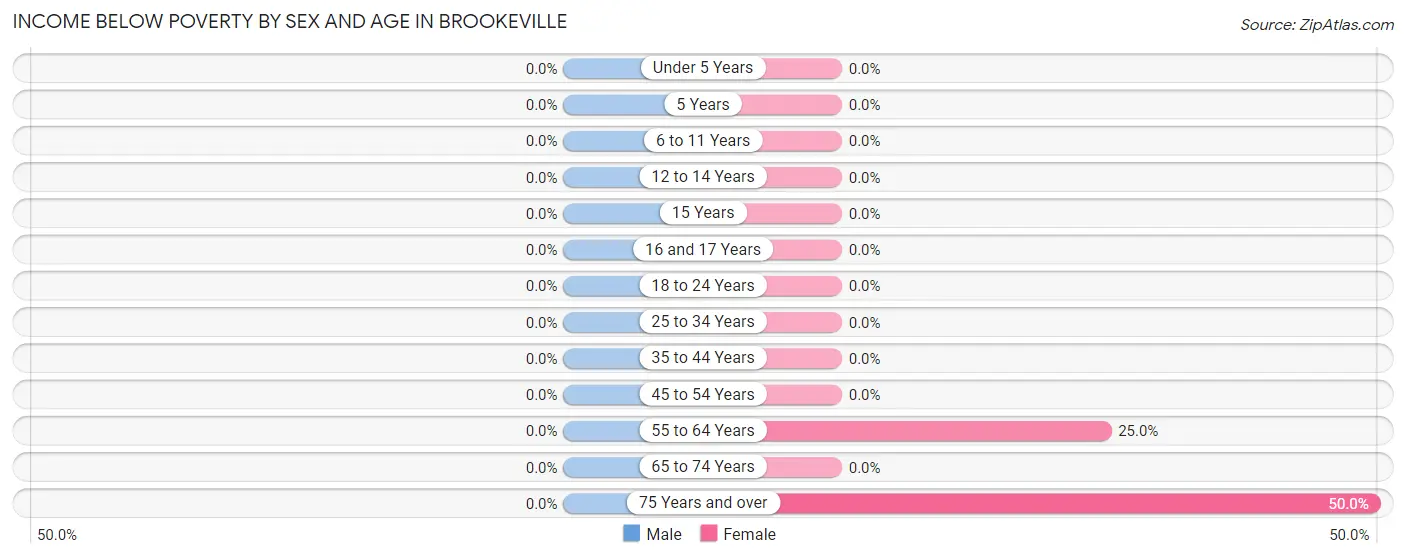
| Age Bracket | Male | Female |
| Under 5 Years | 0 (0.0%) | 0 (0.0%) |
| 5 Years | 0 (0.0%) | 0 (0.0%) |
| 6 to 11 Years | 0 (0.0%) | 0 (0.0%) |
| 12 to 14 Years | 0 (0.0%) | 0 (0.0%) |
| 15 Years | 0 (0.0%) | 0 (0.0%) |
| 16 and 17 Years | 0 (0.0%) | 0 (0.0%) |
| 18 to 24 Years | 0 (0.0%) | 0 (0.0%) |
| 25 to 34 Years | 0 (0.0%) | 0 (0.0%) |
| 35 to 44 Years | 0 (0.0%) | 0 (0.0%) |
| 45 to 54 Years | 0 (0.0%) | 0 (0.0%) |
| 55 to 64 Years | 0 (0.0%) | 4 (25.0%) |
| 65 to 74 Years | 0 (0.0%) | 0 (0.0%) |
| 75 Years and over | 0 (0.0%) | 4 (50.0%) |
| Total | 0 (0.0%) | 8 (9.5%) |
Income Above Poverty by Sex and Age in Brookeville
According to the poverty statistics in Brookeville, males aged under 5 years and females aged under 5 years are the age groups that are most secure financially, with 100.0% of males and 100.0% of females in these age groups living above the poverty line.
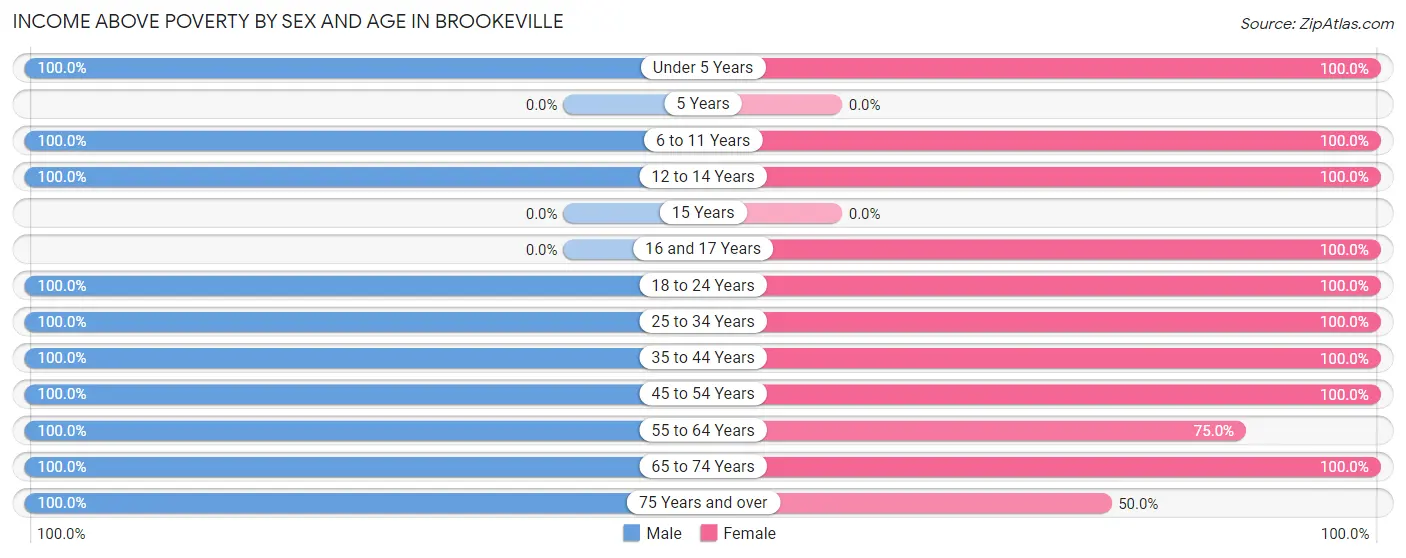
| Age Bracket | Male | Female |
| Under 5 Years | 2 (100.0%) | 3 (100.0%) |
| 5 Years | 0 (0.0%) | 0 (0.0%) |
| 6 to 11 Years | 18 (100.0%) | 7 (100.0%) |
| 12 to 14 Years | 2 (100.0%) | 4 (100.0%) |
| 15 Years | 0 (0.0%) | 0 (0.0%) |
| 16 and 17 Years | 0 (0.0%) | 1 (100.0%) |
| 18 to 24 Years | 2 (100.0%) | 3 (100.0%) |
| 25 to 34 Years | 13 (100.0%) | 15 (100.0%) |
| 35 to 44 Years | 8 (100.0%) | 12 (100.0%) |
| 45 to 54 Years | 10 (100.0%) | 8 (100.0%) |
| 55 to 64 Years | 15 (100.0%) | 12 (75.0%) |
| 65 to 74 Years | 5 (100.0%) | 7 (100.0%) |
| 75 Years and over | 5 (100.0%) | 4 (50.0%) |
| Total | 80 (100.0%) | 76 (90.5%) |
Income Below Poverty Among Married-Couple Families in Brookeville
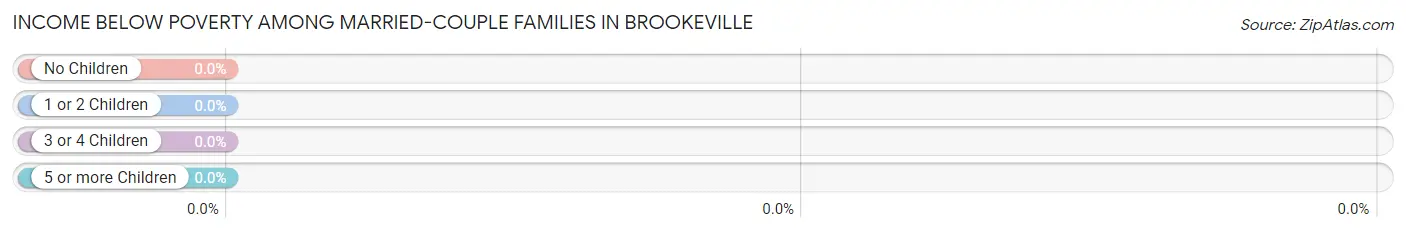
| Children | Above Poverty | Below Poverty |
| No Children | 21 (100.0%) | 0 (0.0%) |
| 1 or 2 Children | 10 (100.0%) | 0 (0.0%) |
| 3 or 4 Children | 6 (100.0%) | 0 (0.0%) |
| 5 or more Children | 0 (0.0%) | 0 (0.0%) |
| Total | 37 (100.0%) | 0 (0.0%) |
Income Below Poverty Among Single-Parent Households in Brookeville
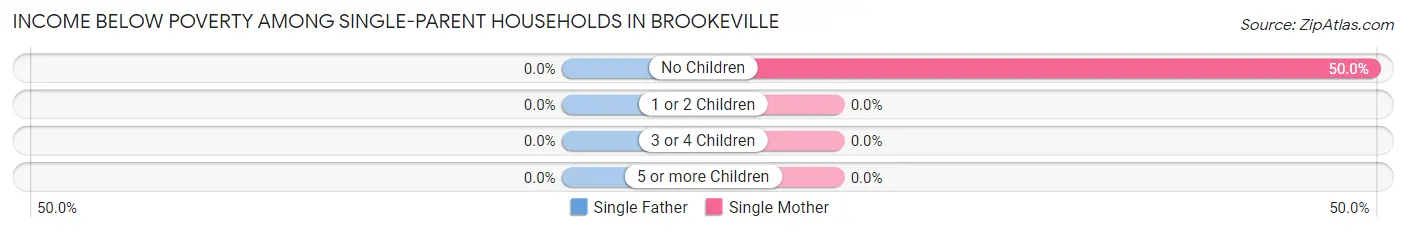
| Children | Single Father | Single Mother |
| No Children | 0 (0.0%) | 4 (50.0%) |
| 1 or 2 Children | 0 (0.0%) | 0 (0.0%) |
| 3 or 4 Children | 0 (0.0%) | 0 (0.0%) |
| 5 or more Children | 0 (0.0%) | 0 (0.0%) |
| Total | 0 (0.0%) | 4 (50.0%) |
Income Below Poverty Among Married-Couple vs Single-Parent Households in Brookeville
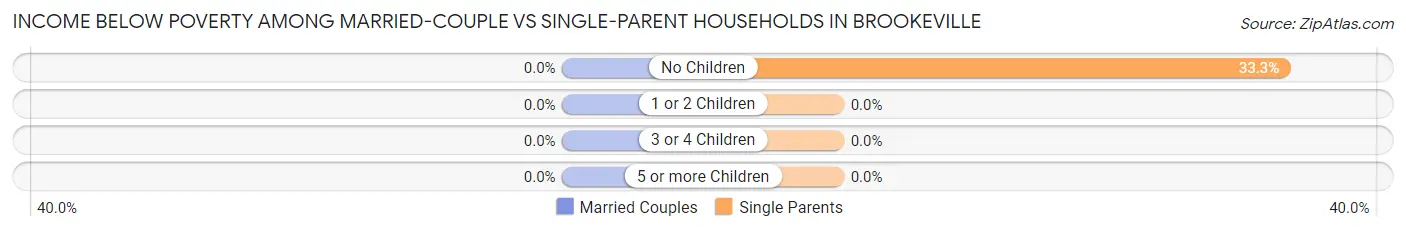
| Children | Married-Couple Families | Single-Parent Households |
| No Children | 0 (0.0%) | 4 (33.3%) |
| 1 or 2 Children | 0 (0.0%) | 0 (0.0%) |
| 3 or 4 Children | 0 (0.0%) | 0 (0.0%) |
| 5 or more Children | 0 (0.0%) | 0 (0.0%) |
| Total | 0 (0.0%) | 4 (30.8%) |
Race in Brookeville
The most populous races in Brookeville are White / Caucasian (162 | 98.8%), and Two or more Races (2 | 1.2%).
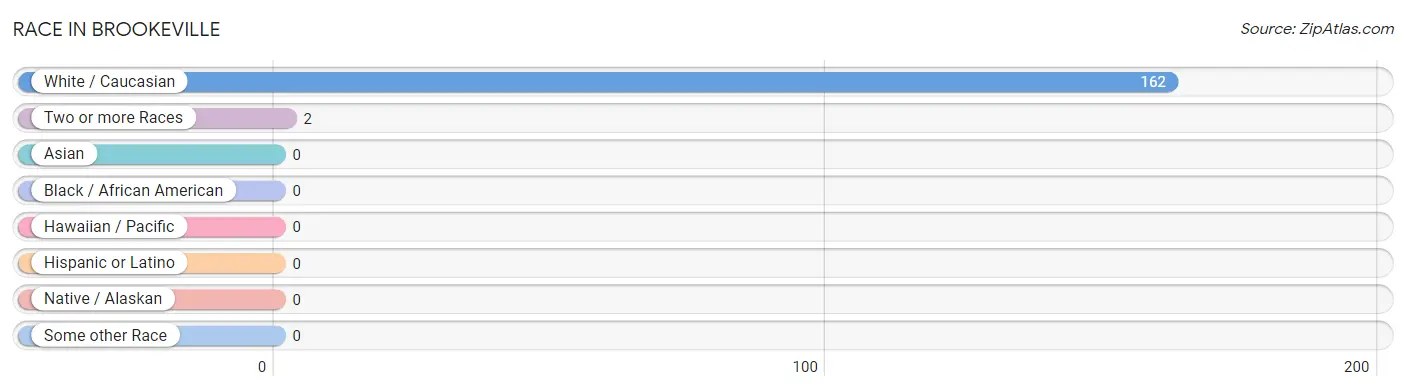
| Race | # Population | % Population |
| Asian | 0 | 0.0% |
| Black / African American | 0 | 0.0% |
| Hawaiian / Pacific | 0 | 0.0% |
| Hispanic or Latino | 0 | 0.0% |
| Native / Alaskan | 0 | 0.0% |
| White / Caucasian | 162 | 98.8% |
| Two or more Races | 2 | 1.2% |
| Some other Race | 0 | 0.0% |
| Total | 164 | 100.0% |
Ancestry in Brookeville
The most populous ancestries reported in Brookeville are European (25 | 15.2%), English (22 | 13.4%), Irish (17 | 10.4%), American (14 | 8.5%), and French (14 | 8.5%), together accounting for 56.1% of all Brookeville residents.
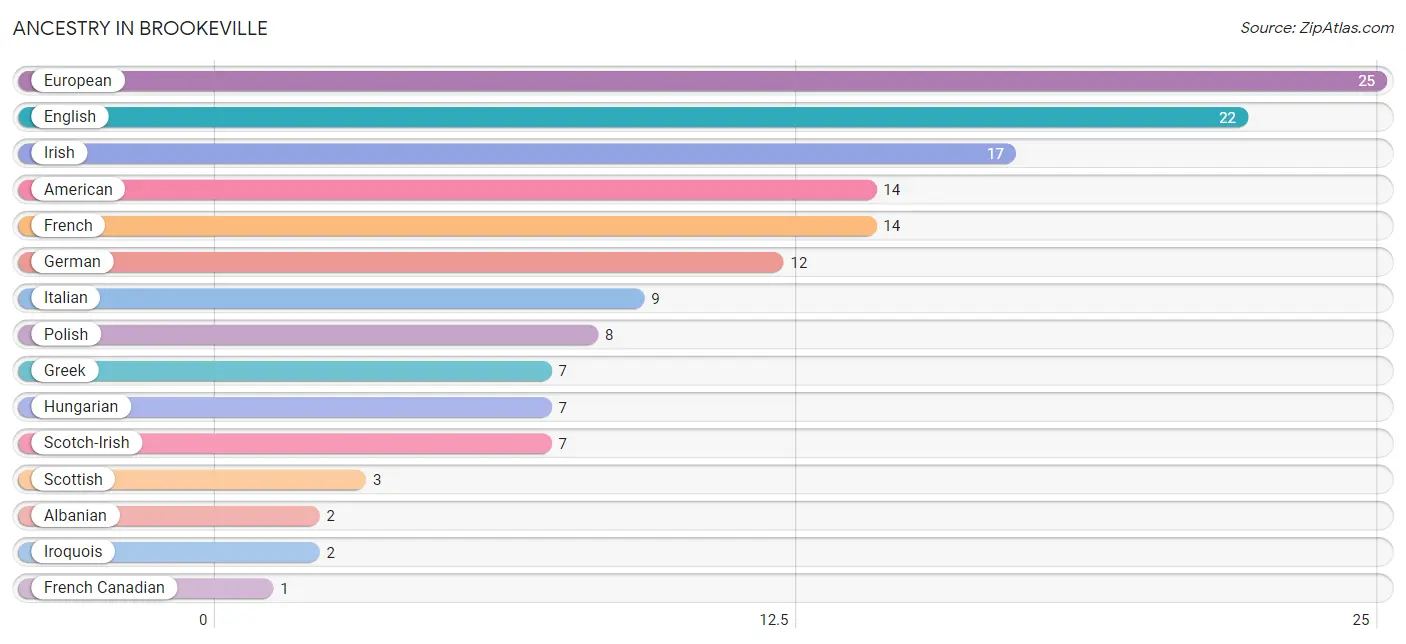
| Ancestry | # Population | % Population |
| Albanian | 2 | 1.2% |
| American | 14 | 8.5% |
| English | 22 | 13.4% |
| European | 25 | 15.2% |
| French | 14 | 8.5% |
| French Canadian | 1 | 0.6% |
| German | 12 | 7.3% |
| Greek | 7 | 4.3% |
| Hungarian | 7 | 4.3% |
| Irish | 17 | 10.4% |
| Iroquois | 2 | 1.2% |
| Italian | 9 | 5.5% |
| Polish | 8 | 4.9% |
| Russian | 1 | 0.6% |
| Scotch-Irish | 7 | 4.3% |
| Scottish | 3 | 1.8% |
| Swedish | 1 | 0.6% | View All 17 Rows |
Immigrants in Brookeville
The most numerous immigrant groups reported in Brookeville came from , and Canada (1 | 0.6%), together accounting for 0.6% of all Brookeville residents.

| Immigration Origin | # Population | % Population |
| Canada | 1 | 0.6% | View All 1 Rows |
Sex and Age in Brookeville
Sex and Age in Brookeville
The most populous age groups in Brookeville are 5 to 9 Years (14 | 17.5%) for men and 25 to 29 Years (12 | 14.3%) for women.
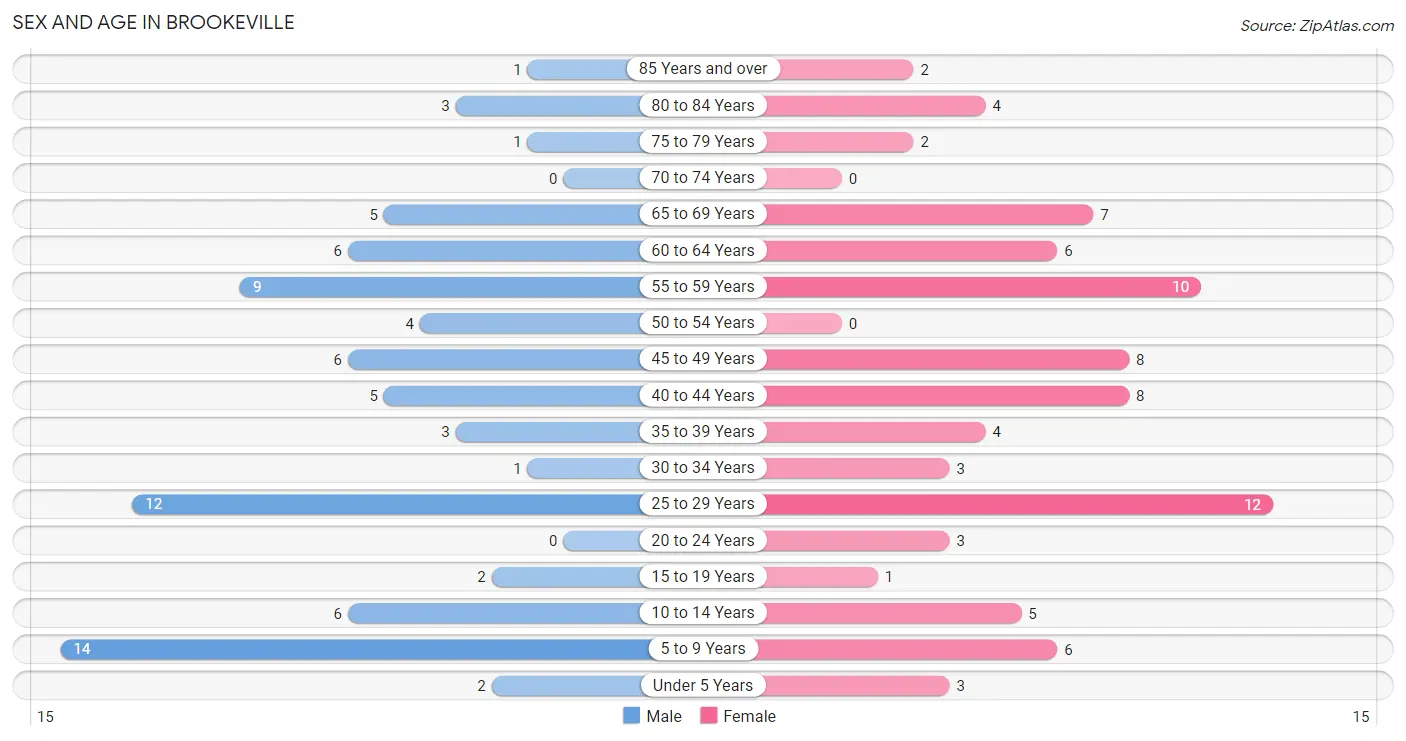
| Age Bracket | Male | Female |
| Under 5 Years | 2 (2.5%) | 3 (3.6%) |
| 5 to 9 Years | 14 (17.5%) | 6 (7.1%) |
| 10 to 14 Years | 6 (7.5%) | 5 (5.9%) |
| 15 to 19 Years | 2 (2.5%) | 1 (1.2%) |
| 20 to 24 Years | 0 (0.0%) | 3 (3.6%) |
| 25 to 29 Years | 12 (15.0%) | 12 (14.3%) |
| 30 to 34 Years | 1 (1.3%) | 3 (3.6%) |
| 35 to 39 Years | 3 (3.7%) | 4 (4.8%) |
| 40 to 44 Years | 5 (6.2%) | 8 (9.5%) |
| 45 to 49 Years | 6 (7.5%) | 8 (9.5%) |
| 50 to 54 Years | 4 (5.0%) | 0 (0.0%) |
| 55 to 59 Years | 9 (11.3%) | 10 (11.9%) |
| 60 to 64 Years | 6 (7.5%) | 6 (7.1%) |
| 65 to 69 Years | 5 (6.2%) | 7 (8.3%) |
| 70 to 74 Years | 0 (0.0%) | 0 (0.0%) |
| 75 to 79 Years | 1 (1.3%) | 2 (2.4%) |
| 80 to 84 Years | 3 (3.7%) | 4 (4.8%) |
| 85 Years and over | 1 (1.3%) | 2 (2.4%) |
| Total | 80 (100.0%) | 84 (100.0%) |
Families and Households in Brookeville
Median Family Size in Brookeville
The median family size in Brookeville is 3.18 persons per family, with married-couple families (37 | 74.0%) accounting for the largest median family size of 3.46 persons per family. On the other hand, single female/mother families (8 | 16.0%) represent the smallest median family size with 2.13 persons per family.
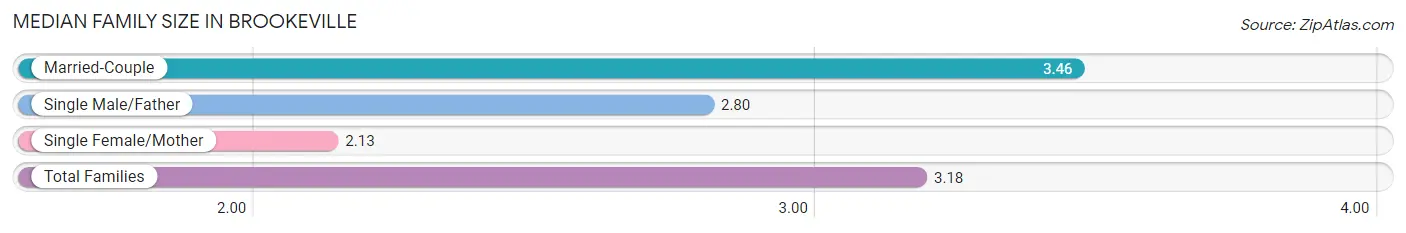
| Family Type | # Families | Family Size |
| Married-Couple | 37 (74.0%) | 3.46 |
| Single Male/Father | 5 (10.0%) | 2.80 |
| Single Female/Mother | 8 (16.0%) | 2.13 |
| Total Families | 50 (100.0%) | 3.18 |
Median Household Size in Brookeville
The median household size in Brookeville is 3.09 persons per household, with married-couple households (37 | 69.8%) accounting for the largest median household size of 3.46 persons per household. non-family households (3 | 5.7%) represent the smallest median household size with 1.67 persons per household.
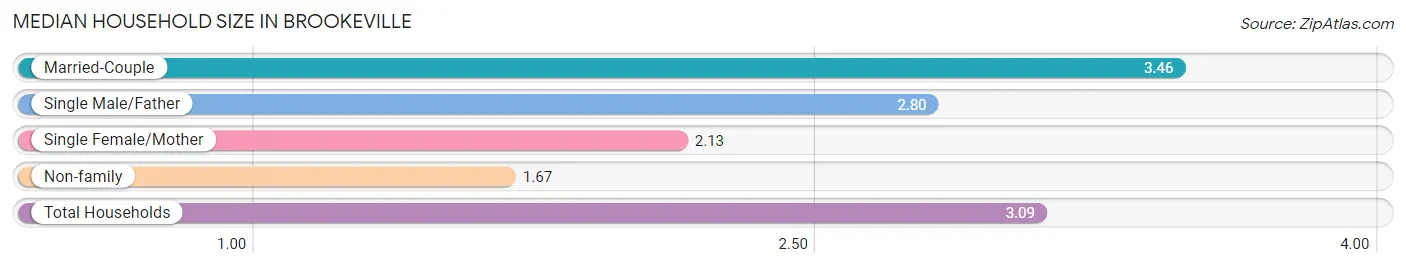
| Household Type | # Households | Household Size |
| Married-Couple | 37 (69.8%) | 3.46 |
| Single Male/Father | 5 (9.4%) | 2.80 |
| Single Female/Mother | 8 (15.1%) | 2.13 |
| Non-family | 3 (5.7%) | 1.67 |
| Total Households | 53 (100.0%) | 3.09 |
Household Size by Marriage Status in Brookeville
Out of a total of 53 households in Brookeville, 50 (94.3%) are family households, while 3 (5.7%) are nonfamily households. The most numerous type of family households are 2-person households, comprising 30, and the most common type of nonfamily households are 2-person households, comprising 3.
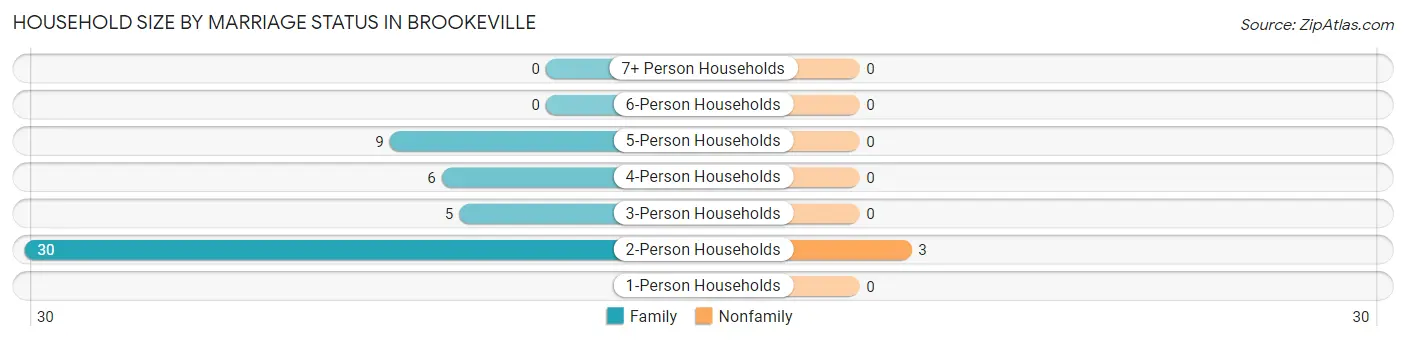
| Household Size | Family Households | Nonfamily Households |
| 1-Person Households | - | 0 (0.0%) |
| 2-Person Households | 30 (56.6%) | 3 (5.7%) |
| 3-Person Households | 5 (9.4%) | 0 (0.0%) |
| 4-Person Households | 6 (11.3%) | 0 (0.0%) |
| 5-Person Households | 9 (17.0%) | 0 (0.0%) |
| 6-Person Households | 0 (0.0%) | 0 (0.0%) |
| 7+ Person Households | 0 (0.0%) | 0 (0.0%) |
| Total | 50 (94.3%) | 3 (5.7%) |
Female Fertility in Brookeville
Fertility by Age in Brookeville
Average fertility rate in Brookeville is 51.0 births per 1,000 women. Women in the age bracket of 20 to 34 years have the highest fertility rate with 111.0 births per 1,000 women. Women in the age bracket of 20 to 34 years acount for 100.0% of all women with births.
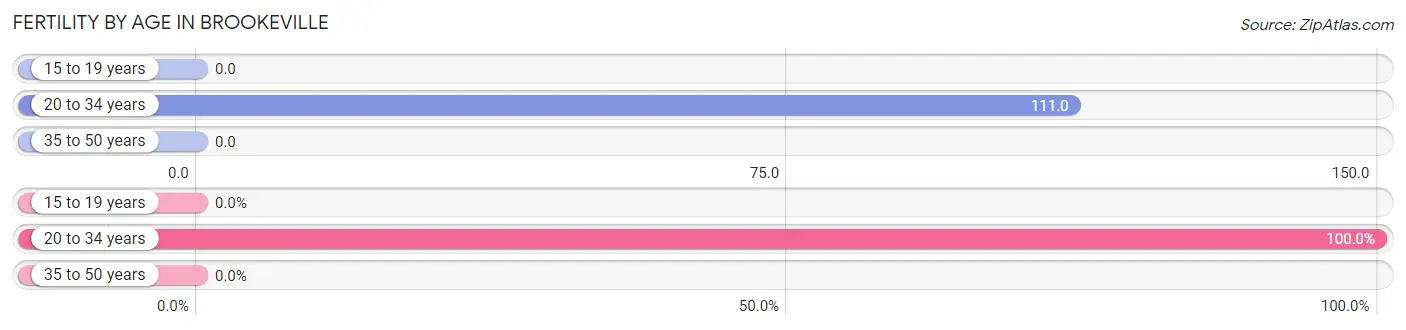
| Age Bracket | Women with Births | Births / 1,000 Women |
| 15 to 19 years | 0 (0.0%) | 0.0 |
| 20 to 34 years | 2 (100.0%) | 111.0 |
| 35 to 50 years | 0 (0.0%) | 0.0 |
| Total | 2 (100.0%) | 51.0 |
Fertility by Age by Marriage Status in Brookeville
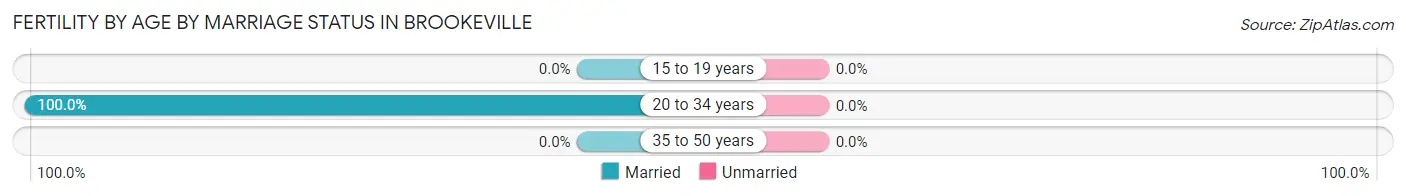
| Age Bracket | Married | Unmarried |
| 15 to 19 years | 0 (0.0%) | 0 (0.0%) |
| 20 to 34 years | 2 (100.0%) | 0 (0.0%) |
| 35 to 50 years | 0 (0.0%) | 0 (0.0%) |
| Total | 2 (100.0%) | 0 (0.0%) |
Fertility by Education in Brookeville
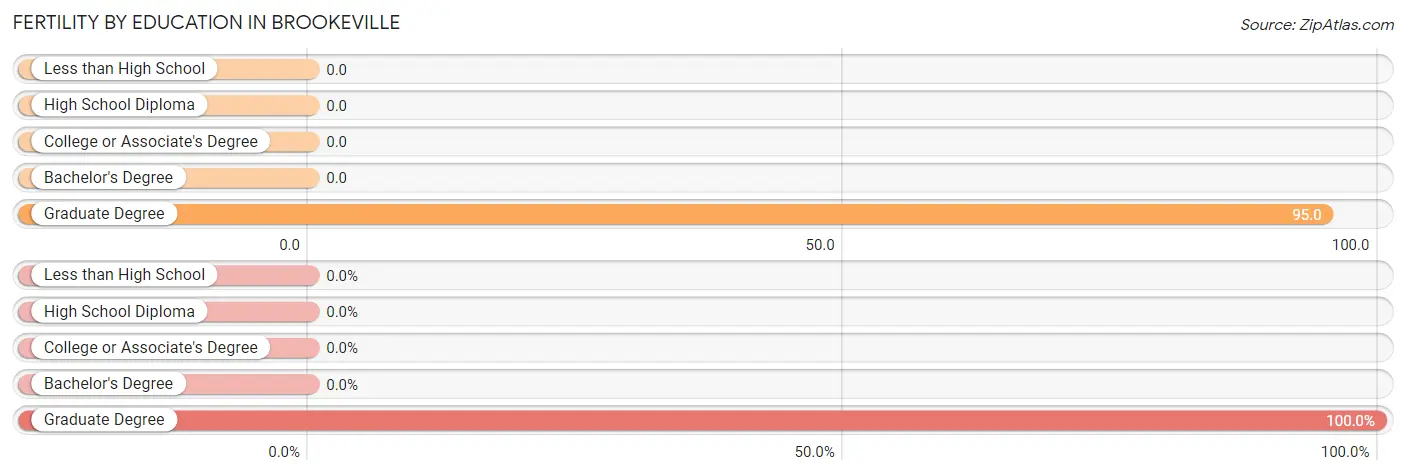
| Educational Attainment | Women with Births | Births / 1,000 Women |
| Less than High School | 0 (0.0%) | 0.0 |
| High School Diploma | 0 (0.0%) | 0.0 |
| College or Associate's Degree | 0 (0.0%) | 0.0 |
| Bachelor's Degree | 0 (0.0%) | 0.0 |
| Graduate Degree | 2 (100.0%) | 95.0 |
| Total | 2 (100.0%) | 51.0 |
Fertility by Education by Marriage Status in Brookeville
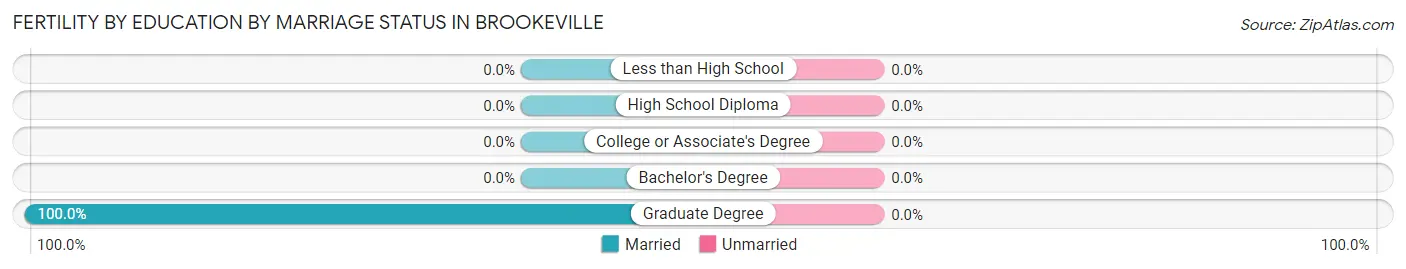
| Educational Attainment | Married | Unmarried |
| Less than High School | 0 (0.0%) | 0 (0.0%) |
| High School Diploma | 0 (0.0%) | 0 (0.0%) |
| College or Associate's Degree | 0 (0.0%) | 0 (0.0%) |
| Bachelor's Degree | 0 (0.0%) | 0 (0.0%) |
| Graduate Degree | 2 (100.0%) | 0 (0.0%) |
| Total | 2 (100.0%) | 0 (0.0%) |
Employment Characteristics in Brookeville
Employment by Class of Employer in Brookeville
Among the 91 employed individuals in Brookeville, private company employees (51 | 56.0%), not-for-profit organizations (13 | 14.3%), and self-employed (not incorporated) (8 | 8.8%) make up the most common classes of employment.
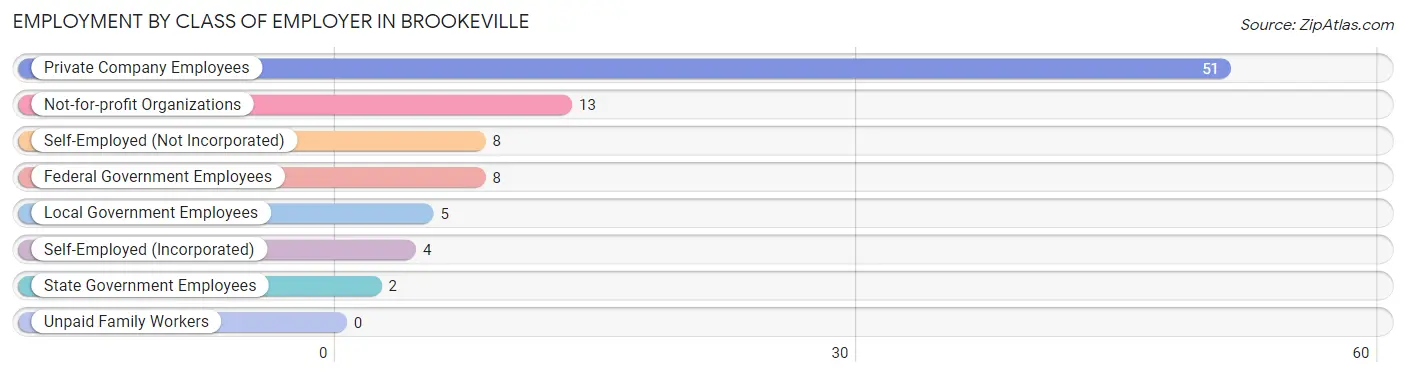
| Employer Class | # Employees | % Employees |
| Private Company Employees | 51 | 56.0% |
| Self-Employed (Incorporated) | 4 | 4.4% |
| Self-Employed (Not Incorporated) | 8 | 8.8% |
| Not-for-profit Organizations | 13 | 14.3% |
| Local Government Employees | 5 | 5.5% |
| State Government Employees | 2 | 2.2% |
| Federal Government Employees | 8 | 8.8% |
| Unpaid Family Workers | 0 | 0.0% |
| Total | 91 | 100.0% |
Employment Status by Age in Brookeville
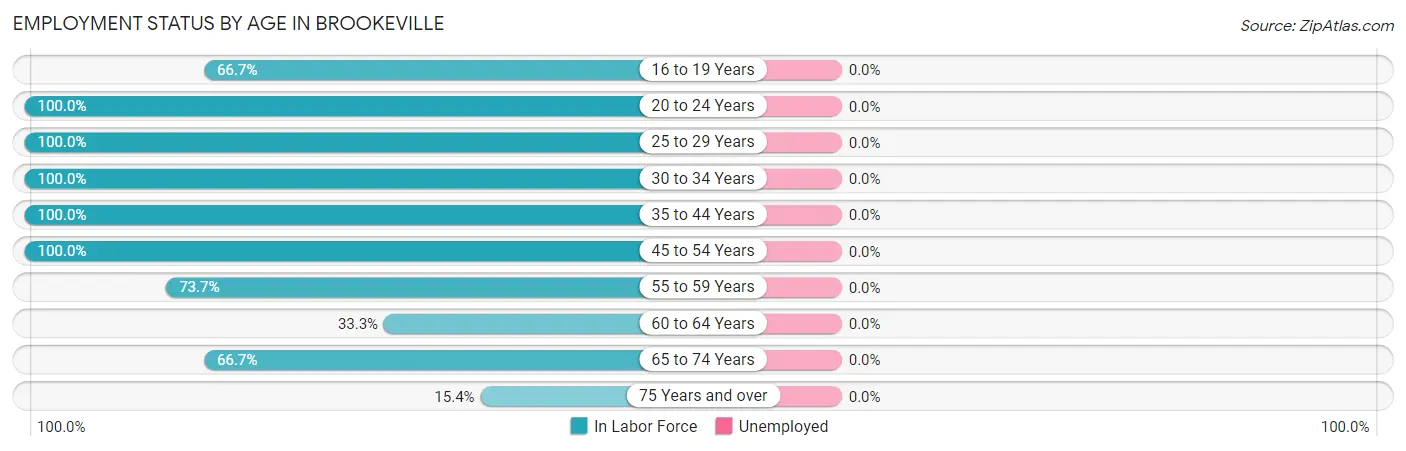
| Age Bracket | In Labor Force | Unemployed |
| 16 to 19 Years | 2 (66.7%) | 0 (0.0%) |
| 20 to 24 Years | 3 (100.0%) | 0 (0.0%) |
| 25 to 29 Years | 24 (100.0%) | 0 (0.0%) |
| 30 to 34 Years | 4 (100.0%) | 0 (0.0%) |
| 35 to 44 Years | 20 (100.0%) | 0 (0.0%) |
| 45 to 54 Years | 18 (100.0%) | 0 (0.0%) |
| 55 to 59 Years | 14 (73.7%) | 0 (0.0%) |
| 60 to 64 Years | 4 (33.3%) | 0 (0.0%) |
| 65 to 74 Years | 8 (66.7%) | 0 (0.0%) |
| 75 Years and over | 2 (15.4%) | 0 (0.0%) |
| Total | 99 (77.3%) | 0 (0.0%) |
Employment Status by Educational Attainment in Brookeville
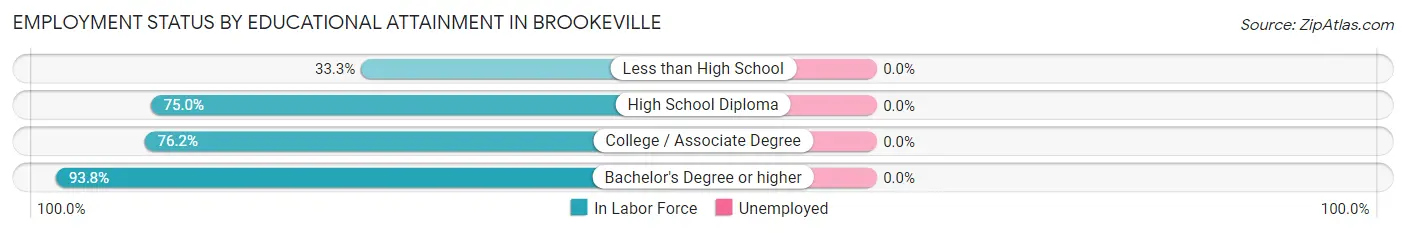
| Educational Attainment | In Labor Force | Unemployed |
| Less than High School | 1 (33.3%) | 0 (0.0%) |
| High School Diploma | 6 (75.0%) | 0 (0.0%) |
| College / Associate Degree | 16 (76.2%) | 0 (0.0%) |
| Bachelor's Degree or higher | 61 (93.8%) | 0 (0.0%) |
| Total | 84 (86.6%) | 0 (0.0%) |
Employment Occupations by Sex in Brookeville
Management, Business, Science and Arts Occupations
The most common Management, Business, Science and Arts occupations in Brookeville are Community & Social Service (22 | 22.2%), Business & Financial (21 | 21.2%), Education Instruction & Library (16 | 16.2%), Management (15 | 15.1%), and Health Diagnosing & Treating (12 | 12.1%).
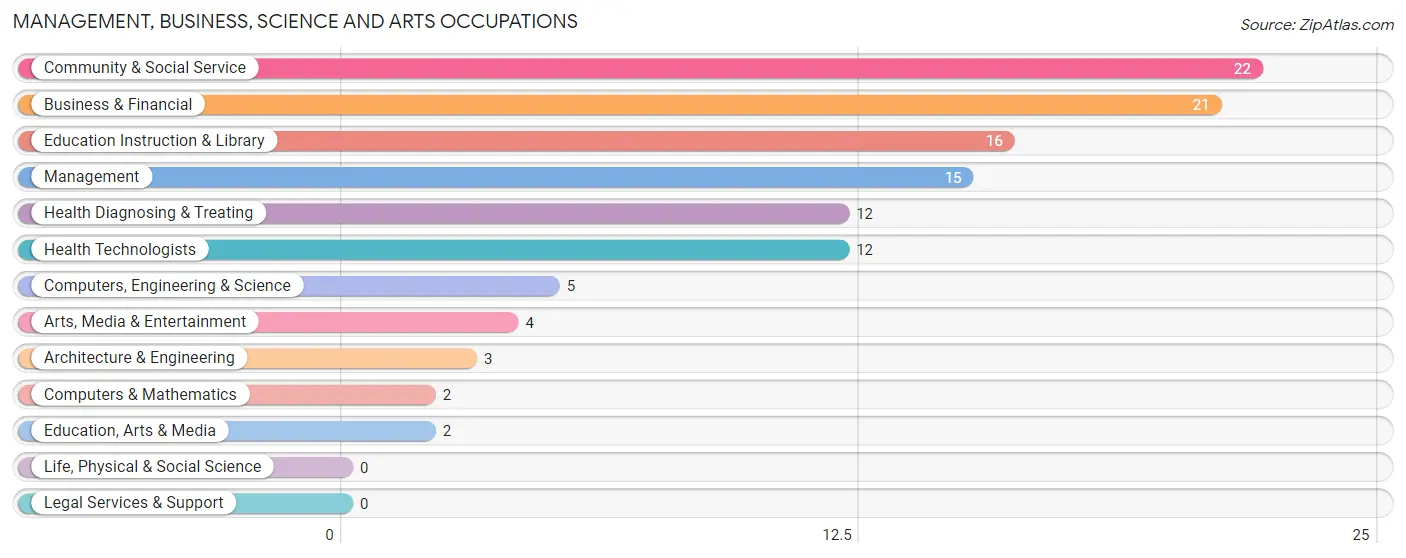
Management, Business, Science and Arts Occupations by Sex
Within the Management, Business, Science and Arts occupations in Brookeville, the most male-oriented occupations are Architecture & Engineering (100.0%), Management (86.7%), and Computers, Engineering & Science (60.0%), while the most female-oriented occupations are Computers & Mathematics (100.0%), Education, Arts & Media (100.0%), and Health Diagnosing & Treating (100.0%).
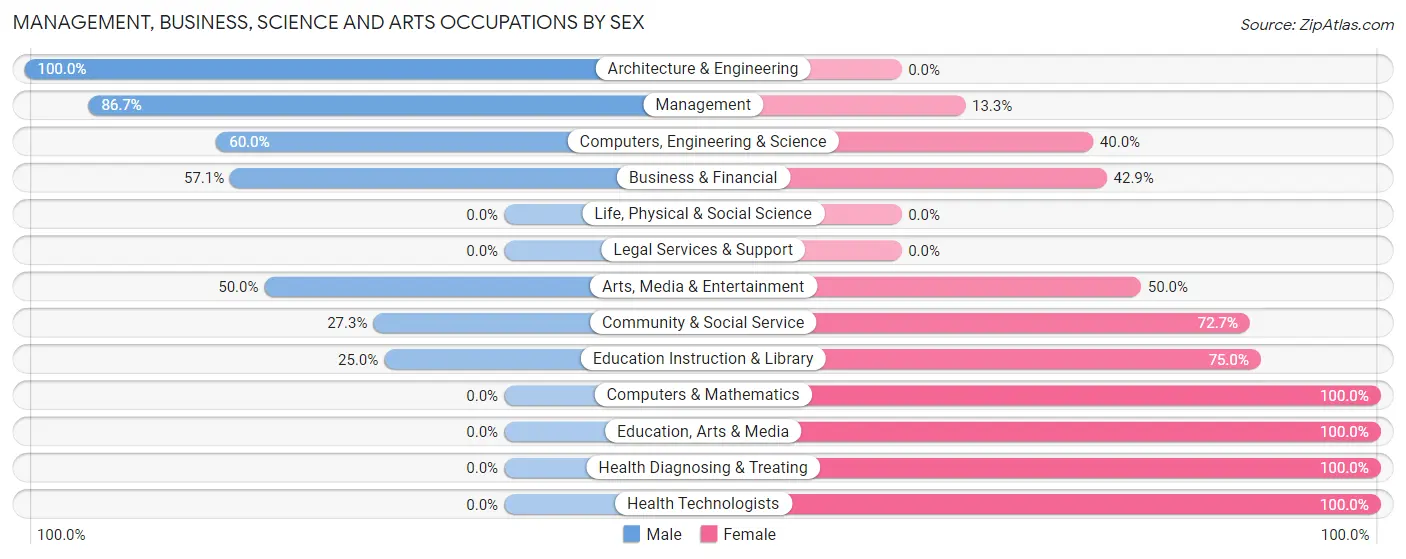
| Occupation | Male | Female |
| Management | 13 (86.7%) | 2 (13.3%) |
| Business & Financial | 12 (57.1%) | 9 (42.9%) |
| Computers, Engineering & Science | 3 (60.0%) | 2 (40.0%) |
| Computers & Mathematics | 0 (0.0%) | 2 (100.0%) |
| Architecture & Engineering | 3 (100.0%) | 0 (0.0%) |
| Life, Physical & Social Science | 0 (0.0%) | 0 (0.0%) |
| Community & Social Service | 6 (27.3%) | 16 (72.7%) |
| Education, Arts & Media | 0 (0.0%) | 2 (100.0%) |
| Legal Services & Support | 0 (0.0%) | 0 (0.0%) |
| Education Instruction & Library | 4 (25.0%) | 12 (75.0%) |
| Arts, Media & Entertainment | 2 (50.0%) | 2 (50.0%) |
| Health Diagnosing & Treating | 0 (0.0%) | 12 (100.0%) |
| Health Technologists | 0 (0.0%) | 12 (100.0%) |
| Total (Category) | 34 (45.3%) | 41 (54.7%) |
| Total (Overall) | 50 (50.5%) | 49 (49.5%) |
Services Occupations
The most common Services occupations in Brookeville are Security & Protection (2 | 2.0%), and Law Enforcement (2 | 2.0%).
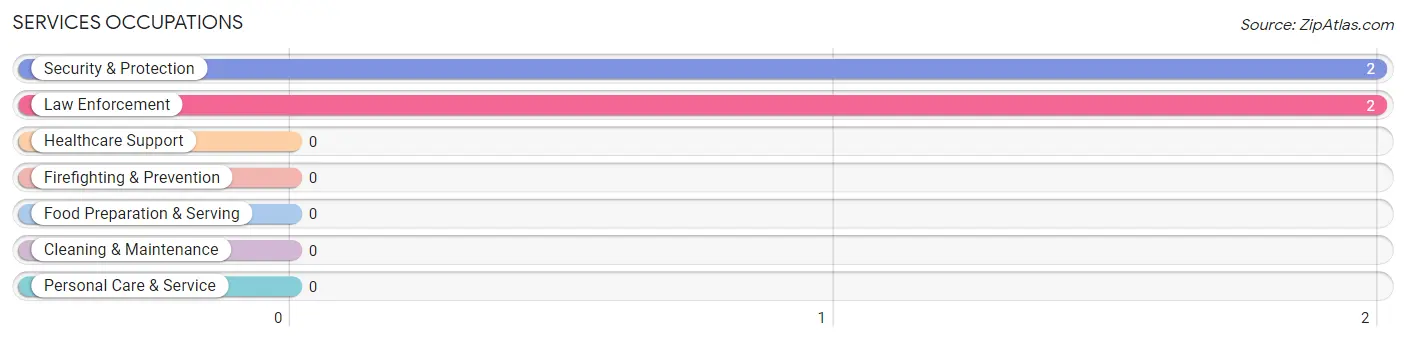
Services Occupations by Sex
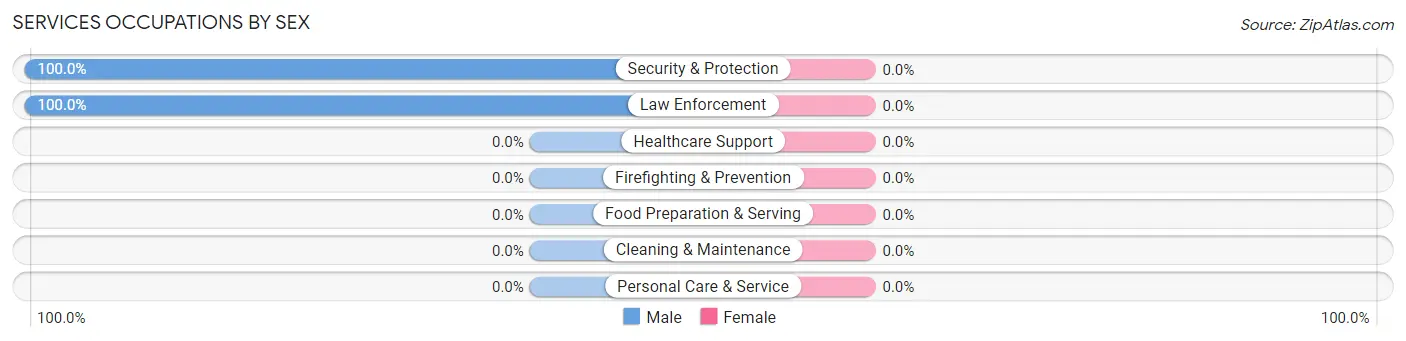
| Occupation | Male | Female |
| Healthcare Support | 0 (0.0%) | 0 (0.0%) |
| Security & Protection | 2 (100.0%) | 0 (0.0%) |
| Firefighting & Prevention | 0 (0.0%) | 0 (0.0%) |
| Law Enforcement | 2 (100.0%) | 0 (0.0%) |
| Food Preparation & Serving | 0 (0.0%) | 0 (0.0%) |
| Cleaning & Maintenance | 0 (0.0%) | 0 (0.0%) |
| Personal Care & Service | 0 (0.0%) | 0 (0.0%) |
| Total (Category) | 2 (100.0%) | 0 (0.0%) |
| Total (Overall) | 50 (50.5%) | 49 (49.5%) |
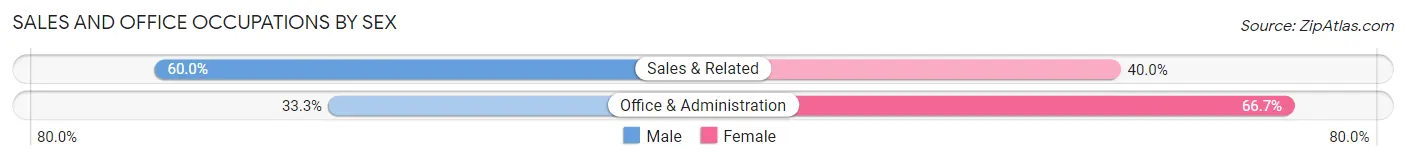
Sales and Office Occupations
The most common Sales and Office occupations in Brookeville are Office & Administration (6 | 6.1%), and Sales & Related (5 | 5.1%).
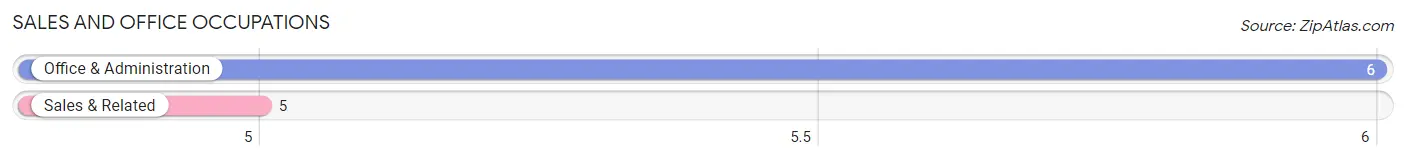
Sales and Office Occupations by Sex
| Occupation | Male | Female |
| Sales & Related | 3 (60.0%) | 2 (40.0%) |
| Office & Administration | 2 (33.3%) | 4 (66.7%) |
| Total (Category) | 5 (45.5%) | 6 (54.5%) |
| Total (Overall) | 50 (50.5%) | 49 (49.5%) |
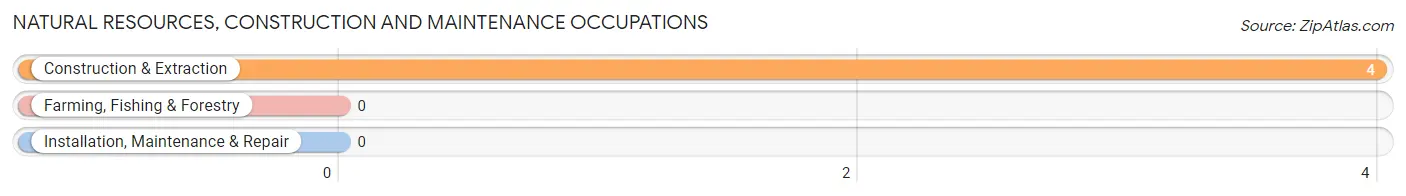
Natural Resources, Construction and Maintenance Occupations
The most common Natural Resources, Construction and Maintenance occupations in Brookeville are , and Construction & Extraction (4 | 4.0%).
Natural Resources, Construction and Maintenance Occupations by Sex
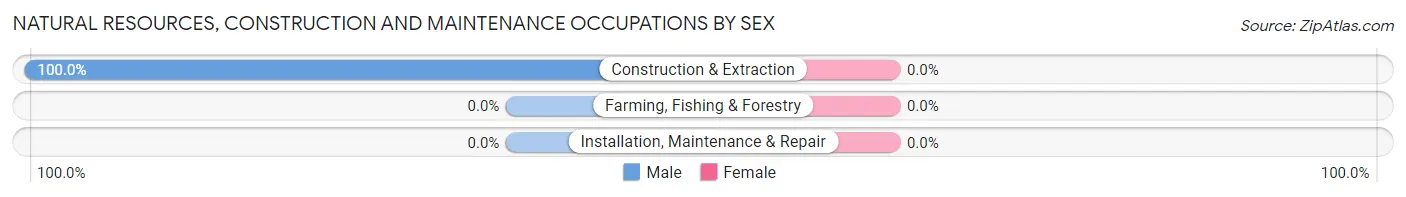
| Occupation | Male | Female |
| Farming, Fishing & Forestry | 0 (0.0%) | 0 (0.0%) |
| Construction & Extraction | 4 (100.0%) | 0 (0.0%) |
| Installation, Maintenance & Repair | 0 (0.0%) | 0 (0.0%) |
| Total (Category) | 4 (100.0%) | 0 (0.0%) |
| Total (Overall) | 50 (50.5%) | 49 (49.5%) |
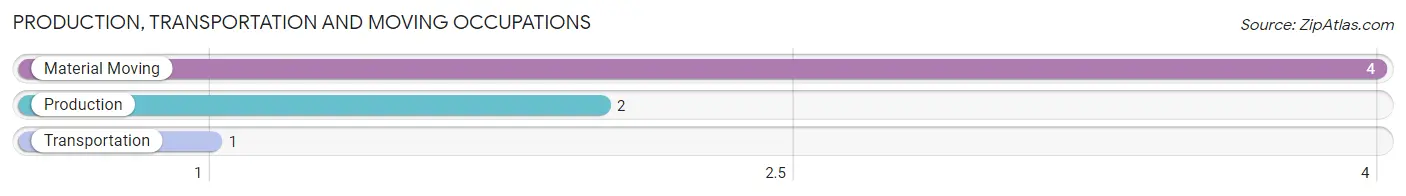
Production, Transportation and Moving Occupations
The most common Production, Transportation and Moving occupations in Brookeville are Material Moving (4 | 4.0%), Production (2 | 2.0%), and Transportation (1 | 1.0%).
Production, Transportation and Moving Occupations by Sex
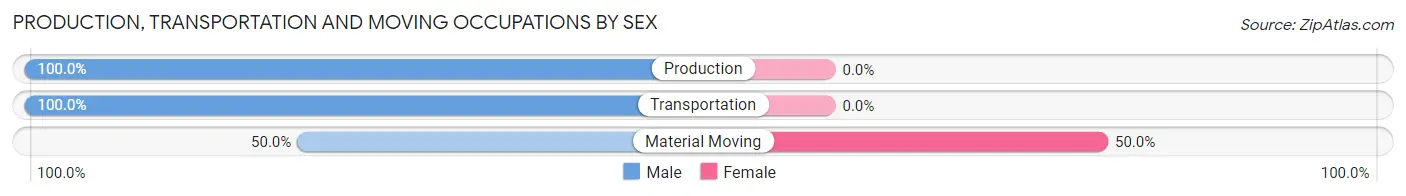
| Occupation | Male | Female |
| Production | 2 (100.0%) | 0 (0.0%) |
| Transportation | 1 (100.0%) | 0 (0.0%) |
| Material Moving | 2 (50.0%) | 2 (50.0%) |
| Total (Category) | 5 (71.4%) | 2 (28.6%) |
| Total (Overall) | 50 (50.5%) | 49 (49.5%) |
Employment Industries by Sex in Brookeville
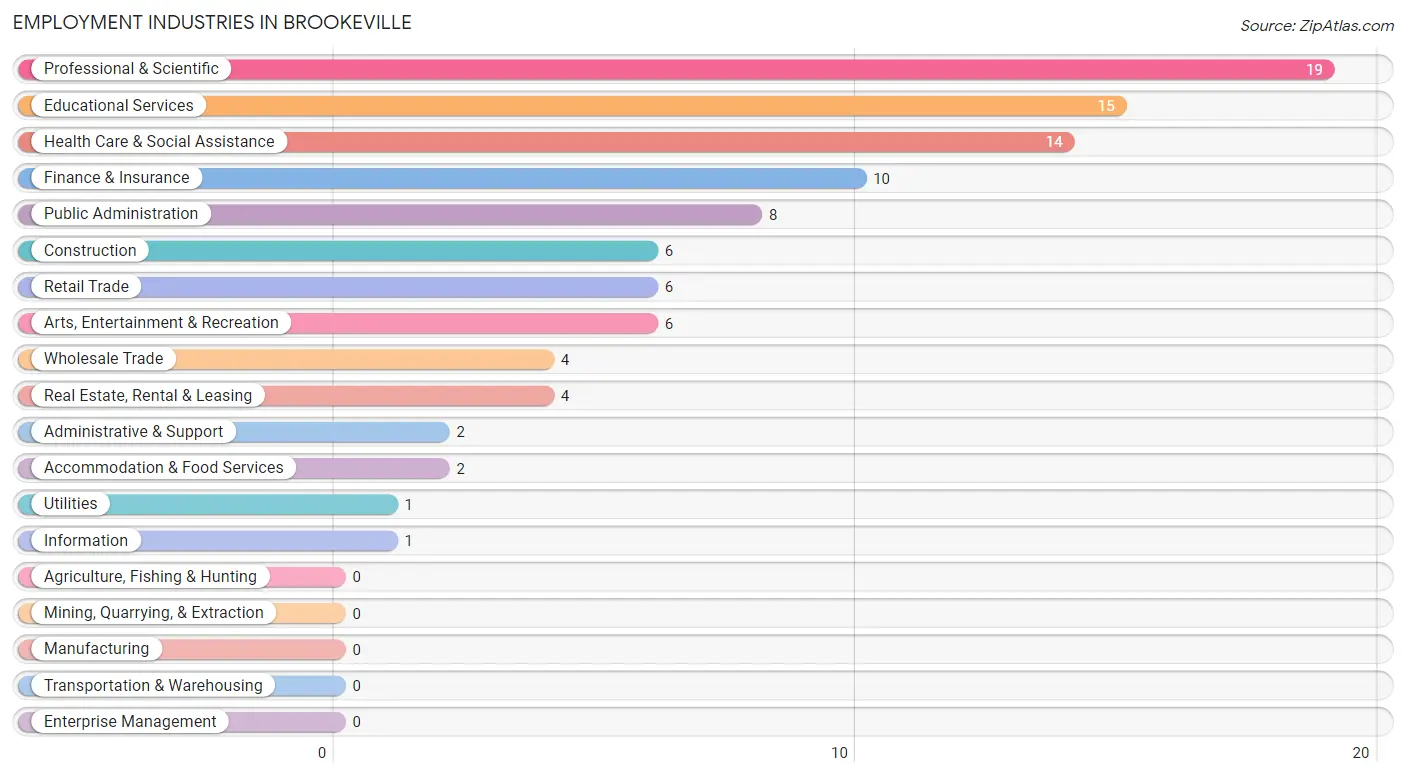
Employment Industries in Brookeville
The major employment industries in Brookeville include Professional & Scientific (19 | 19.2%), Educational Services (15 | 15.1%), Health Care & Social Assistance (14 | 14.1%), Finance & Insurance (10 | 10.1%), and Public Administration (8 | 8.1%).
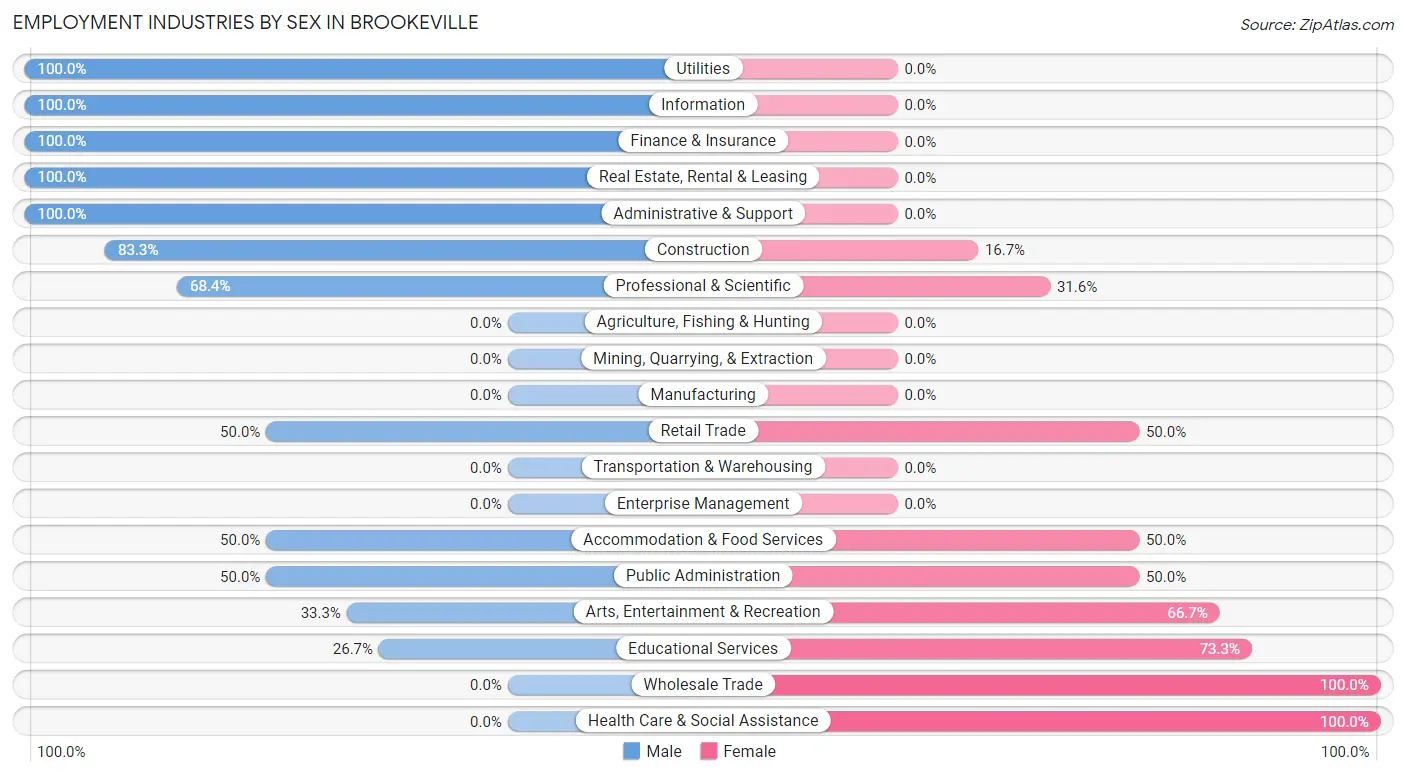
Employment Industries by Sex in Brookeville
The Brookeville industries that see more men than women are Utilities (100.0%), Information (100.0%), and Finance & Insurance (100.0%), whereas the industries that tend to have a higher number of women are Wholesale Trade (100.0%), Health Care & Social Assistance (100.0%), and Educational Services (73.3%).
| Industry | Male | Female |
| Agriculture, Fishing & Hunting | 0 (0.0%) | 0 (0.0%) |
| Mining, Quarrying, & Extraction | 0 (0.0%) | 0 (0.0%) |
| Construction | 5 (83.3%) | 1 (16.7%) |
| Manufacturing | 0 (0.0%) | 0 (0.0%) |
| Wholesale Trade | 0 (0.0%) | 4 (100.0%) |
| Retail Trade | 3 (50.0%) | 3 (50.0%) |
| Transportation & Warehousing | 0 (0.0%) | 0 (0.0%) |
| Utilities | 1 (100.0%) | 0 (0.0%) |
| Information | 1 (100.0%) | 0 (0.0%) |
| Finance & Insurance | 10 (100.0%) | 0 (0.0%) |
| Real Estate, Rental & Leasing | 4 (100.0%) | 0 (0.0%) |
| Professional & Scientific | 13 (68.4%) | 6 (31.6%) |
| Enterprise Management | 0 (0.0%) | 0 (0.0%) |
| Administrative & Support | 2 (100.0%) | 0 (0.0%) |
| Educational Services | 4 (26.7%) | 11 (73.3%) |
| Health Care & Social Assistance | 0 (0.0%) | 14 (100.0%) |
| Arts, Entertainment & Recreation | 2 (33.3%) | 4 (66.7%) |
| Accommodation & Food Services | 1 (50.0%) | 1 (50.0%) |
| Public Administration | 4 (50.0%) | 4 (50.0%) |
| Total | 50 (50.5%) | 49 (49.5%) |
Education in Brookeville
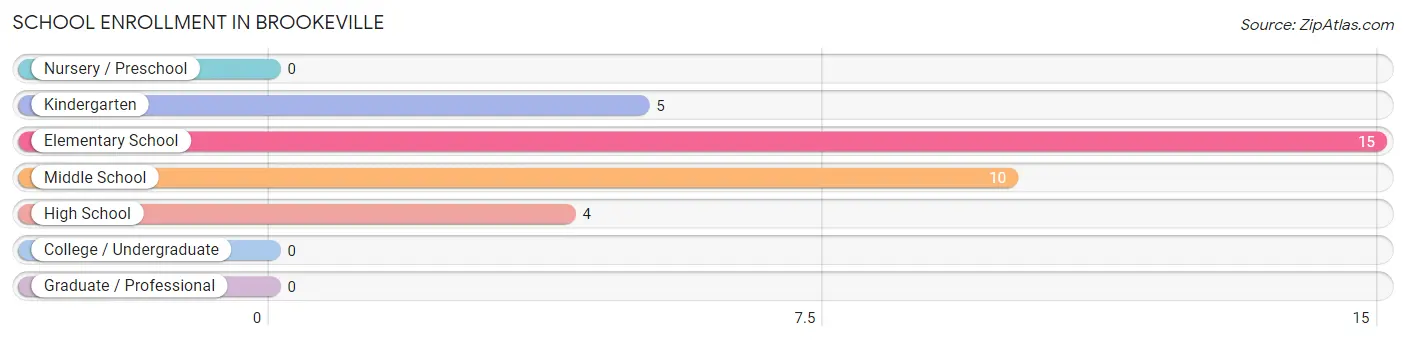
School Enrollment in Brookeville
The most common levels of schooling among the 34 students in Brookeville are elementary school (15 | 44.1%), middle school (10 | 29.4%), and kindergarten (5 | 14.7%).
| School Level | # Students | % Students |
| Nursery / Preschool | 0 | 0.0% |
| Kindergarten | 5 | 14.7% |
| Elementary School | 15 | 44.1% |
| Middle School | 10 | 29.4% |
| High School | 4 | 11.8% |
| College / Undergraduate | 0 | 0.0% |
| Graduate / Professional | 0 | 0.0% |
| Total | 34 | 100.0% |
School Enrollment by Age by Funding Source in Brookeville
Out of a total of 34 students who are enrolled in schools in Brookeville, 18 (52.9%) attend a private institution, while the remaining 16 (47.1%) are enrolled in public schools. The age group of 15 to 17 year olds has the highest likelihood of being enrolled in private schools, with 1 (100.0% in the age bracket) enrolled. Conversely, the age group of 18 to 19 year olds has the lowest likelihood of being enrolled in a private school, with 2 (100.0% in the age bracket) attending a public institution.
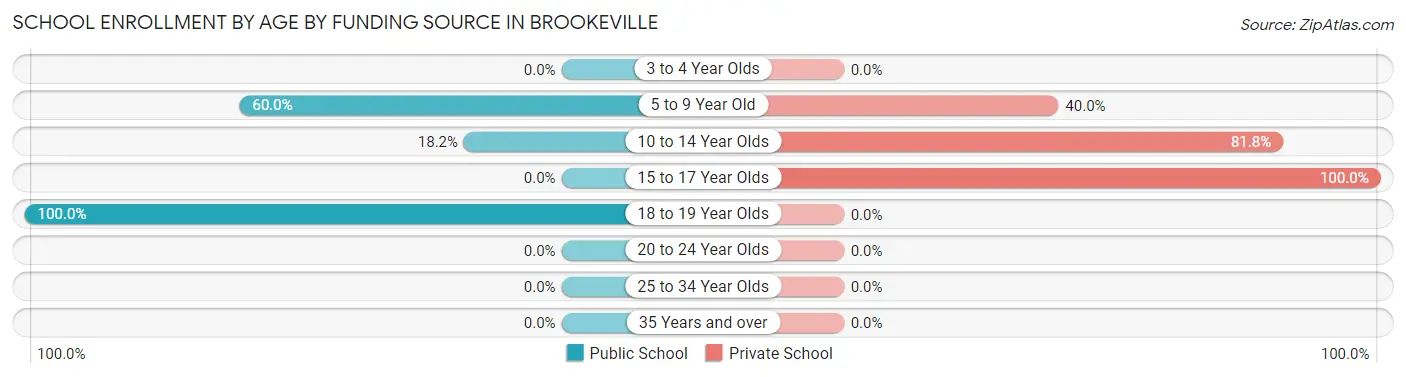
| Age Bracket | Public School | Private School |
| 3 to 4 Year Olds | 0 (0.0%) | 0 (0.0%) |
| 5 to 9 Year Old | 12 (60.0%) | 8 (40.0%) |
| 10 to 14 Year Olds | 2 (18.2%) | 9 (81.8%) |
| 15 to 17 Year Olds | 0 (0.0%) | 1 (100.0%) |
| 18 to 19 Year Olds | 2 (100.0%) | 0 (0.0%) |
| 20 to 24 Year Olds | 0 (0.0%) | 0 (0.0%) |
| 25 to 34 Year Olds | 0 (0.0%) | 0 (0.0%) |
| 35 Years and over | 0 (0.0%) | 0 (0.0%) |
| Total | 16 (47.1%) | 18 (52.9%) |
Educational Attainment by Field of Study in Brookeville
Business (13 | 15.7%), science & technology (12 | 14.5%), visual & performing arts (11 | 13.3%), social sciences (8 | 9.6%), and bio, nature & agricultural (7 | 8.4%) are the most common fields of study among 83 individuals in Brookeville who have obtained a bachelor's degree or higher.
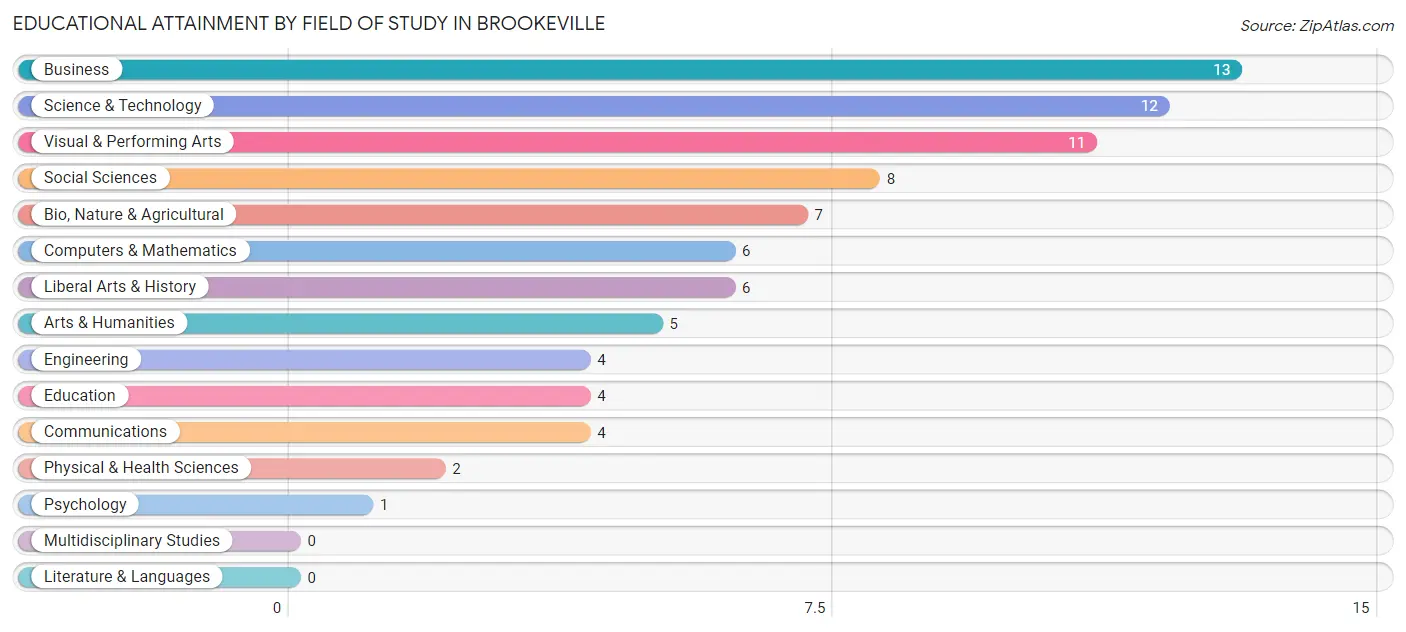
| Field of Study | # Graduates | % Graduates |
| Computers & Mathematics | 6 | 7.2% |
| Bio, Nature & Agricultural | 7 | 8.4% |
| Physical & Health Sciences | 2 | 2.4% |
| Psychology | 1 | 1.2% |
| Social Sciences | 8 | 9.6% |
| Engineering | 4 | 4.8% |
| Multidisciplinary Studies | 0 | 0.0% |
| Science & Technology | 12 | 14.5% |
| Business | 13 | 15.7% |
| Education | 4 | 4.8% |
| Literature & Languages | 0 | 0.0% |
| Liberal Arts & History | 6 | 7.2% |
| Visual & Performing Arts | 11 | 13.3% |
| Communications | 4 | 4.8% |
| Arts & Humanities | 5 | 6.0% |
| Total | 83 | 100.0% |
Transportation & Commute in Brookeville
Vehicle Availability by Sex in Brookeville
The most prevalent vehicle ownership categories in Brookeville are males with 2 vehicles (31, accounting for 62.0%) and females with 2 vehicles (21, making up 75.6%).
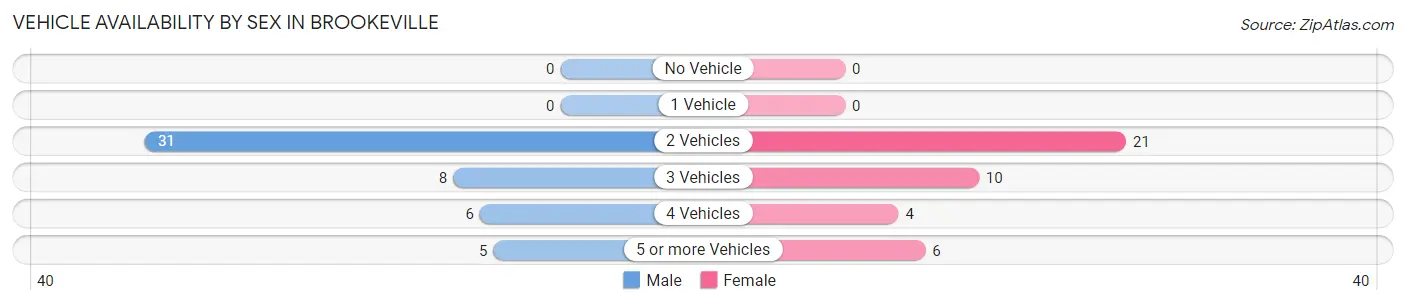
| Vehicles Available | Male | Female |
| No Vehicle | 0 (0.0%) | 0 (0.0%) |
| 1 Vehicle | 0 (0.0%) | 0 (0.0%) |
| 2 Vehicles | 31 (62.0%) | 21 (51.2%) |
| 3 Vehicles | 8 (16.0%) | 10 (24.4%) |
| 4 Vehicles | 6 (12.0%) | 4 (9.8%) |
| 5 or more Vehicles | 5 (10.0%) | 6 (14.6%) |
| Total | 50 (100.0%) | 41 (100.0%) |
Commute Time in Brookeville
The most frequently occuring commute durations in Brookeville are 45 to 59 minutes (15 commuters, 19.0%), 15 to 19 minutes (14 commuters, 17.7%), and 20 to 24 minutes (13 commuters, 16.5%).
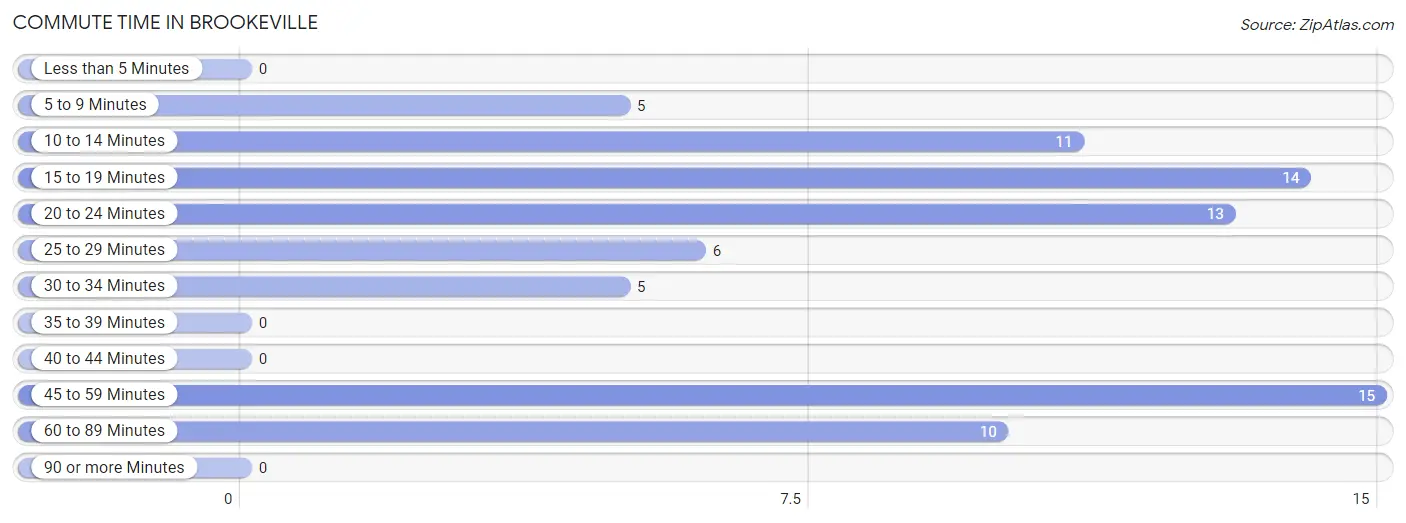
| Commute Time | # Commuters | % Commuters |
| Less than 5 Minutes | 0 | 0.0% |
| 5 to 9 Minutes | 5 | 6.3% |
| 10 to 14 Minutes | 11 | 13.9% |
| 15 to 19 Minutes | 14 | 17.7% |
| 20 to 24 Minutes | 13 | 16.5% |
| 25 to 29 Minutes | 6 | 7.6% |
| 30 to 34 Minutes | 5 | 6.3% |
| 35 to 39 Minutes | 0 | 0.0% |
| 40 to 44 Minutes | 0 | 0.0% |
| 45 to 59 Minutes | 15 | 19.0% |
| 60 to 89 Minutes | 10 | 12.7% |
| 90 or more Minutes | 0 | 0.0% |
Commute Time by Sex in Brookeville
The most common commute times in Brookeville are 10 to 14 minutes (9 commuters, 19.6%) for males and 45 to 59 minutes (11 commuters, 33.3%) for females.
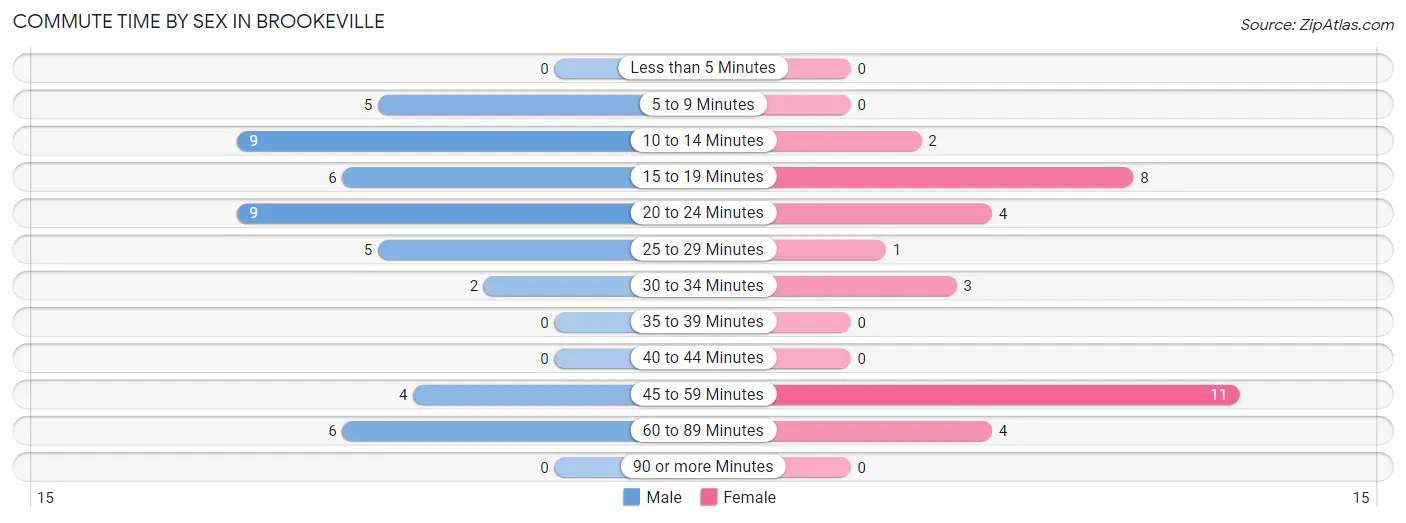
| Commute Time | Male | Female |
| Less than 5 Minutes | 0 (0.0%) | 0 (0.0%) |
| 5 to 9 Minutes | 5 (10.9%) | 0 (0.0%) |
| 10 to 14 Minutes | 9 (19.6%) | 2 (6.1%) |
| 15 to 19 Minutes | 6 (13.0%) | 8 (24.2%) |
| 20 to 24 Minutes | 9 (19.6%) | 4 (12.1%) |
| 25 to 29 Minutes | 5 (10.9%) | 1 (3.0%) |
| 30 to 34 Minutes | 2 (4.3%) | 3 (9.1%) |
| 35 to 39 Minutes | 0 (0.0%) | 0 (0.0%) |
| 40 to 44 Minutes | 0 (0.0%) | 0 (0.0%) |
| 45 to 59 Minutes | 4 (8.7%) | 11 (33.3%) |
| 60 to 89 Minutes | 6 (13.0%) | 4 (12.1%) |
| 90 or more Minutes | 0 (0.0%) | 0 (0.0%) |
Time of Departure to Work by Sex in Brookeville
The most frequent times of departure to work in Brookeville are 8:30 AM to 8:59 AM (12, 26.1%) for males and 6:30 AM to 6:59 AM (12, 36.4%) for females.
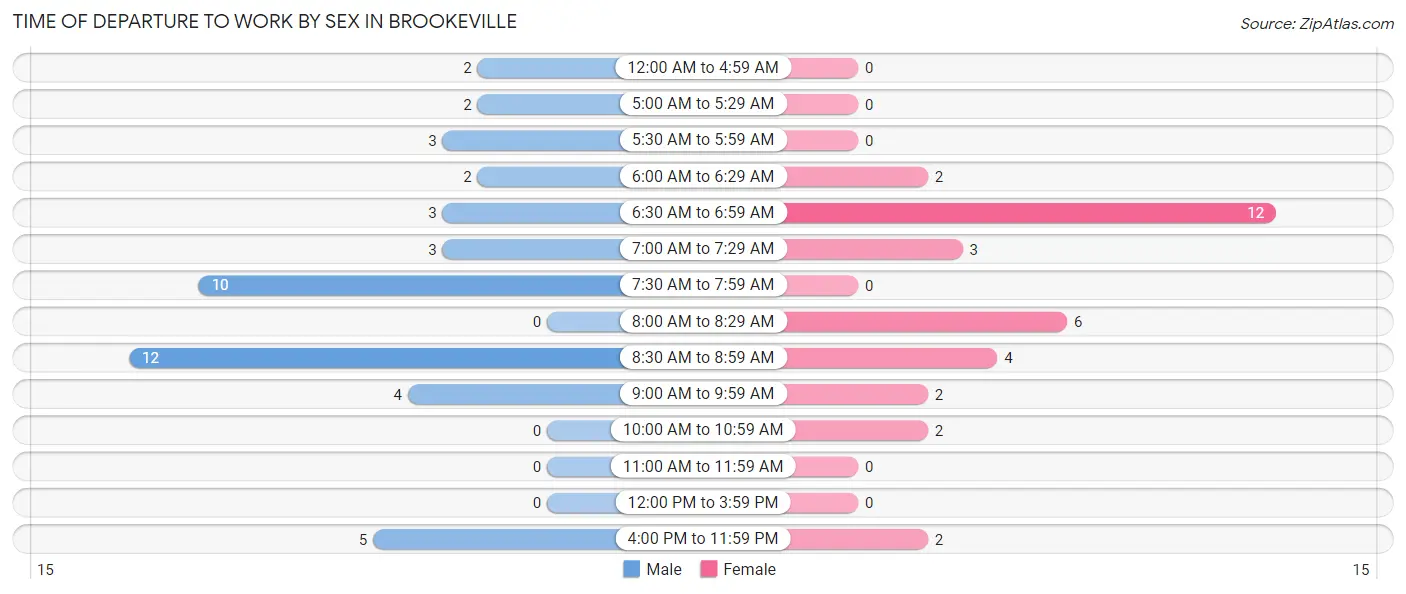
| Time of Departure | Male | Female |
| 12:00 AM to 4:59 AM | 2 (4.3%) | 0 (0.0%) |
| 5:00 AM to 5:29 AM | 2 (4.3%) | 0 (0.0%) |
| 5:30 AM to 5:59 AM | 3 (6.5%) | 0 (0.0%) |
| 6:00 AM to 6:29 AM | 2 (4.3%) | 2 (6.1%) |
| 6:30 AM to 6:59 AM | 3 (6.5%) | 12 (36.4%) |
| 7:00 AM to 7:29 AM | 3 (6.5%) | 3 (9.1%) |
| 7:30 AM to 7:59 AM | 10 (21.7%) | 0 (0.0%) |
| 8:00 AM to 8:29 AM | 0 (0.0%) | 6 (18.2%) |
| 8:30 AM to 8:59 AM | 12 (26.1%) | 4 (12.1%) |
| 9:00 AM to 9:59 AM | 4 (8.7%) | 2 (6.1%) |
| 10:00 AM to 10:59 AM | 0 (0.0%) | 2 (6.1%) |
| 11:00 AM to 11:59 AM | 0 (0.0%) | 0 (0.0%) |
| 12:00 PM to 3:59 PM | 0 (0.0%) | 0 (0.0%) |
| 4:00 PM to 11:59 PM | 5 (10.9%) | 2 (6.1%) |
| Total | 46 (100.0%) | 33 (100.0%) |
Housing Occupancy in Brookeville
Occupancy by Ownership in Brookeville
Of the total 53 dwellings in Brookeville, owner-occupied units account for 48 (90.6%), while renter-occupied units make up 5 (9.4%).
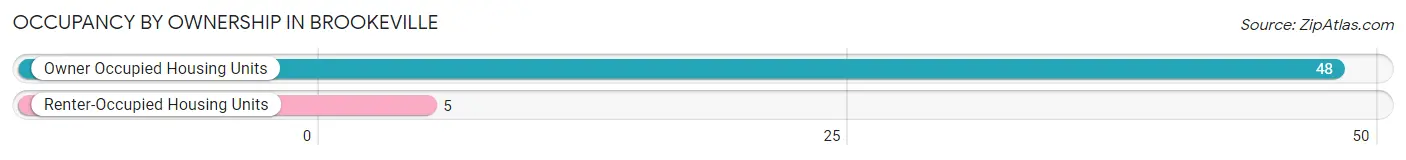
| Occupancy | # Housing Units | % Housing Units |
| Owner Occupied Housing Units | 48 | 90.6% |
| Renter-Occupied Housing Units | 5 | 9.4% |
| Total Occupied Housing Units | 53 | 100.0% |
Occupancy by Household Size in Brookeville
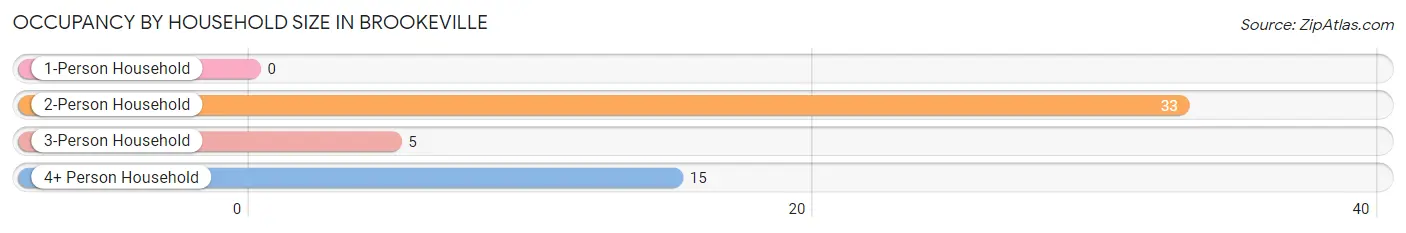
| Household Size | # Housing Units | % Housing Units |
| 1-Person Household | 0 | 0.0% |
| 2-Person Household | 33 | 62.3% |
| 3-Person Household | 5 | 9.4% |
| 4+ Person Household | 15 | 28.3% |
| Total Housing Units | 53 | 100.0% |
Occupancy by Ownership by Household Size in Brookeville
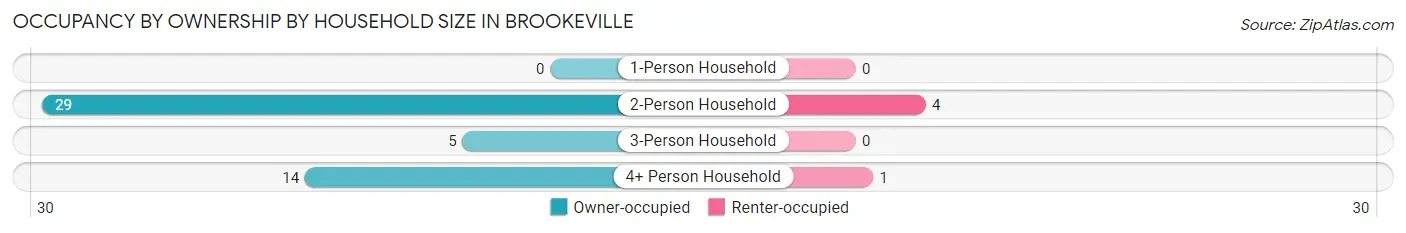
| Household Size | Owner-occupied | Renter-occupied |
| 1-Person Household | 0 (0.0%) | 0 (0.0%) |
| 2-Person Household | 29 (87.9%) | 4 (12.1%) |
| 3-Person Household | 5 (100.0%) | 0 (0.0%) |
| 4+ Person Household | 14 (93.3%) | 1 (6.7%) |
| Total Housing Units | 48 (90.6%) | 5 (9.4%) |
Occupancy by Educational Attainment in Brookeville
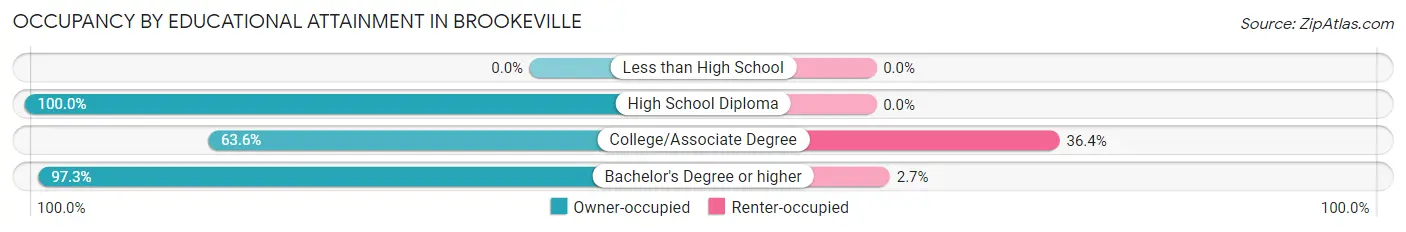
| Household Size | Owner-occupied | Renter-occupied |
| Less than High School | 0 (0.0%) | 0 (0.0%) |
| High School Diploma | 5 (100.0%) | 0 (0.0%) |
| College/Associate Degree | 7 (63.6%) | 4 (36.4%) |
| Bachelor's Degree or higher | 36 (97.3%) | 1 (2.7%) |
Occupancy by Age of Householder in Brookeville
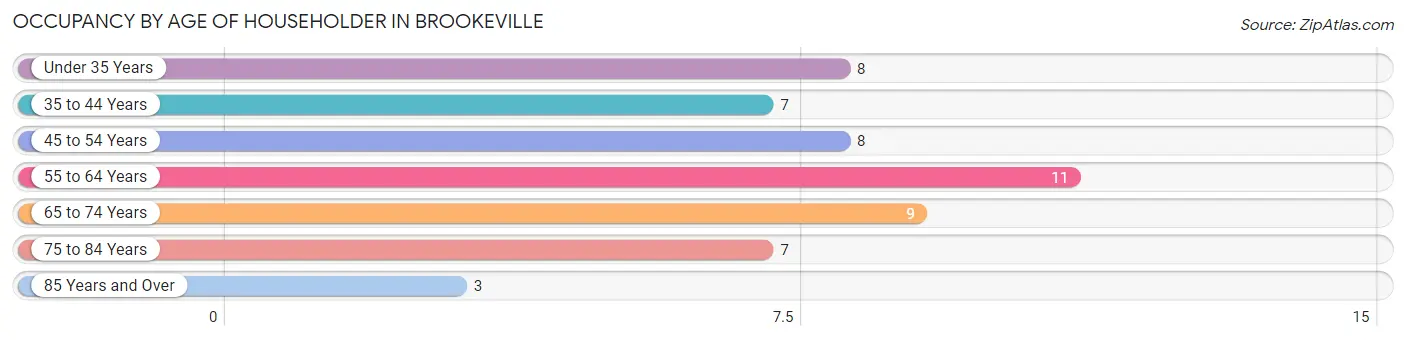
| Age Bracket | # Households | % Households |
| Under 35 Years | 8 | 15.1% |
| 35 to 44 Years | 7 | 13.2% |
| 45 to 54 Years | 8 | 15.1% |
| 55 to 64 Years | 11 | 20.7% |
| 65 to 74 Years | 9 | 17.0% |
| 75 to 84 Years | 7 | 13.2% |
| 85 Years and Over | 3 | 5.7% |
| Total | 53 | 100.0% |
Housing Finances in Brookeville
Median Income by Occupancy in Brookeville
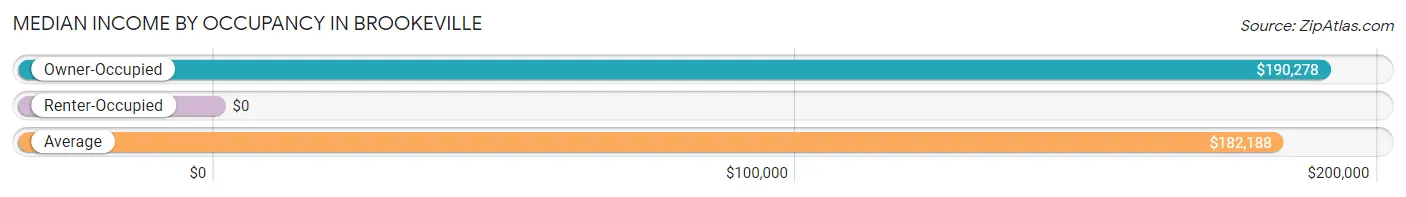
| Occupancy Type | # Households | Median Income |
| Owner-Occupied | 48 (90.6%) | $190,278 |
| Renter-Occupied | 5 (9.4%) | $0 |
| Average | 53 (100.0%) | $182,188 |
Occupancy by Householder Income Bracket in Brookeville
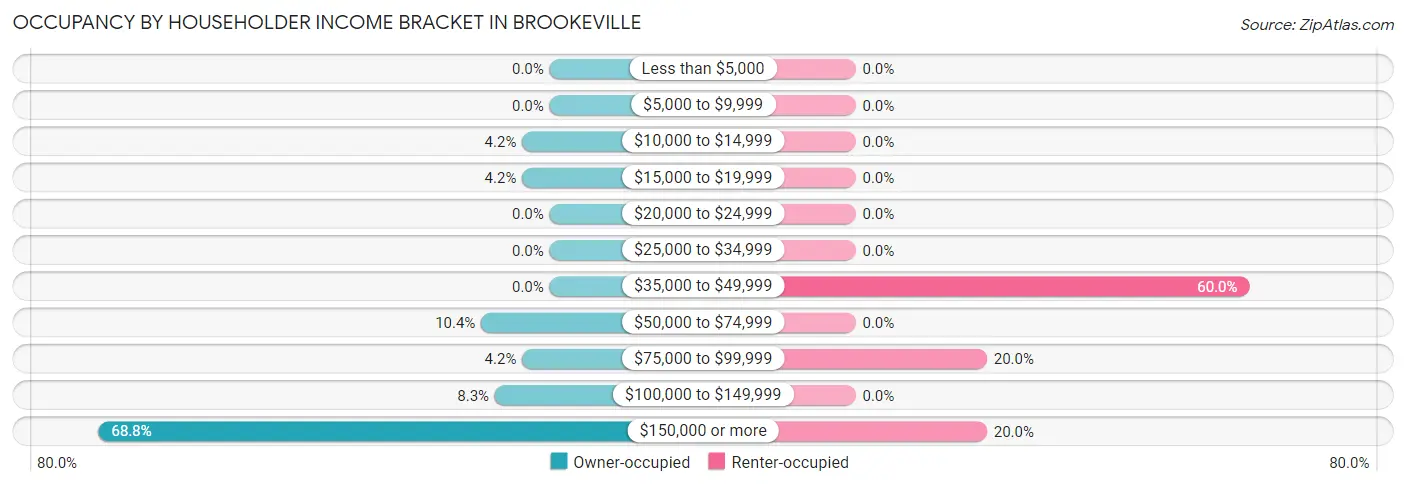
| Income Bracket | Owner-occupied | Renter-occupied |
| Less than $5,000 | 0 (0.0%) | 0 (0.0%) |
| $5,000 to $9,999 | 0 (0.0%) | 0 (0.0%) |
| $10,000 to $14,999 | 2 (4.2%) | 0 (0.0%) |
| $15,000 to $19,999 | 2 (4.2%) | 0 (0.0%) |
| $20,000 to $24,999 | 0 (0.0%) | 0 (0.0%) |
| $25,000 to $34,999 | 0 (0.0%) | 0 (0.0%) |
| $35,000 to $49,999 | 0 (0.0%) | 3 (60.0%) |
| $50,000 to $74,999 | 5 (10.4%) | 0 (0.0%) |
| $75,000 to $99,999 | 2 (4.2%) | 1 (20.0%) |
| $100,000 to $149,999 | 4 (8.3%) | 0 (0.0%) |
| $150,000 or more | 33 (68.8%) | 1 (20.0%) |
| Total | 48 (100.0%) | 5 (100.0%) |
Monthly Housing Cost Tiers in Brookeville
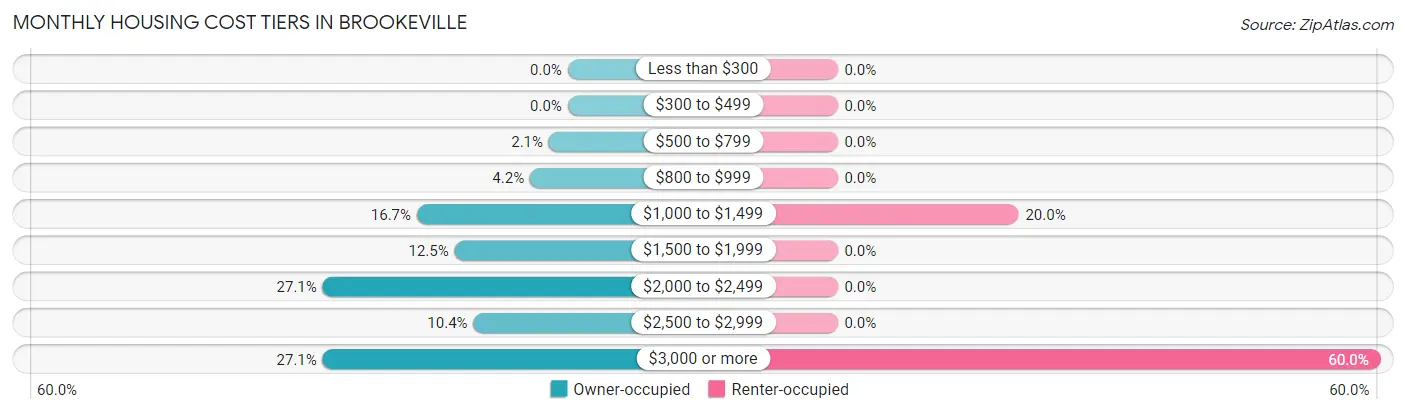
| Monthly Cost | Owner-occupied | Renter-occupied |
| Less than $300 | 0 (0.0%) | 0 (0.0%) |
| $300 to $499 | 0 (0.0%) | 0 (0.0%) |
| $500 to $799 | 1 (2.1%) | 0 (0.0%) |
| $800 to $999 | 2 (4.2%) | 0 (0.0%) |
| $1,000 to $1,499 | 8 (16.7%) | 1 (20.0%) |
| $1,500 to $1,999 | 6 (12.5%) | 0 (0.0%) |
| $2,000 to $2,499 | 13 (27.1%) | 0 (0.0%) |
| $2,500 to $2,999 | 5 (10.4%) | 0 (0.0%) |
| $3,000 or more | 13 (27.1%) | 3 (60.0%) |
| Total | 48 (100.0%) | 5 (100.0%) |
Physical Housing Characteristics in Brookeville
Housing Structures in Brookeville
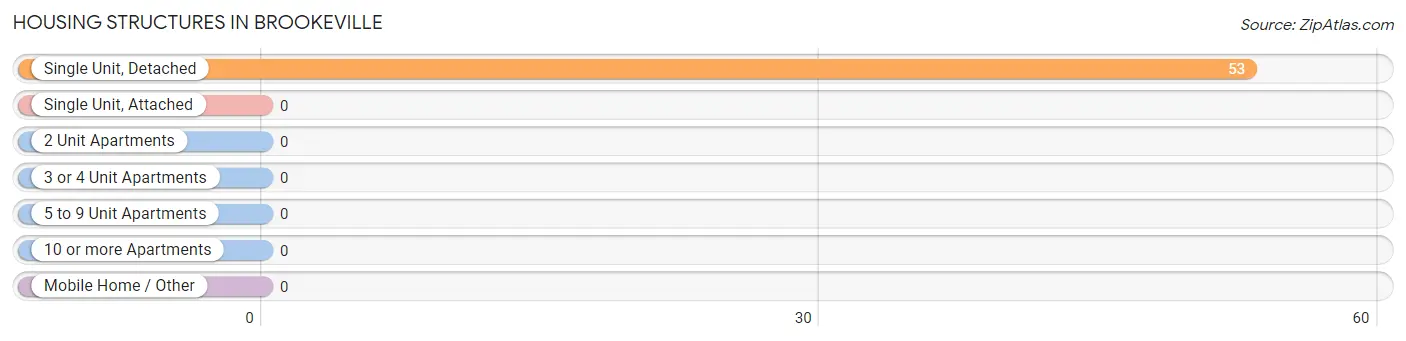
| Structure Type | # Housing Units | % Housing Units |
| Single Unit, Detached | 53 | 100.0% |
| Single Unit, Attached | 0 | 0.0% |
| 2 Unit Apartments | 0 | 0.0% |
| 3 or 4 Unit Apartments | 0 | 0.0% |
| 5 to 9 Unit Apartments | 0 | 0.0% |
| 10 or more Apartments | 0 | 0.0% |
| Mobile Home / Other | 0 | 0.0% |
| Total | 53 | 100.0% |
Housing Structures by Occupancy in Brookeville
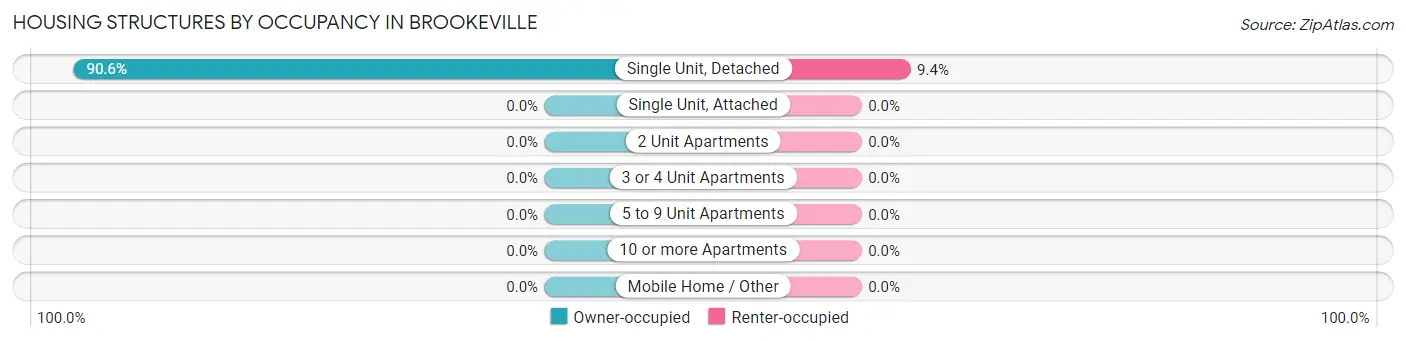
| Structure Type | Owner-occupied | Renter-occupied |
| Single Unit, Detached | 48 (90.6%) | 5 (9.4%) |
| Single Unit, Attached | 0 (0.0%) | 0 (0.0%) |
| 2 Unit Apartments | 0 (0.0%) | 0 (0.0%) |
| 3 or 4 Unit Apartments | 0 (0.0%) | 0 (0.0%) |
| 5 to 9 Unit Apartments | 0 (0.0%) | 0 (0.0%) |
| 10 or more Apartments | 0 (0.0%) | 0 (0.0%) |
| Mobile Home / Other | 0 (0.0%) | 0 (0.0%) |
| Total | 48 (90.6%) | 5 (9.4%) |
Housing Structures by Number of Rooms in Brookeville
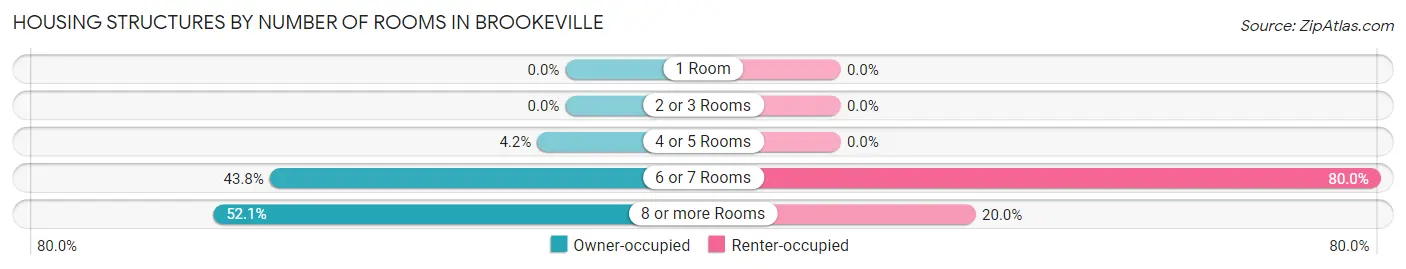
| Number of Rooms | Owner-occupied | Renter-occupied |
| 1 Room | 0 (0.0%) | 0 (0.0%) |
| 2 or 3 Rooms | 0 (0.0%) | 0 (0.0%) |
| 4 or 5 Rooms | 2 (4.2%) | 0 (0.0%) |
| 6 or 7 Rooms | 21 (43.8%) | 4 (80.0%) |
| 8 or more Rooms | 25 (52.1%) | 1 (20.0%) |
| Total | 48 (100.0%) | 5 (100.0%) |
Housing Structure by Heating Type in Brookeville
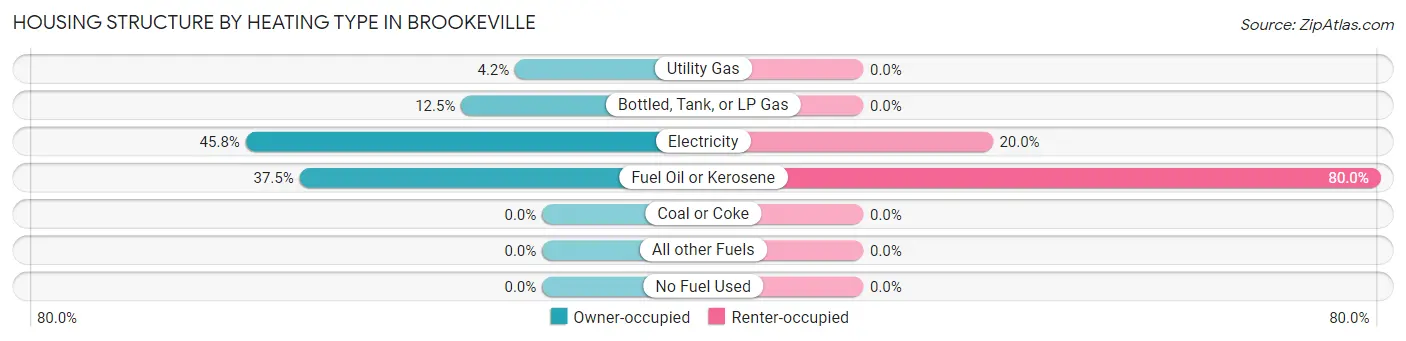
| Heating Type | Owner-occupied | Renter-occupied |
| Utility Gas | 2 (4.2%) | 0 (0.0%) |
| Bottled, Tank, or LP Gas | 6 (12.5%) | 0 (0.0%) |
| Electricity | 22 (45.8%) | 1 (20.0%) |
| Fuel Oil or Kerosene | 18 (37.5%) | 4 (80.0%) |
| Coal or Coke | 0 (0.0%) | 0 (0.0%) |
| All other Fuels | 0 (0.0%) | 0 (0.0%) |
| No Fuel Used | 0 (0.0%) | 0 (0.0%) |
| Total | 48 (100.0%) | 5 (100.0%) |
Household Vehicle Usage in Brookeville
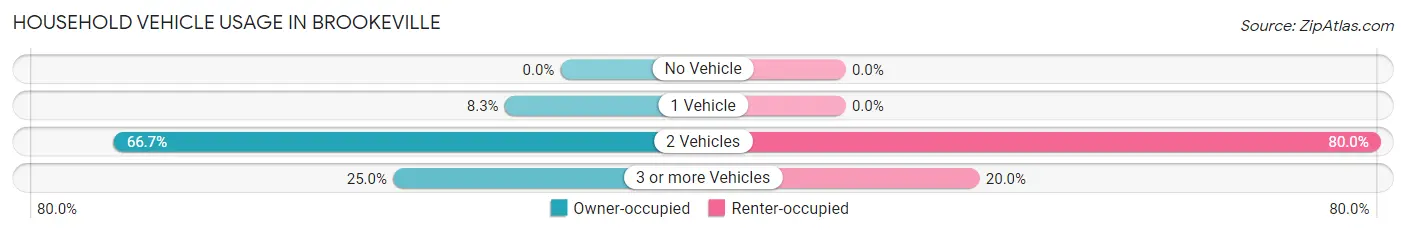
| Vehicles per Household | Owner-occupied | Renter-occupied |
| No Vehicle | 0 (0.0%) | 0 (0.0%) |
| 1 Vehicle | 4 (8.3%) | 0 (0.0%) |
| 2 Vehicles | 32 (66.7%) | 4 (80.0%) |
| 3 or more Vehicles | 12 (25.0%) | 1 (20.0%) |
| Total | 48 (100.0%) | 5 (100.0%) |
Real Estate & Mortgages in Brookeville
Real Estate and Mortgage Overview in Brookeville
| Characteristic | Without Mortgage | With Mortgage |
| Housing Units | 10 | 38 |
| Median Property Value | $625,000 | $653,800 |
| Median Household Income | - | - |
| Monthly Housing Costs | $1,150 | $13 |
| Real Estate Taxes | $7,500 | $0 |
Property Value by Mortgage Status in Brookeville
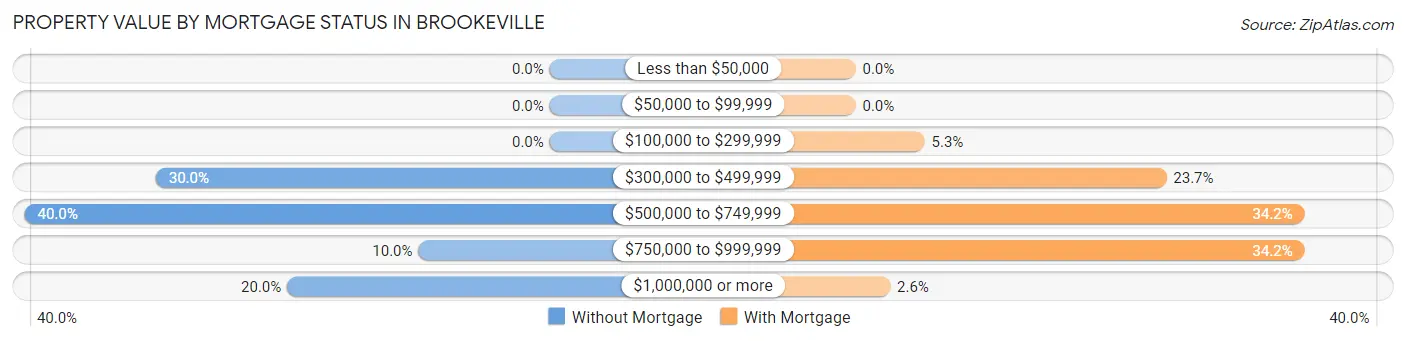
| Property Value | Without Mortgage | With Mortgage |
| Less than $50,000 | 0 (0.0%) | 0 (0.0%) |
| $50,000 to $99,999 | 0 (0.0%) | 0 (0.0%) |
| $100,000 to $299,999 | 0 (0.0%) | 2 (5.3%) |
| $300,000 to $499,999 | 3 (30.0%) | 9 (23.7%) |
| $500,000 to $749,999 | 4 (40.0%) | 13 (34.2%) |
| $750,000 to $999,999 | 1 (10.0%) | 13 (34.2%) |
| $1,000,000 or more | 2 (20.0%) | 1 (2.6%) |
| Total | 10 (100.0%) | 38 (100.0%) |
Household Income by Mortgage Status in Brookeville
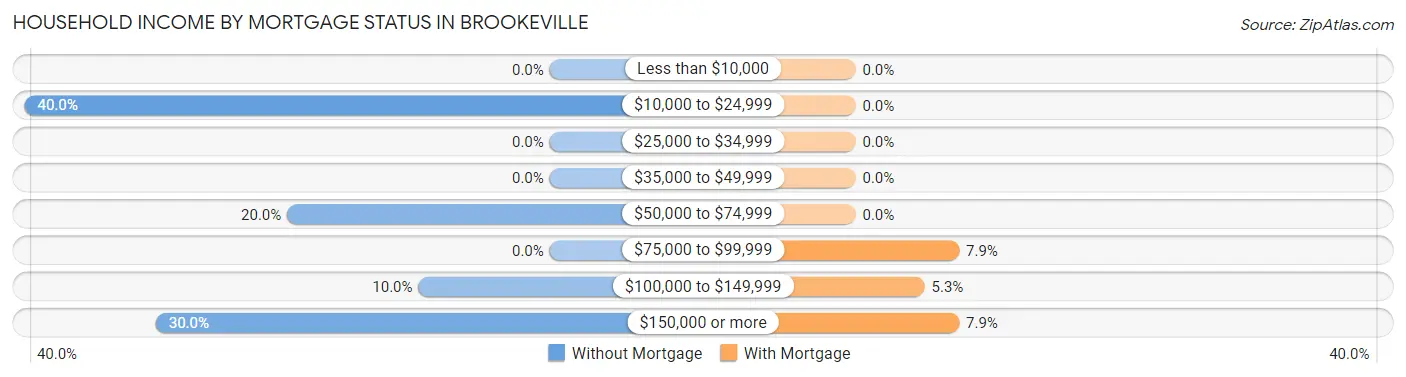
| Household Income | Without Mortgage | With Mortgage |
| Less than $10,000 | 0 (0.0%) | 0 (0.0%) |
| $10,000 to $24,999 | 4 (40.0%) | 0 (0.0%) |
| $25,000 to $34,999 | 0 (0.0%) | 0 (0.0%) |
| $35,000 to $49,999 | 0 (0.0%) | 0 (0.0%) |
| $50,000 to $74,999 | 2 (20.0%) | 0 (0.0%) |
| $75,000 to $99,999 | 0 (0.0%) | 3 (7.9%) |
| $100,000 to $149,999 | 1 (10.0%) | 2 (5.3%) |
| $150,000 or more | 3 (30.0%) | 3 (7.9%) |
| Total | 10 (100.0%) | 38 (100.0%) |
Property Value to Household Income Ratio in Brookeville
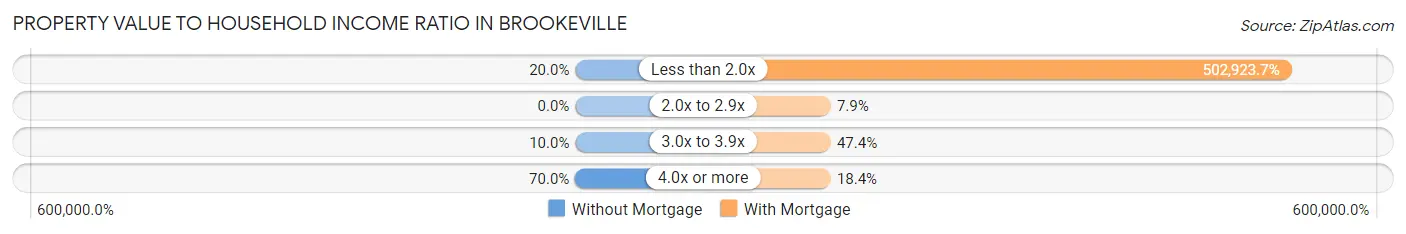
| Value-to-Income Ratio | Without Mortgage | With Mortgage |
| Less than 2.0x | 2 (20.0%) | 191,111 (502,923.7%) |
| 2.0x to 2.9x | 0 (0.0%) | 3 (7.9%) |
| 3.0x to 3.9x | 1 (10.0%) | 18 (47.4%) |
| 4.0x or more | 7 (70.0%) | 7 (18.4%) |
| Total | 10 (100.0%) | 38 (100.0%) |
Real Estate Taxes by Mortgage Status in Brookeville
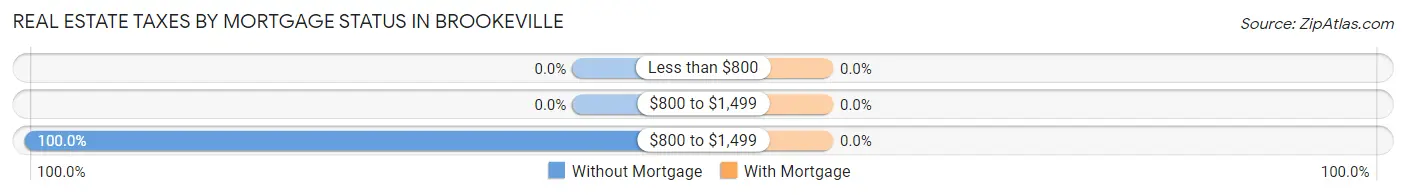
| Property Taxes | Without Mortgage | With Mortgage |
| Less than $800 | 0 (0.0%) | 0 (0.0%) |
| $800 to $1,499 | 0 (0.0%) | 0 (0.0%) |
| $800 to $1,499 | 10 (100.0%) | 0 (0.0%) |
| Total | 10 (100.0%) | 38 (100.0%) |
Health & Disability in Brookeville
Health Insurance Coverage by Age in Brookeville
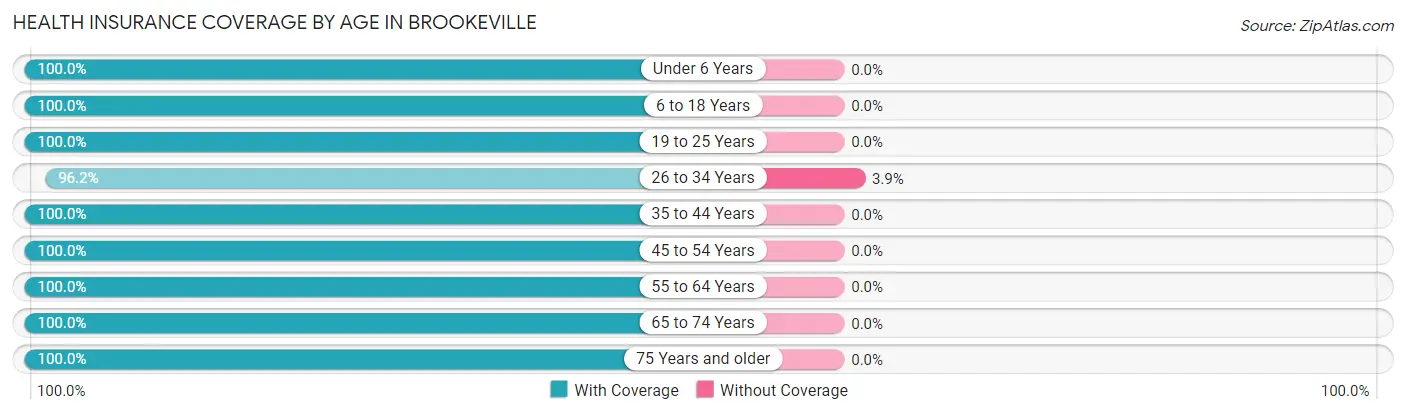
| Age Bracket | With Coverage | Without Coverage |
| Under 6 Years | 5 (100.0%) | 0 (0.0%) |
| 6 to 18 Years | 34 (100.0%) | 0 (0.0%) |
| 19 to 25 Years | 5 (100.0%) | 0 (0.0%) |
| 26 to 34 Years | 25 (96.2%) | 1 (3.8%) |
| 35 to 44 Years | 20 (100.0%) | 0 (0.0%) |
| 45 to 54 Years | 18 (100.0%) | 0 (0.0%) |
| 55 to 64 Years | 31 (100.0%) | 0 (0.0%) |
| 65 to 74 Years | 12 (100.0%) | 0 (0.0%) |
| 75 Years and older | 13 (100.0%) | 0 (0.0%) |
| Total | 163 (99.4%) | 1 (0.6%) |
Health Insurance Coverage by Citizenship Status in Brookeville
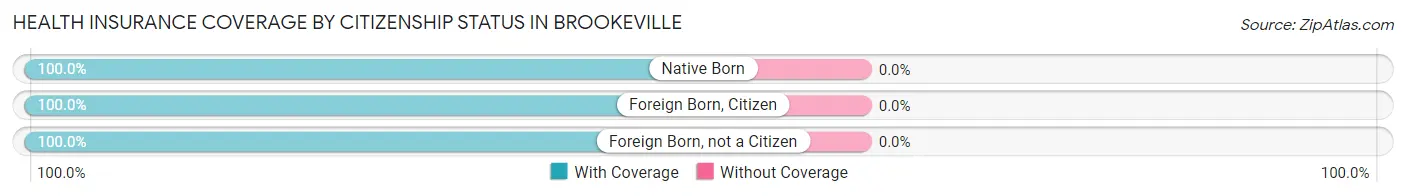
| Citizenship Status | With Coverage | Without Coverage |
| Native Born | 5 (100.0%) | 0 (0.0%) |
| Foreign Born, Citizen | 34 (100.0%) | 0 (0.0%) |
| Foreign Born, not a Citizen | 5 (100.0%) | 0 (0.0%) |
Health Insurance Coverage by Household Income in Brookeville
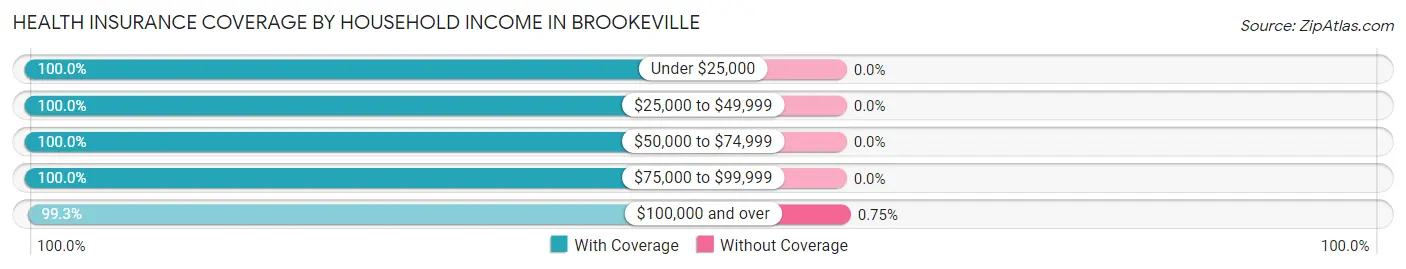
| Household Income | With Coverage | Without Coverage |
| Under $25,000 | 8 (100.0%) | 0 (0.0%) |
| $25,000 to $49,999 | 6 (100.0%) | 0 (0.0%) |
| $50,000 to $74,999 | 10 (100.0%) | 0 (0.0%) |
| $75,000 to $99,999 | 7 (100.0%) | 0 (0.0%) |
| $100,000 and over | 132 (99.3%) | 1 (0.7%) |
Public vs Private Health Insurance Coverage by Age in Brookeville
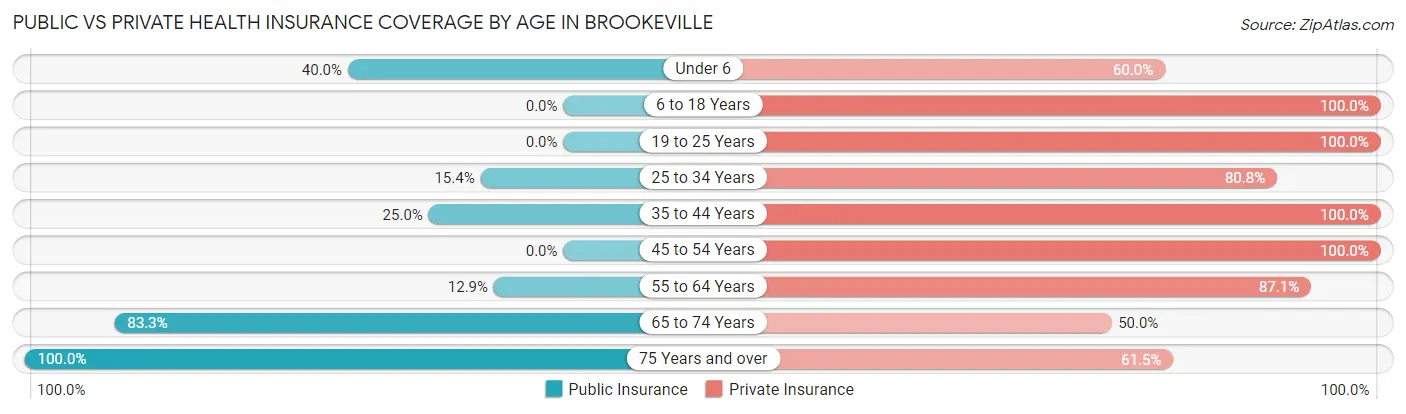
| Age Bracket | Public Insurance | Private Insurance |
| Under 6 | 2 (40.0%) | 3 (60.0%) |
| 6 to 18 Years | 0 (0.0%) | 34 (100.0%) |
| 19 to 25 Years | 0 (0.0%) | 5 (100.0%) |
| 25 to 34 Years | 4 (15.4%) | 21 (80.8%) |
| 35 to 44 Years | 5 (25.0%) | 20 (100.0%) |
| 45 to 54 Years | 0 (0.0%) | 18 (100.0%) |
| 55 to 64 Years | 4 (12.9%) | 27 (87.1%) |
| 65 to 74 Years | 10 (83.3%) | 6 (50.0%) |
| 75 Years and over | 13 (100.0%) | 8 (61.5%) |
| Total | 38 (23.2%) | 142 (86.6%) |
Disability Status by Sex by Age in Brookeville
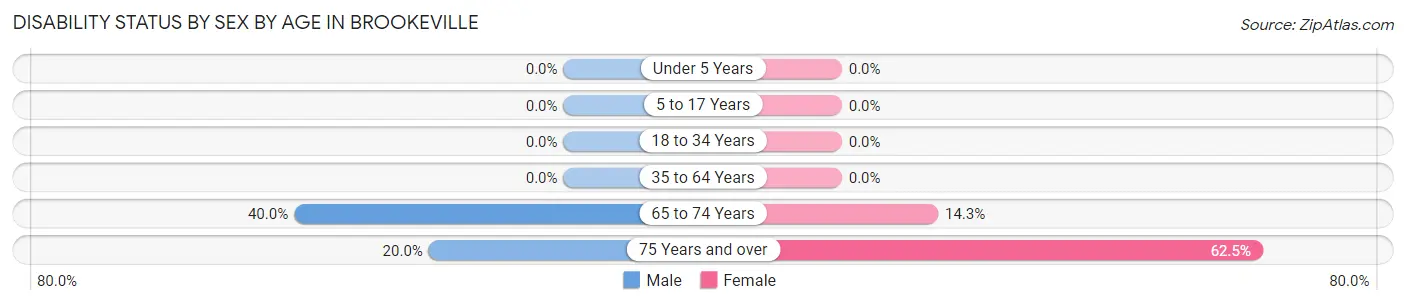
| Age Bracket | Male | Female |
| Under 5 Years | 0 (0.0%) | 0 (0.0%) |
| 5 to 17 Years | 0 (0.0%) | 0 (0.0%) |
| 18 to 34 Years | 0 (0.0%) | 0 (0.0%) |
| 35 to 64 Years | 0 (0.0%) | 0 (0.0%) |
| 65 to 74 Years | 2 (40.0%) | 1 (14.3%) |
| 75 Years and over | 1 (20.0%) | 5 (62.5%) |
Disability Class by Sex by Age in Brookeville
Disability Class: Hearing Difficulty
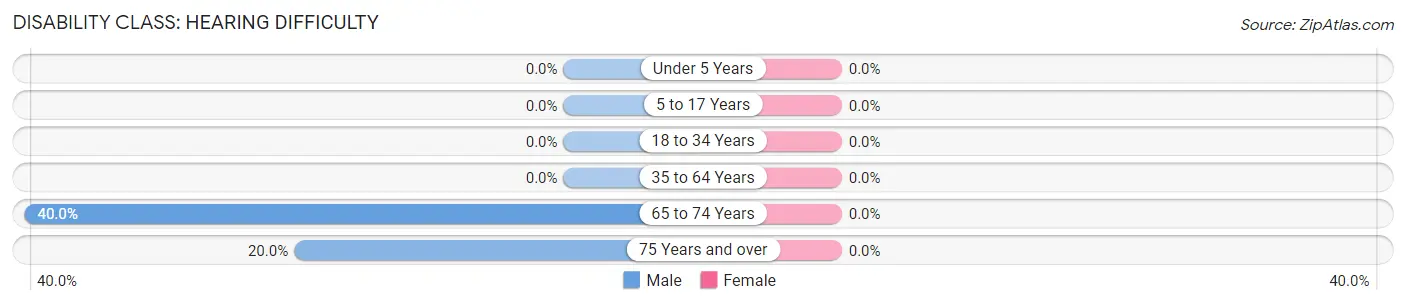
| Age Bracket | Male | Female |
| Under 5 Years | 0 (0.0%) | 0 (0.0%) |
| 5 to 17 Years | 0 (0.0%) | 0 (0.0%) |
| 18 to 34 Years | 0 (0.0%) | 0 (0.0%) |
| 35 to 64 Years | 0 (0.0%) | 0 (0.0%) |
| 65 to 74 Years | 2 (40.0%) | 0 (0.0%) |
| 75 Years and over | 1 (20.0%) | 0 (0.0%) |
Disability Class: Vision Difficulty
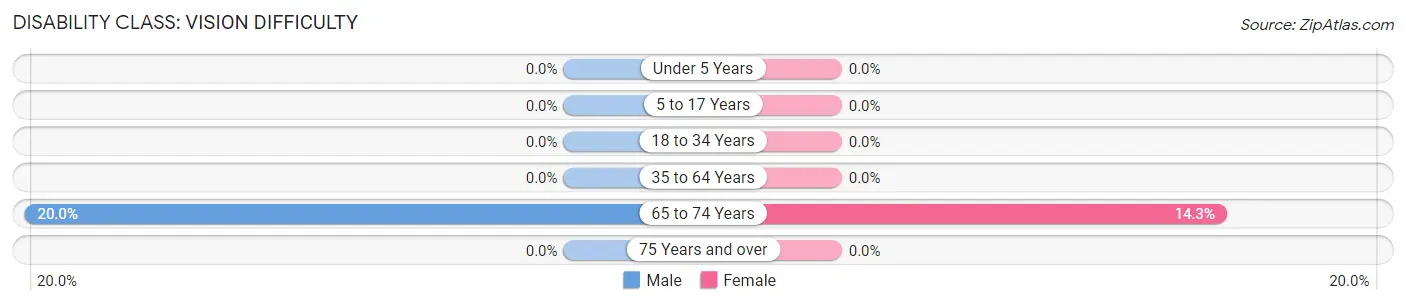
| Age Bracket | Male | Female |
| Under 5 Years | 0 (0.0%) | 0 (0.0%) |
| 5 to 17 Years | 0 (0.0%) | 0 (0.0%) |
| 18 to 34 Years | 0 (0.0%) | 0 (0.0%) |
| 35 to 64 Years | 0 (0.0%) | 0 (0.0%) |
| 65 to 74 Years | 1 (20.0%) | 1 (14.3%) |
| 75 Years and over | 0 (0.0%) | 0 (0.0%) |
Disability Class: Cognitive Difficulty
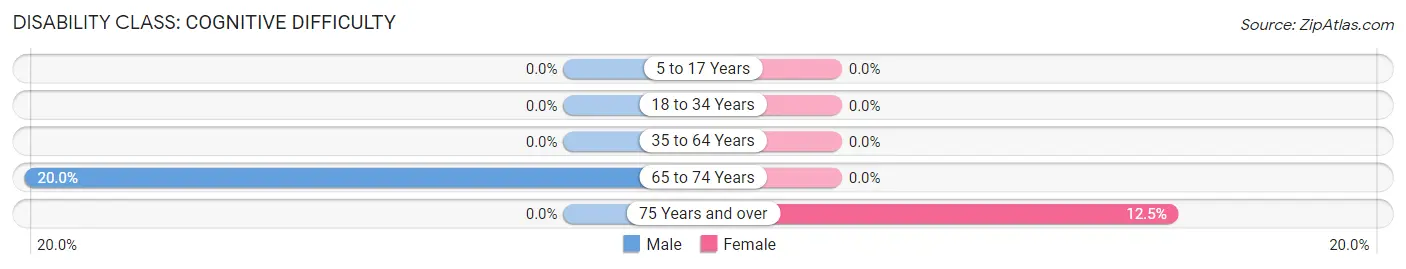
| Age Bracket | Male | Female |
| 5 to 17 Years | 0 (0.0%) | 0 (0.0%) |
| 18 to 34 Years | 0 (0.0%) | 0 (0.0%) |
| 35 to 64 Years | 0 (0.0%) | 0 (0.0%) |
| 65 to 74 Years | 1 (20.0%) | 0 (0.0%) |
| 75 Years and over | 0 (0.0%) | 1 (12.5%) |
Disability Class: Ambulatory Difficulty
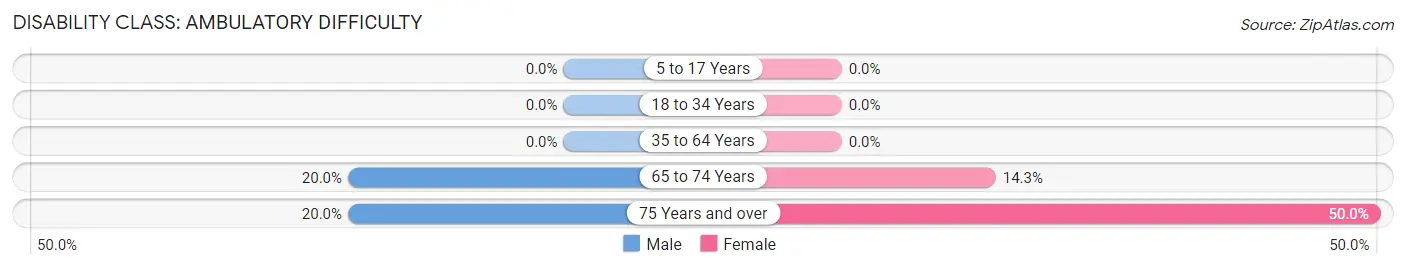
| Age Bracket | Male | Female |
| 5 to 17 Years | 0 (0.0%) | 0 (0.0%) |
| 18 to 34 Years | 0 (0.0%) | 0 (0.0%) |
| 35 to 64 Years | 0 (0.0%) | 0 (0.0%) |
| 65 to 74 Years | 1 (20.0%) | 1 (14.3%) |
| 75 Years and over | 1 (20.0%) | 4 (50.0%) |
Disability Class: Self-Care Difficulty
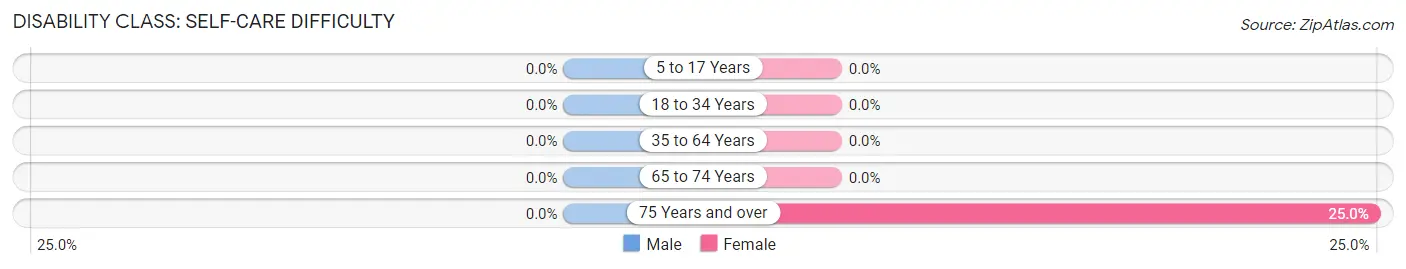
| Age Bracket | Male | Female |
| 5 to 17 Years | 0 (0.0%) | 0 (0.0%) |
| 18 to 34 Years | 0 (0.0%) | 0 (0.0%) |
| 35 to 64 Years | 0 (0.0%) | 0 (0.0%) |
| 65 to 74 Years | 0 (0.0%) | 0 (0.0%) |
| 75 Years and over | 0 (0.0%) | 2 (25.0%) |
Technology Access in Brookeville
Computing Device Access in Brookeville
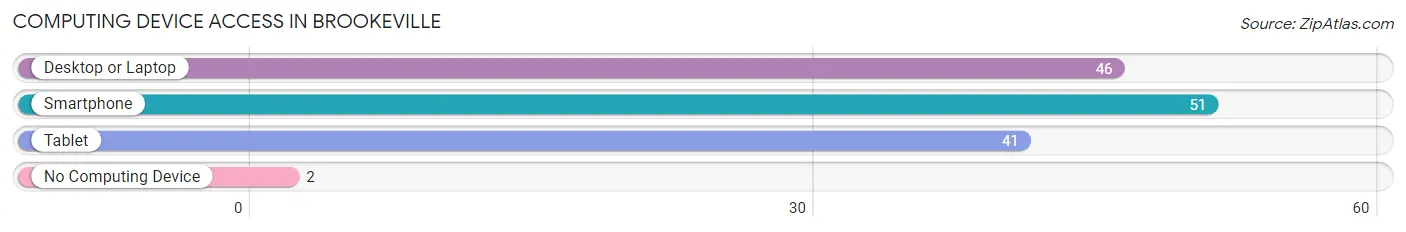
| Device Type | # Households | % Households |
| Desktop or Laptop | 46 | 86.8% |
| Smartphone | 51 | 96.2% |
| Tablet | 41 | 77.4% |
| No Computing Device | 2 | 3.8% |
| Total | 53 | 100.0% |
Internet Access in Brookeville
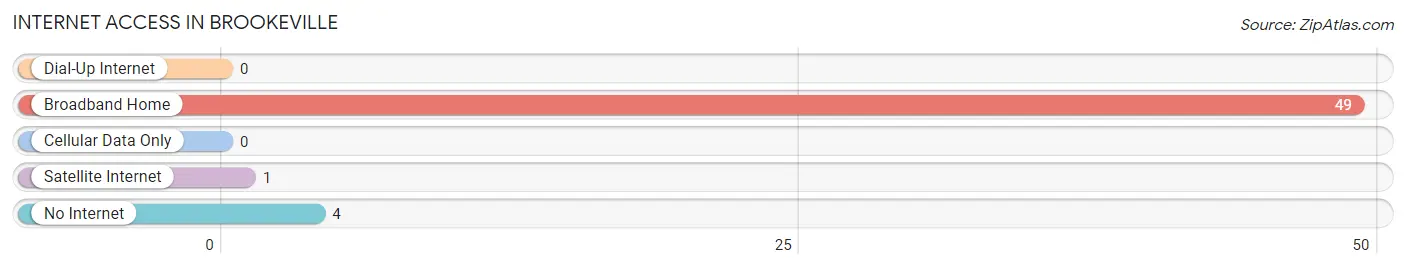
| Internet Type | # Households | % Households |
| Dial-Up Internet | 0 | 0.0% |
| Broadband Home | 49 | 92.4% |
| Cellular Data Only | 0 | 0.0% |
| Satellite Internet | 1 | 1.9% |
| No Internet | 4 | 7.5% |
| Total | 53 | 100.0% |
Brookeville Summary
Brookeville, Maryland is a small town located in Montgomery County, Maryland, approximately 20 miles north of Washington, D.C. It is a historic town, founded in 1794, and is the only incorporated town in Montgomery County. The town is known for its historic buildings, quaint atmosphere, and its proximity to Washington, D.C.
History
Brookeville was founded in 1794 by Richard Thomas, a Quaker from Pennsylvania. Thomas purchased the land from the Brooke family, who had owned the land since the late 1600s. Thomas named the town after the Brooke family, and it was officially incorporated in 1808.
The town was an important stop on the Underground Railroad, and was the site of the first meeting of the Montgomery County government in 1813. During the War of 1812, the town was briefly occupied by British troops, who were driven out by local militia.
In the 19th century, Brookeville was a popular summer destination for wealthy Washingtonians, who built large estates in the area. The town was also home to several mills, which provided employment for many of the town’s residents.
Geography
Brookeville is located in Montgomery County, Maryland, approximately 20 miles north of Washington, D.C. The town is situated on the western edge of the Patuxent River, and is bordered by the towns of Olney and Sandy Spring to the north, and the towns of Ashton and Laytonsville to the south.
The town covers an area of 1.2 square miles, and has a population of approximately 1,200 people. The town is mostly residential, with a few small businesses located in the downtown area.
Economy
The economy of Brookeville is largely based on tourism and small businesses. The town is a popular destination for visitors from Washington, D.C., who come to enjoy the town’s historic buildings and quaint atmosphere.
The town is also home to several small businesses, including restaurants, antique stores, and art galleries. The town is also home to several small farms, which produce a variety of fruits and vegetables.
Demographics
As of the 2010 census, the population of Brookeville was 1,203. The racial makeup of the town was 87.3% White, 8.2% African American, 0.7% Asian, 0.2% Native American, and 3.6% from other races.
The median household income in Brookeville was $107,917, and the median family income was $118,917. The per capita income was $45,917. Approximately 8.2% of the population was below the poverty line.
The town is served by the Montgomery County Public Schools system. The town is home to one elementary school, one middle school, and one high school.
Common Questions
What is Per Capita Income in Brookeville?
Per Capita income in Brookeville is $62,971.
What is the Median Family Income in Brookeville?
Median Family Income in Brookeville is $188,750.
What is the Median Household income in Brookeville?
Median Household Income in Brookeville is $182,188.
What is Income or Wage Gap in Brookeville?
Income or Wage Gap in Brookeville is 38.1%.
Women in Brookeville earn 61.9 cents for every dollar earned by a man.
What is Inequality or Gini Index in Brookeville?
Inequality or Gini Index in Brookeville is 0.36.
What is the Total Population of Brookeville?
Total Population of Brookeville is 164.
What is the Total Male Population of Brookeville?
Total Male Population of Brookeville is 80.
What is the Total Female Population of Brookeville?
Total Female Population of Brookeville is 84.
What is the Ratio of Males per 100 Females in Brookeville?
There are 95.24 Males per 100 Females in Brookeville.
What is the Ratio of Females per 100 Males in Brookeville?
There are 105.00 Females per 100 Males in Brookeville.
What is the Median Population Age in Brookeville?
Median Population Age in Brookeville is 41.3 Years.
What is the Average Family Size in Brookeville
Average Family Size in Brookeville is 3.2 People.
What is the Average Household Size in Brookeville
Average Household Size in Brookeville is 3.1 People.
How Large is the Labor Force in Brookeville?
There are 99 People in the Labor Forcein in Brookeville.
What is the Percentage of People in the Labor Force in Brookeville?
77.3% of People are in the Labor Force in Brookeville.