Cities with the Highest Percentage of Local Government Employees in Massachusetts
RELATED REPORTS & OPTIONS
Local Government Employees
Massachusetts
Compare Cities
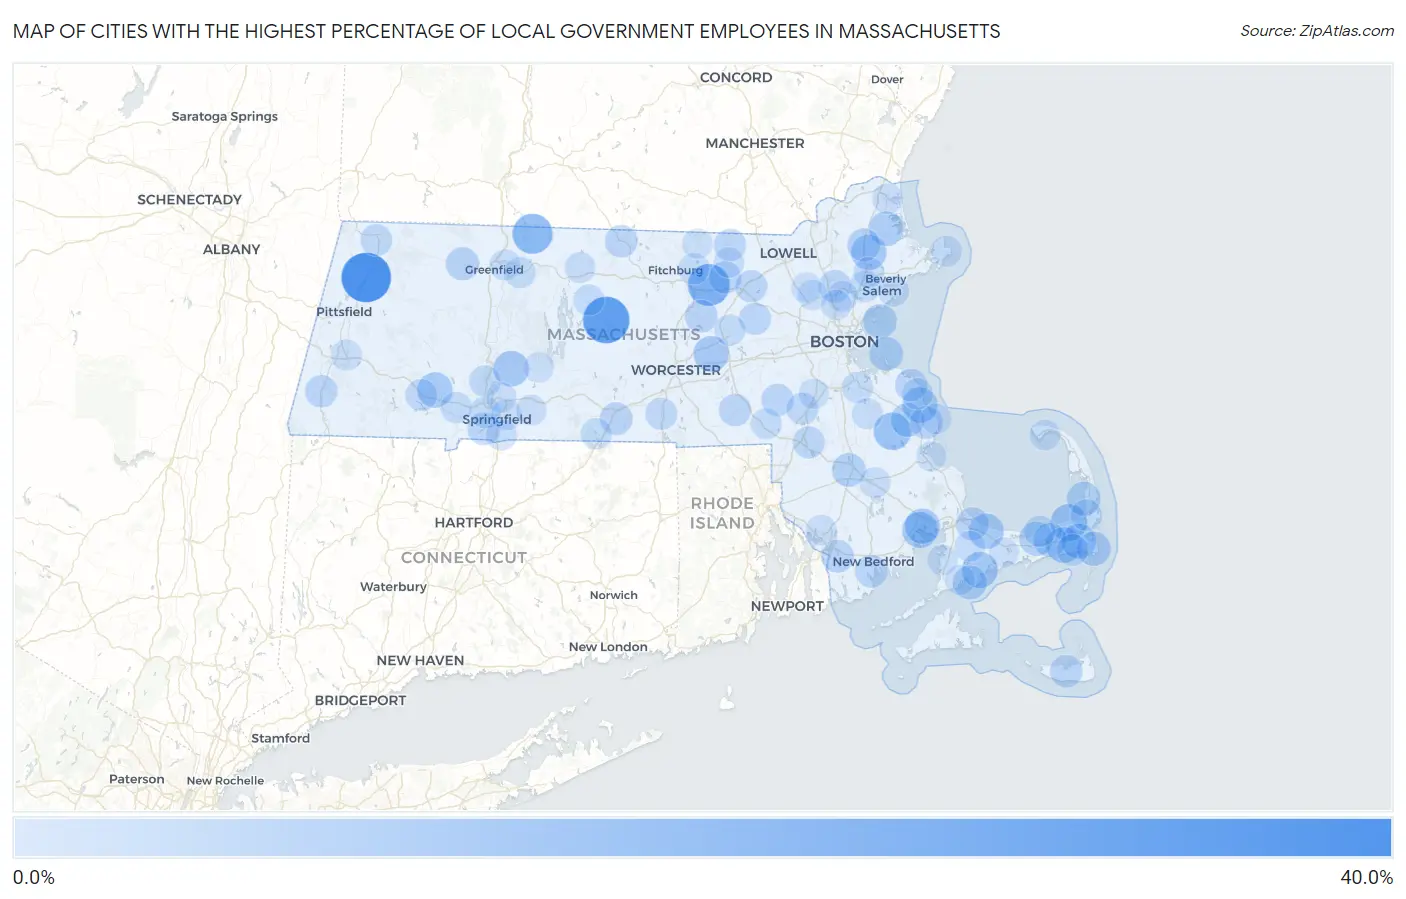
Map of Cities with the Highest Percentage of Local Government Employees in Massachusetts
0.0%
40.0%
Cities with the Highest Percentage of Local Government Employees in Massachusetts
| City | % Local Government Employees | vs State | vs National | |
| 1. | Cheshire | 39.0% | 7.0%(+32.0)#1 | 7.2%(+31.8)#497 |
| 2. | Barre | 33.8% | 7.0%(+26.8)#2 | 7.2%(+26.6)#698 |
| 3. | Shirley | 26.3% | 7.0%(+19.3)#3 | 7.2%(+19.1)#1,168 |
| 4. | Northfield | 23.2% | 7.0%(+16.3)#4 | 7.2%(+16.0)#1,492 |
| 5. | Hanson | 19.1% | 7.0%(+12.1)#5 | 7.2%(+11.8)#2,259 |
| 6. | Brewster | 17.9% | 7.0%(+10.9)#6 | 7.2%(+10.7)#2,597 |
| 7. | Green Harbor | 16.6% | 7.0%(+9.56)#7 | 7.2%(+9.32)#3,090 |
| 8. | Northwest Harwich | 16.4% | 7.0%(+9.43)#8 | 7.2%(+9.20)#3,144 |
| 9. | Mashpee Neck | 16.4% | 7.0%(+9.42)#9 | 7.2%(+9.19)#3,150 |
| 10. | Weweantic | 16.4% | 7.0%(+9.41)#10 | 7.2%(+9.17)#3,155 |
| 11. | Granby | 16.2% | 7.0%(+9.18)#11 | 7.2%(+8.95)#3,255 |
| 12. | Northborough | 15.9% | 7.0%(+8.90)#12 | 7.2%(+8.66)#3,385 |
| 13. | Topsfield | 15.7% | 7.0%(+8.74)#13 | 7.2%(+8.50)#3,476 |
| 14. | Russell | 15.5% | 7.0%(+8.55)#14 | 7.2%(+8.32)#3,582 |
| 15. | Marshfield Hills | 15.5% | 7.0%(+8.51)#15 | 7.2%(+8.28)#3,595 |
| 16. | East Sandwich | 15.5% | 7.0%(+8.49)#16 | 7.2%(+8.25)#3,604 |
| 17. | Wareham Center | 15.5% | 7.0%(+8.48)#17 | 7.2%(+8.24)#3,612 |
| 18. | East Harwich | 15.2% | 7.0%(+8.16)#18 | 7.2%(+7.93)#3,791 |
| 19. | Cedar Crest | 15.0% | 7.0%(+8.02)#19 | 7.2%(+7.79)#3,878 |
| 20. | Rowley | 14.4% | 7.0%(+7.45)#20 | 7.2%(+7.21)#4,242 |
| 21. | Chatham | 13.7% | 7.0%(+6.74)#21 | 7.2%(+6.50)#4,771 |
| 22. | Nahant | 13.5% | 7.0%(+6.49)#22 | 7.2%(+6.26)#4,956 |
| 23. | Yarmouth Port | 13.4% | 7.0%(+6.43)#23 | 7.2%(+6.20)#5,002 |
| 24. | North Eastham | 13.4% | 7.0%(+6.37)#24 | 7.2%(+6.13)#5,054 |
| 25. | Seconsett Island | 13.3% | 7.0%(+6.34)#25 | 7.2%(+6.11)#5,084 |
| 26. | Hull | 13.3% | 7.0%(+6.31)#26 | 7.2%(+6.08)#5,105 |
| 27. | South Dennis | 13.3% | 7.0%(+6.31)#27 | 7.2%(+6.08)#5,106 |
| 28. | North Pembroke | 13.2% | 7.0%(+6.19)#28 | 7.2%(+5.96)#5,189 |
| 29. | Raynham Center | 13.1% | 7.0%(+6.07)#29 | 7.2%(+5.84)#5,278 |
| 30. | Shelburne Falls | 12.4% | 7.0%(+5.41)#30 | 7.2%(+5.17)#5,867 |
| 31. | Boxford | 12.0% | 7.0%(+5.04)#31 | 7.2%(+4.81)#6,278 |
| 32. | Sandwich | 11.8% | 7.0%(+4.80)#32 | 7.2%(+4.57)#6,518 |
| 33. | Sturbridge | 11.7% | 7.0%(+4.74)#33 | 7.2%(+4.51)#6,593 |
| 34. | Marshfield | 11.6% | 7.0%(+4.61)#34 | 7.2%(+4.38)#6,727 |
| 35. | South Lancaster | 11.5% | 7.0%(+4.54)#35 | 7.2%(+4.31)#6,819 |
| 36. | North Westport | 11.5% | 7.0%(+4.46)#36 | 7.2%(+4.23)#6,909 |
| 37. | Reading | 11.4% | 7.0%(+4.42)#37 | 7.2%(+4.19)#6,969 |
| 38. | Bliss Corner | 11.4% | 7.0%(+4.36)#38 | 7.2%(+4.13)#7,019 |
| 39. | Nantucket | 11.3% | 7.0%(+4.33)#39 | 7.2%(+4.10)#7,055 |
| 40. | Winchendon | 11.2% | 7.0%(+4.17)#40 | 7.2%(+3.93)#7,264 |
| 41. | Agawam Town | 11.0% | 7.0%(+4.03)#41 | 7.2%(+3.79)#7,449 |
| 42. | North Scituate | 11.0% | 7.0%(+4.02)#42 | 7.2%(+3.79)#7,452 |
| 43. | Great Barrington | 11.0% | 7.0%(+4.02)#43 | 7.2%(+3.78)#7,460 |
| 44. | Ayer | 11.0% | 7.0%(+3.97)#44 | 7.2%(+3.74)#7,515 |
| 45. | Millis Clicquot | 11.0% | 7.0%(+3.96)#45 | 7.2%(+3.73)#7,534 |
| 46. | Hopedale | 10.8% | 7.0%(+3.85)#46 | 7.2%(+3.62)#7,657 |
| 47. | Mansfield Center | 10.5% | 7.0%(+3.51)#47 | 7.2%(+3.27)#8,143 |
| 48. | Littleton Common | 10.5% | 7.0%(+3.50)#48 | 7.2%(+3.27)#8,144 |
| 49. | Maynard | 10.5% | 7.0%(+3.49)#49 | 7.2%(+3.25)#8,171 |
| 50. | East Pepperell | 10.5% | 7.0%(+3.48)#50 | 7.2%(+3.24)#8,190 |
| 51. | Blandford | 10.2% | 7.0%(+3.23)#51 | 7.2%(+3.00)#8,547 |
| 52. | Walpole | 10.2% | 7.0%(+3.20)#52 | 7.2%(+2.97)#8,595 |
| 53. | Oxford | 10.2% | 7.0%(+3.19)#53 | 7.2%(+2.96)#8,609 |
| 54. | North Adams | 10.1% | 7.0%(+3.10)#54 | 7.2%(+2.87)#8,738 |
| 55. | Holyoke | 9.9% | 7.0%(+2.93)#55 | 7.2%(+2.70)#9,034 |
| 56. | Peabody | 9.9% | 7.0%(+2.87)#56 | 7.2%(+2.64)#9,140 |
| 57. | Harwich Port | 9.7% | 7.0%(+2.70)#57 | 7.2%(+2.46)#9,429 |
| 58. | West Springfield Town | 9.5% | 7.0%(+2.48)#58 | 7.2%(+2.24)#9,846 |
| 59. | Dennis | 9.5% | 7.0%(+2.47)#59 | 7.2%(+2.24)#9,860 |
| 60. | Westfield | 9.4% | 7.0%(+2.43)#60 | 7.2%(+2.19)#9,939 |
| 61. | Orleans | 9.4% | 7.0%(+2.43)#61 | 7.2%(+2.19)#9,943 |
| 62. | Hudson | 9.3% | 7.0%(+2.32)#62 | 7.2%(+2.09)#10,128 |
| 63. | Braintree Town | 9.3% | 7.0%(+2.28)#63 | 7.2%(+2.05)#10,212 |
| 64. | Lunenburg | 9.2% | 7.0%(+2.22)#64 | 7.2%(+1.99)#10,329 |
| 65. | Holland | 9.2% | 7.0%(+2.16)#65 | 7.2%(+1.92)#10,450 |
| 66. | Scituate | 9.1% | 7.0%(+2.12)#66 | 7.2%(+1.89)#10,515 |
| 67. | Millers Falls | 9.1% | 7.0%(+2.10)#67 | 7.2%(+1.86)#10,551 |
| 68. | Franklin Town | 9.0% | 7.0%(+1.99)#68 | 7.2%(+1.76)#10,765 |
| 69. | Petersham | 9.0% | 7.0%(+1.97)#69 | 7.2%(+1.74)#10,809 |
| 70. | Wakefield | 8.8% | 7.0%(+1.84)#70 | 7.2%(+1.60)#11,054 |
| 71. | Rockport | 8.8% | 7.0%(+1.81)#71 | 7.2%(+1.58)#11,107 |
| 72. | Oak Bluffs | 8.7% | 7.0%(+1.75)#72 | 7.2%(+1.52)#11,238 |
| 73. | Turners Falls | 8.7% | 7.0%(+1.74)#73 | 7.2%(+1.51)#11,257 |
| 74. | Middleborough Center | 8.7% | 7.0%(+1.71)#74 | 7.2%(+1.48)#11,310 |
| 75. | Lee | 8.7% | 7.0%(+1.71)#75 | 7.2%(+1.47)#11,319 |
| 76. | Abington | 8.7% | 7.0%(+1.70)#76 | 7.2%(+1.46)#11,351 |
| 77. | Longmeadow | 8.6% | 7.0%(+1.65)#77 | 7.2%(+1.41)#11,450 |
| 78. | Forestdale | 8.5% | 7.0%(+1.52)#78 | 7.2%(+1.29)#11,703 |
| 79. | Danvers | 8.5% | 7.0%(+1.48)#79 | 7.2%(+1.25)#11,785 |
| 80. | Provincetown | 8.4% | 7.0%(+1.42)#80 | 7.2%(+1.18)#11,916 |
| 81. | Salem | 8.4% | 7.0%(+1.37)#81 | 7.2%(+1.13)#12,022 |
| 82. | Athol | 8.3% | 7.0%(+1.33)#82 | 7.2%(+1.10)#12,115 |
| 83. | Springfield | 8.3% | 7.0%(+1.26)#83 | 7.2%(+1.03)#12,239 |
| 84. | North Falmouth | 8.2% | 7.0%(+1.24)#84 | 7.2%(+1.01)#12,281 |
| 85. | Wilbraham | 8.2% | 7.0%(+1.21)#85 | 7.2%(+0.980)#12,342 |
| 86. | Newburyport | 8.2% | 7.0%(+1.18)#86 | 7.2%(+0.942)#12,436 |
| 87. | Ocean Bluff Brant Rock | 8.2% | 7.0%(+1.16)#87 | 7.2%(+0.923)#12,478 |
| 88. | Somerset | 8.1% | 7.0%(+1.10)#88 | 7.2%(+0.862)#12,596 |
| 89. | Burlington | 8.1% | 7.0%(+1.06)#89 | 7.2%(+0.823)#12,681 |
| 90. | Groton | 8.0% | 7.0%(+1.03)#90 | 7.2%(+0.799)#12,730 |
| 91. | Chicopee | 8.0% | 7.0%(+0.963)#91 | 7.2%(+0.730)#12,879 |
| 92. | Norwood | 7.8% | 7.0%(+0.840)#92 | 7.2%(+0.607)#13,175 |
| 93. | Stoneham | 7.8% | 7.0%(+0.808)#93 | 7.2%(+0.574)#13,244 |
| 94. | East Falmouth | 7.7% | 7.0%(+0.755)#94 | 7.2%(+0.522)#13,371 |
| 95. | Townsend | 7.7% | 7.0%(+0.748)#95 | 7.2%(+0.514)#13,385 |
| 96. | Greenfield | 7.7% | 7.0%(+0.737)#96 | 7.2%(+0.503)#13,406 |
| 97. | Belchertown | 7.7% | 7.0%(+0.709)#97 | 7.2%(+0.476)#13,482 |
| 98. | Pinehurst | 7.6% | 7.0%(+0.653)#98 | 7.2%(+0.420)#13,631 |
| 99. | Barnstable Town | 7.5% | 7.0%(+0.544)#99 | 7.2%(+0.311)#13,895 |
| 100. | North Plymouth | 7.5% | 7.0%(+0.528)#100 | 7.2%(+0.295)#13,924 |
Common Questions
What are the Top 10 Cities with the Highest Percentage of Local Government Employees in Massachusetts?
Top 10 Cities with the Highest Percentage of Local Government Employees in Massachusetts are:
#1
39.0%
#2
33.8%
#3
26.3%
#4
23.2%
#5
19.1%
#6
17.9%
#7
16.4%
#8
16.4%
#9
16.4%
#10
16.2%
What city has the Highest Percentage of Local Government Employees in Massachusetts?
Cheshire has the Highest Percentage of Local Government Employees in Massachusetts with 39.0%.
What is the Percentage of Local Government Employees in the State of Massachusetts?
Percentage of Local Government Employees in Massachusetts is 7.0%.
What is the Percentage of Local Government Employees in the United States?
Percentage of Local Government Employees in the United States is 7.2%.