Cities with the Highest Percentage of Local Government Employees in Mississippi
RELATED REPORTS & OPTIONS
Local Government Employees
Mississippi
Compare Cities
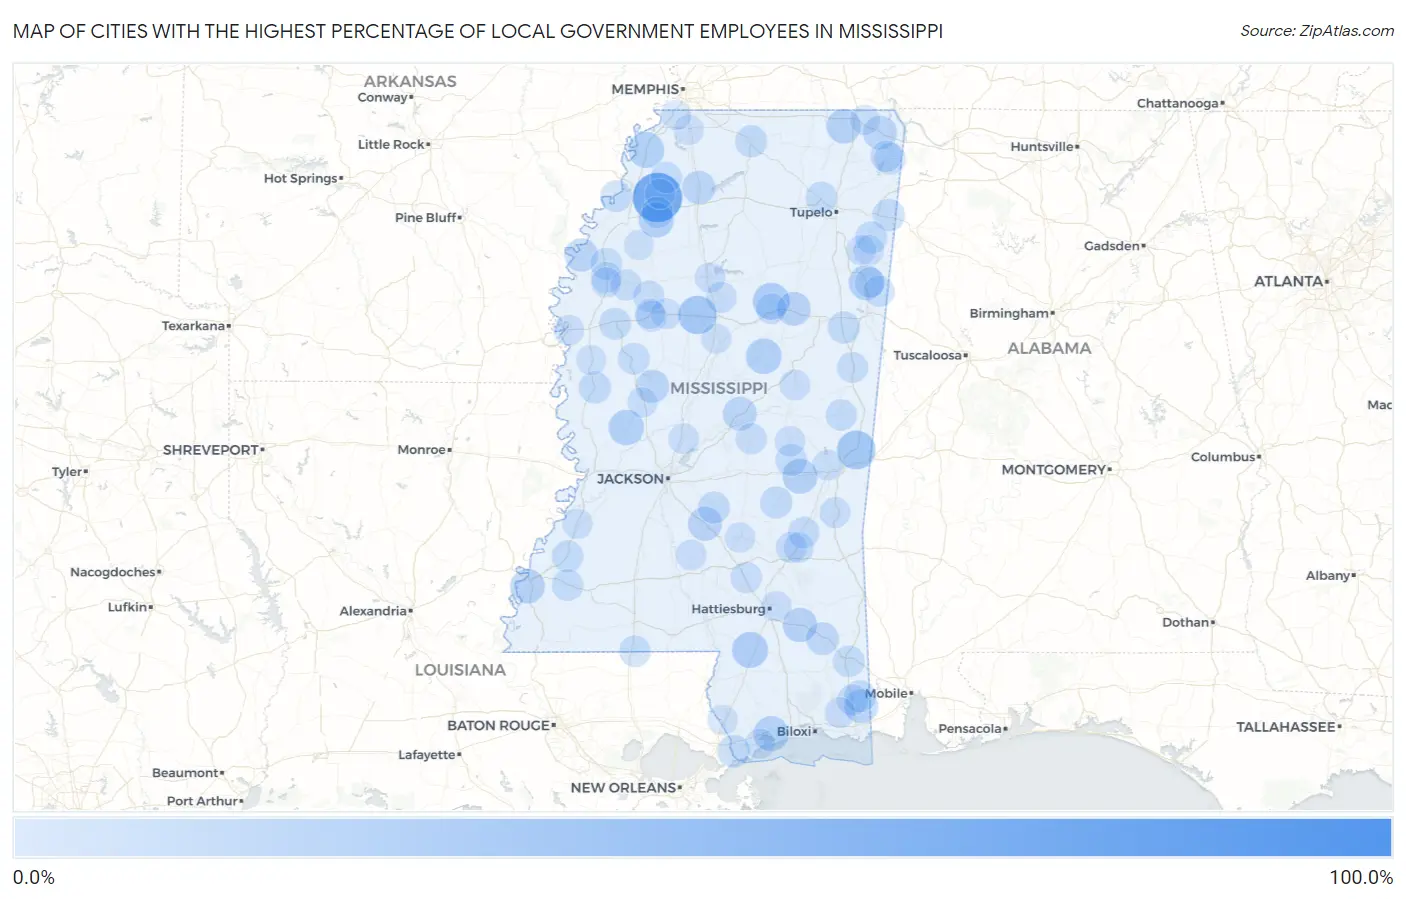
Map of Cities with the Highest Percentage of Local Government Employees in Mississippi
0.0%
100.0%
Cities with the Highest Percentage of Local Government Employees in Mississippi
| City | % Local Government Employees | vs State | vs National | |
| 1. | Panther Burn | 100.0% | 6.7%(+93.3)#1 | 7.2%(+92.8)#24 |
| 2. | Darling | 70.6% | 6.7%(+63.9)#2 | 7.2%(+63.4)#108 |
| 3. | Bond | 63.6% | 6.7%(+56.9)#3 | 7.2%(+56.4)#144 |
| 4. | New Site | 38.8% | 6.7%(+32.1)#4 | 7.2%(+31.6)#500 |
| 5. | Eastabuchie | 37.8% | 6.7%(+31.1)#5 | 7.2%(+30.6)#539 |
| 6. | Lauderdale | 35.8% | 6.7%(+29.1)#6 | 7.2%(+28.6)#613 |
| 7. | Carrollton | 35.6% | 6.7%(+28.9)#7 | 7.2%(+28.4)#623 |
| 8. | Walthall | 30.6% | 6.7%(+23.9)#8 | 7.2%(+23.3)#877 |
| 9. | Lumberton | 27.8% | 6.7%(+21.1)#9 | 7.2%(+20.5)#1,041 |
| 10. | North Tunica | 27.3% | 6.7%(+20.6)#10 | 7.2%(+20.0)#1,074 |
| 11. | Mccool | 26.7% | 6.7%(+20.0)#11 | 7.2%(+19.4)#1,139 |
| 12. | Satartia | 25.9% | 6.7%(+19.2)#12 | 7.2%(+18.7)#1,204 |
| 13. | Delisle | 25.6% | 6.7%(+18.9)#13 | 7.2%(+18.3)#1,232 |
| 14. | Lambert | 25.3% | 6.7%(+18.6)#14 | 7.2%(+18.1)#1,256 |
| 15. | Hickory | 24.6% | 6.7%(+17.9)#15 | 7.2%(+17.4)#1,356 |
| 16. | New Hamilton | 24.5% | 6.7%(+17.8)#16 | 7.2%(+17.3)#1,362 |
| 17. | Redwood | 23.9% | 6.7%(+17.2)#17 | 7.2%(+16.7)#1,415 |
| 18. | Bobo | 23.4% | 6.7%(+16.7)#18 | 7.2%(+16.2)#1,463 |
| 19. | Kossuth | 23.3% | 6.7%(+16.6)#19 | 7.2%(+16.1)#1,473 |
| 20. | Cloverdale | 23.3% | 6.7%(+16.6)#20 | 7.2%(+16.1)#1,479 |
| 21. | New Augusta | 22.9% | 6.7%(+16.2)#21 | 7.2%(+15.7)#1,538 |
| 22. | Mendenhall | 21.6% | 6.7%(+14.9)#22 | 7.2%(+14.4)#1,743 |
| 23. | Maben | 21.5% | 6.7%(+14.8)#23 | 7.2%(+14.3)#1,763 |
| 24. | Burnsville | 21.3% | 6.7%(+14.6)#24 | 7.2%(+14.1)#1,791 |
| 25. | Redwater | 21.2% | 6.7%(+14.5)#25 | 7.2%(+14.0)#1,803 |
| 26. | Big Point | 20.9% | 6.7%(+14.2)#26 | 7.2%(+13.7)#1,865 |
| 27. | Gunnison | 19.8% | 6.7%(+13.1)#27 | 7.2%(+12.5)#2,101 |
| 28. | Eden | 19.6% | 6.7%(+12.9)#28 | 7.2%(+12.4)#2,130 |
| 29. | Sardis | 19.4% | 6.7%(+12.7)#29 | 7.2%(+12.1)#2,183 |
| 30. | Glen Allan | 18.6% | 6.7%(+11.9)#30 | 7.2%(+11.4)#2,400 |
| 31. | Mclain | 18.3% | 6.7%(+11.6)#31 | 7.2%(+11.1)#2,492 |
| 32. | Pearlington | 18.2% | 6.7%(+11.5)#32 | 7.2%(+11.0)#2,513 |
| 33. | Anguilla | 16.5% | 6.7%(+9.83)#33 | 7.2%(+9.30)#3,099 |
| 34. | Artesia | 16.4% | 6.7%(+9.71)#34 | 7.2%(+9.18)#3,152 |
| 35. | Tremont | 16.4% | 6.7%(+9.67)#35 | 7.2%(+9.14)#3,170 |
| 36. | Montrose | 16.3% | 6.7%(+9.63)#36 | 7.2%(+9.10)#3,186 |
| 37. | Holly Springs | 16.2% | 6.7%(+9.47)#37 | 7.2%(+8.94)#3,259 |
| 38. | Hurley | 16.1% | 6.7%(+9.35)#38 | 7.2%(+8.82)#3,313 |
| 39. | Smithville | 16.0% | 6.7%(+9.30)#39 | 7.2%(+8.77)#3,333 |
| 40. | De Soto | 15.6% | 6.7%(+8.90)#40 | 7.2%(+8.37)#3,557 |
| 41. | Puckett | 15.6% | 6.7%(+8.87)#41 | 7.2%(+8.34)#3,568 |
| 42. | Indianola | 15.4% | 6.7%(+8.68)#42 | 7.2%(+8.15)#3,670 |
| 43. | Decatur | 15.3% | 6.7%(+8.60)#43 | 7.2%(+8.07)#3,705 |
| 44. | Belzoni | 14.9% | 6.7%(+8.25)#44 | 7.2%(+7.72)#3,922 |
| 45. | Mound Bayou | 14.9% | 6.7%(+8.22)#45 | 7.2%(+7.69)#3,937 |
| 46. | Fayette | 14.9% | 6.7%(+8.20)#46 | 7.2%(+7.67)#3,949 |
| 47. | Tishomingo | 14.9% | 6.7%(+8.17)#47 | 7.2%(+7.64)#3,967 |
| 48. | Lucedale | 14.6% | 6.7%(+7.88)#48 | 7.2%(+7.35)#4,147 |
| 49. | Friars Point | 14.6% | 6.7%(+7.87)#49 | 7.2%(+7.34)#4,152 |
| 50. | Roxie | 14.5% | 6.7%(+7.82)#50 | 7.2%(+7.29)#4,184 |
| 51. | Marks | 14.4% | 6.7%(+7.67)#51 | 7.2%(+7.13)#4,286 |
| 52. | Sherman | 14.3% | 6.7%(+7.64)#52 | 7.2%(+7.11)#4,302 |
| 53. | Paden | 14.3% | 6.7%(+7.59)#53 | 7.2%(+7.06)#4,363 |
| 54. | Heidelberg | 14.2% | 6.7%(+7.49)#54 | 7.2%(+6.96)#4,434 |
| 55. | Osyka | 13.9% | 6.7%(+7.24)#55 | 7.2%(+6.71)#4,627 |
| 56. | Crenshaw | 13.9% | 6.7%(+7.19)#56 | 7.2%(+6.66)#4,659 |
| 57. | De Kalb | 13.9% | 6.7%(+7.19)#57 | 7.2%(+6.66)#4,660 |
| 58. | Seminary | 13.8% | 6.7%(+7.14)#58 | 7.2%(+6.61)#4,693 |
| 59. | Wade | 13.8% | 6.7%(+7.10)#59 | 7.2%(+6.57)#4,721 |
| 60. | Walnut Grove | 13.6% | 6.7%(+6.94)#60 | 7.2%(+6.41)#4,837 |
| 61. | Schlater | 13.3% | 6.7%(+6.64)#61 | 7.2%(+6.11)#5,078 |
| 62. | Caledonia | 13.2% | 6.7%(+6.55)#62 | 7.2%(+6.02)#5,145 |
| 63. | Duck Hill | 13.0% | 6.7%(+6.33)#63 | 7.2%(+5.80)#5,315 |
| 64. | Renova | 13.0% | 6.7%(+6.27)#64 | 7.2%(+5.74)#5,368 |
| 65. | Sharon | 12.8% | 6.7%(+6.13)#65 | 7.2%(+5.60)#5,488 |
| 66. | Macon | 12.8% | 6.7%(+6.09)#66 | 7.2%(+5.56)#5,535 |
| 67. | Ruleville | 12.7% | 6.7%(+6.03)#67 | 7.2%(+5.50)#5,581 |
| 68. | Itta Bena | 12.7% | 6.7%(+5.97)#68 | 7.2%(+5.44)#5,624 |
| 69. | Quitman | 12.4% | 6.7%(+5.68)#69 | 7.2%(+5.15)#5,886 |
| 70. | Noxapater | 12.2% | 6.7%(+5.48)#70 | 7.2%(+4.95)#6,115 |
| 71. | Kokomo | 12.2% | 6.7%(+5.46)#71 | 7.2%(+4.93)#6,137 |
| 72. | Greenwood | 11.9% | 6.7%(+5.19)#72 | 7.2%(+4.66)#6,423 |
| 73. | Nellieburg | 11.9% | 6.7%(+5.18)#73 | 7.2%(+4.65)#6,439 |
| 74. | Canton | 11.8% | 6.7%(+5.07)#74 | 7.2%(+4.54)#6,539 |
| 75. | New Hebron | 11.6% | 6.7%(+4.90)#75 | 7.2%(+4.37)#6,732 |
| 76. | Rena Lara | 11.3% | 6.7%(+4.64)#76 | 7.2%(+4.11)#7,035 |
| 77. | Eupora | 11.3% | 6.7%(+4.60)#77 | 7.2%(+4.07)#7,101 |
| 78. | Vancleave | 11.3% | 6.7%(+4.57)#78 | 7.2%(+4.04)#7,135 |
| 79. | Hatley | 11.3% | 6.7%(+4.55)#79 | 7.2%(+4.02)#7,153 |
| 80. | Greenville | 11.2% | 6.7%(+4.50)#80 | 7.2%(+3.97)#7,224 |
| 81. | Union | 11.1% | 6.7%(+4.38)#81 | 7.2%(+3.85)#7,393 |
| 82. | Petal | 11.0% | 6.7%(+4.33)#82 | 7.2%(+3.80)#7,441 |
| 83. | Port Gibson | 11.0% | 6.7%(+4.29)#83 | 7.2%(+3.75)#7,489 |
| 84. | Sandersville | 10.9% | 6.7%(+4.25)#84 | 7.2%(+3.72)#7,545 |
| 85. | Grenada | 10.9% | 6.7%(+4.24)#85 | 7.2%(+3.71)#7,559 |
| 86. | Mize | 10.9% | 6.7%(+4.19)#86 | 7.2%(+3.66)#7,602 |
| 87. | Cleveland | 10.7% | 6.7%(+4.02)#87 | 7.2%(+3.49)#7,830 |
| 88. | Hernando | 10.7% | 6.7%(+3.97)#88 | 7.2%(+3.44)#7,908 |
| 89. | Lynchburg | 10.5% | 6.7%(+3.78)#89 | 7.2%(+3.25)#8,187 |
| 90. | Amory | 10.4% | 6.7%(+3.74)#90 | 7.2%(+3.21)#8,229 |
| 91. | Hamilton | 10.4% | 6.7%(+3.74)#91 | 7.2%(+3.21)#8,241 |
| 92. | Nicholson | 10.4% | 6.7%(+3.73)#92 | 7.2%(+3.20)#8,245 |
| 93. | Bay St Louis | 10.4% | 6.7%(+3.69)#93 | 7.2%(+3.16)#8,313 |
| 94. | Vaiden | 10.3% | 6.7%(+3.65)#94 | 7.2%(+3.12)#8,375 |
| 95. | Mississippi Valley State University | 10.3% | 6.7%(+3.60)#95 | 7.2%(+3.07)#8,453 |
| 96. | Farmington | 10.3% | 6.7%(+3.56)#96 | 7.2%(+3.03)#8,505 |
| 97. | Falcon | 10.2% | 6.7%(+3.51)#97 | 7.2%(+2.98)#8,584 |
| 98. | Yazoo City | 10.1% | 6.7%(+3.45)#98 | 7.2%(+2.92)#8,657 |
| 99. | Tutwiler | 10.1% | 6.7%(+3.44)#99 | 7.2%(+2.91)#8,678 |
| 100. | Hollandale | 10.1% | 6.7%(+3.41)#100 | 7.2%(+2.88)#8,723 |
Common Questions
What are the Top 10 Cities with the Highest Percentage of Local Government Employees in Mississippi?
Top 10 Cities with the Highest Percentage of Local Government Employees in Mississippi are:
#1
70.6%
#2
35.8%
#3
35.6%
#4
30.6%
#5
27.8%
#6
27.3%
#7
26.7%
#8
25.9%
#9
25.6%
#10
25.3%
What city has the Highest Percentage of Local Government Employees in Mississippi?
Darling has the Highest Percentage of Local Government Employees in Mississippi with 70.6%.
What is the Percentage of Local Government Employees in the State of Mississippi?
Percentage of Local Government Employees in Mississippi is 6.7%.
What is the Percentage of Local Government Employees in the United States?
Percentage of Local Government Employees in the United States is 7.2%.