North Pembroke, MA Map & Demographics
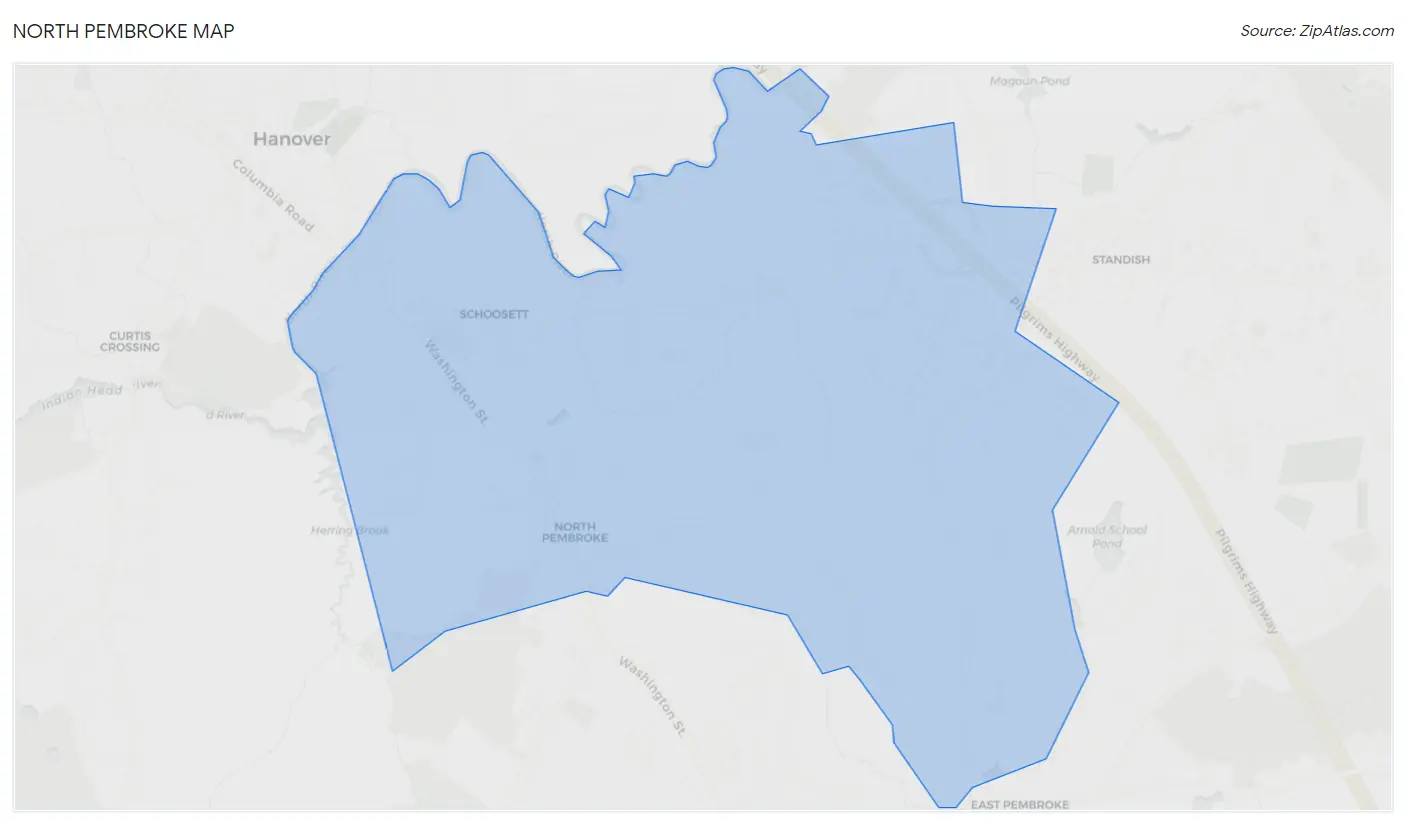
North Pembroke Map
North Pembroke Overview
$61,174
PER CAPITA INCOME
$187,769
AVG FAMILY INCOME
$156,429
AVG HOUSEHOLD INCOME
0.3%
WAGE / INCOME GAP [ % ]
99.7¢/ $1
WAGE / INCOME GAP [ $ ]
0.35
INEQUALITY / GINI INDEX
3,954
TOTAL POPULATION
1,751
MALE POPULATION
2,203
FEMALE POPULATION
79.48
MALES / 100 FEMALES
125.81
FEMALES / 100 MALES
50.8
MEDIAN AGE
2.9
AVG FAMILY SIZE
2.6
AVG HOUSEHOLD SIZE
1,866
LABOR FORCE [ PEOPLE ]
58.1%
PERCENT IN LABOR FORCE
1.6%
UNEMPLOYMENT RATE
Income in North Pembroke
Income Overview in North Pembroke
Per Capita Income in North Pembroke is $61,174, while median incomes of families and households are $187,769 and $156,429 respectively.
| Characteristic | Number | Measure |
| Per Capita Income | 3,954 | $61,174 |
| Median Family Income | 1,206 | $187,769 |
| Mean Family Income | 1,206 | $184,693 |
| Median Household Income | 1,526 | $156,429 |
| Mean Household Income | 1,526 | $158,516 |
| Income Deficit | 1,206 | $0 |
| Wage / Income Gap (%) | 3,954 | 0.32% |
| Wage / Income Gap ($) | 3,954 | 99.68¢ per $1 |
| Gini / Inequality Index | 3,954 | 0.35 |
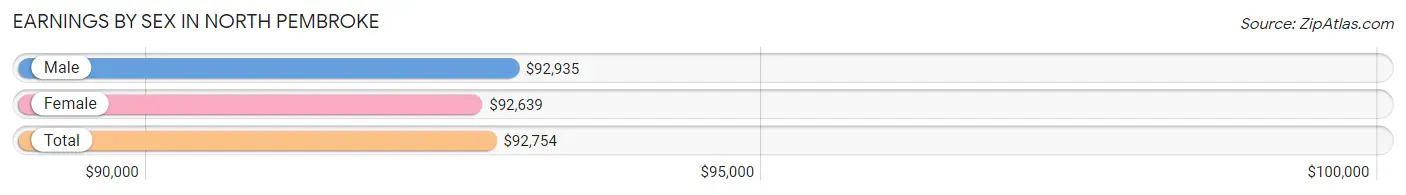
Earnings by Sex in North Pembroke
Average Earnings in North Pembroke are $92,754, $92,935 for men and $92,639 for women, a difference of 0.3%.
| Sex | Number | Average Earnings |
| Male | 946 (48.8%) | $92,935 |
| Female | 992 (51.2%) | $92,639 |
| Total | 1,938 (100.0%) | $92,754 |
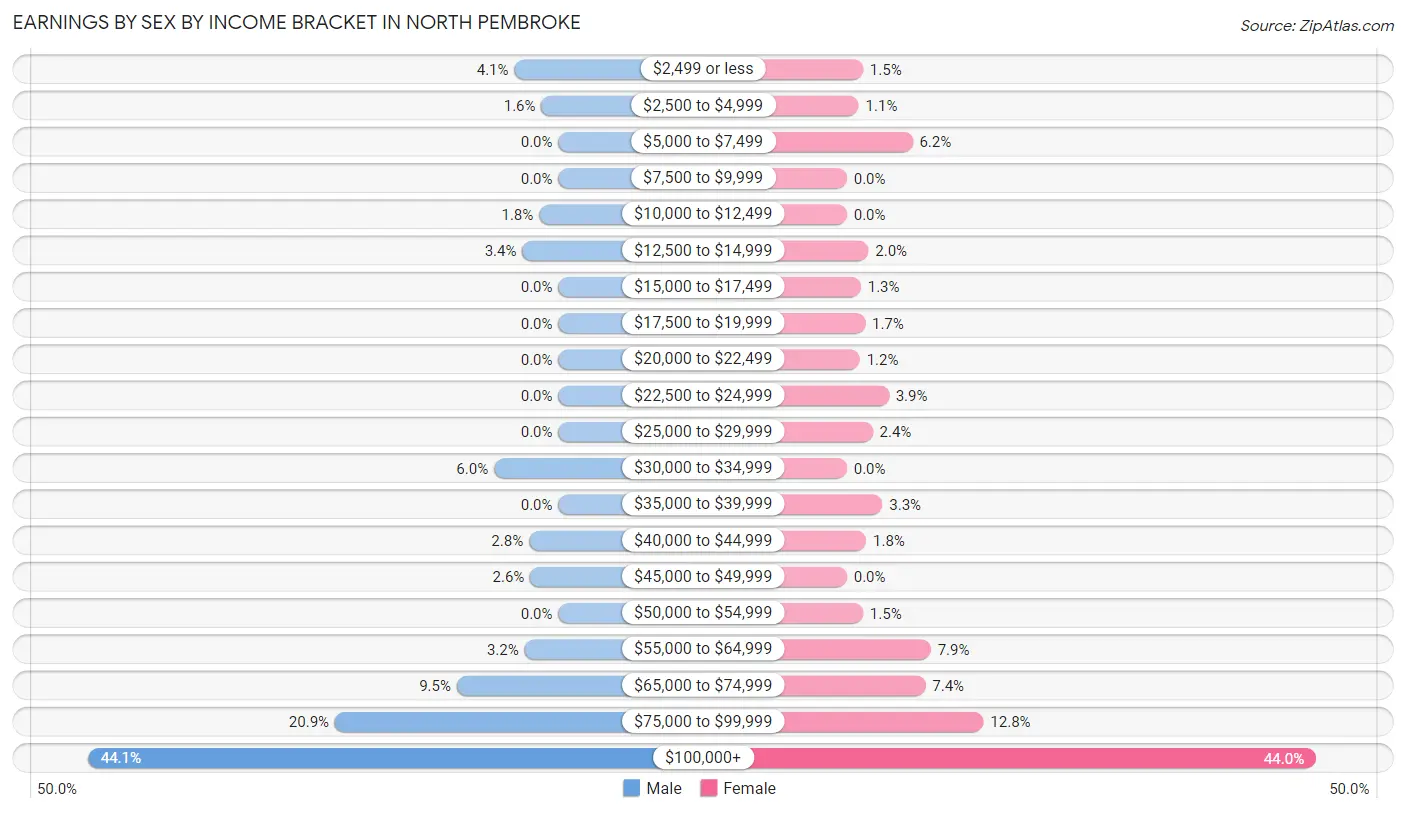
Earnings by Sex by Income Bracket in North Pembroke
The most common earnings brackets in North Pembroke are $100,000+ for men (417 | 44.1%) and $100,000+ for women (436 | 44.0%).
| Income | Male | Female |
| $2,499 or less | 39 (4.1%) | 15 (1.5%) |
| $2,500 to $4,999 | 15 (1.6%) | 11 (1.1%) |
| $5,000 to $7,499 | 0 (0.0%) | 61 (6.1%) |
| $7,500 to $9,999 | 0 (0.0%) | 0 (0.0%) |
| $10,000 to $12,499 | 17 (1.8%) | 0 (0.0%) |
| $12,500 to $14,999 | 32 (3.4%) | 20 (2.0%) |
| $15,000 to $17,499 | 0 (0.0%) | 13 (1.3%) |
| $17,500 to $19,999 | 0 (0.0%) | 17 (1.7%) |
| $20,000 to $22,499 | 0 (0.0%) | 12 (1.2%) |
| $22,500 to $24,999 | 0 (0.0%) | 39 (3.9%) |
| $25,000 to $29,999 | 0 (0.0%) | 24 (2.4%) |
| $30,000 to $34,999 | 57 (6.0%) | 0 (0.0%) |
| $35,000 to $39,999 | 0 (0.0%) | 33 (3.3%) |
| $40,000 to $44,999 | 26 (2.8%) | 18 (1.8%) |
| $45,000 to $49,999 | 25 (2.6%) | 0 (0.0%) |
| $50,000 to $54,999 | 0 (0.0%) | 15 (1.5%) |
| $55,000 to $64,999 | 30 (3.2%) | 78 (7.9%) |
| $65,000 to $74,999 | 90 (9.5%) | 73 (7.4%) |
| $75,000 to $99,999 | 198 (20.9%) | 127 (12.8%) |
| $100,000+ | 417 (44.1%) | 436 (44.0%) |
| Total | 946 (100.0%) | 992 (100.0%) |
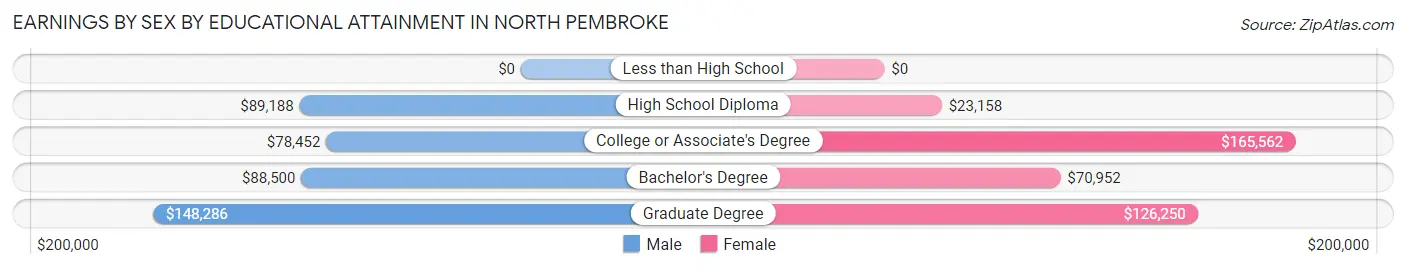
Earnings by Sex by Educational Attainment in North Pembroke
Average earnings in North Pembroke are $100,089 for men and $99,471 for women, a difference of 0.6%. Men with an educational attainment of graduate degree enjoy the highest average annual earnings of $148,286, while those with college or associate's degree education earn the least with $78,452. Women with an educational attainment of college or associate's degree earn the most with the average annual earnings of $165,562, while those with high school diploma education have the smallest earnings of $23,158.
| Educational Attainment | Male Income | Female Income |
| Less than High School | - | - |
| High School Diploma | $89,188 | $23,158 |
| College or Associate's Degree | $78,452 | $165,562 |
| Bachelor's Degree | $88,500 | $70,952 |
| Graduate Degree | $148,286 | $126,250 |
| Total | $100,089 | $99,471 |
Family Income in North Pembroke
Family Income Brackets in North Pembroke
According to the North Pembroke family income data, there are 499 families falling into the $150,000 to $199,999 income range, which is the most common income bracket and makes up 41.4% of all families.
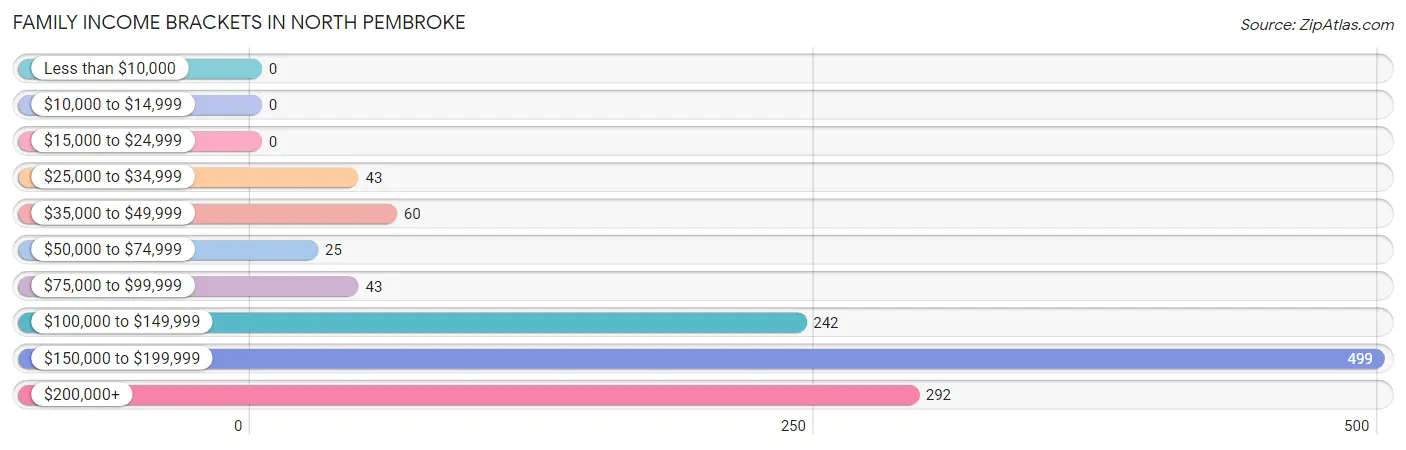
| Income Bracket | # Families | % Families |
| Less than $10,000 | 0 | 0.0% |
| $10,000 to $14,999 | 0 | 0.0% |
| $15,000 to $24,999 | 0 | 0.0% |
| $25,000 to $34,999 | 43 | 3.6% |
| $35,000 to $49,999 | 60 | 5.0% |
| $50,000 to $74,999 | 25 | 2.1% |
| $75,000 to $99,999 | 43 | 3.6% |
| $100,000 to $149,999 | 242 | 20.1% |
| $150,000 to $199,999 | 499 | 41.4% |
| $200,000+ | 292 | 24.2% |
Family Income by Famaliy Size in North Pembroke
5-person families (130 | 10.8%) account for the highest median family income in North Pembroke with $250,001 per family, while 2-person families (689 | 57.1%) have the highest median income of $81,988 per family member.
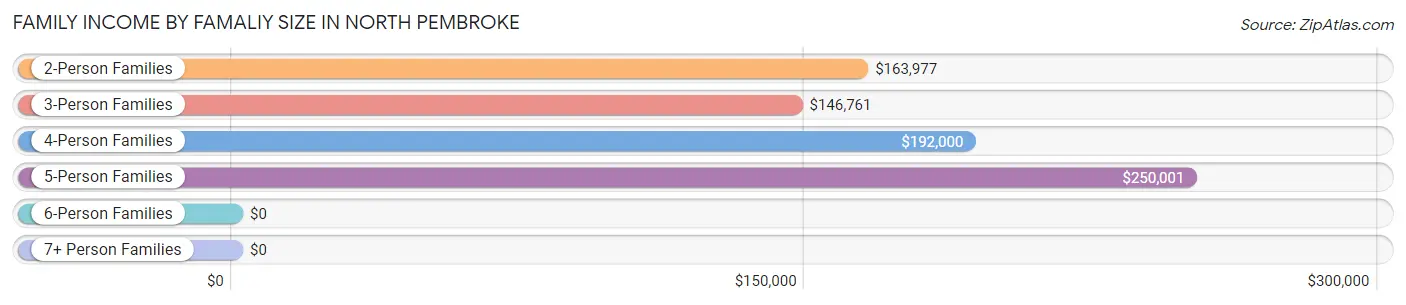
| Income Bracket | # Families | Median Income |
| 2-Person Families | 689 (57.1%) | $163,977 |
| 3-Person Families | 99 (8.2%) | $146,761 |
| 4-Person Families | 246 (20.4%) | $192,000 |
| 5-Person Families | 130 (10.8%) | $250,001 |
| 6-Person Families | 42 (3.5%) | $0 |
| 7+ Person Families | 0 (0.0%) | $0 |
| Total | 1,206 (100.0%) | $187,769 |
Family Income by Number of Earners in North Pembroke
The median family income in North Pembroke is $187,769, with families comprising 3+ earners (134) having the highest median family income of $193,750, while families with no earners (148) have the lowest median family income of $39,167, accounting for 11.1% and 12.3% of families, respectively.
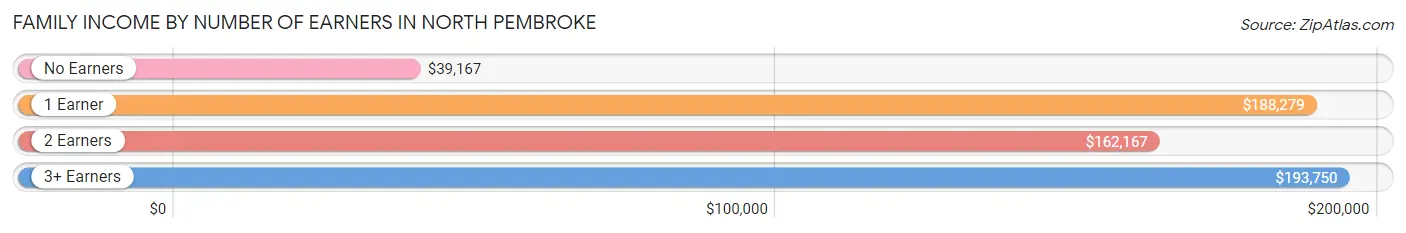
| Number of Earners | # Families | Median Income |
| No Earners | 148 (12.3%) | $39,167 |
| 1 Earner | 552 (45.8%) | $188,279 |
| 2 Earners | 372 (30.8%) | $162,167 |
| 3+ Earners | 134 (11.1%) | $193,750 |
| Total | 1,206 (100.0%) | $187,769 |
Household Income in North Pembroke
Household Income Brackets in North Pembroke
With 514 households falling in the category, the $150,000 to $199,999 income range is the most frequent in North Pembroke, accounting for 33.7% of all households.
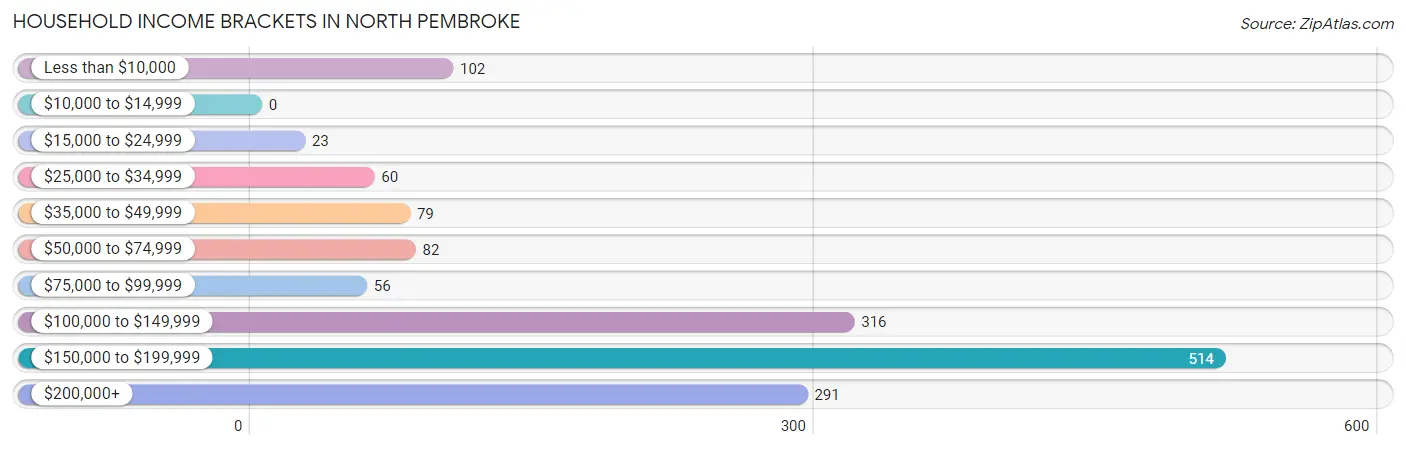
| Income Bracket | # Households | % Households |
| Less than $10,000 | 102 | 6.7% |
| $10,000 to $14,999 | 0 | 0.0% |
| $15,000 to $24,999 | 23 | 1.5% |
| $25,000 to $34,999 | 60 | 3.9% |
| $35,000 to $49,999 | 79 | 5.2% |
| $50,000 to $74,999 | 82 | 5.4% |
| $75,000 to $99,999 | 56 | 3.7% |
| $100,000 to $149,999 | 316 | 20.7% |
| $150,000 to $199,999 | 514 | 33.7% |
| $200,000+ | 291 | 19.1% |
Household Income by Householder Age in North Pembroke
The median household income in North Pembroke is $156,429, with the highest median household income of $188,388 found in the 45 to 64 years age bracket for the primary householder. A total of 820 households (53.7%) fall into this category.
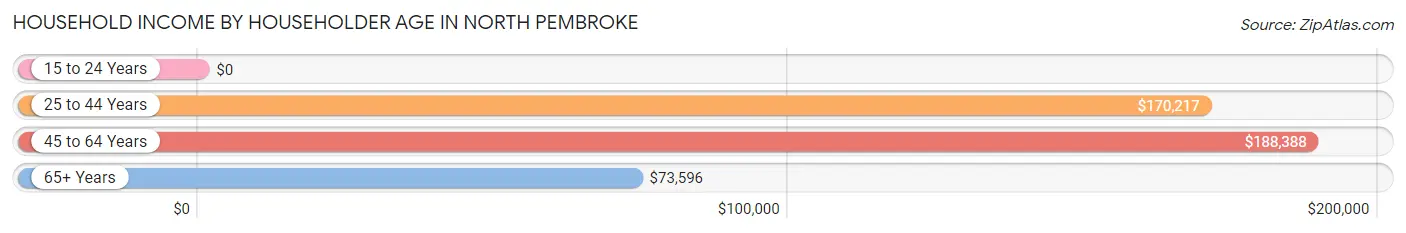
| Income Bracket | # Households | Median Income |
| 15 to 24 Years | 0 (0.0%) | $0 |
| 25 to 44 Years | 262 (17.2%) | $170,217 |
| 45 to 64 Years | 820 (53.7%) | $188,388 |
| 65+ Years | 444 (29.1%) | $73,596 |
| Total | 1,526 (100.0%) | $156,429 |
Poverty in North Pembroke
Income Below Poverty by Sex and Age in North Pembroke
With 1.9% poverty level for males and 6.6% for females among the residents of North Pembroke, 55 to 64 year old males and 75 year old and over females are the most vulnerable to poverty, with 17 males (6.2%) and 55 females (22.1%) in their respective age groups living below the poverty level.
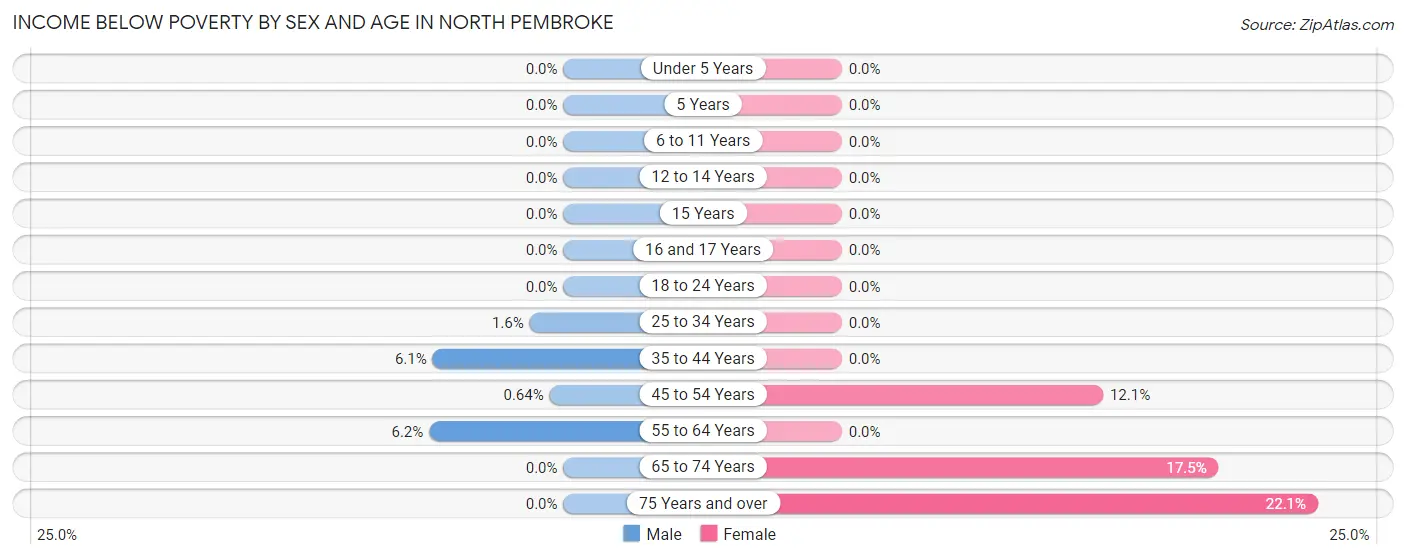
| Age Bracket | Male | Female |
| Under 5 Years | 0 (0.0%) | 0 (0.0%) |
| 5 Years | 0 (0.0%) | 0 (0.0%) |
| 6 to 11 Years | 0 (0.0%) | 0 (0.0%) |
| 12 to 14 Years | 0 (0.0%) | 0 (0.0%) |
| 15 Years | 0 (0.0%) | 0 (0.0%) |
| 16 and 17 Years | 0 (0.0%) | 0 (0.0%) |
| 18 to 24 Years | 0 (0.0%) | 0 (0.0%) |
| 25 to 34 Years | 2 (1.6%) | 0 (0.0%) |
| 35 to 44 Years | 13 (6.1%) | 0 (0.0%) |
| 45 to 54 Years | 1 (0.6%) | 48 (12.1%) |
| 55 to 64 Years | 17 (6.2%) | 0 (0.0%) |
| 65 to 74 Years | 0 (0.0%) | 43 (17.5%) |
| 75 Years and over | 0 (0.0%) | 55 (22.1%) |
| Total | 33 (1.9%) | 146 (6.6%) |
Income Above Poverty by Sex and Age in North Pembroke
According to the poverty statistics in North Pembroke, males aged under 5 years and females aged under 5 years are the age groups that are most secure financially, with 100.0% of males and 100.0% of females in these age groups living above the poverty line.
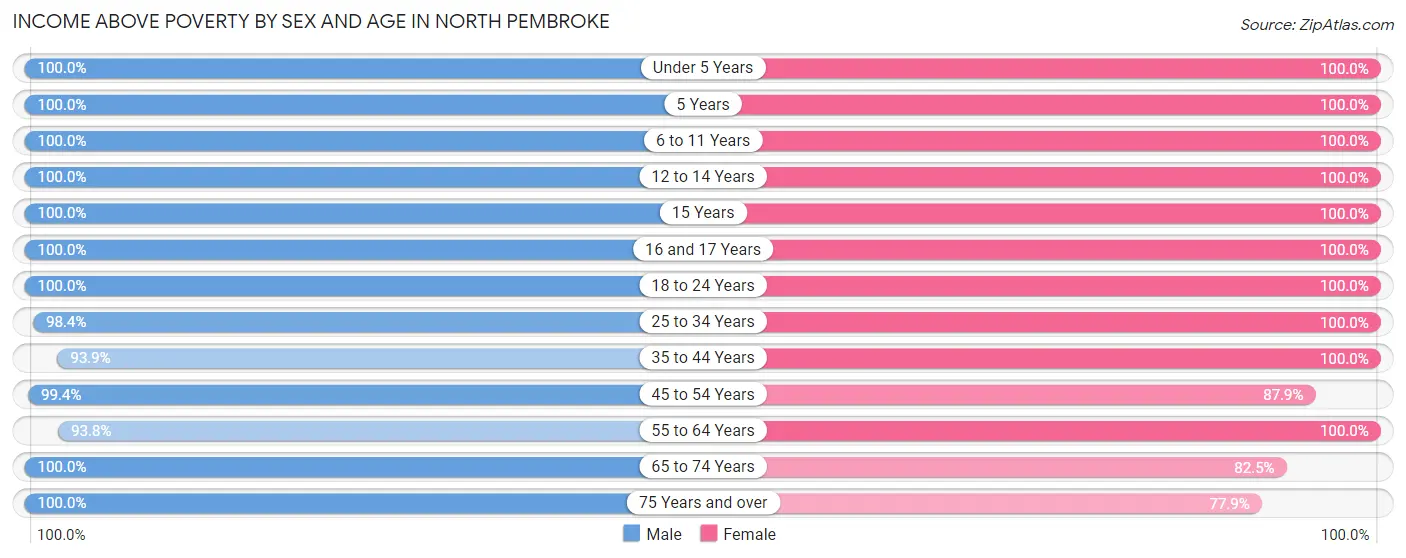
| Age Bracket | Male | Female |
| Under 5 Years | 19 (100.0%) | 120 (100.0%) |
| 5 Years | 22 (100.0%) | 46 (100.0%) |
| 6 to 11 Years | 88 (100.0%) | 62 (100.0%) |
| 12 to 14 Years | 122 (100.0%) | 167 (100.0%) |
| 15 Years | 41 (100.0%) | 56 (100.0%) |
| 16 and 17 Years | 63 (100.0%) | 52 (100.0%) |
| 18 to 24 Years | 105 (100.0%) | 110 (100.0%) |
| 25 to 34 Years | 125 (98.4%) | 63 (100.0%) |
| 35 to 44 Years | 201 (93.9%) | 219 (100.0%) |
| 45 to 54 Years | 156 (99.4%) | 348 (87.9%) |
| 55 to 64 Years | 256 (93.8%) | 417 (100.0%) |
| 65 to 74 Years | 400 (100.0%) | 203 (82.5%) |
| 75 Years and over | 109 (100.0%) | 194 (77.9%) |
| Total | 1,707 (98.1%) | 2,057 (93.4%) |
Income Below Poverty Among Married-Couple Families in North Pembroke
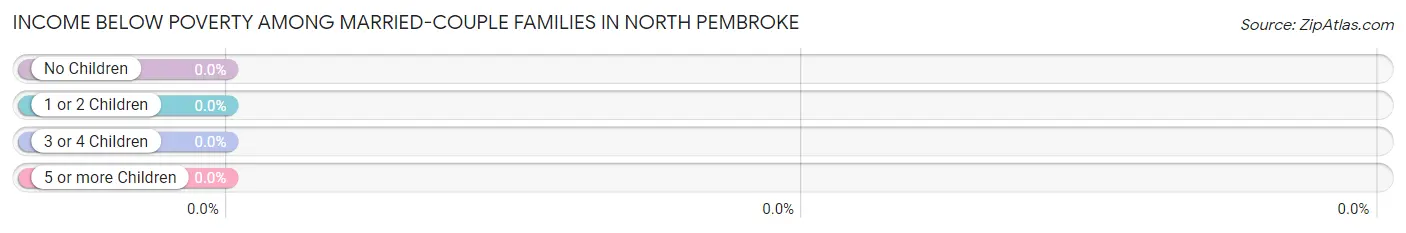
| Children | Above Poverty | Below Poverty |
| No Children | 672 (100.0%) | 0 (0.0%) |
| 1 or 2 Children | 241 (100.0%) | 0 (0.0%) |
| 3 or 4 Children | 149 (100.0%) | 0 (0.0%) |
| 5 or more Children | 0 (0.0%) | 0 (0.0%) |
| Total | 1,062 (100.0%) | 0 (0.0%) |
Income Below Poverty Among Single-Parent Households in North Pembroke
| Children | Single Father | Single Mother |
| No Children | 0 (0.0%) | 0 (0.0%) |
| 1 or 2 Children | 0 (0.0%) | 0 (0.0%) |
| 3 or 4 Children | 0 (0.0%) | 0 (0.0%) |
| 5 or more Children | 0 (0.0%) | 0 (0.0%) |
| Total | 0 (0.0%) | 0 (0.0%) |
Income Below Poverty Among Married-Couple vs Single-Parent Households in North Pembroke
| Children | Married-Couple Families | Single-Parent Households |
| No Children | 0 (0.0%) | 0 (0.0%) |
| 1 or 2 Children | 0 (0.0%) | 0 (0.0%) |
| 3 or 4 Children | 0 (0.0%) | 0 (0.0%) |
| 5 or more Children | 0 (0.0%) | 0 (0.0%) |
| Total | 0 (0.0%) | 0 (0.0%) |
Race in North Pembroke
The most populous races in North Pembroke are White / Caucasian (3,599 | 91.0%), Two or more Races (226 | 5.7%), and Hispanic or Latino (121 | 3.1%).
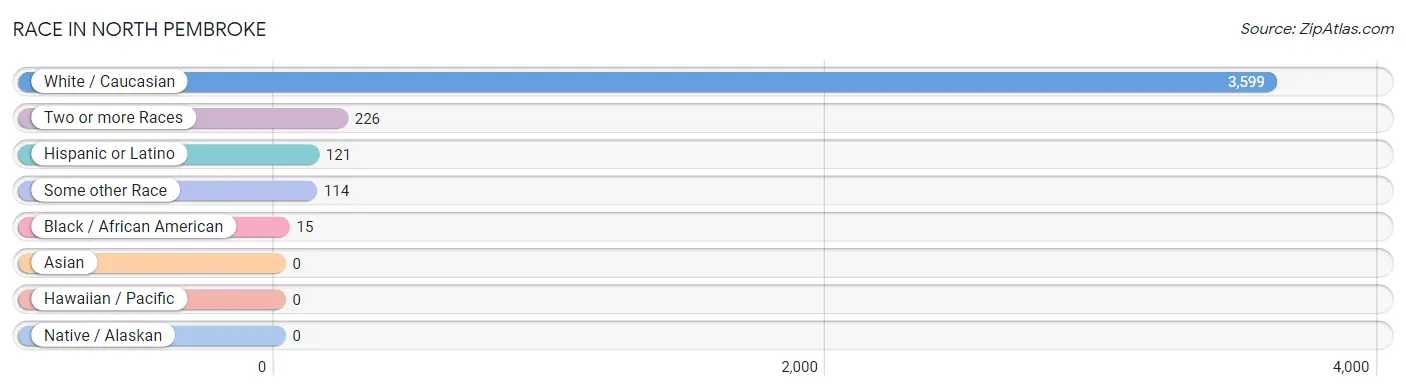
| Race | # Population | % Population |
| Asian | 0 | 0.0% |
| Black / African American | 15 | 0.4% |
| Hawaiian / Pacific | 0 | 0.0% |
| Hispanic or Latino | 121 | 3.1% |
| Native / Alaskan | 0 | 0.0% |
| White / Caucasian | 3,599 | 91.0% |
| Two or more Races | 226 | 5.7% |
| Some other Race | 114 | 2.9% |
| Total | 3,954 | 100.0% |
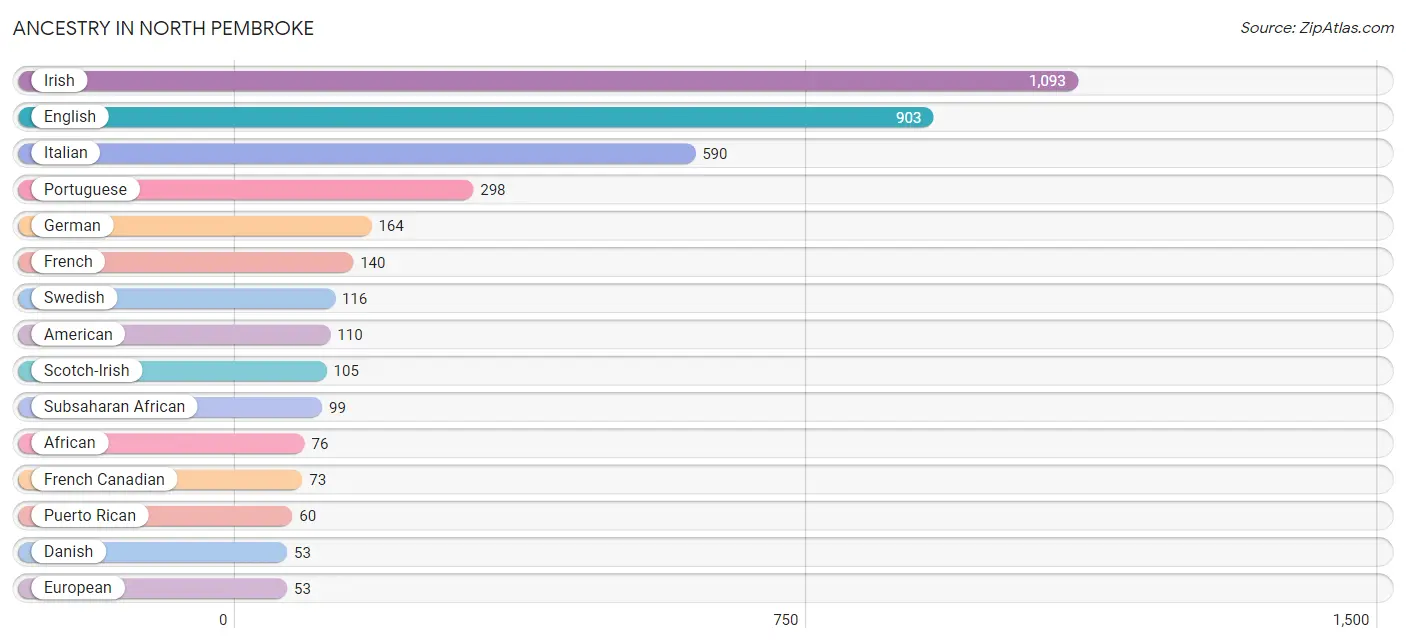
Ancestry in North Pembroke
The most populous ancestries reported in North Pembroke are Irish (1,093 | 27.6%), English (903 | 22.8%), Italian (590 | 14.9%), Portuguese (298 | 7.5%), and German (164 | 4.2%), together accounting for 77.1% of all North Pembroke residents.
| Ancestry | # Population | % Population |
| African | 76 | 1.9% |
| American | 110 | 2.8% |
| Armenian | 13 | 0.3% |
| British | 11 | 0.3% |
| British West Indian | 15 | 0.4% |
| Canadian | 15 | 0.4% |
| Cape Verdean | 23 | 0.6% |
| Danish | 53 | 1.3% |
| Dominican | 50 | 1.3% |
| Dutch | 9 | 0.2% |
| Eastern European | 21 | 0.5% |
| English | 903 | 22.8% |
| European | 53 | 1.3% |
| Finnish | 15 | 0.4% |
| French | 140 | 3.5% |
| French American Indian | 53 | 1.3% |
| French Canadian | 73 | 1.8% |
| German | 164 | 4.2% |
| Irish | 1,093 | 27.6% |
| Italian | 590 | 14.9% |
| Northern European | 15 | 0.4% |
| Polish | 47 | 1.2% |
| Portuguese | 298 | 7.5% |
| Puerto Rican | 60 | 1.5% |
| Scandinavian | 46 | 1.2% |
| Scotch-Irish | 105 | 2.7% |
| Scottish | 12 | 0.3% |
| Subsaharan African | 99 | 2.5% |
| Swedish | 116 | 2.9% |
| Ukrainian | 21 | 0.5% |
| Welsh | 26 | 0.7% | View All 31 Rows |
Immigrants in North Pembroke
The most numerous immigrant groups reported in North Pembroke came from Africa (45 | 1.1%), Cabo Verde (45 | 1.1%), Western Africa (45 | 1.1%), Caribbean (42 | 1.1%), and Latin America (42 | 1.1%), together accounting for 5.5% of all North Pembroke residents.
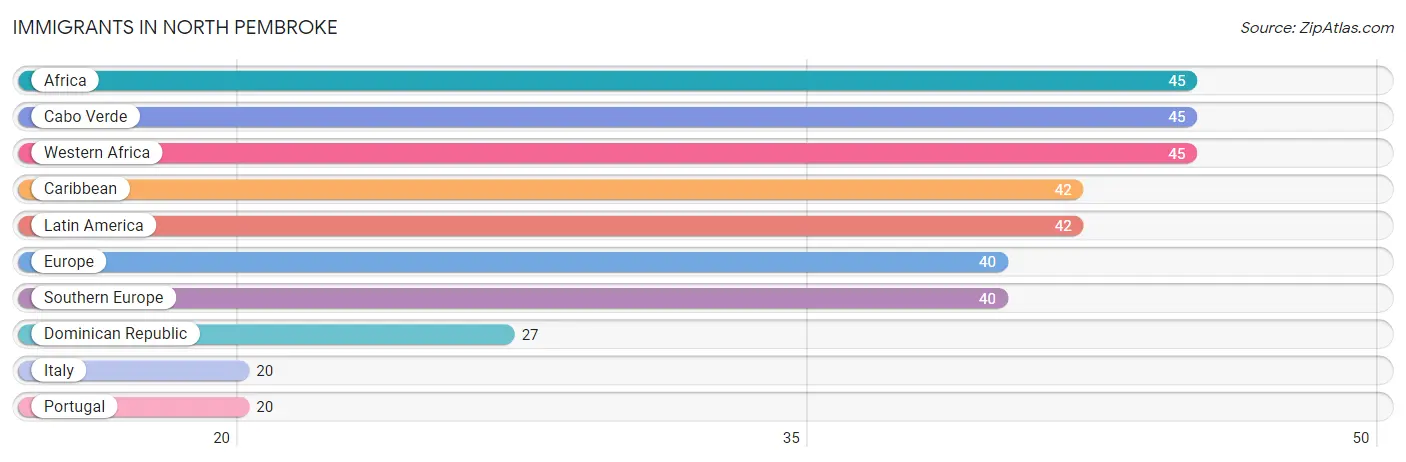
| Immigration Origin | # Population | % Population |
| Africa | 45 | 1.1% |
| Cabo Verde | 45 | 1.1% |
| Caribbean | 42 | 1.1% |
| Dominican Republic | 27 | 0.7% |
| Europe | 40 | 1.0% |
| Italy | 20 | 0.5% |
| Latin America | 42 | 1.1% |
| Portugal | 20 | 0.5% |
| Southern Europe | 40 | 1.0% |
| Western Africa | 45 | 1.1% | View All 10 Rows |
Sex and Age in North Pembroke
Sex and Age in North Pembroke
The most populous age groups in North Pembroke are 65 to 69 Years (295 | 16.9%) for men and 60 to 64 Years (355 | 16.1%) for women.
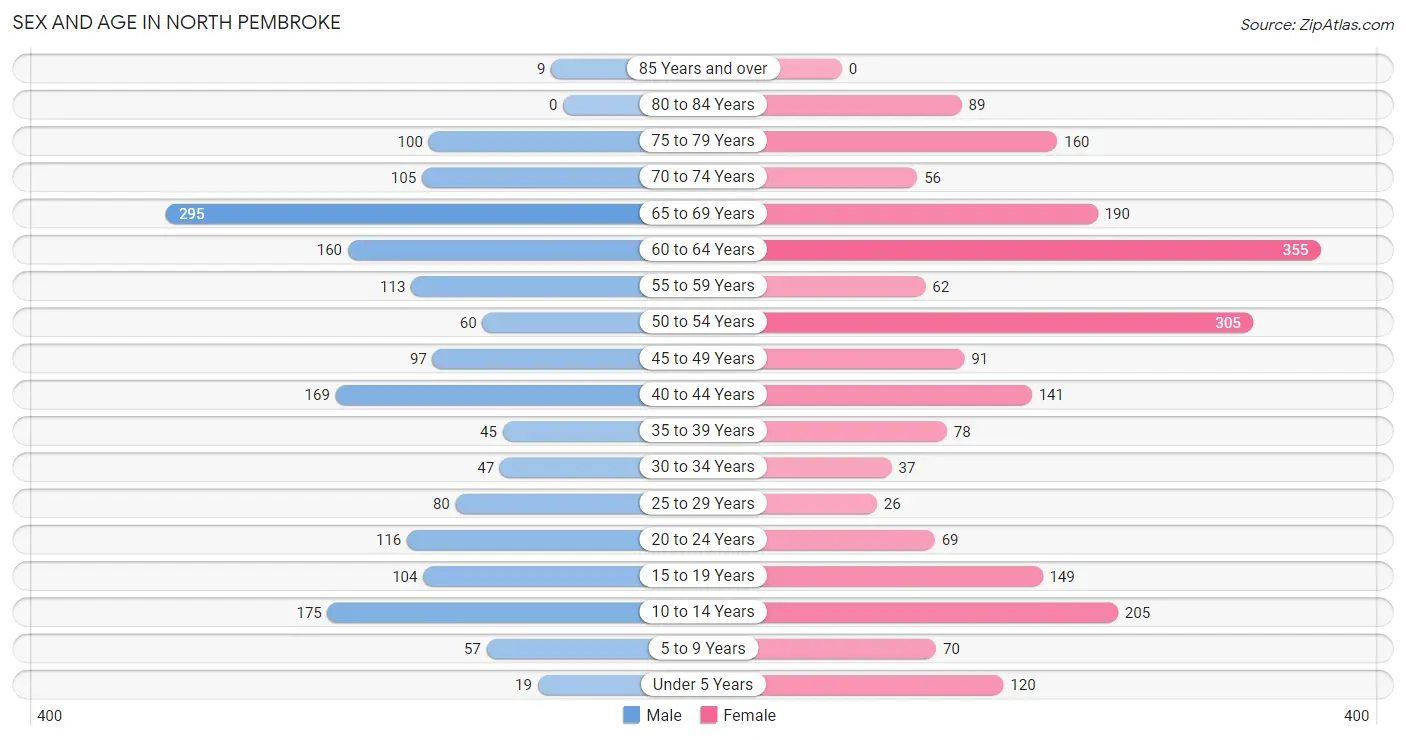
| Age Bracket | Male | Female |
| Under 5 Years | 19 (1.1%) | 120 (5.4%) |
| 5 to 9 Years | 57 (3.3%) | 70 (3.2%) |
| 10 to 14 Years | 175 (10.0%) | 205 (9.3%) |
| 15 to 19 Years | 104 (5.9%) | 149 (6.8%) |
| 20 to 24 Years | 116 (6.6%) | 69 (3.1%) |
| 25 to 29 Years | 80 (4.6%) | 26 (1.2%) |
| 30 to 34 Years | 47 (2.7%) | 37 (1.7%) |
| 35 to 39 Years | 45 (2.6%) | 78 (3.5%) |
| 40 to 44 Years | 169 (9.7%) | 141 (6.4%) |
| 45 to 49 Years | 97 (5.5%) | 91 (4.1%) |
| 50 to 54 Years | 60 (3.4%) | 305 (13.8%) |
| 55 to 59 Years | 113 (6.5%) | 62 (2.8%) |
| 60 to 64 Years | 160 (9.1%) | 355 (16.1%) |
| 65 to 69 Years | 295 (16.9%) | 190 (8.6%) |
| 70 to 74 Years | 105 (6.0%) | 56 (2.5%) |
| 75 to 79 Years | 100 (5.7%) | 160 (7.3%) |
| 80 to 84 Years | 0 (0.0%) | 89 (4.0%) |
| 85 Years and over | 9 (0.5%) | 0 (0.0%) |
| Total | 1,751 (100.0%) | 2,203 (100.0%) |
Families and Households in North Pembroke
Median Family Size in North Pembroke
The median family size in North Pembroke is 2.90 persons per family, with married-couple families (1,062 | 88.1%) accounting for the largest median family size of 2.92 persons per family. On the other hand, single male/father families (59 | 4.9%) represent the smallest median family size with 2.69 persons per family.
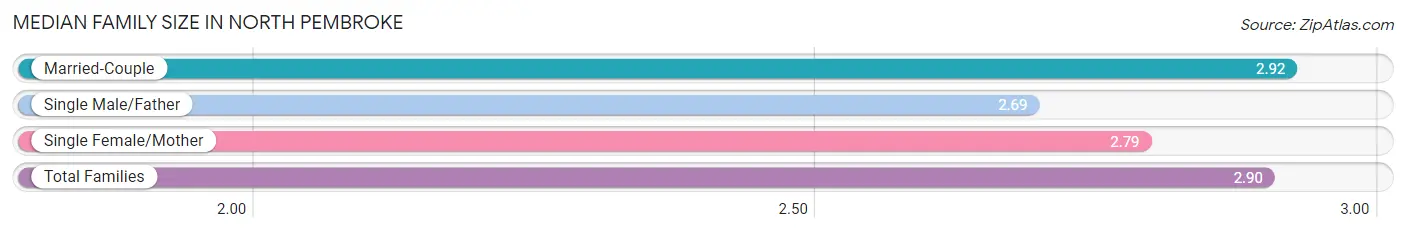
| Family Type | # Families | Family Size |
| Married-Couple | 1,062 (88.1%) | 2.92 |
| Single Male/Father | 59 (4.9%) | 2.69 |
| Single Female/Mother | 85 (7.0%) | 2.79 |
| Total Families | 1,206 (100.0%) | 2.90 |
Median Household Size in North Pembroke
The median household size in North Pembroke is 2.58 persons per household, with married-couple households (1,062 | 69.6%) accounting for the largest median household size of 2.93 persons per household. non-family households (320 | 21.0%) represent the smallest median household size with 1.33 persons per household.
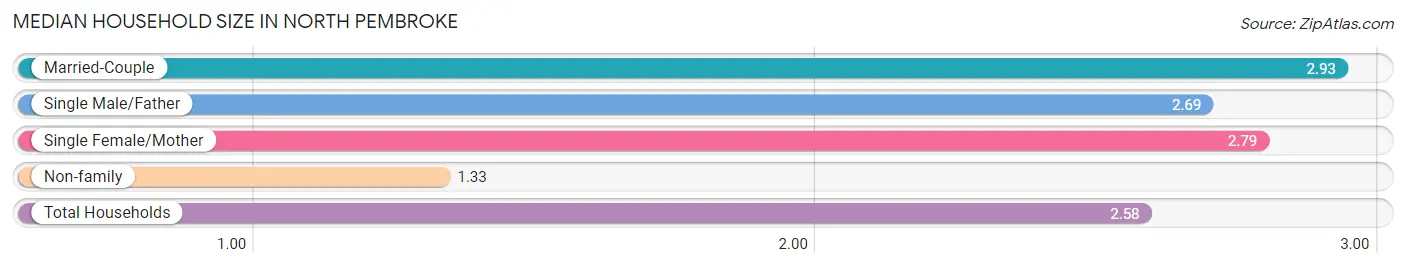
| Household Type | # Households | Household Size |
| Married-Couple | 1,062 (69.6%) | 2.93 |
| Single Male/Father | 59 (3.9%) | 2.69 |
| Single Female/Mother | 85 (5.6%) | 2.79 |
| Non-family | 320 (21.0%) | 1.33 |
| Total Households | 1,526 (100.0%) | 2.58 |
Household Size by Marriage Status in North Pembroke
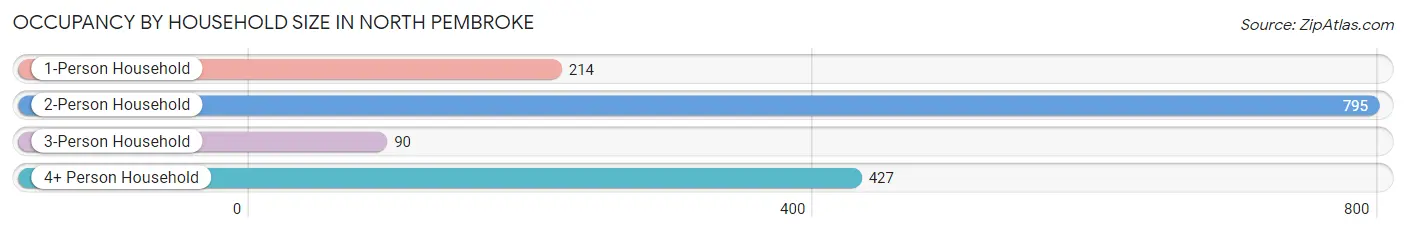
Out of a total of 1,526 households in North Pembroke, 1,206 (79.0%) are family households, while 320 (21.0%) are nonfamily households. The most numerous type of family households are 2-person households, comprising 689, and the most common type of nonfamily households are 1-person households, comprising 214.
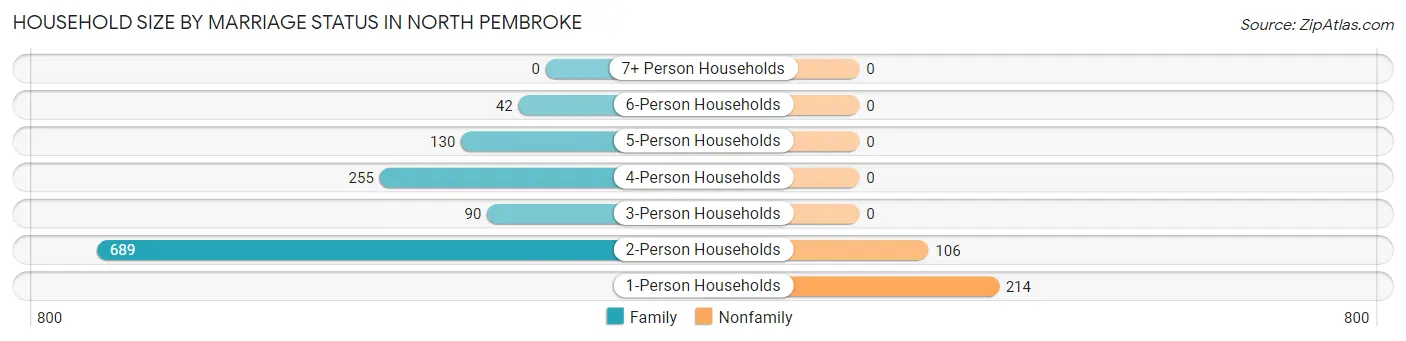
| Household Size | Family Households | Nonfamily Households |
| 1-Person Households | - | 214 (14.0%) |
| 2-Person Households | 689 (45.2%) | 106 (7.0%) |
| 3-Person Households | 90 (5.9%) | 0 (0.0%) |
| 4-Person Households | 255 (16.7%) | 0 (0.0%) |
| 5-Person Households | 130 (8.5%) | 0 (0.0%) |
| 6-Person Households | 42 (2.8%) | 0 (0.0%) |
| 7+ Person Households | 0 (0.0%) | 0 (0.0%) |
| Total | 1,206 (79.0%) | 320 (21.0%) |
Female Fertility in North Pembroke
Fertility by Age in North Pembroke
Average fertility rate in North Pembroke is 32.0 births per 1,000 women. Women in the age bracket of 35 to 50 years have the highest fertility rate with 57.0 births per 1,000 women. Women in the age bracket of 35 to 50 years acount for 100.0% of all women with births.
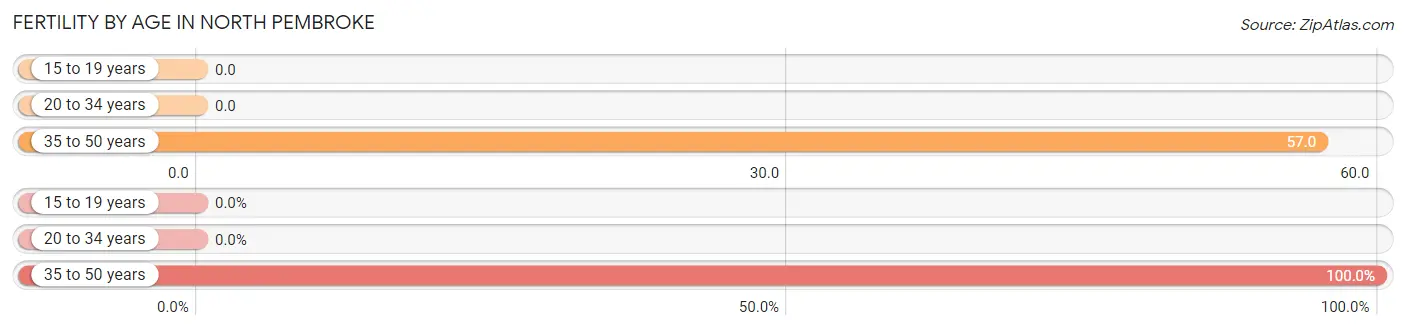
| Age Bracket | Women with Births | Births / 1,000 Women |
| 15 to 19 years | 0 (0.0%) | 0.0 |
| 20 to 34 years | 0 (0.0%) | 0.0 |
| 35 to 50 years | 21 (100.0%) | 57.0 |
| Total | 21 (100.0%) | 32.0 |
Fertility by Age by Marriage Status in North Pembroke
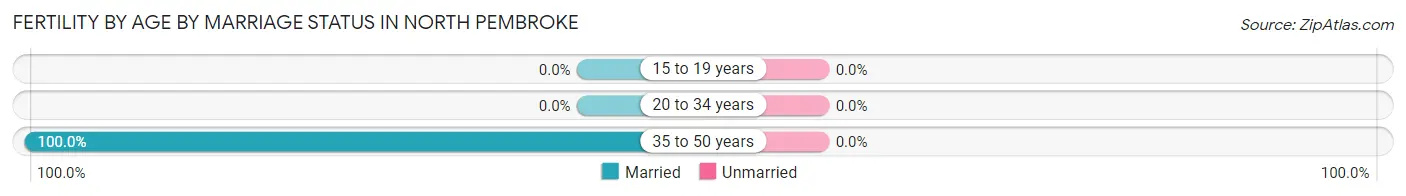
| Age Bracket | Married | Unmarried |
| 15 to 19 years | 0 (0.0%) | 0 (0.0%) |
| 20 to 34 years | 0 (0.0%) | 0 (0.0%) |
| 35 to 50 years | 21 (100.0%) | 0 (0.0%) |
| Total | 21 (100.0%) | 0 (0.0%) |
Fertility by Education in North Pembroke
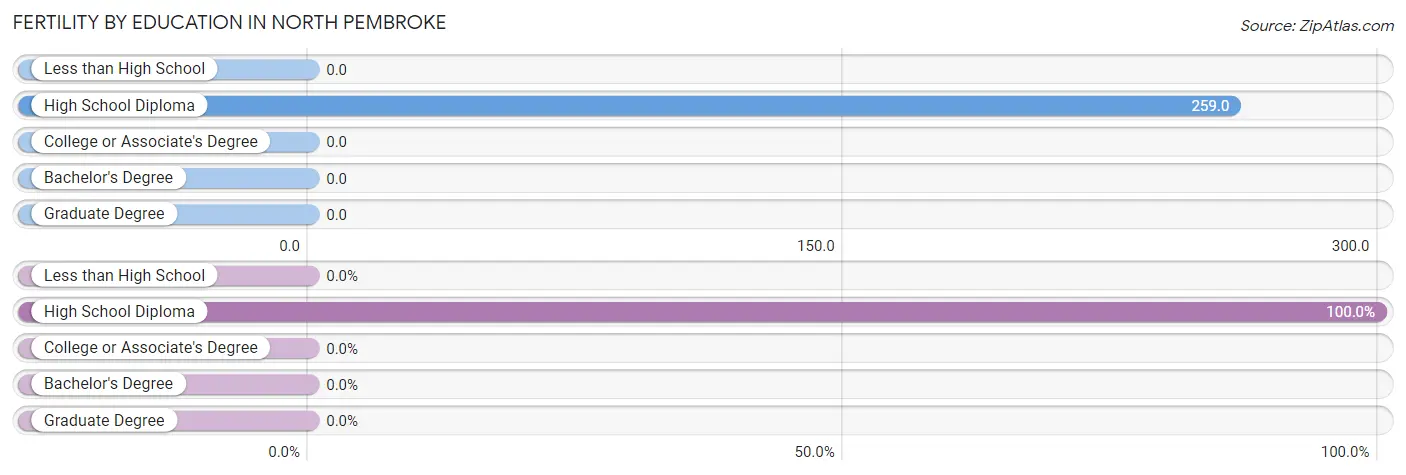
| Educational Attainment | Women with Births | Births / 1,000 Women |
| Less than High School | 0 (0.0%) | 0.0 |
| High School Diploma | 21 (100.0%) | 259.0 |
| College or Associate's Degree | 0 (0.0%) | 0.0 |
| Bachelor's Degree | 0 (0.0%) | 0.0 |
| Graduate Degree | 0 (0.0%) | 0.0 |
| Total | 21 (100.0%) | 32.0 |
Fertility by Education by Marriage Status in North Pembroke
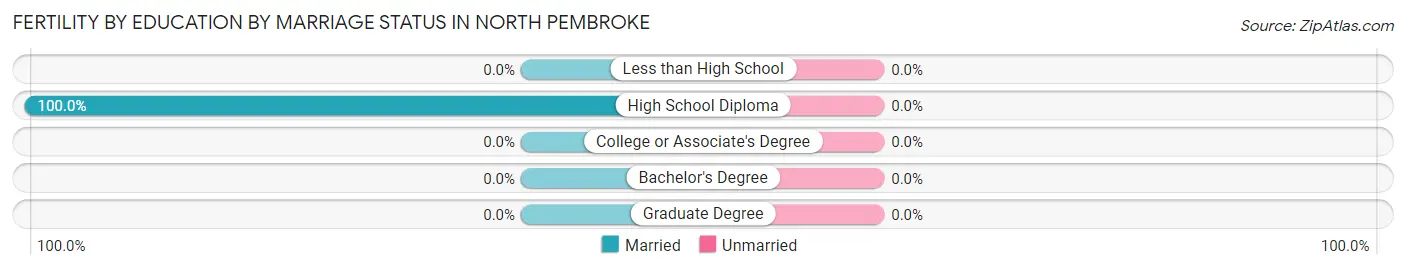
| Educational Attainment | Married | Unmarried |
| Less than High School | 0 (0.0%) | 0 (0.0%) |
| High School Diploma | 21 (100.0%) | 0 (0.0%) |
| College or Associate's Degree | 0 (0.0%) | 0 (0.0%) |
| Bachelor's Degree | 0 (0.0%) | 0 (0.0%) |
| Graduate Degree | 0 (0.0%) | 0 (0.0%) |
| Total | 21 (100.0%) | 0 (0.0%) |
Employment Characteristics in North Pembroke
Employment by Class of Employer in North Pembroke
Among the 1,835 employed individuals in North Pembroke, private company employees (1,225 | 66.8%), local government employees (242 | 13.2%), and not-for-profit organizations (132 | 7.2%) make up the most common classes of employment.
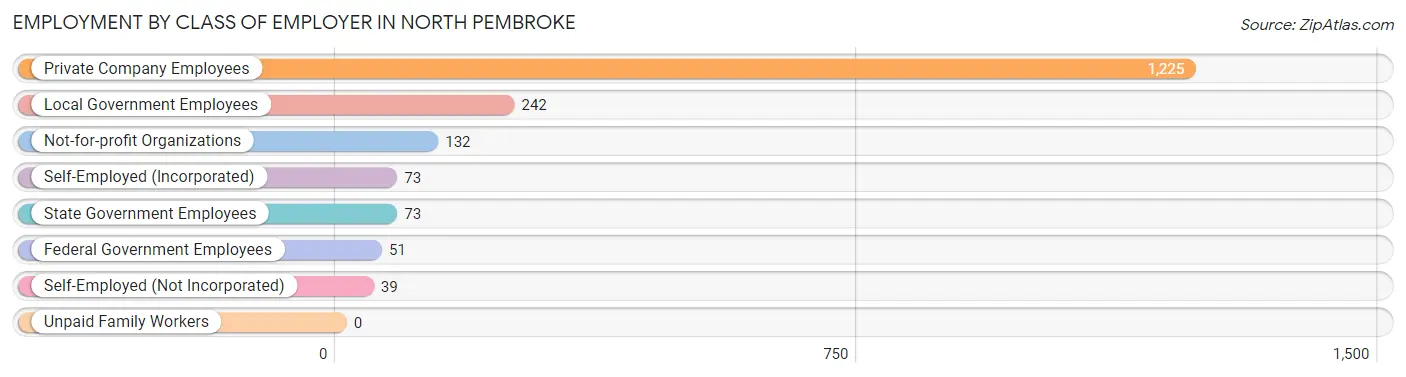
| Employer Class | # Employees | % Employees |
| Private Company Employees | 1,225 | 66.8% |
| Self-Employed (Incorporated) | 73 | 4.0% |
| Self-Employed (Not Incorporated) | 39 | 2.1% |
| Not-for-profit Organizations | 132 | 7.2% |
| Local Government Employees | 242 | 13.2% |
| State Government Employees | 73 | 4.0% |
| Federal Government Employees | 51 | 2.8% |
| Unpaid Family Workers | 0 | 0.0% |
| Total | 1,835 | 100.0% |
Employment Status by Age in North Pembroke
According to the labor force statistics for North Pembroke, out of the total population over 16 years of age (3,211), 58.1% or 1,866 individuals are in the labor force, with 1.6% or 30 of them unemployed. The age group with the highest labor force participation rate is 25 to 29 years, with 99.1% or 105 individuals in the labor force. Within the labor force, the 20 to 24 years age range has the highest percentage of unemployed individuals, with 14.2% or 18 of them being unemployed.
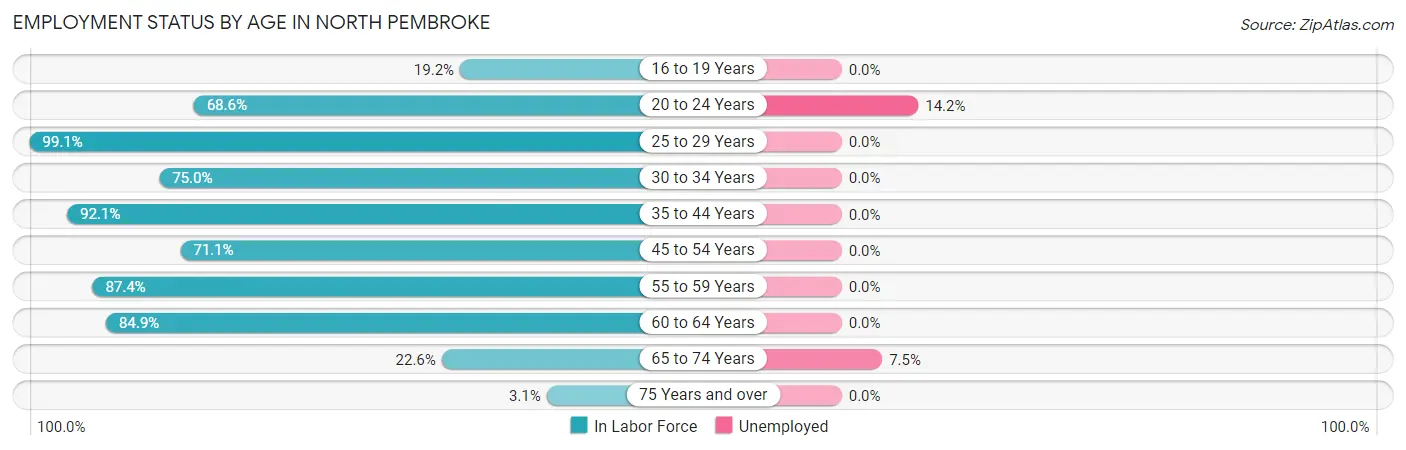
| Age Bracket | In Labor Force | Unemployed |
| 16 to 19 Years | 30 (19.2%) | 0 (0.0%) |
| 20 to 24 Years | 127 (68.6%) | 18 (14.2%) |
| 25 to 29 Years | 105 (99.1%) | 0 (0.0%) |
| 30 to 34 Years | 63 (75.0%) | 0 (0.0%) |
| 35 to 44 Years | 399 (92.1%) | 0 (0.0%) |
| 45 to 54 Years | 393 (71.1%) | 0 (0.0%) |
| 55 to 59 Years | 153 (87.4%) | 0 (0.0%) |
| 60 to 64 Years | 437 (84.9%) | 0 (0.0%) |
| 65 to 74 Years | 146 (22.6%) | 11 (7.5%) |
| 75 Years and over | 11 (3.1%) | 0 (0.0%) |
| Total | 1,866 (58.1%) | 30 (1.6%) |
Employment Status by Educational Attainment in North Pembroke
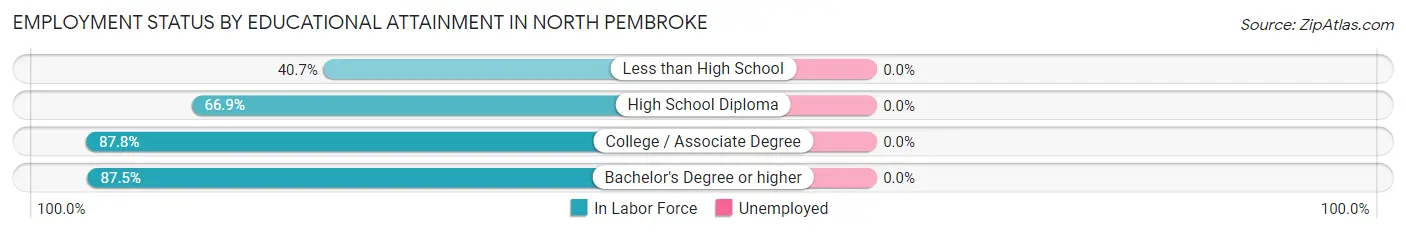
| Educational Attainment | In Labor Force | Unemployed |
| Less than High School | 22 (40.7%) | 0 (0.0%) |
| High School Diploma | 192 (66.9%) | 0 (0.0%) |
| College / Associate Degree | 569 (87.8%) | 0 (0.0%) |
| Bachelor's Degree or higher | 767 (87.5%) | 0 (0.0%) |
| Total | 1,551 (83.1%) | 0 (0.0%) |
Employment Occupations by Sex in North Pembroke
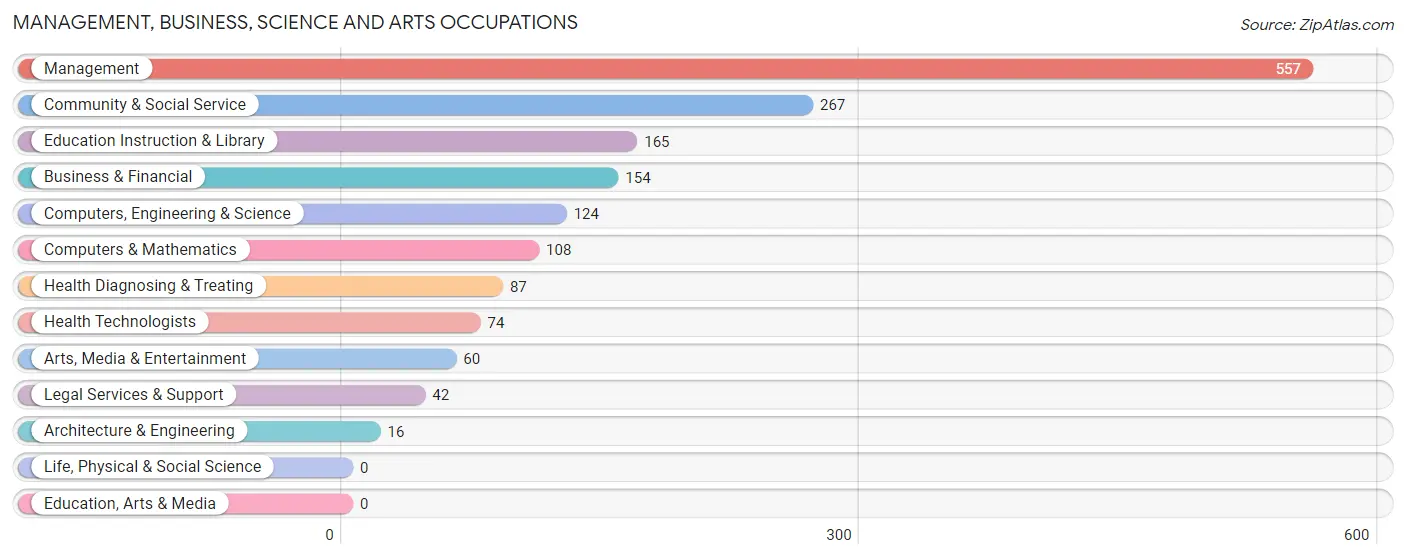
Management, Business, Science and Arts Occupations
The most common Management, Business, Science and Arts occupations in North Pembroke are Management (557 | 30.7%), Community & Social Service (267 | 14.7%), Education Instruction & Library (165 | 9.1%), Business & Financial (154 | 8.5%), and Computers, Engineering & Science (124 | 6.8%).
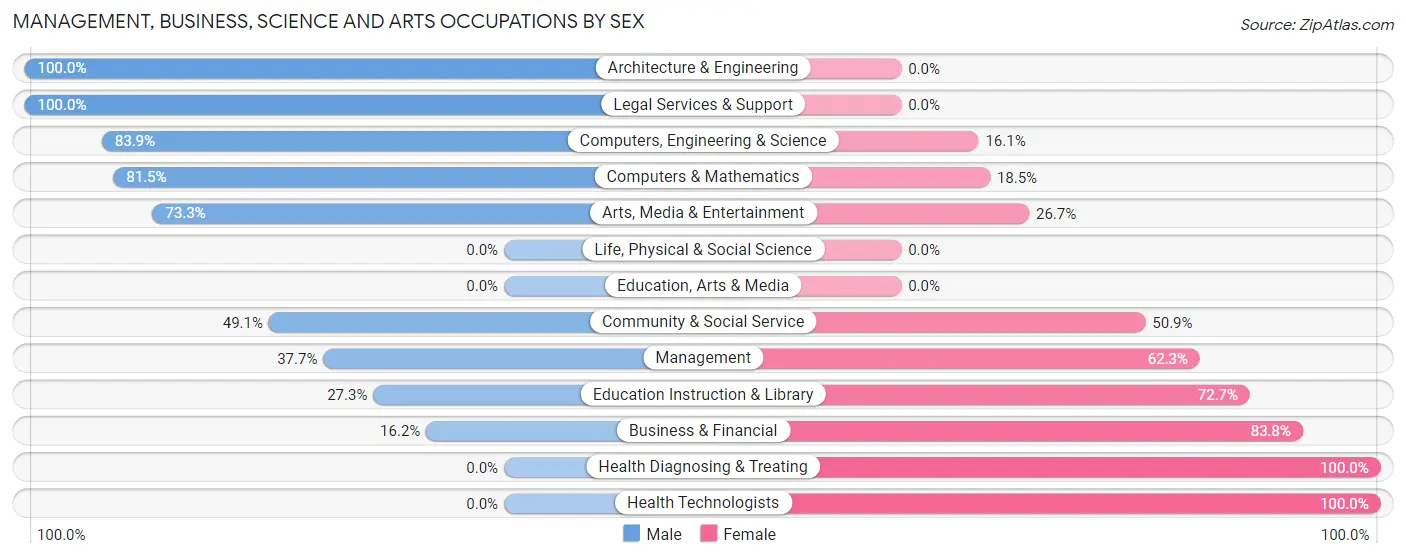
Management, Business, Science and Arts Occupations by Sex
Within the Management, Business, Science and Arts occupations in North Pembroke, the most male-oriented occupations are Architecture & Engineering (100.0%), Legal Services & Support (100.0%), and Computers, Engineering & Science (83.9%), while the most female-oriented occupations are Health Diagnosing & Treating (100.0%), Health Technologists (100.0%), and Business & Financial (83.8%).
| Occupation | Male | Female |
| Management | 210 (37.7%) | 347 (62.3%) |
| Business & Financial | 25 (16.2%) | 129 (83.8%) |
| Computers, Engineering & Science | 104 (83.9%) | 20 (16.1%) |
| Computers & Mathematics | 88 (81.5%) | 20 (18.5%) |
| Architecture & Engineering | 16 (100.0%) | 0 (0.0%) |
| Life, Physical & Social Science | 0 (0.0%) | 0 (0.0%) |
| Community & Social Service | 131 (49.1%) | 136 (50.9%) |
| Education, Arts & Media | 0 (0.0%) | 0 (0.0%) |
| Legal Services & Support | 42 (100.0%) | 0 (0.0%) |
| Education Instruction & Library | 45 (27.3%) | 120 (72.7%) |
| Arts, Media & Entertainment | 44 (73.3%) | 16 (26.7%) |
| Health Diagnosing & Treating | 0 (0.0%) | 87 (100.0%) |
| Health Technologists | 0 (0.0%) | 74 (100.0%) |
| Total (Category) | 470 (39.5%) | 719 (60.5%) |
| Total (Overall) | 869 (47.8%) | 947 (52.1%) |
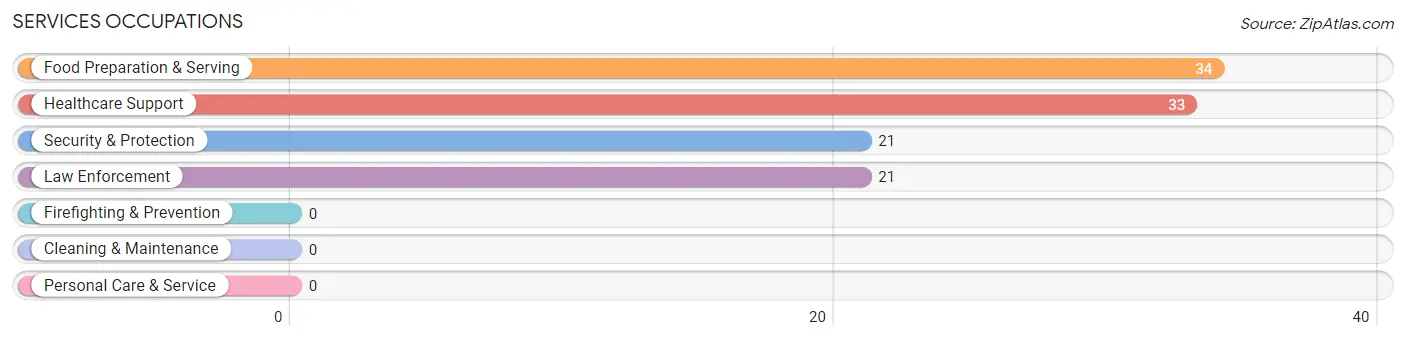
Services Occupations
The most common Services occupations in North Pembroke are Food Preparation & Serving (34 | 1.9%), Healthcare Support (33 | 1.8%), Security & Protection (21 | 1.2%), and Law Enforcement (21 | 1.2%).
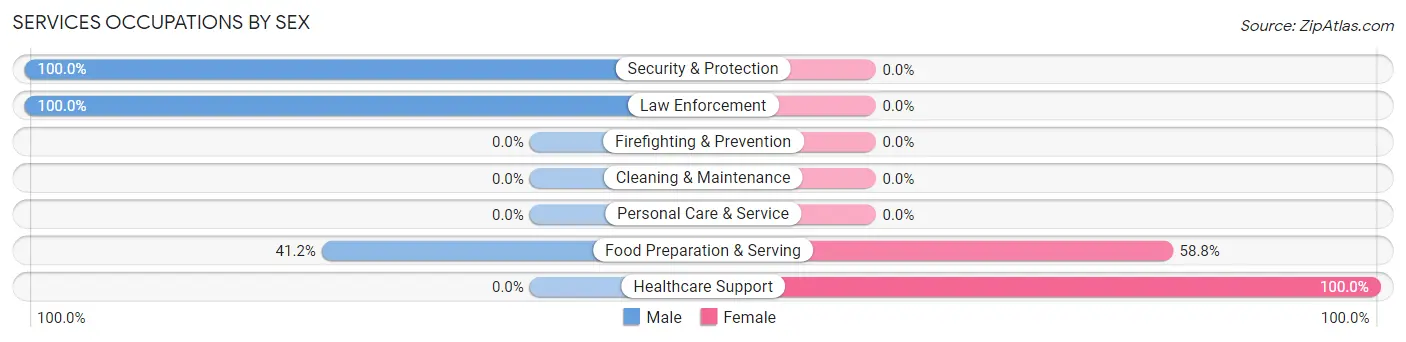
Services Occupations by Sex
Within the Services occupations in North Pembroke, the most male-oriented occupations are Security & Protection (100.0%), Law Enforcement (100.0%), and Food Preparation & Serving (41.2%), while the most female-oriented occupations are Healthcare Support (100.0%), and Food Preparation & Serving (58.8%).
| Occupation | Male | Female |
| Healthcare Support | 0 (0.0%) | 33 (100.0%) |
| Security & Protection | 21 (100.0%) | 0 (0.0%) |
| Firefighting & Prevention | 0 (0.0%) | 0 (0.0%) |
| Law Enforcement | 21 (100.0%) | 0 (0.0%) |
| Food Preparation & Serving | 14 (41.2%) | 20 (58.8%) |
| Cleaning & Maintenance | 0 (0.0%) | 0 (0.0%) |
| Personal Care & Service | 0 (0.0%) | 0 (0.0%) |
| Total (Category) | 35 (39.8%) | 53 (60.2%) |
| Total (Overall) | 869 (47.8%) | 947 (52.1%) |
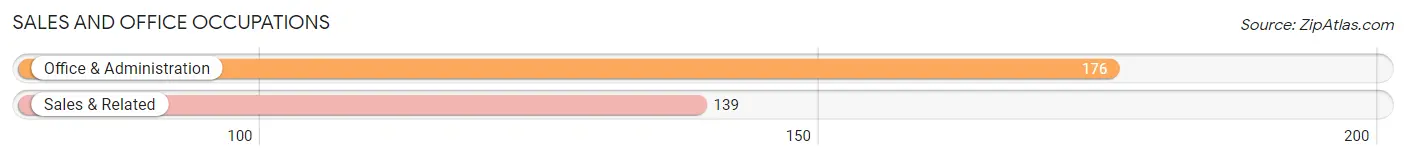
Sales and Office Occupations
The most common Sales and Office occupations in North Pembroke are Office & Administration (176 | 9.7%), and Sales & Related (139 | 7.6%).
Sales and Office Occupations by Sex
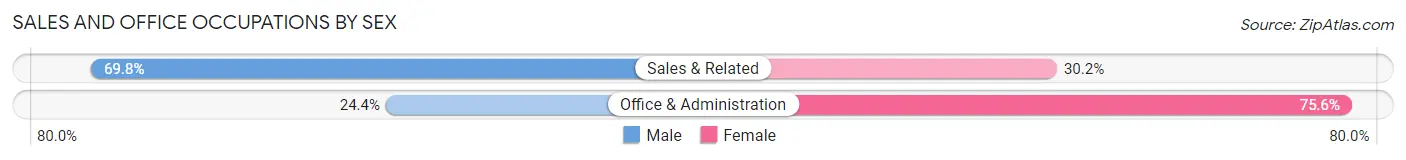
| Occupation | Male | Female |
| Sales & Related | 97 (69.8%) | 42 (30.2%) |
| Office & Administration | 43 (24.4%) | 133 (75.6%) |
| Total (Category) | 140 (44.4%) | 175 (55.6%) |
| Total (Overall) | 869 (47.8%) | 947 (52.1%) |
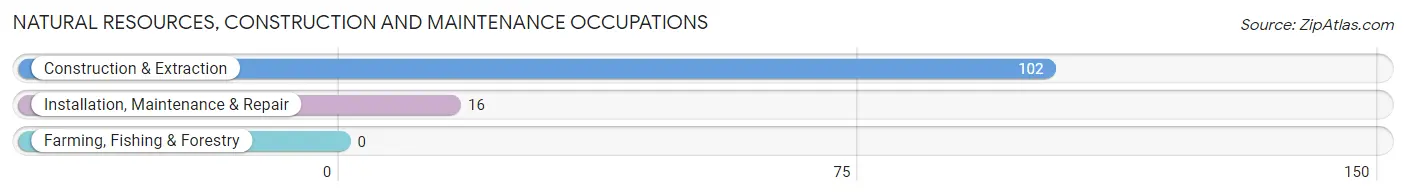
Natural Resources, Construction and Maintenance Occupations
The most common Natural Resources, Construction and Maintenance occupations in North Pembroke are Construction & Extraction (102 | 5.6%), and Installation, Maintenance & Repair (16 | 0.9%).
Natural Resources, Construction and Maintenance Occupations by Sex
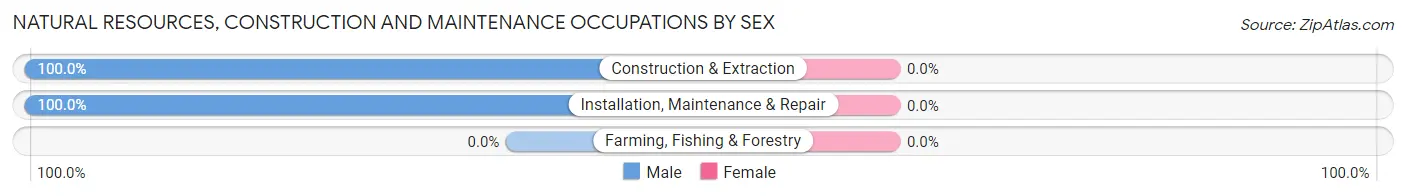
| Occupation | Male | Female |
| Farming, Fishing & Forestry | 0 (0.0%) | 0 (0.0%) |
| Construction & Extraction | 102 (100.0%) | 0 (0.0%) |
| Installation, Maintenance & Repair | 16 (100.0%) | 0 (0.0%) |
| Total (Category) | 118 (100.0%) | 0 (0.0%) |
| Total (Overall) | 869 (47.8%) | 947 (52.1%) |
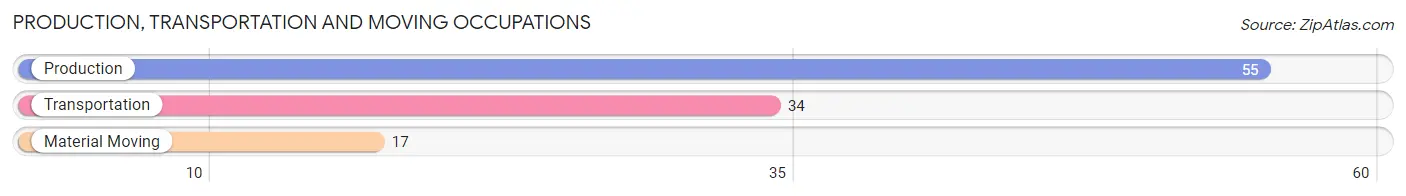
Production, Transportation and Moving Occupations
The most common Production, Transportation and Moving occupations in North Pembroke are Production (55 | 3.0%), Transportation (34 | 1.9%), and Material Moving (17 | 0.9%).
Production, Transportation and Moving Occupations by Sex
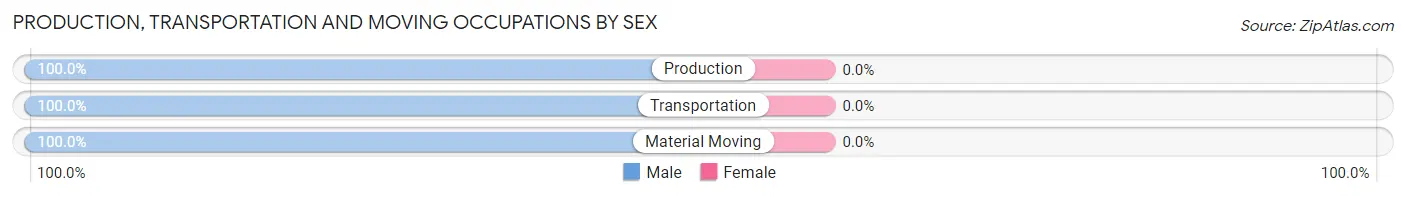
| Occupation | Male | Female |
| Production | 55 (100.0%) | 0 (0.0%) |
| Transportation | 34 (100.0%) | 0 (0.0%) |
| Material Moving | 17 (100.0%) | 0 (0.0%) |
| Total (Category) | 106 (100.0%) | 0 (0.0%) |
| Total (Overall) | 869 (47.8%) | 947 (52.1%) |
Employment Industries by Sex in North Pembroke
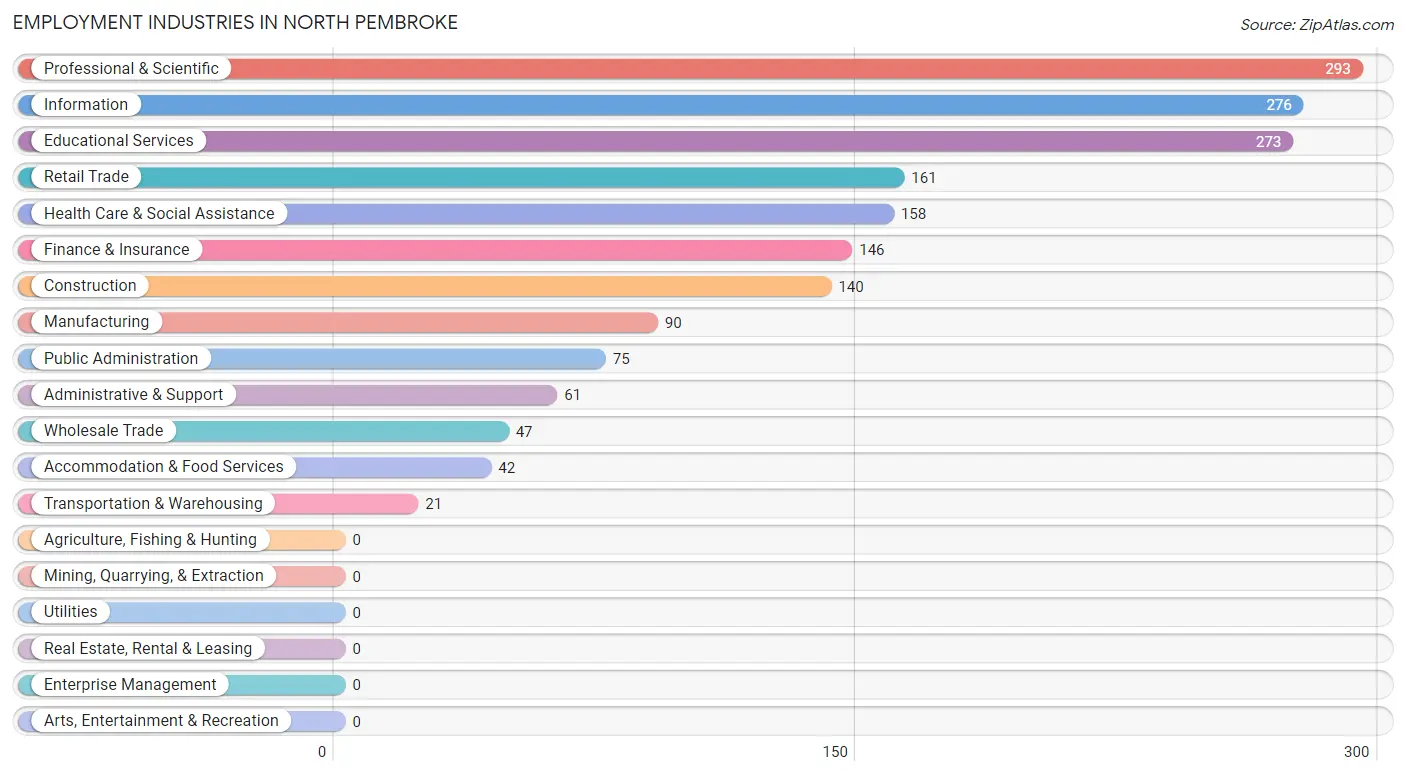
Employment Industries in North Pembroke
The major employment industries in North Pembroke include Professional & Scientific (293 | 16.1%), Information (276 | 15.2%), Educational Services (273 | 15.0%), Retail Trade (161 | 8.9%), and Health Care & Social Assistance (158 | 8.7%).
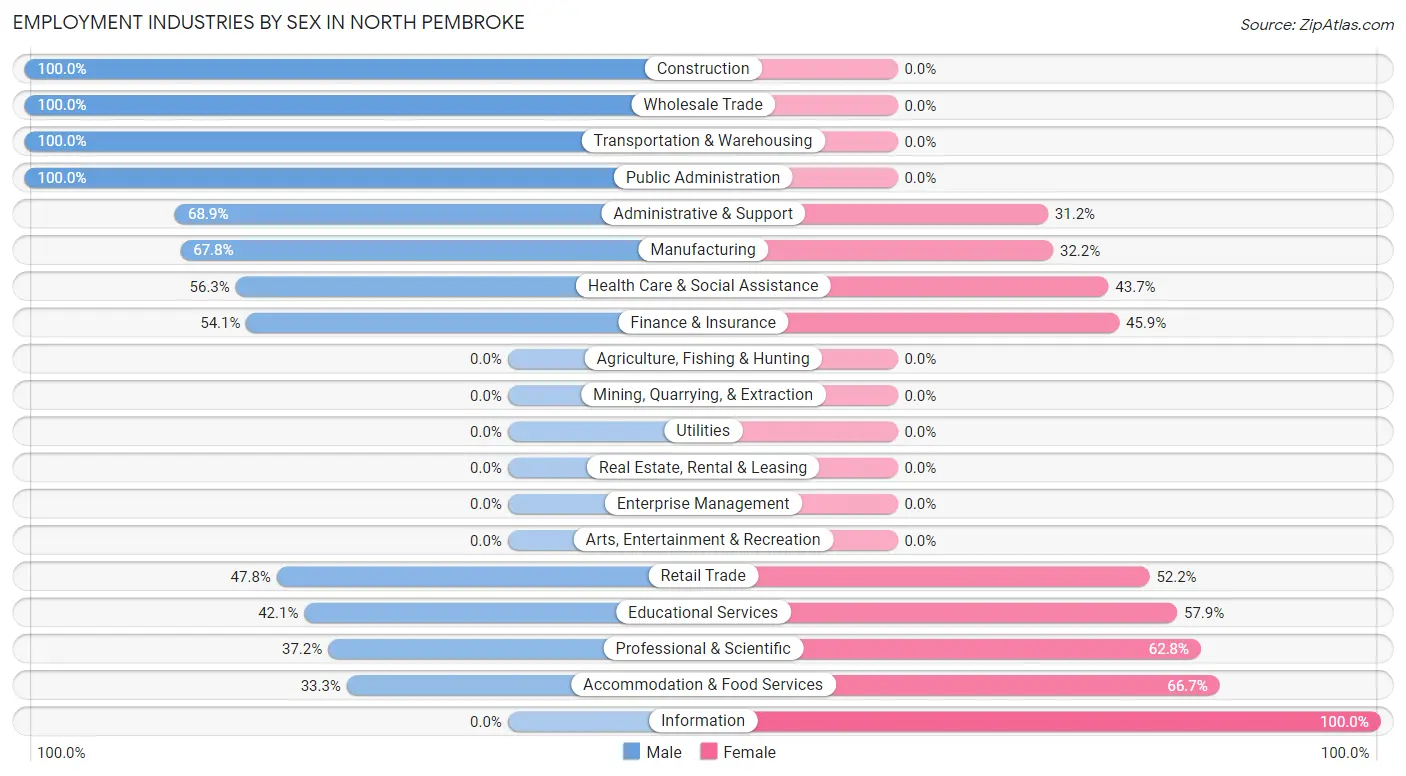
Employment Industries by Sex in North Pembroke
The North Pembroke industries that see more men than women are Construction (100.0%), Wholesale Trade (100.0%), and Transportation & Warehousing (100.0%), whereas the industries that tend to have a higher number of women are Information (100.0%), Accommodation & Food Services (66.7%), and Professional & Scientific (62.8%).
| Industry | Male | Female |
| Agriculture, Fishing & Hunting | 0 (0.0%) | 0 (0.0%) |
| Mining, Quarrying, & Extraction | 0 (0.0%) | 0 (0.0%) |
| Construction | 140 (100.0%) | 0 (0.0%) |
| Manufacturing | 61 (67.8%) | 29 (32.2%) |
| Wholesale Trade | 47 (100.0%) | 0 (0.0%) |
| Retail Trade | 77 (47.8%) | 84 (52.2%) |
| Transportation & Warehousing | 21 (100.0%) | 0 (0.0%) |
| Utilities | 0 (0.0%) | 0 (0.0%) |
| Information | 0 (0.0%) | 276 (100.0%) |
| Finance & Insurance | 79 (54.1%) | 67 (45.9%) |
| Real Estate, Rental & Leasing | 0 (0.0%) | 0 (0.0%) |
| Professional & Scientific | 109 (37.2%) | 184 (62.8%) |
| Enterprise Management | 0 (0.0%) | 0 (0.0%) |
| Administrative & Support | 42 (68.9%) | 19 (31.1%) |
| Educational Services | 115 (42.1%) | 158 (57.9%) |
| Health Care & Social Assistance | 89 (56.3%) | 69 (43.7%) |
| Arts, Entertainment & Recreation | 0 (0.0%) | 0 (0.0%) |
| Accommodation & Food Services | 14 (33.3%) | 28 (66.7%) |
| Public Administration | 75 (100.0%) | 0 (0.0%) |
| Total | 869 (47.8%) | 947 (52.1%) |
Education in North Pembroke
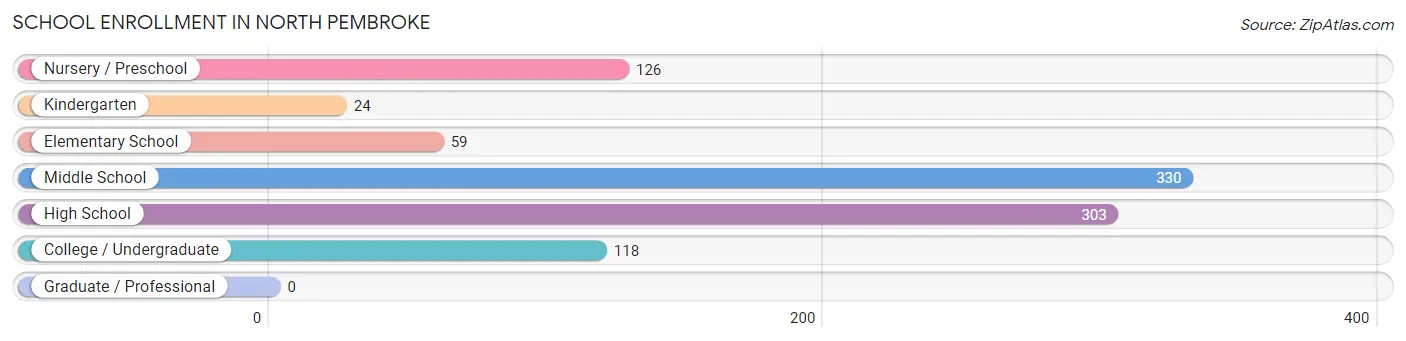
School Enrollment in North Pembroke
The most common levels of schooling among the 960 students in North Pembroke are middle school (330 | 34.4%), high school (303 | 31.6%), and nursery / preschool (126 | 13.1%).
| School Level | # Students | % Students |
| Nursery / Preschool | 126 | 13.1% |
| Kindergarten | 24 | 2.5% |
| Elementary School | 59 | 6.1% |
| Middle School | 330 | 34.4% |
| High School | 303 | 31.6% |
| College / Undergraduate | 118 | 12.3% |
| Graduate / Professional | 0 | 0.0% |
| Total | 960 | 100.0% |
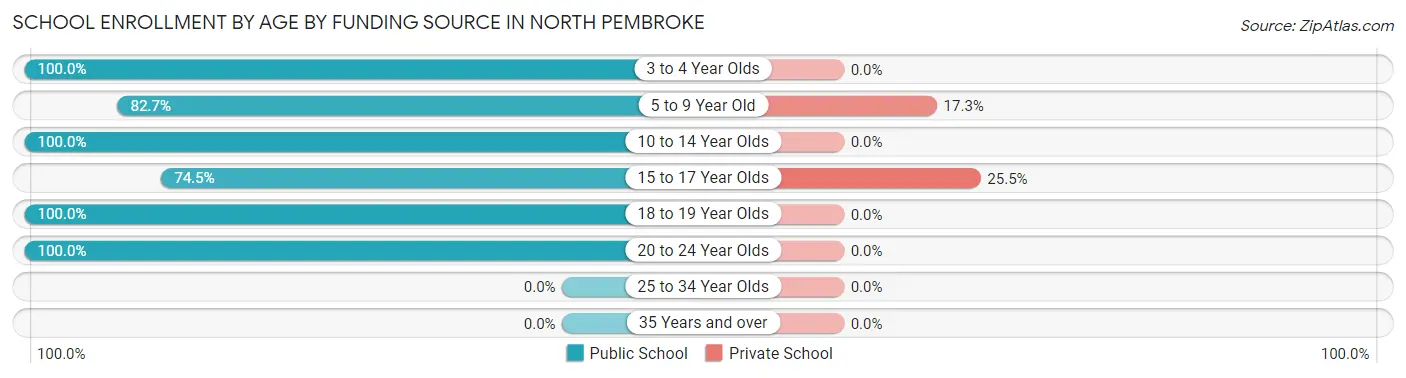
School Enrollment by Age by Funding Source in North Pembroke
Out of a total of 960 students who are enrolled in schools in North Pembroke, 76 (7.9%) attend a private institution, while the remaining 884 (92.1%) are enrolled in public schools. The age group of 15 to 17 year olds has the highest likelihood of being enrolled in private schools, with 54 (25.5% in the age bracket) enrolled. Conversely, the age group of 3 to 4 year olds has the lowest likelihood of being enrolled in a private school, with 82 (100.0% in the age bracket) attending a public institution.
| Age Bracket | Public School | Private School |
| 3 to 4 Year Olds | 82 (100.0%) | 0 (0.0%) |
| 5 to 9 Year Old | 105 (82.7%) | 22 (17.3%) |
| 10 to 14 Year Olds | 380 (100.0%) | 0 (0.0%) |
| 15 to 17 Year Olds | 158 (74.5%) | 54 (25.5%) |
| 18 to 19 Year Olds | 41 (100.0%) | 0 (0.0%) |
| 20 to 24 Year Olds | 118 (100.0%) | 0 (0.0%) |
| 25 to 34 Year Olds | 0 (0.0%) | 0 (0.0%) |
| 35 Years and over | 0 (0.0%) | 0 (0.0%) |
| Total | 884 (92.1%) | 76 (7.9%) |
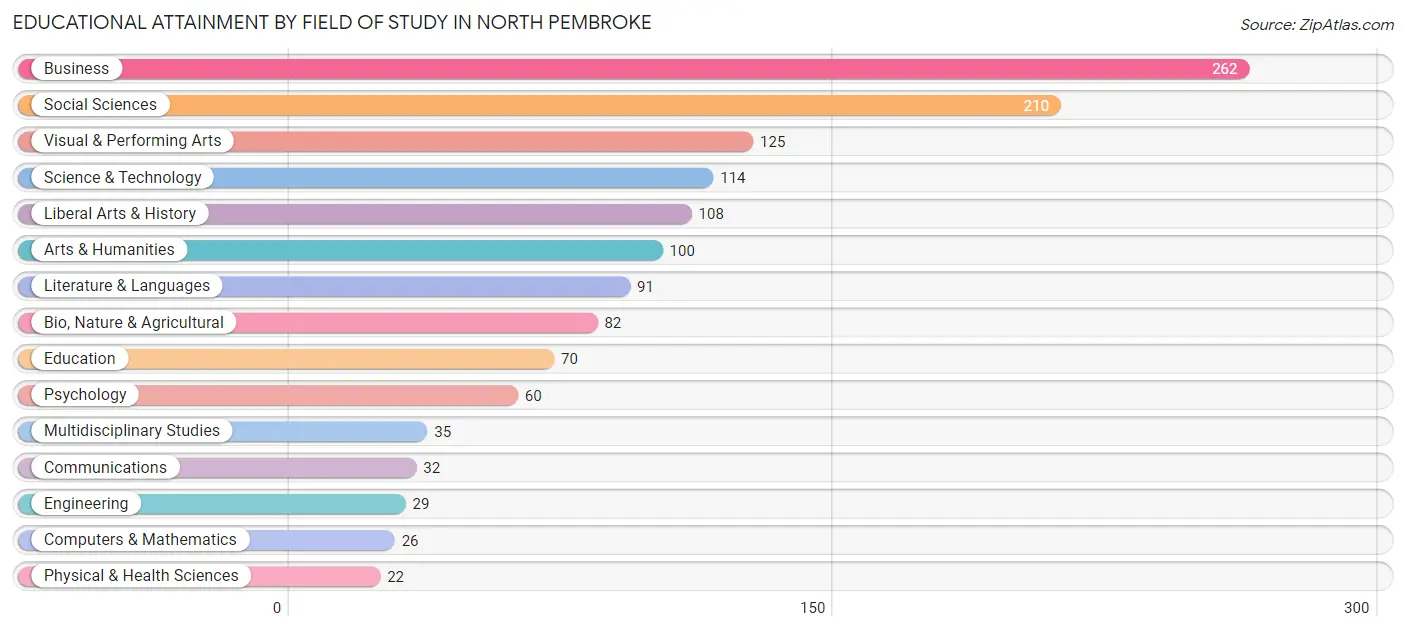
Educational Attainment by Field of Study in North Pembroke
Business (262 | 19.2%), social sciences (210 | 15.4%), visual & performing arts (125 | 9.1%), science & technology (114 | 8.4%), and liberal arts & history (108 | 7.9%) are the most common fields of study among 1,366 individuals in North Pembroke who have obtained a bachelor's degree or higher.
| Field of Study | # Graduates | % Graduates |
| Computers & Mathematics | 26 | 1.9% |
| Bio, Nature & Agricultural | 82 | 6.0% |
| Physical & Health Sciences | 22 | 1.6% |
| Psychology | 60 | 4.4% |
| Social Sciences | 210 | 15.4% |
| Engineering | 29 | 2.1% |
| Multidisciplinary Studies | 35 | 2.6% |
| Science & Technology | 114 | 8.4% |
| Business | 262 | 19.2% |
| Education | 70 | 5.1% |
| Literature & Languages | 91 | 6.7% |
| Liberal Arts & History | 108 | 7.9% |
| Visual & Performing Arts | 125 | 9.1% |
| Communications | 32 | 2.3% |
| Arts & Humanities | 100 | 7.3% |
| Total | 1,366 | 100.0% |
Transportation & Commute in North Pembroke
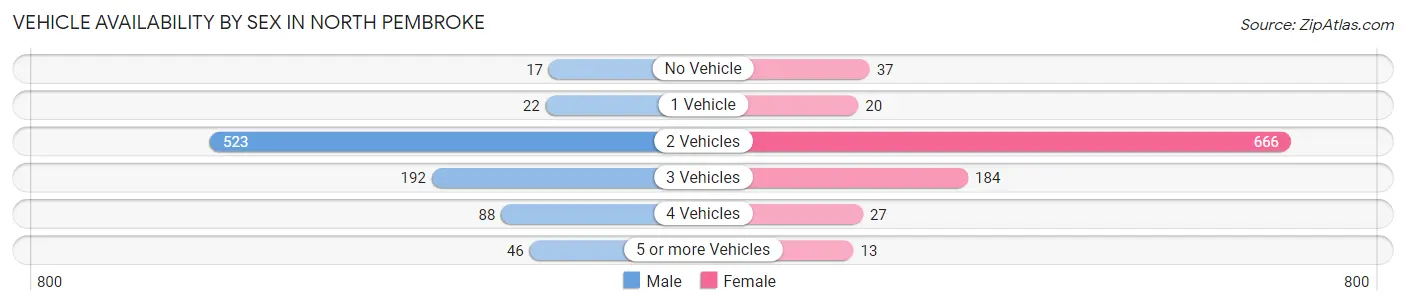
Vehicle Availability by Sex in North Pembroke
The most prevalent vehicle ownership categories in North Pembroke are males with 2 vehicles (523, accounting for 58.9%) and females with 2 vehicles (666, making up 55.2%).
| Vehicles Available | Male | Female |
| No Vehicle | 17 (1.9%) | 37 (3.9%) |
| 1 Vehicle | 22 (2.5%) | 20 (2.1%) |
| 2 Vehicles | 523 (58.9%) | 666 (70.3%) |
| 3 Vehicles | 192 (21.6%) | 184 (19.4%) |
| 4 Vehicles | 88 (9.9%) | 27 (2.9%) |
| 5 or more Vehicles | 46 (5.2%) | 13 (1.4%) |
| Total | 888 (100.0%) | 947 (100.0%) |
Commute Time in North Pembroke
The most frequently occuring commute durations in North Pembroke are 20 to 24 minutes (222 commuters, 17.1%), 45 to 59 minutes (219 commuters, 16.9%), and 60 to 89 minutes (205 commuters, 15.8%).
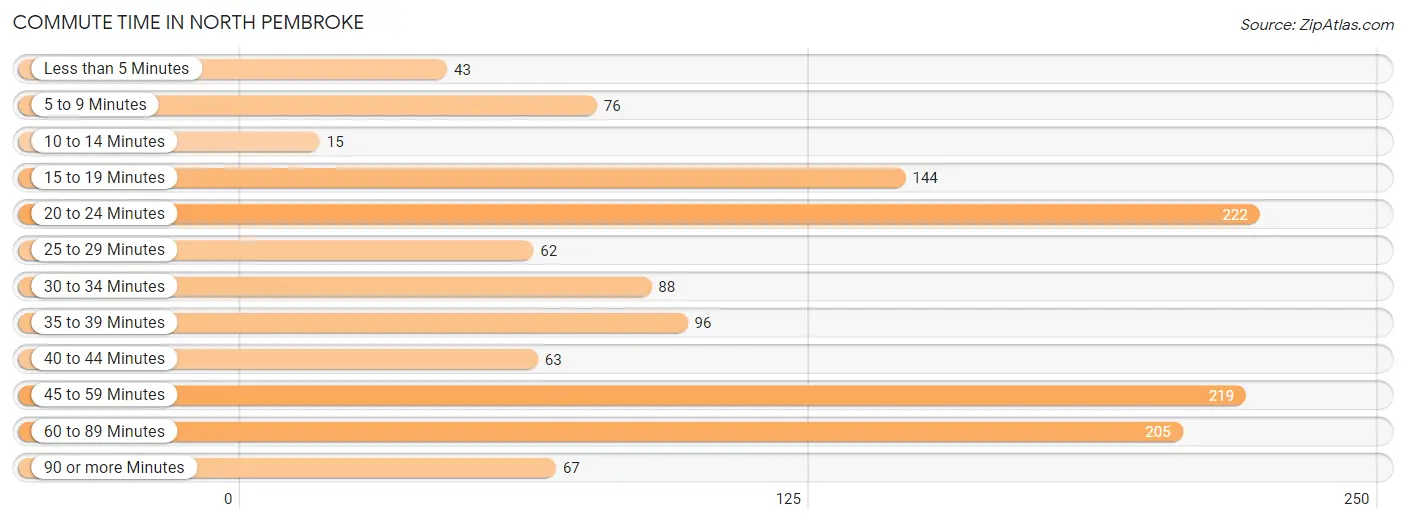
| Commute Time | # Commuters | % Commuters |
| Less than 5 Minutes | 43 | 3.3% |
| 5 to 9 Minutes | 76 | 5.9% |
| 10 to 14 Minutes | 15 | 1.1% |
| 15 to 19 Minutes | 144 | 11.1% |
| 20 to 24 Minutes | 222 | 17.1% |
| 25 to 29 Minutes | 62 | 4.8% |
| 30 to 34 Minutes | 88 | 6.8% |
| 35 to 39 Minutes | 96 | 7.4% |
| 40 to 44 Minutes | 63 | 4.9% |
| 45 to 59 Minutes | 219 | 16.9% |
| 60 to 89 Minutes | 205 | 15.8% |
| 90 or more Minutes | 67 | 5.1% |
Commute Time by Sex in North Pembroke
The most common commute times in North Pembroke are 60 to 89 minutes (177 commuters, 22.8%) for males and 20 to 24 minutes (108 commuters, 20.6%) for females.
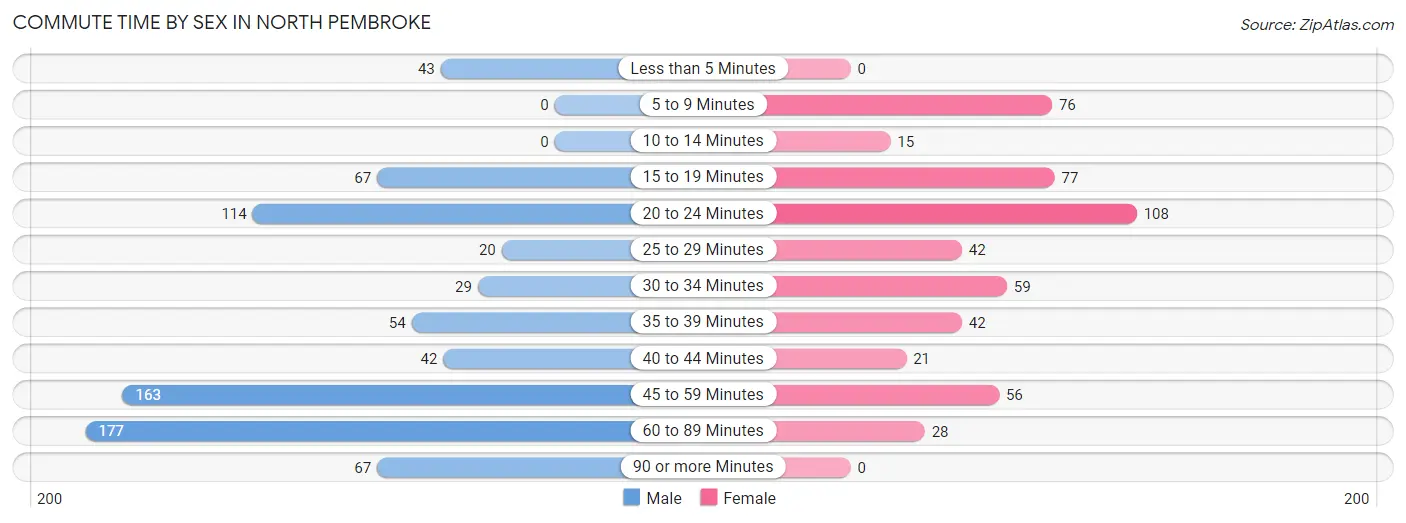
| Commute Time | Male | Female |
| Less than 5 Minutes | 43 (5.5%) | 0 (0.0%) |
| 5 to 9 Minutes | 0 (0.0%) | 76 (14.5%) |
| 10 to 14 Minutes | 0 (0.0%) | 15 (2.9%) |
| 15 to 19 Minutes | 67 (8.6%) | 77 (14.7%) |
| 20 to 24 Minutes | 114 (14.7%) | 108 (20.6%) |
| 25 to 29 Minutes | 20 (2.6%) | 42 (8.0%) |
| 30 to 34 Minutes | 29 (3.7%) | 59 (11.3%) |
| 35 to 39 Minutes | 54 (7.0%) | 42 (8.0%) |
| 40 to 44 Minutes | 42 (5.4%) | 21 (4.0%) |
| 45 to 59 Minutes | 163 (21.0%) | 56 (10.7%) |
| 60 to 89 Minutes | 177 (22.8%) | 28 (5.3%) |
| 90 or more Minutes | 67 (8.6%) | 0 (0.0%) |
Time of Departure to Work by Sex in North Pembroke
The most frequent times of departure to work in North Pembroke are 6:00 AM to 6:29 AM (126, 16.2%) for males and 7:30 AM to 7:59 AM (138, 26.3%) for females.
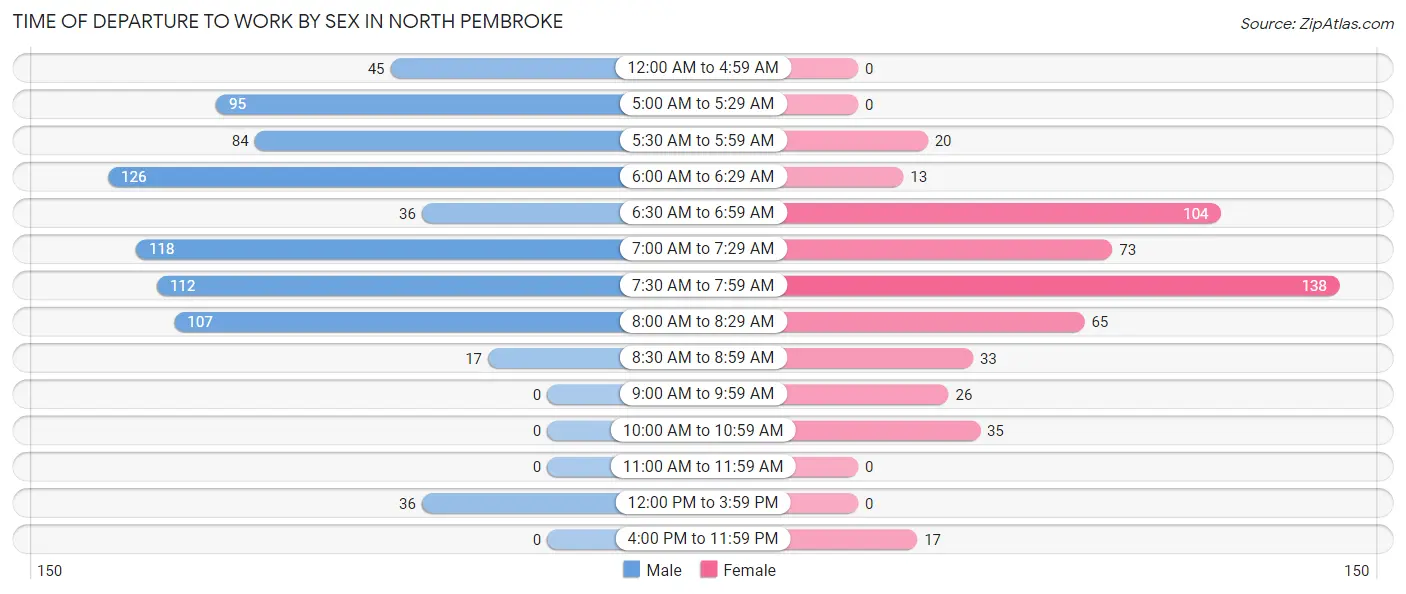
| Time of Departure | Male | Female |
| 12:00 AM to 4:59 AM | 45 (5.8%) | 0 (0.0%) |
| 5:00 AM to 5:29 AM | 95 (12.2%) | 0 (0.0%) |
| 5:30 AM to 5:59 AM | 84 (10.8%) | 20 (3.8%) |
| 6:00 AM to 6:29 AM | 126 (16.2%) | 13 (2.5%) |
| 6:30 AM to 6:59 AM | 36 (4.6%) | 104 (19.9%) |
| 7:00 AM to 7:29 AM | 118 (15.2%) | 73 (13.9%) |
| 7:30 AM to 7:59 AM | 112 (14.4%) | 138 (26.3%) |
| 8:00 AM to 8:29 AM | 107 (13.8%) | 65 (12.4%) |
| 8:30 AM to 8:59 AM | 17 (2.2%) | 33 (6.3%) |
| 9:00 AM to 9:59 AM | 0 (0.0%) | 26 (5.0%) |
| 10:00 AM to 10:59 AM | 0 (0.0%) | 35 (6.7%) |
| 11:00 AM to 11:59 AM | 0 (0.0%) | 0 (0.0%) |
| 12:00 PM to 3:59 PM | 36 (4.6%) | 0 (0.0%) |
| 4:00 PM to 11:59 PM | 0 (0.0%) | 17 (3.2%) |
| Total | 776 (100.0%) | 524 (100.0%) |
Housing Occupancy in North Pembroke
Occupancy by Ownership in North Pembroke
Of the total 1,526 dwellings in North Pembroke, owner-occupied units account for 1,153 (75.6%), while renter-occupied units make up 373 (24.4%).
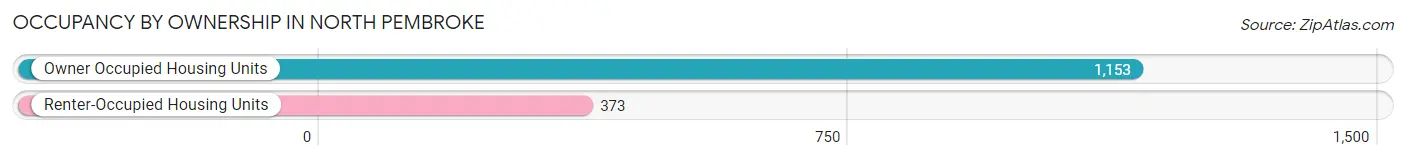
| Occupancy | # Housing Units | % Housing Units |
| Owner Occupied Housing Units | 1,153 | 75.6% |
| Renter-Occupied Housing Units | 373 | 24.4% |
| Total Occupied Housing Units | 1,526 | 100.0% |
Occupancy by Household Size in North Pembroke
| Household Size | # Housing Units | % Housing Units |
| 1-Person Household | 214 | 14.0% |
| 2-Person Household | 795 | 52.1% |
| 3-Person Household | 90 | 5.9% |
| 4+ Person Household | 427 | 28.0% |
| Total Housing Units | 1,526 | 100.0% |
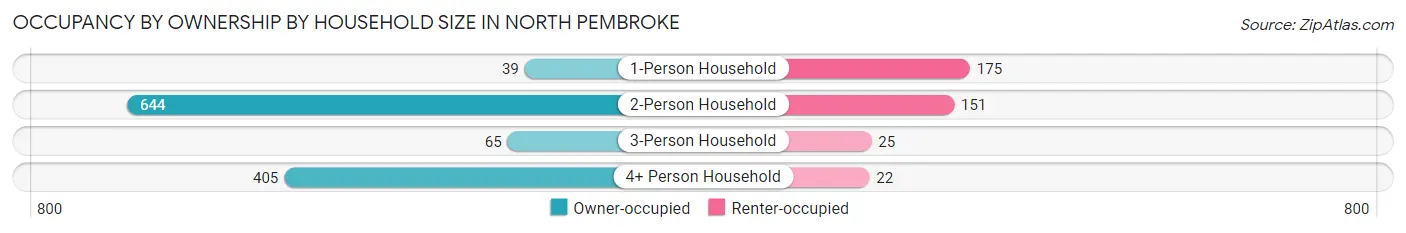
Occupancy by Ownership by Household Size in North Pembroke
| Household Size | Owner-occupied | Renter-occupied |
| 1-Person Household | 39 (18.2%) | 175 (81.8%) |
| 2-Person Household | 644 (81.0%) | 151 (19.0%) |
| 3-Person Household | 65 (72.2%) | 25 (27.8%) |
| 4+ Person Household | 405 (94.9%) | 22 (5.1%) |
| Total Housing Units | 1,153 (75.6%) | 373 (24.4%) |
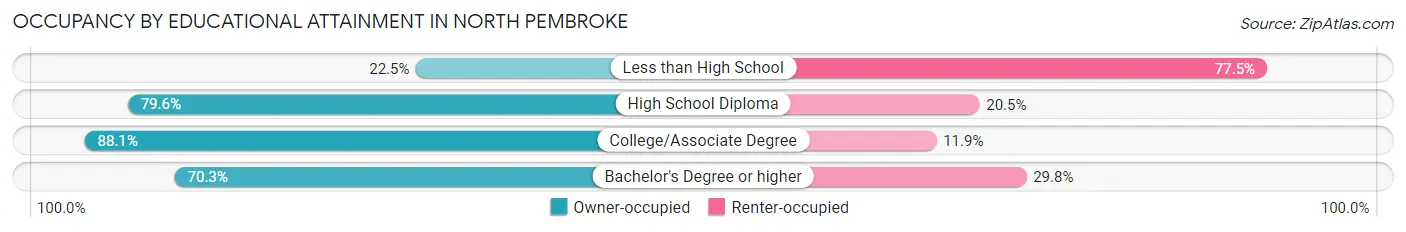
Occupancy by Educational Attainment in North Pembroke
| Household Size | Owner-occupied | Renter-occupied |
| Less than High School | 16 (22.5%) | 55 (77.5%) |
| High School Diploma | 175 (79.5%) | 45 (20.4%) |
| College/Associate Degree | 466 (88.1%) | 63 (11.9%) |
| Bachelor's Degree or higher | 496 (70.3%) | 210 (29.7%) |
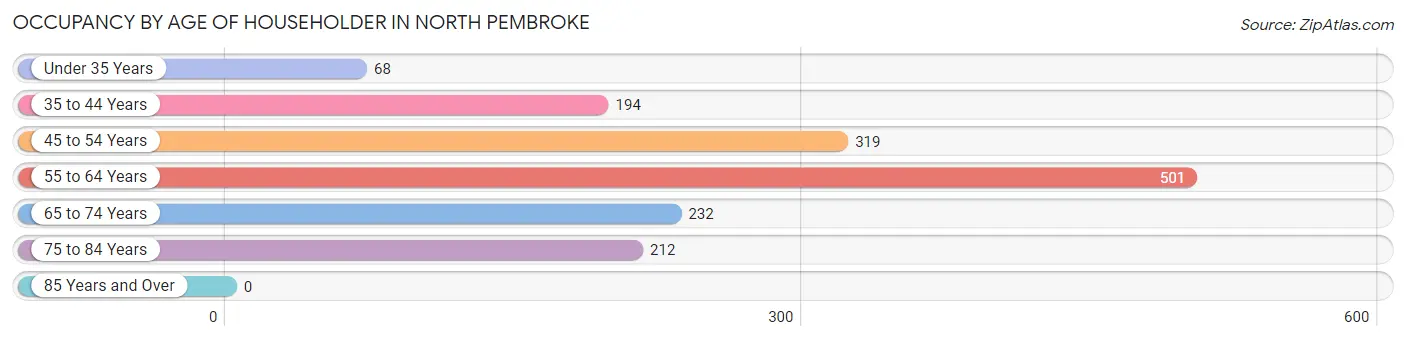
Occupancy by Age of Householder in North Pembroke
| Age Bracket | # Households | % Households |
| Under 35 Years | 68 | 4.5% |
| 35 to 44 Years | 194 | 12.7% |
| 45 to 54 Years | 319 | 20.9% |
| 55 to 64 Years | 501 | 32.8% |
| 65 to 74 Years | 232 | 15.2% |
| 75 to 84 Years | 212 | 13.9% |
| 85 Years and Over | 0 | 0.0% |
| Total | 1,526 | 100.0% |
Housing Finances in North Pembroke
Median Income by Occupancy in North Pembroke
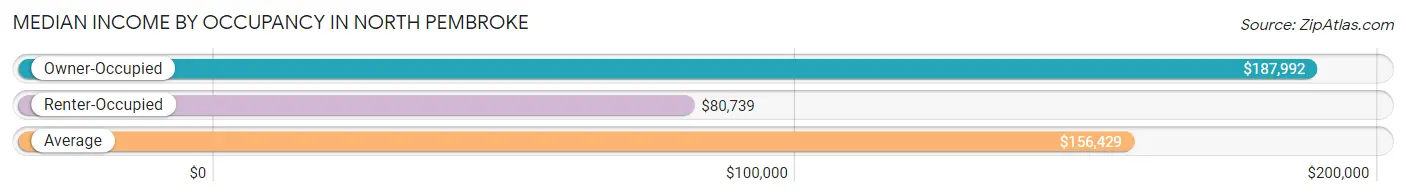
| Occupancy Type | # Households | Median Income |
| Owner-Occupied | 1,153 (75.6%) | $187,992 |
| Renter-Occupied | 373 (24.4%) | $80,739 |
| Average | 1,526 (100.0%) | $156,429 |
Occupancy by Householder Income Bracket in North Pembroke
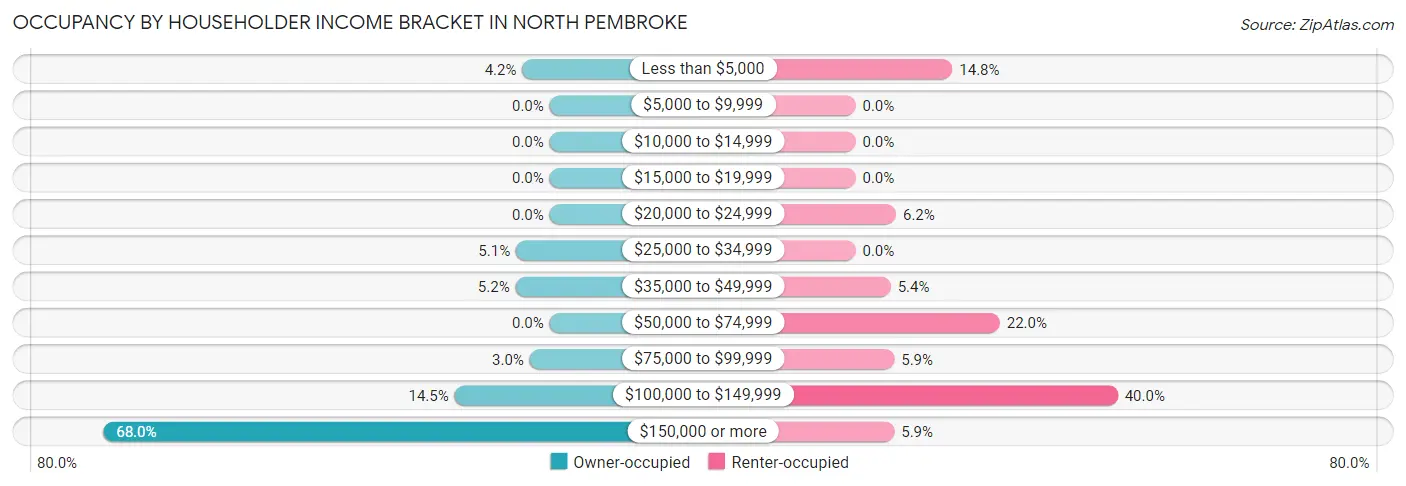
| Income Bracket | Owner-occupied | Renter-occupied |
| Less than $5,000 | 48 (4.2%) | 55 (14.7%) |
| $5,000 to $9,999 | 0 (0.0%) | 0 (0.0%) |
| $10,000 to $14,999 | 0 (0.0%) | 0 (0.0%) |
| $15,000 to $19,999 | 0 (0.0%) | 0 (0.0%) |
| $20,000 to $24,999 | 0 (0.0%) | 23 (6.2%) |
| $25,000 to $34,999 | 59 (5.1%) | 0 (0.0%) |
| $35,000 to $49,999 | 60 (5.2%) | 20 (5.4%) |
| $50,000 to $74,999 | 0 (0.0%) | 82 (22.0%) |
| $75,000 to $99,999 | 35 (3.0%) | 22 (5.9%) |
| $100,000 to $149,999 | 167 (14.5%) | 149 (40.0%) |
| $150,000 or more | 784 (68.0%) | 22 (5.9%) |
| Total | 1,153 (100.0%) | 373 (100.0%) |
Monthly Housing Cost Tiers in North Pembroke
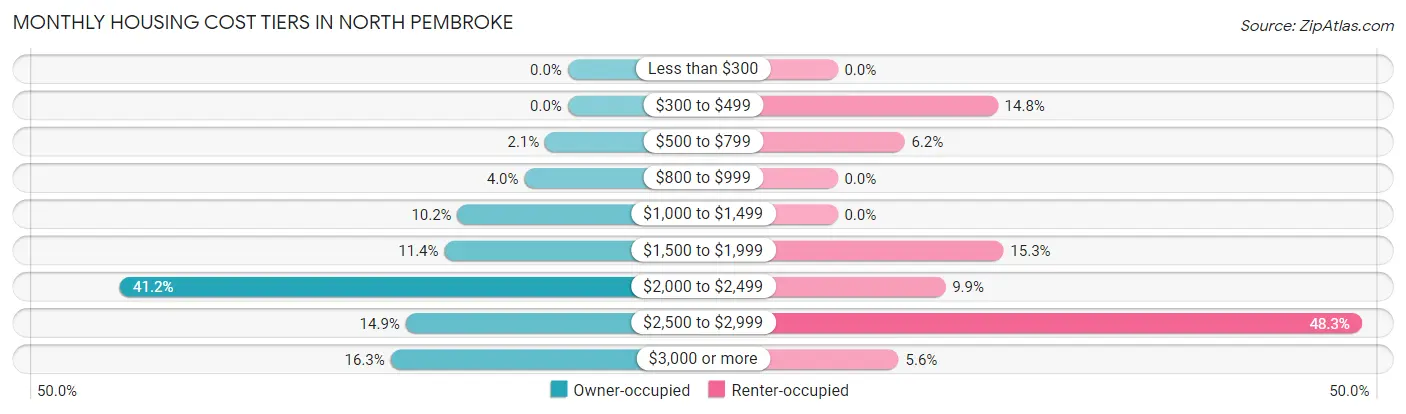
| Monthly Cost | Owner-occupied | Renter-occupied |
| Less than $300 | 0 (0.0%) | 0 (0.0%) |
| $300 to $499 | 0 (0.0%) | 55 (14.7%) |
| $500 to $799 | 24 (2.1%) | 23 (6.2%) |
| $800 to $999 | 46 (4.0%) | 0 (0.0%) |
| $1,000 to $1,499 | 117 (10.2%) | 0 (0.0%) |
| $1,500 to $1,999 | 131 (11.4%) | 57 (15.3%) |
| $2,000 to $2,499 | 475 (41.2%) | 37 (9.9%) |
| $2,500 to $2,999 | 172 (14.9%) | 180 (48.3%) |
| $3,000 or more | 188 (16.3%) | 21 (5.6%) |
| Total | 1,153 (100.0%) | 373 (100.0%) |
Physical Housing Characteristics in North Pembroke
Housing Structures in North Pembroke
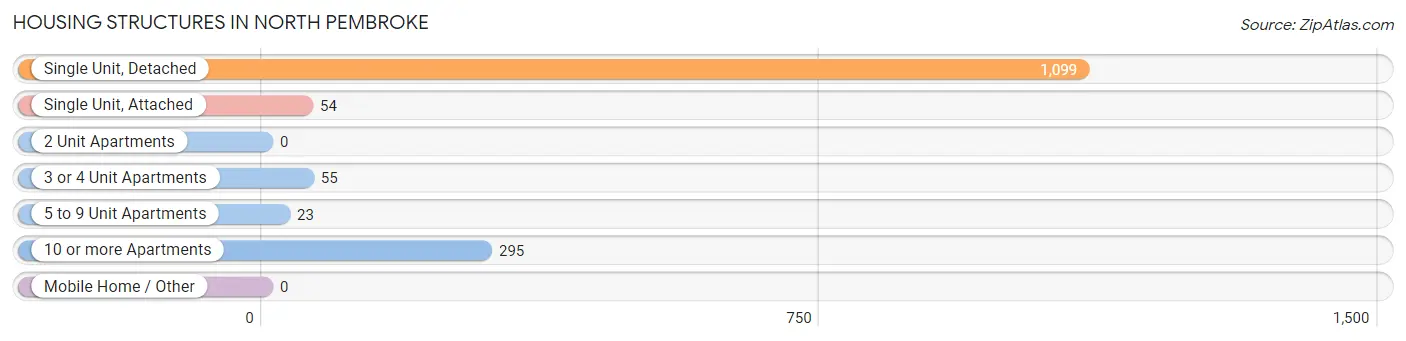
| Structure Type | # Housing Units | % Housing Units |
| Single Unit, Detached | 1,099 | 72.0% |
| Single Unit, Attached | 54 | 3.5% |
| 2 Unit Apartments | 0 | 0.0% |
| 3 or 4 Unit Apartments | 55 | 3.6% |
| 5 to 9 Unit Apartments | 23 | 1.5% |
| 10 or more Apartments | 295 | 19.3% |
| Mobile Home / Other | 0 | 0.0% |
| Total | 1,526 | 100.0% |
Housing Structures by Occupancy in North Pembroke
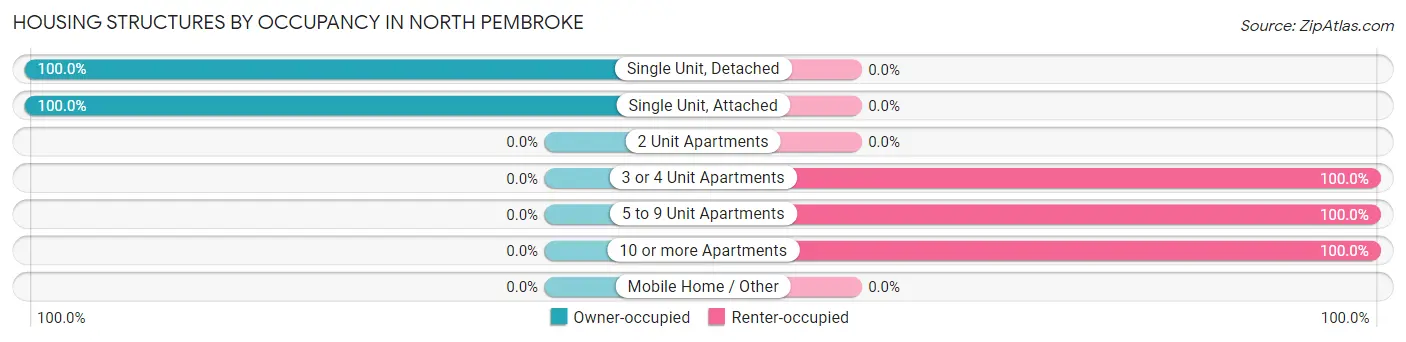
| Structure Type | Owner-occupied | Renter-occupied |
| Single Unit, Detached | 1,099 (100.0%) | 0 (0.0%) |
| Single Unit, Attached | 54 (100.0%) | 0 (0.0%) |
| 2 Unit Apartments | 0 (0.0%) | 0 (0.0%) |
| 3 or 4 Unit Apartments | 0 (0.0%) | 55 (100.0%) |
| 5 to 9 Unit Apartments | 0 (0.0%) | 23 (100.0%) |
| 10 or more Apartments | 0 (0.0%) | 295 (100.0%) |
| Mobile Home / Other | 0 (0.0%) | 0 (0.0%) |
| Total | 1,153 (75.6%) | 373 (24.4%) |
Housing Structures by Number of Rooms in North Pembroke
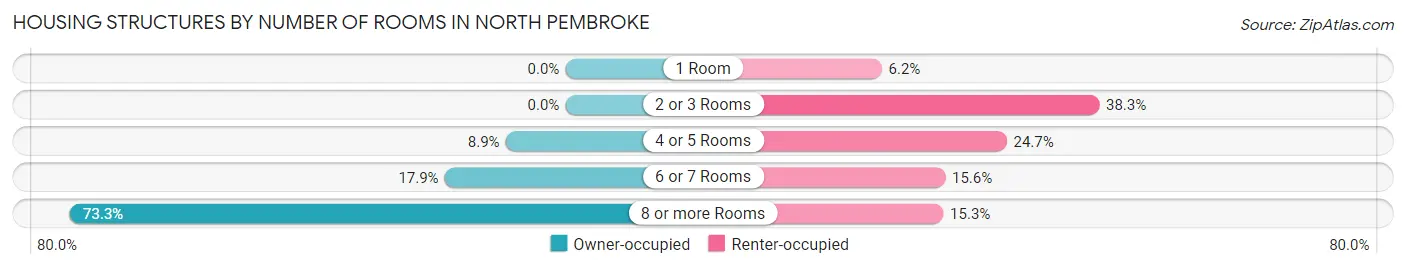
| Number of Rooms | Owner-occupied | Renter-occupied |
| 1 Room | 0 (0.0%) | 23 (6.2%) |
| 2 or 3 Rooms | 0 (0.0%) | 143 (38.3%) |
| 4 or 5 Rooms | 102 (8.8%) | 92 (24.7%) |
| 6 or 7 Rooms | 206 (17.9%) | 58 (15.5%) |
| 8 or more Rooms | 845 (73.3%) | 57 (15.3%) |
| Total | 1,153 (100.0%) | 373 (100.0%) |
Housing Structure by Heating Type in North Pembroke
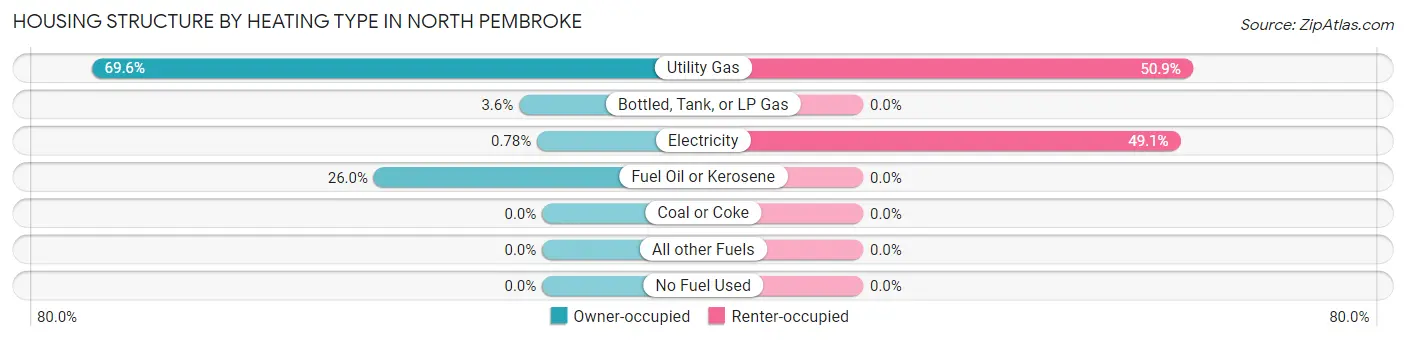
| Heating Type | Owner-occupied | Renter-occupied |
| Utility Gas | 803 (69.6%) | 190 (50.9%) |
| Bottled, Tank, or LP Gas | 41 (3.6%) | 0 (0.0%) |
| Electricity | 9 (0.8%) | 183 (49.1%) |
| Fuel Oil or Kerosene | 300 (26.0%) | 0 (0.0%) |
| Coal or Coke | 0 (0.0%) | 0 (0.0%) |
| All other Fuels | 0 (0.0%) | 0 (0.0%) |
| No Fuel Used | 0 (0.0%) | 0 (0.0%) |
| Total | 1,153 (100.0%) | 373 (100.0%) |
Household Vehicle Usage in North Pembroke
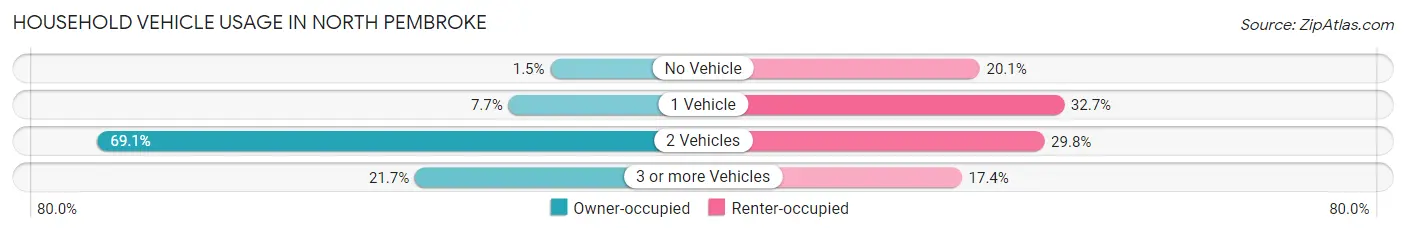
| Vehicles per Household | Owner-occupied | Renter-occupied |
| No Vehicle | 17 (1.5%) | 75 (20.1%) |
| 1 Vehicle | 89 (7.7%) | 122 (32.7%) |
| 2 Vehicles | 797 (69.1%) | 111 (29.8%) |
| 3 or more Vehicles | 250 (21.7%) | 65 (17.4%) |
| Total | 1,153 (100.0%) | 373 (100.0%) |
Real Estate & Mortgages in North Pembroke
Real Estate and Mortgage Overview in North Pembroke
| Characteristic | Without Mortgage | With Mortgage |
| Housing Units | 234 | 919 |
| Median Property Value | $735,500 | $453,300 |
| Median Household Income | $193,036 | $626 |
| Monthly Housing Costs | $1,501 | $188 |
| Real Estate Taxes | $9,500 | $0 |
Property Value by Mortgage Status in North Pembroke
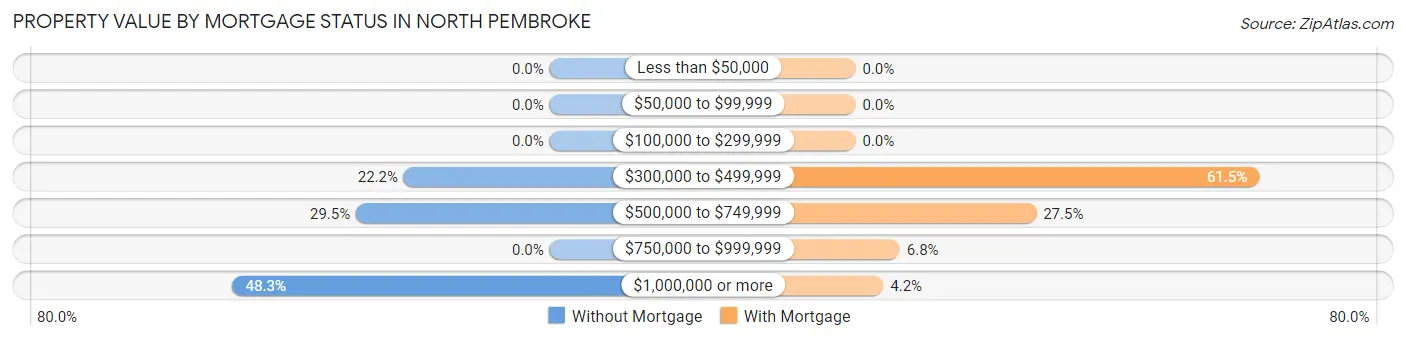
| Property Value | Without Mortgage | With Mortgage |
| Less than $50,000 | 0 (0.0%) | 0 (0.0%) |
| $50,000 to $99,999 | 0 (0.0%) | 0 (0.0%) |
| $100,000 to $299,999 | 0 (0.0%) | 0 (0.0%) |
| $300,000 to $499,999 | 52 (22.2%) | 565 (61.5%) |
| $500,000 to $749,999 | 69 (29.5%) | 253 (27.5%) |
| $750,000 to $999,999 | 0 (0.0%) | 62 (6.8%) |
| $1,000,000 or more | 113 (48.3%) | 39 (4.2%) |
| Total | 234 (100.0%) | 919 (100.0%) |
Household Income by Mortgage Status in North Pembroke
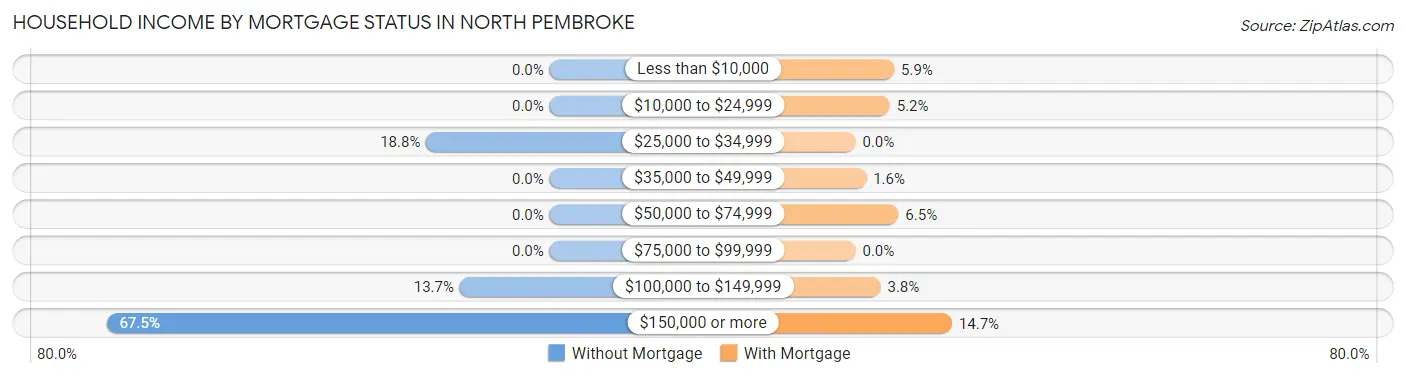
| Household Income | Without Mortgage | With Mortgage |
| Less than $10,000 | 0 (0.0%) | 54 (5.9%) |
| $10,000 to $24,999 | 0 (0.0%) | 48 (5.2%) |
| $25,000 to $34,999 | 44 (18.8%) | 0 (0.0%) |
| $35,000 to $49,999 | 0 (0.0%) | 15 (1.6%) |
| $50,000 to $74,999 | 0 (0.0%) | 60 (6.5%) |
| $75,000 to $99,999 | 0 (0.0%) | 0 (0.0%) |
| $100,000 to $149,999 | 32 (13.7%) | 35 (3.8%) |
| $150,000 or more | 158 (67.5%) | 135 (14.7%) |
| Total | 234 (100.0%) | 919 (100.0%) |
Property Value to Household Income Ratio in North Pembroke
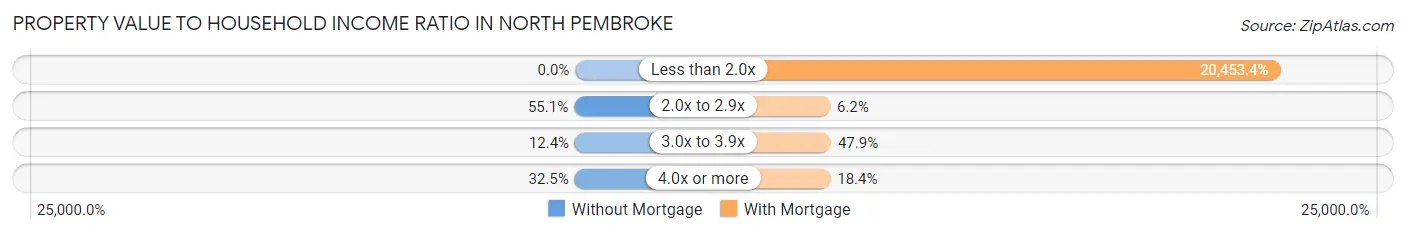
| Value-to-Income Ratio | Without Mortgage | With Mortgage |
| Less than 2.0x | 0 (0.0%) | 187,967 (20,453.4%) |
| 2.0x to 2.9x | 129 (55.1%) | 57 (6.2%) |
| 3.0x to 3.9x | 29 (12.4%) | 440 (47.9%) |
| 4.0x or more | 76 (32.5%) | 169 (18.4%) |
| Total | 234 (100.0%) | 919 (100.0%) |
Real Estate Taxes by Mortgage Status in North Pembroke
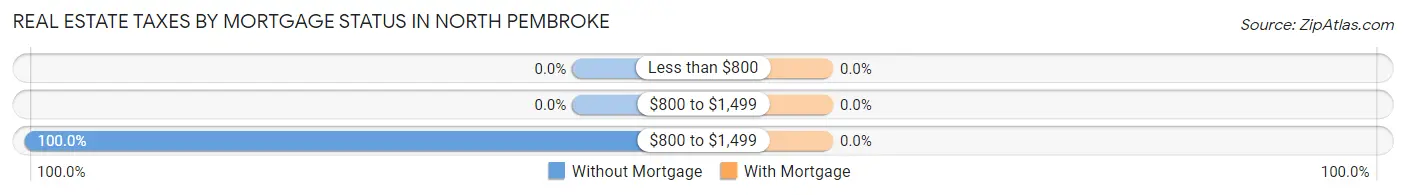
| Property Taxes | Without Mortgage | With Mortgage |
| Less than $800 | 0 (0.0%) | 0 (0.0%) |
| $800 to $1,499 | 0 (0.0%) | 0 (0.0%) |
| $800 to $1,499 | 234 (100.0%) | 0 (0.0%) |
| Total | 234 (100.0%) | 919 (100.0%) |
Health & Disability in North Pembroke
Health Insurance Coverage by Age in North Pembroke
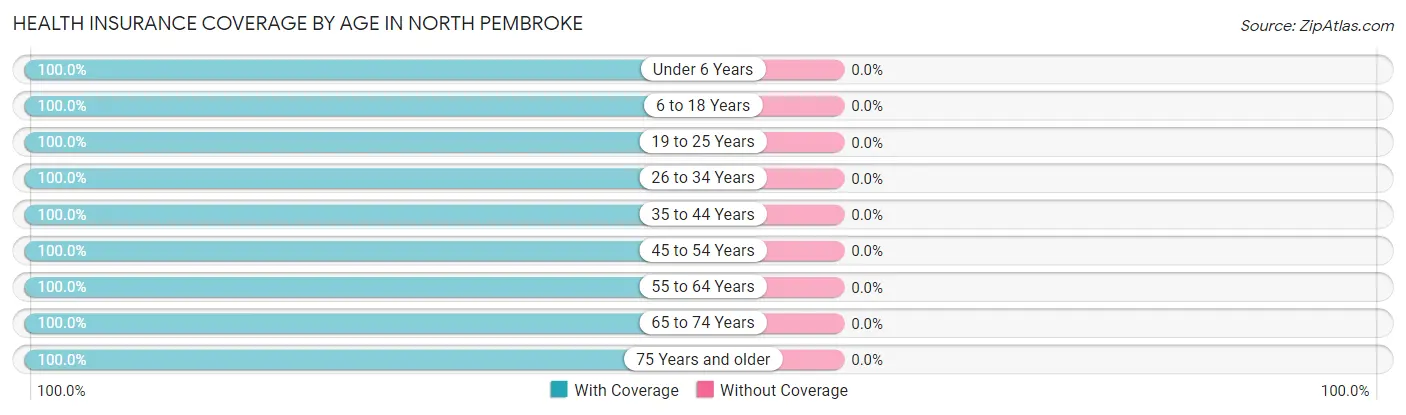
| Age Bracket | With Coverage | Without Coverage |
| Under 6 Years | 207 (100.0%) | 0 (0.0%) |
| 6 to 18 Years | 692 (100.0%) | 0 (0.0%) |
| 19 to 25 Years | 174 (100.0%) | 0 (0.0%) |
| 26 to 34 Years | 190 (100.0%) | 0 (0.0%) |
| 35 to 44 Years | 433 (100.0%) | 0 (0.0%) |
| 45 to 54 Years | 534 (100.0%) | 0 (0.0%) |
| 55 to 64 Years | 690 (100.0%) | 0 (0.0%) |
| 65 to 74 Years | 646 (100.0%) | 0 (0.0%) |
| 75 Years and older | 358 (100.0%) | 0 (0.0%) |
| Total | 3,924 (100.0%) | 0 (0.0%) |
Health Insurance Coverage by Citizenship Status in North Pembroke
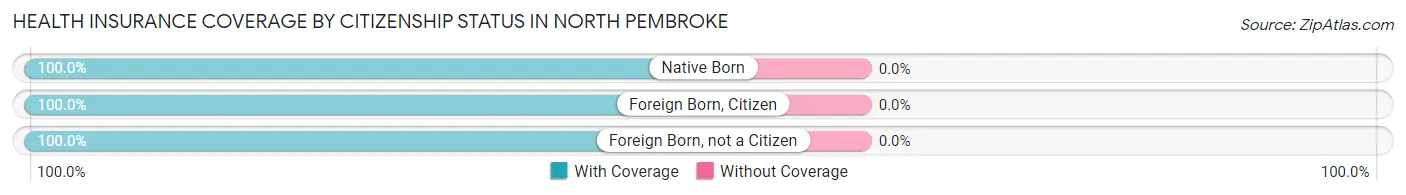
| Citizenship Status | With Coverage | Without Coverage |
| Native Born | 207 (100.0%) | 0 (0.0%) |
| Foreign Born, Citizen | 692 (100.0%) | 0 (0.0%) |
| Foreign Born, not a Citizen | 174 (100.0%) | 0 (0.0%) |
Health Insurance Coverage by Household Income in North Pembroke
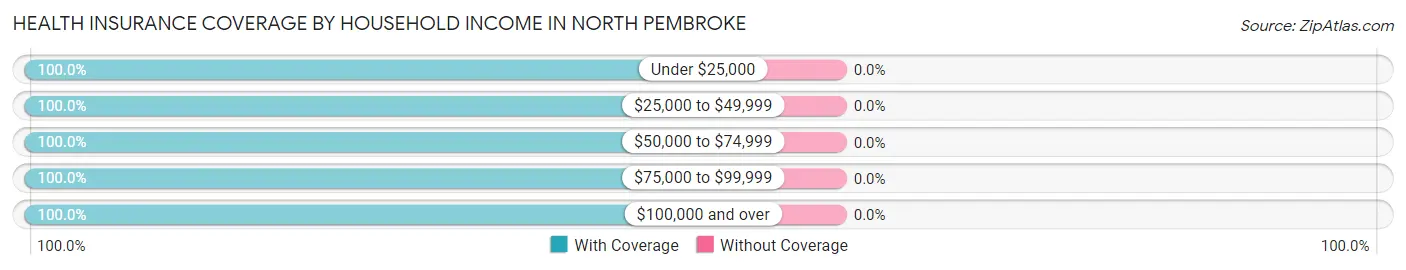
| Household Income | With Coverage | Without Coverage |
| Under $25,000 | 169 (100.0%) | 0 (0.0%) |
| $25,000 to $49,999 | 245 (100.0%) | 0 (0.0%) |
| $50,000 to $74,999 | 126 (100.0%) | 0 (0.0%) |
| $75,000 to $99,999 | 191 (100.0%) | 0 (0.0%) |
| $100,000 and over | 3,185 (100.0%) | 0 (0.0%) |
Public vs Private Health Insurance Coverage by Age in North Pembroke
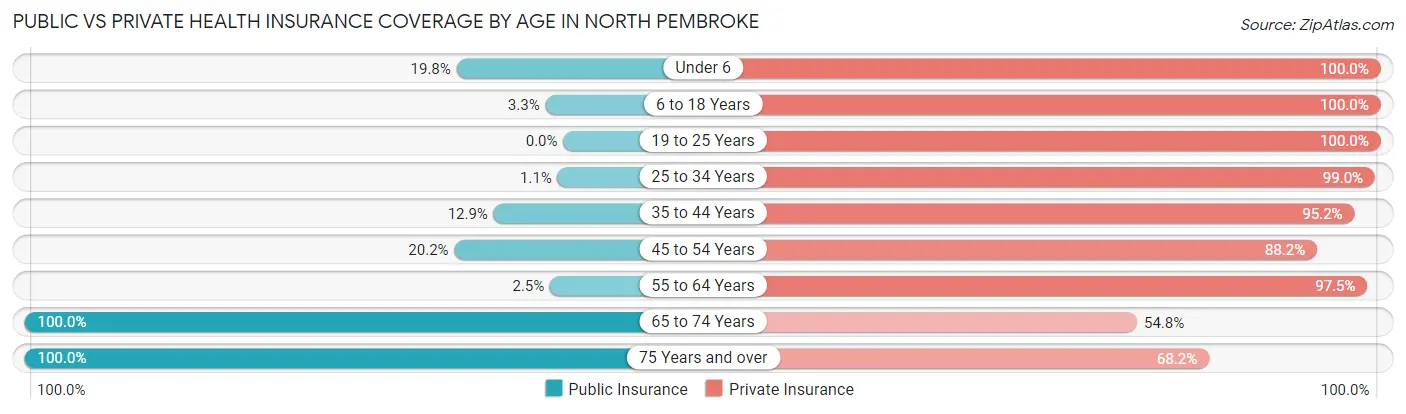
| Age Bracket | Public Insurance | Private Insurance |
| Under 6 | 41 (19.8%) | 207 (100.0%) |
| 6 to 18 Years | 23 (3.3%) | 692 (100.0%) |
| 19 to 25 Years | 0 (0.0%) | 174 (100.0%) |
| 25 to 34 Years | 2 (1.1%) | 188 (99.0%) |
| 35 to 44 Years | 56 (12.9%) | 412 (95.2%) |
| 45 to 54 Years | 108 (20.2%) | 471 (88.2%) |
| 55 to 64 Years | 17 (2.5%) | 673 (97.5%) |
| 65 to 74 Years | 646 (100.0%) | 354 (54.8%) |
| 75 Years and over | 358 (100.0%) | 244 (68.2%) |
| Total | 1,251 (31.9%) | 3,415 (87.0%) |
Disability Status by Sex by Age in North Pembroke
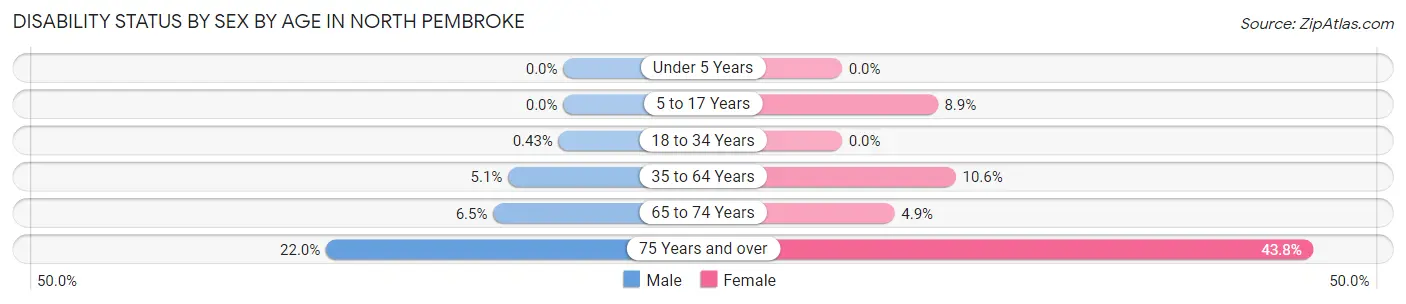
| Age Bracket | Male | Female |
| Under 5 Years | 0 (0.0%) | 0 (0.0%) |
| 5 to 17 Years | 0 (0.0%) | 34 (8.9%) |
| 18 to 34 Years | 1 (0.4%) | 0 (0.0%) |
| 35 to 64 Years | 32 (5.1%) | 109 (10.6%) |
| 65 to 74 Years | 26 (6.5%) | 12 (4.9%) |
| 75 Years and over | 24 (22.0%) | 109 (43.8%) |
Disability Class by Sex by Age in North Pembroke
Disability Class: Hearing Difficulty
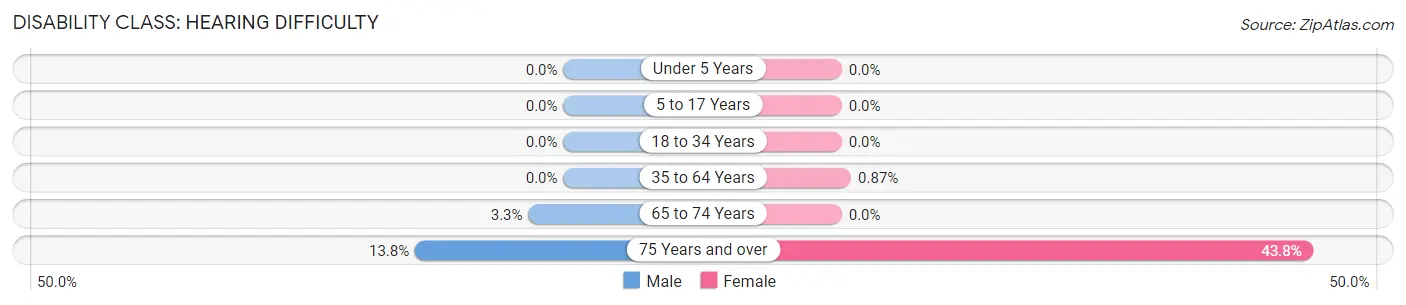
| Age Bracket | Male | Female |
| Under 5 Years | 0 (0.0%) | 0 (0.0%) |
| 5 to 17 Years | 0 (0.0%) | 0 (0.0%) |
| 18 to 34 Years | 0 (0.0%) | 0 (0.0%) |
| 35 to 64 Years | 0 (0.0%) | 9 (0.9%) |
| 65 to 74 Years | 13 (3.3%) | 0 (0.0%) |
| 75 Years and over | 15 (13.8%) | 109 (43.8%) |
Disability Class: Vision Difficulty
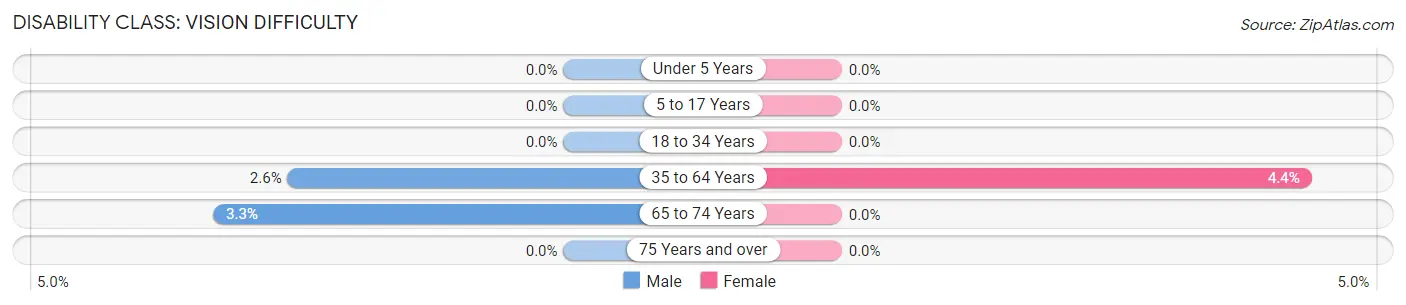
| Age Bracket | Male | Female |
| Under 5 Years | 0 (0.0%) | 0 (0.0%) |
| 5 to 17 Years | 0 (0.0%) | 0 (0.0%) |
| 18 to 34 Years | 0 (0.0%) | 0 (0.0%) |
| 35 to 64 Years | 16 (2.6%) | 45 (4.4%) |
| 65 to 74 Years | 13 (3.3%) | 0 (0.0%) |
| 75 Years and over | 0 (0.0%) | 0 (0.0%) |
Disability Class: Cognitive Difficulty
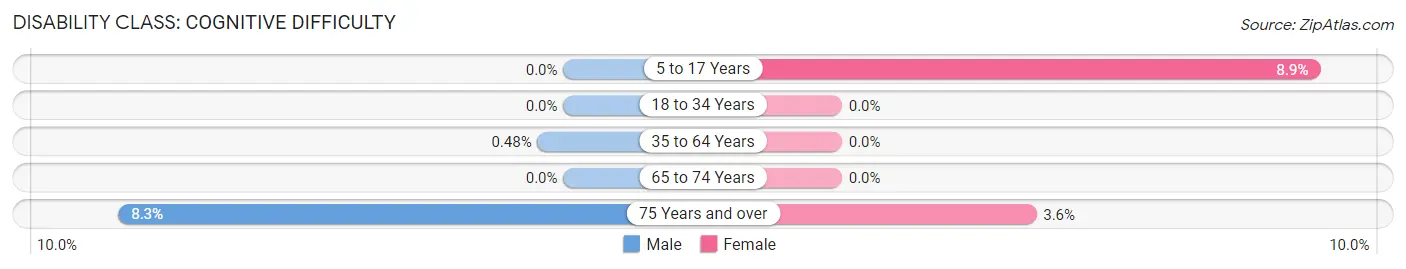
| Age Bracket | Male | Female |
| 5 to 17 Years | 0 (0.0%) | 34 (8.9%) |
| 18 to 34 Years | 0 (0.0%) | 0 (0.0%) |
| 35 to 64 Years | 3 (0.5%) | 0 (0.0%) |
| 65 to 74 Years | 0 (0.0%) | 0 (0.0%) |
| 75 Years and over | 9 (8.3%) | 9 (3.6%) |
Disability Class: Ambulatory Difficulty
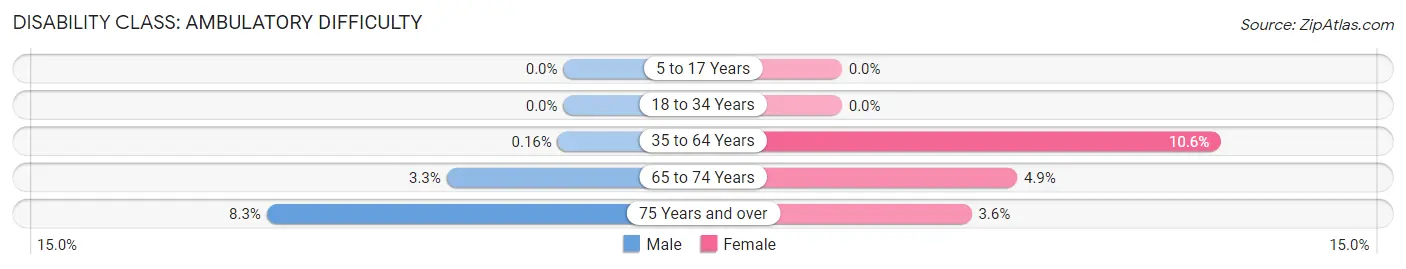
| Age Bracket | Male | Female |
| 5 to 17 Years | 0 (0.0%) | 0 (0.0%) |
| 18 to 34 Years | 0 (0.0%) | 0 (0.0%) |
| 35 to 64 Years | 1 (0.2%) | 109 (10.6%) |
| 65 to 74 Years | 13 (3.3%) | 12 (4.9%) |
| 75 Years and over | 9 (8.3%) | 9 (3.6%) |
Disability Class: Self-Care Difficulty
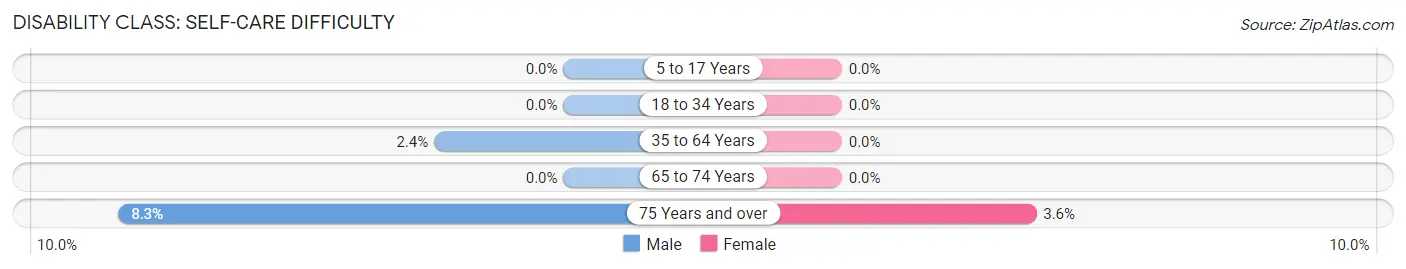
| Age Bracket | Male | Female |
| 5 to 17 Years | 0 (0.0%) | 0 (0.0%) |
| 18 to 34 Years | 0 (0.0%) | 0 (0.0%) |
| 35 to 64 Years | 15 (2.4%) | 0 (0.0%) |
| 65 to 74 Years | 0 (0.0%) | 0 (0.0%) |
| 75 Years and over | 9 (8.3%) | 9 (3.6%) |
Technology Access in North Pembroke
Computing Device Access in North Pembroke
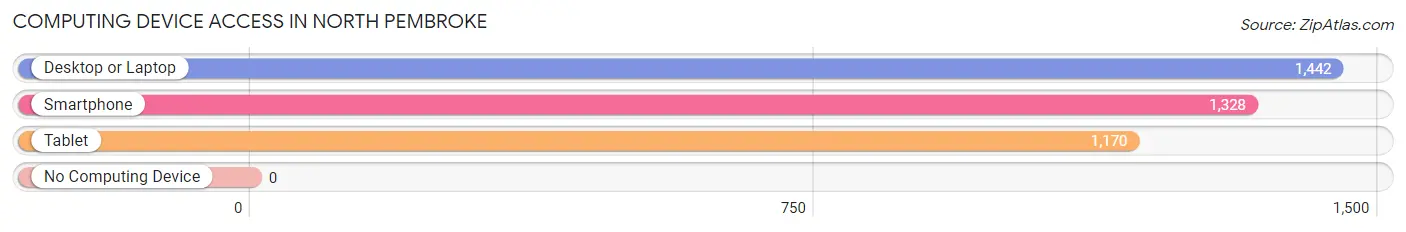
| Device Type | # Households | % Households |
| Desktop or Laptop | 1,442 | 94.5% |
| Smartphone | 1,328 | 87.0% |
| Tablet | 1,170 | 76.7% |
| No Computing Device | 0 | 0.0% |
| Total | 1,526 | 100.0% |
Internet Access in North Pembroke
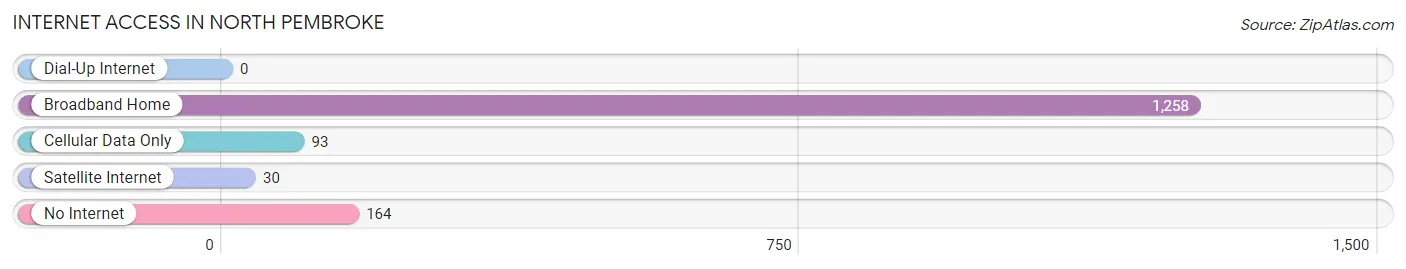
| Internet Type | # Households | % Households |
| Dial-Up Internet | 0 | 0.0% |
| Broadband Home | 1,258 | 82.4% |
| Cellular Data Only | 93 | 6.1% |
| Satellite Internet | 30 | 2.0% |
| No Internet | 164 | 10.7% |
| Total | 1,526 | 100.0% |
North Pembroke Summary
North Pembroke is a small town located in Plymouth County, Massachusetts. It is situated on the north bank of the North River, which is a tributary of the Taunton River. The town is bordered by the towns of Hanover to the north, Pembroke to the south, Hanson to the east, and Marshfield to the west. The population of North Pembroke was 4,845 at the 2010 census.
History
North Pembroke was first settled in 1650 by a group of English settlers from the Plymouth Colony. The town was originally part of the town of Pembroke, which was incorporated in 1712. In 1820, the town of North Pembroke was officially incorporated.
The town was primarily an agricultural community until the mid-19th century, when the shoe industry began to take hold. The shoe industry was a major employer in the town until the mid-20th century, when it began to decline.
Geography
North Pembroke is located in southeastern Massachusetts, about 25 miles south of Boston. The town is situated on the north bank of the North River, which is a tributary of the Taunton River. The town is bordered by the towns of Hanover to the north, Pembroke to the south, Hanson to the east, and Marshfield to the west.
The town has a total area of 8.2 square miles, of which 8.1 square miles is land and 0.1 square miles is water. The town is mostly flat, with some small hills in the northern part of town.
Economy
North Pembroke is a primarily residential community, with no major industries or businesses. The town is home to several small businesses, including a few restaurants, a grocery store, and a few retail stores.
The town is also home to several small farms, which produce a variety of fruits and vegetables. The town also has a few small manufacturing businesses, which produce a variety of products, including furniture, clothing, and electronics.
Demographics
As of the 2010 census, there were 4,845 people, 1,845 households, and 1,346 families residing in the town. The population density was 597.3 people per square mile. There were 1,945 housing units at an average density of 239.3 per square mile.
The racial makeup of the town was 97.2% White, 0.7% African American, 0.2% Native American, 0.5% Asian, 0.1% Pacific Islander, 0.4% from other races, and 0.9% from two or more races. Hispanic or Latino of any race were 1.3% of the population.
There were 1,845 households, out of which 33.2% had children under the age of 18 living with them, 57.2% were married couples living together, 10.2% had a female householder with no husband present, and 28.2% were non-families. 22.2% of all households were made up of individuals, and 8.2% had someone living alone who was 65 years of age or older. The average household size was 2.63 and the average family size was 3.09.
In the town, the population was spread out, with 25.2% under the age of 18, 6.2% from 18 to 24, 30.2% from 25 to 44, 25.2% from 45 to 64, and 13.2% who were 65 years of age or older. The median age was 38 years. For every 100 females, there were 97.2 males. For every 100 females age 18 and over, there were 94.2 males.
The median income for a household in the town was $60,938, and the median income for a family was $68,750. Males had a median income of $45,938 versus $35,000 for females. The per capita income for the town was $25,938. About 3.2% of families and 4.2% of the population were below the poverty line, including 5.2% of those under age 18 and 4.2% of those age 65 or over.
Common Questions
What is Per Capita Income in North Pembroke?
Per Capita income in North Pembroke is $61,174.
What is the Median Family Income in North Pembroke?
Median Family Income in North Pembroke is $187,769.
What is the Median Household income in North Pembroke?
Median Household Income in North Pembroke is $156,429.
What is Income or Wage Gap in North Pembroke?
Income or Wage Gap in North Pembroke is 0.3%.
Women in North Pembroke earn 99.7 cents for every dollar earned by a man.
What is Inequality or Gini Index in North Pembroke?
Inequality or Gini Index in North Pembroke is 0.35.
What is the Total Population of North Pembroke?
Total Population of North Pembroke is 3,954.
What is the Total Male Population of North Pembroke?
Total Male Population of North Pembroke is 1,751.
What is the Total Female Population of North Pembroke?
Total Female Population of North Pembroke is 2,203.
What is the Ratio of Males per 100 Females in North Pembroke?
There are 79.48 Males per 100 Females in North Pembroke.
What is the Ratio of Females per 100 Males in North Pembroke?
There are 125.81 Females per 100 Males in North Pembroke.
What is the Median Population Age in North Pembroke?
Median Population Age in North Pembroke is 50.8 Years.
What is the Average Family Size in North Pembroke
Average Family Size in North Pembroke is 2.9 People.
What is the Average Household Size in North Pembroke
Average Household Size in North Pembroke is 2.6 People.
How Large is the Labor Force in North Pembroke?
There are 1,866 People in the Labor Forcein in North Pembroke.
What is the Percentage of People in the Labor Force in North Pembroke?
58.1% of People are in the Labor Force in North Pembroke.
What is the Unemployment Rate in North Pembroke?
Unemployment Rate in North Pembroke is 1.6%.