Great Barrington, MA Map & Demographics
Great Barrington Map
Great Barrington Overview
$38,284
PER CAPITA INCOME
$92,143
AVG FAMILY INCOME
$44,583
AVG HOUSEHOLD INCOME
0.48
INEQUALITY / GINI INDEX
1,890
TOTAL POPULATION
626
MALE POPULATION
1,264
FEMALE POPULATION
49.53
MALES / 100 FEMALES
201.92
FEMALES / 100 MALES
49.8
MEDIAN AGE
2.9
AVG FAMILY SIZE
1.9
AVG HOUSEHOLD SIZE
994
LABOR FORCE [ PEOPLE ]
63.9%
PERCENT IN LABOR FORCE
3.4%
UNEMPLOYMENT RATE
Great Barrington Zip Codes
Great Barrington Area Codes
Income in Great Barrington
Income Overview in Great Barrington
Per Capita Income in Great Barrington is $38,284, while median incomes of families and households are $92,143 and $44,583 respectively.
| Characteristic | Number | Measure |
| Per Capita Income | 1,890 | $38,284 |
| Median Family Income | 430 | $92,143 |
| Mean Family Income | 430 | $95,888 |
| Median Household Income | 970 | $44,583 |
| Mean Household Income | 970 | $71,658 |
| Income Deficit | 430 | $0 |
| Wage / Income Gap (%) | 1,890 | 0.00% |
| Wage / Income Gap ($) | 1,890 | 100.00¢ per $1 |
| Gini / Inequality Index | 1,890 | 0.48 |
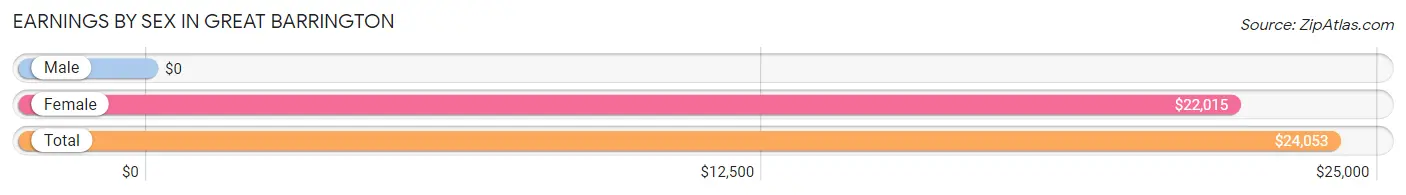
Earnings by Sex in Great Barrington
| Sex | Number | Average Earnings |
| Male | 383 (36.2%) | $0 |
| Female | 676 (63.8%) | $22,015 |
| Total | 1,059 (100.0%) | $24,053 |
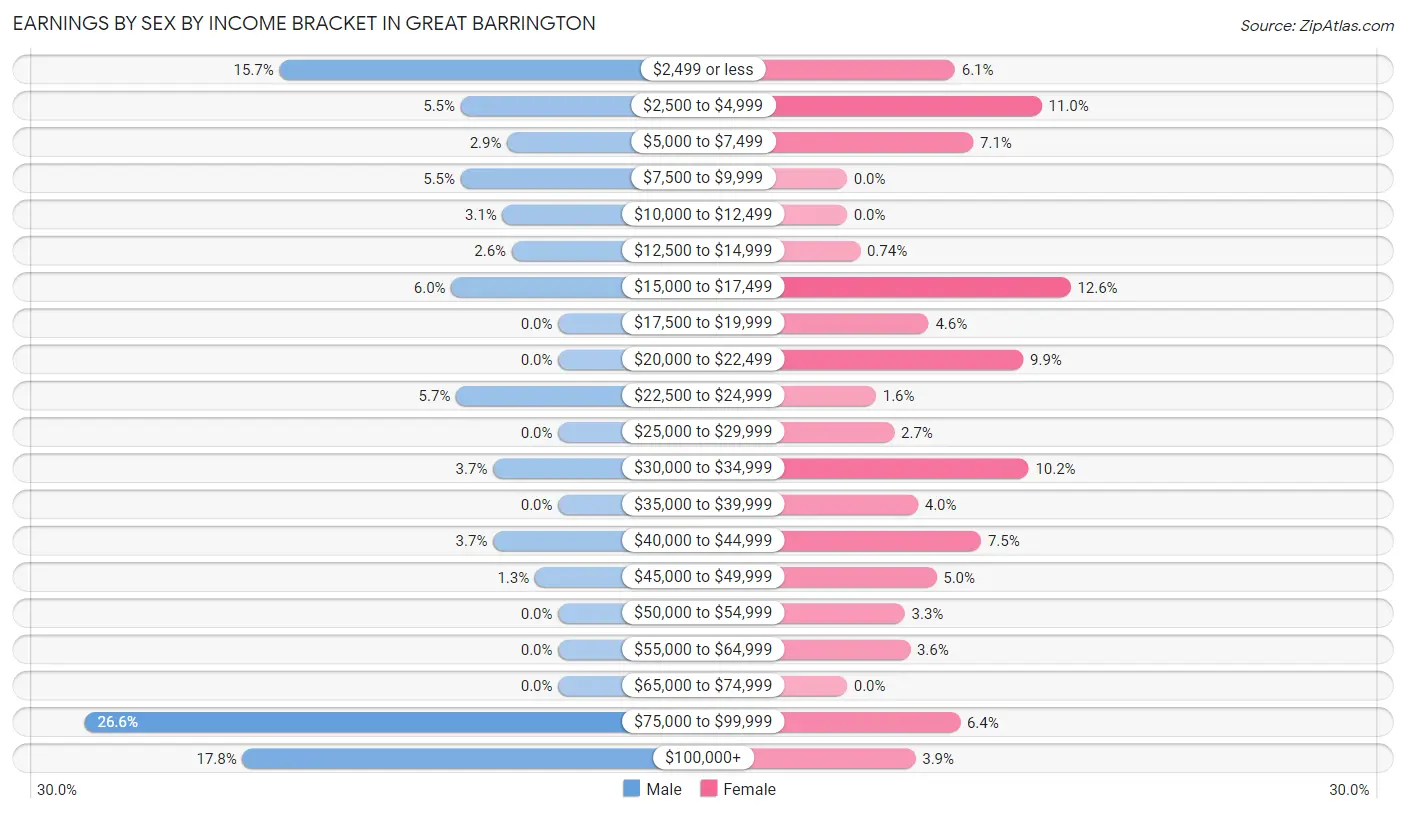
Earnings by Sex by Income Bracket in Great Barrington
The most common earnings brackets in Great Barrington are $75,000 to $99,999 for men (102 | 26.6%) and $15,000 to $17,499 for women (85 | 12.6%).
| Income | Male | Female |
| $2,499 or less | 60 (15.7%) | 41 (6.1%) |
| $2,500 to $4,999 | 21 (5.5%) | 74 (11.0%) |
| $5,000 to $7,499 | 11 (2.9%) | 48 (7.1%) |
| $7,500 to $9,999 | 21 (5.5%) | 0 (0.0%) |
| $10,000 to $12,499 | 12 (3.1%) | 0 (0.0%) |
| $12,500 to $14,999 | 10 (2.6%) | 5 (0.7%) |
| $15,000 to $17,499 | 23 (6.0%) | 85 (12.6%) |
| $17,500 to $19,999 | 0 (0.0%) | 31 (4.6%) |
| $20,000 to $22,499 | 0 (0.0%) | 67 (9.9%) |
| $22,500 to $24,999 | 22 (5.7%) | 11 (1.6%) |
| $25,000 to $29,999 | 0 (0.0%) | 18 (2.7%) |
| $30,000 to $34,999 | 14 (3.7%) | 69 (10.2%) |
| $35,000 to $39,999 | 0 (0.0%) | 27 (4.0%) |
| $40,000 to $44,999 | 14 (3.7%) | 51 (7.5%) |
| $45,000 to $49,999 | 5 (1.3%) | 34 (5.0%) |
| $50,000 to $54,999 | 0 (0.0%) | 22 (3.3%) |
| $55,000 to $64,999 | 0 (0.0%) | 24 (3.5%) |
| $65,000 to $74,999 | 0 (0.0%) | 0 (0.0%) |
| $75,000 to $99,999 | 102 (26.6%) | 43 (6.4%) |
| $100,000+ | 68 (17.7%) | 26 (3.8%) |
| Total | 383 (100.0%) | 676 (100.0%) |
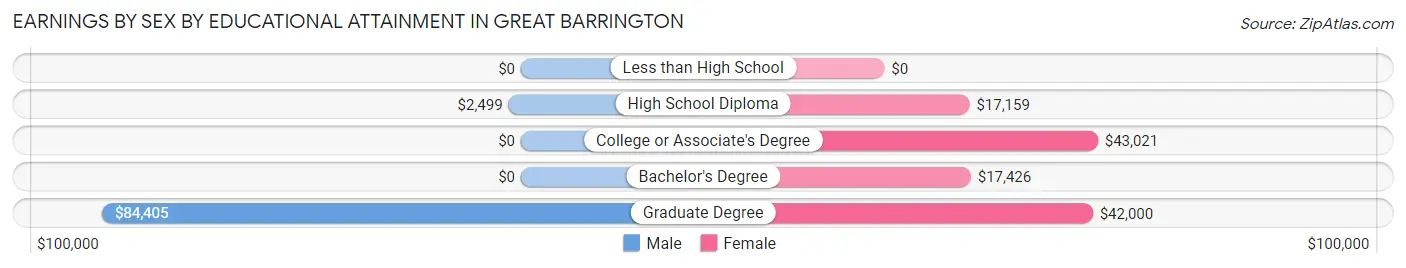
Earnings by Sex by Educational Attainment in Great Barrington
| Educational Attainment | Male Income | Female Income |
| Less than High School | - | - |
| High School Diploma | $2,499 | $17,159 |
| College or Associate's Degree | - | - |
| Bachelor's Degree | - | - |
| Graduate Degree | $84,405 | $42,000 |
| Total | - | - |
Family Income in Great Barrington
Family Income Brackets in Great Barrington
According to the Great Barrington family income data, there are 127 families falling into the $100,000 to $149,999 income range, which is the most common income bracket and makes up 29.5% of all families.
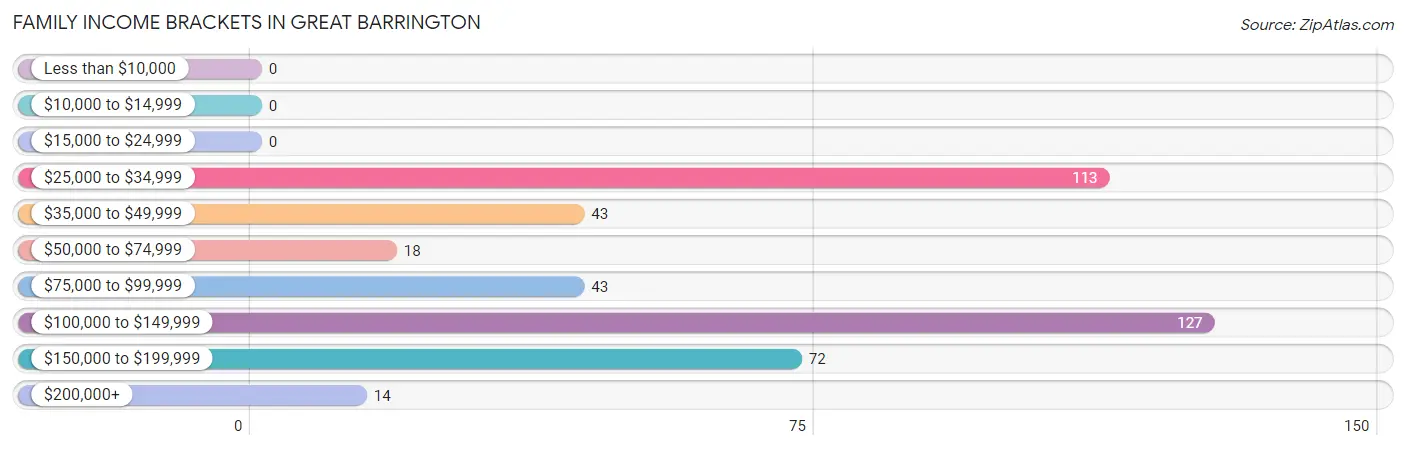
| Income Bracket | # Families | % Families |
| Less than $10,000 | 0 | 0.0% |
| $10,000 to $14,999 | 0 | 0.0% |
| $15,000 to $24,999 | 0 | 0.0% |
| $25,000 to $34,999 | 113 | 26.3% |
| $35,000 to $49,999 | 43 | 10.0% |
| $50,000 to $74,999 | 18 | 4.2% |
| $75,000 to $99,999 | 43 | 10.0% |
| $100,000 to $149,999 | 127 | 29.5% |
| $150,000 to $199,999 | 72 | 16.7% |
| $200,000+ | 14 | 3.3% |
Family Income by Famaliy Size in Great Barrington
4-person families (82 | 19.1%) account for the highest median family income in Great Barrington with $117,619 per family, while 2-person families (223 | 51.9%) have the highest median income of $45,223 per family member.
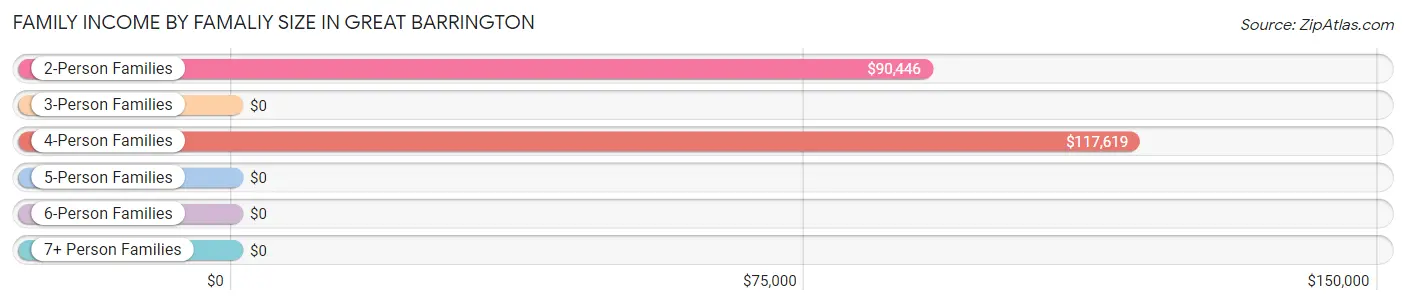
| Income Bracket | # Families | Median Income |
| 2-Person Families | 223 (51.9%) | $90,446 |
| 3-Person Families | 125 (29.1%) | $0 |
| 4-Person Families | 82 (19.1%) | $117,619 |
| 5-Person Families | 0 (0.0%) | $0 |
| 6-Person Families | 0 (0.0%) | $0 |
| 7+ Person Families | 0 (0.0%) | $0 |
| Total | 430 (100.0%) | $92,143 |
Family Income by Number of Earners in Great Barrington
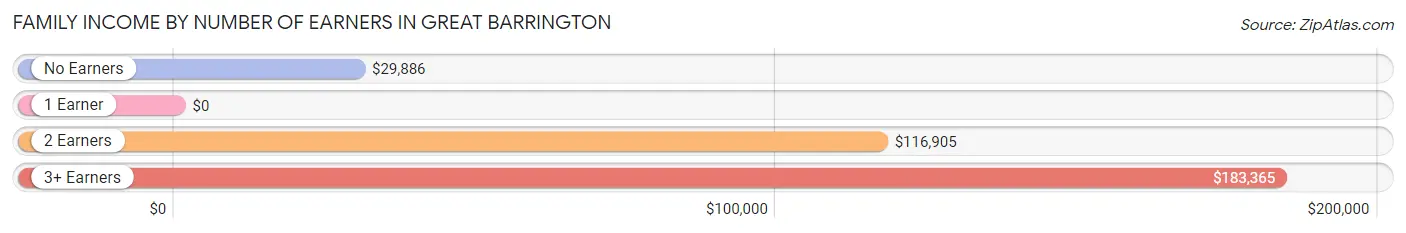
| Number of Earners | # Families | Median Income |
| No Earners | 65 (15.1%) | $29,886 |
| 1 Earner | 124 (28.8%) | $0 |
| 2 Earners | 196 (45.6%) | $116,905 |
| 3+ Earners | 45 (10.5%) | $183,365 |
| Total | 430 (100.0%) | $92,143 |
Household Income in Great Barrington
Household Income Brackets in Great Barrington
With 165 households falling in the category, the $50,000 to $74,999 income range is the most frequent in Great Barrington, accounting for 17.0% of all households. In contrast, only 18 households (1.9%) fall into the $10,000 to $14,999 income bracket, making it the least populous group.
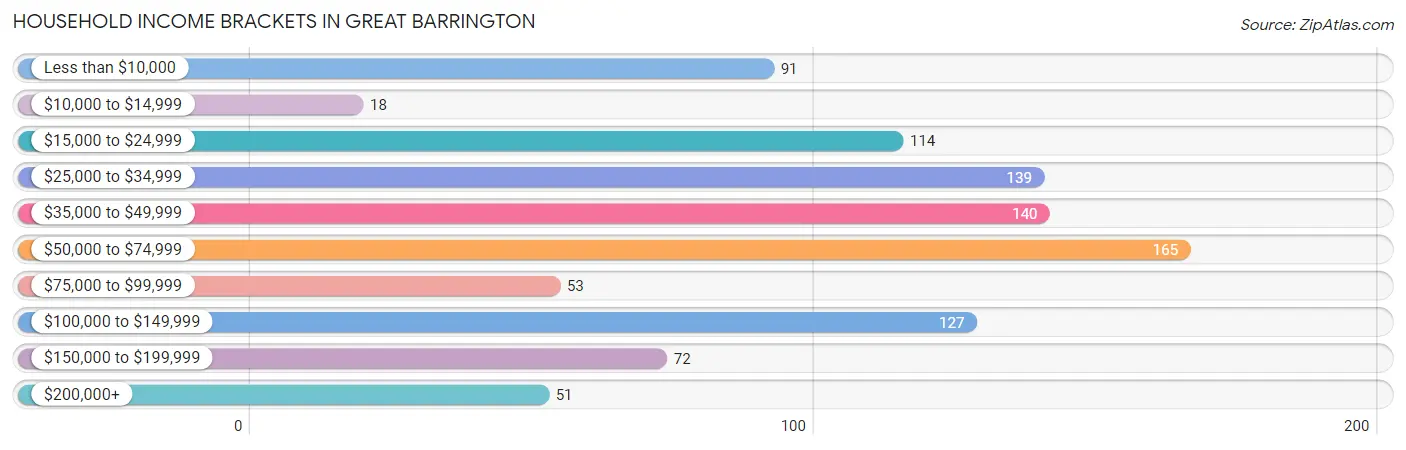
| Income Bracket | # Households | % Households |
| Less than $10,000 | 91 | 9.4% |
| $10,000 to $14,999 | 18 | 1.9% |
| $15,000 to $24,999 | 114 | 11.8% |
| $25,000 to $34,999 | 139 | 14.3% |
| $35,000 to $49,999 | 140 | 14.4% |
| $50,000 to $74,999 | 165 | 17.0% |
| $75,000 to $99,999 | 53 | 5.5% |
| $100,000 to $149,999 | 127 | 13.1% |
| $150,000 to $199,999 | 72 | 7.4% |
| $200,000+ | 51 | 5.3% |
Household Income by Householder Age in Great Barrington
The median household income in Great Barrington is $44,583, with the highest median household income of $67,583 found in the 45 to 64 years age bracket for the primary householder. A total of 369 households (38.0%) fall into this category. Meanwhile, the 15 to 24 years age bracket for the primary householder has the lowest median household income of $0, with 54 households (5.6%) in this group.
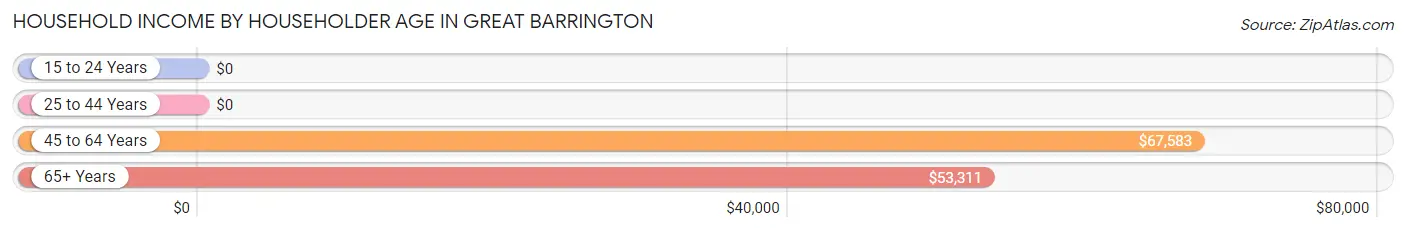
| Income Bracket | # Households | Median Income |
| 15 to 24 Years | 54 (5.6%) | $0 |
| 25 to 44 Years | 139 (14.3%) | $0 |
| 45 to 64 Years | 369 (38.0%) | $67,583 |
| 65+ Years | 408 (42.1%) | $53,311 |
| Total | 970 (100.0%) | $44,583 |
Poverty in Great Barrington
Income Below Poverty by Sex and Age in Great Barrington
With 9.9% poverty level for males and 3.9% for females among the residents of Great Barrington, 25 to 34 year old males and 55 to 64 year old females are the most vulnerable to poverty, with 60 males (58.3%) and 17 females (11.3%) in their respective age groups living below the poverty level.
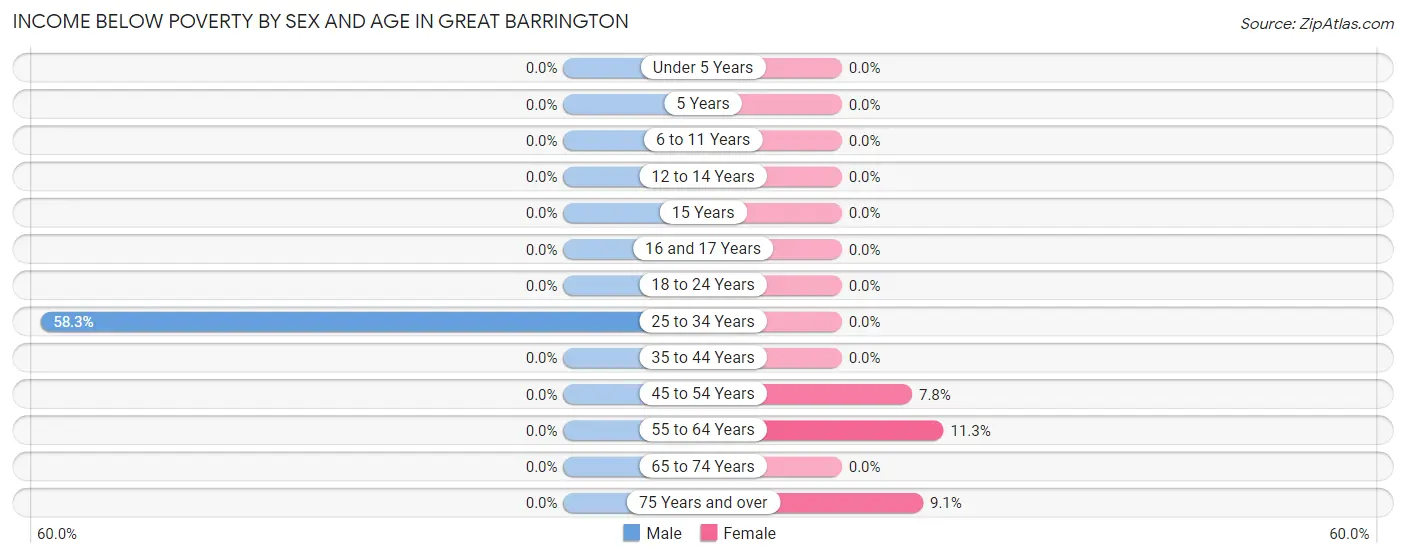
| Age Bracket | Male | Female |
| Under 5 Years | 0 (0.0%) | 0 (0.0%) |
| 5 Years | 0 (0.0%) | 0 (0.0%) |
| 6 to 11 Years | 0 (0.0%) | 0 (0.0%) |
| 12 to 14 Years | 0 (0.0%) | 0 (0.0%) |
| 15 Years | 0 (0.0%) | 0 (0.0%) |
| 16 and 17 Years | 0 (0.0%) | 0 (0.0%) |
| 18 to 24 Years | 0 (0.0%) | 0 (0.0%) |
| 25 to 34 Years | 60 (58.3%) | 0 (0.0%) |
| 35 to 44 Years | 0 (0.0%) | 0 (0.0%) |
| 45 to 54 Years | 0 (0.0%) | 14 (7.8%) |
| 55 to 64 Years | 0 (0.0%) | 17 (11.3%) |
| 65 to 74 Years | 0 (0.0%) | 0 (0.0%) |
| 75 Years and over | 0 (0.0%) | 18 (9.0%) |
| Total | 60 (9.9%) | 49 (3.9%) |
Income Above Poverty by Sex and Age in Great Barrington
According to the poverty statistics in Great Barrington, males aged 5 years and females aged under 5 years are the age groups that are most secure financially, with 100.0% of males and 100.0% of females in these age groups living above the poverty line.
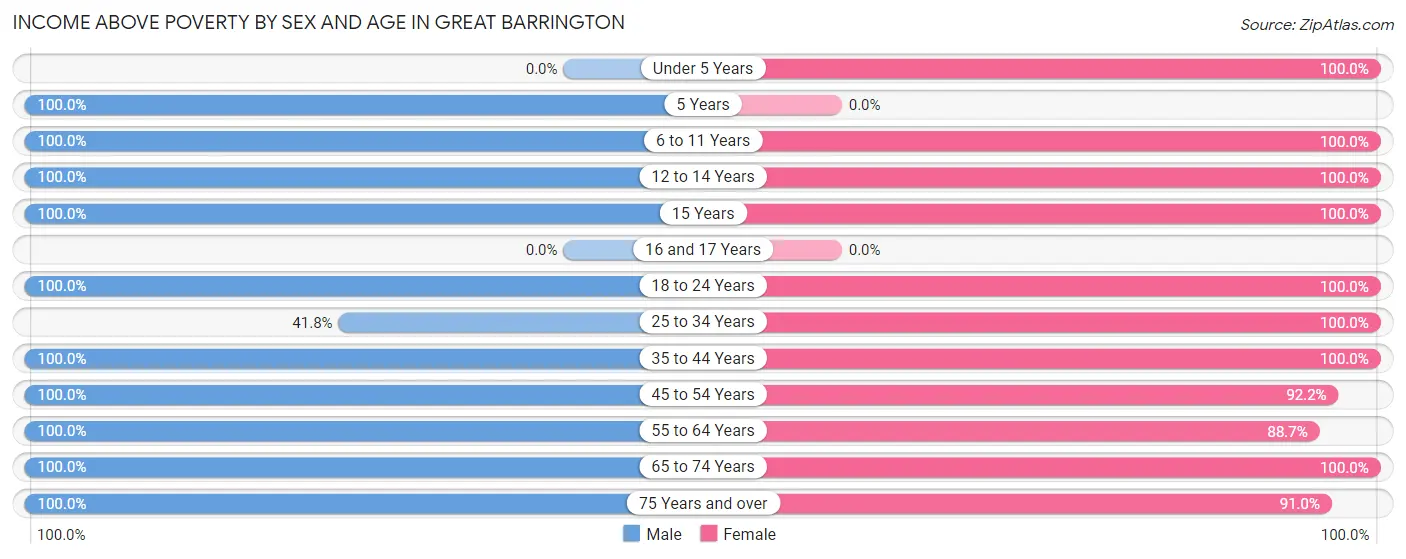
| Age Bracket | Male | Female |
| Under 5 Years | 0 (0.0%) | 113 (100.0%) |
| 5 Years | 18 (100.0%) | 0 (0.0%) |
| 6 to 11 Years | 13 (100.0%) | 34 (100.0%) |
| 12 to 14 Years | 72 (100.0%) | 17 (100.0%) |
| 15 Years | 3 (100.0%) | 44 (100.0%) |
| 16 and 17 Years | 0 (0.0%) | 0 (0.0%) |
| 18 to 24 Years | 43 (100.0%) | 154 (100.0%) |
| 25 to 34 Years | 43 (41.7%) | 98 (100.0%) |
| 35 to 44 Years | 59 (100.0%) | 41 (100.0%) |
| 45 to 54 Years | 102 (100.0%) | 165 (92.2%) |
| 55 to 64 Years | 90 (100.0%) | 133 (88.7%) |
| 65 to 74 Years | 50 (100.0%) | 235 (100.0%) |
| 75 Years and over | 52 (100.0%) | 181 (90.9%) |
| Total | 545 (90.1%) | 1,215 (96.1%) |
Income Below Poverty Among Married-Couple Families in Great Barrington
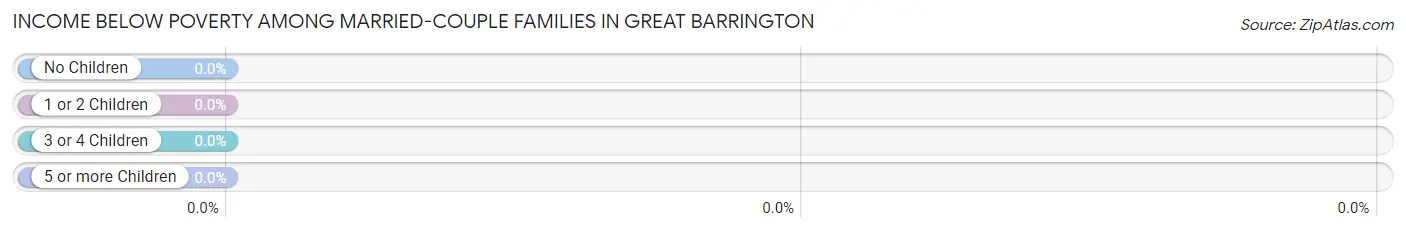
| Children | Above Poverty | Below Poverty |
| No Children | 199 (100.0%) | 0 (0.0%) |
| 1 or 2 Children | 97 (100.0%) | 0 (0.0%) |
| 3 or 4 Children | 0 (0.0%) | 0 (0.0%) |
| 5 or more Children | 0 (0.0%) | 0 (0.0%) |
| Total | 296 (100.0%) | 0 (0.0%) |
Income Below Poverty Among Single-Parent Households in Great Barrington
| Children | Single Father | Single Mother |
| No Children | 0 (0.0%) | 0 (0.0%) |
| 1 or 2 Children | 0 (0.0%) | 0 (0.0%) |
| 3 or 4 Children | 0 (0.0%) | 0 (0.0%) |
| 5 or more Children | 0 (0.0%) | 0 (0.0%) |
| Total | 0 (0.0%) | 0 (0.0%) |
Income Below Poverty Among Married-Couple vs Single-Parent Households in Great Barrington
| Children | Married-Couple Families | Single-Parent Households |
| No Children | 0 (0.0%) | 0 (0.0%) |
| 1 or 2 Children | 0 (0.0%) | 0 (0.0%) |
| 3 or 4 Children | 0 (0.0%) | 0 (0.0%) |
| 5 or more Children | 0 (0.0%) | 0 (0.0%) |
| Total | 0 (0.0%) | 0 (0.0%) |
Race in Great Barrington
The most populous races in Great Barrington are White / Caucasian (1,748 | 92.5%), Hispanic or Latino (108 | 5.7%), and Two or more Races (89 | 4.7%).
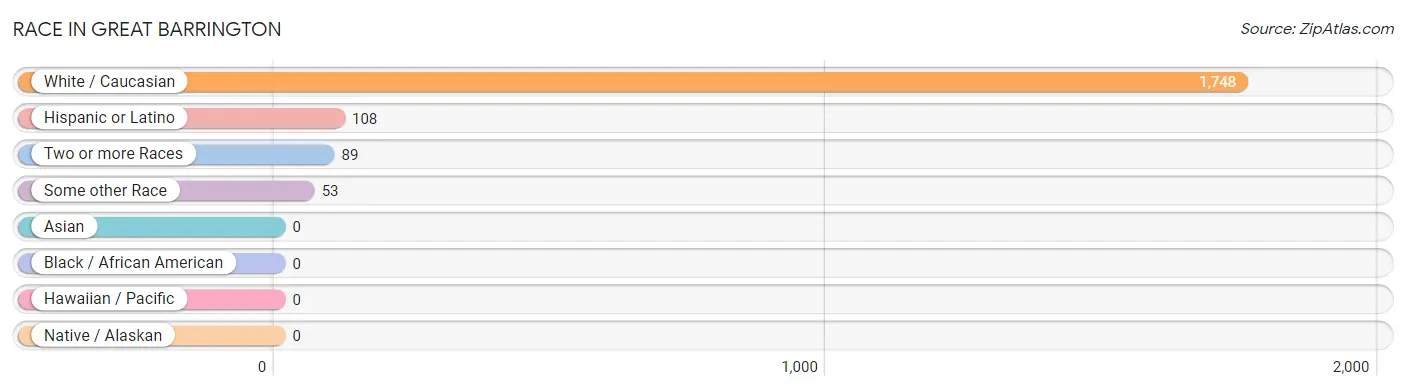
| Race | # Population | % Population |
| Asian | 0 | 0.0% |
| Black / African American | 0 | 0.0% |
| Hawaiian / Pacific | 0 | 0.0% |
| Hispanic or Latino | 108 | 5.7% |
| Native / Alaskan | 0 | 0.0% |
| White / Caucasian | 1,748 | 92.5% |
| Two or more Races | 89 | 4.7% |
| Some other Race | 53 | 2.8% |
| Total | 1,890 | 100.0% |
Ancestry in Great Barrington
The most populous ancestries reported in Great Barrington are Irish (407 | 21.5%), Polish (348 | 18.4%), German (343 | 18.1%), Italian (239 | 12.7%), and English (201 | 10.6%), together accounting for 81.4% of all Great Barrington residents.
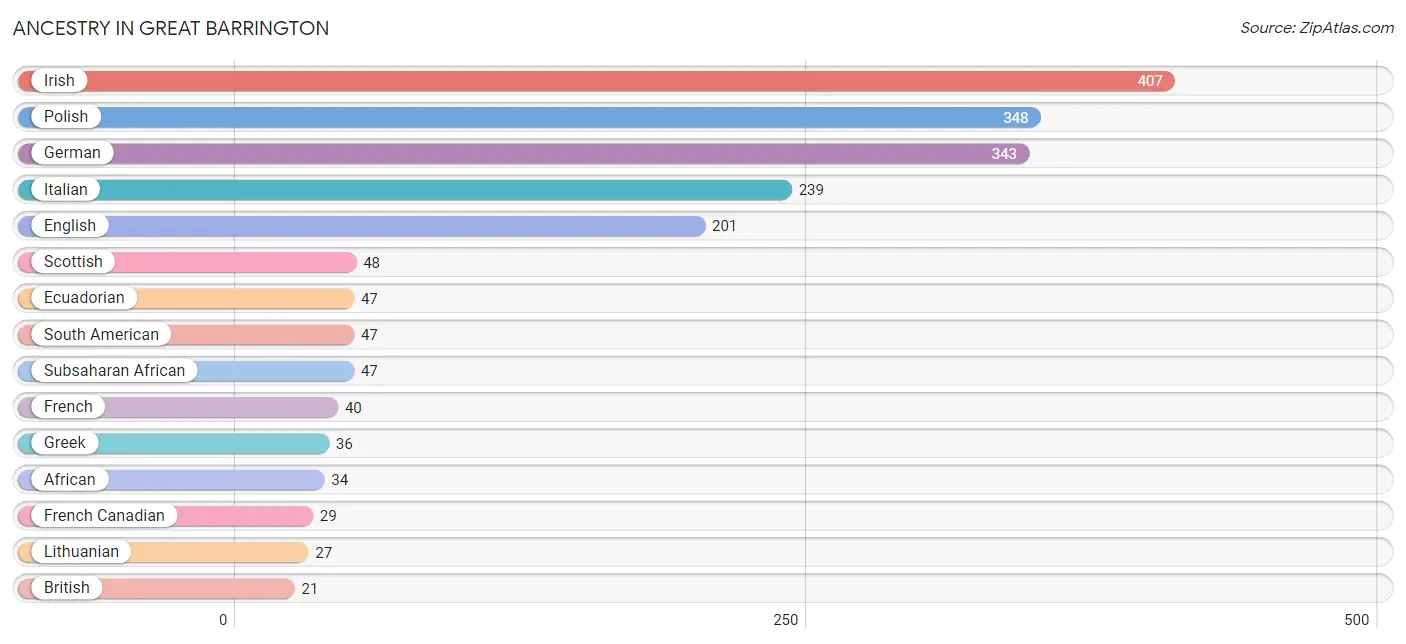
| Ancestry | # Population | % Population |
| African | 34 | 1.8% |
| British | 21 | 1.1% |
| Danish | 18 | 0.9% |
| Ecuadorian | 47 | 2.5% |
| English | 201 | 10.6% |
| European | 19 | 1.0% |
| French | 40 | 2.1% |
| French Canadian | 29 | 1.5% |
| German | 343 | 18.1% |
| Greek | 36 | 1.9% |
| Irish | 407 | 21.5% |
| Italian | 239 | 12.7% |
| Lithuanian | 27 | 1.4% |
| Mexican | 12 | 0.6% |
| Nigerian | 13 | 0.7% |
| Polish | 348 | 18.4% |
| Puerto Rican | 10 | 0.5% |
| Russian | 15 | 0.8% |
| Scandinavian | 17 | 0.9% |
| Scotch-Irish | 21 | 1.1% |
| Scottish | 48 | 2.5% |
| South American | 47 | 2.5% |
| Subsaharan African | 47 | 2.5% |
| Ukrainian | 21 | 1.1% | View All 24 Rows |
Immigrants in Great Barrington
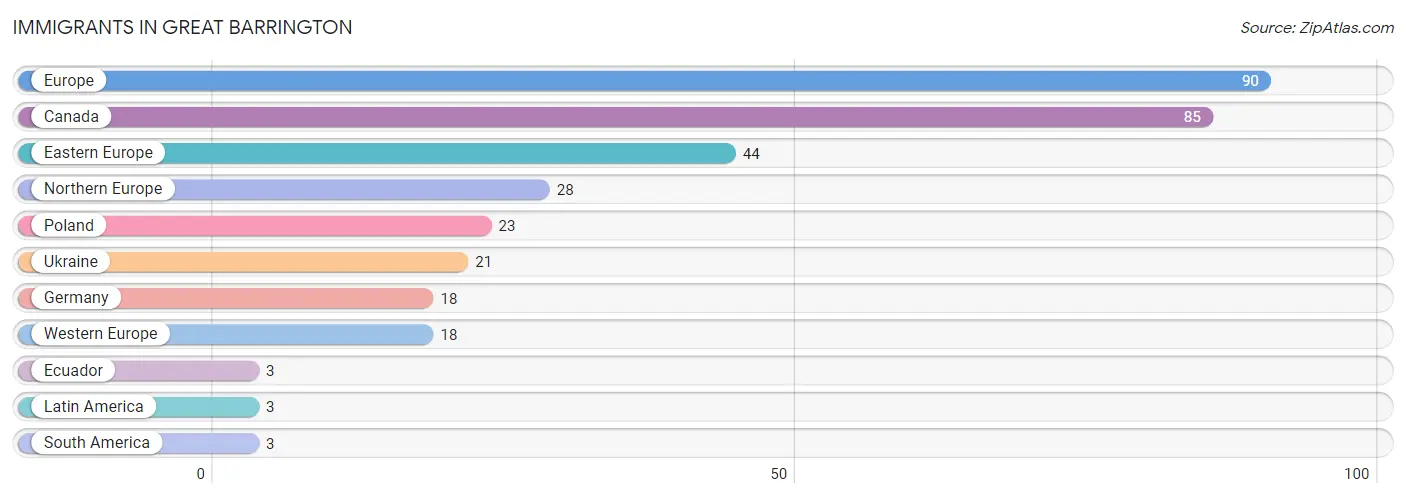
The most numerous immigrant groups reported in Great Barrington came from Europe (90 | 4.8%), Canada (85 | 4.5%), Eastern Europe (44 | 2.3%), Northern Europe (28 | 1.5%), and Poland (23 | 1.2%), together accounting for 14.3% of all Great Barrington residents.
| Immigration Origin | # Population | % Population |
| Canada | 85 | 4.5% |
| Eastern Europe | 44 | 2.3% |
| Ecuador | 3 | 0.2% |
| Europe | 90 | 4.8% |
| Germany | 18 | 0.9% |
| Latin America | 3 | 0.2% |
| Northern Europe | 28 | 1.5% |
| Poland | 23 | 1.2% |
| South America | 3 | 0.2% |
| Ukraine | 21 | 1.1% |
| Western Europe | 18 | 0.9% | View All 11 Rows |
Sex and Age in Great Barrington
Sex and Age in Great Barrington
The most populous age groups in Great Barrington are 25 to 29 Years (103 | 16.5%) for men and 65 to 69 Years (165 | 13.1%) for women.
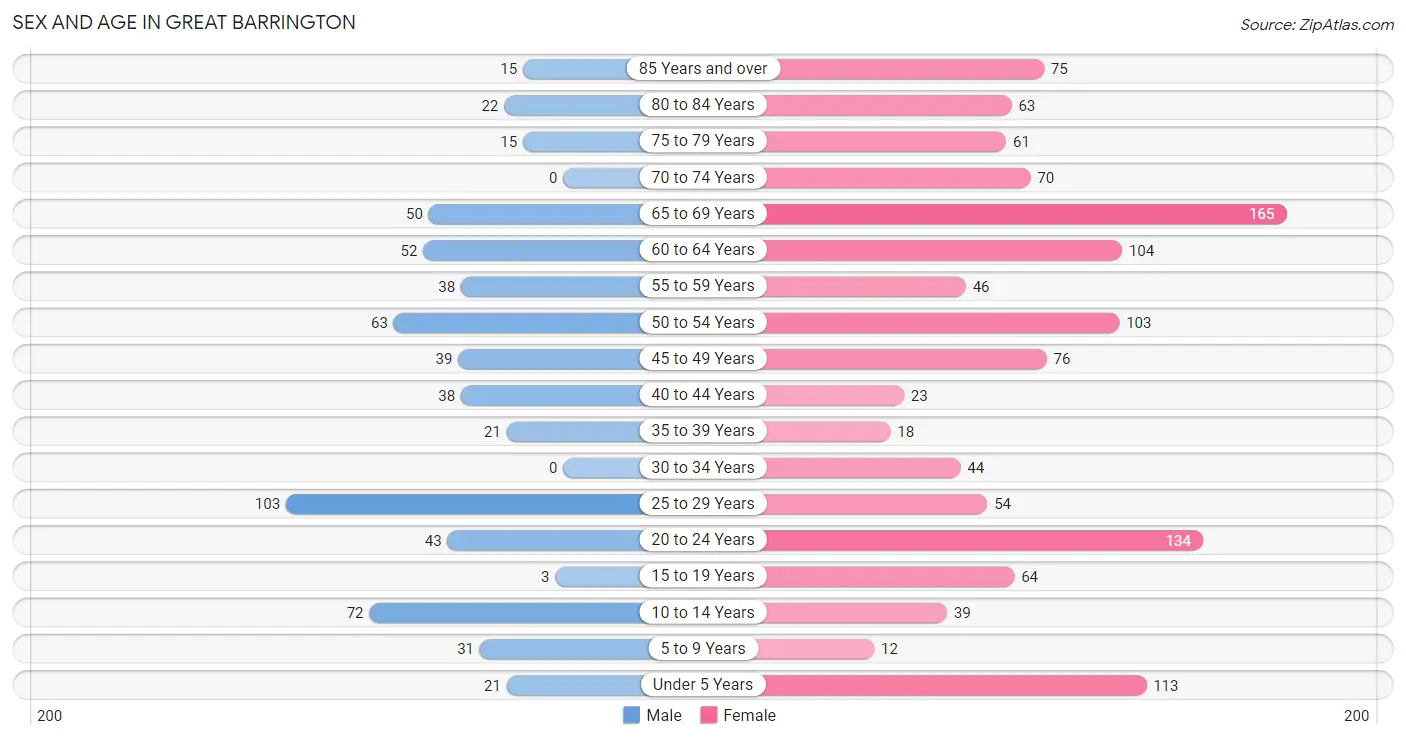
| Age Bracket | Male | Female |
| Under 5 Years | 21 (3.4%) | 113 (8.9%) |
| 5 to 9 Years | 31 (5.0%) | 12 (0.9%) |
| 10 to 14 Years | 72 (11.5%) | 39 (3.1%) |
| 15 to 19 Years | 3 (0.5%) | 64 (5.1%) |
| 20 to 24 Years | 43 (6.9%) | 134 (10.6%) |
| 25 to 29 Years | 103 (16.5%) | 54 (4.3%) |
| 30 to 34 Years | 0 (0.0%) | 44 (3.5%) |
| 35 to 39 Years | 21 (3.4%) | 18 (1.4%) |
| 40 to 44 Years | 38 (6.1%) | 23 (1.8%) |
| 45 to 49 Years | 39 (6.2%) | 76 (6.0%) |
| 50 to 54 Years | 63 (10.1%) | 103 (8.2%) |
| 55 to 59 Years | 38 (6.1%) | 46 (3.6%) |
| 60 to 64 Years | 52 (8.3%) | 104 (8.2%) |
| 65 to 69 Years | 50 (8.0%) | 165 (13.1%) |
| 70 to 74 Years | 0 (0.0%) | 70 (5.5%) |
| 75 to 79 Years | 15 (2.4%) | 61 (4.8%) |
| 80 to 84 Years | 22 (3.5%) | 63 (5.0%) |
| 85 Years and over | 15 (2.4%) | 75 (5.9%) |
| Total | 626 (100.0%) | 1,264 (100.0%) |
Families and Households in Great Barrington
Median Family Size in Great Barrington
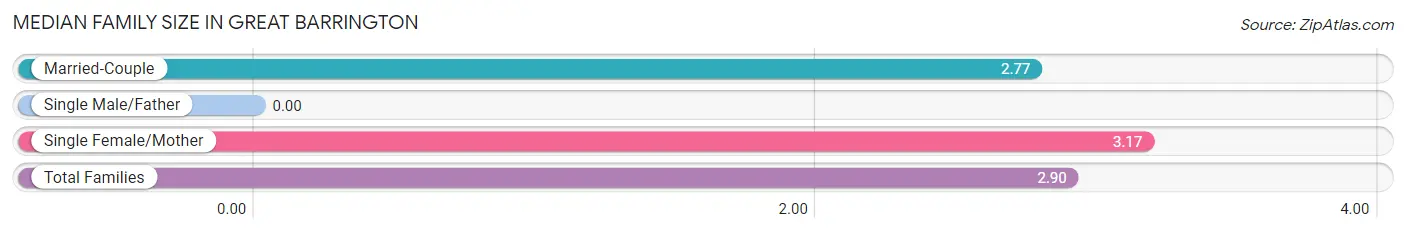
| Family Type | # Families | Family Size |
| Married-Couple | 296 (68.8%) | 2.77 |
| Single Male/Father | 0 (0.0%) | - |
| Single Female/Mother | 134 (31.2%) | 3.17 |
| Total Families | 430 (100.0%) | 2.90 |
Median Household Size in Great Barrington
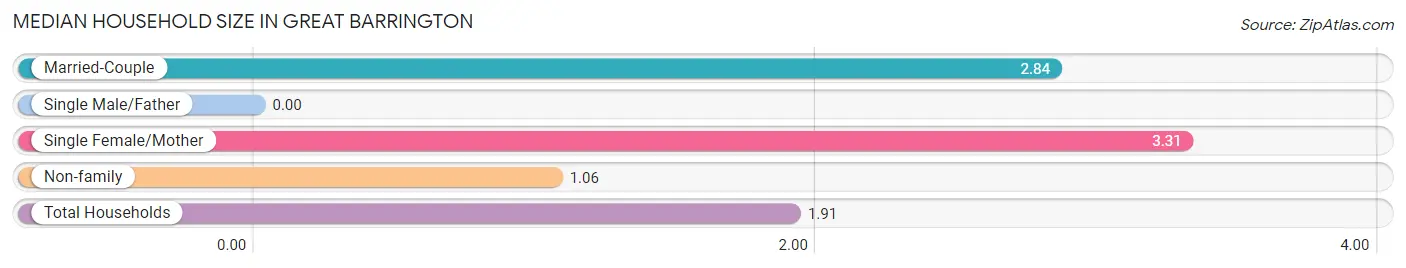
| Household Type | # Households | Household Size |
| Married-Couple | 296 (30.5%) | 2.84 |
| Single Male/Father | 0 (0.0%) | - |
| Single Female/Mother | 134 (13.8%) | 3.31 |
| Non-family | 540 (55.7%) | 1.06 |
| Total Households | 970 (100.0%) | 1.91 |
Household Size by Marriage Status in Great Barrington
Out of a total of 970 households in Great Barrington, 430 (44.3%) are family households, while 540 (55.7%) are nonfamily households. The most numerous type of family households are 2-person households, comprising 223, and the most common type of nonfamily households are 1-person households, comprising 503.
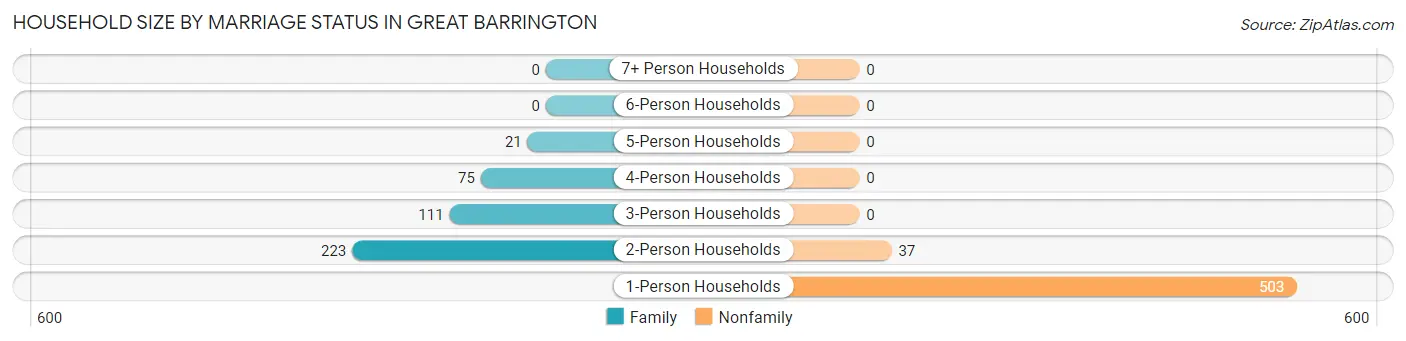
| Household Size | Family Households | Nonfamily Households |
| 1-Person Households | - | 503 (51.9%) |
| 2-Person Households | 223 (23.0%) | 37 (3.8%) |
| 3-Person Households | 111 (11.4%) | 0 (0.0%) |
| 4-Person Households | 75 (7.7%) | 0 (0.0%) |
| 5-Person Households | 21 (2.2%) | 0 (0.0%) |
| 6-Person Households | 0 (0.0%) | 0 (0.0%) |
| 7+ Person Households | 0 (0.0%) | 0 (0.0%) |
| Total | 430 (44.3%) | 540 (55.7%) |
Female Fertility in Great Barrington
Fertility by Age in Great Barrington
| Age Bracket | Women with Births | Births / 1,000 Women |
| 15 to 19 years | 0 (0.0%) | 0.0 |
| 20 to 34 years | 0 (0.0%) | 0.0 |
| 35 to 50 years | 0 (0.0%) | 0.0 |
| Total | 0 (0.0%) | 0.0 |
Fertility by Age by Marriage Status in Great Barrington
| Age Bracket | Married | Unmarried |
| 15 to 19 years | 0 (0.0%) | 0 (0.0%) |
| 20 to 34 years | 0 (0.0%) | 0 (0.0%) |
| 35 to 50 years | 0 (0.0%) | 0 (0.0%) |
| Total | 0 (0.0%) | 0 (0.0%) |
Fertility by Education in Great Barrington
| Educational Attainment | Women with Births | Births / 1,000 Women |
| Less than High School | 0 (0.0%) | 0.0 |
| High School Diploma | 0 (0.0%) | 0.0 |
| College or Associate's Degree | 0 (0.0%) | 0.0 |
| Bachelor's Degree | 0 (0.0%) | 0.0 |
| Graduate Degree | 0 (0.0%) | 0.0 |
| Total | 0 (0.0%) | 0.0 |
Fertility by Education by Marriage Status in Great Barrington
| Educational Attainment | Married | Unmarried |
| Less than High School | 0 (0.0%) | 0 (0.0%) |
| High School Diploma | 0 (0.0%) | 0 (0.0%) |
| College or Associate's Degree | 0 (0.0%) | 0 (0.0%) |
| Bachelor's Degree | 0 (0.0%) | 0 (0.0%) |
| Graduate Degree | 0 (0.0%) | 0 (0.0%) |
| Total | 0 (0.0%) | 0 (0.0%) |
Employment Characteristics in Great Barrington
Employment by Class of Employer in Great Barrington
Among the 881 employed individuals in Great Barrington, private company employees (494 | 56.1%), not-for-profit organizations (137 | 15.5%), and local government employees (97 | 11.0%) make up the most common classes of employment.
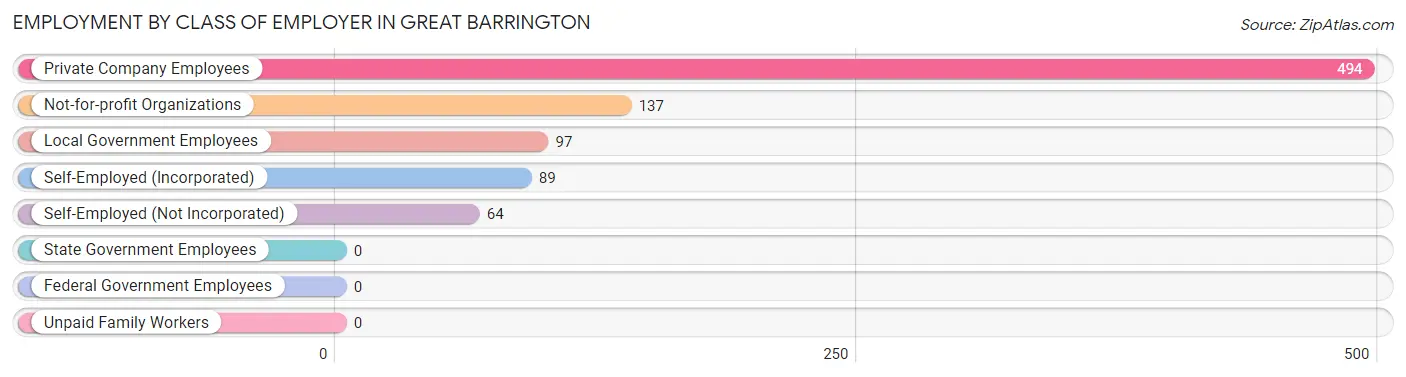
| Employer Class | # Employees | % Employees |
| Private Company Employees | 494 | 56.1% |
| Self-Employed (Incorporated) | 89 | 10.1% |
| Self-Employed (Not Incorporated) | 64 | 7.3% |
| Not-for-profit Organizations | 137 | 15.5% |
| Local Government Employees | 97 | 11.0% |
| State Government Employees | 0 | 0.0% |
| Federal Government Employees | 0 | 0.0% |
| Unpaid Family Workers | 0 | 0.0% |
| Total | 881 | 100.0% |
Employment Status by Age in Great Barrington
According to the labor force statistics for Great Barrington, out of the total population over 16 years of age (1,555), 63.9% or 994 individuals are in the labor force, with 3.4% or 34 of them unemployed. The age group with the highest labor force participation rate is 16 to 19 years, with 100.0% or 20 individuals in the labor force. Within the labor force, the 20 to 24 years age range has the highest percentage of unemployed individuals, with 14.0% or 18 of them being unemployed.
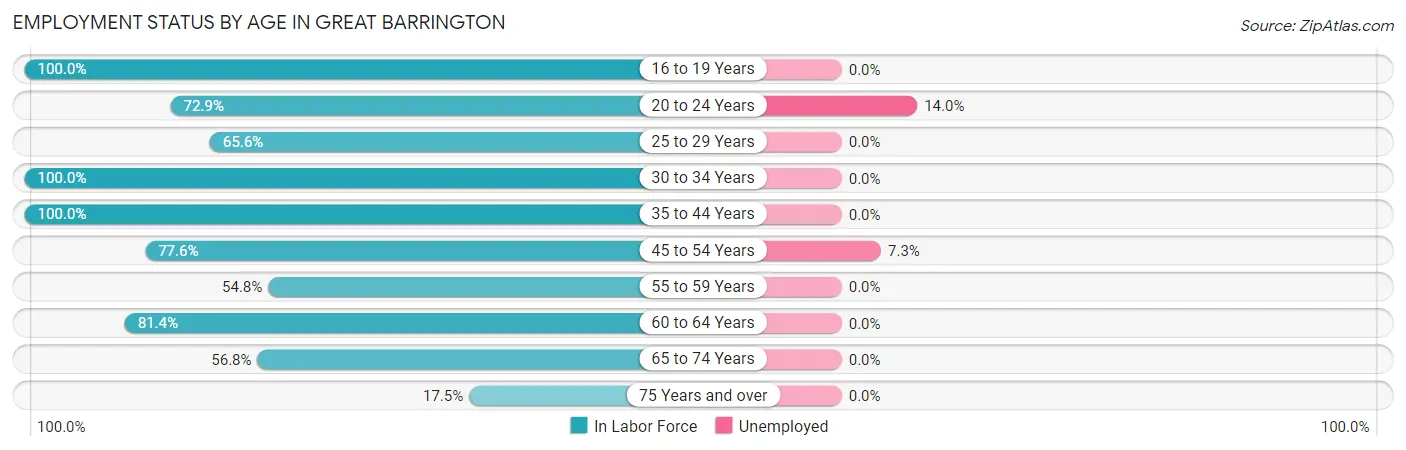
| Age Bracket | In Labor Force | Unemployed |
| 16 to 19 Years | 20 (100.0%) | 0 (0.0%) |
| 20 to 24 Years | 129 (72.9%) | 18 (14.0%) |
| 25 to 29 Years | 103 (65.6%) | 0 (0.0%) |
| 30 to 34 Years | 44 (100.0%) | 0 (0.0%) |
| 35 to 44 Years | 100 (100.0%) | 0 (0.0%) |
| 45 to 54 Years | 218 (77.6%) | 16 (7.3%) |
| 55 to 59 Years | 46 (54.8%) | 0 (0.0%) |
| 60 to 64 Years | 127 (81.4%) | 0 (0.0%) |
| 65 to 74 Years | 162 (56.8%) | 0 (0.0%) |
| 75 Years and over | 44 (17.5%) | 0 (0.0%) |
| Total | 994 (63.9%) | 34 (3.4%) |
Employment Status by Educational Attainment in Great Barrington
According to labor force statistics for Great Barrington, 77.6% of individuals (638) out of the total population between 25 and 64 years of age (822) are in the labor force, with 2.5% or 16 of them being unemployed. The group with the highest labor force participation rate are those with the educational attainment of bachelor's degree or higher, with 92.1% or 396 individuals in the labor force. Within the labor force, individuals with high school diploma education have the highest percentage of unemployment, with 14.3% or 16 of them being unemployed.
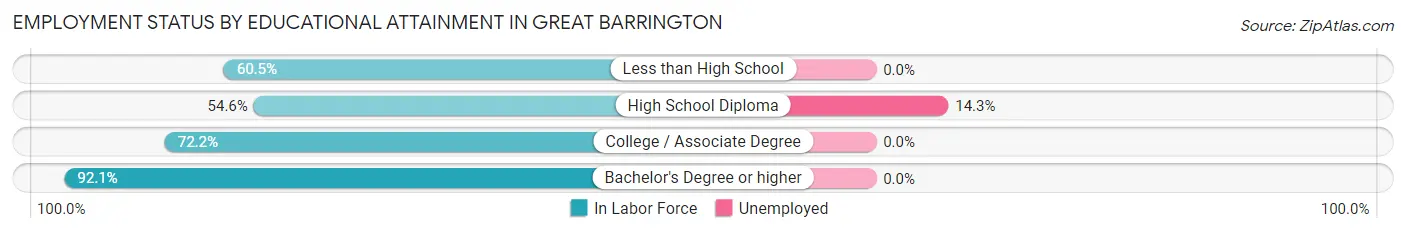
| Educational Attainment | In Labor Force | Unemployed |
| Less than High School | 26 (60.5%) | 0 (0.0%) |
| High School Diploma | 112 (54.6%) | 29 (14.3%) |
| College / Associate Degree | 104 (72.2%) | 0 (0.0%) |
| Bachelor's Degree or higher | 396 (92.1%) | 0 (0.0%) |
| Total | 638 (77.6%) | 21 (2.5%) |
Employment Occupations by Sex in Great Barrington
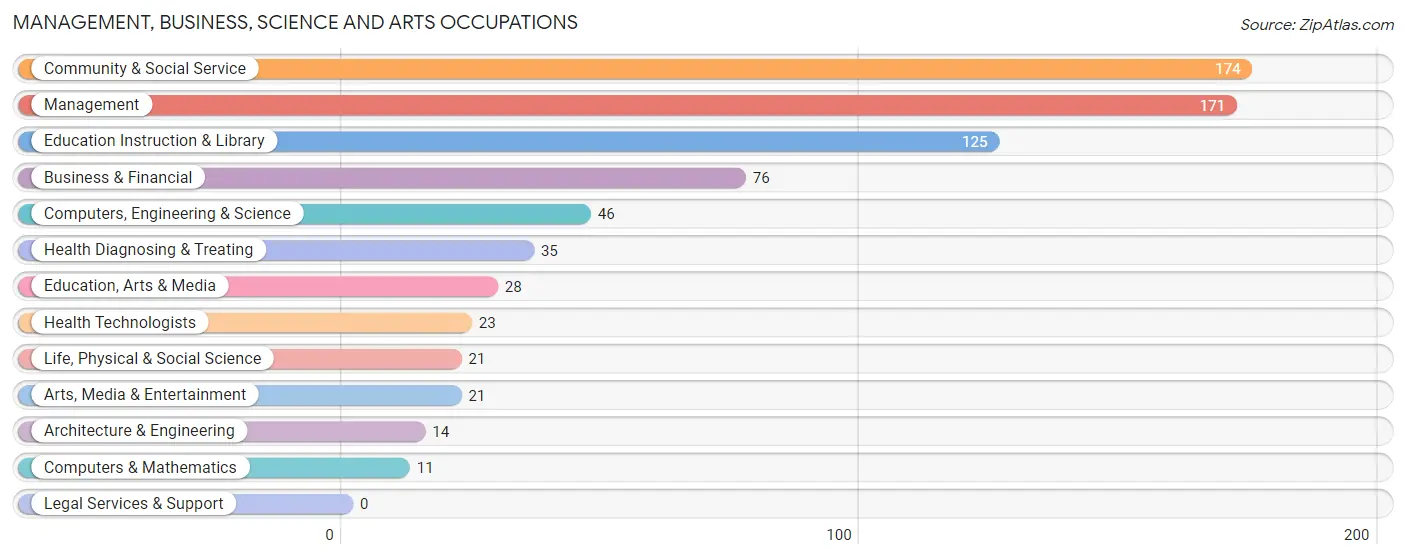
Management, Business, Science and Arts Occupations
The most common Management, Business, Science and Arts occupations in Great Barrington are Community & Social Service (174 | 18.1%), Management (171 | 17.8%), Education Instruction & Library (125 | 13.0%), Business & Financial (76 | 7.9%), and Computers, Engineering & Science (46 | 4.8%).
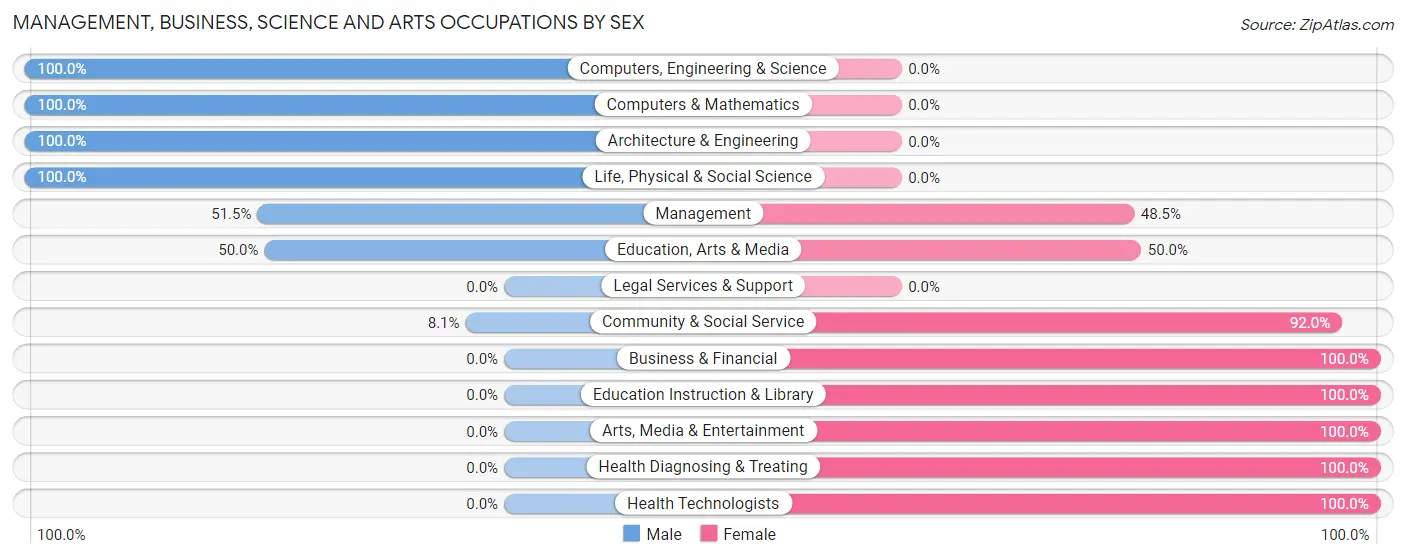
Management, Business, Science and Arts Occupations by Sex
Within the Management, Business, Science and Arts occupations in Great Barrington, the most male-oriented occupations are Computers, Engineering & Science (100.0%), Computers & Mathematics (100.0%), and Architecture & Engineering (100.0%), while the most female-oriented occupations are Business & Financial (100.0%), Education Instruction & Library (100.0%), and Arts, Media & Entertainment (100.0%).
| Occupation | Male | Female |
| Management | 88 (51.5%) | 83 (48.5%) |
| Business & Financial | 0 (0.0%) | 76 (100.0%) |
| Computers, Engineering & Science | 46 (100.0%) | 0 (0.0%) |
| Computers & Mathematics | 11 (100.0%) | 0 (0.0%) |
| Architecture & Engineering | 14 (100.0%) | 0 (0.0%) |
| Life, Physical & Social Science | 21 (100.0%) | 0 (0.0%) |
| Community & Social Service | 14 (8.1%) | 160 (91.9%) |
| Education, Arts & Media | 14 (50.0%) | 14 (50.0%) |
| Legal Services & Support | 0 (0.0%) | 0 (0.0%) |
| Education Instruction & Library | 0 (0.0%) | 125 (100.0%) |
| Arts, Media & Entertainment | 0 (0.0%) | 21 (100.0%) |
| Health Diagnosing & Treating | 0 (0.0%) | 35 (100.0%) |
| Health Technologists | 0 (0.0%) | 23 (100.0%) |
| Total (Category) | 148 (29.5%) | 354 (70.5%) |
| Total (Overall) | 362 (37.8%) | 597 (62.3%) |
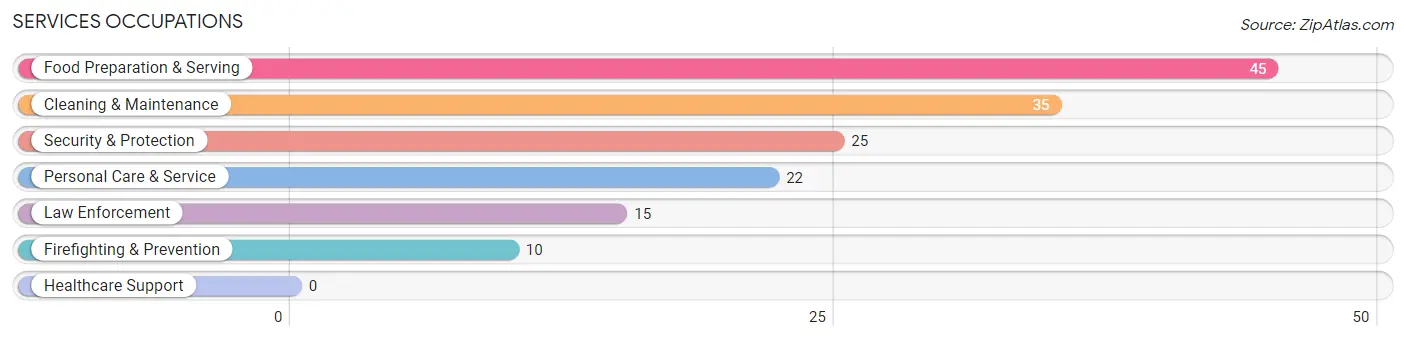
Services Occupations
The most common Services occupations in Great Barrington are Food Preparation & Serving (45 | 4.7%), Cleaning & Maintenance (35 | 3.6%), Security & Protection (25 | 2.6%), Personal Care & Service (22 | 2.3%), and Law Enforcement (15 | 1.6%).
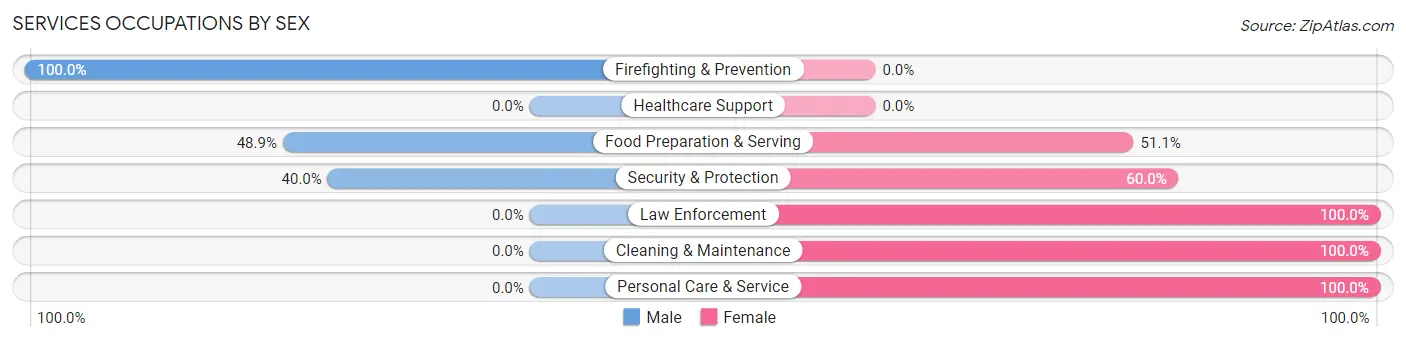
Services Occupations by Sex
Within the Services occupations in Great Barrington, the most male-oriented occupations are Firefighting & Prevention (100.0%), Food Preparation & Serving (48.9%), and Security & Protection (40.0%), while the most female-oriented occupations are Law Enforcement (100.0%), Cleaning & Maintenance (100.0%), and Personal Care & Service (100.0%).
| Occupation | Male | Female |
| Healthcare Support | 0 (0.0%) | 0 (0.0%) |
| Security & Protection | 10 (40.0%) | 15 (60.0%) |
| Firefighting & Prevention | 10 (100.0%) | 0 (0.0%) |
| Law Enforcement | 0 (0.0%) | 15 (100.0%) |
| Food Preparation & Serving | 22 (48.9%) | 23 (51.1%) |
| Cleaning & Maintenance | 0 (0.0%) | 35 (100.0%) |
| Personal Care & Service | 0 (0.0%) | 22 (100.0%) |
| Total (Category) | 32 (25.2%) | 95 (74.8%) |
| Total (Overall) | 362 (37.8%) | 597 (62.3%) |
Sales and Office Occupations
The most common Sales and Office occupations in Great Barrington are Sales & Related (109 | 11.4%), and Office & Administration (57 | 5.9%).
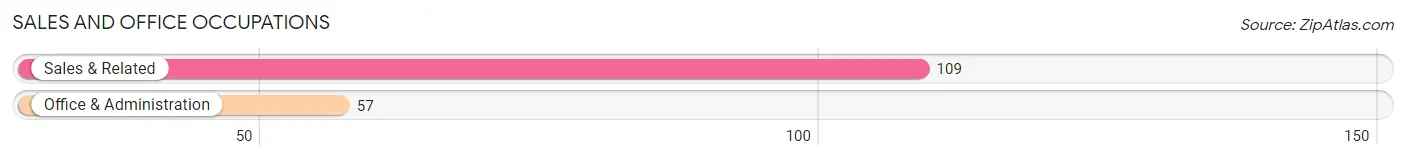
Sales and Office Occupations by Sex
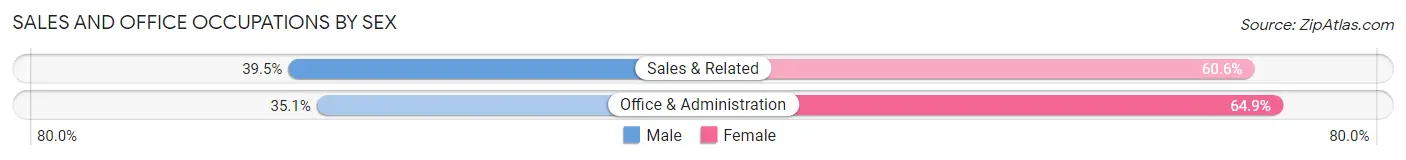
| Occupation | Male | Female |
| Sales & Related | 43 (39.5%) | 66 (60.6%) |
| Office & Administration | 20 (35.1%) | 37 (64.9%) |
| Total (Category) | 63 (38.0%) | 103 (62.1%) |
| Total (Overall) | 362 (37.8%) | 597 (62.3%) |
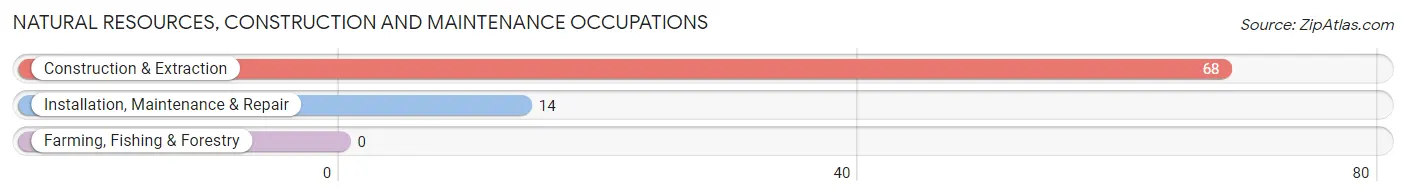
Natural Resources, Construction and Maintenance Occupations
The most common Natural Resources, Construction and Maintenance occupations in Great Barrington are Construction & Extraction (68 | 7.1%), and Installation, Maintenance & Repair (14 | 1.5%).
Natural Resources, Construction and Maintenance Occupations by Sex
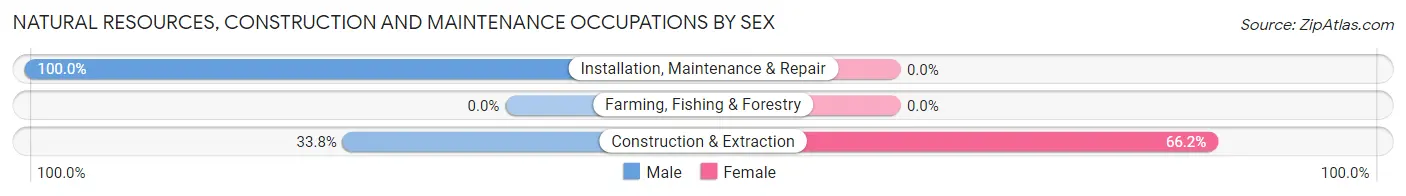
| Occupation | Male | Female |
| Farming, Fishing & Forestry | 0 (0.0%) | 0 (0.0%) |
| Construction & Extraction | 23 (33.8%) | 45 (66.2%) |
| Installation, Maintenance & Repair | 14 (100.0%) | 0 (0.0%) |
| Total (Category) | 37 (45.1%) | 45 (54.9%) |
| Total (Overall) | 362 (37.8%) | 597 (62.3%) |
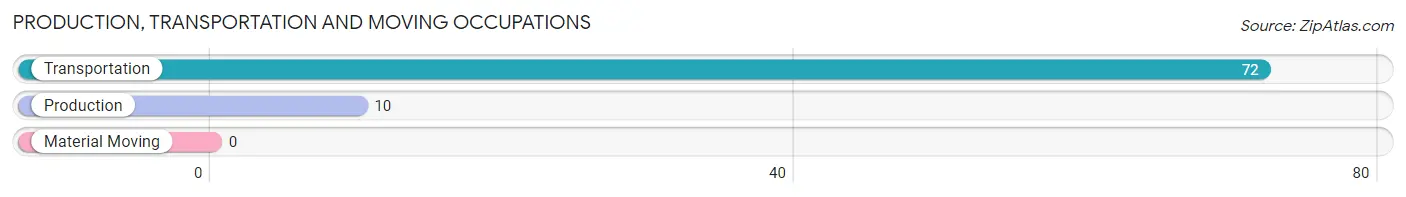
Production, Transportation and Moving Occupations
The most common Production, Transportation and Moving occupations in Great Barrington are Transportation (72 | 7.5%), and Production (10 | 1.0%).
Production, Transportation and Moving Occupations by Sex
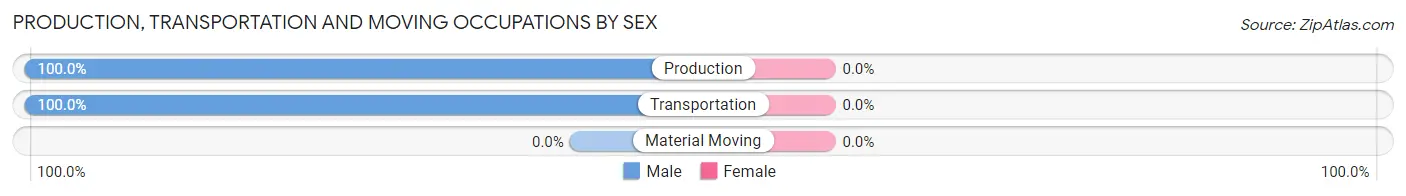
| Occupation | Male | Female |
| Production | 10 (100.0%) | 0 (0.0%) |
| Transportation | 72 (100.0%) | 0 (0.0%) |
| Material Moving | 0 (0.0%) | 0 (0.0%) |
| Total (Category) | 82 (100.0%) | 0 (0.0%) |
| Total (Overall) | 362 (37.8%) | 597 (62.3%) |
Employment Industries by Sex in Great Barrington
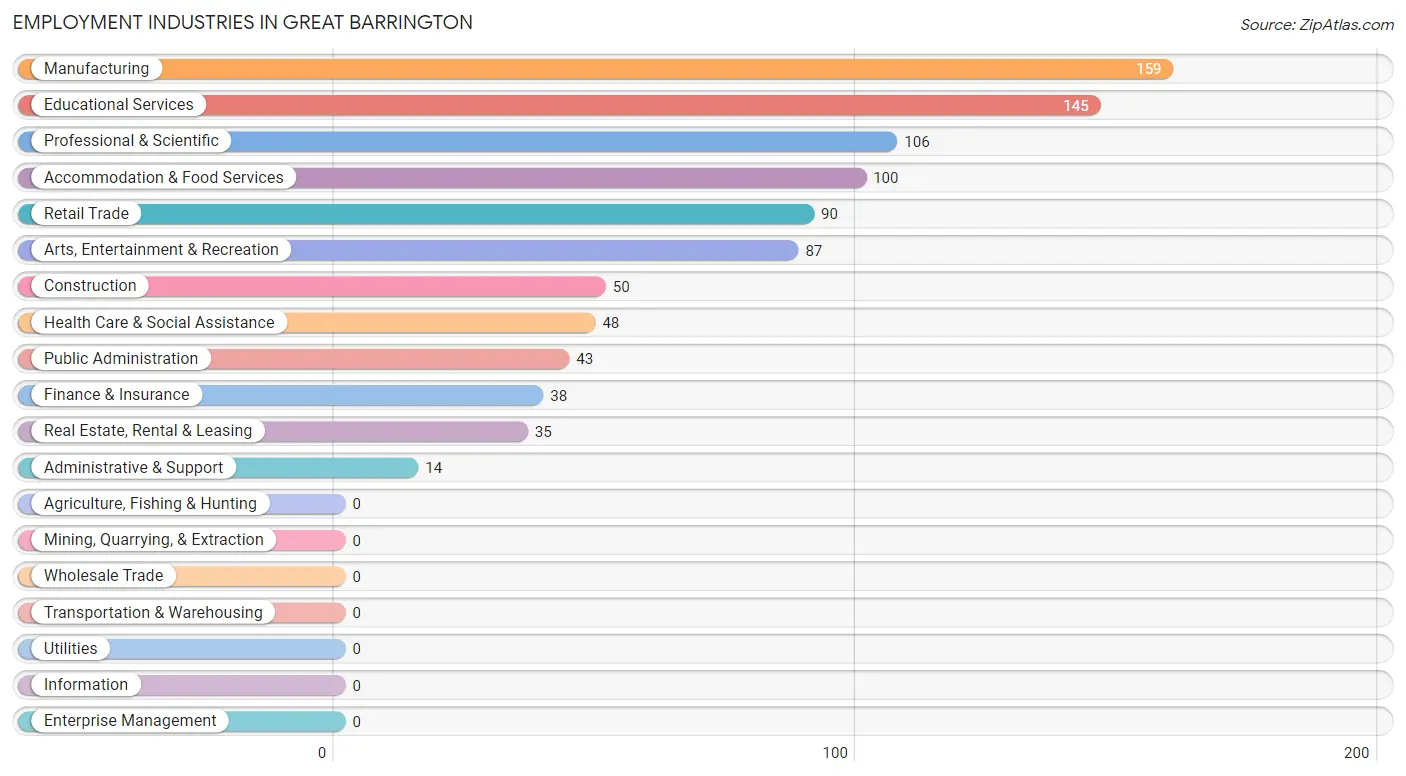
Employment Industries in Great Barrington
The major employment industries in Great Barrington include Manufacturing (159 | 16.6%), Educational Services (145 | 15.1%), Professional & Scientific (106 | 11.1%), Accommodation & Food Services (100 | 10.4%), and Retail Trade (90 | 9.4%).
Employment Industries by Sex in Great Barrington
The Great Barrington industries that see more men than women are Arts, Entertainment & Recreation (80.5%), Construction (74.0%), and Public Administration (65.1%), whereas the industries that tend to have a higher number of women are Finance & Insurance (100.0%), Administrative & Support (100.0%), and Health Care & Social Assistance (100.0%).
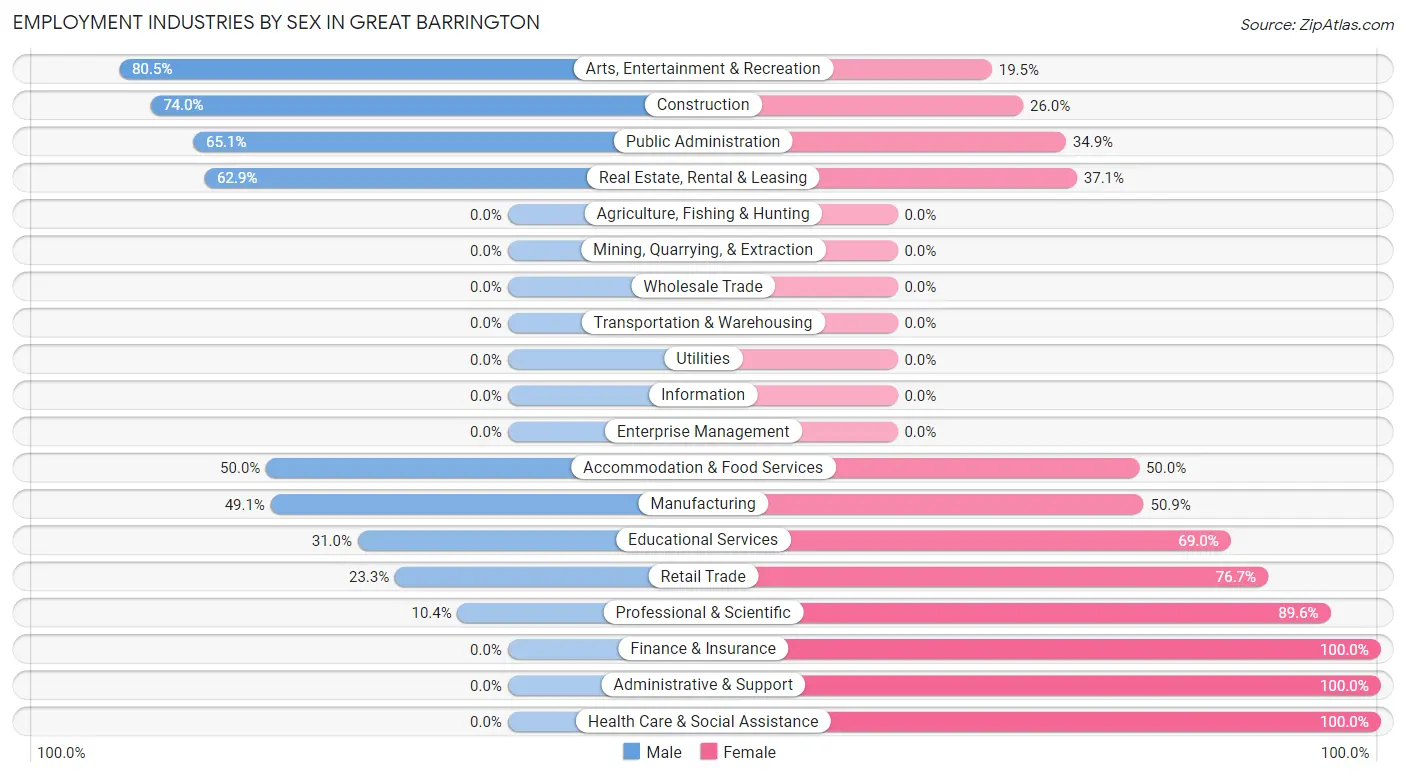
| Industry | Male | Female |
| Agriculture, Fishing & Hunting | 0 (0.0%) | 0 (0.0%) |
| Mining, Quarrying, & Extraction | 0 (0.0%) | 0 (0.0%) |
| Construction | 37 (74.0%) | 13 (26.0%) |
| Manufacturing | 78 (49.1%) | 81 (50.9%) |
| Wholesale Trade | 0 (0.0%) | 0 (0.0%) |
| Retail Trade | 21 (23.3%) | 69 (76.7%) |
| Transportation & Warehousing | 0 (0.0%) | 0 (0.0%) |
| Utilities | 0 (0.0%) | 0 (0.0%) |
| Information | 0 (0.0%) | 0 (0.0%) |
| Finance & Insurance | 0 (0.0%) | 38 (100.0%) |
| Real Estate, Rental & Leasing | 22 (62.9%) | 13 (37.1%) |
| Professional & Scientific | 11 (10.4%) | 95 (89.6%) |
| Enterprise Management | 0 (0.0%) | 0 (0.0%) |
| Administrative & Support | 0 (0.0%) | 14 (100.0%) |
| Educational Services | 45 (31.0%) | 100 (69.0%) |
| Health Care & Social Assistance | 0 (0.0%) | 48 (100.0%) |
| Arts, Entertainment & Recreation | 70 (80.5%) | 17 (19.5%) |
| Accommodation & Food Services | 50 (50.0%) | 50 (50.0%) |
| Public Administration | 28 (65.1%) | 15 (34.9%) |
| Total | 362 (37.8%) | 597 (62.3%) |
Education in Great Barrington
School Enrollment in Great Barrington
The most common levels of schooling among the 333 students in Great Barrington are middle school (111 | 33.3%), college / undergraduate (91 | 27.3%), and high school (67 | 20.1%).
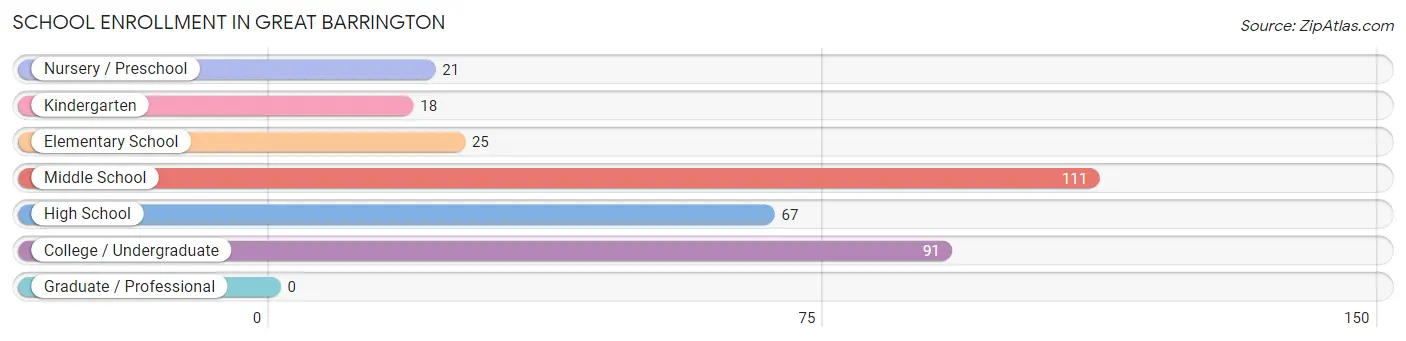
| School Level | # Students | % Students |
| Nursery / Preschool | 21 | 6.3% |
| Kindergarten | 18 | 5.4% |
| Elementary School | 25 | 7.5% |
| Middle School | 111 | 33.3% |
| High School | 67 | 20.1% |
| College / Undergraduate | 91 | 27.3% |
| Graduate / Professional | 0 | 0.0% |
| Total | 333 | 100.0% |
School Enrollment by Age by Funding Source in Great Barrington
Out of a total of 333 students who are enrolled in schools in Great Barrington, 34 (10.2%) attend a private institution, while the remaining 299 (89.8%) are enrolled in public schools. The age group of 5 to 9 year old has the highest likelihood of being enrolled in private schools, with 12 (27.9% in the age bracket) enrolled. Conversely, the age group of 3 to 4 year olds has the lowest likelihood of being enrolled in a private school, with 21 (100.0% in the age bracket) attending a public institution.
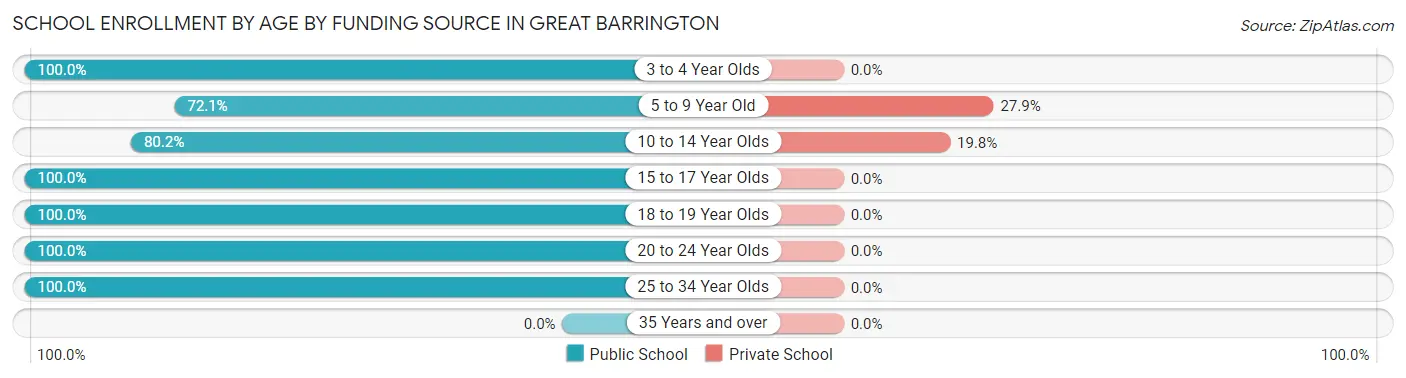
| Age Bracket | Public School | Private School |
| 3 to 4 Year Olds | 21 (100.0%) | 0 (0.0%) |
| 5 to 9 Year Old | 31 (72.1%) | 12 (27.9%) |
| 10 to 14 Year Olds | 89 (80.2%) | 22 (19.8%) |
| 15 to 17 Year Olds | 47 (100.0%) | 0 (0.0%) |
| 18 to 19 Year Olds | 20 (100.0%) | 0 (0.0%) |
| 20 to 24 Year Olds | 70 (100.0%) | 0 (0.0%) |
| 25 to 34 Year Olds | 21 (100.0%) | 0 (0.0%) |
| 35 Years and over | 0 (0.0%) | 0 (0.0%) |
| Total | 299 (89.8%) | 34 (10.2%) |
Educational Attainment by Field of Study in Great Barrington
Liberal arts & history (148 | 19.2%), education (103 | 13.4%), visual & performing arts (88 | 11.4%), physical & health sciences (80 | 10.4%), and social sciences (71 | 9.2%) are the most common fields of study among 770 individuals in Great Barrington who have obtained a bachelor's degree or higher.
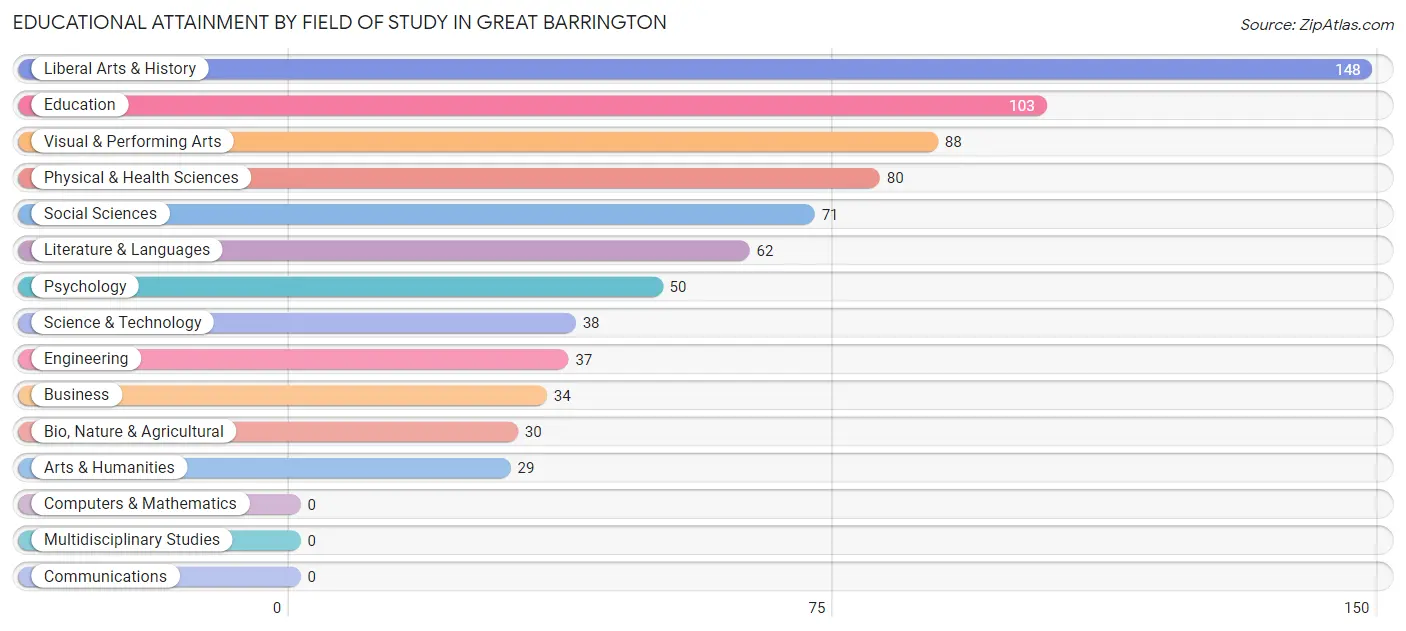
| Field of Study | # Graduates | % Graduates |
| Computers & Mathematics | 0 | 0.0% |
| Bio, Nature & Agricultural | 30 | 3.9% |
| Physical & Health Sciences | 80 | 10.4% |
| Psychology | 50 | 6.5% |
| Social Sciences | 71 | 9.2% |
| Engineering | 37 | 4.8% |
| Multidisciplinary Studies | 0 | 0.0% |
| Science & Technology | 38 | 4.9% |
| Business | 34 | 4.4% |
| Education | 103 | 13.4% |
| Literature & Languages | 62 | 8.1% |
| Liberal Arts & History | 148 | 19.2% |
| Visual & Performing Arts | 88 | 11.4% |
| Communications | 0 | 0.0% |
| Arts & Humanities | 29 | 3.8% |
| Total | 770 | 100.0% |
Transportation & Commute in Great Barrington
Vehicle Availability by Sex in Great Barrington
The most prevalent vehicle ownership categories in Great Barrington are males with 2 vehicles (231, accounting for 63.8%) and females with 2 vehicles (241, making up 44.5%).
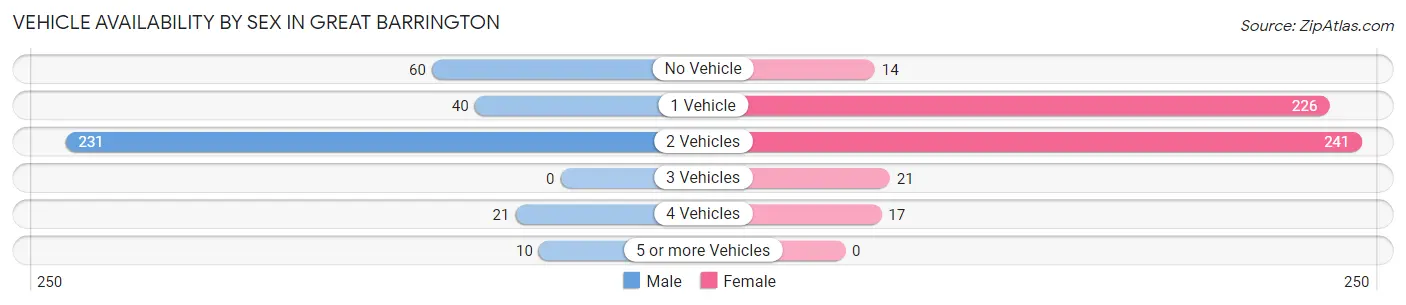
| Vehicles Available | Male | Female |
| No Vehicle | 60 (16.6%) | 14 (2.7%) |
| 1 Vehicle | 40 (11.1%) | 226 (43.5%) |
| 2 Vehicles | 231 (63.8%) | 241 (46.4%) |
| 3 Vehicles | 0 (0.0%) | 21 (4.1%) |
| 4 Vehicles | 21 (5.8%) | 17 (3.3%) |
| 5 or more Vehicles | 10 (2.8%) | 0 (0.0%) |
| Total | 362 (100.0%) | 519 (100.0%) |
Commute Time in Great Barrington
The most frequently occuring commute durations in Great Barrington are 5 to 9 minutes (275 commuters, 36.5%), 10 to 14 minutes (147 commuters, 19.5%), and 30 to 34 minutes (84 commuters, 11.1%).
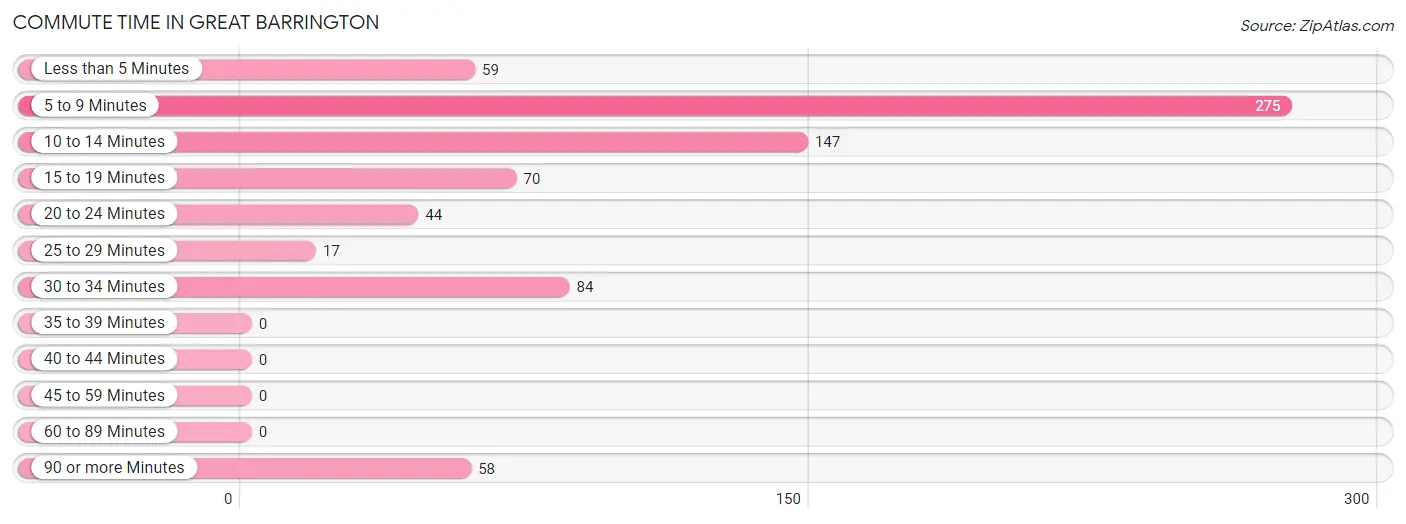
| Commute Time | # Commuters | % Commuters |
| Less than 5 Minutes | 59 | 7.8% |
| 5 to 9 Minutes | 275 | 36.5% |
| 10 to 14 Minutes | 147 | 19.5% |
| 15 to 19 Minutes | 70 | 9.3% |
| 20 to 24 Minutes | 44 | 5.8% |
| 25 to 29 Minutes | 17 | 2.2% |
| 30 to 34 Minutes | 84 | 11.1% |
| 35 to 39 Minutes | 0 | 0.0% |
| 40 to 44 Minutes | 0 | 0.0% |
| 45 to 59 Minutes | 0 | 0.0% |
| 60 to 89 Minutes | 0 | 0.0% |
| 90 or more Minutes | 58 | 7.7% |
Commute Time by Sex in Great Barrington
The most common commute times in Great Barrington are 15 to 19 minutes (70 commuters, 21.5%) for males and 5 to 9 minutes (222 commuters, 51.7%) for females.
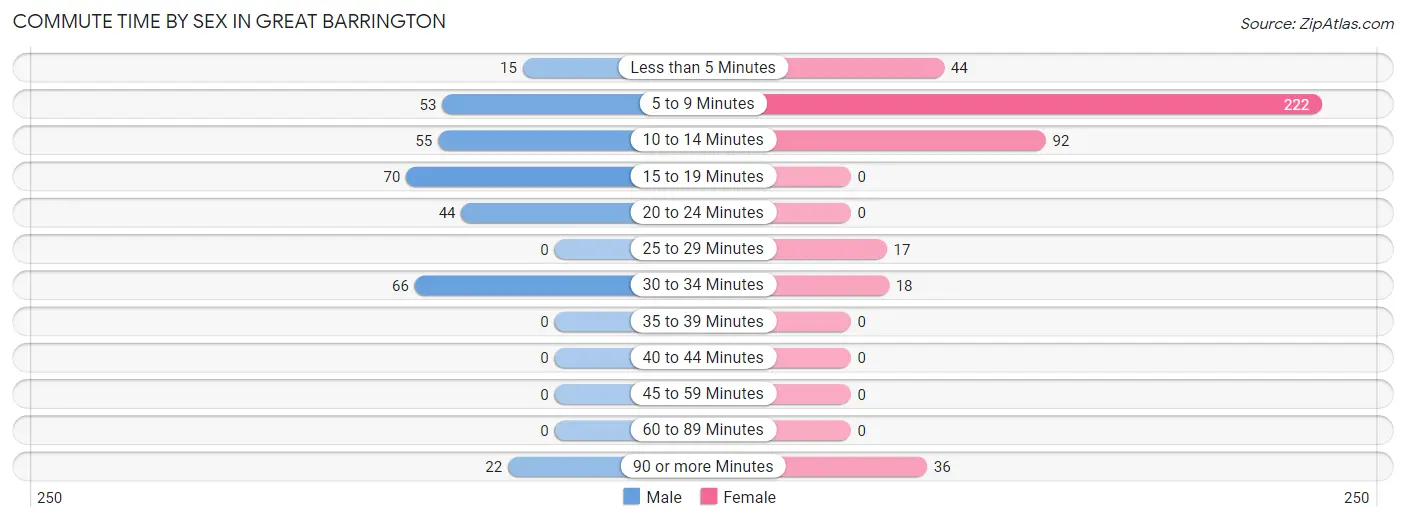
| Commute Time | Male | Female |
| Less than 5 Minutes | 15 (4.6%) | 44 (10.3%) |
| 5 to 9 Minutes | 53 (16.3%) | 222 (51.7%) |
| 10 to 14 Minutes | 55 (16.9%) | 92 (21.4%) |
| 15 to 19 Minutes | 70 (21.5%) | 0 (0.0%) |
| 20 to 24 Minutes | 44 (13.5%) | 0 (0.0%) |
| 25 to 29 Minutes | 0 (0.0%) | 17 (4.0%) |
| 30 to 34 Minutes | 66 (20.3%) | 18 (4.2%) |
| 35 to 39 Minutes | 0 (0.0%) | 0 (0.0%) |
| 40 to 44 Minutes | 0 (0.0%) | 0 (0.0%) |
| 45 to 59 Minutes | 0 (0.0%) | 0 (0.0%) |
| 60 to 89 Minutes | 0 (0.0%) | 0 (0.0%) |
| 90 or more Minutes | 22 (6.8%) | 36 (8.4%) |
Time of Departure to Work by Sex in Great Barrington
The most frequent times of departure to work in Great Barrington are 7:30 AM to 7:59 AM (114, 35.1%) for males and 9:00 AM to 9:59 AM (117, 27.3%) for females.
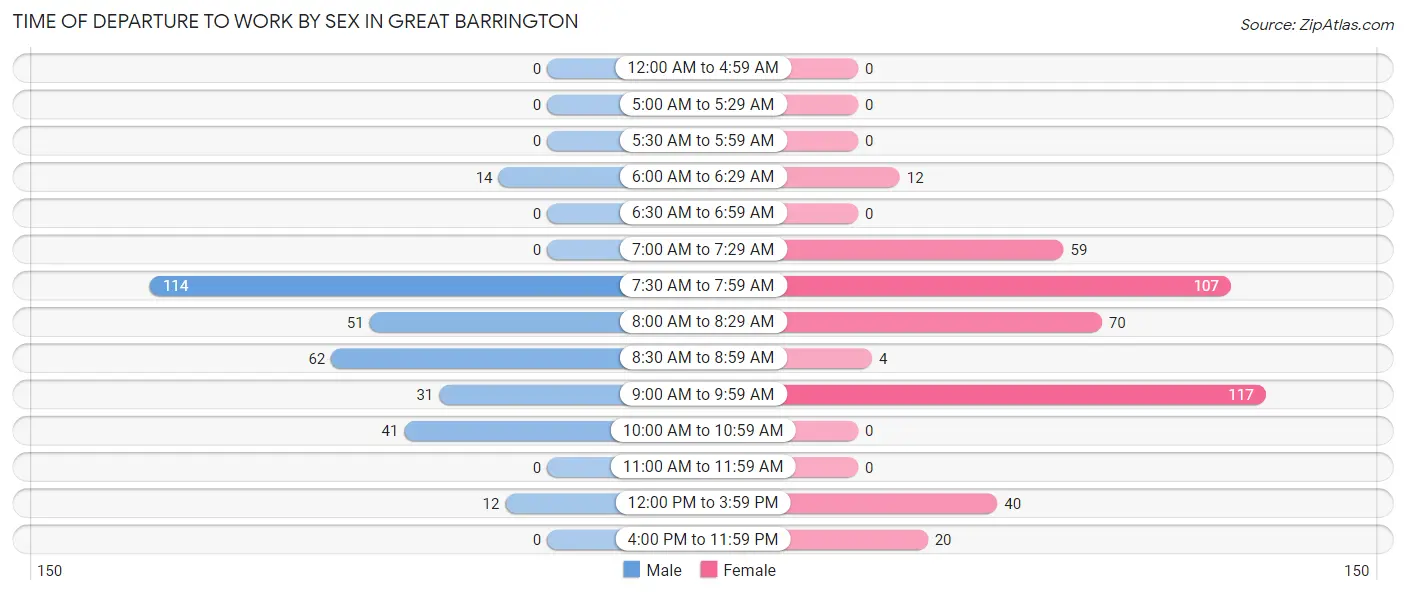
| Time of Departure | Male | Female |
| 12:00 AM to 4:59 AM | 0 (0.0%) | 0 (0.0%) |
| 5:00 AM to 5:29 AM | 0 (0.0%) | 0 (0.0%) |
| 5:30 AM to 5:59 AM | 0 (0.0%) | 0 (0.0%) |
| 6:00 AM to 6:29 AM | 14 (4.3%) | 12 (2.8%) |
| 6:30 AM to 6:59 AM | 0 (0.0%) | 0 (0.0%) |
| 7:00 AM to 7:29 AM | 0 (0.0%) | 59 (13.8%) |
| 7:30 AM to 7:59 AM | 114 (35.1%) | 107 (24.9%) |
| 8:00 AM to 8:29 AM | 51 (15.7%) | 70 (16.3%) |
| 8:30 AM to 8:59 AM | 62 (19.1%) | 4 (0.9%) |
| 9:00 AM to 9:59 AM | 31 (9.5%) | 117 (27.3%) |
| 10:00 AM to 10:59 AM | 41 (12.6%) | 0 (0.0%) |
| 11:00 AM to 11:59 AM | 0 (0.0%) | 0 (0.0%) |
| 12:00 PM to 3:59 PM | 12 (3.7%) | 40 (9.3%) |
| 4:00 PM to 11:59 PM | 0 (0.0%) | 20 (4.7%) |
| Total | 325 (100.0%) | 429 (100.0%) |
Housing Occupancy in Great Barrington
Occupancy by Ownership in Great Barrington
Of the total 970 dwellings in Great Barrington, owner-occupied units account for 533 (54.9%), while renter-occupied units make up 437 (45.1%).
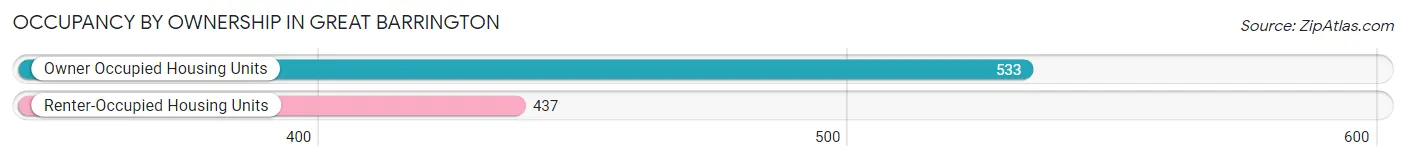
| Occupancy | # Housing Units | % Housing Units |
| Owner Occupied Housing Units | 533 | 54.9% |
| Renter-Occupied Housing Units | 437 | 45.1% |
| Total Occupied Housing Units | 970 | 100.0% |
Occupancy by Household Size in Great Barrington
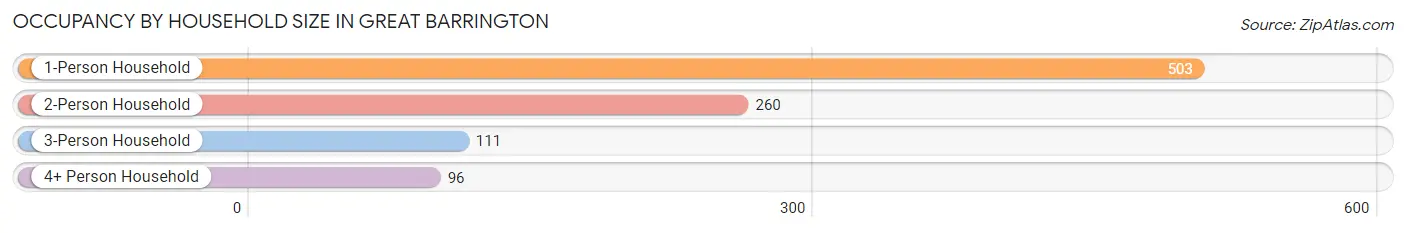
| Household Size | # Housing Units | % Housing Units |
| 1-Person Household | 503 | 51.9% |
| 2-Person Household | 260 | 26.8% |
| 3-Person Household | 111 | 11.4% |
| 4+ Person Household | 96 | 9.9% |
| Total Housing Units | 970 | 100.0% |
Occupancy by Ownership by Household Size in Great Barrington
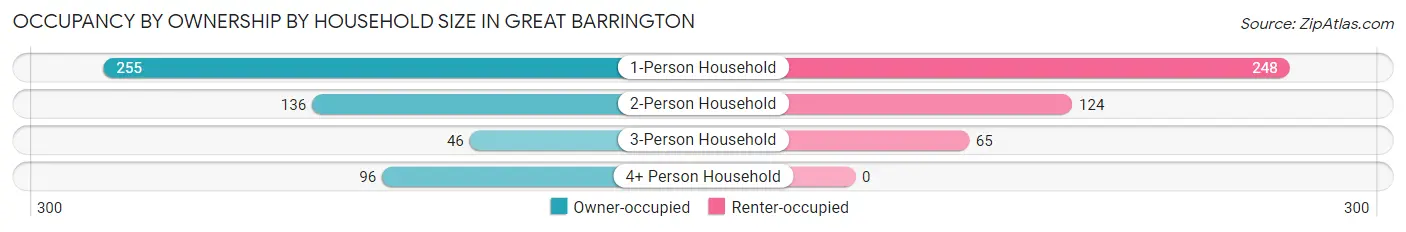
| Household Size | Owner-occupied | Renter-occupied |
| 1-Person Household | 255 (50.7%) | 248 (49.3%) |
| 2-Person Household | 136 (52.3%) | 124 (47.7%) |
| 3-Person Household | 46 (41.4%) | 65 (58.6%) |
| 4+ Person Household | 96 (100.0%) | 0 (0.0%) |
| Total Housing Units | 533 (54.9%) | 437 (45.1%) |
Occupancy by Educational Attainment in Great Barrington
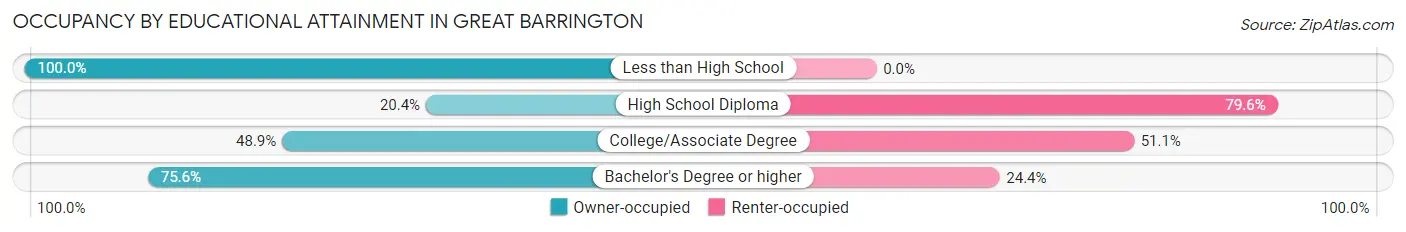
| Household Size | Owner-occupied | Renter-occupied |
| Less than High School | 64 (100.0%) | 0 (0.0%) |
| High School Diploma | 66 (20.4%) | 257 (79.6%) |
| College/Associate Degree | 69 (48.9%) | 72 (51.1%) |
| Bachelor's Degree or higher | 334 (75.6%) | 108 (24.4%) |
Occupancy by Age of Householder in Great Barrington
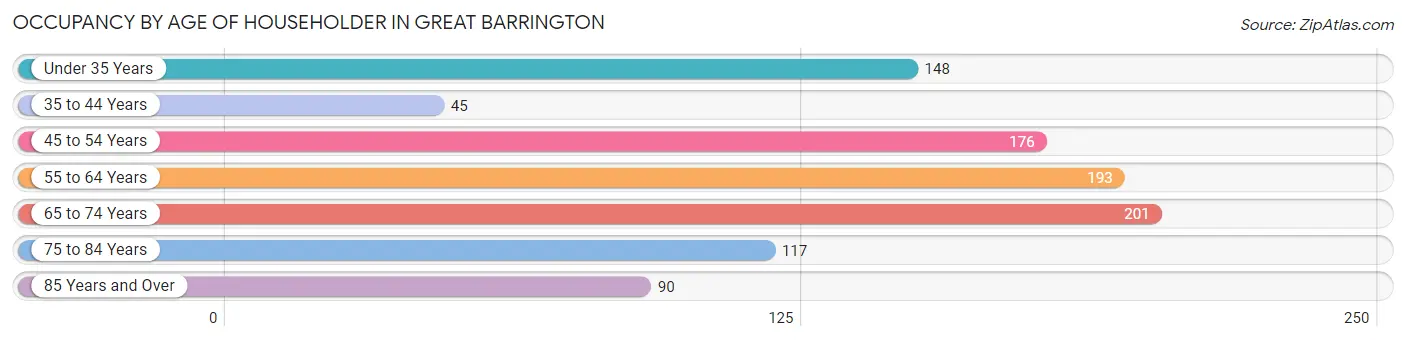
| Age Bracket | # Households | % Households |
| Under 35 Years | 148 | 15.3% |
| 35 to 44 Years | 45 | 4.6% |
| 45 to 54 Years | 176 | 18.1% |
| 55 to 64 Years | 193 | 19.9% |
| 65 to 74 Years | 201 | 20.7% |
| 75 to 84 Years | 117 | 12.1% |
| 85 Years and Over | 90 | 9.3% |
| Total | 970 | 100.0% |
Housing Finances in Great Barrington
Median Income by Occupancy in Great Barrington
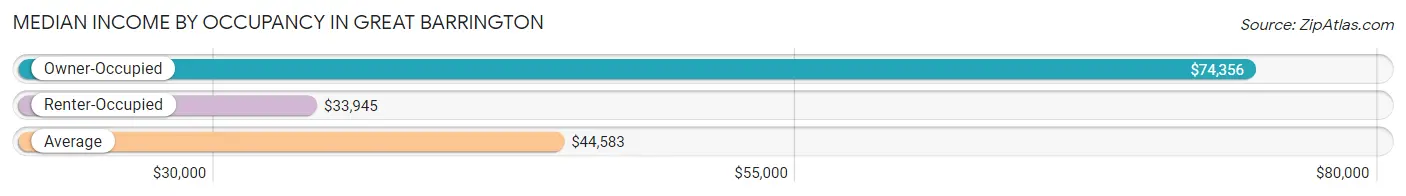
| Occupancy Type | # Households | Median Income |
| Owner-Occupied | 533 (54.9%) | $74,356 |
| Renter-Occupied | 437 (45.1%) | $33,945 |
| Average | 970 (100.0%) | $44,583 |
Occupancy by Householder Income Bracket in Great Barrington
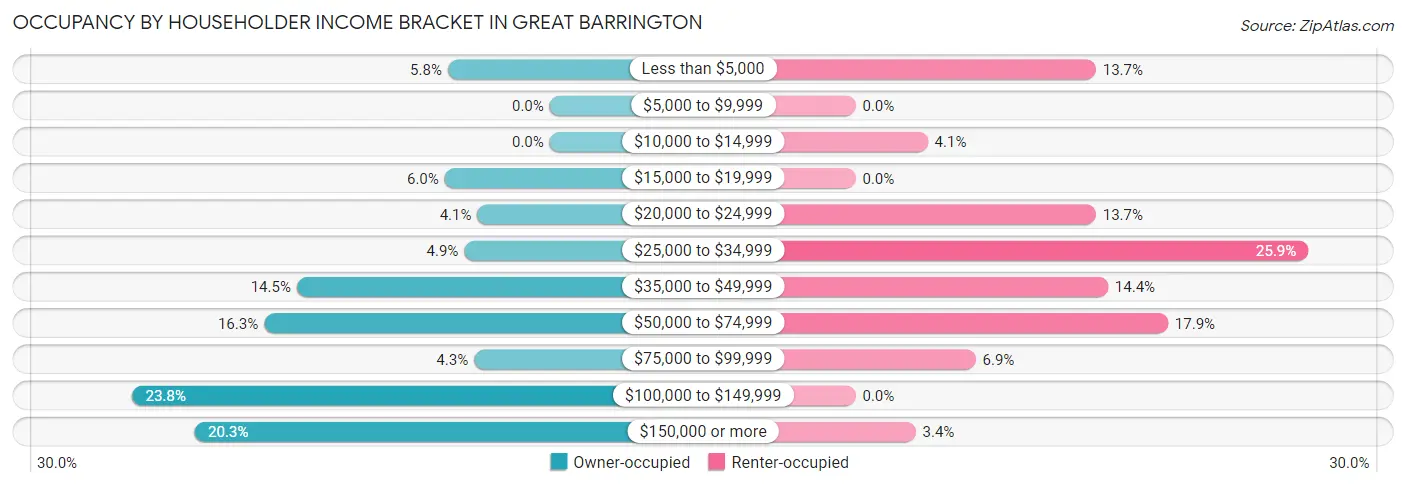
| Income Bracket | Owner-occupied | Renter-occupied |
| Less than $5,000 | 31 (5.8%) | 60 (13.7%) |
| $5,000 to $9,999 | 0 (0.0%) | 0 (0.0%) |
| $10,000 to $14,999 | 0 (0.0%) | 18 (4.1%) |
| $15,000 to $19,999 | 32 (6.0%) | 0 (0.0%) |
| $20,000 to $24,999 | 22 (4.1%) | 60 (13.7%) |
| $25,000 to $34,999 | 26 (4.9%) | 113 (25.9%) |
| $35,000 to $49,999 | 77 (14.4%) | 63 (14.4%) |
| $50,000 to $74,999 | 87 (16.3%) | 78 (17.8%) |
| $75,000 to $99,999 | 23 (4.3%) | 30 (6.9%) |
| $100,000 to $149,999 | 127 (23.8%) | 0 (0.0%) |
| $150,000 or more | 108 (20.3%) | 15 (3.4%) |
| Total | 533 (100.0%) | 437 (100.0%) |
Monthly Housing Cost Tiers in Great Barrington
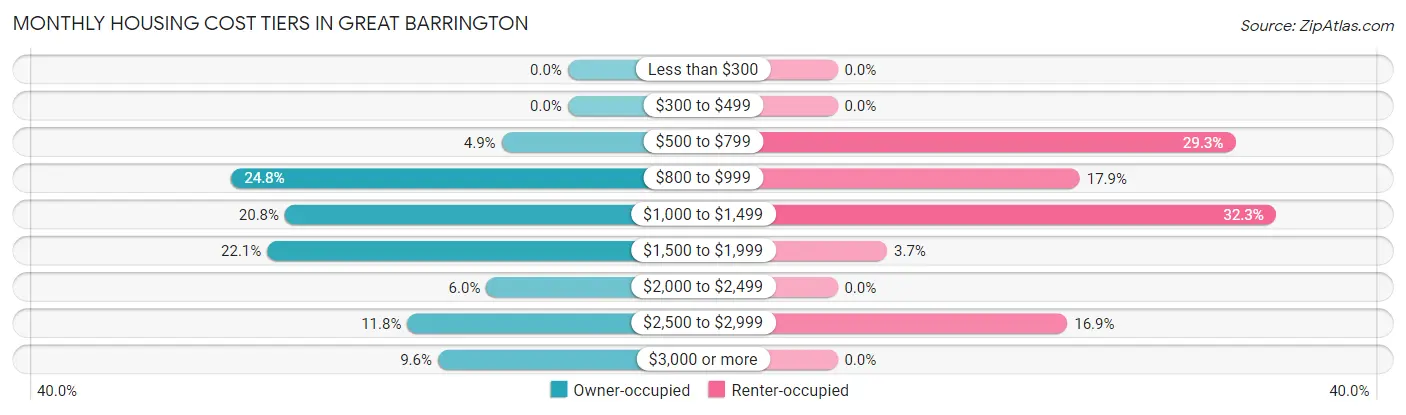
| Monthly Cost | Owner-occupied | Renter-occupied |
| Less than $300 | 0 (0.0%) | 0 (0.0%) |
| $300 to $499 | 0 (0.0%) | 0 (0.0%) |
| $500 to $799 | 26 (4.9%) | 128 (29.3%) |
| $800 to $999 | 132 (24.8%) | 78 (17.8%) |
| $1,000 to $1,499 | 111 (20.8%) | 141 (32.3%) |
| $1,500 to $1,999 | 118 (22.1%) | 16 (3.7%) |
| $2,000 to $2,499 | 32 (6.0%) | 0 (0.0%) |
| $2,500 to $2,999 | 63 (11.8%) | 74 (16.9%) |
| $3,000 or more | 51 (9.6%) | 0 (0.0%) |
| Total | 533 (100.0%) | 437 (100.0%) |
Physical Housing Characteristics in Great Barrington
Housing Structures in Great Barrington
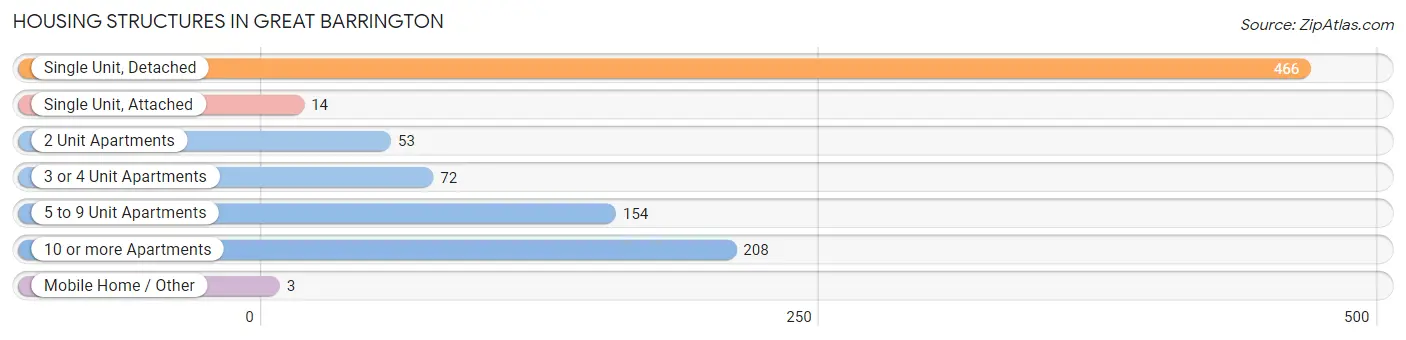
| Structure Type | # Housing Units | % Housing Units |
| Single Unit, Detached | 466 | 48.0% |
| Single Unit, Attached | 14 | 1.4% |
| 2 Unit Apartments | 53 | 5.5% |
| 3 or 4 Unit Apartments | 72 | 7.4% |
| 5 to 9 Unit Apartments | 154 | 15.9% |
| 10 or more Apartments | 208 | 21.4% |
| Mobile Home / Other | 3 | 0.3% |
| Total | 970 | 100.0% |
Housing Structures by Occupancy in Great Barrington
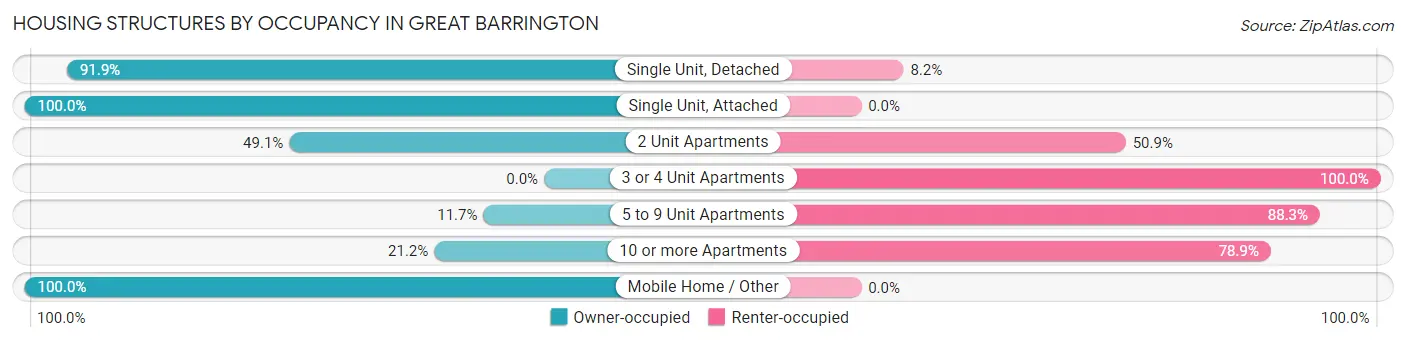
| Structure Type | Owner-occupied | Renter-occupied |
| Single Unit, Detached | 428 (91.8%) | 38 (8.2%) |
| Single Unit, Attached | 14 (100.0%) | 0 (0.0%) |
| 2 Unit Apartments | 26 (49.1%) | 27 (50.9%) |
| 3 or 4 Unit Apartments | 0 (0.0%) | 72 (100.0%) |
| 5 to 9 Unit Apartments | 18 (11.7%) | 136 (88.3%) |
| 10 or more Apartments | 44 (21.1%) | 164 (78.8%) |
| Mobile Home / Other | 3 (100.0%) | 0 (0.0%) |
| Total | 533 (54.9%) | 437 (45.1%) |
Housing Structures by Number of Rooms in Great Barrington
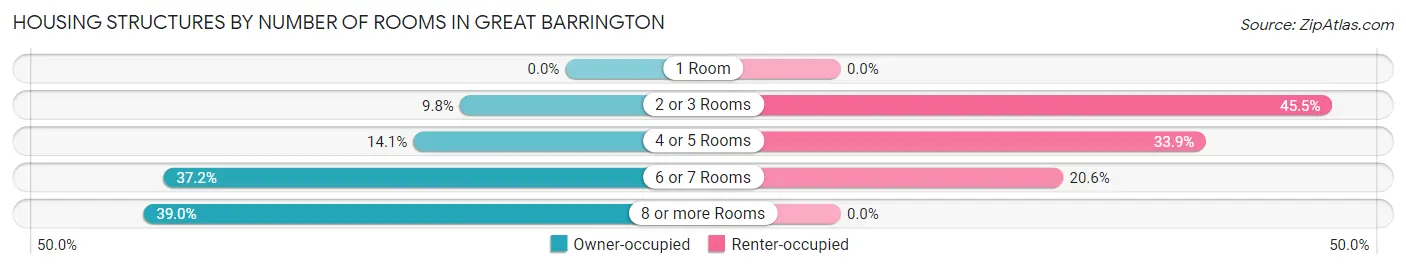
| Number of Rooms | Owner-occupied | Renter-occupied |
| 1 Room | 0 (0.0%) | 0 (0.0%) |
| 2 or 3 Rooms | 52 (9.8%) | 199 (45.5%) |
| 4 or 5 Rooms | 75 (14.1%) | 148 (33.9%) |
| 6 or 7 Rooms | 198 (37.1%) | 90 (20.6%) |
| 8 or more Rooms | 208 (39.0%) | 0 (0.0%) |
| Total | 533 (100.0%) | 437 (100.0%) |
Housing Structure by Heating Type in Great Barrington
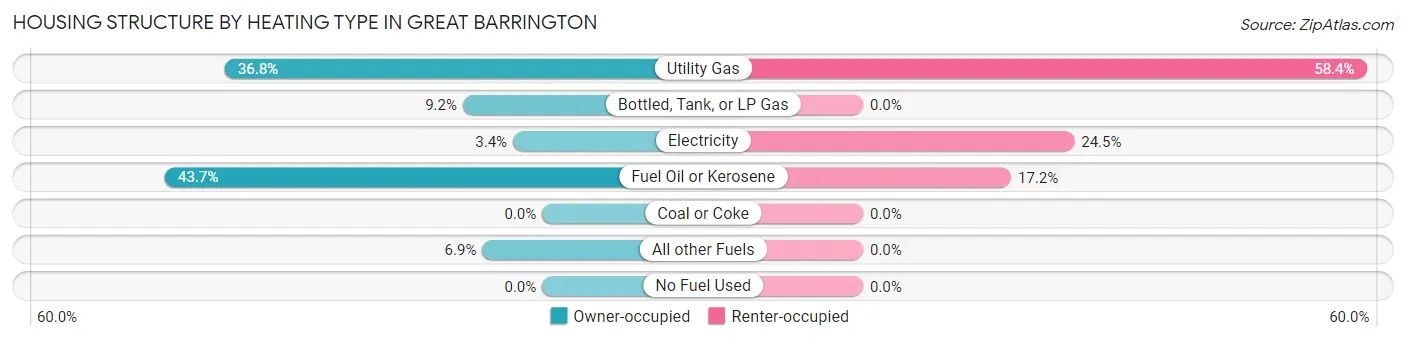
| Heating Type | Owner-occupied | Renter-occupied |
| Utility Gas | 196 (36.8%) | 255 (58.4%) |
| Bottled, Tank, or LP Gas | 49 (9.2%) | 0 (0.0%) |
| Electricity | 18 (3.4%) | 107 (24.5%) |
| Fuel Oil or Kerosene | 233 (43.7%) | 75 (17.2%) |
| Coal or Coke | 0 (0.0%) | 0 (0.0%) |
| All other Fuels | 37 (6.9%) | 0 (0.0%) |
| No Fuel Used | 0 (0.0%) | 0 (0.0%) |
| Total | 533 (100.0%) | 437 (100.0%) |
Household Vehicle Usage in Great Barrington
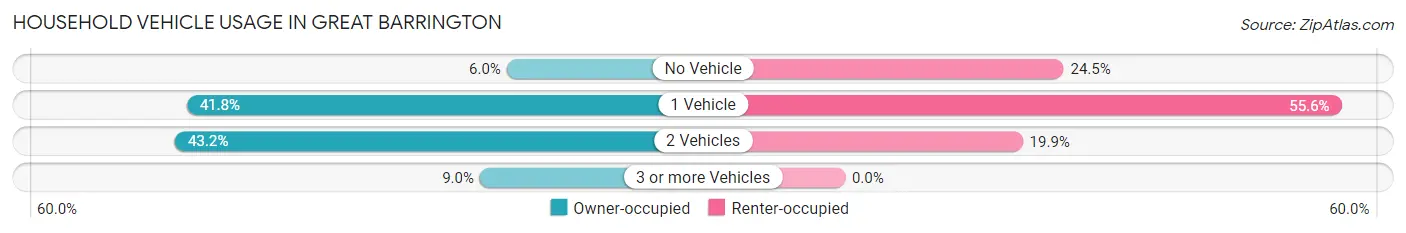
| Vehicles per Household | Owner-occupied | Renter-occupied |
| No Vehicle | 32 (6.0%) | 107 (24.5%) |
| 1 Vehicle | 223 (41.8%) | 243 (55.6%) |
| 2 Vehicles | 230 (43.1%) | 87 (19.9%) |
| 3 or more Vehicles | 48 (9.0%) | 0 (0.0%) |
| Total | 533 (100.0%) | 437 (100.0%) |
Real Estate & Mortgages in Great Barrington
Real Estate and Mortgage Overview in Great Barrington
| Characteristic | Without Mortgage | With Mortgage |
| Housing Units | 266 | 267 |
| Median Property Value | $552,100 | $409,600 |
| Median Household Income | $54,324 | $56 |
| Monthly Housing Costs | $978 | $51 |
| Real Estate Taxes | $6,274 | $0 |
Property Value by Mortgage Status in Great Barrington
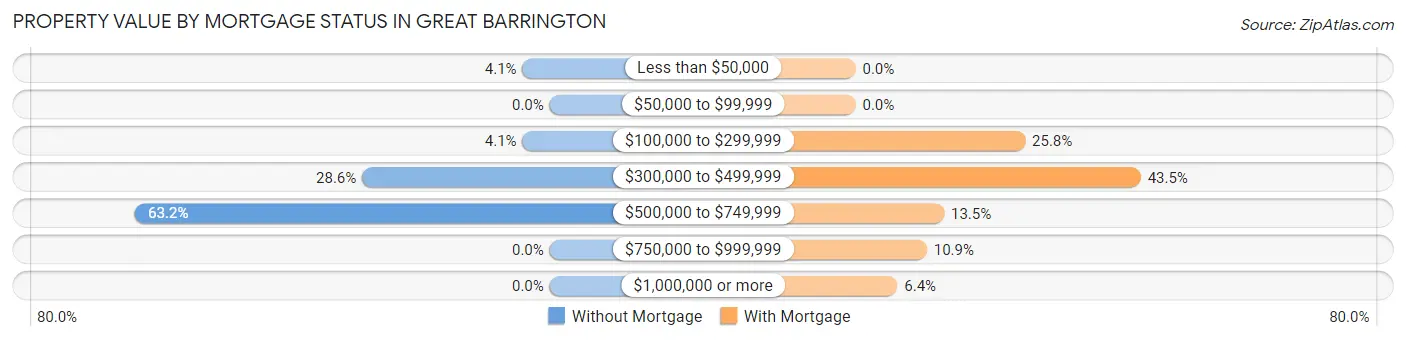
| Property Value | Without Mortgage | With Mortgage |
| Less than $50,000 | 11 (4.1%) | 0 (0.0%) |
| $50,000 to $99,999 | 0 (0.0%) | 0 (0.0%) |
| $100,000 to $299,999 | 11 (4.1%) | 69 (25.8%) |
| $300,000 to $499,999 | 76 (28.6%) | 116 (43.4%) |
| $500,000 to $749,999 | 168 (63.2%) | 36 (13.5%) |
| $750,000 to $999,999 | 0 (0.0%) | 29 (10.9%) |
| $1,000,000 or more | 0 (0.0%) | 17 (6.4%) |
| Total | 266 (100.0%) | 267 (100.0%) |
Household Income by Mortgage Status in Great Barrington
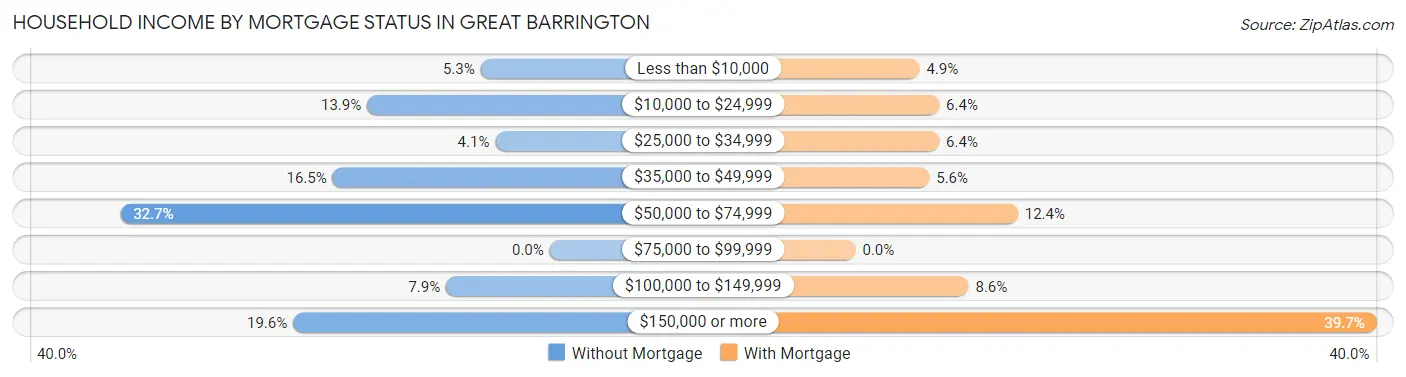
| Household Income | Without Mortgage | With Mortgage |
| Less than $10,000 | 14 (5.3%) | 13 (4.9%) |
| $10,000 to $24,999 | 37 (13.9%) | 17 (6.4%) |
| $25,000 to $34,999 | 11 (4.1%) | 17 (6.4%) |
| $35,000 to $49,999 | 44 (16.5%) | 15 (5.6%) |
| $50,000 to $74,999 | 87 (32.7%) | 33 (12.4%) |
| $75,000 to $99,999 | 0 (0.0%) | 0 (0.0%) |
| $100,000 to $149,999 | 21 (7.9%) | 23 (8.6%) |
| $150,000 or more | 52 (19.6%) | 106 (39.7%) |
| Total | 266 (100.0%) | 267 (100.0%) |
Property Value to Household Income Ratio in Great Barrington
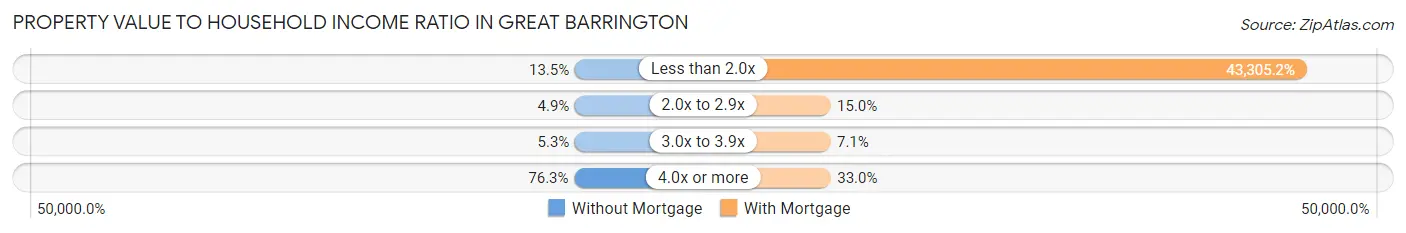
| Value-to-Income Ratio | Without Mortgage | With Mortgage |
| Less than 2.0x | 36 (13.5%) | 115,625 (43,305.2%) |
| 2.0x to 2.9x | 13 (4.9%) | 40 (15.0%) |
| 3.0x to 3.9x | 14 (5.3%) | 19 (7.1%) |
| 4.0x or more | 203 (76.3%) | 88 (33.0%) |
| Total | 266 (100.0%) | 267 (100.0%) |
Real Estate Taxes by Mortgage Status in Great Barrington
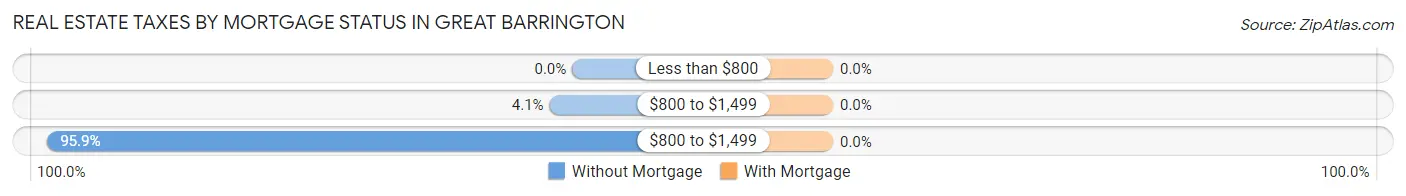
| Property Taxes | Without Mortgage | With Mortgage |
| Less than $800 | 0 (0.0%) | 0 (0.0%) |
| $800 to $1,499 | 11 (4.1%) | 0 (0.0%) |
| $800 to $1,499 | 255 (95.9%) | 0 (0.0%) |
| Total | 266 (100.0%) | 267 (100.0%) |
Health & Disability in Great Barrington
Health Insurance Coverage by Age in Great Barrington
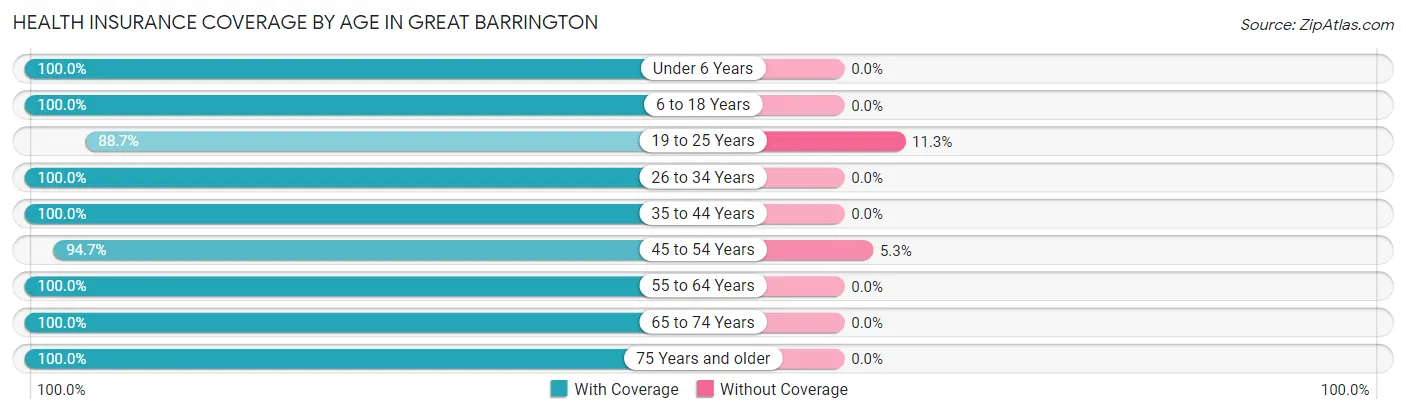
| Age Bracket | With Coverage | Without Coverage |
| Under 6 Years | 152 (100.0%) | 0 (0.0%) |
| 6 to 18 Years | 203 (100.0%) | 0 (0.0%) |
| 19 to 25 Years | 258 (88.7%) | 33 (11.3%) |
| 26 to 34 Years | 87 (100.0%) | 0 (0.0%) |
| 35 to 44 Years | 100 (100.0%) | 0 (0.0%) |
| 45 to 54 Years | 266 (94.7%) | 15 (5.3%) |
| 55 to 64 Years | 240 (100.0%) | 0 (0.0%) |
| 65 to 74 Years | 285 (100.0%) | 0 (0.0%) |
| 75 Years and older | 251 (100.0%) | 0 (0.0%) |
| Total | 1,842 (97.5%) | 48 (2.5%) |
Health Insurance Coverage by Citizenship Status in Great Barrington
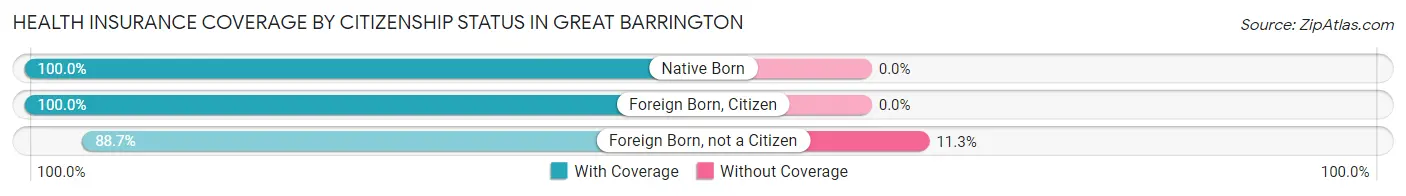
| Citizenship Status | With Coverage | Without Coverage |
| Native Born | 152 (100.0%) | 0 (0.0%) |
| Foreign Born, Citizen | 203 (100.0%) | 0 (0.0%) |
| Foreign Born, not a Citizen | 258 (88.7%) | 33 (11.3%) |
Health Insurance Coverage by Household Income in Great Barrington
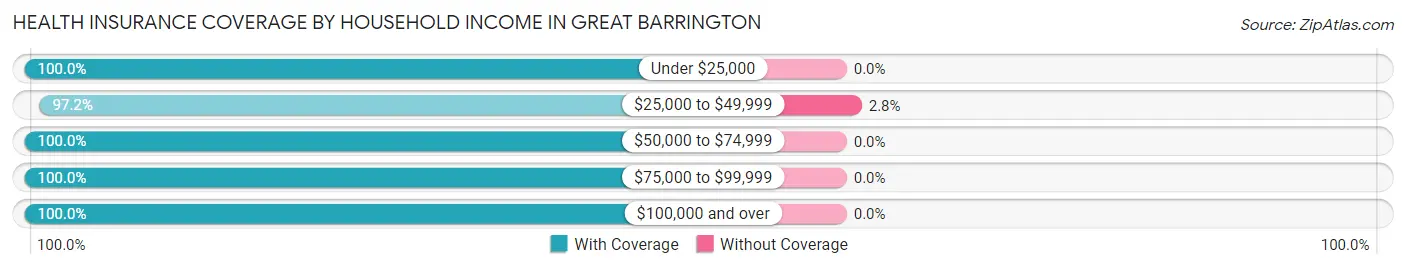
| Household Income | With Coverage | Without Coverage |
| Under $25,000 | 223 (100.0%) | 0 (0.0%) |
| $25,000 to $49,999 | 519 (97.2%) | 15 (2.8%) |
| $50,000 to $74,999 | 194 (100.0%) | 0 (0.0%) |
| $75,000 to $99,999 | 142 (100.0%) | 0 (0.0%) |
| $100,000 and over | 764 (100.0%) | 0 (0.0%) |
Public vs Private Health Insurance Coverage by Age in Great Barrington
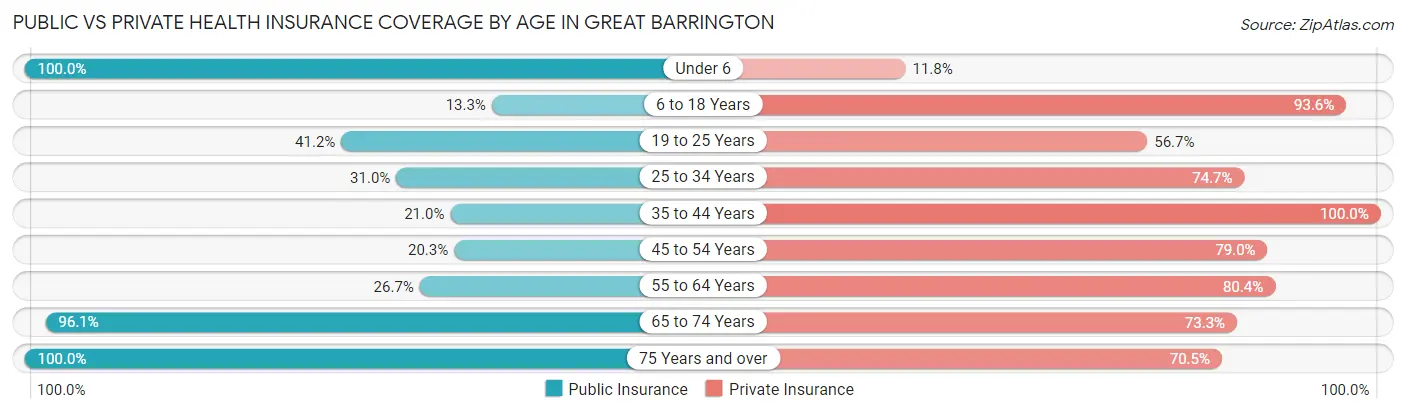
| Age Bracket | Public Insurance | Private Insurance |
| Under 6 | 152 (100.0%) | 18 (11.8%) |
| 6 to 18 Years | 27 (13.3%) | 190 (93.6%) |
| 19 to 25 Years | 120 (41.2%) | 165 (56.7%) |
| 25 to 34 Years | 27 (31.0%) | 65 (74.7%) |
| 35 to 44 Years | 21 (21.0%) | 100 (100.0%) |
| 45 to 54 Years | 57 (20.3%) | 222 (79.0%) |
| 55 to 64 Years | 64 (26.7%) | 193 (80.4%) |
| 65 to 74 Years | 274 (96.1%) | 209 (73.3%) |
| 75 Years and over | 251 (100.0%) | 177 (70.5%) |
| Total | 993 (52.5%) | 1,339 (70.9%) |
Disability Status by Sex by Age in Great Barrington
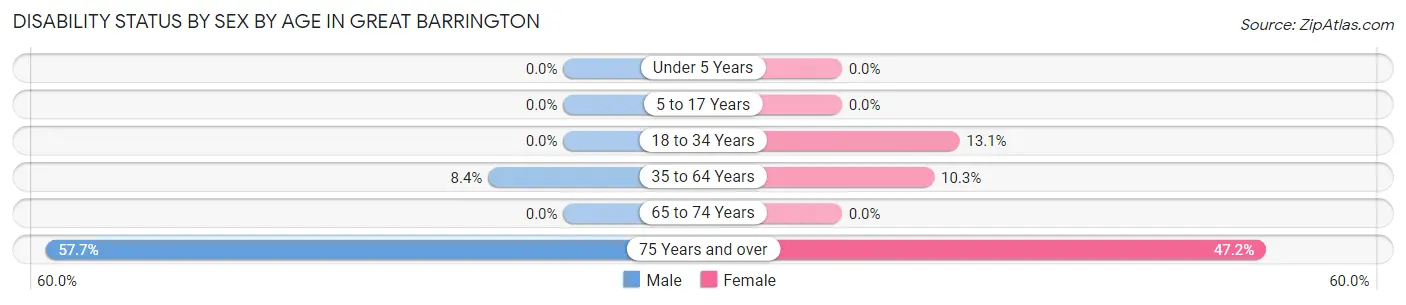
| Age Bracket | Male | Female |
| Under 5 Years | 0 (0.0%) | 0 (0.0%) |
| 5 to 17 Years | 0 (0.0%) | 0 (0.0%) |
| 18 to 34 Years | 0 (0.0%) | 33 (13.1%) |
| 35 to 64 Years | 21 (8.4%) | 38 (10.3%) |
| 65 to 74 Years | 0 (0.0%) | 0 (0.0%) |
| 75 Years and over | 30 (57.7%) | 94 (47.2%) |
Disability Class by Sex by Age in Great Barrington
Disability Class: Hearing Difficulty
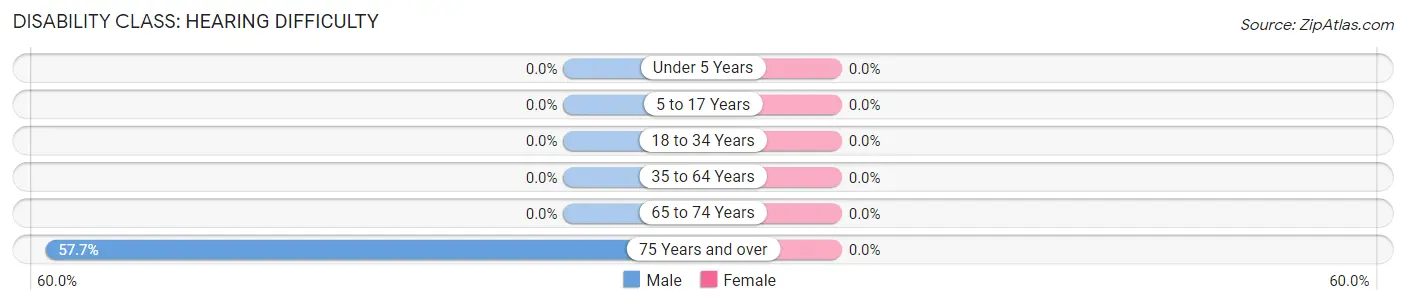
| Age Bracket | Male | Female |
| Under 5 Years | 0 (0.0%) | 0 (0.0%) |
| 5 to 17 Years | 0 (0.0%) | 0 (0.0%) |
| 18 to 34 Years | 0 (0.0%) | 0 (0.0%) |
| 35 to 64 Years | 0 (0.0%) | 0 (0.0%) |
| 65 to 74 Years | 0 (0.0%) | 0 (0.0%) |
| 75 Years and over | 30 (57.7%) | 0 (0.0%) |
Disability Class: Vision Difficulty
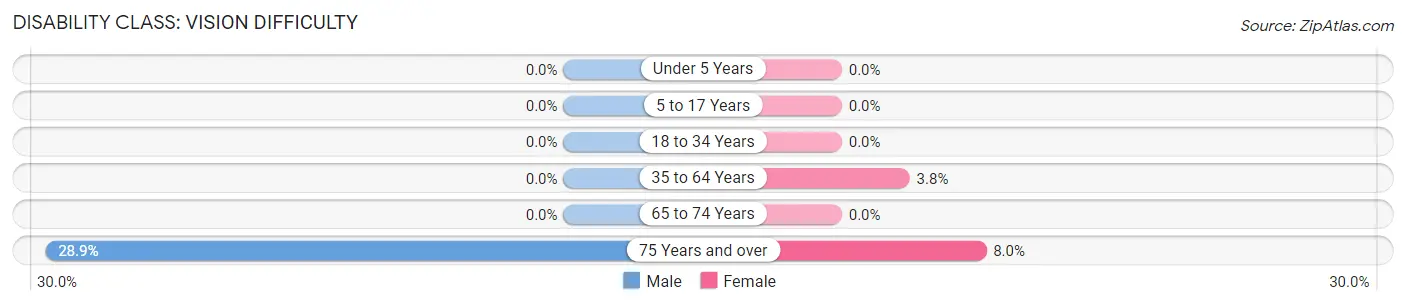
| Age Bracket | Male | Female |
| Under 5 Years | 0 (0.0%) | 0 (0.0%) |
| 5 to 17 Years | 0 (0.0%) | 0 (0.0%) |
| 18 to 34 Years | 0 (0.0%) | 0 (0.0%) |
| 35 to 64 Years | 0 (0.0%) | 14 (3.8%) |
| 65 to 74 Years | 0 (0.0%) | 0 (0.0%) |
| 75 Years and over | 15 (28.8%) | 16 (8.0%) |
Disability Class: Cognitive Difficulty
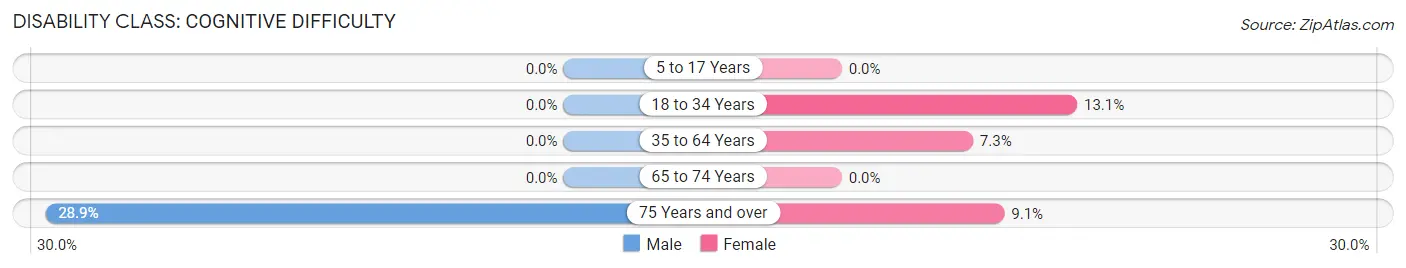
| Age Bracket | Male | Female |
| 5 to 17 Years | 0 (0.0%) | 0 (0.0%) |
| 18 to 34 Years | 0 (0.0%) | 33 (13.1%) |
| 35 to 64 Years | 0 (0.0%) | 27 (7.3%) |
| 65 to 74 Years | 0 (0.0%) | 0 (0.0%) |
| 75 Years and over | 15 (28.8%) | 18 (9.0%) |
Disability Class: Ambulatory Difficulty
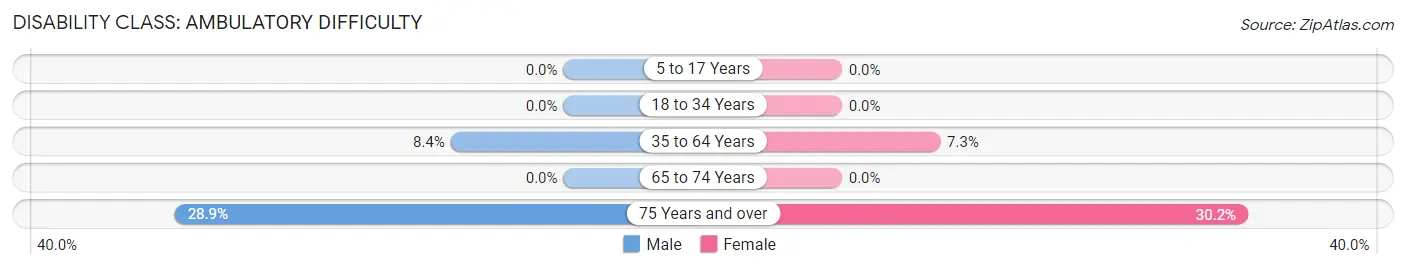
| Age Bracket | Male | Female |
| 5 to 17 Years | 0 (0.0%) | 0 (0.0%) |
| 18 to 34 Years | 0 (0.0%) | 0 (0.0%) |
| 35 to 64 Years | 21 (8.4%) | 27 (7.3%) |
| 65 to 74 Years | 0 (0.0%) | 0 (0.0%) |
| 75 Years and over | 15 (28.8%) | 60 (30.1%) |
Disability Class: Self-Care Difficulty
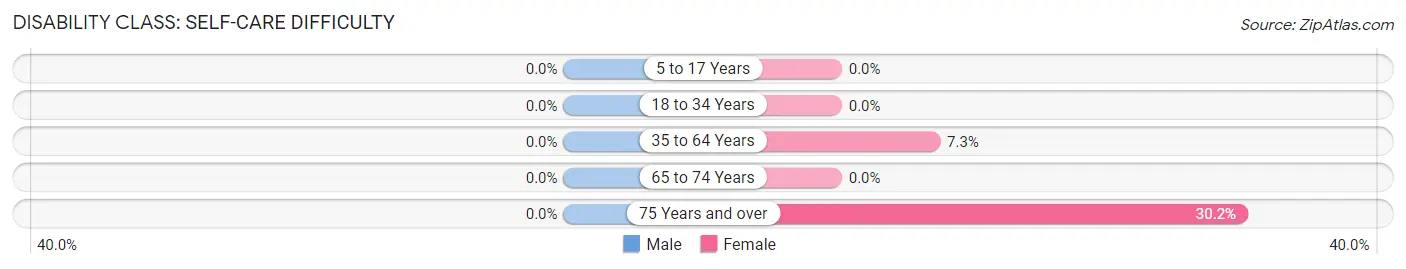
| Age Bracket | Male | Female |
| 5 to 17 Years | 0 (0.0%) | 0 (0.0%) |
| 18 to 34 Years | 0 (0.0%) | 0 (0.0%) |
| 35 to 64 Years | 0 (0.0%) | 27 (7.3%) |
| 65 to 74 Years | 0 (0.0%) | 0 (0.0%) |
| 75 Years and over | 0 (0.0%) | 60 (30.1%) |
Technology Access in Great Barrington
Computing Device Access in Great Barrington
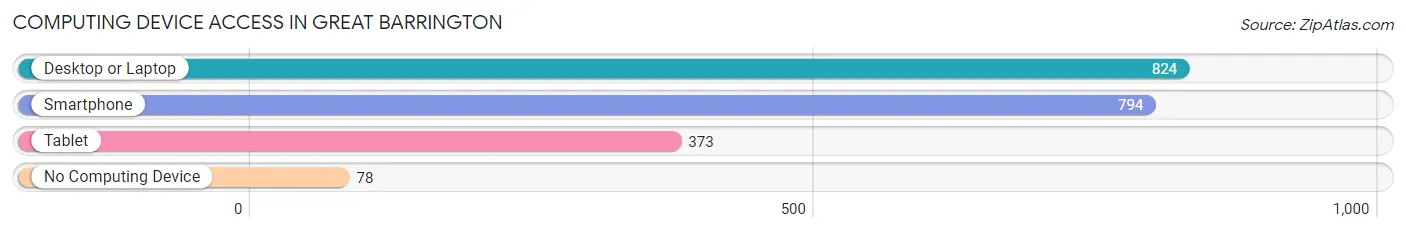
| Device Type | # Households | % Households |
| Desktop or Laptop | 824 | 85.0% |
| Smartphone | 794 | 81.9% |
| Tablet | 373 | 38.5% |
| No Computing Device | 78 | 8.0% |
| Total | 970 | 100.0% |
Internet Access in Great Barrington
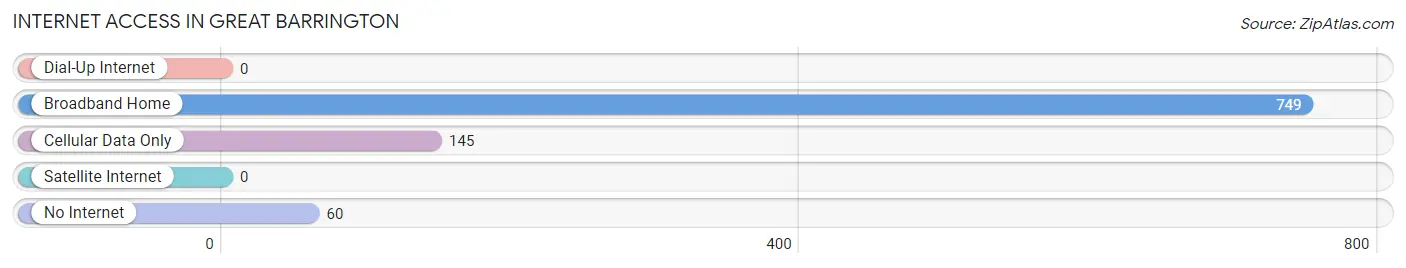
| Internet Type | # Households | % Households |
| Dial-Up Internet | 0 | 0.0% |
| Broadband Home | 749 | 77.2% |
| Cellular Data Only | 145 | 14.9% |
| Satellite Internet | 0 | 0.0% |
| No Internet | 60 | 6.2% |
| Total | 970 | 100.0% |
Great Barrington Summary
Great Barrington is a town located in Berkshire County, Massachusetts, United States. It is the largest town in the county and is situated in the southern part of the state. The town is located in the heart of the Berkshires, a region of the Appalachian Mountains known for its natural beauty and cultural attractions. The town is home to a population of approximately 7,000 people, and is the commercial and cultural center of the region.
History
The area that is now Great Barrington was originally inhabited by the Mahican Native American tribe. The first European settlers arrived in the area in 1724, and the town was officially incorporated in 1761. The town was named after the English town of Great Barrington, Gloucestershire.
The town quickly became an important center of commerce and industry, with a variety of mills and factories being established in the area. The town was also home to a number of prominent citizens, including the poet and essayist Henry David Thoreau, who lived in Great Barrington for a time.
In the late 19th century, the town became a popular summer resort destination, and many wealthy families built large estates in the area. The town also became a center of the arts, with a number of prominent writers, artists, and musicians living in the area.
Geography
Great Barrington is located in the southern part of Berkshire County, in the western part of Massachusetts. The town is situated in the heart of the Berkshires, a region of the Appalachian Mountains known for its natural beauty and cultural attractions. The town is bordered by the towns of Egremont to the north, Monterey to the east, Alford to the south, and Sheffield to the west.
The town is located at the confluence of the Housatonic and Green Rivers, and is surrounded by hills and mountains. The highest point in the town is Monument Mountain, which rises to an elevation of 1,890 feet.
Economy
Great Barrington is the commercial and cultural center of the Berkshires region. The town is home to a variety of businesses, including retail stores, restaurants, and professional services. The town is also home to a number of cultural attractions, including the Mahaiwe Performing Arts Center, the Berkshire Museum, and the Berkshire Scenic Railway.
The town is also home to a number of educational institutions, including the Berkshire School, Bard College at Simon's Rock, and the Massachusetts College of Liberal Arts. The town is also home to a number of health care facilities, including Fairview Hospital and the Berkshire Medical Center.
Demographics
As of the 2010 census, Great Barrington had a population of 7,104 people. The racial makeup of the town was 94.3% White, 1.3% African American, 0.3% Native American, 1.2% Asian, 0.1% Pacific Islander, 1.2% from other races, and 1.6% from two or more races. Hispanic or Latino of any race were 3.2% of the population.
The median household income in the town was $50,945, and the median family income was $62,813. The per capita income in the town was $30,945. About 8.3% of the population was below the poverty line.
Common Questions
What is Per Capita Income in Great Barrington?
Per Capita income in Great Barrington is $38,284.
What is the Median Family Income in Great Barrington?
Median Family Income in Great Barrington is $92,143.
What is the Median Household income in Great Barrington?
Median Household Income in Great Barrington is $44,583.
What is Inequality or Gini Index in Great Barrington?
Inequality or Gini Index in Great Barrington is 0.48.
What is the Total Population of Great Barrington?
Total Population of Great Barrington is 1,890.
What is the Total Male Population of Great Barrington?
Total Male Population of Great Barrington is 626.
What is the Total Female Population of Great Barrington?
Total Female Population of Great Barrington is 1,264.
What is the Ratio of Males per 100 Females in Great Barrington?
There are 49.53 Males per 100 Females in Great Barrington.
What is the Ratio of Females per 100 Males in Great Barrington?
There are 201.92 Females per 100 Males in Great Barrington.
What is the Median Population Age in Great Barrington?
Median Population Age in Great Barrington is 49.8 Years.
What is the Average Family Size in Great Barrington
Average Family Size in Great Barrington is 2.9 People.
What is the Average Household Size in Great Barrington
Average Household Size in Great Barrington is 1.9 People.
How Large is the Labor Force in Great Barrington?
There are 994 People in the Labor Forcein in Great Barrington.
What is the Percentage of People in the Labor Force in Great Barrington?
63.9% of People are in the Labor Force in Great Barrington.
What is the Unemployment Rate in Great Barrington?
Unemployment Rate in Great Barrington is 3.4%.