Belchertown, MA Map & Demographics
Belchertown Map
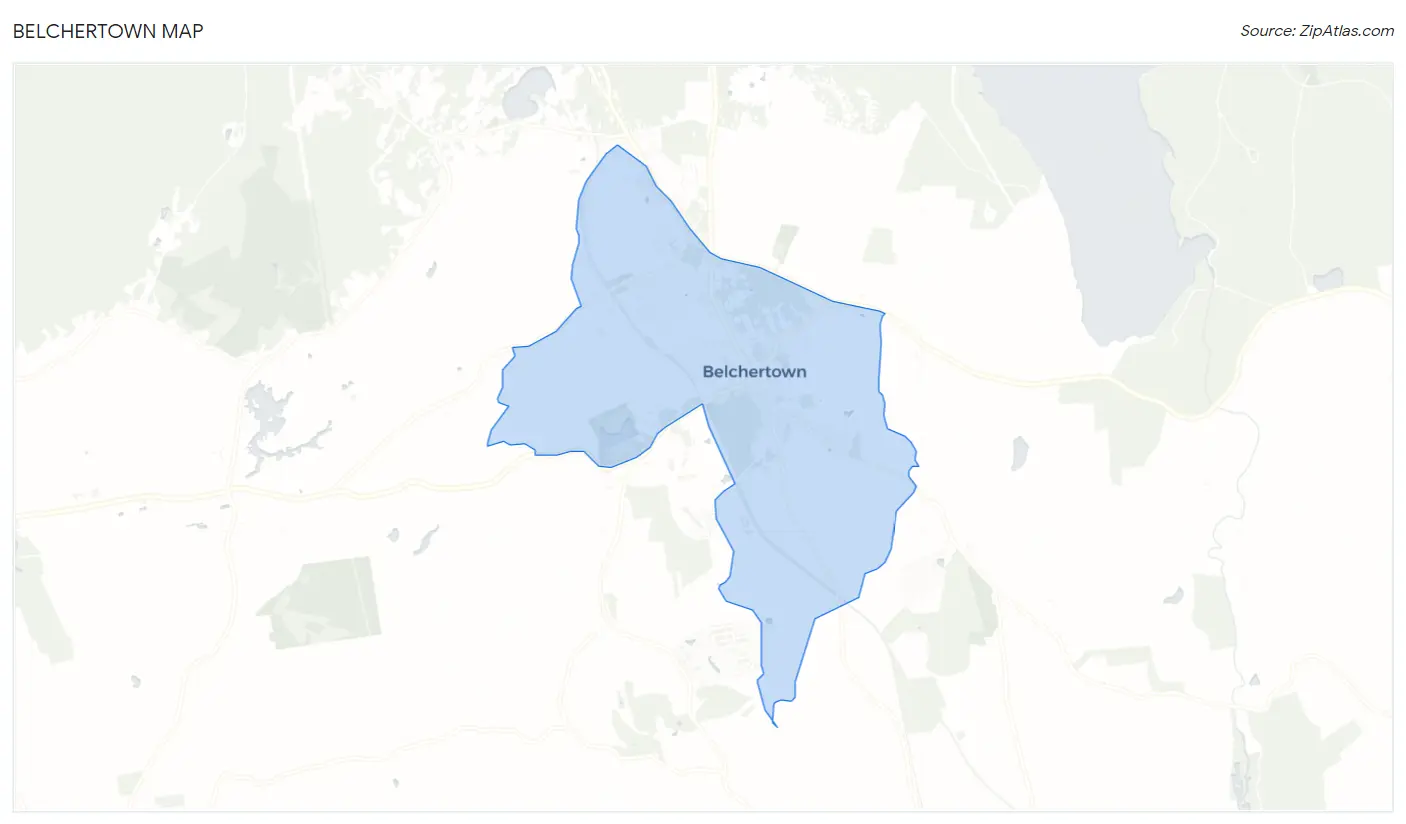
Belchertown Overview
$55,609
PER CAPITA INCOME
$121,538
AVG FAMILY INCOME
$75,284
AVG HOUSEHOLD INCOME
2.5%
WAGE / INCOME GAP [ % ]
97.5¢/ $1
WAGE / INCOME GAP [ $ ]
0.53
INEQUALITY / GINI INDEX
2,648
TOTAL POPULATION
1,255
MALE POPULATION
1,393
FEMALE POPULATION
90.09
MALES / 100 FEMALES
111.00
FEMALES / 100 MALES
48.7
MEDIAN AGE
2.9
AVG FAMILY SIZE
1.9
AVG HOUSEHOLD SIZE
1,444
LABOR FORCE [ PEOPLE ]
64.6%
PERCENT IN LABOR FORCE
0.9%
UNEMPLOYMENT RATE
Belchertown Zip Codes
Belchertown Area Codes
Income in Belchertown
Income Overview in Belchertown
Per Capita Income in Belchertown is $55,609, while median incomes of families and households are $121,538 and $75,284 respectively.
| Characteristic | Number | Measure |
| Per Capita Income | 2,648 | $55,609 |
| Median Family Income | 538 | $121,538 |
| Mean Family Income | 538 | $186,162 |
| Median Household Income | 1,362 | $75,284 |
| Mean Household Income | 1,362 | $108,335 |
| Income Deficit | 538 | $0 |
| Wage / Income Gap (%) | 2,648 | 2.46% |
| Wage / Income Gap ($) | 2,648 | 97.54¢ per $1 |
| Gini / Inequality Index | 2,648 | 0.53 |
Earnings by Sex in Belchertown
Average Earnings in Belchertown are $52,951, $52,192 for men and $53,507 for women, a difference of 2.5%.
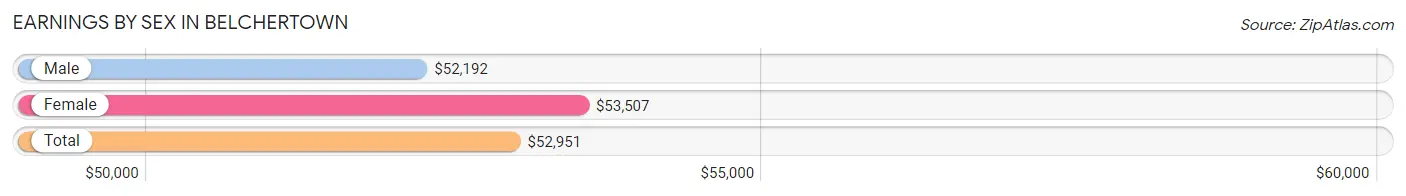
| Sex | Number | Average Earnings |
| Male | 740 (49.5%) | $52,192 |
| Female | 754 (50.5%) | $53,507 |
| Total | 1,494 (100.0%) | $52,951 |
Earnings by Sex by Income Bracket in Belchertown
The most common earnings brackets in Belchertown are $50,000 to $54,999 for men (130 | 17.6%) and $100,000+ for women (173 | 22.9%).
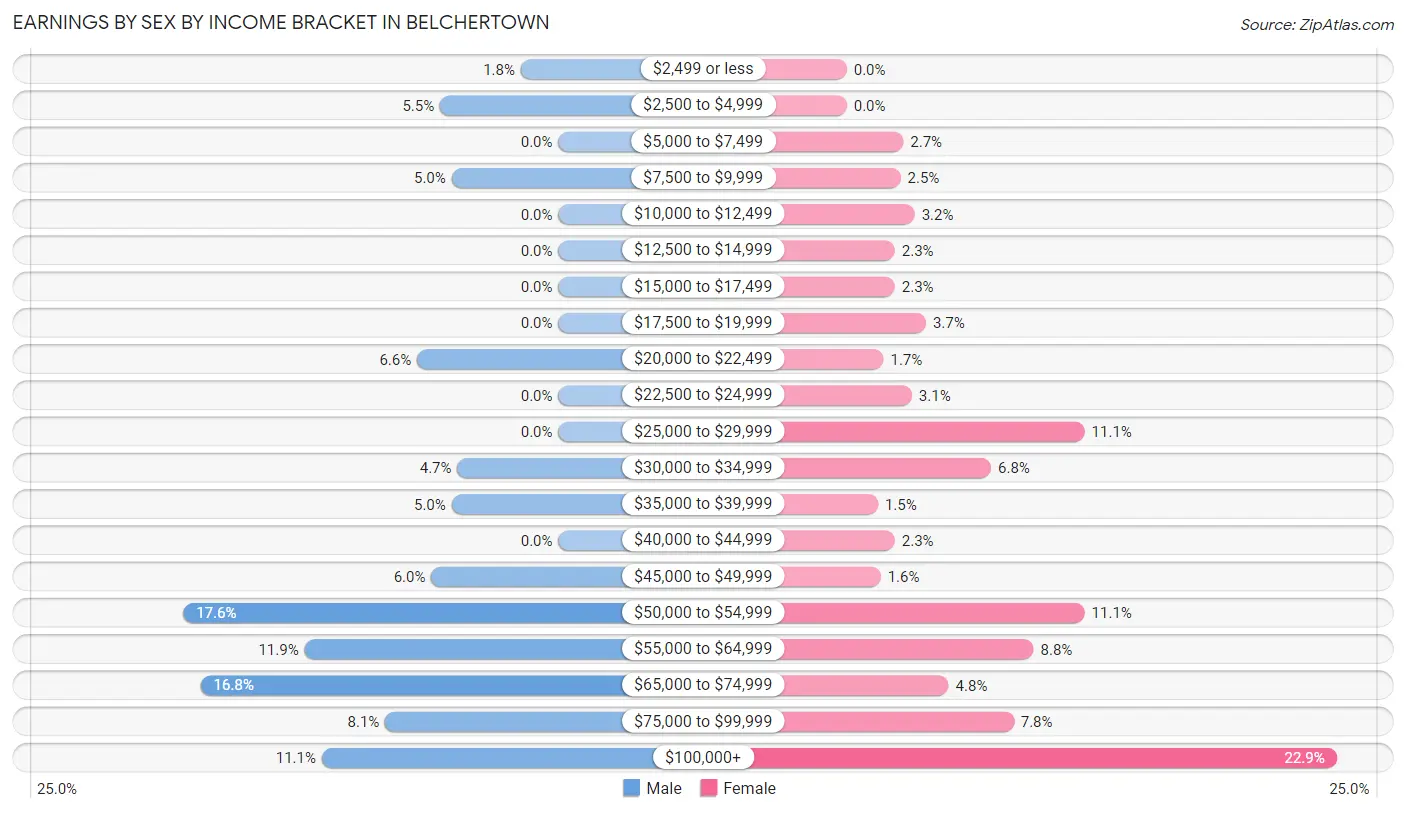
| Income | Male | Female |
| $2,499 or less | 13 (1.8%) | 0 (0.0%) |
| $2,500 to $4,999 | 41 (5.5%) | 0 (0.0%) |
| $5,000 to $7,499 | 0 (0.0%) | 20 (2.6%) |
| $7,500 to $9,999 | 37 (5.0%) | 19 (2.5%) |
| $10,000 to $12,499 | 0 (0.0%) | 24 (3.2%) |
| $12,500 to $14,999 | 0 (0.0%) | 17 (2.2%) |
| $15,000 to $17,499 | 0 (0.0%) | 17 (2.2%) |
| $17,500 to $19,999 | 0 (0.0%) | 28 (3.7%) |
| $20,000 to $22,499 | 49 (6.6%) | 13 (1.7%) |
| $22,500 to $24,999 | 0 (0.0%) | 23 (3.0%) |
| $25,000 to $29,999 | 0 (0.0%) | 84 (11.1%) |
| $30,000 to $34,999 | 35 (4.7%) | 51 (6.8%) |
| $35,000 to $39,999 | 37 (5.0%) | 11 (1.5%) |
| $40,000 to $44,999 | 0 (0.0%) | 17 (2.2%) |
| $45,000 to $49,999 | 44 (5.9%) | 12 (1.6%) |
| $50,000 to $54,999 | 130 (17.6%) | 84 (11.1%) |
| $55,000 to $64,999 | 88 (11.9%) | 66 (8.7%) |
| $65,000 to $74,999 | 124 (16.8%) | 36 (4.8%) |
| $75,000 to $99,999 | 60 (8.1%) | 59 (7.8%) |
| $100,000+ | 82 (11.1%) | 173 (22.9%) |
| Total | 740 (100.0%) | 754 (100.0%) |
Earnings by Sex by Educational Attainment in Belchertown
Average earnings in Belchertown are $62,909 for men and $54,965 for women, a difference of 12.6%. Men with an educational attainment of graduate degree enjoy the highest average annual earnings of $69,075, while those with high school diploma education earn the least with $51,797. Women with an educational attainment of graduate degree earn the most with the average annual earnings of $80,294, while those with high school diploma education have the smallest earnings of $30,882.
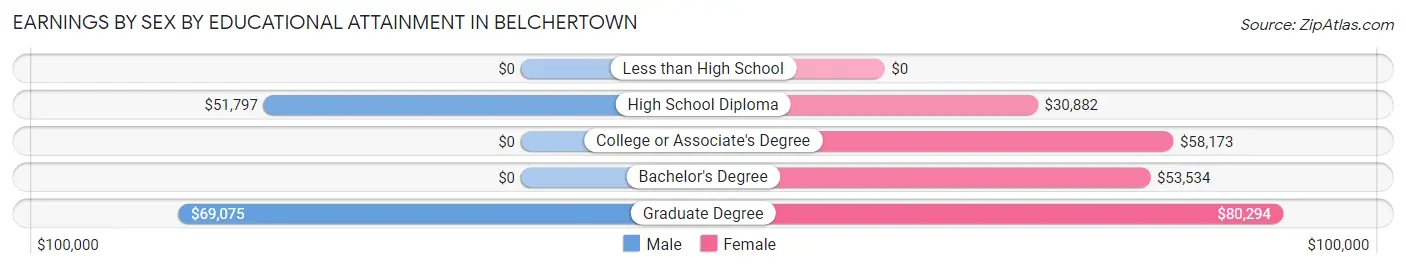
| Educational Attainment | Male Income | Female Income |
| Less than High School | - | - |
| High School Diploma | $51,797 | $30,882 |
| College or Associate's Degree | - | - |
| Bachelor's Degree | - | - |
| Graduate Degree | $69,075 | $80,294 |
| Total | $62,909 | $54,965 |
Family Income in Belchertown
Family Income Brackets in Belchertown
According to the Belchertown family income data, there are 149 families falling into the $150,000 to $199,999 income range, which is the most common income bracket and makes up 27.7% of all families.
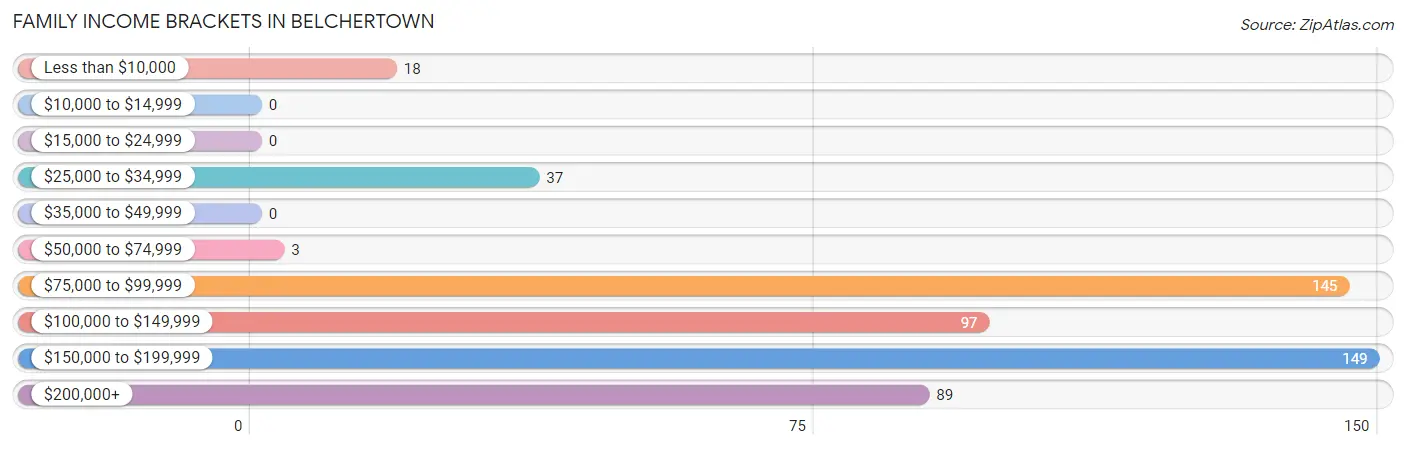
| Income Bracket | # Families | % Families |
| Less than $10,000 | 18 | 3.3% |
| $10,000 to $14,999 | 0 | 0.0% |
| $15,000 to $24,999 | 0 | 0.0% |
| $25,000 to $34,999 | 37 | 6.9% |
| $35,000 to $49,999 | 0 | 0.0% |
| $50,000 to $74,999 | 3 | 0.6% |
| $75,000 to $99,999 | 145 | 27.0% |
| $100,000 to $149,999 | 97 | 18.0% |
| $150,000 to $199,999 | 149 | 27.7% |
| $200,000+ | 89 | 16.5% |
Family Income by Famaliy Size in Belchertown
4-person families (111 | 20.6%) account for the highest median family income in Belchertown with $154,511 per family, while 2-person families (202 | 37.6%) have the highest median income of $66,607 per family member.
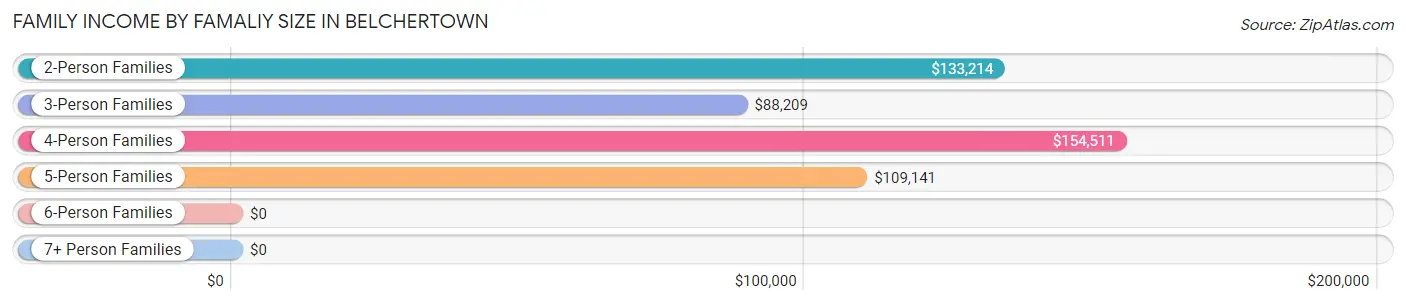
| Income Bracket | # Families | Median Income |
| 2-Person Families | 202 (37.6%) | $133,214 |
| 3-Person Families | 165 (30.7%) | $88,209 |
| 4-Person Families | 111 (20.6%) | $154,511 |
| 5-Person Families | 55 (10.2%) | $109,141 |
| 6-Person Families | 5 (0.9%) | $0 |
| 7+ Person Families | 0 (0.0%) | $0 |
| Total | 538 (100.0%) | $121,538 |
Family Income by Number of Earners in Belchertown
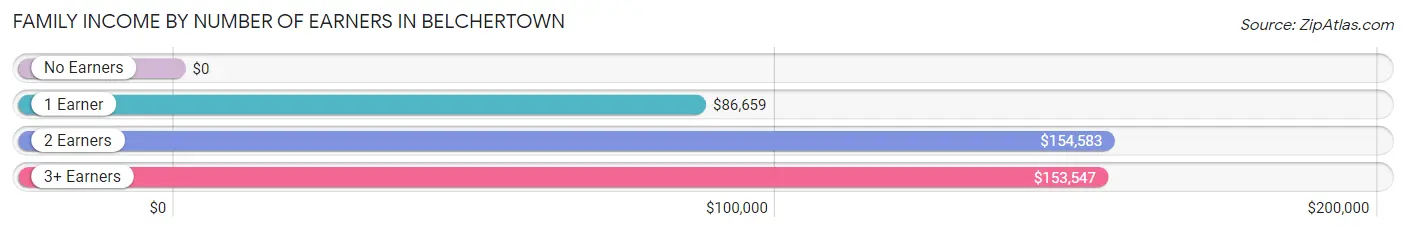
| Number of Earners | # Families | Median Income |
| No Earners | 46 (8.6%) | $0 |
| 1 Earner | 199 (37.0%) | $86,659 |
| 2 Earners | 217 (40.3%) | $154,583 |
| 3+ Earners | 76 (14.1%) | $153,547 |
| Total | 538 (100.0%) | $121,538 |
Household Income in Belchertown
Household Income Brackets in Belchertown
With 237 households falling in the category, the $150,000 to $199,999 income range is the most frequent in Belchertown, accounting for 17.4% of all households. In contrast, only 25 households (1.8%) fall into the $35,000 to $49,999 income bracket, making it the least populous group.
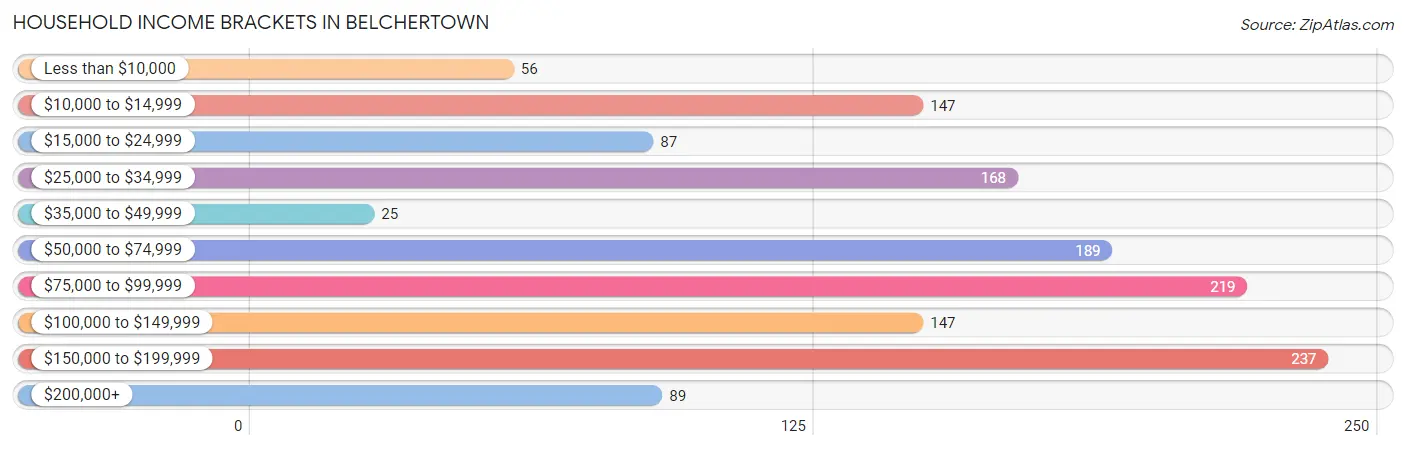
| Income Bracket | # Households | % Households |
| Less than $10,000 | 56 | 4.1% |
| $10,000 to $14,999 | 147 | 10.8% |
| $15,000 to $24,999 | 87 | 6.4% |
| $25,000 to $34,999 | 168 | 12.3% |
| $35,000 to $49,999 | 25 | 1.8% |
| $50,000 to $74,999 | 189 | 13.9% |
| $75,000 to $99,999 | 219 | 16.1% |
| $100,000 to $149,999 | 147 | 10.8% |
| $150,000 to $199,999 | 237 | 17.4% |
| $200,000+ | 89 | 6.5% |
Household Income by Householder Age in Belchertown
The median household income in Belchertown is $75,284, with the highest median household income of $113,813 found in the 25 to 44 years age bracket for the primary householder. A total of 331 households (24.3%) fall into this category. Meanwhile, the 15 to 24 years age bracket for the primary householder has the lowest median household income of $0, with 51 households (3.7%) in this group.
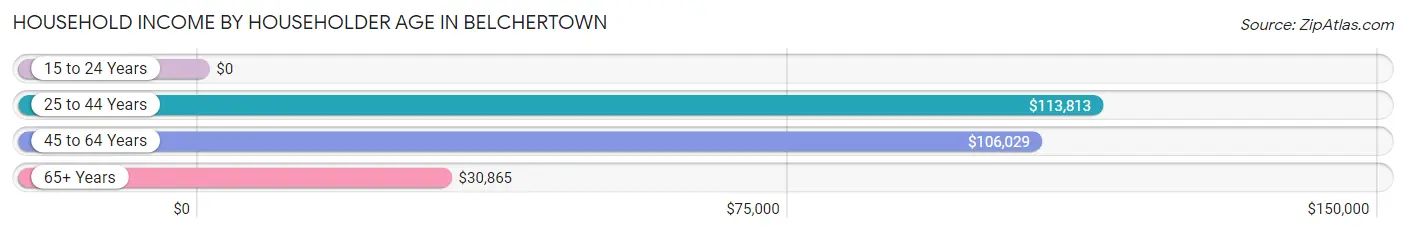
| Income Bracket | # Households | Median Income |
| 15 to 24 Years | 51 (3.7%) | $0 |
| 25 to 44 Years | 331 (24.3%) | $113,813 |
| 45 to 64 Years | 482 (35.4%) | $106,029 |
| 65+ Years | 498 (36.6%) | $30,865 |
| Total | 1,362 (100.0%) | $75,284 |
Poverty in Belchertown
Income Below Poverty by Sex and Age in Belchertown
With 10.8% poverty level for males and 9.3% for females among the residents of Belchertown, 55 to 64 year old males and 65 to 74 year old females are the most vulnerable to poverty, with 100 males (34.4%) and 67 females (32.8%) in their respective age groups living below the poverty level.
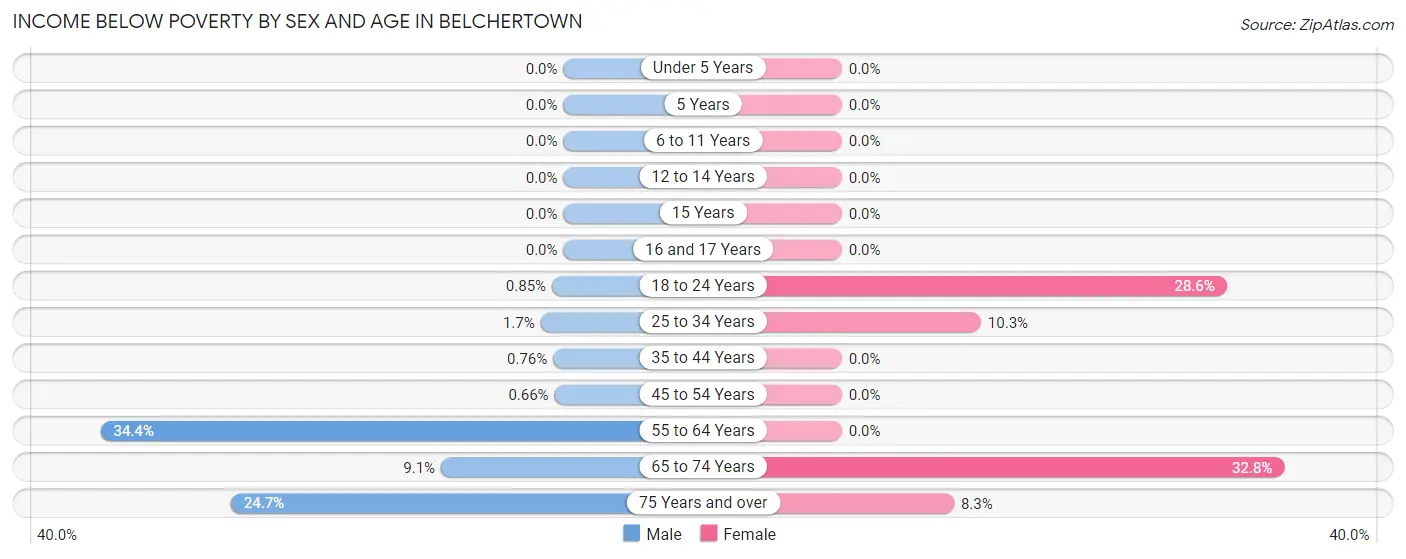
| Age Bracket | Male | Female |
| Under 5 Years | 0 (0.0%) | 0 (0.0%) |
| 5 Years | 0 (0.0%) | 0 (0.0%) |
| 6 to 11 Years | 0 (0.0%) | 0 (0.0%) |
| 12 to 14 Years | 0 (0.0%) | 0 (0.0%) |
| 15 Years | 0 (0.0%) | 0 (0.0%) |
| 16 and 17 Years | 0 (0.0%) | 0 (0.0%) |
| 18 to 24 Years | 1 (0.9%) | 24 (28.6%) |
| 25 to 34 Years | 2 (1.7%) | 19 (10.3%) |
| 35 to 44 Years | 1 (0.8%) | 0 (0.0%) |
| 45 to 54 Years | 1 (0.7%) | 0 (0.0%) |
| 55 to 64 Years | 100 (34.4%) | 0 (0.0%) |
| 65 to 74 Years | 12 (9.1%) | 67 (32.8%) |
| 75 Years and over | 19 (24.7%) | 19 (8.3%) |
| Total | 136 (10.8%) | 129 (9.3%) |
Income Above Poverty by Sex and Age in Belchertown
According to the poverty statistics in Belchertown, males aged under 5 years and females aged under 5 years are the age groups that are most secure financially, with 100.0% of males and 100.0% of females in these age groups living above the poverty line.
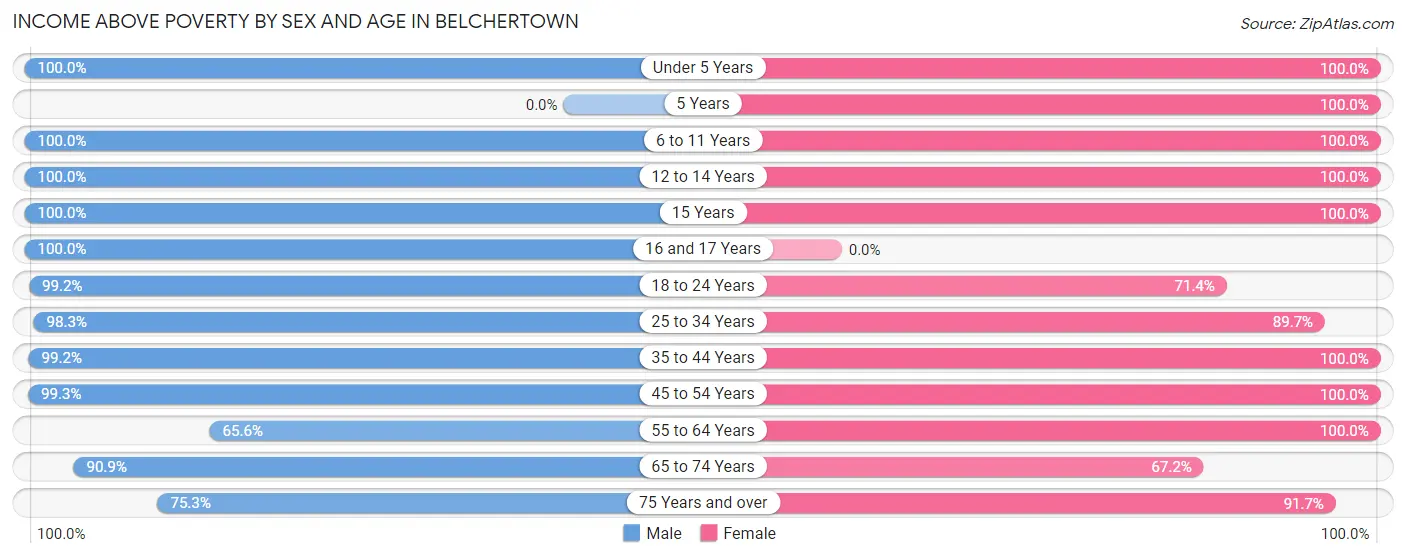
| Age Bracket | Male | Female |
| Under 5 Years | 62 (100.0%) | 74 (100.0%) |
| 5 Years | 0 (0.0%) | 14 (100.0%) |
| 6 to 11 Years | 116 (100.0%) | 58 (100.0%) |
| 12 to 14 Years | 32 (100.0%) | 19 (100.0%) |
| 15 Years | 24 (100.0%) | 14 (100.0%) |
| 16 and 17 Years | 4 (100.0%) | 0 (0.0%) |
| 18 to 24 Years | 116 (99.2%) | 60 (71.4%) |
| 25 to 34 Years | 116 (98.3%) | 165 (89.7%) |
| 35 to 44 Years | 130 (99.2%) | 214 (100.0%) |
| 45 to 54 Years | 150 (99.3%) | 118 (100.0%) |
| 55 to 64 Years | 191 (65.6%) | 182 (100.0%) |
| 65 to 74 Years | 120 (90.9%) | 137 (67.2%) |
| 75 Years and over | 58 (75.3%) | 209 (91.7%) |
| Total | 1,119 (89.2%) | 1,264 (90.7%) |
Income Below Poverty Among Married-Couple Families in Belchertown
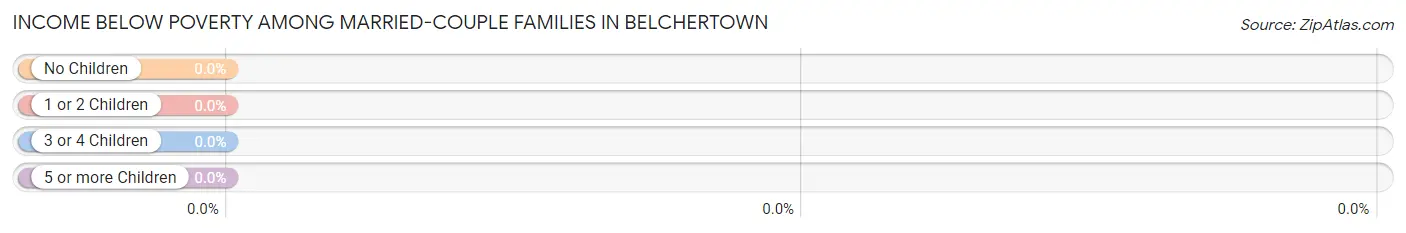
| Children | Above Poverty | Below Poverty |
| No Children | 235 (100.0%) | 0 (0.0%) |
| 1 or 2 Children | 128 (100.0%) | 0 (0.0%) |
| 3 or 4 Children | 43 (100.0%) | 0 (0.0%) |
| 5 or more Children | 0 (0.0%) | 0 (0.0%) |
| Total | 406 (100.0%) | 0 (0.0%) |
Income Below Poverty Among Single-Parent Households in Belchertown
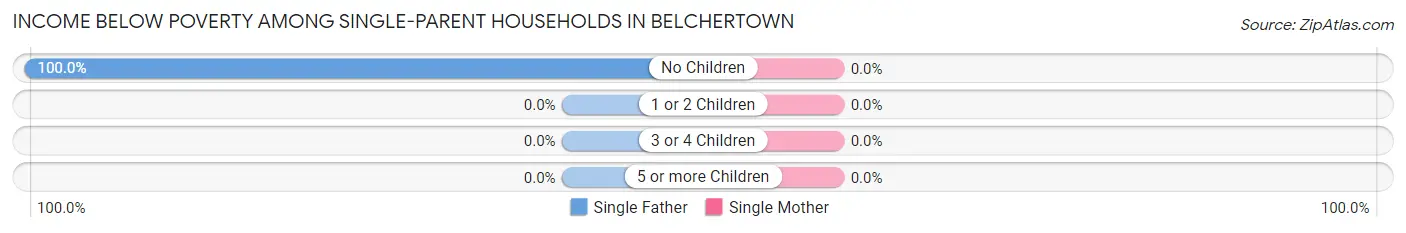
| Children | Single Father | Single Mother |
| No Children | 18 (100.0%) | 0 (0.0%) |
| 1 or 2 Children | 0 (0.0%) | 0 (0.0%) |
| 3 or 4 Children | 0 (0.0%) | 0 (0.0%) |
| 5 or more Children | 0 (0.0%) | 0 (0.0%) |
| Total | 18 (100.0%) | 0 (0.0%) |
Income Below Poverty Among Married-Couple vs Single-Parent Households in Belchertown
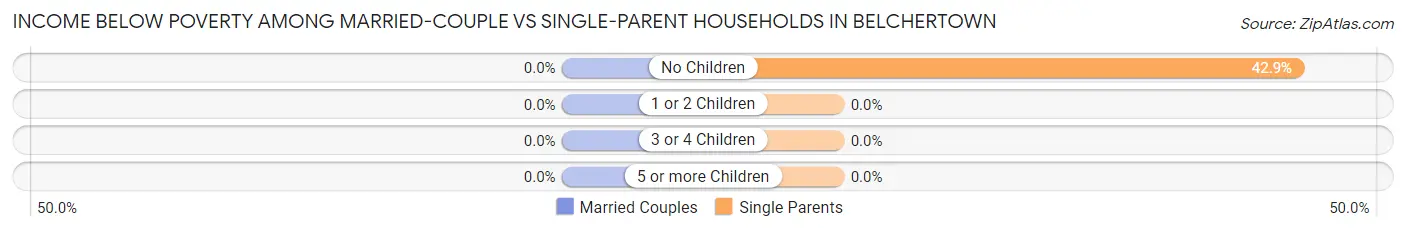
| Children | Married-Couple Families | Single-Parent Households |
| No Children | 0 (0.0%) | 18 (42.9%) |
| 1 or 2 Children | 0 (0.0%) | 0 (0.0%) |
| 3 or 4 Children | 0 (0.0%) | 0 (0.0%) |
| 5 or more Children | 0 (0.0%) | 0 (0.0%) |
| Total | 0 (0.0%) | 18 (13.6%) |
Race in Belchertown
The most populous races in Belchertown are White / Caucasian (2,489 | 94.0%), Hispanic or Latino (119 | 4.5%), and Black / African American (69 | 2.6%).
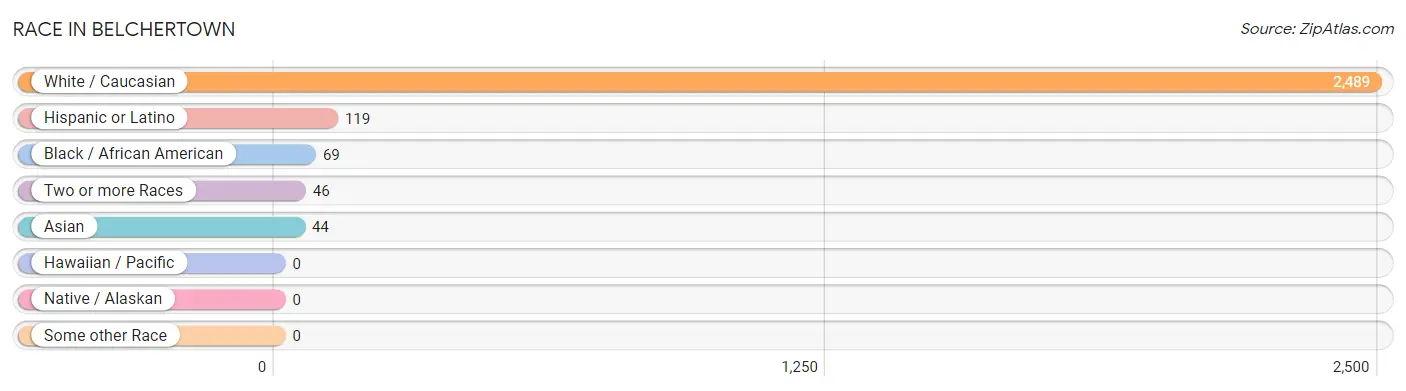
| Race | # Population | % Population |
| Asian | 44 | 1.7% |
| Black / African American | 69 | 2.6% |
| Hawaiian / Pacific | 0 | 0.0% |
| Hispanic or Latino | 119 | 4.5% |
| Native / Alaskan | 0 | 0.0% |
| White / Caucasian | 2,489 | 94.0% |
| Two or more Races | 46 | 1.7% |
| Some other Race | 0 | 0.0% |
| Total | 2,648 | 100.0% |
Ancestry in Belchertown
The most populous ancestries reported in Belchertown are Irish (472 | 17.8%), Polish (393 | 14.8%), French Canadian (318 | 12.0%), Italian (316 | 11.9%), and English (223 | 8.4%), together accounting for 65.0% of all Belchertown residents.
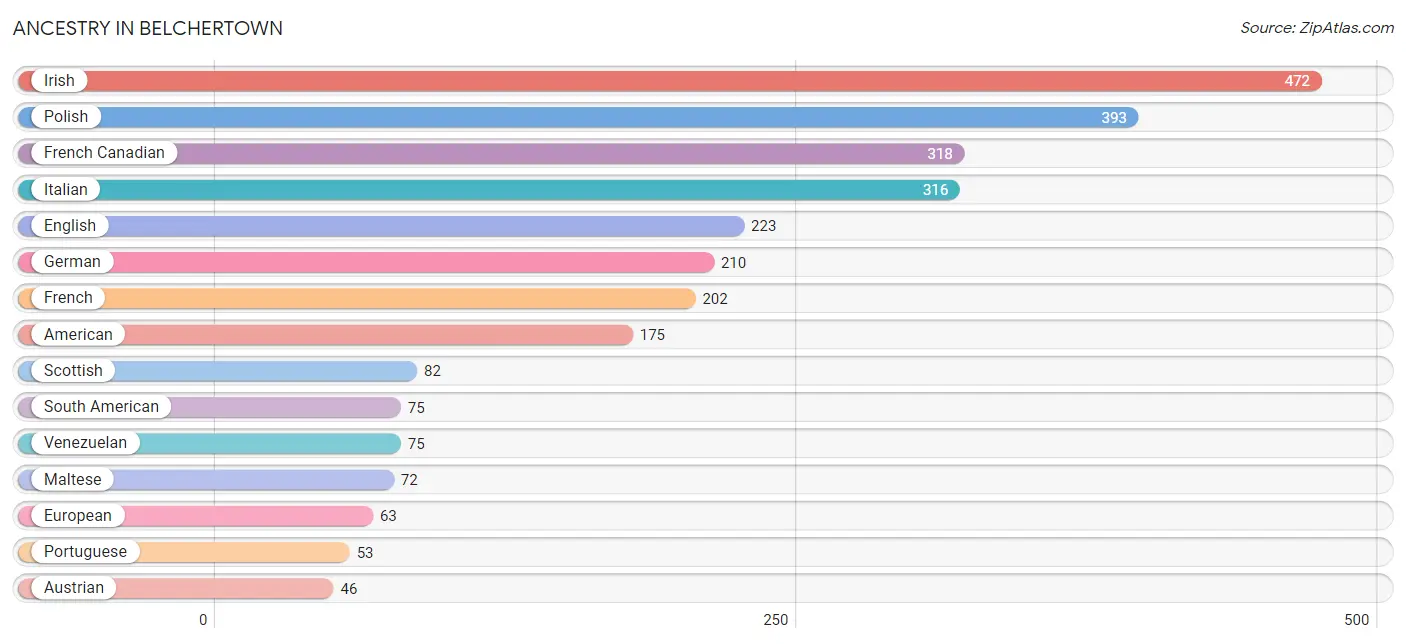
| Ancestry | # Population | % Population |
| American | 175 | 6.6% |
| Arab | 32 | 1.2% |
| Austrian | 46 | 1.7% |
| British | 12 | 0.4% |
| Burmese | 44 | 1.7% |
| Canadian | 17 | 0.6% |
| Central American | 28 | 1.1% |
| Dutch | 21 | 0.8% |
| English | 223 | 8.4% |
| European | 63 | 2.4% |
| Finnish | 19 | 0.7% |
| French | 202 | 7.6% |
| French Canadian | 318 | 12.0% |
| German | 210 | 7.9% |
| Greek | 39 | 1.5% |
| Irish | 472 | 17.8% |
| Iroquois | 27 | 1.0% |
| Italian | 316 | 11.9% |
| Lebanese | 32 | 1.2% |
| Maltese | 72 | 2.7% |
| Mexican | 16 | 0.6% |
| Native Hawaiian | 15 | 0.6% |
| Norwegian | 22 | 0.8% |
| Polish | 393 | 14.8% |
| Portuguese | 53 | 2.0% |
| Russian | 29 | 1.1% |
| Salvadoran | 28 | 1.1% |
| Scotch-Irish | 46 | 1.7% |
| Scottish | 82 | 3.1% |
| Slovene | 20 | 0.8% |
| South American | 75 | 2.8% |
| Swedish | 20 | 0.8% |
| Turkish | 13 | 0.5% |
| Venezuelan | 75 | 2.8% | View All 34 Rows |
Immigrants in Belchertown
The most numerous immigrant groups reported in Belchertown came from Latin America (91 | 3.4%), South America (75 | 2.8%), Venezuela (75 | 2.8%), Asia (44 | 1.7%), and Eastern Asia (44 | 1.7%), together accounting for 12.4% of all Belchertown residents.
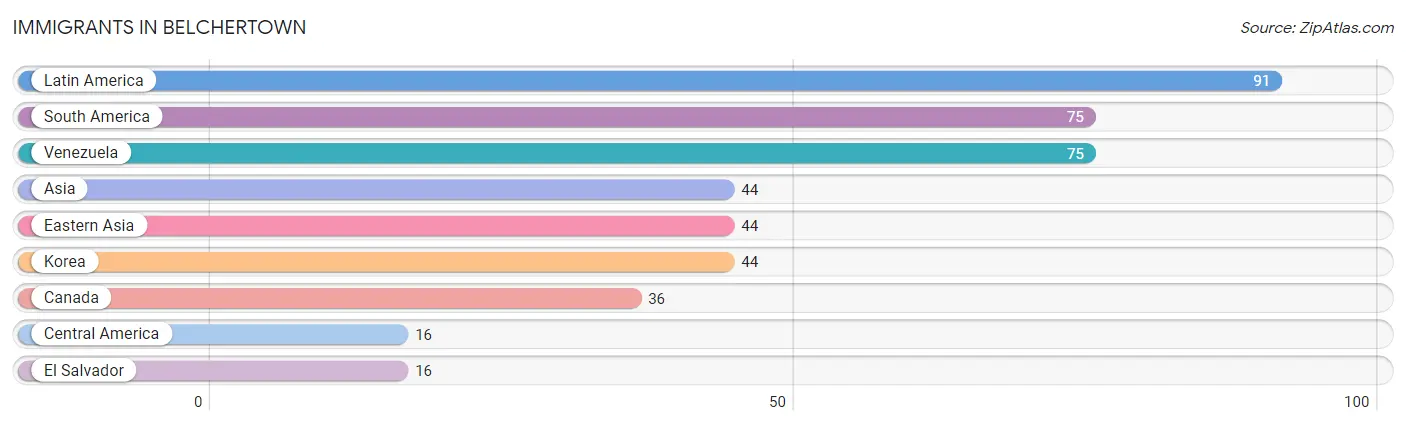
| Immigration Origin | # Population | % Population |
| Asia | 44 | 1.7% |
| Canada | 36 | 1.4% |
| Central America | 16 | 0.6% |
| Eastern Asia | 44 | 1.7% |
| El Salvador | 16 | 0.6% |
| Korea | 44 | 1.7% |
| Latin America | 91 | 3.4% |
| South America | 75 | 2.8% |
| Venezuela | 75 | 2.8% | View All 9 Rows |
Sex and Age in Belchertown
Sex and Age in Belchertown
The most populous age groups in Belchertown are 60 to 64 Years (218 | 17.4%) for men and 85 Years and over (191 | 13.7%) for women.
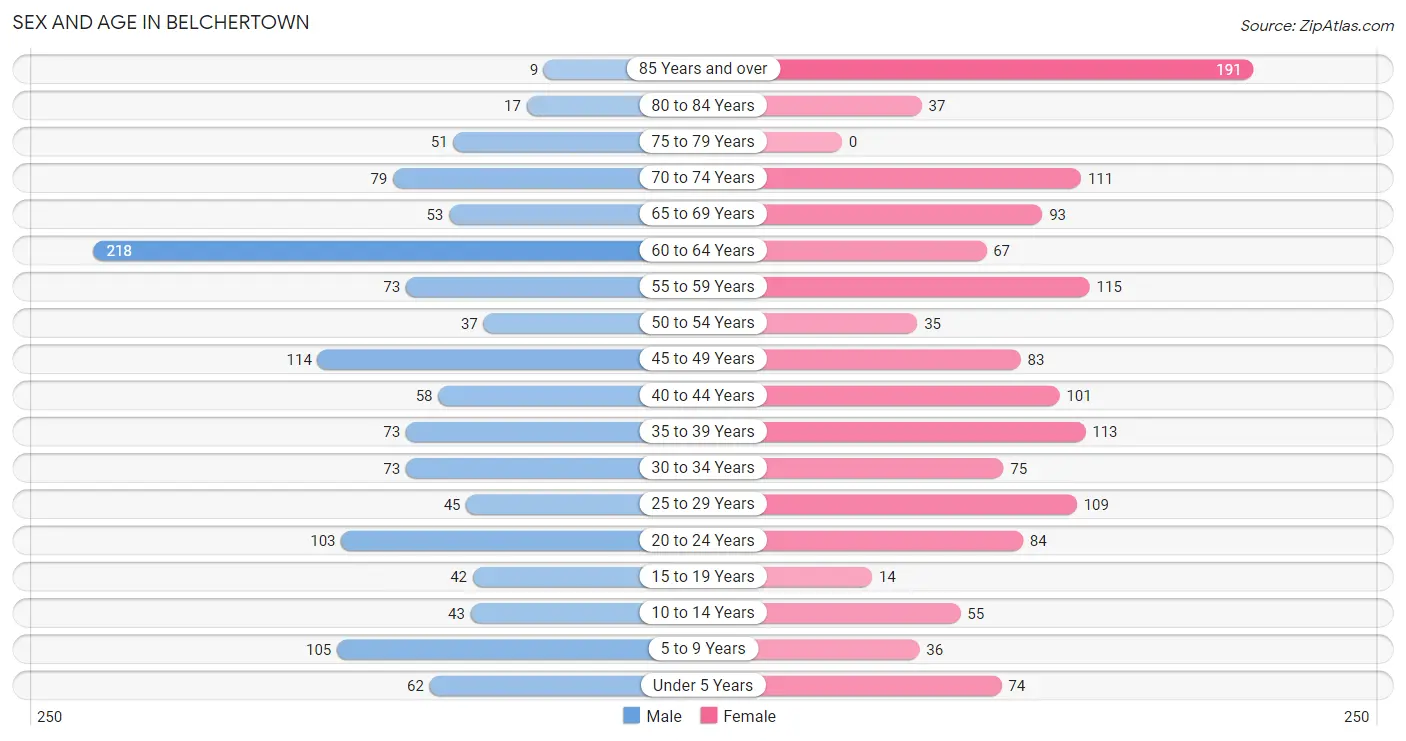
| Age Bracket | Male | Female |
| Under 5 Years | 62 (4.9%) | 74 (5.3%) |
| 5 to 9 Years | 105 (8.4%) | 36 (2.6%) |
| 10 to 14 Years | 43 (3.4%) | 55 (4.0%) |
| 15 to 19 Years | 42 (3.4%) | 14 (1.0%) |
| 20 to 24 Years | 103 (8.2%) | 84 (6.0%) |
| 25 to 29 Years | 45 (3.6%) | 109 (7.8%) |
| 30 to 34 Years | 73 (5.8%) | 75 (5.4%) |
| 35 to 39 Years | 73 (5.8%) | 113 (8.1%) |
| 40 to 44 Years | 58 (4.6%) | 101 (7.2%) |
| 45 to 49 Years | 114 (9.1%) | 83 (6.0%) |
| 50 to 54 Years | 37 (2.9%) | 35 (2.5%) |
| 55 to 59 Years | 73 (5.8%) | 115 (8.3%) |
| 60 to 64 Years | 218 (17.4%) | 67 (4.8%) |
| 65 to 69 Years | 53 (4.2%) | 93 (6.7%) |
| 70 to 74 Years | 79 (6.3%) | 111 (8.0%) |
| 75 to 79 Years | 51 (4.1%) | 0 (0.0%) |
| 80 to 84 Years | 17 (1.3%) | 37 (2.7%) |
| 85 Years and over | 9 (0.7%) | 191 (13.7%) |
| Total | 1,255 (100.0%) | 1,393 (100.0%) |
Families and Households in Belchertown
Median Family Size in Belchertown
The median family size in Belchertown is 2.88 persons per family, with married-couple families (406 | 75.5%) accounting for the largest median family size of 3.04 persons per family. On the other hand, single male/father families (18 | 3.4%) represent the smallest median family size with 1.78 persons per family.
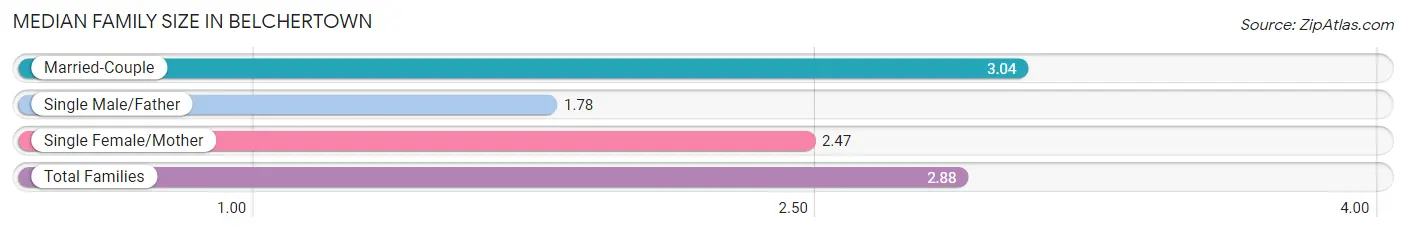
| Family Type | # Families | Family Size |
| Married-Couple | 406 (75.5%) | 3.04 |
| Single Male/Father | 18 (3.4%) | 1.78 |
| Single Female/Mother | 114 (21.2%) | 2.47 |
| Total Families | 538 (100.0%) | 2.88 |
Median Household Size in Belchertown
The median household size in Belchertown is 1.94 persons per household, with married-couple households (406 | 29.8%) accounting for the largest median household size of 3.04 persons per household. non-family households (824 | 60.5%) represent the smallest median household size with 1.26 persons per household.
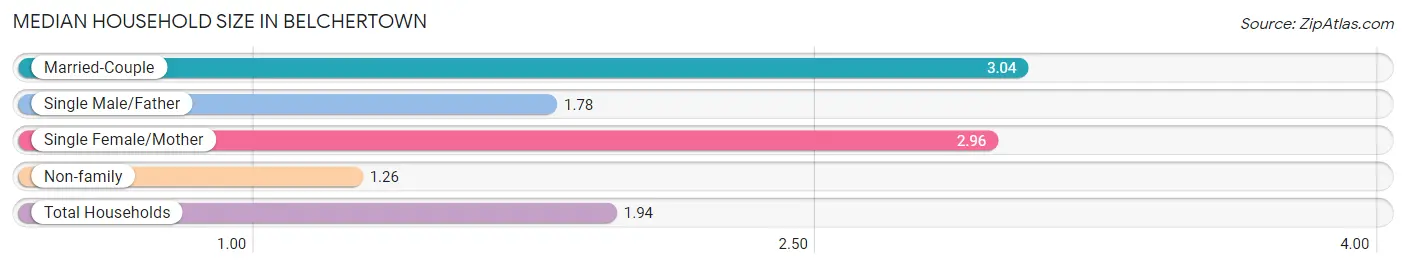
| Household Type | # Households | Household Size |
| Married-Couple | 406 (29.8%) | 3.04 |
| Single Male/Father | 18 (1.3%) | 1.78 |
| Single Female/Mother | 114 (8.4%) | 2.96 |
| Non-family | 824 (60.5%) | 1.26 |
| Total Households | 1,362 (100.0%) | 1.94 |
Household Size by Marriage Status in Belchertown
Out of a total of 1,362 households in Belchertown, 538 (39.5%) are family households, while 824 (60.5%) are nonfamily households. The most numerous type of family households are 2-person households, comprising 202, and the most common type of nonfamily households are 1-person households, comprising 631.
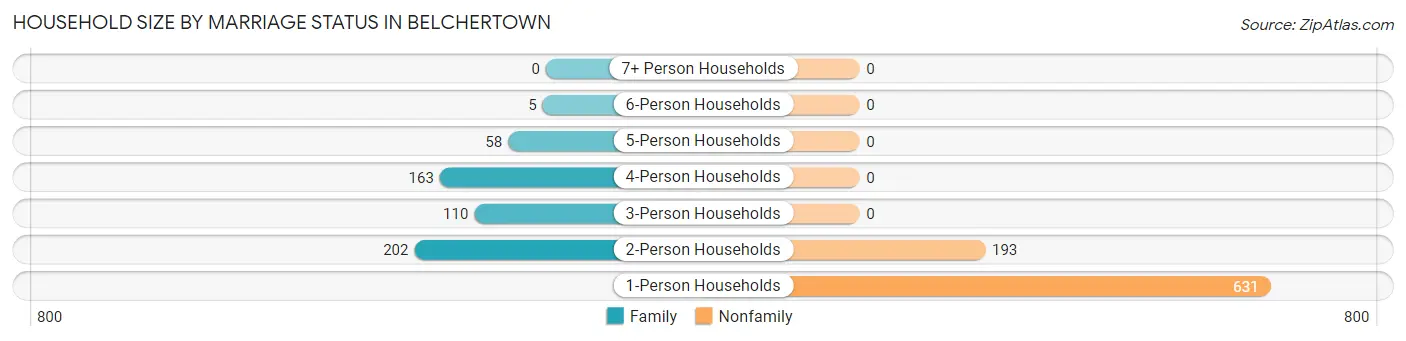
| Household Size | Family Households | Nonfamily Households |
| 1-Person Households | - | 631 (46.3%) |
| 2-Person Households | 202 (14.8%) | 193 (14.2%) |
| 3-Person Households | 110 (8.1%) | 0 (0.0%) |
| 4-Person Households | 163 (12.0%) | 0 (0.0%) |
| 5-Person Households | 58 (4.3%) | 0 (0.0%) |
| 6-Person Households | 5 (0.4%) | 0 (0.0%) |
| 7+ Person Households | 0 (0.0%) | 0 (0.0%) |
| Total | 538 (39.5%) | 824 (60.5%) |
Female Fertility in Belchertown
Fertility by Age in Belchertown
Average fertility rate in Belchertown is 48.0 births per 1,000 women. Women in the age bracket of 35 to 50 years have the highest fertility rate with 94.0 births per 1,000 women. Women in the age bracket of 35 to 50 years acount for 100.0% of all women with births.
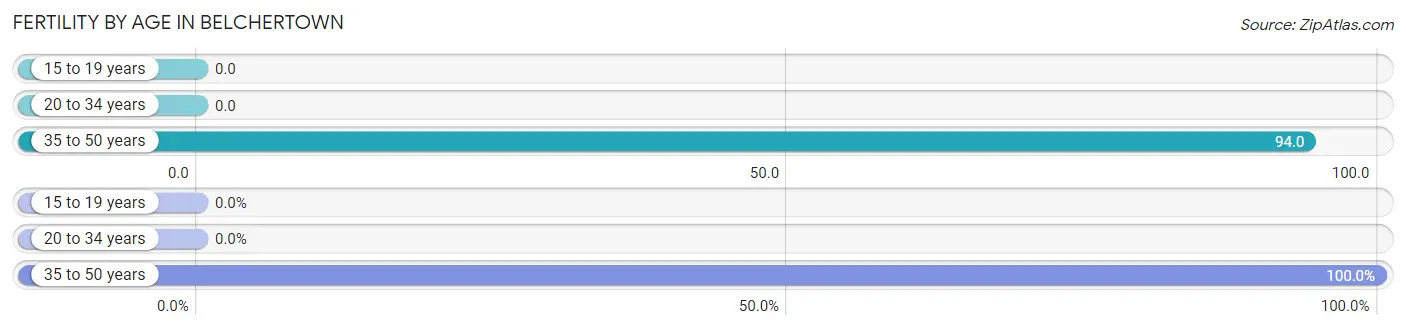
| Age Bracket | Women with Births | Births / 1,000 Women |
| 15 to 19 years | 0 (0.0%) | 0.0 |
| 20 to 34 years | 0 (0.0%) | 0.0 |
| 35 to 50 years | 28 (100.0%) | 94.0 |
| Total | 28 (100.0%) | 48.0 |
Fertility by Age by Marriage Status in Belchertown
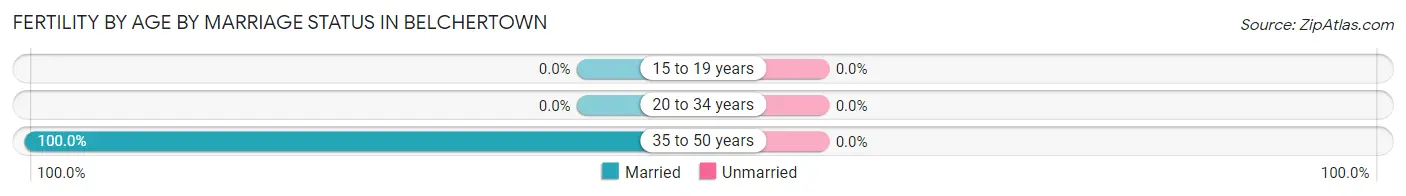
| Age Bracket | Married | Unmarried |
| 15 to 19 years | 0 (0.0%) | 0 (0.0%) |
| 20 to 34 years | 0 (0.0%) | 0 (0.0%) |
| 35 to 50 years | 28 (100.0%) | 0 (0.0%) |
| Total | 28 (100.0%) | 0 (0.0%) |
Fertility by Education in Belchertown
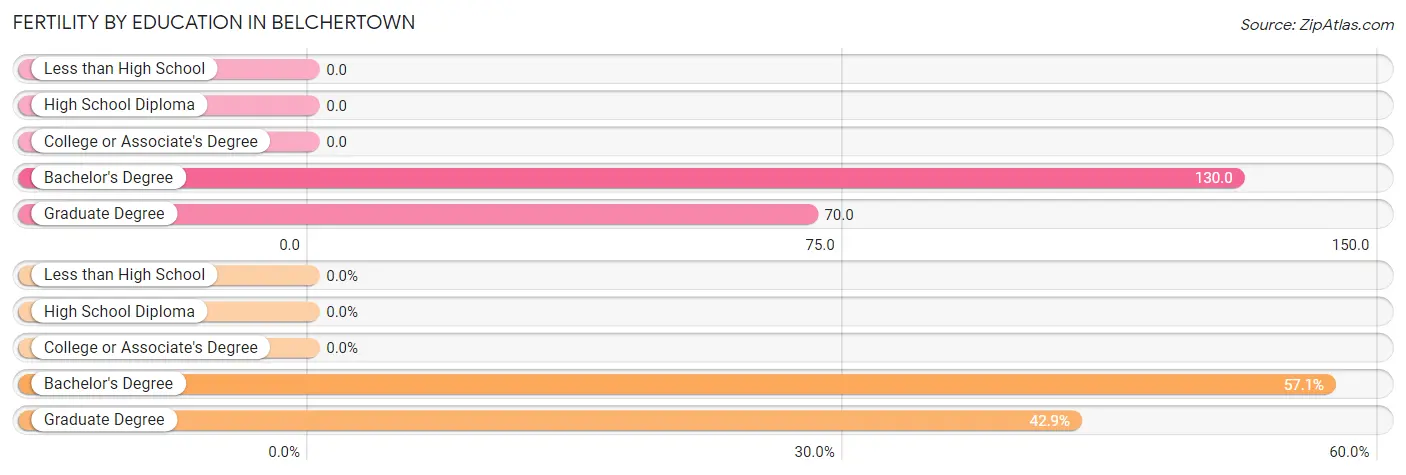
| Educational Attainment | Women with Births | Births / 1,000 Women |
| Less than High School | 0 (0.0%) | 0.0 |
| High School Diploma | 0 (0.0%) | 0.0 |
| College or Associate's Degree | 0 (0.0%) | 0.0 |
| Bachelor's Degree | 16 (57.1%) | 130.0 |
| Graduate Degree | 12 (42.9%) | 70.0 |
| Total | 28 (100.0%) | 48.0 |
Fertility by Education by Marriage Status in Belchertown
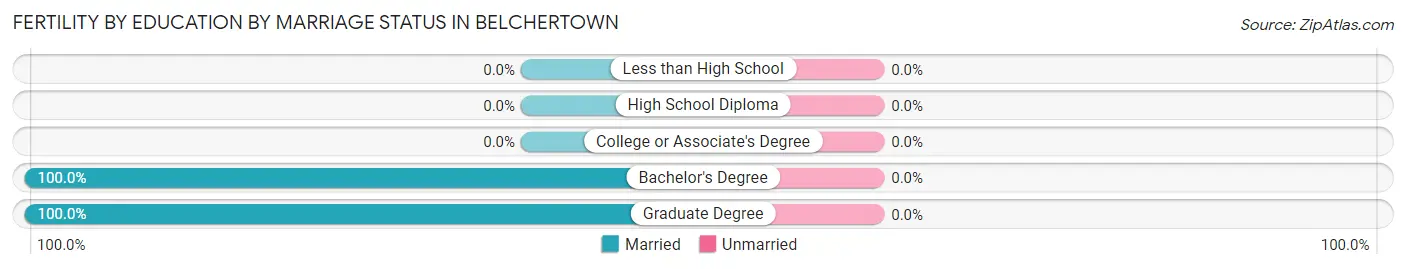
| Educational Attainment | Married | Unmarried |
| Less than High School | 0 (0.0%) | 0 (0.0%) |
| High School Diploma | 0 (0.0%) | 0 (0.0%) |
| College or Associate's Degree | 0 (0.0%) | 0 (0.0%) |
| Bachelor's Degree | 16 (100.0%) | 0 (0.0%) |
| Graduate Degree | 12 (100.0%) | 0 (0.0%) |
| Total | 28 (100.0%) | 0 (0.0%) |
Employment Characteristics in Belchertown
Employment by Class of Employer in Belchertown
Among the 1,415 employed individuals in Belchertown, private company employees (883 | 62.4%), not-for-profit organizations (204 | 14.4%), and local government employees (109 | 7.7%) make up the most common classes of employment.
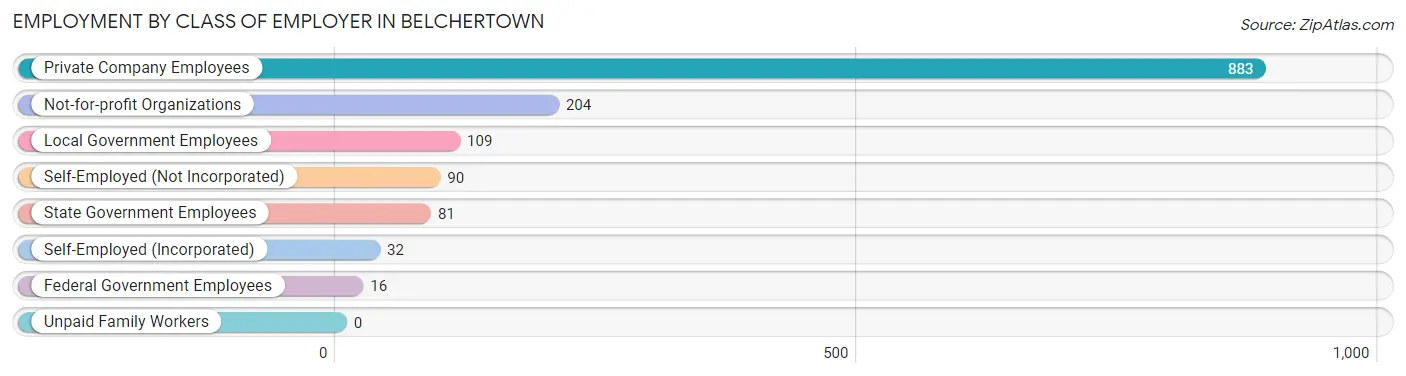
| Employer Class | # Employees | % Employees |
| Private Company Employees | 883 | 62.4% |
| Self-Employed (Incorporated) | 32 | 2.3% |
| Self-Employed (Not Incorporated) | 90 | 6.4% |
| Not-for-profit Organizations | 204 | 14.4% |
| Local Government Employees | 109 | 7.7% |
| State Government Employees | 81 | 5.7% |
| Federal Government Employees | 16 | 1.1% |
| Unpaid Family Workers | 0 | 0.0% |
| Total | 1,415 | 100.0% |
Employment Status by Age in Belchertown
According to the labor force statistics for Belchertown, out of the total population over 16 years of age (2,235), 64.6% or 1,444 individuals are in the labor force, with 0.9% or 13 of them unemployed. The age group with the highest labor force participation rate is 20 to 24 years, with 99.5% or 186 individuals in the labor force. Within the labor force, the 16 to 19 years age range has the highest percentage of unemployed individuals, with 92.9% or 13 of them being unemployed.
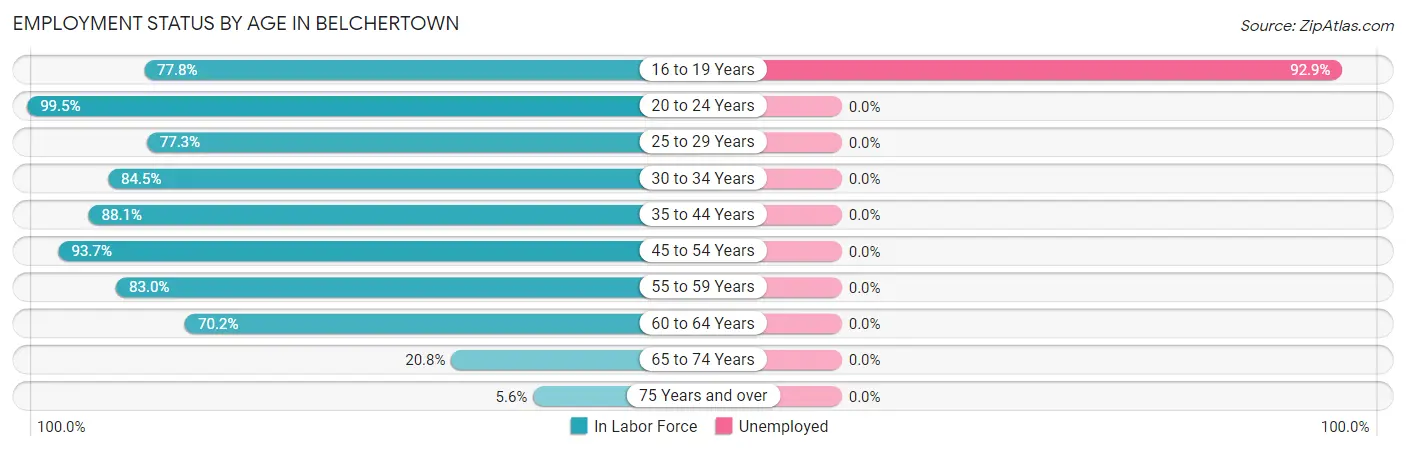
| Age Bracket | In Labor Force | Unemployed |
| 16 to 19 Years | 14 (77.8%) | 13 (92.9%) |
| 20 to 24 Years | 186 (99.5%) | 0 (0.0%) |
| 25 to 29 Years | 119 (77.3%) | 0 (0.0%) |
| 30 to 34 Years | 125 (84.5%) | 0 (0.0%) |
| 35 to 44 Years | 304 (88.1%) | 0 (0.0%) |
| 45 to 54 Years | 252 (93.7%) | 0 (0.0%) |
| 55 to 59 Years | 156 (83.0%) | 0 (0.0%) |
| 60 to 64 Years | 200 (70.2%) | 0 (0.0%) |
| 65 to 74 Years | 70 (20.8%) | 0 (0.0%) |
| 75 Years and over | 17 (5.6%) | 0 (0.0%) |
| Total | 1,444 (64.6%) | 13 (0.9%) |
Employment Status by Educational Attainment in Belchertown
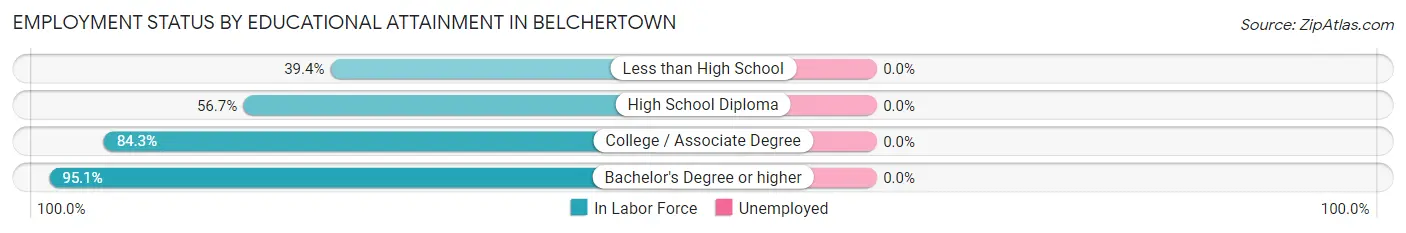
| Educational Attainment | In Labor Force | Unemployed |
| Less than High School | 13 (39.4%) | 0 (0.0%) |
| High School Diploma | 156 (56.7%) | 0 (0.0%) |
| College / Associate Degree | 323 (84.3%) | 0 (0.0%) |
| Bachelor's Degree or higher | 664 (95.1%) | 0 (0.0%) |
| Total | 1,156 (83.2%) | 0 (0.0%) |
Employment Occupations by Sex in Belchertown
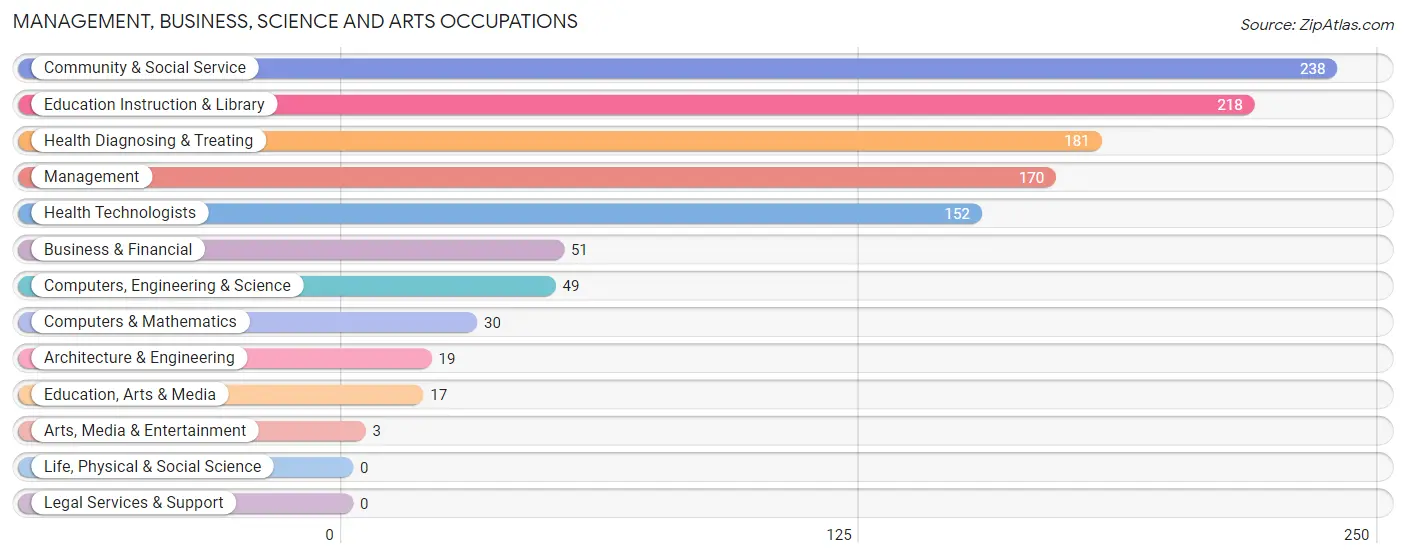
Management, Business, Science and Arts Occupations
The most common Management, Business, Science and Arts occupations in Belchertown are Community & Social Service (238 | 16.6%), Education Instruction & Library (218 | 15.2%), Health Diagnosing & Treating (181 | 12.7%), Management (170 | 11.9%), and Health Technologists (152 | 10.6%).
Management, Business, Science and Arts Occupations by Sex
Within the Management, Business, Science and Arts occupations in Belchertown, the most male-oriented occupations are Computers, Engineering & Science (100.0%), Computers & Mathematics (100.0%), and Architecture & Engineering (100.0%), while the most female-oriented occupations are Arts, Media & Entertainment (100.0%), Health Diagnosing & Treating (100.0%), and Health Technologists (100.0%).
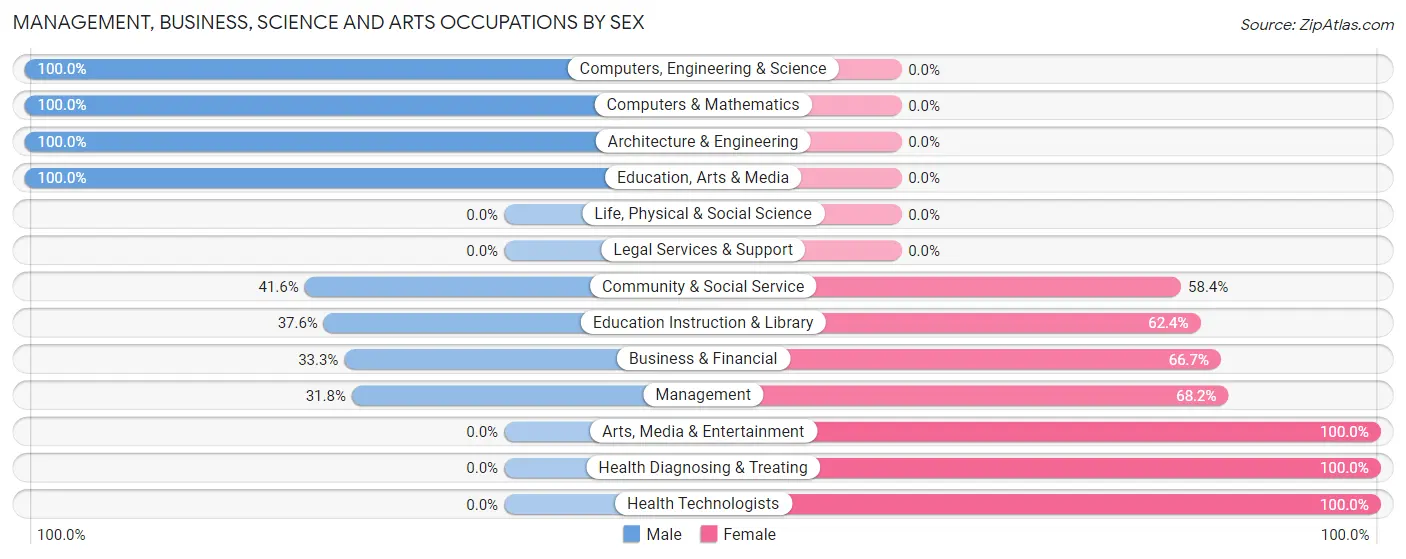
| Occupation | Male | Female |
| Management | 54 (31.8%) | 116 (68.2%) |
| Business & Financial | 17 (33.3%) | 34 (66.7%) |
| Computers, Engineering & Science | 49 (100.0%) | 0 (0.0%) |
| Computers & Mathematics | 30 (100.0%) | 0 (0.0%) |
| Architecture & Engineering | 19 (100.0%) | 0 (0.0%) |
| Life, Physical & Social Science | 0 (0.0%) | 0 (0.0%) |
| Community & Social Service | 99 (41.6%) | 139 (58.4%) |
| Education, Arts & Media | 17 (100.0%) | 0 (0.0%) |
| Legal Services & Support | 0 (0.0%) | 0 (0.0%) |
| Education Instruction & Library | 82 (37.6%) | 136 (62.4%) |
| Arts, Media & Entertainment | 0 (0.0%) | 3 (100.0%) |
| Health Diagnosing & Treating | 0 (0.0%) | 181 (100.0%) |
| Health Technologists | 0 (0.0%) | 152 (100.0%) |
| Total (Category) | 219 (31.8%) | 470 (68.2%) |
| Total (Overall) | 727 (50.8%) | 703 (49.2%) |
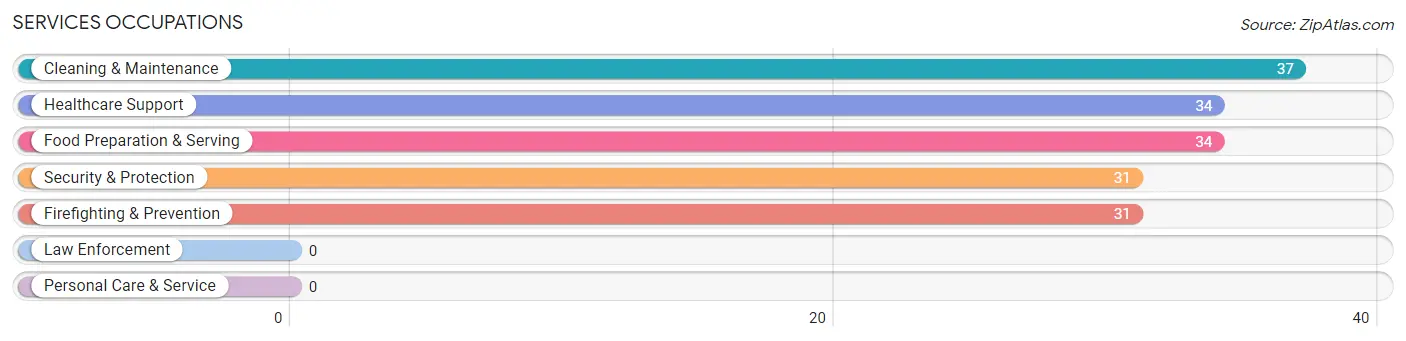
Services Occupations
The most common Services occupations in Belchertown are Cleaning & Maintenance (37 | 2.6%), Healthcare Support (34 | 2.4%), Food Preparation & Serving (34 | 2.4%), Security & Protection (31 | 2.2%), and Firefighting & Prevention (31 | 2.2%).
Services Occupations by Sex
Within the Services occupations in Belchertown, the most male-oriented occupations are Security & Protection (100.0%), Firefighting & Prevention (100.0%), and Cleaning & Maintenance (100.0%), while the most female-oriented occupations are Healthcare Support (100.0%), and Food Preparation & Serving (100.0%).
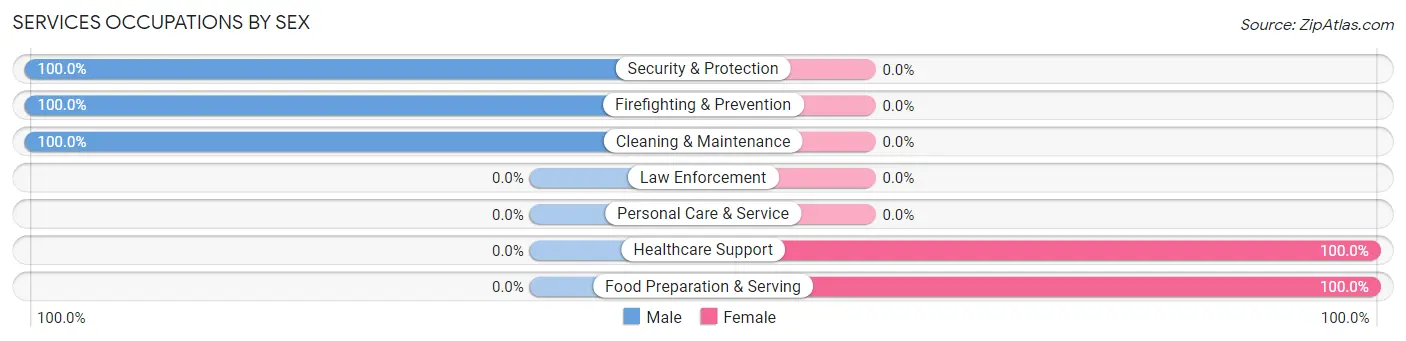
| Occupation | Male | Female |
| Healthcare Support | 0 (0.0%) | 34 (100.0%) |
| Security & Protection | 31 (100.0%) | 0 (0.0%) |
| Firefighting & Prevention | 31 (100.0%) | 0 (0.0%) |
| Law Enforcement | 0 (0.0%) | 0 (0.0%) |
| Food Preparation & Serving | 0 (0.0%) | 34 (100.0%) |
| Cleaning & Maintenance | 37 (100.0%) | 0 (0.0%) |
| Personal Care & Service | 0 (0.0%) | 0 (0.0%) |
| Total (Category) | 68 (50.0%) | 68 (50.0%) |
| Total (Overall) | 727 (50.8%) | 703 (49.2%) |
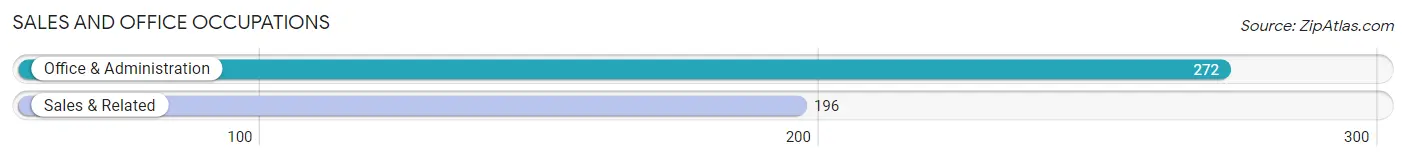
Sales and Office Occupations
The most common Sales and Office occupations in Belchertown are Office & Administration (272 | 19.0%), and Sales & Related (196 | 13.7%).
Sales and Office Occupations by Sex
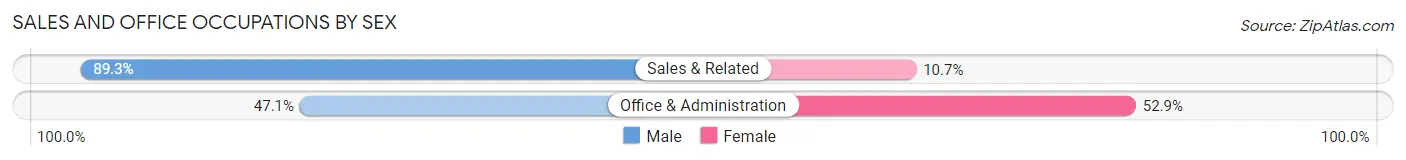
| Occupation | Male | Female |
| Sales & Related | 175 (89.3%) | 21 (10.7%) |
| Office & Administration | 128 (47.1%) | 144 (52.9%) |
| Total (Category) | 303 (64.7%) | 165 (35.3%) |
| Total (Overall) | 727 (50.8%) | 703 (49.2%) |
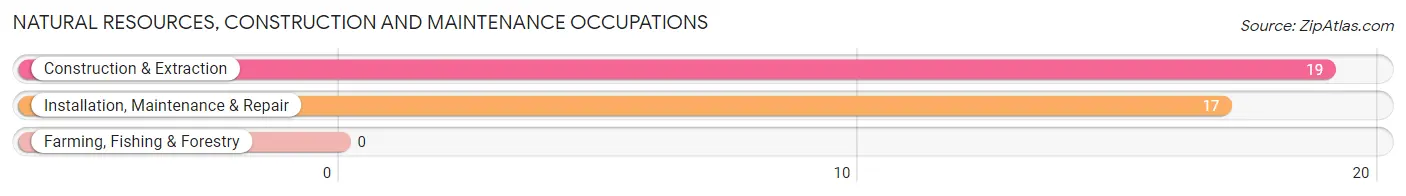
Natural Resources, Construction and Maintenance Occupations
The most common Natural Resources, Construction and Maintenance occupations in Belchertown are Construction & Extraction (19 | 1.3%), and Installation, Maintenance & Repair (17 | 1.2%).
Natural Resources, Construction and Maintenance Occupations by Sex
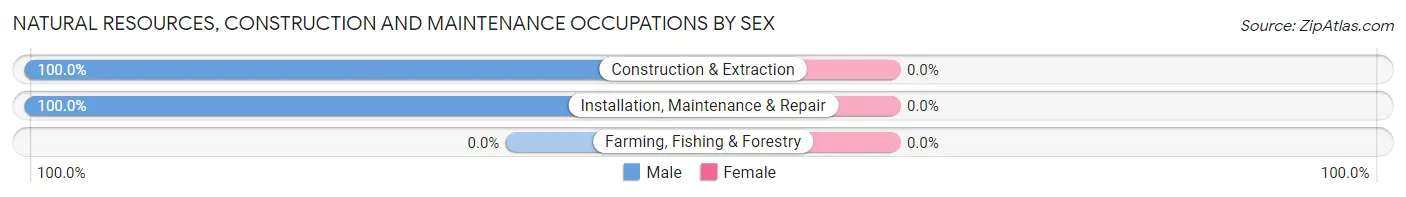
| Occupation | Male | Female |
| Farming, Fishing & Forestry | 0 (0.0%) | 0 (0.0%) |
| Construction & Extraction | 19 (100.0%) | 0 (0.0%) |
| Installation, Maintenance & Repair | 17 (100.0%) | 0 (0.0%) |
| Total (Category) | 36 (100.0%) | 0 (0.0%) |
| Total (Overall) | 727 (50.8%) | 703 (49.2%) |
Production, Transportation and Moving Occupations
The most common Production, Transportation and Moving occupations in Belchertown are Production (78 | 5.4%), and Material Moving (23 | 1.6%).
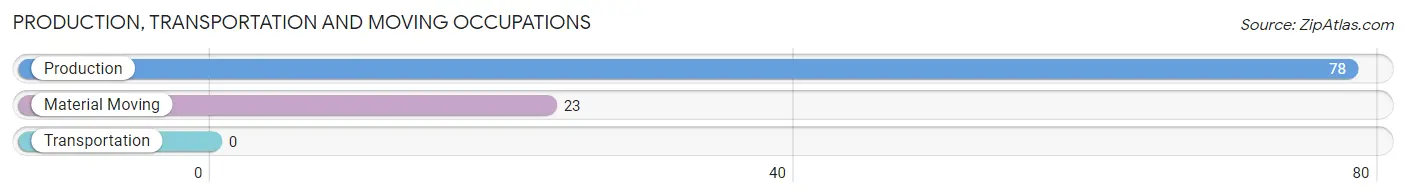
Production, Transportation and Moving Occupations by Sex
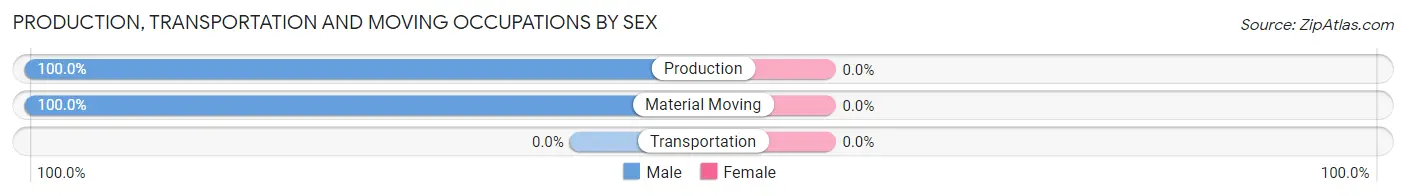
| Occupation | Male | Female |
| Production | 78 (100.0%) | 0 (0.0%) |
| Transportation | 0 (0.0%) | 0 (0.0%) |
| Material Moving | 23 (100.0%) | 0 (0.0%) |
| Total (Category) | 101 (100.0%) | 0 (0.0%) |
| Total (Overall) | 727 (50.8%) | 703 (49.2%) |
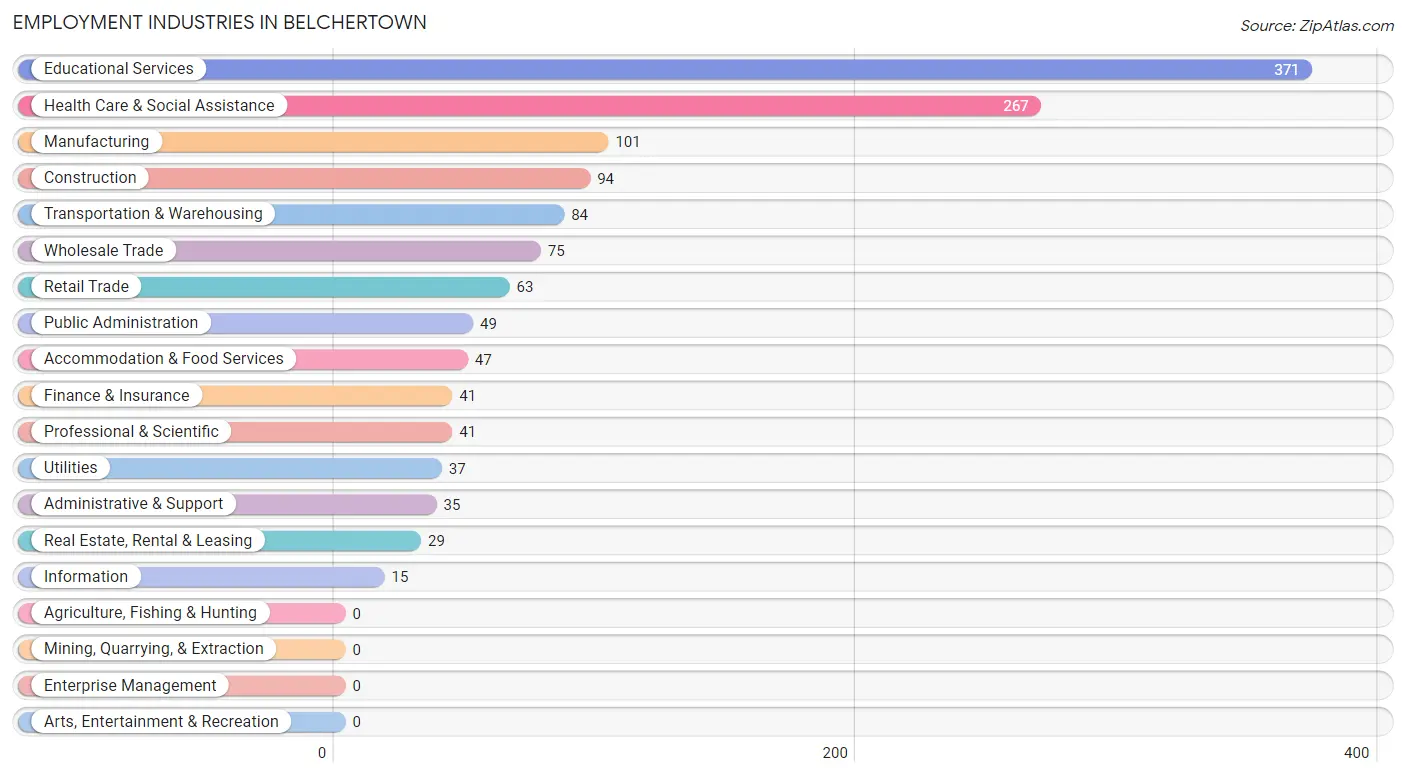
Employment Industries by Sex in Belchertown
Employment Industries in Belchertown
The major employment industries in Belchertown include Educational Services (371 | 25.9%), Health Care & Social Assistance (267 | 18.7%), Manufacturing (101 | 7.1%), Construction (94 | 6.6%), and Transportation & Warehousing (84 | 5.9%).
Employment Industries by Sex in Belchertown
The Belchertown industries that see more men than women are Construction (100.0%), Wholesale Trade (100.0%), and Transportation & Warehousing (100.0%), whereas the industries that tend to have a higher number of women are Information (100.0%), Accommodation & Food Services (100.0%), and Health Care & Social Assistance (93.6%).
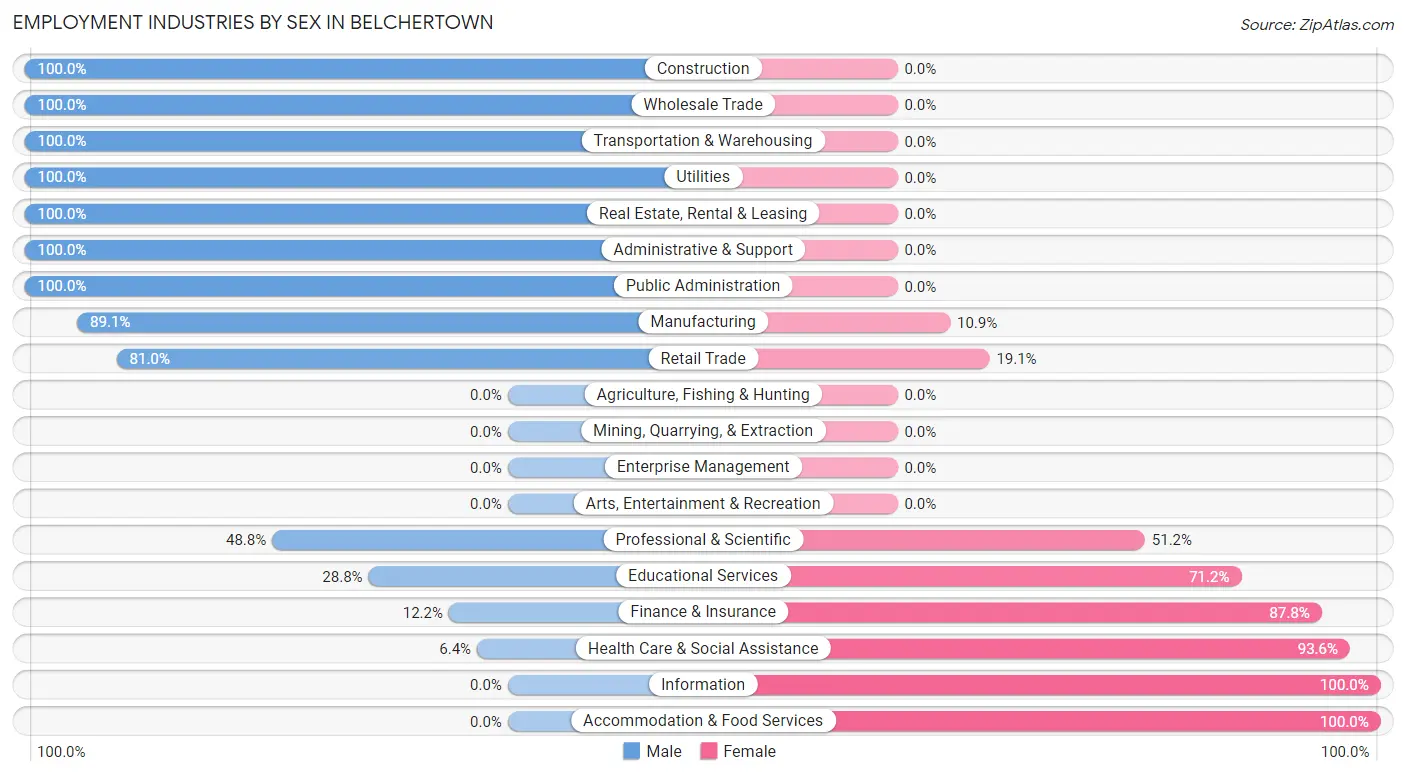
| Industry | Male | Female |
| Agriculture, Fishing & Hunting | 0 (0.0%) | 0 (0.0%) |
| Mining, Quarrying, & Extraction | 0 (0.0%) | 0 (0.0%) |
| Construction | 94 (100.0%) | 0 (0.0%) |
| Manufacturing | 90 (89.1%) | 11 (10.9%) |
| Wholesale Trade | 75 (100.0%) | 0 (0.0%) |
| Retail Trade | 51 (80.9%) | 12 (19.1%) |
| Transportation & Warehousing | 84 (100.0%) | 0 (0.0%) |
| Utilities | 37 (100.0%) | 0 (0.0%) |
| Information | 0 (0.0%) | 15 (100.0%) |
| Finance & Insurance | 5 (12.2%) | 36 (87.8%) |
| Real Estate, Rental & Leasing | 29 (100.0%) | 0 (0.0%) |
| Professional & Scientific | 20 (48.8%) | 21 (51.2%) |
| Enterprise Management | 0 (0.0%) | 0 (0.0%) |
| Administrative & Support | 35 (100.0%) | 0 (0.0%) |
| Educational Services | 107 (28.8%) | 264 (71.2%) |
| Health Care & Social Assistance | 17 (6.4%) | 250 (93.6%) |
| Arts, Entertainment & Recreation | 0 (0.0%) | 0 (0.0%) |
| Accommodation & Food Services | 0 (0.0%) | 47 (100.0%) |
| Public Administration | 49 (100.0%) | 0 (0.0%) |
| Total | 727 (50.8%) | 703 (49.2%) |
Education in Belchertown
School Enrollment in Belchertown
The most common levels of schooling among the 461 students in Belchertown are elementary school (112 | 24.3%), college / undergraduate (103 | 22.3%), and middle school (94 | 20.4%).
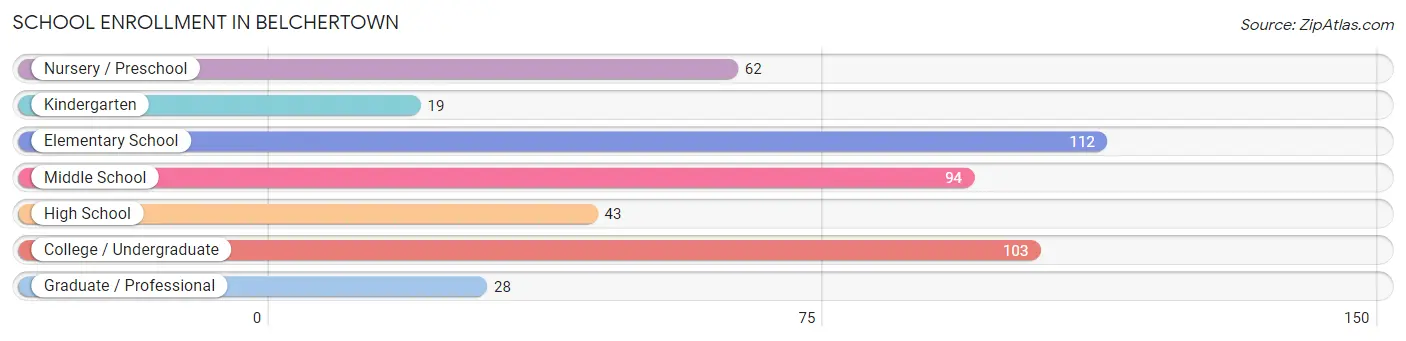
| School Level | # Students | % Students |
| Nursery / Preschool | 62 | 13.5% |
| Kindergarten | 19 | 4.1% |
| Elementary School | 112 | 24.3% |
| Middle School | 94 | 20.4% |
| High School | 43 | 9.3% |
| College / Undergraduate | 103 | 22.3% |
| Graduate / Professional | 28 | 6.1% |
| Total | 461 | 100.0% |
School Enrollment by Age by Funding Source in Belchertown
Out of a total of 461 students who are enrolled in schools in Belchertown, 154 (33.4%) attend a private institution, while the remaining 307 (66.6%) are enrolled in public schools. The age group of 3 to 4 year olds has the highest likelihood of being enrolled in private schools, with 48 (100.0% in the age bracket) enrolled. Conversely, the age group of 10 to 14 year olds has the lowest likelihood of being enrolled in a private school, with 98 (100.0% in the age bracket) attending a public institution.
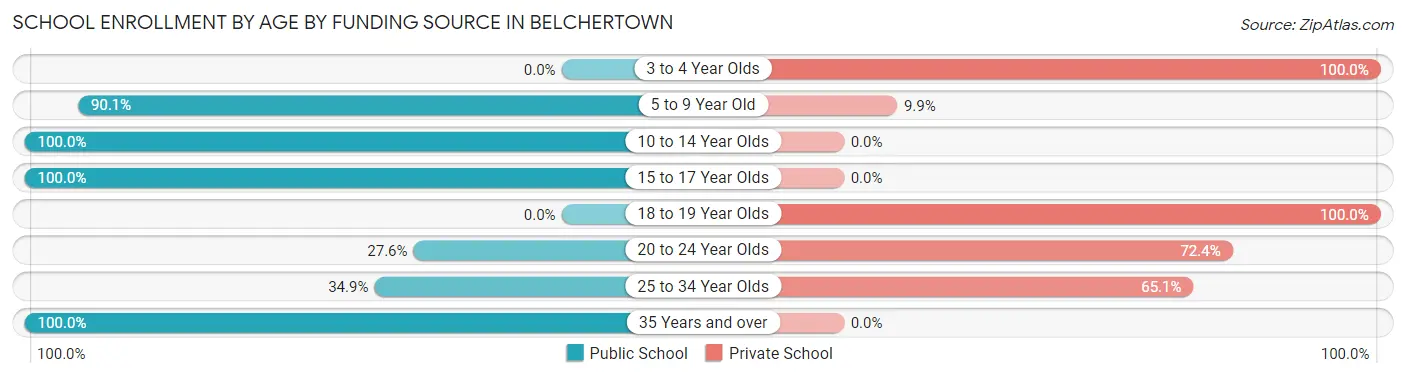
| Age Bracket | Public School | Private School |
| 3 to 4 Year Olds | 0 (0.0%) | 48 (100.0%) |
| 5 to 9 Year Old | 127 (90.1%) | 14 (9.9%) |
| 10 to 14 Year Olds | 98 (100.0%) | 0 (0.0%) |
| 15 to 17 Year Olds | 42 (100.0%) | 0 (0.0%) |
| 18 to 19 Year Olds | 0 (0.0%) | 1 (100.0%) |
| 20 to 24 Year Olds | 24 (27.6%) | 63 (72.4%) |
| 25 to 34 Year Olds | 15 (34.9%) | 28 (65.1%) |
| 35 Years and over | 1 (100.0%) | 0 (0.0%) |
| Total | 307 (66.6%) | 154 (33.4%) |
Educational Attainment by Field of Study in Belchertown
Science & technology (172 | 20.0%), business (150 | 17.4%), arts & humanities (90 | 10.5%), bio, nature & agricultural (89 | 10.3%), and visual & performing arts (79 | 9.2%) are the most common fields of study among 860 individuals in Belchertown who have obtained a bachelor's degree or higher.
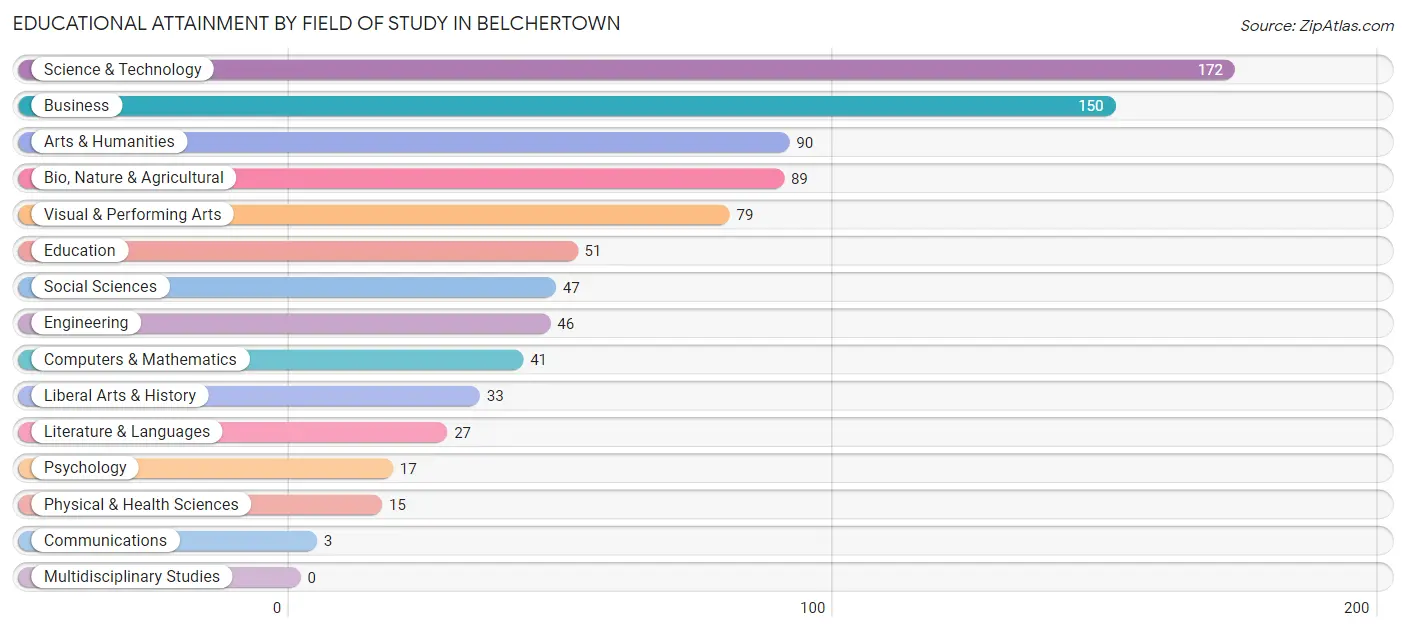
| Field of Study | # Graduates | % Graduates |
| Computers & Mathematics | 41 | 4.8% |
| Bio, Nature & Agricultural | 89 | 10.3% |
| Physical & Health Sciences | 15 | 1.7% |
| Psychology | 17 | 2.0% |
| Social Sciences | 47 | 5.5% |
| Engineering | 46 | 5.3% |
| Multidisciplinary Studies | 0 | 0.0% |
| Science & Technology | 172 | 20.0% |
| Business | 150 | 17.4% |
| Education | 51 | 5.9% |
| Literature & Languages | 27 | 3.1% |
| Liberal Arts & History | 33 | 3.8% |
| Visual & Performing Arts | 79 | 9.2% |
| Communications | 3 | 0.4% |
| Arts & Humanities | 90 | 10.5% |
| Total | 860 | 100.0% |
Transportation & Commute in Belchertown
Vehicle Availability by Sex in Belchertown
The most prevalent vehicle ownership categories in Belchertown are males with 2 vehicles (400, accounting for 55.2%) and females with 2 vehicles (422, making up 57.9%).
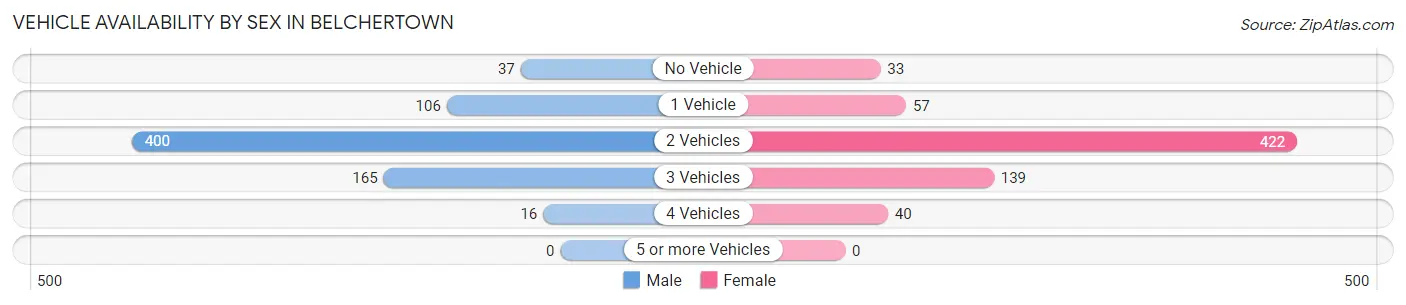
| Vehicles Available | Male | Female |
| No Vehicle | 37 (5.1%) | 33 (4.8%) |
| 1 Vehicle | 106 (14.6%) | 57 (8.3%) |
| 2 Vehicles | 400 (55.2%) | 422 (61.1%) |
| 3 Vehicles | 165 (22.8%) | 139 (20.1%) |
| 4 Vehicles | 16 (2.2%) | 40 (5.8%) |
| 5 or more Vehicles | 0 (0.0%) | 0 (0.0%) |
| Total | 724 (100.0%) | 691 (100.0%) |
Commute Time in Belchertown
The most frequently occuring commute durations in Belchertown are 15 to 19 minutes (227 commuters, 18.9%), 20 to 24 minutes (207 commuters, 17.2%), and 5 to 9 minutes (157 commuters, 13.1%).
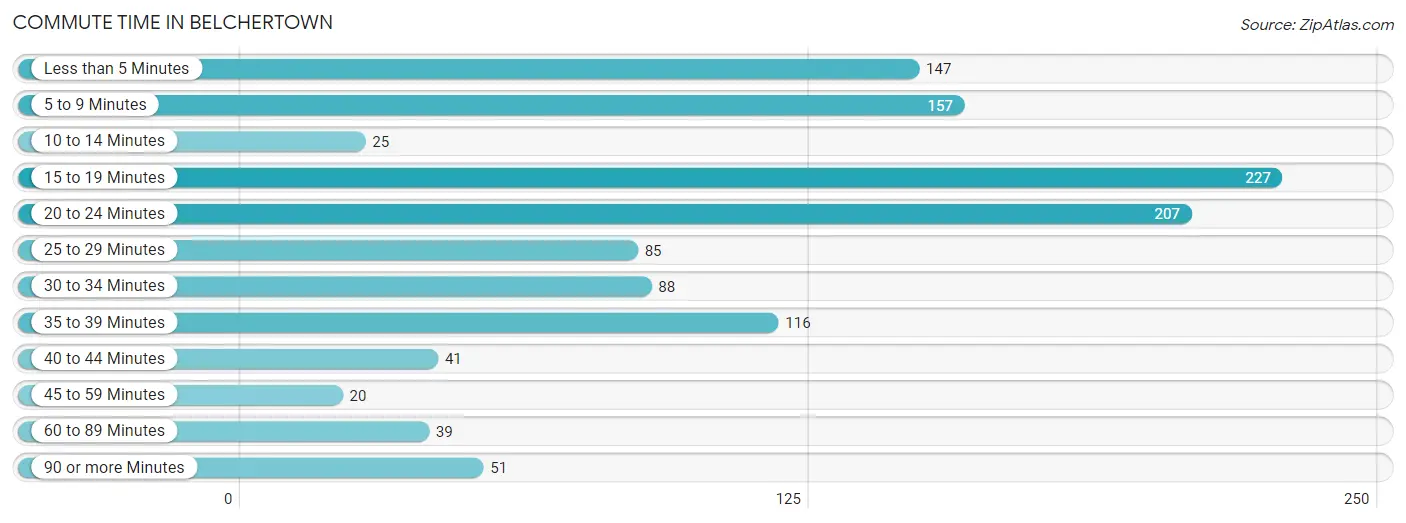
| Commute Time | # Commuters | % Commuters |
| Less than 5 Minutes | 147 | 12.2% |
| 5 to 9 Minutes | 157 | 13.1% |
| 10 to 14 Minutes | 25 | 2.1% |
| 15 to 19 Minutes | 227 | 18.9% |
| 20 to 24 Minutes | 207 | 17.2% |
| 25 to 29 Minutes | 85 | 7.1% |
| 30 to 34 Minutes | 88 | 7.3% |
| 35 to 39 Minutes | 116 | 9.6% |
| 40 to 44 Minutes | 41 | 3.4% |
| 45 to 59 Minutes | 20 | 1.7% |
| 60 to 89 Minutes | 39 | 3.2% |
| 90 or more Minutes | 51 | 4.2% |
Commute Time by Sex in Belchertown
The most common commute times in Belchertown are 20 to 24 minutes (139 commuters, 22.3%) for males and less than 5 minutes (130 commuters, 22.4%) for females.
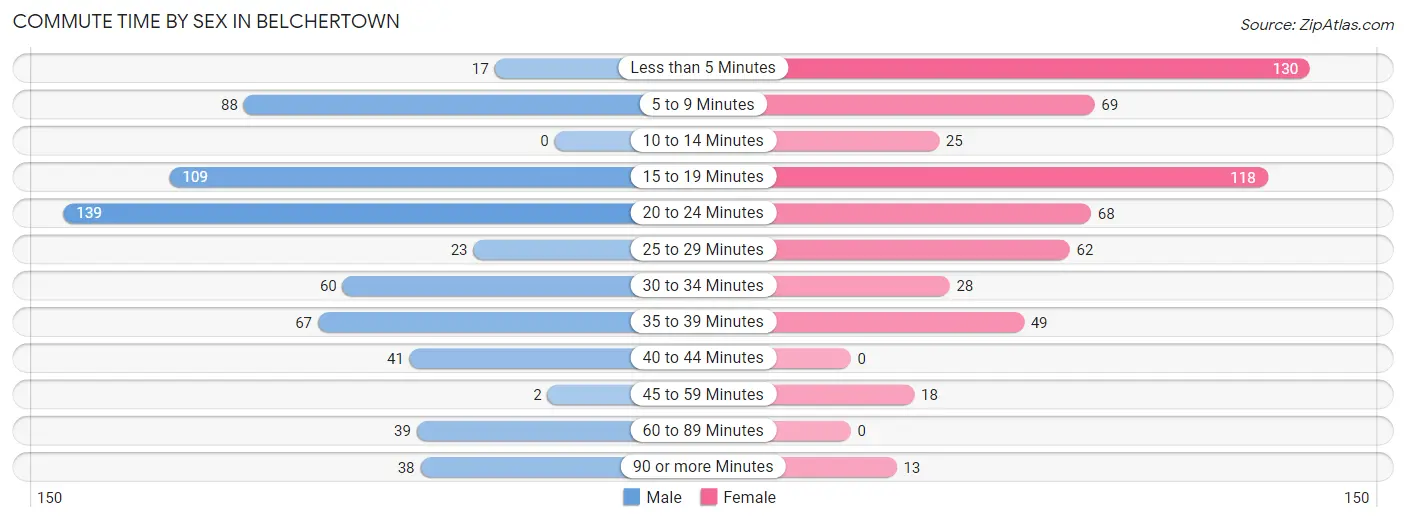
| Commute Time | Male | Female |
| Less than 5 Minutes | 17 (2.7%) | 130 (22.4%) |
| 5 to 9 Minutes | 88 (14.1%) | 69 (11.9%) |
| 10 to 14 Minutes | 0 (0.0%) | 25 (4.3%) |
| 15 to 19 Minutes | 109 (17.5%) | 118 (20.3%) |
| 20 to 24 Minutes | 139 (22.3%) | 68 (11.7%) |
| 25 to 29 Minutes | 23 (3.7%) | 62 (10.7%) |
| 30 to 34 Minutes | 60 (9.6%) | 28 (4.8%) |
| 35 to 39 Minutes | 67 (10.7%) | 49 (8.5%) |
| 40 to 44 Minutes | 41 (6.6%) | 0 (0.0%) |
| 45 to 59 Minutes | 2 (0.3%) | 18 (3.1%) |
| 60 to 89 Minutes | 39 (6.3%) | 0 (0.0%) |
| 90 or more Minutes | 38 (6.1%) | 13 (2.2%) |
Time of Departure to Work by Sex in Belchertown
The most frequent times of departure to work in Belchertown are 7:00 AM to 7:29 AM (139, 22.3%) for males and 8:30 AM to 8:59 AM (127, 21.9%) for females.
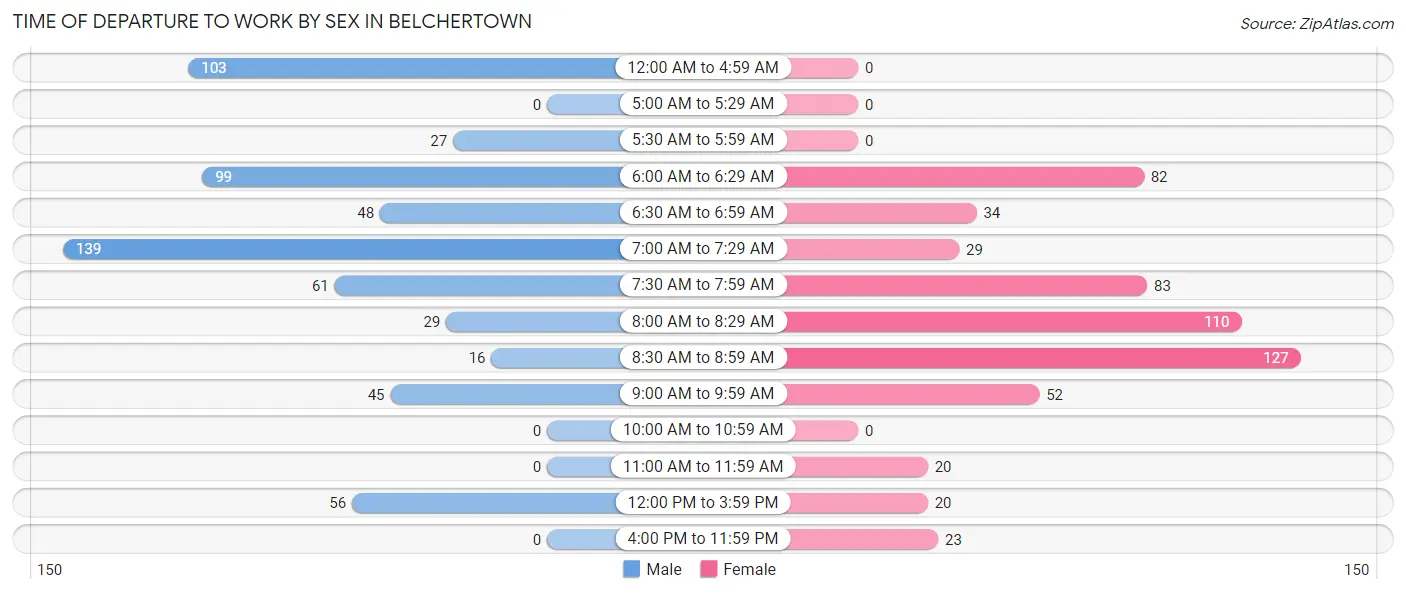
| Time of Departure | Male | Female |
| 12:00 AM to 4:59 AM | 103 (16.5%) | 0 (0.0%) |
| 5:00 AM to 5:29 AM | 0 (0.0%) | 0 (0.0%) |
| 5:30 AM to 5:59 AM | 27 (4.3%) | 0 (0.0%) |
| 6:00 AM to 6:29 AM | 99 (15.9%) | 82 (14.1%) |
| 6:30 AM to 6:59 AM | 48 (7.7%) | 34 (5.9%) |
| 7:00 AM to 7:29 AM | 139 (22.3%) | 29 (5.0%) |
| 7:30 AM to 7:59 AM | 61 (9.8%) | 83 (14.3%) |
| 8:00 AM to 8:29 AM | 29 (4.6%) | 110 (19.0%) |
| 8:30 AM to 8:59 AM | 16 (2.6%) | 127 (21.9%) |
| 9:00 AM to 9:59 AM | 45 (7.2%) | 52 (9.0%) |
| 10:00 AM to 10:59 AM | 0 (0.0%) | 0 (0.0%) |
| 11:00 AM to 11:59 AM | 0 (0.0%) | 20 (3.5%) |
| 12:00 PM to 3:59 PM | 56 (9.0%) | 20 (3.5%) |
| 4:00 PM to 11:59 PM | 0 (0.0%) | 23 (4.0%) |
| Total | 623 (100.0%) | 580 (100.0%) |
Housing Occupancy in Belchertown
Occupancy by Ownership in Belchertown
Of the total 1,362 dwellings in Belchertown, owner-occupied units account for 880 (64.6%), while renter-occupied units make up 482 (35.4%).
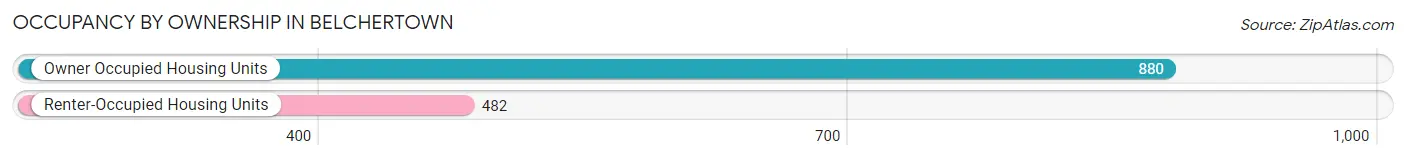
| Occupancy | # Housing Units | % Housing Units |
| Owner Occupied Housing Units | 880 | 64.6% |
| Renter-Occupied Housing Units | 482 | 35.4% |
| Total Occupied Housing Units | 1,362 | 100.0% |
Occupancy by Household Size in Belchertown
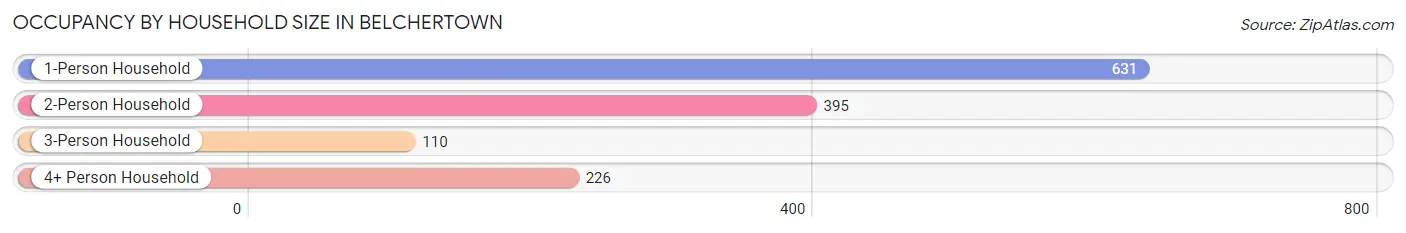
| Household Size | # Housing Units | % Housing Units |
| 1-Person Household | 631 | 46.3% |
| 2-Person Household | 395 | 29.0% |
| 3-Person Household | 110 | 8.1% |
| 4+ Person Household | 226 | 16.6% |
| Total Housing Units | 1,362 | 100.0% |
Occupancy by Ownership by Household Size in Belchertown
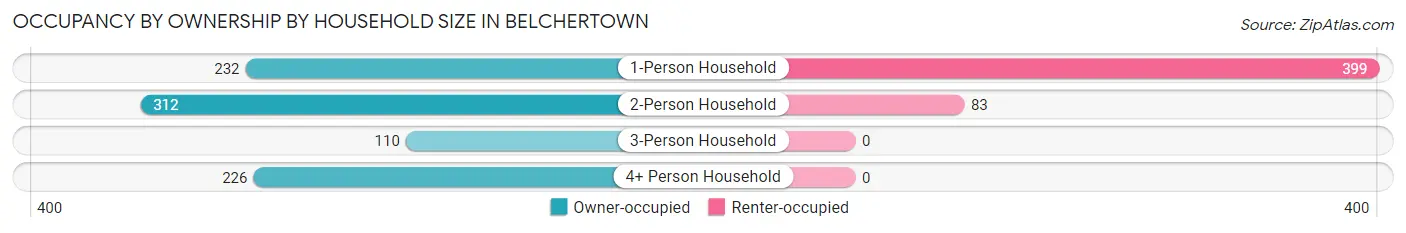
| Household Size | Owner-occupied | Renter-occupied |
| 1-Person Household | 232 (36.8%) | 399 (63.2%) |
| 2-Person Household | 312 (79.0%) | 83 (21.0%) |
| 3-Person Household | 110 (100.0%) | 0 (0.0%) |
| 4+ Person Household | 226 (100.0%) | 0 (0.0%) |
| Total Housing Units | 880 (64.6%) | 482 (35.4%) |
Occupancy by Educational Attainment in Belchertown
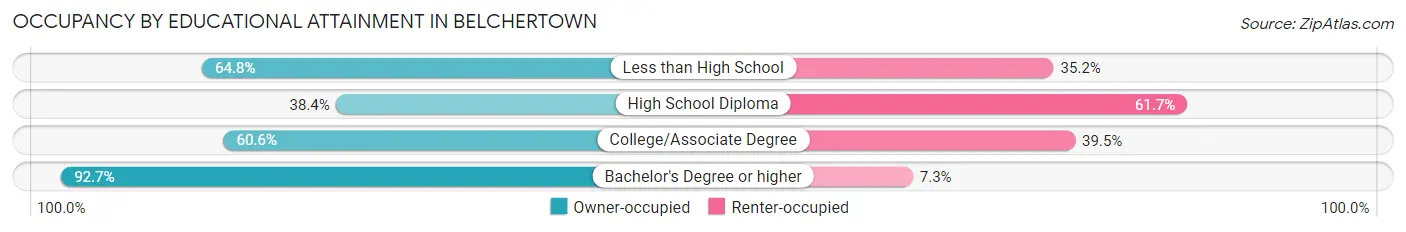
| Household Size | Owner-occupied | Renter-occupied |
| Less than High School | 35 (64.8%) | 19 (35.2%) |
| High School Diploma | 153 (38.4%) | 246 (61.7%) |
| College/Associate Degree | 284 (60.6%) | 185 (39.5%) |
| Bachelor's Degree or higher | 408 (92.7%) | 32 (7.3%) |
Occupancy by Age of Householder in Belchertown
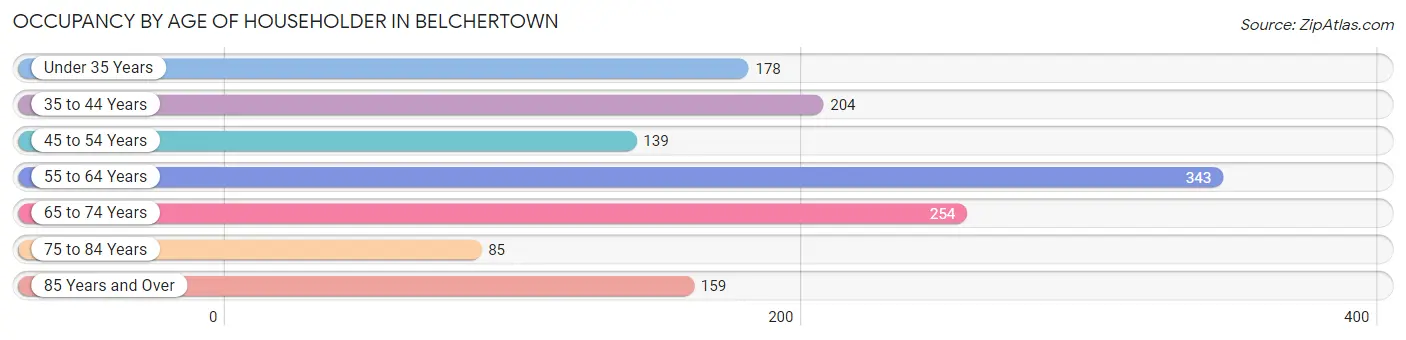
| Age Bracket | # Households | % Households |
| Under 35 Years | 178 | 13.1% |
| 35 to 44 Years | 204 | 15.0% |
| 45 to 54 Years | 139 | 10.2% |
| 55 to 64 Years | 343 | 25.2% |
| 65 to 74 Years | 254 | 18.6% |
| 75 to 84 Years | 85 | 6.2% |
| 85 Years and Over | 159 | 11.7% |
| Total | 1,362 | 100.0% |
Housing Finances in Belchertown
Median Income by Occupancy in Belchertown
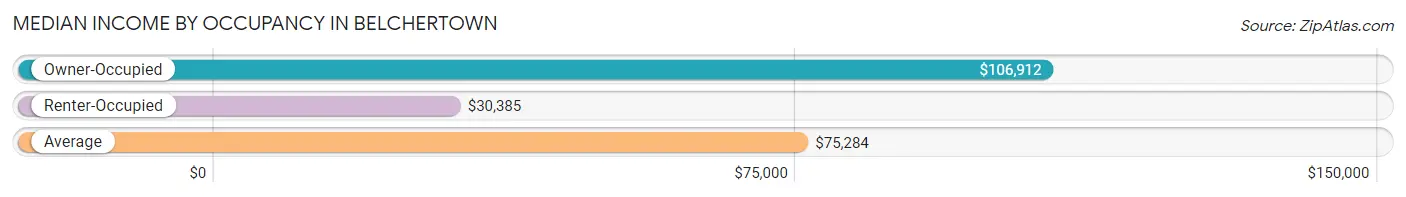
| Occupancy Type | # Households | Median Income |
| Owner-Occupied | 880 (64.6%) | $106,912 |
| Renter-Occupied | 482 (35.4%) | $30,385 |
| Average | 1,362 (100.0%) | $75,284 |
Occupancy by Householder Income Bracket in Belchertown
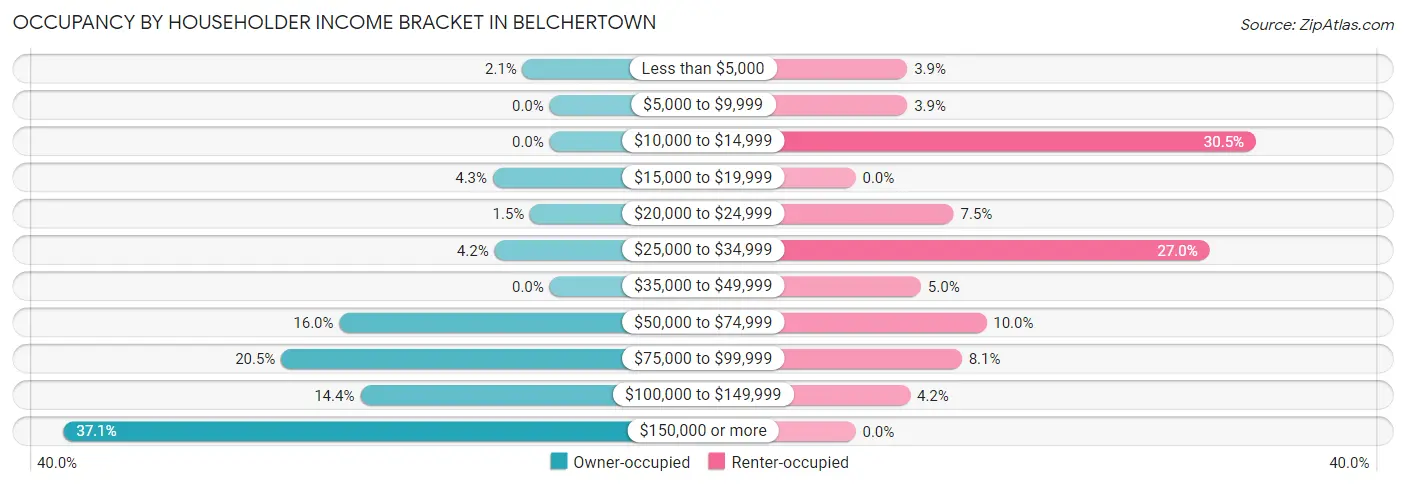
| Income Bracket | Owner-occupied | Renter-occupied |
| Less than $5,000 | 18 (2.1%) | 19 (3.9%) |
| $5,000 to $9,999 | 0 (0.0%) | 19 (3.9%) |
| $10,000 to $14,999 | 0 (0.0%) | 147 (30.5%) |
| $15,000 to $19,999 | 38 (4.3%) | 0 (0.0%) |
| $20,000 to $24,999 | 13 (1.5%) | 36 (7.5%) |
| $25,000 to $34,999 | 37 (4.2%) | 130 (27.0%) |
| $35,000 to $49,999 | 0 (0.0%) | 24 (5.0%) |
| $50,000 to $74,999 | 141 (16.0%) | 48 (10.0%) |
| $75,000 to $99,999 | 180 (20.4%) | 39 (8.1%) |
| $100,000 to $149,999 | 127 (14.4%) | 20 (4.2%) |
| $150,000 or more | 326 (37.0%) | 0 (0.0%) |
| Total | 880 (100.0%) | 482 (100.0%) |
Monthly Housing Cost Tiers in Belchertown
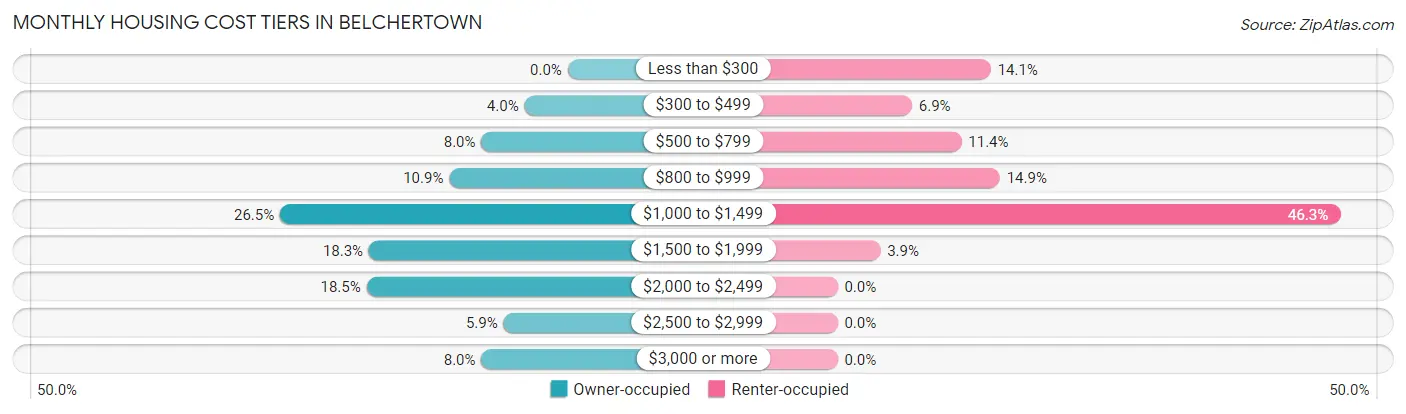
| Monthly Cost | Owner-occupied | Renter-occupied |
| Less than $300 | 0 (0.0%) | 68 (14.1%) |
| $300 to $499 | 35 (4.0%) | 33 (6.9%) |
| $500 to $799 | 70 (8.0%) | 55 (11.4%) |
| $800 to $999 | 96 (10.9%) | 72 (14.9%) |
| $1,000 to $1,499 | 233 (26.5%) | 223 (46.3%) |
| $1,500 to $1,999 | 161 (18.3%) | 19 (3.9%) |
| $2,000 to $2,499 | 163 (18.5%) | 0 (0.0%) |
| $2,500 to $2,999 | 52 (5.9%) | 0 (0.0%) |
| $3,000 or more | 70 (8.0%) | 0 (0.0%) |
| Total | 880 (100.0%) | 482 (100.0%) |
Physical Housing Characteristics in Belchertown
Housing Structures in Belchertown
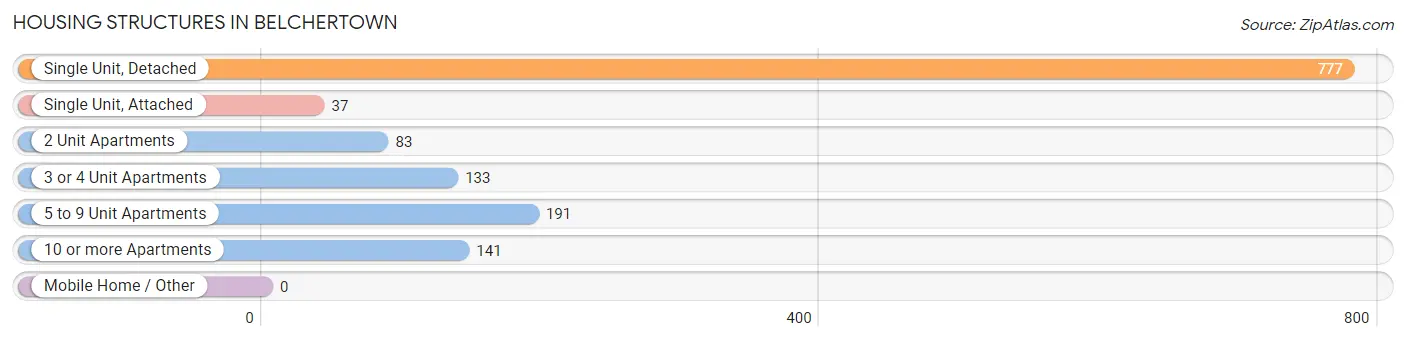
| Structure Type | # Housing Units | % Housing Units |
| Single Unit, Detached | 777 | 57.1% |
| Single Unit, Attached | 37 | 2.7% |
| 2 Unit Apartments | 83 | 6.1% |
| 3 or 4 Unit Apartments | 133 | 9.8% |
| 5 to 9 Unit Apartments | 191 | 14.0% |
| 10 or more Apartments | 141 | 10.3% |
| Mobile Home / Other | 0 | 0.0% |
| Total | 1,362 | 100.0% |
Housing Structures by Occupancy in Belchertown
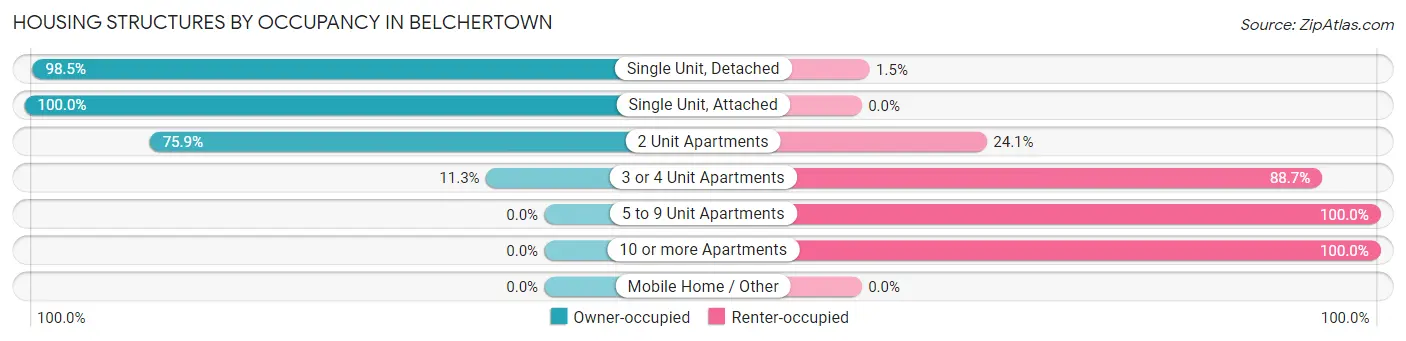
| Structure Type | Owner-occupied | Renter-occupied |
| Single Unit, Detached | 765 (98.5%) | 12 (1.5%) |
| Single Unit, Attached | 37 (100.0%) | 0 (0.0%) |
| 2 Unit Apartments | 63 (75.9%) | 20 (24.1%) |
| 3 or 4 Unit Apartments | 15 (11.3%) | 118 (88.7%) |
| 5 to 9 Unit Apartments | 0 (0.0%) | 191 (100.0%) |
| 10 or more Apartments | 0 (0.0%) | 141 (100.0%) |
| Mobile Home / Other | 0 (0.0%) | 0 (0.0%) |
| Total | 880 (64.6%) | 482 (35.4%) |
Housing Structures by Number of Rooms in Belchertown
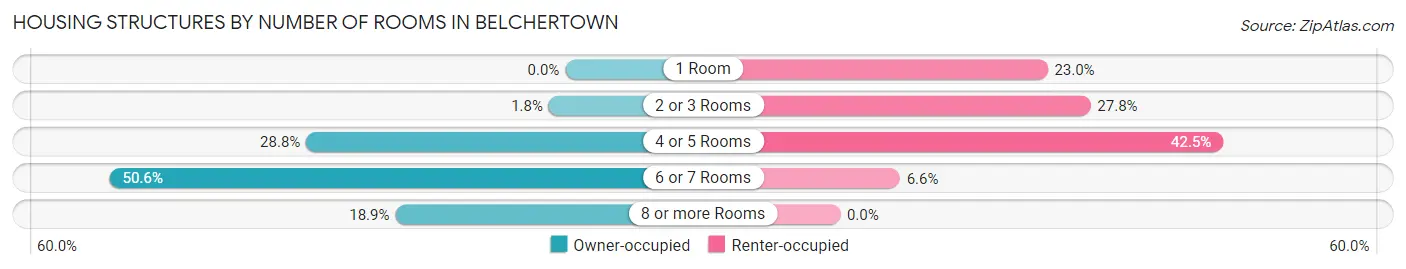
| Number of Rooms | Owner-occupied | Renter-occupied |
| 1 Room | 0 (0.0%) | 111 (23.0%) |
| 2 or 3 Rooms | 16 (1.8%) | 134 (27.8%) |
| 4 or 5 Rooms | 253 (28.7%) | 205 (42.5%) |
| 6 or 7 Rooms | 445 (50.6%) | 32 (6.6%) |
| 8 or more Rooms | 166 (18.9%) | 0 (0.0%) |
| Total | 880 (100.0%) | 482 (100.0%) |
Housing Structure by Heating Type in Belchertown
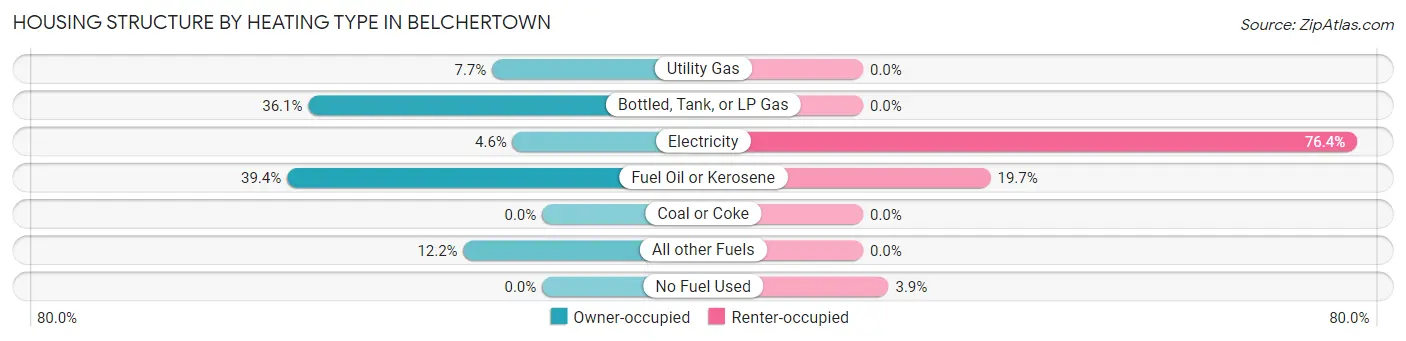
| Heating Type | Owner-occupied | Renter-occupied |
| Utility Gas | 68 (7.7%) | 0 (0.0%) |
| Bottled, Tank, or LP Gas | 318 (36.1%) | 0 (0.0%) |
| Electricity | 40 (4.5%) | 368 (76.3%) |
| Fuel Oil or Kerosene | 347 (39.4%) | 95 (19.7%) |
| Coal or Coke | 0 (0.0%) | 0 (0.0%) |
| All other Fuels | 107 (12.2%) | 0 (0.0%) |
| No Fuel Used | 0 (0.0%) | 19 (3.9%) |
| Total | 880 (100.0%) | 482 (100.0%) |
Household Vehicle Usage in Belchertown
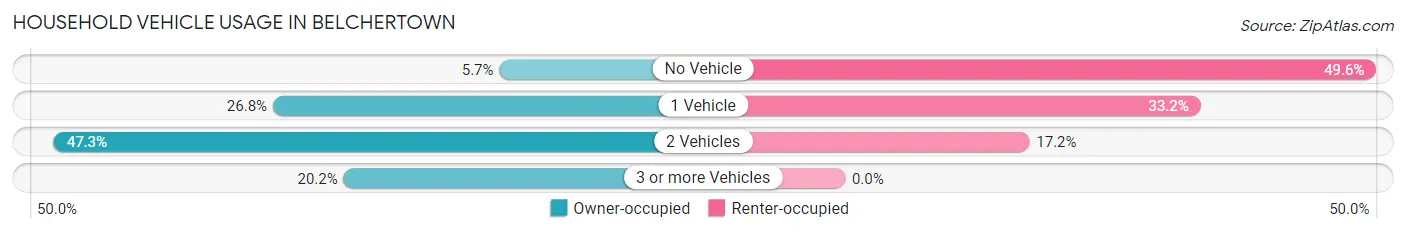
| Vehicles per Household | Owner-occupied | Renter-occupied |
| No Vehicle | 50 (5.7%) | 239 (49.6%) |
| 1 Vehicle | 236 (26.8%) | 160 (33.2%) |
| 2 Vehicles | 416 (47.3%) | 83 (17.2%) |
| 3 or more Vehicles | 178 (20.2%) | 0 (0.0%) |
| Total | 880 (100.0%) | 482 (100.0%) |
Real Estate & Mortgages in Belchertown
Real Estate and Mortgage Overview in Belchertown
| Characteristic | Without Mortgage | With Mortgage |
| Housing Units | 313 | 567 |
| Median Property Value | $305,900 | $304,600 |
| Median Household Income | $75,525 | $283 |
| Monthly Housing Costs | $969 | $70 |
| Real Estate Taxes | $4,380 | $0 |
Property Value by Mortgage Status in Belchertown
| Property Value | Without Mortgage | With Mortgage |
| Less than $50,000 | 17 (5.4%) | 0 (0.0%) |
| $50,000 to $99,999 | 18 (5.8%) | 0 (0.0%) |
| $100,000 to $299,999 | 114 (36.4%) | 276 (48.7%) |
| $300,000 to $499,999 | 164 (52.4%) | 253 (44.6%) |
| $500,000 to $749,999 | 0 (0.0%) | 38 (6.7%) |
| $750,000 to $999,999 | 0 (0.0%) | 0 (0.0%) |
| $1,000,000 or more | 0 (0.0%) | 0 (0.0%) |
| Total | 313 (100.0%) | 567 (100.0%) |
Household Income by Mortgage Status in Belchertown
| Household Income | Without Mortgage | With Mortgage |
| Less than $10,000 | 18 (5.8%) | 36 (6.4%) |
| $10,000 to $24,999 | 51 (16.3%) | 0 (0.0%) |
| $25,000 to $34,999 | 20 (6.4%) | 0 (0.0%) |
| $35,000 to $49,999 | 0 (0.0%) | 17 (3.0%) |
| $50,000 to $74,999 | 53 (16.9%) | 0 (0.0%) |
| $75,000 to $99,999 | 115 (36.7%) | 88 (15.5%) |
| $100,000 to $149,999 | 13 (4.2%) | 65 (11.5%) |
| $150,000 or more | 43 (13.7%) | 114 (20.1%) |
| Total | 313 (100.0%) | 567 (100.0%) |
Property Value to Household Income Ratio in Belchertown
| Value-to-Income Ratio | Without Mortgage | With Mortgage |
| Less than 2.0x | 37 (11.8%) | 149,926 (26,442.0%) |
| 2.0x to 2.9x | 39 (12.5%) | 241 (42.5%) |
| 3.0x to 3.9x | 113 (36.1%) | 149 (26.3%) |
| 4.0x or more | 106 (33.9%) | 148 (26.1%) |
| Total | 313 (100.0%) | 567 (100.0%) |
Real Estate Taxes by Mortgage Status in Belchertown
| Property Taxes | Without Mortgage | With Mortgage |
| Less than $800 | 0 (0.0%) | 0 (0.0%) |
| $800 to $1,499 | 17 (5.4%) | 0 (0.0%) |
| $800 to $1,499 | 296 (94.6%) | 38 (6.7%) |
| Total | 313 (100.0%) | 567 (100.0%) |
Health & Disability in Belchertown
Health Insurance Coverage by Age in Belchertown
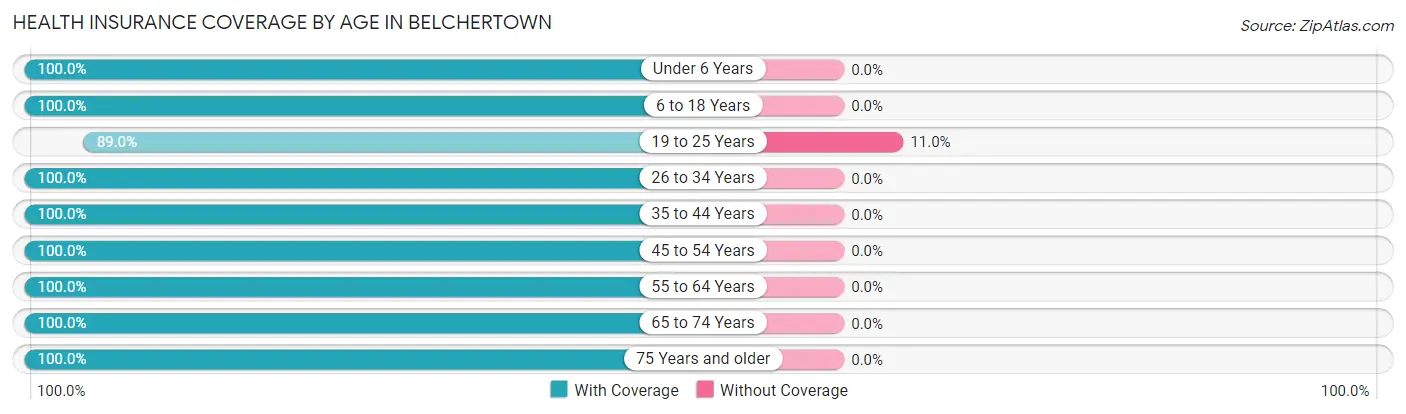
| Age Bracket | With Coverage | Without Coverage |
| Under 6 Years | 150 (100.0%) | 0 (0.0%) |
| 6 to 18 Years | 268 (100.0%) | 0 (0.0%) |
| 19 to 25 Years | 234 (89.0%) | 29 (11.0%) |
| 26 to 34 Years | 239 (100.0%) | 0 (0.0%) |
| 35 to 44 Years | 345 (100.0%) | 0 (0.0%) |
| 45 to 54 Years | 269 (100.0%) | 0 (0.0%) |
| 55 to 64 Years | 473 (100.0%) | 0 (0.0%) |
| 65 to 74 Years | 336 (100.0%) | 0 (0.0%) |
| 75 Years and older | 305 (100.0%) | 0 (0.0%) |
| Total | 2,619 (98.9%) | 29 (1.1%) |
Health Insurance Coverage by Citizenship Status in Belchertown
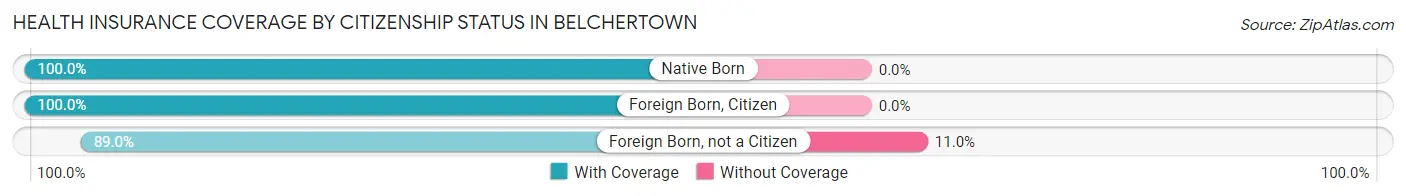
| Citizenship Status | With Coverage | Without Coverage |
| Native Born | 150 (100.0%) | 0 (0.0%) |
| Foreign Born, Citizen | 268 (100.0%) | 0 (0.0%) |
| Foreign Born, not a Citizen | 234 (89.0%) | 29 (11.0%) |
Health Insurance Coverage by Household Income in Belchertown
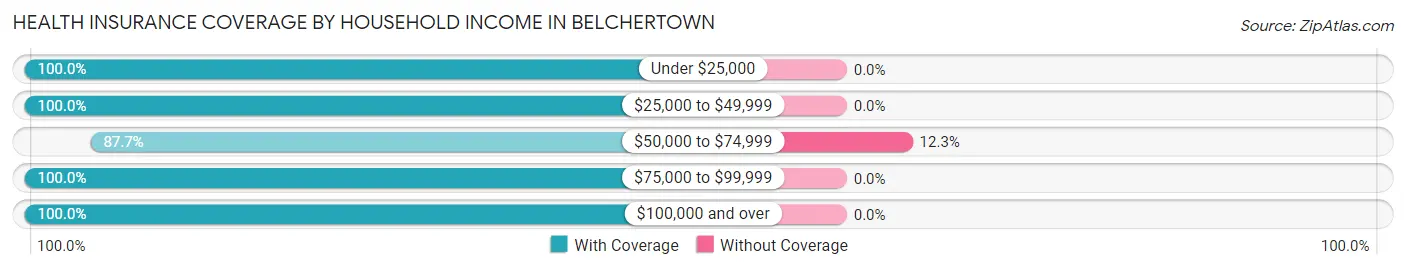
| Household Income | With Coverage | Without Coverage |
| Under $25,000 | 304 (100.0%) | 0 (0.0%) |
| $25,000 to $49,999 | 275 (100.0%) | 0 (0.0%) |
| $50,000 to $74,999 | 206 (87.7%) | 29 (12.3%) |
| $75,000 to $99,999 | 454 (100.0%) | 0 (0.0%) |
| $100,000 and over | 1,375 (100.0%) | 0 (0.0%) |
Public vs Private Health Insurance Coverage by Age in Belchertown
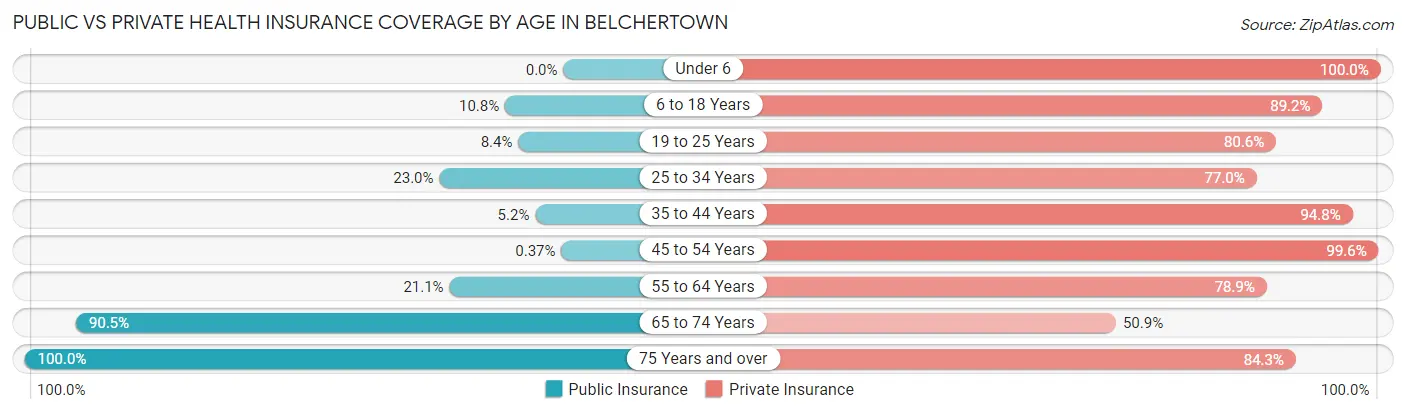
| Age Bracket | Public Insurance | Private Insurance |
| Under 6 | 0 (0.0%) | 150 (100.0%) |
| 6 to 18 Years | 29 (10.8%) | 239 (89.2%) |
| 19 to 25 Years | 22 (8.4%) | 212 (80.6%) |
| 25 to 34 Years | 55 (23.0%) | 184 (77.0%) |
| 35 to 44 Years | 18 (5.2%) | 327 (94.8%) |
| 45 to 54 Years | 1 (0.4%) | 268 (99.6%) |
| 55 to 64 Years | 100 (21.1%) | 373 (78.9%) |
| 65 to 74 Years | 304 (90.5%) | 171 (50.9%) |
| 75 Years and over | 305 (100.0%) | 257 (84.3%) |
| Total | 834 (31.5%) | 2,181 (82.4%) |
Disability Status by Sex by Age in Belchertown
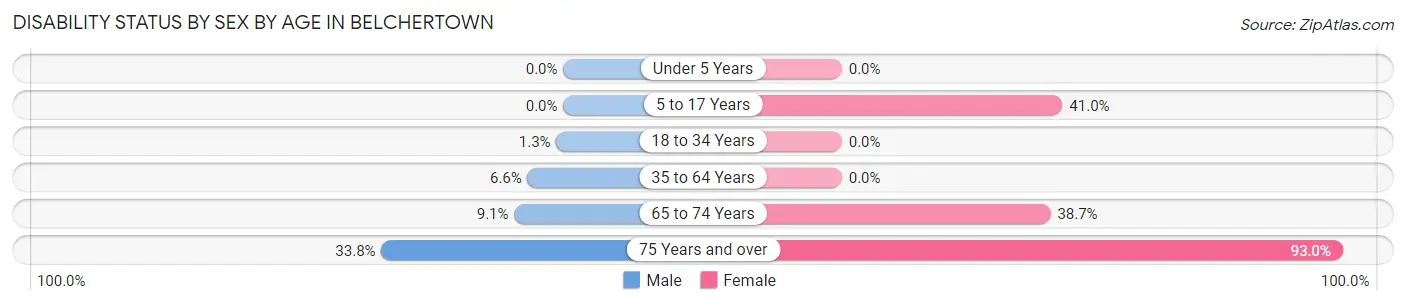
| Age Bracket | Male | Female |
| Under 5 Years | 0 (0.0%) | 0 (0.0%) |
| 5 to 17 Years | 0 (0.0%) | 43 (40.9%) |
| 18 to 34 Years | 3 (1.3%) | 0 (0.0%) |
| 35 to 64 Years | 38 (6.6%) | 0 (0.0%) |
| 65 to 74 Years | 12 (9.1%) | 79 (38.7%) |
| 75 Years and over | 26 (33.8%) | 212 (93.0%) |
Disability Class by Sex by Age in Belchertown
Disability Class: Hearing Difficulty
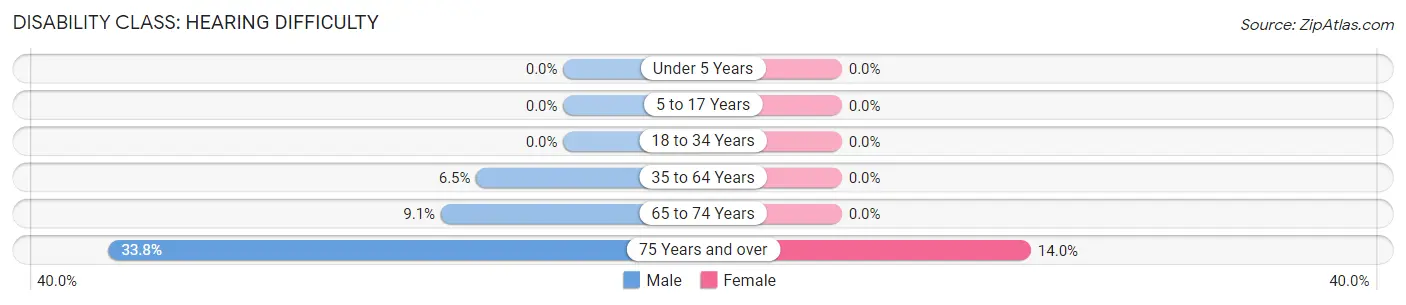
| Age Bracket | Male | Female |
| Under 5 Years | 0 (0.0%) | 0 (0.0%) |
| 5 to 17 Years | 0 (0.0%) | 0 (0.0%) |
| 18 to 34 Years | 0 (0.0%) | 0 (0.0%) |
| 35 to 64 Years | 37 (6.5%) | 0 (0.0%) |
| 65 to 74 Years | 12 (9.1%) | 0 (0.0%) |
| 75 Years and over | 26 (33.8%) | 32 (14.0%) |
Disability Class: Vision Difficulty
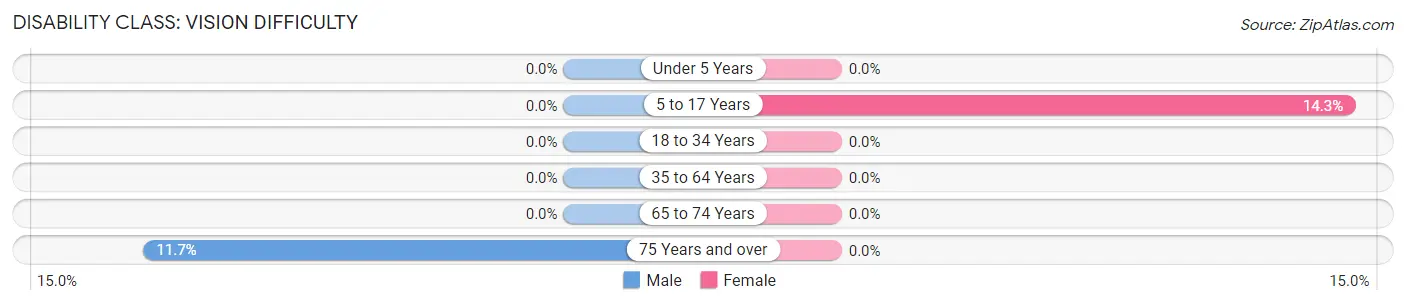
| Age Bracket | Male | Female |
| Under 5 Years | 0 (0.0%) | 0 (0.0%) |
| 5 to 17 Years | 0 (0.0%) | 15 (14.3%) |
| 18 to 34 Years | 0 (0.0%) | 0 (0.0%) |
| 35 to 64 Years | 0 (0.0%) | 0 (0.0%) |
| 65 to 74 Years | 0 (0.0%) | 0 (0.0%) |
| 75 Years and over | 9 (11.7%) | 0 (0.0%) |
Disability Class: Cognitive Difficulty
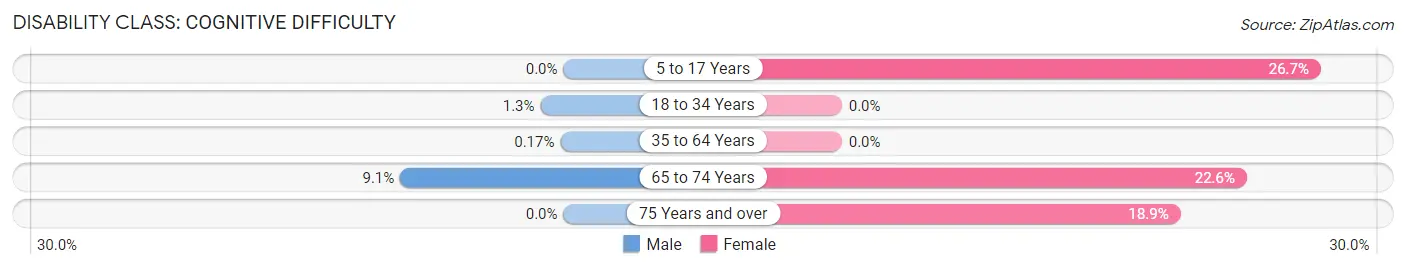
| Age Bracket | Male | Female |
| 5 to 17 Years | 0 (0.0%) | 28 (26.7%) |
| 18 to 34 Years | 3 (1.3%) | 0 (0.0%) |
| 35 to 64 Years | 1 (0.2%) | 0 (0.0%) |
| 65 to 74 Years | 12 (9.1%) | 46 (22.6%) |
| 75 Years and over | 0 (0.0%) | 43 (18.9%) |
Disability Class: Ambulatory Difficulty
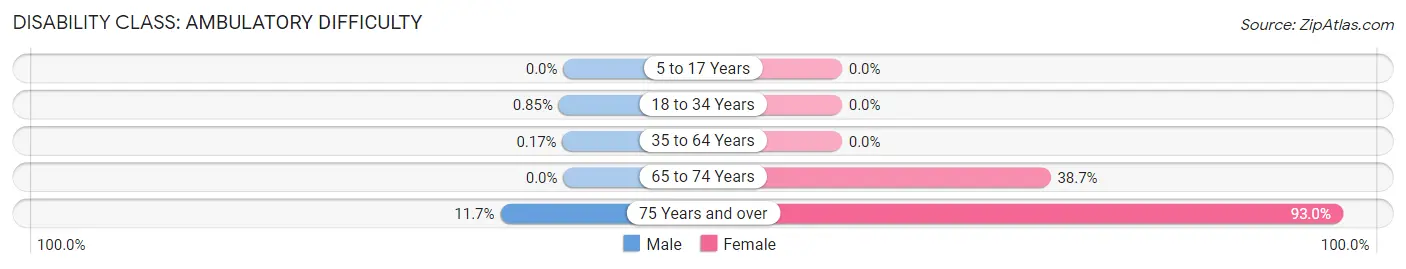
| Age Bracket | Male | Female |
| 5 to 17 Years | 0 (0.0%) | 0 (0.0%) |
| 18 to 34 Years | 2 (0.9%) | 0 (0.0%) |
| 35 to 64 Years | 1 (0.2%) | 0 (0.0%) |
| 65 to 74 Years | 0 (0.0%) | 79 (38.7%) |
| 75 Years and over | 9 (11.7%) | 212 (93.0%) |
Disability Class: Self-Care Difficulty
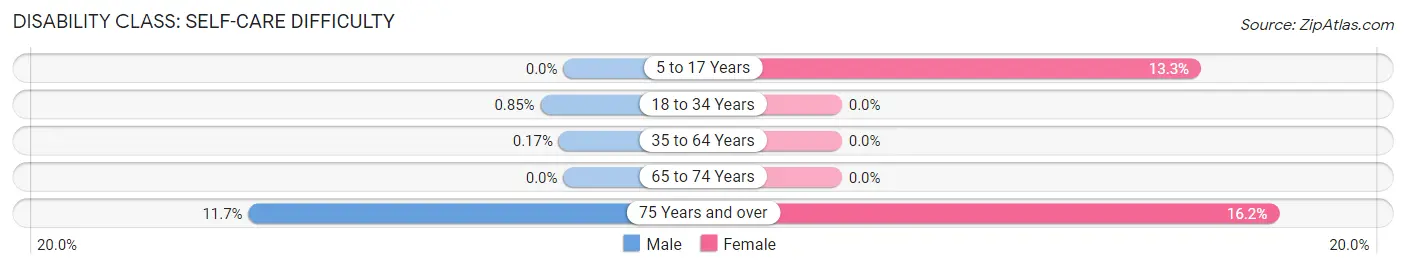
| Age Bracket | Male | Female |
| 5 to 17 Years | 0 (0.0%) | 14 (13.3%) |
| 18 to 34 Years | 2 (0.9%) | 0 (0.0%) |
| 35 to 64 Years | 1 (0.2%) | 0 (0.0%) |
| 65 to 74 Years | 0 (0.0%) | 0 (0.0%) |
| 75 Years and over | 9 (11.7%) | 37 (16.2%) |
Technology Access in Belchertown
Computing Device Access in Belchertown
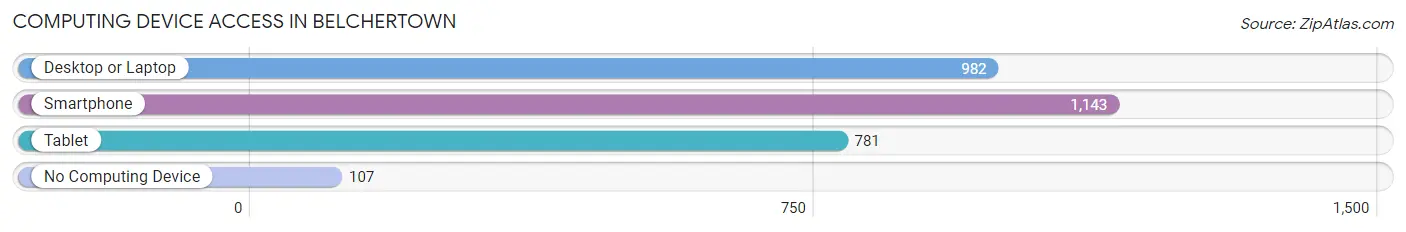
| Device Type | # Households | % Households |
| Desktop or Laptop | 982 | 72.1% |
| Smartphone | 1,143 | 83.9% |
| Tablet | 781 | 57.3% |
| No Computing Device | 107 | 7.9% |
| Total | 1,362 | 100.0% |
Internet Access in Belchertown
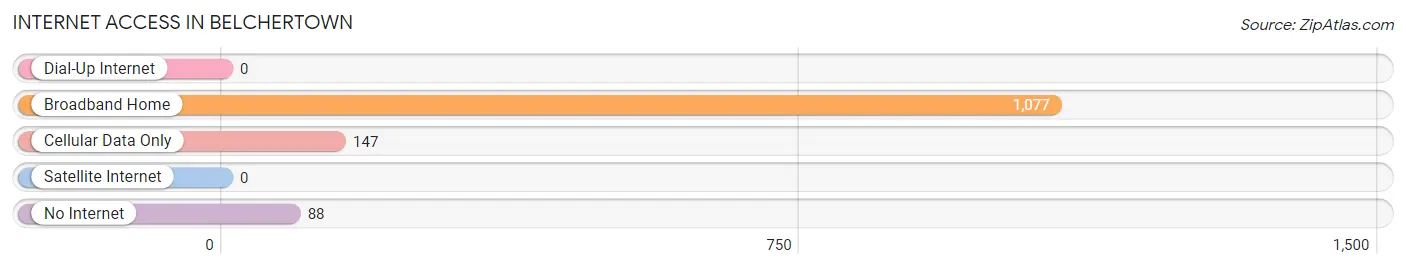
| Internet Type | # Households | % Households |
| Dial-Up Internet | 0 | 0.0% |
| Broadband Home | 1,077 | 79.1% |
| Cellular Data Only | 147 | 10.8% |
| Satellite Internet | 0 | 0.0% |
| No Internet | 88 | 6.5% |
| Total | 1,362 | 100.0% |
Belchertown Summary
Belchertown, Massachusetts is a small town located in the Pioneer Valley of western Massachusetts. It is situated in the foothills of the Berkshires, and is bordered by the towns of Amherst, Granby, and Ware. The town was first settled in 1731 and was officially incorporated in 1761. Belchertown is home to approximately 14,000 people, and is known for its rural charm and small-town atmosphere.
Geography
Belchertown is located in the Pioneer Valley of western Massachusetts, in the foothills of the Berkshires. The town is bordered by the towns of Amherst, Granby, and Ware. Belchertown is situated on the banks of the Quabbin Reservoir, which is the largest body of water in Massachusetts. The town is also home to several smaller bodies of water, including the Swift River, the Ware River, and the Quaboag River. The town is located in the Connecticut River Valley, and is approximately 25 miles north of Springfield and 90 miles west of Boston.
The town of Belchertown is made up of several distinct neighborhoods, including Belchertown Center, East Belchertown, North Belchertown, and South Belchertown. The town is also home to several small villages, including Amherstdale, Belchertown Common, and Belchertown Heights.
History
Belchertown was first settled in 1731 by settlers from Connecticut. The town was officially incorporated in 1761, and was named after Governor Jonathan Belcher. Belchertown was primarily an agricultural community, and was known for its dairy farms and apple orchards. The town was also home to several small industries, including a paper mill, a grist mill, and a saw mill.
In the late 19th century, Belchertown became a popular summer resort destination. The town was home to several large hotels, and was known for its picturesque scenery and outdoor activities.
Economy
Belchertown is primarily a residential community, and the town’s economy is largely based on the service industry. The town is home to several small businesses, including restaurants, retail stores, and professional services. The town is also home to several large employers, including the Belchertown Public Schools, the Belchertown Fire Department, and the Belchertown Police Department.
Demographics
As of the 2010 census, Belchertown had a population of 14,649. The racial makeup of the town was 94.3% White, 1.3% African American, 0.4% Native American, 1.2% Asian, 0.1% Pacific Islander, 1.2% from other races, and 1.5% from two or more races. Hispanic or Latino of any race were 3.2% of the population.
Belchertown is a predominantly white town, with a median household income of $63,917. The town has a median age of 41.7 years, and a poverty rate of 8.3%. The town is home to several educational institutions, including the Belchertown Public Schools, the Belchertown High School, and the Belchertown Community College.
Common Questions
What is Per Capita Income in Belchertown?
Per Capita income in Belchertown is $55,609.
What is the Median Family Income in Belchertown?
Median Family Income in Belchertown is $121,538.
What is the Median Household income in Belchertown?
Median Household Income in Belchertown is $75,284.
What is Income or Wage Gap in Belchertown?
Income or Wage Gap in Belchertown is 2.5%.
Women in Belchertown earn 97.5 cents for every dollar earned by a man.
What is Inequality or Gini Index in Belchertown?
Inequality or Gini Index in Belchertown is 0.53.
What is the Total Population of Belchertown?
Total Population of Belchertown is 2,648.
What is the Total Male Population of Belchertown?
Total Male Population of Belchertown is 1,255.
What is the Total Female Population of Belchertown?
Total Female Population of Belchertown is 1,393.
What is the Ratio of Males per 100 Females in Belchertown?
There are 90.09 Males per 100 Females in Belchertown.
What is the Ratio of Females per 100 Males in Belchertown?
There are 111.00 Females per 100 Males in Belchertown.
What is the Median Population Age in Belchertown?
Median Population Age in Belchertown is 48.7 Years.
What is the Average Family Size in Belchertown
Average Family Size in Belchertown is 2.9 People.
What is the Average Household Size in Belchertown
Average Household Size in Belchertown is 1.9 People.
How Large is the Labor Force in Belchertown?
There are 1,444 People in the Labor Forcein in Belchertown.
What is the Percentage of People in the Labor Force in Belchertown?
64.6% of People are in the Labor Force in Belchertown.
What is the Unemployment Rate in Belchertown?
Unemployment Rate in Belchertown is 0.9%.