Cities with the Highest Percentage of Finnish Population in Massachusetts
RELATED REPORTS & OPTIONS
Finnish
Massachusetts
Compare Cities
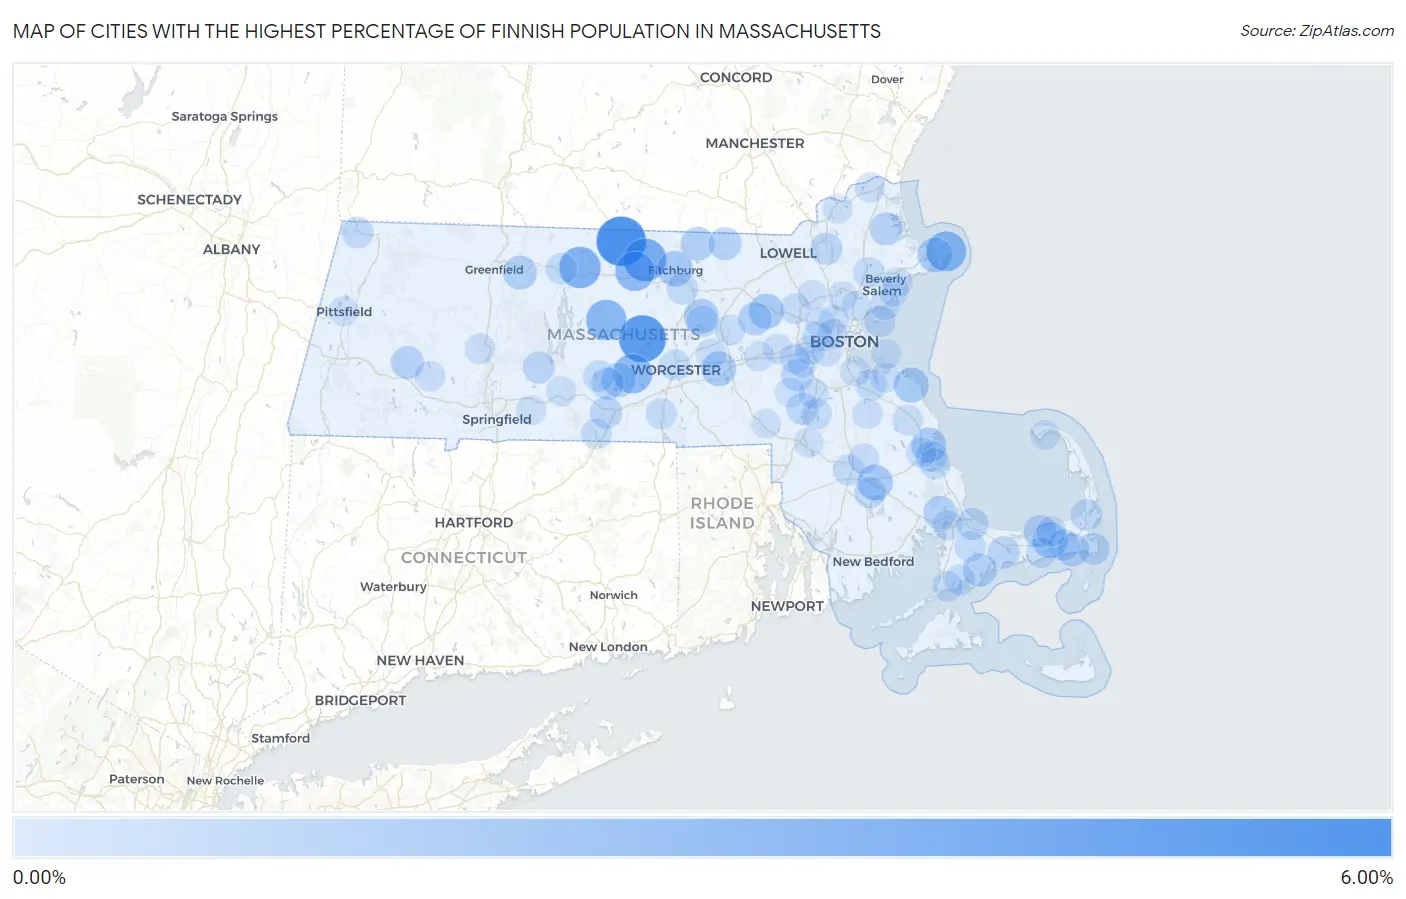
Map of Cities with the Highest Percentage of Finnish Population in Massachusetts
0.00%
6.00%
Cities with the Highest Percentage of Finnish Population in Massachusetts
| City | Finnish | vs State | vs National | |
| 1. | Winchendon | 5.60% | 0.32%(+5.29)#1 | 0.19%(+5.41)#277 |
| 2. | Rutland | 4.91% | 0.32%(+4.59)#2 | 0.19%(+4.72)#308 |
| 3. | South Ashburnham | 3.72% | 0.32%(+3.40)#3 | 0.19%(+3.53)#403 |
| 4. | Athol | 3.31% | 0.32%(+3.00)#4 | 0.19%(+3.12)#446 |
| 5. | Barre | 3.03% | 0.32%(+2.71)#5 | 0.19%(+2.84)#500 |
| 6. | Rockport | 2.91% | 0.32%(+2.60)#6 | 0.19%(+2.72)#523 |
| 7. | Gardner | 2.76% | 0.32%(+2.44)#7 | 0.19%(+2.57)#548 |
| 8. | Spencer | 2.75% | 0.32%(+2.43)#8 | 0.19%(+2.56)#550 |
| 9. | South Dennis | 1.74% | 0.32%(+1.42)#9 | 0.19%(+1.55)#867 |
| 10. | Middleborough Center | 1.69% | 0.32%(+1.37)#10 | 0.19%(+1.50)#890 |
| 11. | Fitchburg | 1.68% | 0.32%(+1.36)#11 | 0.19%(+1.49)#896 |
| 12. | North Scituate | 1.60% | 0.32%(+1.29)#12 | 0.19%(+1.41)#930 |
| 13. | West Concord | 1.55% | 0.32%(+1.23)#13 | 0.19%(+1.36)#960 |
| 14. | Westborough | 1.51% | 0.32%(+1.19)#14 | 0.19%(+1.32)#994 |
| 15. | South Duxbury | 1.50% | 0.32%(+1.18)#15 | 0.19%(+1.31)#1,001 |
| 16. | Gloucester | 1.49% | 0.32%(+1.18)#16 | 0.19%(+1.30)#1,006 |
| 17. | South Lancaster | 1.46% | 0.32%(+1.15)#17 | 0.19%(+1.27)#1,026 |
| 18. | East Brookfield | 1.26% | 0.32%(+0.947)#18 | 0.19%(+1.07)#1,178 |
| 19. | Townsend | 1.24% | 0.32%(+0.921)#19 | 0.19%(+1.05)#1,203 |
| 20. | Millers Falls | 1.23% | 0.32%(+0.909)#20 | 0.19%(+1.04)#1,215 |
| 21. | Mashpee Neck | 1.10% | 0.32%(+0.786)#21 | 0.19%(+0.912)#1,336 |
| 22. | White Island Shores | 1.08% | 0.32%(+0.763)#22 | 0.19%(+0.890)#1,372 |
| 23. | Maynard | 1.08% | 0.32%(+0.761)#23 | 0.19%(+0.888)#1,375 |
| 24. | Harwich Port | 1.07% | 0.32%(+0.749)#24 | 0.19%(+0.876)#1,391 |
| 25. | Rowley | 1.04% | 0.32%(+0.719)#25 | 0.19%(+0.845)#1,424 |
| 26. | Chester | 1.01% | 0.32%(+0.690)#26 | 0.19%(+0.816)#1,469 |
| 27. | Dennis | 1.00% | 0.32%(+0.685)#27 | 0.19%(+0.811)#1,479 |
| 28. | Pepperell | 1.00% | 0.32%(+0.681)#28 | 0.19%(+0.808)#1,486 |
| 29. | Brookfield | 0.84% | 0.32%(+0.527)#29 | 0.19%(+0.654)#1,734 |
| 30. | Dover | 0.84% | 0.32%(+0.519)#30 | 0.19%(+0.646)#1,750 |
| 31. | Barnstable Town | 0.83% | 0.32%(+0.517)#31 | 0.19%(+0.644)#1,756 |
| 32. | Andover | 0.82% | 0.32%(+0.501)#32 | 0.19%(+0.628)#1,792 |
| 33. | Fiskdale | 0.81% | 0.32%(+0.497)#33 | 0.19%(+0.624)#1,796 |
| 34. | Chatham | 0.73% | 0.32%(+0.417)#34 | 0.19%(+0.543)#1,975 |
| 35. | Belchertown | 0.72% | 0.32%(+0.401)#35 | 0.19%(+0.528)#2,007 |
| 36. | Sandwich | 0.71% | 0.32%(+0.396)#36 | 0.19%(+0.522)#2,018 |
| 37. | Walpole | 0.69% | 0.32%(+0.374)#37 | 0.19%(+0.501)#2,066 |
| 38. | Northwest Harwich | 0.66% | 0.32%(+0.346)#38 | 0.19%(+0.473)#2,143 |
| 39. | Orleans | 0.66% | 0.32%(+0.344)#39 | 0.19%(+0.471)#2,150 |
| 40. | Williamstown | 0.64% | 0.32%(+0.328)#40 | 0.19%(+0.455)#2,188 |
| 41. | Clinton | 0.64% | 0.32%(+0.322)#41 | 0.19%(+0.449)#2,206 |
| 42. | Nahant | 0.63% | 0.32%(+0.313)#42 | 0.19%(+0.440)#2,237 |
| 43. | North Plymouth | 0.61% | 0.32%(+0.295)#43 | 0.19%(+0.421)#2,289 |
| 44. | Leominster | 0.60% | 0.32%(+0.284)#44 | 0.19%(+0.411)#2,311 |
| 45. | West Brookfield | 0.59% | 0.32%(+0.271)#45 | 0.19%(+0.398)#2,354 |
| 46. | North Lakeville | 0.58% | 0.32%(+0.261)#46 | 0.19%(+0.388)#2,382 |
| 47. | Weymouth Town | 0.57% | 0.32%(+0.254)#47 | 0.19%(+0.381)#2,409 |
| 48. | Orange | 0.56% | 0.32%(+0.246)#48 | 0.19%(+0.373)#2,434 |
| 49. | North Attleborough | 0.53% | 0.32%(+0.217)#49 | 0.19%(+0.343)#2,532 |
| 50. | Danvers | 0.52% | 0.32%(+0.207)#50 | 0.19%(+0.333)#2,563 |
| 51. | Sharon | 0.52% | 0.32%(+0.202)#51 | 0.19%(+0.328)#2,580 |
| 52. | Oxford | 0.52% | 0.32%(+0.201)#52 | 0.19%(+0.328)#2,584 |
| 53. | Raynham Center | 0.51% | 0.32%(+0.196)#53 | 0.19%(+0.323)#2,611 |
| 54. | Forestdale | 0.51% | 0.32%(+0.195)#54 | 0.19%(+0.321)#2,616 |
| 55. | Worcester | 0.51% | 0.32%(+0.190)#55 | 0.19%(+0.316)#2,632 |
| 56. | East Falmouth | 0.47% | 0.32%(+0.156)#56 | 0.19%(+0.283)#2,747 |
| 57. | Plymouth | 0.46% | 0.32%(+0.141)#57 | 0.19%(+0.268)#2,825 |
| 58. | South Yarmouth | 0.43% | 0.32%(+0.115)#58 | 0.19%(+0.242)#2,966 |
| 59. | Holland | 0.41% | 0.32%(+0.097)#59 | 0.19%(+0.223)#3,045 |
| 60. | Hudson | 0.39% | 0.32%(+0.077)#60 | 0.19%(+0.204)#3,152 |
| 61. | Hanscom Afb | 0.39% | 0.32%(+0.076)#61 | 0.19%(+0.202)#3,156 |
| 62. | Falmouth | 0.39% | 0.32%(+0.070)#62 | 0.19%(+0.196)#3,181 |
| 63. | North Pembroke | 0.38% | 0.32%(+0.063)#63 | 0.19%(+0.189)#3,228 |
| 64. | Bridgewater Town | 0.37% | 0.32%(+0.055)#64 | 0.19%(+0.182)#3,285 |
| 65. | Buzzards Bay | 0.37% | 0.32%(+0.051)#65 | 0.19%(+0.178)#3,302 |
| 66. | Huntington | 0.35% | 0.32%(+0.030)#66 | 0.19%(+0.157)#3,426 |
| 67. | Northborough | 0.34% | 0.32%(+0.028)#67 | 0.19%(+0.155)#3,433 |
| 68. | Medford | 0.33% | 0.32%(+0.017)#68 | 0.19%(+0.144)#3,488 |
| 69. | Northampton | 0.33% | 0.32%(+0.013)#69 | 0.19%(+0.139)#3,522 |
| 70. | Wellesley | 0.31% | 0.32%(-0.002)#70 | 0.19%(+0.125)#3,631 |
| 71. | Hingham | 0.30% | 0.32%(-0.013)#71 | 0.19%(+0.113)#3,710 |
| 72. | Norwood | 0.30% | 0.32%(-0.017)#72 | 0.19%(+0.110)#3,741 |
| 73. | East Dennis | 0.30% | 0.32%(-0.020)#73 | 0.19%(+0.107)#3,762 |
| 74. | Kingston | 0.30% | 0.32%(-0.021)#74 | 0.19%(+0.106)#3,774 |
| 75. | Brookline | 0.29% | 0.32%(-0.025)#75 | 0.19%(+0.102)#3,807 |
| 76. | Salem | 0.29% | 0.32%(-0.029)#76 | 0.19%(+0.097)#3,839 |
| 77. | Abington | 0.28% | 0.32%(-0.034)#77 | 0.19%(+0.092)#3,875 |
| 78. | Watertown Town | 0.28% | 0.32%(-0.038)#78 | 0.19%(+0.089)#3,914 |
| 79. | Beverly | 0.28% | 0.32%(-0.041)#79 | 0.19%(+0.086)#3,936 |
| 80. | Arlington | 0.27% | 0.32%(-0.042)#80 | 0.19%(+0.085)#3,948 |
| 81. | Needham | 0.27% | 0.32%(-0.044)#81 | 0.19%(+0.082)#3,963 |
| 82. | Amesbury Town | 0.27% | 0.32%(-0.045)#82 | 0.19%(+0.082)#3,967 |
| 83. | Swampscott | 0.27% | 0.32%(-0.045)#83 | 0.19%(+0.081)#3,975 |
| 84. | Palmer Town | 0.27% | 0.32%(-0.051)#84 | 0.19%(+0.076)#4,023 |
| 85. | Newton | 0.26% | 0.32%(-0.052)#85 | 0.19%(+0.075)#4,035 |
| 86. | Quincy | 0.26% | 0.32%(-0.058)#86 | 0.19%(+0.069)#4,089 |
| 87. | Cambridge | 0.25% | 0.32%(-0.063)#87 | 0.19%(+0.064)#4,139 |
| 88. | Medfield | 0.24% | 0.32%(-0.079)#88 | 0.19%(+0.048)#4,267 |
| 89. | Hull | 0.24% | 0.32%(-0.079)#89 | 0.19%(+0.047)#4,269 |
| 90. | Framingham | 0.24% | 0.32%(-0.080)#90 | 0.19%(+0.047)#4,275 |
| 91. | Wilbraham | 0.23% | 0.32%(-0.082)#91 | 0.19%(+0.045)#4,300 |
| 92. | Provincetown | 0.23% | 0.32%(-0.083)#92 | 0.19%(+0.043)#4,313 |
| 93. | Cochituate | 0.23% | 0.32%(-0.086)#93 | 0.19%(+0.041)#4,327 |
| 94. | Haverhill | 0.23% | 0.32%(-0.086)#94 | 0.19%(+0.041)#4,328 |
| 95. | Wakefield | 0.23% | 0.32%(-0.087)#95 | 0.19%(+0.039)#4,340 |
| 96. | Pittsfield | 0.23% | 0.32%(-0.088)#96 | 0.19%(+0.039)#4,350 |
| 97. | Burlington | 0.22% | 0.32%(-0.095)#97 | 0.19%(+0.032)#4,420 |
| 98. | Mansfield Center | 0.22% | 0.32%(-0.095)#98 | 0.19%(+0.031)#4,429 |
| 99. | Saugus | 0.22% | 0.32%(-0.096)#99 | 0.19%(+0.031)#4,432 |
| 100. | Franklin Town | 0.22% | 0.32%(-0.100)#100 | 0.19%(+0.027)#4,475 |
Common Questions
What are the Top 10 Cities with the Highest Percentage of Finnish Population in Massachusetts?
Top 10 Cities with the Highest Percentage of Finnish Population in Massachusetts are:
#1
5.60%
#2
4.91%
#3
3.72%
#4
3.31%
#5
3.03%
#6
2.91%
#7
2.76%
#8
2.75%
#9
1.74%
#10
1.69%
What city has the Highest Percentage of Finnish Population in Massachusetts?
Winchendon has the Highest Percentage of Finnish Population in Massachusetts with 5.60%.
What is the Percentage of Finnish Population in the State of Massachusetts?
Percentage of Finnish Population in Massachusetts is 0.32%.
What is the Percentage of Finnish Population in the United States?
Percentage of Finnish Population in the United States is 0.19%.