Petersham, MA Map & Demographics
Petersham Map
Petersham Overview
$45,723
PER CAPITA INCOME
$123,333
AVG FAMILY INCOME
$76,328
AVG HOUSEHOLD INCOME
0.43
INEQUALITY / GINI INDEX
275
TOTAL POPULATION
151
MALE POPULATION
124
FEMALE POPULATION
121.77
MALES / 100 FEMALES
82.12
FEMALES / 100 MALES
55.2
MEDIAN AGE
2.9
AVG FAMILY SIZE
2.4
AVG HOUSEHOLD SIZE
147
LABOR FORCE [ PEOPLE ]
58.3%
PERCENT IN LABOR FORCE
1.4%
UNEMPLOYMENT RATE
Petersham Zip Codes
Petersham Area Codes
Income in Petersham
Income Overview in Petersham
Per Capita Income in Petersham is $45,723, while median incomes of families and households are $123,333 and $76,328 respectively.
| Characteristic | Number | Measure |
| Per Capita Income | 275 | $45,723 |
| Median Family Income | 62 | $123,333 |
| Mean Family Income | 62 | $147,098 |
| Median Household Income | 113 | $76,328 |
| Mean Household Income | 113 | $108,269 |
| Income Deficit | 62 | $0 |
| Wage / Income Gap (%) | 275 | 0.00% |
| Wage / Income Gap ($) | 275 | 100.00¢ per $1 |
| Gini / Inequality Index | 275 | 0.43 |
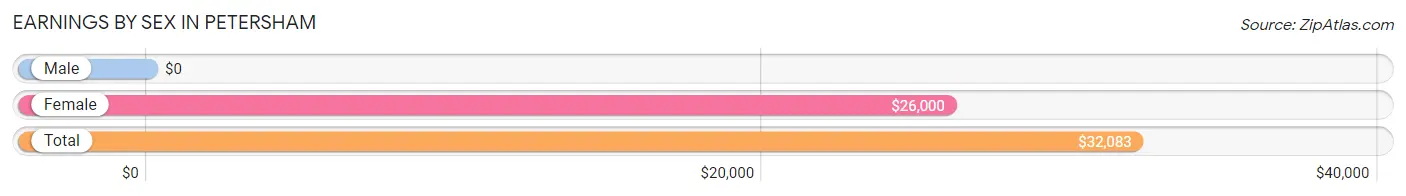
Earnings by Sex in Petersham
| Sex | Number | Average Earnings |
| Male | 72 (44.4%) | $0 |
| Female | 90 (55.6%) | $26,000 |
| Total | 162 (100.0%) | $32,083 |
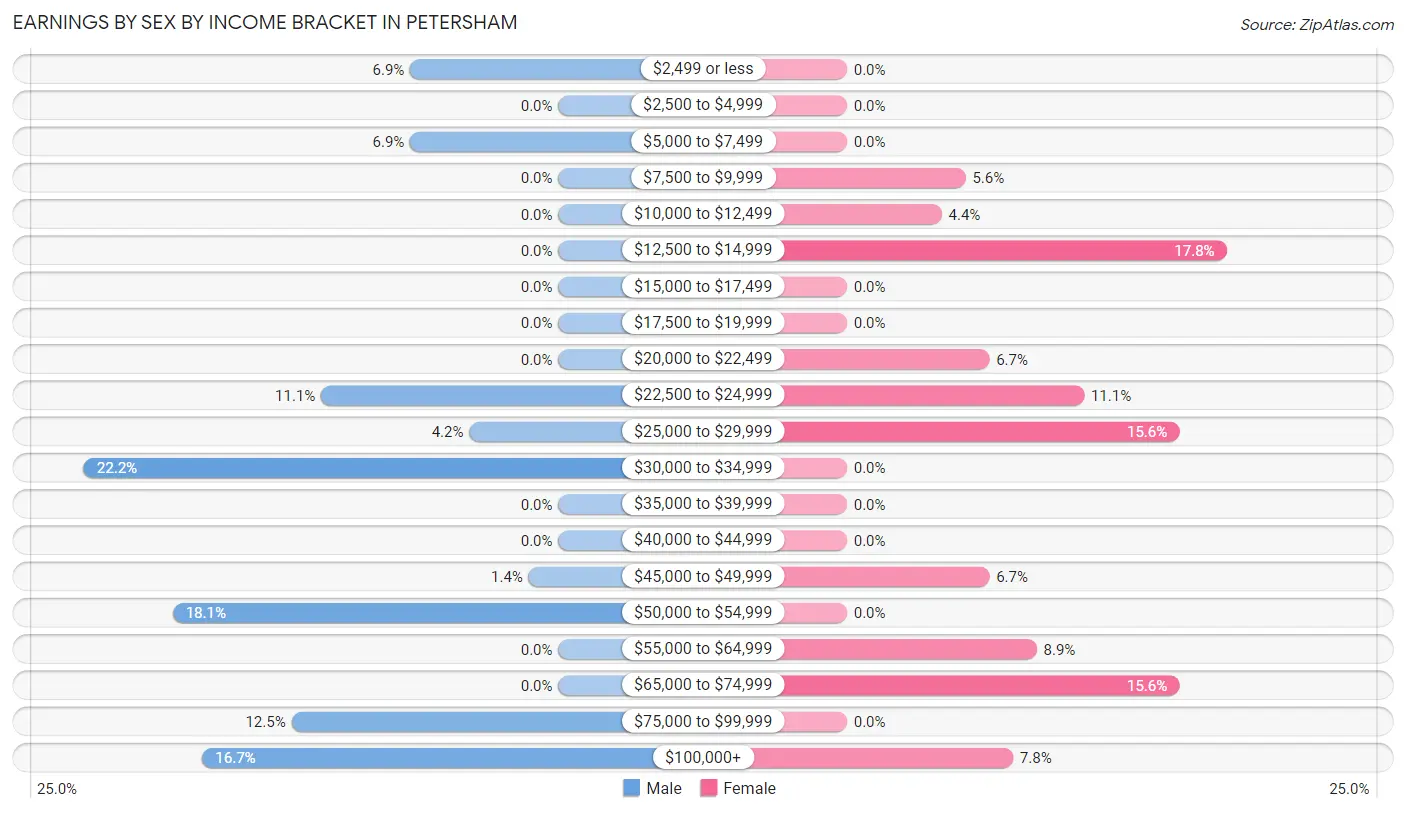
Earnings by Sex by Income Bracket in Petersham
The most common earnings brackets in Petersham are $30,000 to $34,999 for men (16 | 22.2%) and $12,500 to $14,999 for women (16 | 17.8%).
| Income | Male | Female |
| $2,499 or less | 5 (6.9%) | 0 (0.0%) |
| $2,500 to $4,999 | 0 (0.0%) | 0 (0.0%) |
| $5,000 to $7,499 | 5 (6.9%) | 0 (0.0%) |
| $7,500 to $9,999 | 0 (0.0%) | 5 (5.6%) |
| $10,000 to $12,499 | 0 (0.0%) | 4 (4.4%) |
| $12,500 to $14,999 | 0 (0.0%) | 16 (17.8%) |
| $15,000 to $17,499 | 0 (0.0%) | 0 (0.0%) |
| $17,500 to $19,999 | 0 (0.0%) | 0 (0.0%) |
| $20,000 to $22,499 | 0 (0.0%) | 6 (6.7%) |
| $22,500 to $24,999 | 8 (11.1%) | 10 (11.1%) |
| $25,000 to $29,999 | 3 (4.2%) | 14 (15.6%) |
| $30,000 to $34,999 | 16 (22.2%) | 0 (0.0%) |
| $35,000 to $39,999 | 0 (0.0%) | 0 (0.0%) |
| $40,000 to $44,999 | 0 (0.0%) | 0 (0.0%) |
| $45,000 to $49,999 | 1 (1.4%) | 6 (6.7%) |
| $50,000 to $54,999 | 13 (18.1%) | 0 (0.0%) |
| $55,000 to $64,999 | 0 (0.0%) | 8 (8.9%) |
| $65,000 to $74,999 | 0 (0.0%) | 14 (15.6%) |
| $75,000 to $99,999 | 9 (12.5%) | 0 (0.0%) |
| $100,000+ | 12 (16.7%) | 7 (7.8%) |
| Total | 72 (100.0%) | 90 (100.0%) |
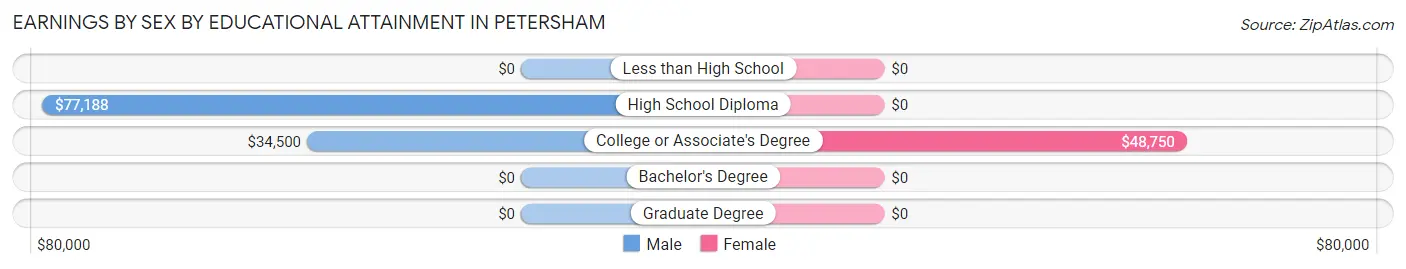
Earnings by Sex by Educational Attainment in Petersham
| Educational Attainment | Male Income | Female Income |
| Less than High School | - | - |
| High School Diploma | $77,188 | $0 |
| College or Associate's Degree | $34,500 | $48,750 |
| Bachelor's Degree | - | - |
| Graduate Degree | - | - |
| Total | - | - |
Family Income in Petersham
Family Income Brackets in Petersham
According to the Petersham family income data, there are 25 families falling into the $100,000 to $149,999 income range, which is the most common income bracket and makes up 40.3% of all families.
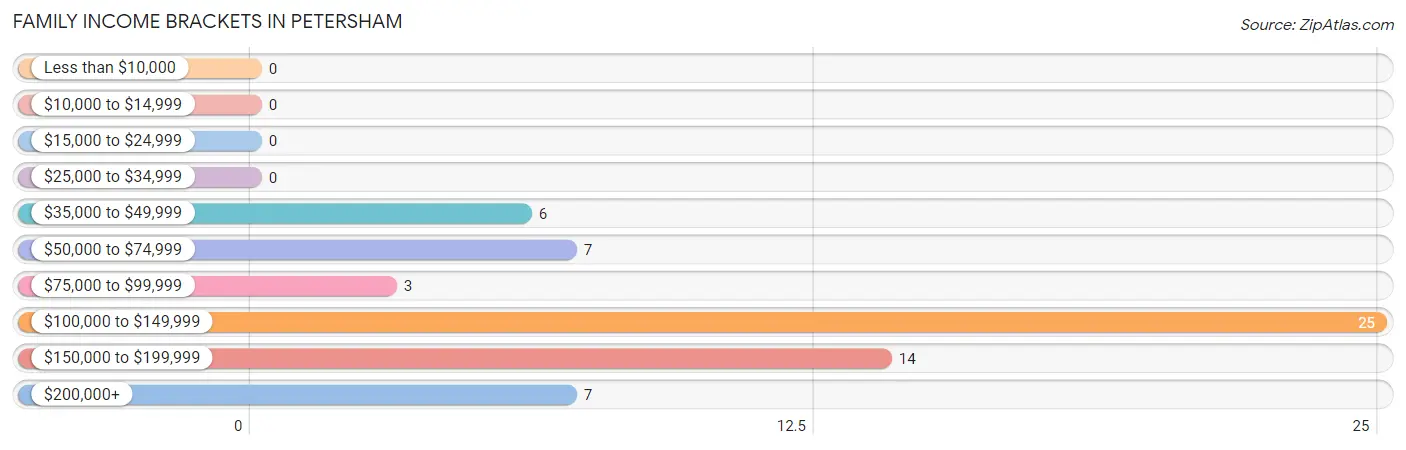
| Income Bracket | # Families | % Families |
| Less than $10,000 | 0 | 0.0% |
| $10,000 to $14,999 | 0 | 0.0% |
| $15,000 to $24,999 | 0 | 0.0% |
| $25,000 to $34,999 | 0 | 0.0% |
| $35,000 to $49,999 | 6 | 9.7% |
| $50,000 to $74,999 | 7 | 11.3% |
| $75,000 to $99,999 | 3 | 4.8% |
| $100,000 to $149,999 | 25 | 40.3% |
| $150,000 to $199,999 | 14 | 22.6% |
| $200,000+ | 7 | 11.3% |
Family Income by Famaliy Size in Petersham
3-person families (17 | 27.4%) account for the highest median family income in Petersham with $186,125 per family, while 3-person families (17 | 27.4%) have the highest median income of $62,042 per family member.
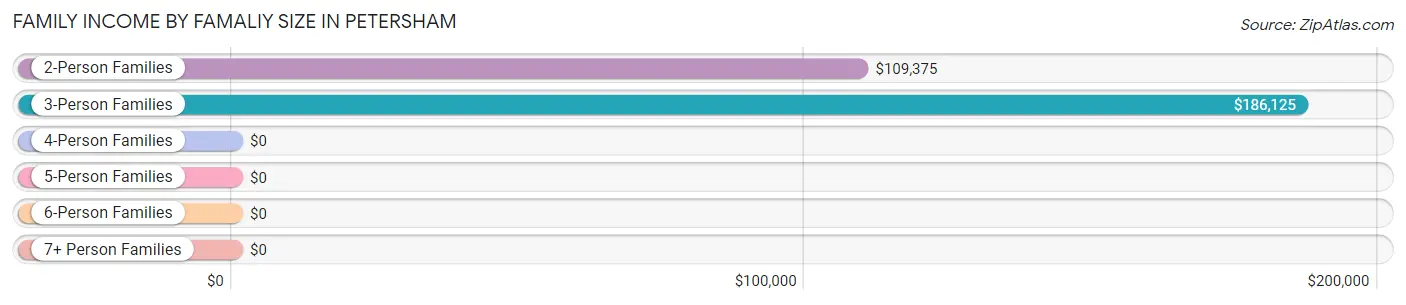
| Income Bracket | # Families | Median Income |
| 2-Person Families | 31 (50.0%) | $109,375 |
| 3-Person Families | 17 (27.4%) | $186,125 |
| 4-Person Families | 10 (16.1%) | $0 |
| 5-Person Families | 4 (6.5%) | $0 |
| 6-Person Families | 0 (0.0%) | $0 |
| 7+ Person Families | 0 (0.0%) | $0 |
| Total | 62 (100.0%) | $123,333 |
Family Income by Number of Earners in Petersham
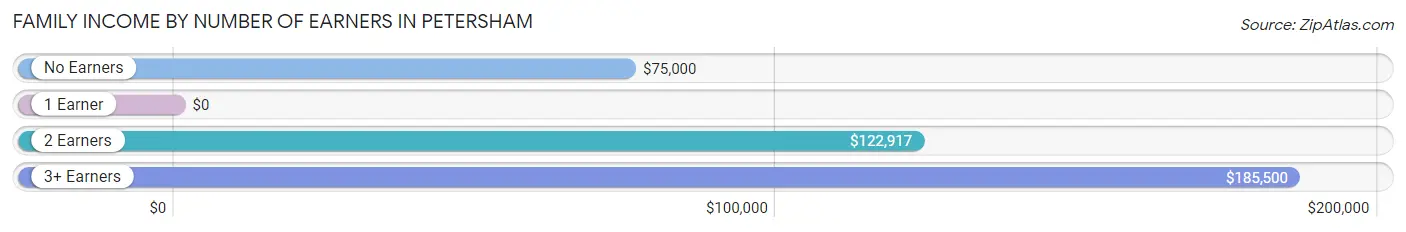
| Number of Earners | # Families | Median Income |
| No Earners | 10 (16.1%) | $75,000 |
| 1 Earner | 5 (8.1%) | $0 |
| 2 Earners | 25 (40.3%) | $122,917 |
| 3+ Earners | 22 (35.5%) | $185,500 |
| Total | 62 (100.0%) | $123,333 |
Household Income in Petersham
Household Income Brackets in Petersham
With 25 households falling in the category, the $100,000 to $149,999 income range is the most frequent in Petersham, accounting for 22.1% of all households.
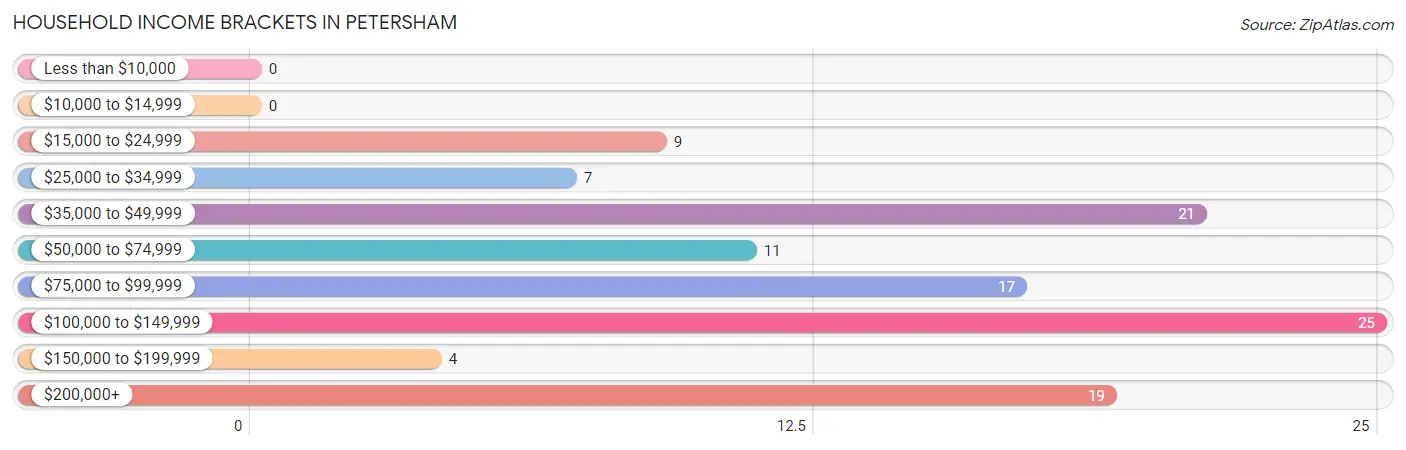
| Income Bracket | # Households | % Households |
| Less than $10,000 | 0 | 0.0% |
| $10,000 to $14,999 | 0 | 0.0% |
| $15,000 to $24,999 | 9 | 8.0% |
| $25,000 to $34,999 | 7 | 6.2% |
| $35,000 to $49,999 | 21 | 18.6% |
| $50,000 to $74,999 | 11 | 9.7% |
| $75,000 to $99,999 | 17 | 15.0% |
| $100,000 to $149,999 | 25 | 22.1% |
| $150,000 to $199,999 | 4 | 3.5% |
| $200,000+ | 19 | 16.8% |
Household Income by Householder Age in Petersham
The median household income in Petersham is $76,328, with the highest median household income of $130,938 found in the 25 to 44 years age bracket for the primary householder. A total of 13 households (11.5%) fall into this category.
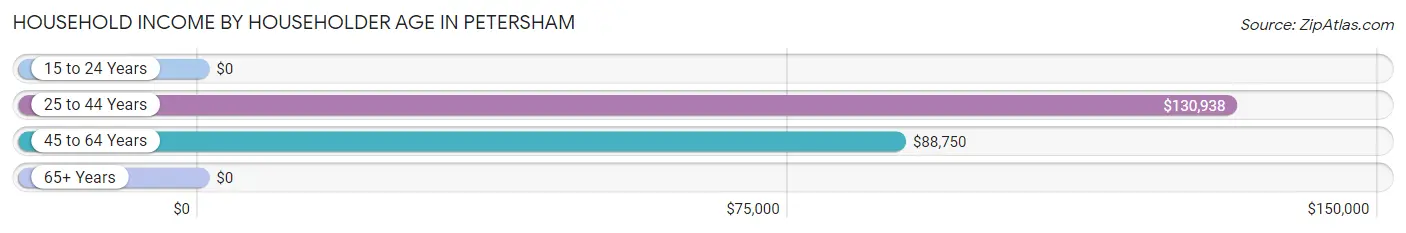
| Income Bracket | # Households | Median Income |
| 15 to 24 Years | 0 (0.0%) | $0 |
| 25 to 44 Years | 13 (11.5%) | $130,938 |
| 45 to 64 Years | 46 (40.7%) | $88,750 |
| 65+ Years | 54 (47.8%) | $0 |
| Total | 113 (100.0%) | $76,328 |
Poverty in Petersham
Income Below Poverty by Sex and Age in Petersham
With 13.2% poverty level for males and 2.4% for females among the residents of Petersham, 55 to 64 year old males and 55 to 64 year old females are the most vulnerable to poverty, with 19 males (48.7%) and 3 females (15.0%) in their respective age groups living below the poverty level.
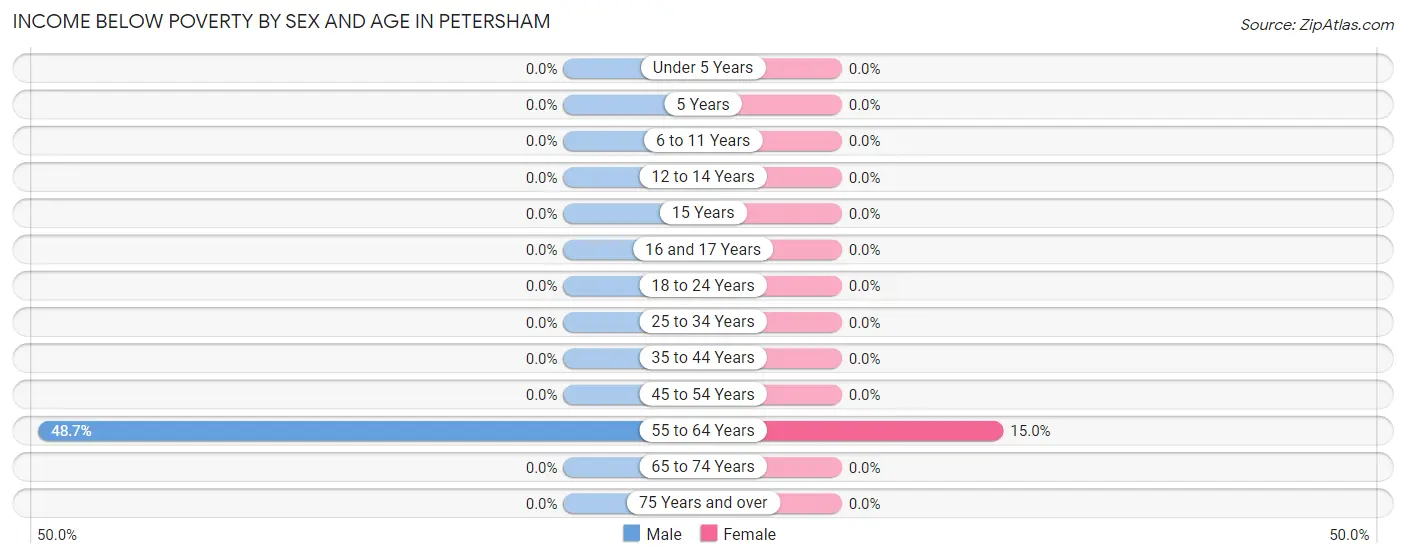
| Age Bracket | Male | Female |
| Under 5 Years | 0 (0.0%) | 0 (0.0%) |
| 5 Years | 0 (0.0%) | 0 (0.0%) |
| 6 to 11 Years | 0 (0.0%) | 0 (0.0%) |
| 12 to 14 Years | 0 (0.0%) | 0 (0.0%) |
| 15 Years | 0 (0.0%) | 0 (0.0%) |
| 16 and 17 Years | 0 (0.0%) | 0 (0.0%) |
| 18 to 24 Years | 0 (0.0%) | 0 (0.0%) |
| 25 to 34 Years | 0 (0.0%) | 0 (0.0%) |
| 35 to 44 Years | 0 (0.0%) | 0 (0.0%) |
| 45 to 54 Years | 0 (0.0%) | 0 (0.0%) |
| 55 to 64 Years | 19 (48.7%) | 3 (15.0%) |
| 65 to 74 Years | 0 (0.0%) | 0 (0.0%) |
| 75 Years and over | 0 (0.0%) | 0 (0.0%) |
| Total | 19 (13.2%) | 3 (2.4%) |
Income Above Poverty by Sex and Age in Petersham
According to the poverty statistics in Petersham, males aged under 5 years and females aged 6 to 11 years are the age groups that are most secure financially, with 100.0% of males and 100.0% of females in these age groups living above the poverty line.
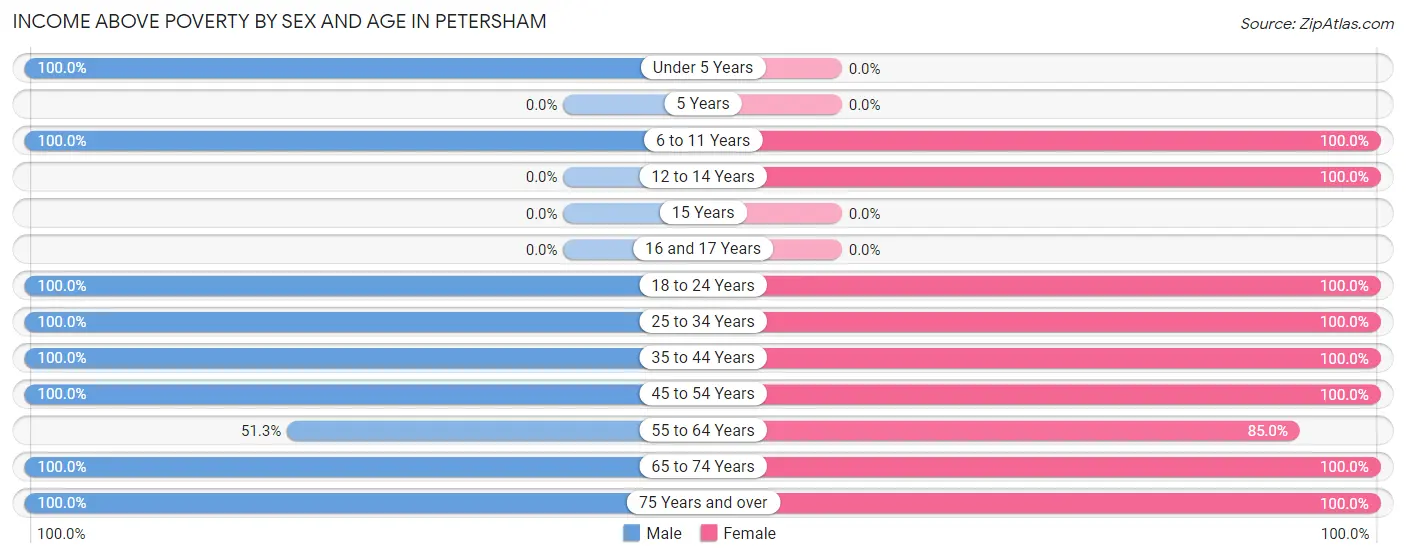
| Age Bracket | Male | Female |
| Under 5 Years | 4 (100.0%) | 0 (0.0%) |
| 5 Years | 0 (0.0%) | 0 (0.0%) |
| 6 to 11 Years | 5 (100.0%) | 3 (100.0%) |
| 12 to 14 Years | 0 (0.0%) | 4 (100.0%) |
| 15 Years | 0 (0.0%) | 0 (0.0%) |
| 16 and 17 Years | 0 (0.0%) | 0 (0.0%) |
| 18 to 24 Years | 9 (100.0%) | 13 (100.0%) |
| 25 to 34 Years | 13 (100.0%) | 16 (100.0%) |
| 35 to 44 Years | 5 (100.0%) | 13 (100.0%) |
| 45 to 54 Years | 17 (100.0%) | 25 (100.0%) |
| 55 to 64 Years | 20 (51.3%) | 17 (85.0%) |
| 65 to 74 Years | 39 (100.0%) | 27 (100.0%) |
| 75 Years and over | 13 (100.0%) | 3 (100.0%) |
| Total | 125 (86.8%) | 121 (97.6%) |
Income Below Poverty Among Married-Couple Families in Petersham
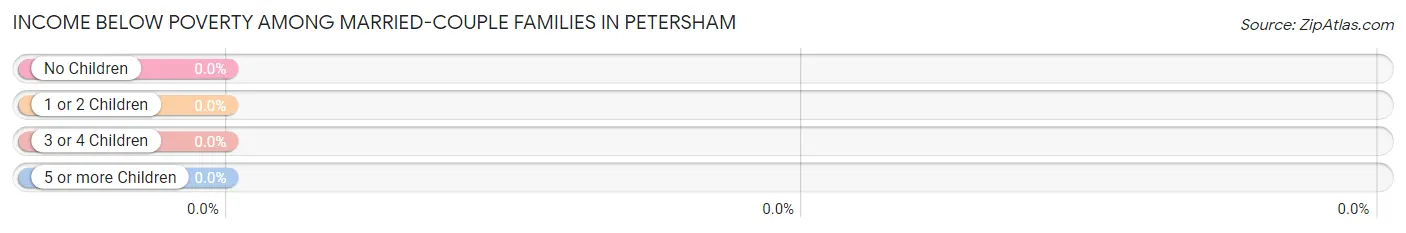
| Children | Above Poverty | Below Poverty |
| No Children | 45 (100.0%) | 0 (0.0%) |
| 1 or 2 Children | 13 (100.0%) | 0 (0.0%) |
| 3 or 4 Children | 0 (0.0%) | 0 (0.0%) |
| 5 or more Children | 0 (0.0%) | 0 (0.0%) |
| Total | 58 (100.0%) | 0 (0.0%) |
Income Below Poverty Among Single-Parent Households in Petersham
| Children | Single Father | Single Mother |
| No Children | 0 (0.0%) | 0 (0.0%) |
| 1 or 2 Children | 0 (0.0%) | 0 (0.0%) |
| 3 or 4 Children | 0 (0.0%) | 0 (0.0%) |
| 5 or more Children | 0 (0.0%) | 0 (0.0%) |
| Total | 0 (0.0%) | 0 (0.0%) |
Income Below Poverty Among Married-Couple vs Single-Parent Households in Petersham
| Children | Married-Couple Families | Single-Parent Households |
| No Children | 0 (0.0%) | 0 (0.0%) |
| 1 or 2 Children | 0 (0.0%) | 0 (0.0%) |
| 3 or 4 Children | 0 (0.0%) | 0 (0.0%) |
| 5 or more Children | 0 (0.0%) | 0 (0.0%) |
| Total | 0 (0.0%) | 0 (0.0%) |
Race in Petersham
The most populous races in Petersham are White / Caucasian (243 | 88.4%), Hispanic or Latino (31 | 11.3%), and Two or more Races (27 | 9.8%).
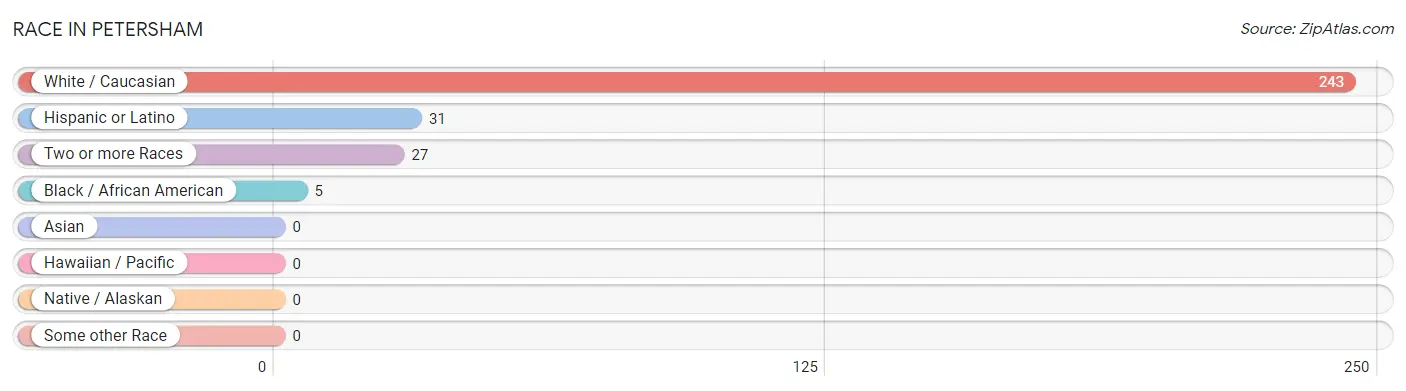
| Race | # Population | % Population |
| Asian | 0 | 0.0% |
| Black / African American | 5 | 1.8% |
| Hawaiian / Pacific | 0 | 0.0% |
| Hispanic or Latino | 31 | 11.3% |
| Native / Alaskan | 0 | 0.0% |
| White / Caucasian | 243 | 88.4% |
| Two or more Races | 27 | 9.8% |
| Some other Race | 0 | 0.0% |
| Total | 275 | 100.0% |
Ancestry in Petersham
The most populous ancestries reported in Petersham are Irish (81 | 29.4%), English (66 | 24.0%), German (39 | 14.2%), French Canadian (21 | 7.6%), and Cuban (18 | 6.6%), together accounting for 81.8% of all Petersham residents.
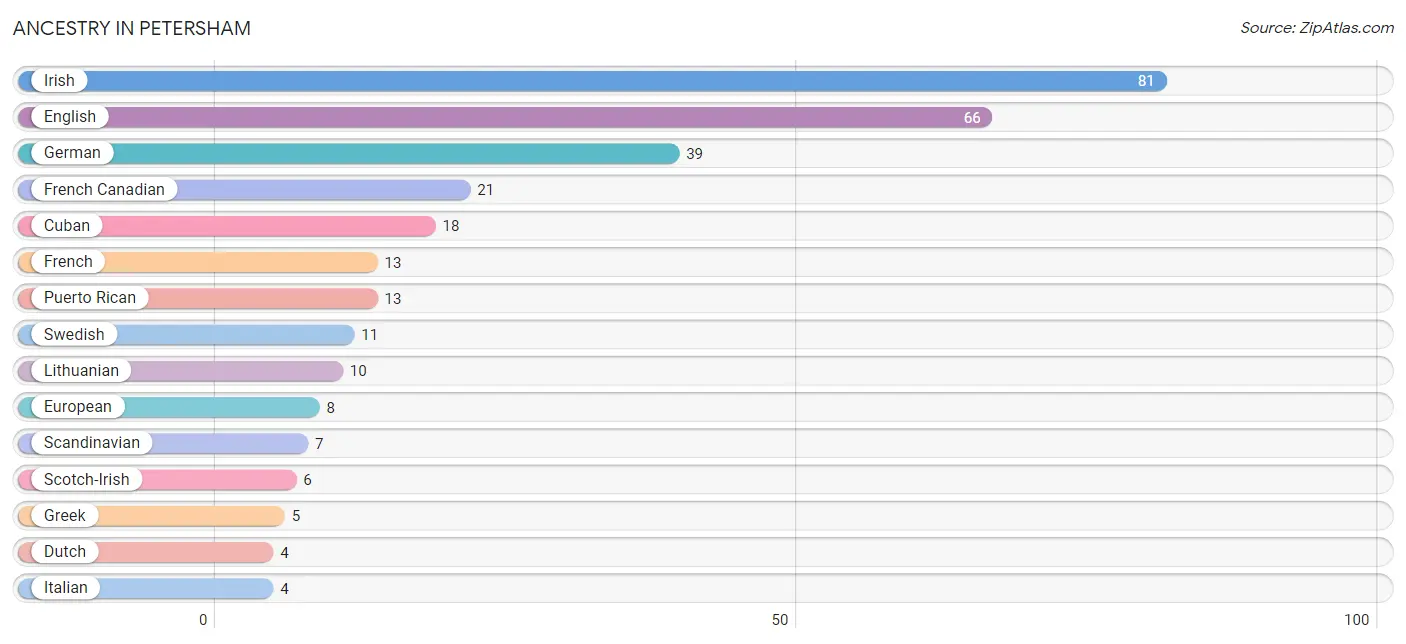
| Ancestry | # Population | % Population |
| Armenian | 3 | 1.1% |
| Canadian | 3 | 1.1% |
| Cuban | 18 | 6.6% |
| Dutch | 4 | 1.5% |
| English | 66 | 24.0% |
| European | 8 | 2.9% |
| French | 13 | 4.7% |
| French Canadian | 21 | 7.6% |
| German | 39 | 14.2% |
| Greek | 5 | 1.8% |
| Irish | 81 | 29.4% |
| Iroquois | 3 | 1.1% |
| Italian | 4 | 1.5% |
| Lithuanian | 10 | 3.6% |
| Polish | 3 | 1.1% |
| Puerto Rican | 13 | 4.7% |
| Russian | 3 | 1.1% |
| Scandinavian | 7 | 2.5% |
| Scotch-Irish | 6 | 2.2% |
| Scottish | 3 | 1.1% |
| Swedish | 11 | 4.0% | View All 21 Rows |
Immigrants in Petersham

| Immigration Origin | # Population | % Population | View All 0 Rows |
Sex and Age in Petersham
Sex and Age in Petersham
The most populous age groups in Petersham are 55 to 59 Years (33 | 21.8%) for men and 50 to 54 Years (20 | 16.1%) for women.
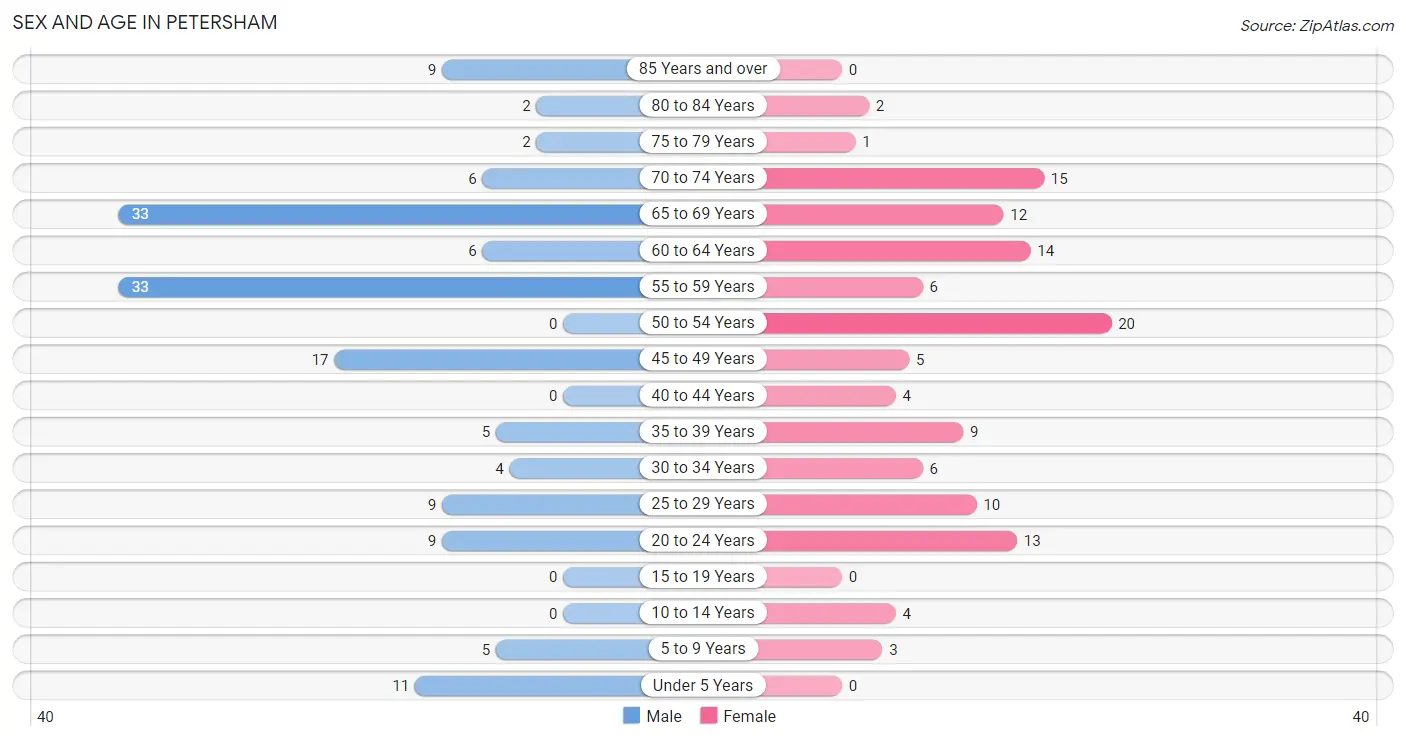
| Age Bracket | Male | Female |
| Under 5 Years | 11 (7.3%) | 0 (0.0%) |
| 5 to 9 Years | 5 (3.3%) | 3 (2.4%) |
| 10 to 14 Years | 0 (0.0%) | 4 (3.2%) |
| 15 to 19 Years | 0 (0.0%) | 0 (0.0%) |
| 20 to 24 Years | 9 (6.0%) | 13 (10.5%) |
| 25 to 29 Years | 9 (6.0%) | 10 (8.1%) |
| 30 to 34 Years | 4 (2.6%) | 6 (4.8%) |
| 35 to 39 Years | 5 (3.3%) | 9 (7.3%) |
| 40 to 44 Years | 0 (0.0%) | 4 (3.2%) |
| 45 to 49 Years | 17 (11.3%) | 5 (4.0%) |
| 50 to 54 Years | 0 (0.0%) | 20 (16.1%) |
| 55 to 59 Years | 33 (21.8%) | 6 (4.8%) |
| 60 to 64 Years | 6 (4.0%) | 14 (11.3%) |
| 65 to 69 Years | 33 (21.8%) | 12 (9.7%) |
| 70 to 74 Years | 6 (4.0%) | 15 (12.1%) |
| 75 to 79 Years | 2 (1.3%) | 1 (0.8%) |
| 80 to 84 Years | 2 (1.3%) | 2 (1.6%) |
| 85 Years and over | 9 (6.0%) | 0 (0.0%) |
| Total | 151 (100.0%) | 124 (100.0%) |
Families and Households in Petersham
Median Family Size in Petersham
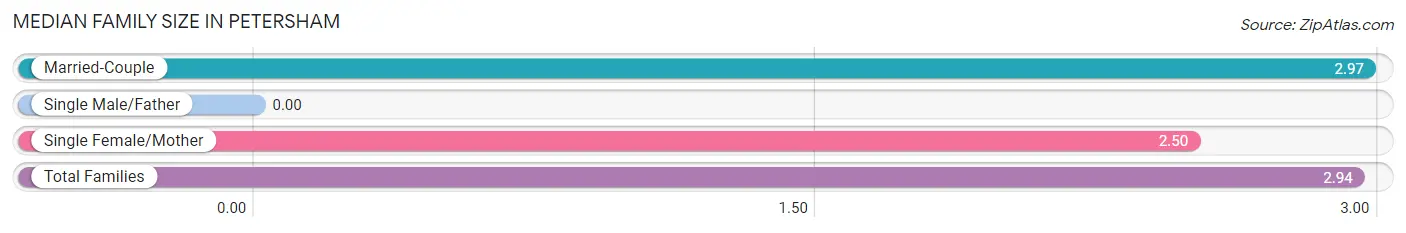
| Family Type | # Families | Family Size |
| Married-Couple | 58 (93.5%) | 2.97 |
| Single Male/Father | 0 (0.0%) | - |
| Single Female/Mother | 4 (6.5%) | 2.50 |
| Total Families | 62 (100.0%) | 2.94 |
Median Household Size in Petersham
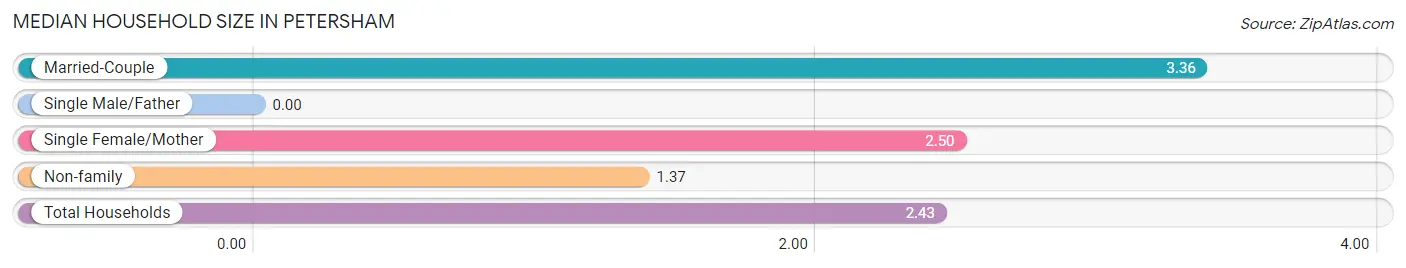
| Household Type | # Households | Household Size |
| Married-Couple | 58 (51.3%) | 3.36 |
| Single Male/Father | 0 (0.0%) | - |
| Single Female/Mother | 4 (3.5%) | 2.50 |
| Non-family | 51 (45.1%) | 1.37 |
| Total Households | 113 (100.0%) | 2.43 |
Household Size by Marriage Status in Petersham
Out of a total of 113 households in Petersham, 62 (54.9%) are family households, while 51 (45.1%) are nonfamily households. The most numerous type of family households are 2-person households, comprising 31, and the most common type of nonfamily households are 1-person households, comprising 40.
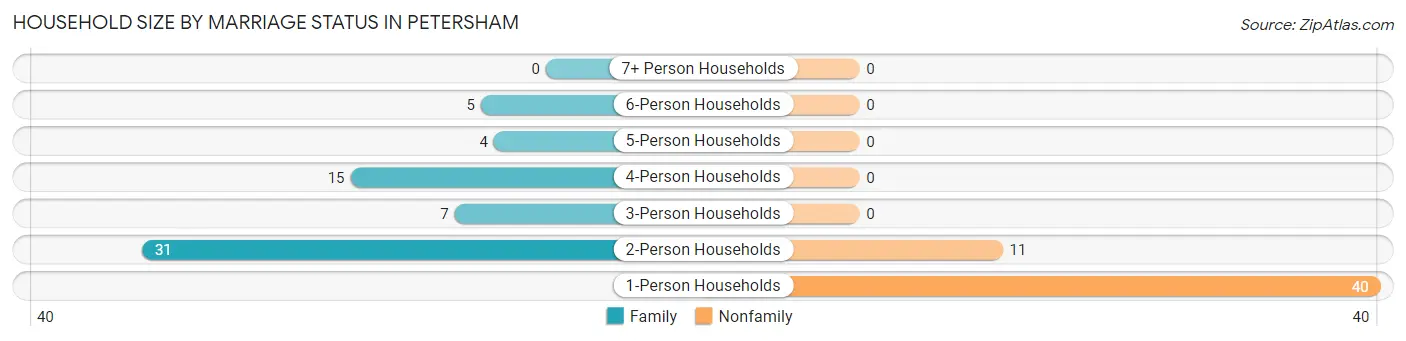
| Household Size | Family Households | Nonfamily Households |
| 1-Person Households | - | 40 (35.4%) |
| 2-Person Households | 31 (27.4%) | 11 (9.7%) |
| 3-Person Households | 7 (6.2%) | 0 (0.0%) |
| 4-Person Households | 15 (13.3%) | 0 (0.0%) |
| 5-Person Households | 4 (3.5%) | 0 (0.0%) |
| 6-Person Households | 5 (4.4%) | 0 (0.0%) |
| 7+ Person Households | 0 (0.0%) | 0 (0.0%) |
| Total | 62 (54.9%) | 51 (45.1%) |
Female Fertility in Petersham
Fertility by Age in Petersham
| Age Bracket | Women with Births | Births / 1,000 Women |
| 15 to 19 years | 0 (0.0%) | 0.0 |
| 20 to 34 years | 0 (0.0%) | 0.0 |
| 35 to 50 years | 0 (0.0%) | 0.0 |
| Total | 0 (0.0%) | 0.0 |
Fertility by Age by Marriage Status in Petersham
| Age Bracket | Married | Unmarried |
| 15 to 19 years | 0 (0.0%) | 0 (0.0%) |
| 20 to 34 years | 0 (0.0%) | 0 (0.0%) |
| 35 to 50 years | 0 (0.0%) | 0 (0.0%) |
| Total | 0 (0.0%) | 0 (0.0%) |
Fertility by Education in Petersham
| Educational Attainment | Women with Births | Births / 1,000 Women |
| Less than High School | 0 (0.0%) | 0.0 |
| High School Diploma | 0 (0.0%) | 0.0 |
| College or Associate's Degree | 0 (0.0%) | 0.0 |
| Bachelor's Degree | 0 (0.0%) | 0.0 |
| Graduate Degree | 0 (0.0%) | 0.0 |
| Total | 0 (0.0%) | 0.0 |
Fertility by Education by Marriage Status in Petersham
| Educational Attainment | Married | Unmarried |
| Less than High School | 0 (0.0%) | 0 (0.0%) |
| High School Diploma | 0 (0.0%) | 0 (0.0%) |
| College or Associate's Degree | 0 (0.0%) | 0 (0.0%) |
| Bachelor's Degree | 0 (0.0%) | 0 (0.0%) |
| Graduate Degree | 0 (0.0%) | 0 (0.0%) |
| Total | 0 (0.0%) | 0 (0.0%) |
Employment Characteristics in Petersham
Employment by Class of Employer in Petersham
Among the 145 employed individuals in Petersham, private company employees (66 | 45.5%), not-for-profit organizations (34 | 23.4%), and local government employees (13 | 9.0%) make up the most common classes of employment.
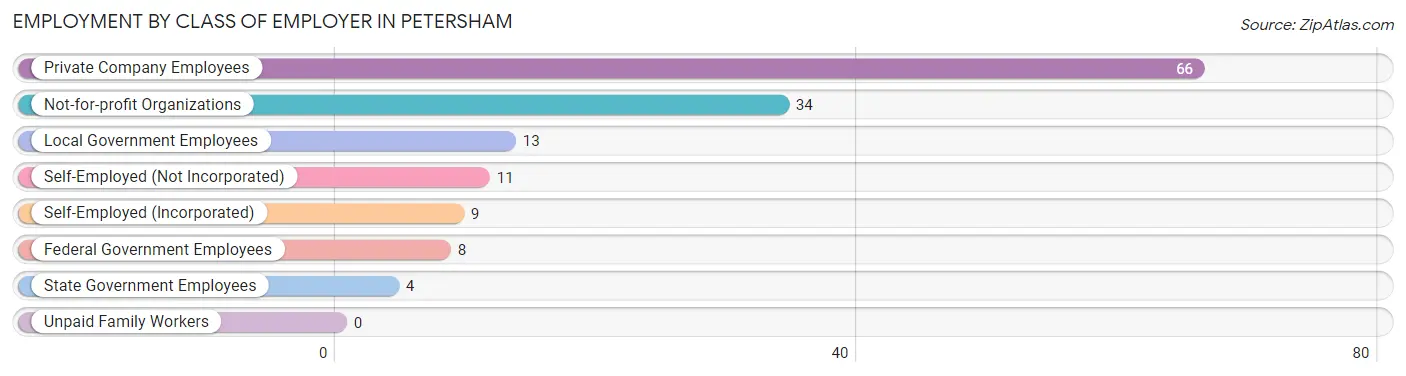
| Employer Class | # Employees | % Employees |
| Private Company Employees | 66 | 45.5% |
| Self-Employed (Incorporated) | 9 | 6.2% |
| Self-Employed (Not Incorporated) | 11 | 7.6% |
| Not-for-profit Organizations | 34 | 23.4% |
| Local Government Employees | 13 | 9.0% |
| State Government Employees | 4 | 2.8% |
| Federal Government Employees | 8 | 5.5% |
| Unpaid Family Workers | 0 | 0.0% |
| Total | 145 | 100.0% |
Employment Status by Age in Petersham
According to the labor force statistics for Petersham, out of the total population over 16 years of age (252), 58.3% or 147 individuals are in the labor force, with 1.4% or 2 of them unemployed. The age group with the highest labor force participation rate is 20 to 24 years, with 100.0% or 22 individuals in the labor force. Within the labor force, the 60 to 64 years age range has the highest percentage of unemployed individuals, with 11.8% or 2 of them being unemployed.
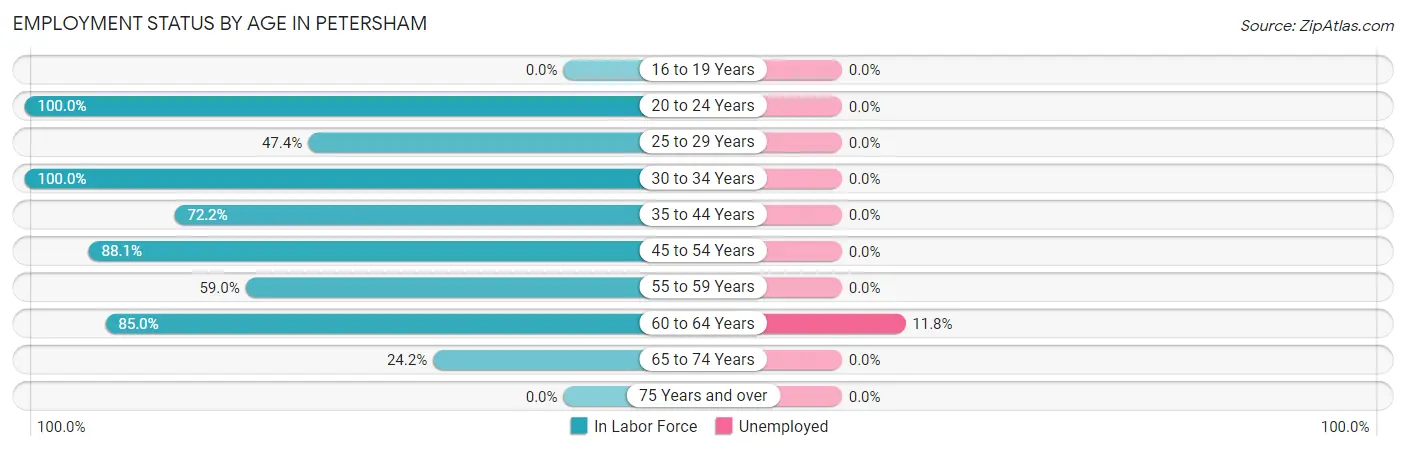
| Age Bracket | In Labor Force | Unemployed |
| 16 to 19 Years | 0 (0.0%) | 0 (0.0%) |
| 20 to 24 Years | 22 (100.0%) | 0 (0.0%) |
| 25 to 29 Years | 9 (47.4%) | 0 (0.0%) |
| 30 to 34 Years | 10 (100.0%) | 0 (0.0%) |
| 35 to 44 Years | 13 (72.2%) | 0 (0.0%) |
| 45 to 54 Years | 37 (88.1%) | 0 (0.0%) |
| 55 to 59 Years | 23 (59.0%) | 0 (0.0%) |
| 60 to 64 Years | 17 (85.0%) | 2 (11.8%) |
| 65 to 74 Years | 16 (24.2%) | 0 (0.0%) |
| 75 Years and over | 0 (0.0%) | 0 (0.0%) |
| Total | 147 (58.3%) | 2 (1.4%) |
Employment Status by Educational Attainment in Petersham
According to labor force statistics for Petersham, 73.6% of individuals (109) out of the total population between 25 and 64 years of age (148) are in the labor force, with 1.8% or 2 of them being unemployed. The group with the highest labor force participation rate are those with the educational attainment of college / associate degree, with 100.0% or 69 individuals in the labor force. Within the labor force, individuals with high school diploma education have the highest percentage of unemployment, with 10.5% or 2 of them being unemployed.
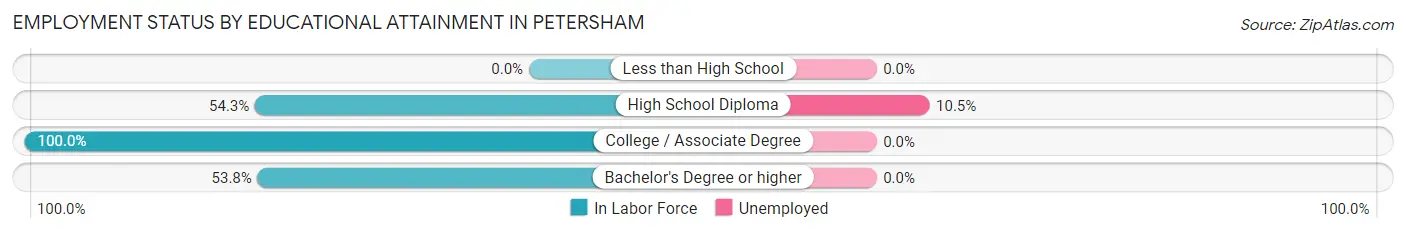
| Educational Attainment | In Labor Force | Unemployed |
| Less than High School | 0 (0.0%) | 0 (0.0%) |
| High School Diploma | 19 (54.3%) | 4 (10.5%) |
| College / Associate Degree | 69 (100.0%) | 0 (0.0%) |
| Bachelor's Degree or higher | 21 (53.8%) | 0 (0.0%) |
| Total | 109 (73.6%) | 3 (1.8%) |
Employment Occupations by Sex in Petersham
Management, Business, Science and Arts Occupations
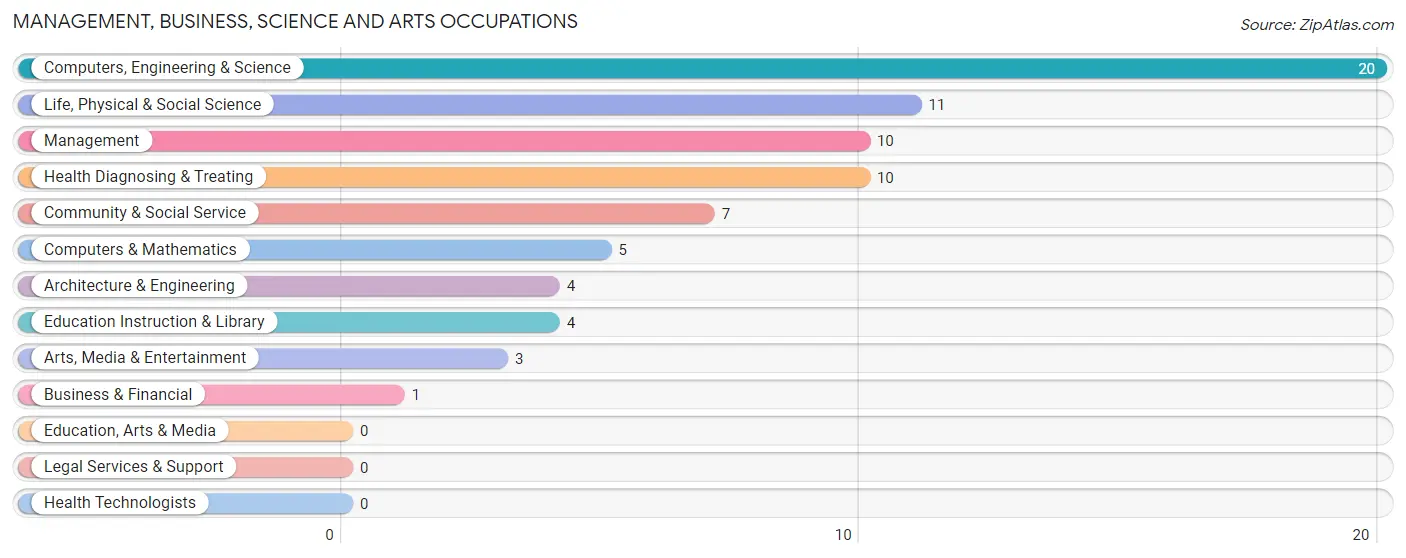
The most common Management, Business, Science and Arts occupations in Petersham are Computers, Engineering & Science (20 | 13.8%), Life, Physical & Social Science (11 | 7.6%), Management (10 | 6.9%), Health Diagnosing & Treating (10 | 6.9%), and Community & Social Service (7 | 4.8%).
Management, Business, Science and Arts Occupations by Sex
Within the Management, Business, Science and Arts occupations in Petersham, the most male-oriented occupations are Business & Financial (100.0%), Life, Physical & Social Science (100.0%), and Arts, Media & Entertainment (100.0%), while the most female-oriented occupations are Computers & Mathematics (100.0%), Architecture & Engineering (100.0%), and Health Diagnosing & Treating (100.0%).
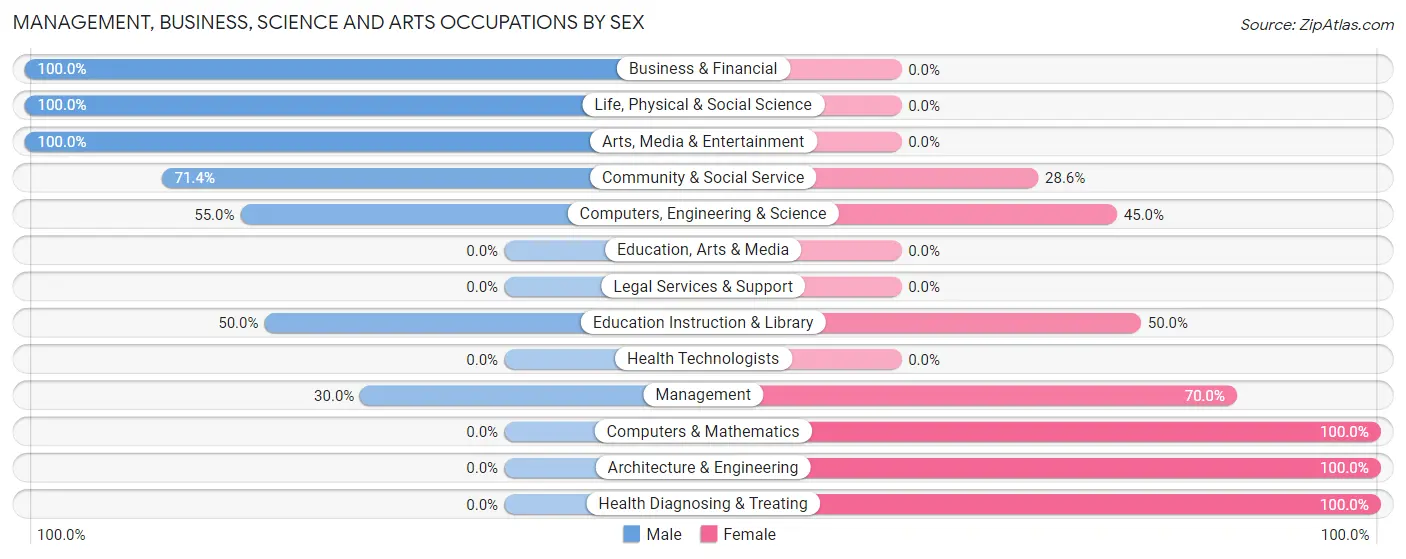
| Occupation | Male | Female |
| Management | 3 (30.0%) | 7 (70.0%) |
| Business & Financial | 1 (100.0%) | 0 (0.0%) |
| Computers, Engineering & Science | 11 (55.0%) | 9 (45.0%) |
| Computers & Mathematics | 0 (0.0%) | 5 (100.0%) |
| Architecture & Engineering | 0 (0.0%) | 4 (100.0%) |
| Life, Physical & Social Science | 11 (100.0%) | 0 (0.0%) |
| Community & Social Service | 5 (71.4%) | 2 (28.6%) |
| Education, Arts & Media | 0 (0.0%) | 0 (0.0%) |
| Legal Services & Support | 0 (0.0%) | 0 (0.0%) |
| Education Instruction & Library | 2 (50.0%) | 2 (50.0%) |
| Arts, Media & Entertainment | 3 (100.0%) | 0 (0.0%) |
| Health Diagnosing & Treating | 0 (0.0%) | 10 (100.0%) |
| Health Technologists | 0 (0.0%) | 0 (0.0%) |
| Total (Category) | 20 (41.7%) | 28 (58.3%) |
| Total (Overall) | 65 (44.8%) | 80 (55.2%) |
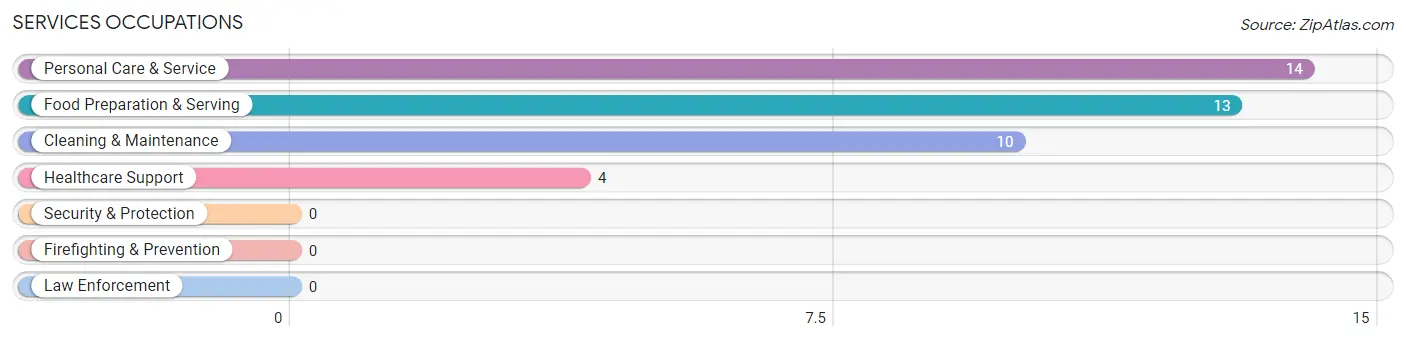
Services Occupations
The most common Services occupations in Petersham are Personal Care & Service (14 | 9.7%), Food Preparation & Serving (13 | 9.0%), Cleaning & Maintenance (10 | 6.9%), and Healthcare Support (4 | 2.8%).
Services Occupations by Sex
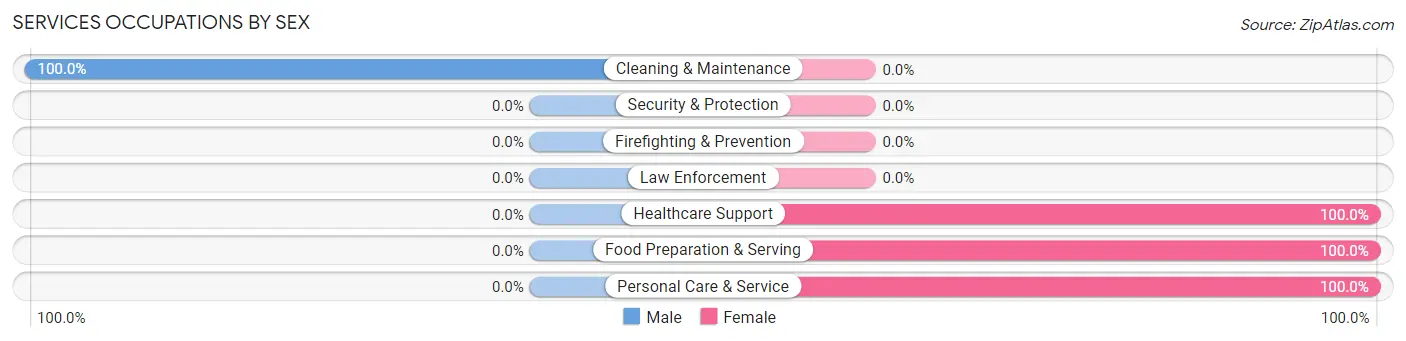
| Occupation | Male | Female |
| Healthcare Support | 0 (0.0%) | 4 (100.0%) |
| Security & Protection | 0 (0.0%) | 0 (0.0%) |
| Firefighting & Prevention | 0 (0.0%) | 0 (0.0%) |
| Law Enforcement | 0 (0.0%) | 0 (0.0%) |
| Food Preparation & Serving | 0 (0.0%) | 13 (100.0%) |
| Cleaning & Maintenance | 10 (100.0%) | 0 (0.0%) |
| Personal Care & Service | 0 (0.0%) | 14 (100.0%) |
| Total (Category) | 10 (24.4%) | 31 (75.6%) |
| Total (Overall) | 65 (44.8%) | 80 (55.2%) |
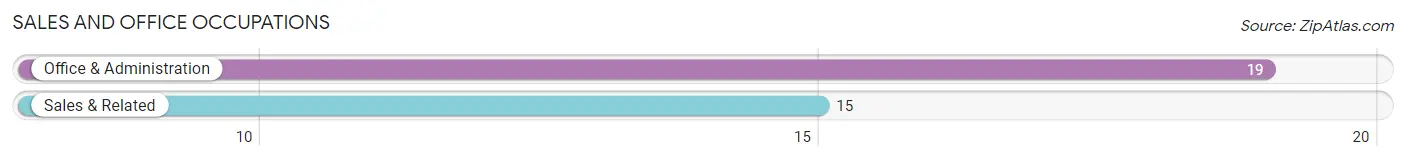
Sales and Office Occupations
The most common Sales and Office occupations in Petersham are Office & Administration (19 | 13.1%), and Sales & Related (15 | 10.3%).
Sales and Office Occupations by Sex
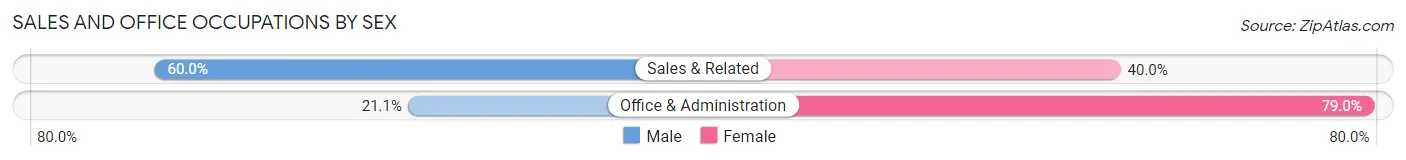
| Occupation | Male | Female |
| Sales & Related | 9 (60.0%) | 6 (40.0%) |
| Office & Administration | 4 (21.0%) | 15 (78.9%) |
| Total (Category) | 13 (38.2%) | 21 (61.8%) |
| Total (Overall) | 65 (44.8%) | 80 (55.2%) |
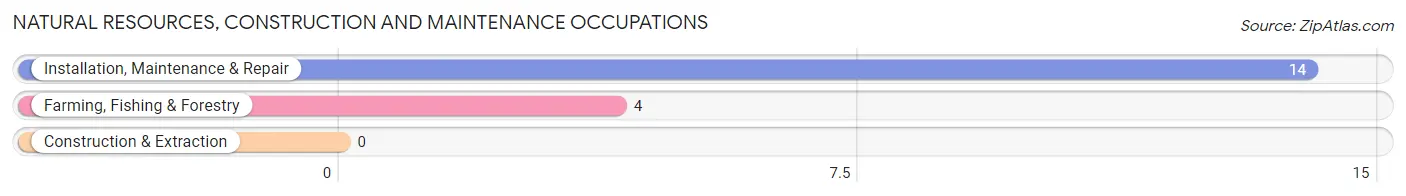
Natural Resources, Construction and Maintenance Occupations
The most common Natural Resources, Construction and Maintenance occupations in Petersham are Installation, Maintenance & Repair (14 | 9.7%), and Farming, Fishing & Forestry (4 | 2.8%).
Natural Resources, Construction and Maintenance Occupations by Sex
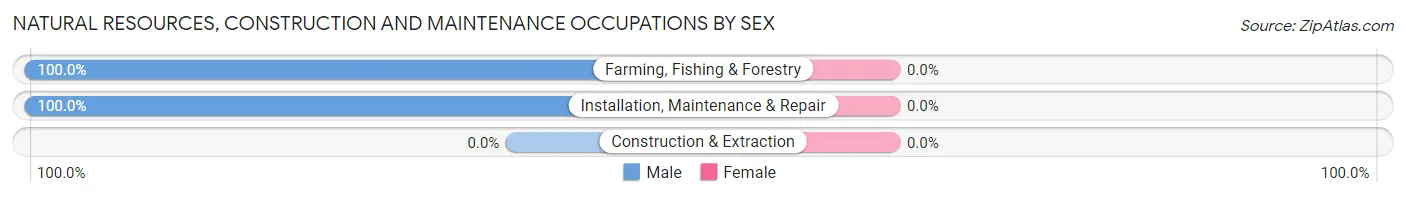
| Occupation | Male | Female |
| Farming, Fishing & Forestry | 4 (100.0%) | 0 (0.0%) |
| Construction & Extraction | 0 (0.0%) | 0 (0.0%) |
| Installation, Maintenance & Repair | 14 (100.0%) | 0 (0.0%) |
| Total (Category) | 18 (100.0%) | 0 (0.0%) |
| Total (Overall) | 65 (44.8%) | 80 (55.2%) |
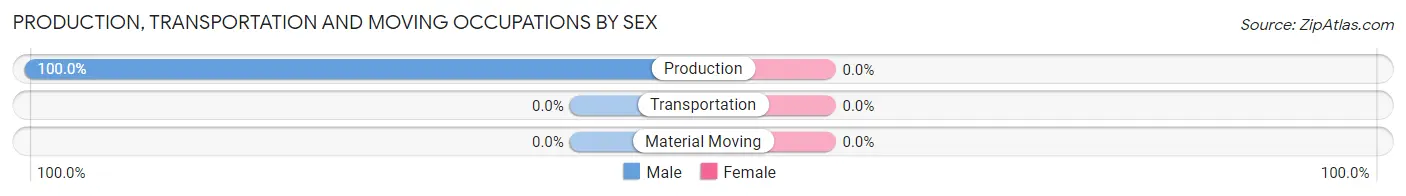
Production, Transportation and Moving Occupations
The most common Production, Transportation and Moving occupations in Petersham are , and Production (4 | 2.8%).
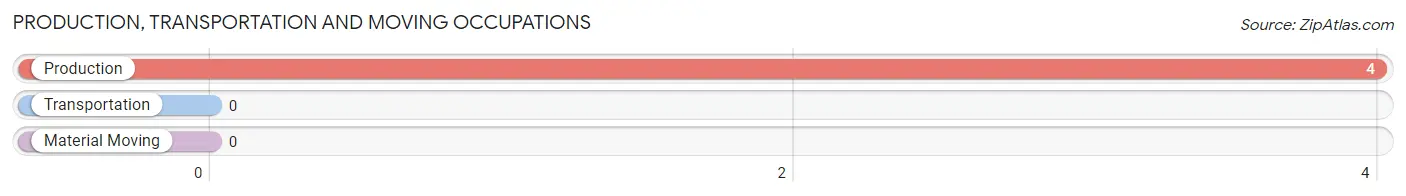
Production, Transportation and Moving Occupations by Sex
| Occupation | Male | Female |
| Production | 4 (100.0%) | 0 (0.0%) |
| Transportation | 0 (0.0%) | 0 (0.0%) |
| Material Moving | 0 (0.0%) | 0 (0.0%) |
| Total (Category) | 4 (100.0%) | 0 (0.0%) |
| Total (Overall) | 65 (44.8%) | 80 (55.2%) |
Employment Industries by Sex in Petersham
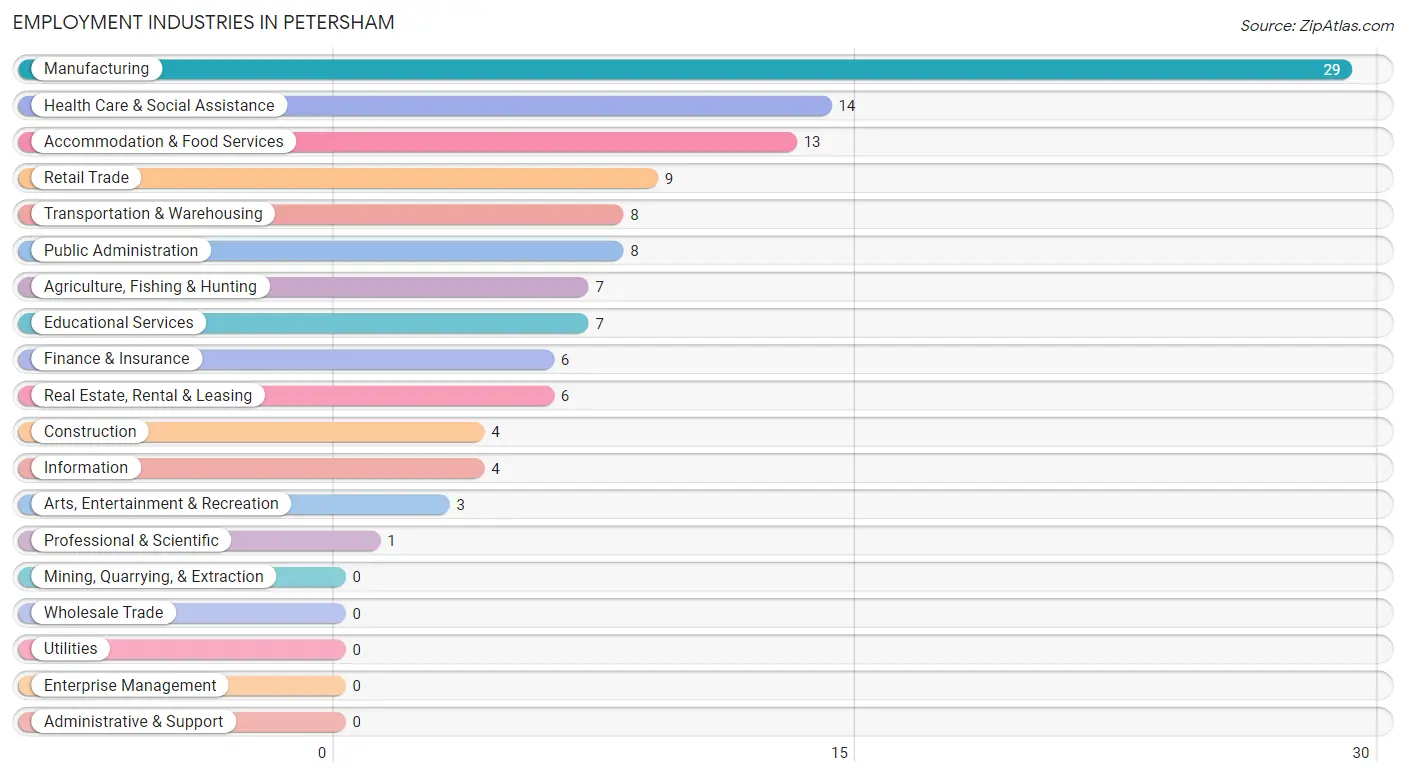
Employment Industries in Petersham
The major employment industries in Petersham include Manufacturing (29 | 20.0%), Health Care & Social Assistance (14 | 9.7%), Accommodation & Food Services (13 | 9.0%), Retail Trade (9 | 6.2%), and Transportation & Warehousing (8 | 5.5%).
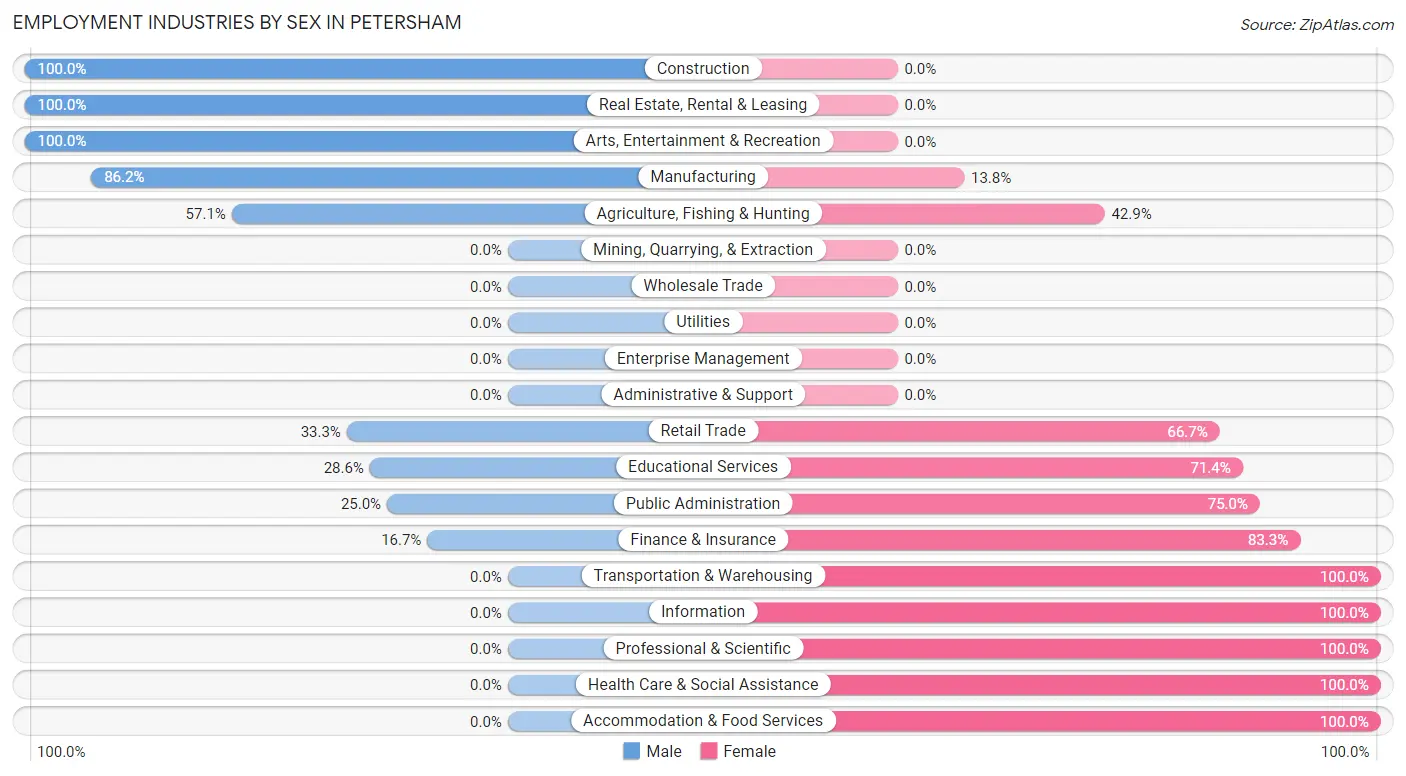
Employment Industries by Sex in Petersham
The Petersham industries that see more men than women are Construction (100.0%), Real Estate, Rental & Leasing (100.0%), and Arts, Entertainment & Recreation (100.0%), whereas the industries that tend to have a higher number of women are Transportation & Warehousing (100.0%), Information (100.0%), and Professional & Scientific (100.0%).
| Industry | Male | Female |
| Agriculture, Fishing & Hunting | 4 (57.1%) | 3 (42.9%) |
| Mining, Quarrying, & Extraction | 0 (0.0%) | 0 (0.0%) |
| Construction | 4 (100.0%) | 0 (0.0%) |
| Manufacturing | 25 (86.2%) | 4 (13.8%) |
| Wholesale Trade | 0 (0.0%) | 0 (0.0%) |
| Retail Trade | 3 (33.3%) | 6 (66.7%) |
| Transportation & Warehousing | 0 (0.0%) | 8 (100.0%) |
| Utilities | 0 (0.0%) | 0 (0.0%) |
| Information | 0 (0.0%) | 4 (100.0%) |
| Finance & Insurance | 1 (16.7%) | 5 (83.3%) |
| Real Estate, Rental & Leasing | 6 (100.0%) | 0 (0.0%) |
| Professional & Scientific | 0 (0.0%) | 1 (100.0%) |
| Enterprise Management | 0 (0.0%) | 0 (0.0%) |
| Administrative & Support | 0 (0.0%) | 0 (0.0%) |
| Educational Services | 2 (28.6%) | 5 (71.4%) |
| Health Care & Social Assistance | 0 (0.0%) | 14 (100.0%) |
| Arts, Entertainment & Recreation | 3 (100.0%) | 0 (0.0%) |
| Accommodation & Food Services | 0 (0.0%) | 13 (100.0%) |
| Public Administration | 2 (25.0%) | 6 (75.0%) |
| Total | 65 (44.8%) | 80 (55.2%) |
Education in Petersham
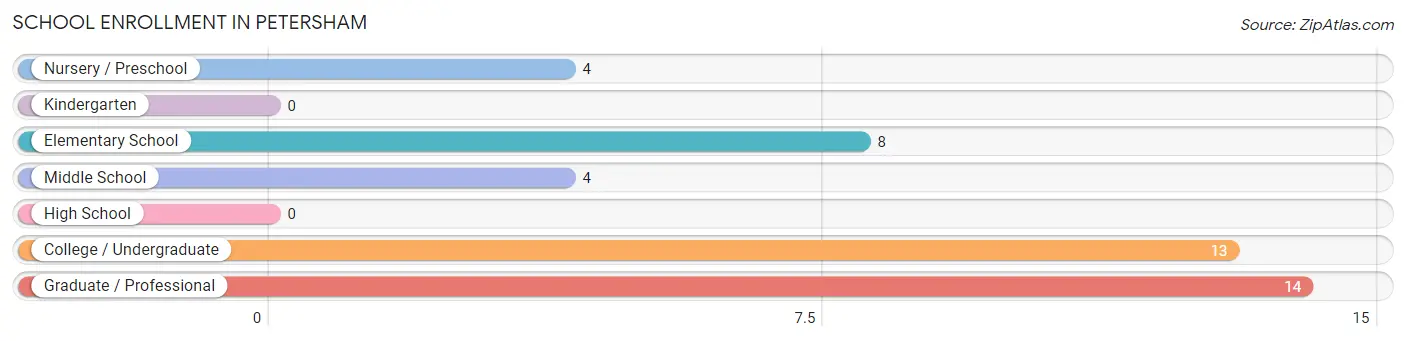
School Enrollment in Petersham
The most common levels of schooling among the 43 students in Petersham are graduate / professional (14 | 32.6%), college / undergraduate (13 | 30.2%), and elementary school (8 | 18.6%).
| School Level | # Students | % Students |
| Nursery / Preschool | 4 | 9.3% |
| Kindergarten | 0 | 0.0% |
| Elementary School | 8 | 18.6% |
| Middle School | 4 | 9.3% |
| High School | 0 | 0.0% |
| College / Undergraduate | 13 | 30.2% |
| Graduate / Professional | 14 | 32.6% |
| Total | 43 | 100.0% |
School Enrollment by Age by Funding Source in Petersham
Out of a total of 43 students who are enrolled in schools in Petersham, 14 (32.6%) attend a private institution, while the remaining 29 (67.4%) are enrolled in public schools. The age group of 3 to 4 year olds has the highest likelihood of being enrolled in private schools, with 4 (100.0% in the age bracket) enrolled. Conversely, the age group of 5 to 9 year old has the lowest likelihood of being enrolled in a private school, with 8 (100.0% in the age bracket) attending a public institution.
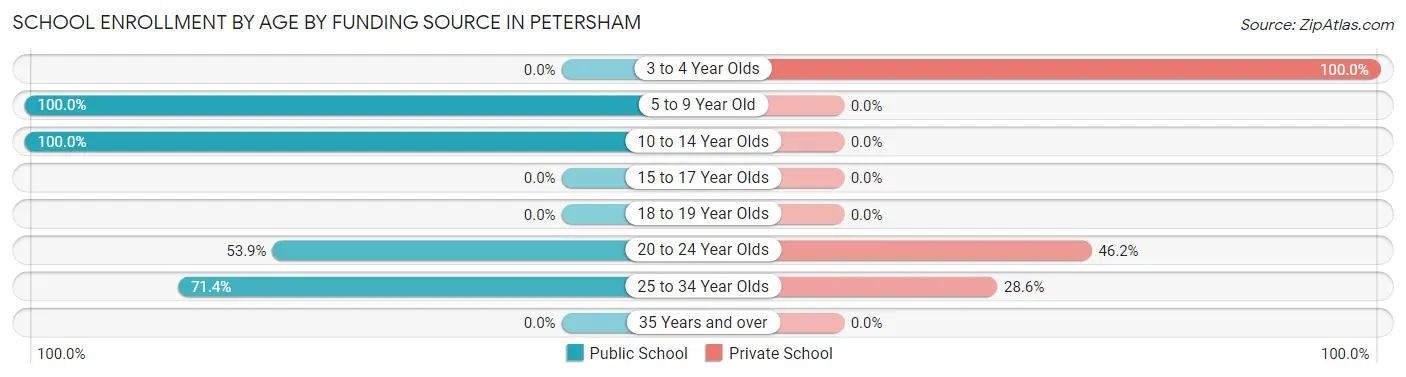
| Age Bracket | Public School | Private School |
| 3 to 4 Year Olds | 0 (0.0%) | 4 (100.0%) |
| 5 to 9 Year Old | 8 (100.0%) | 0 (0.0%) |
| 10 to 14 Year Olds | 4 (100.0%) | 0 (0.0%) |
| 15 to 17 Year Olds | 0 (0.0%) | 0 (0.0%) |
| 18 to 19 Year Olds | 0 (0.0%) | 0 (0.0%) |
| 20 to 24 Year Olds | 7 (53.8%) | 6 (46.2%) |
| 25 to 34 Year Olds | 10 (71.4%) | 4 (28.6%) |
| 35 Years and over | 0 (0.0%) | 0 (0.0%) |
| Total | 29 (67.4%) | 14 (32.6%) |
Educational Attainment by Field of Study in Petersham
Engineering (18 | 17.8%), education (15 | 14.8%), liberal arts & history (13 | 12.9%), science & technology (12 | 11.9%), and computers & mathematics (10 | 9.9%) are the most common fields of study among 101 individuals in Petersham who have obtained a bachelor's degree or higher.
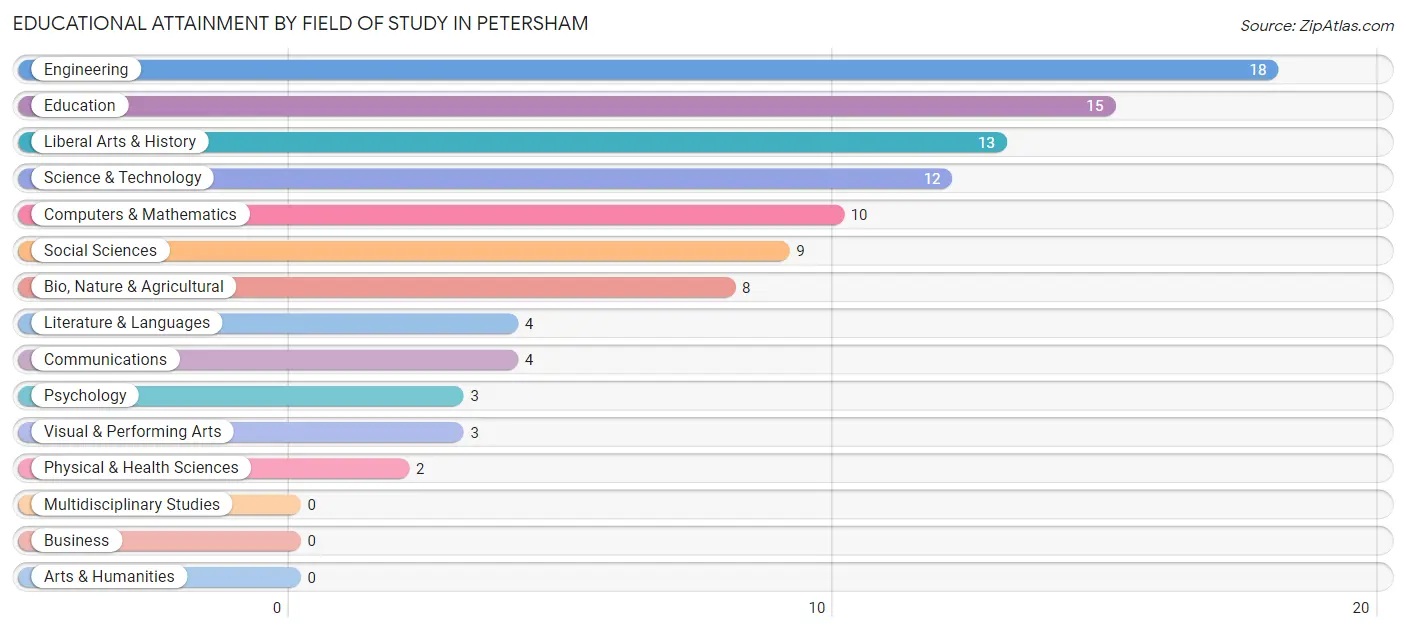
| Field of Study | # Graduates | % Graduates |
| Computers & Mathematics | 10 | 9.9% |
| Bio, Nature & Agricultural | 8 | 7.9% |
| Physical & Health Sciences | 2 | 2.0% |
| Psychology | 3 | 3.0% |
| Social Sciences | 9 | 8.9% |
| Engineering | 18 | 17.8% |
| Multidisciplinary Studies | 0 | 0.0% |
| Science & Technology | 12 | 11.9% |
| Business | 0 | 0.0% |
| Education | 15 | 14.8% |
| Literature & Languages | 4 | 4.0% |
| Liberal Arts & History | 13 | 12.9% |
| Visual & Performing Arts | 3 | 3.0% |
| Communications | 4 | 4.0% |
| Arts & Humanities | 0 | 0.0% |
| Total | 101 | 100.0% |
Transportation & Commute in Petersham
Vehicle Availability by Sex in Petersham
The most prevalent vehicle ownership categories in Petersham are males with 4 vehicles (33, accounting for 50.8%) and females with 4 vehicles (17, making up 41.2%).
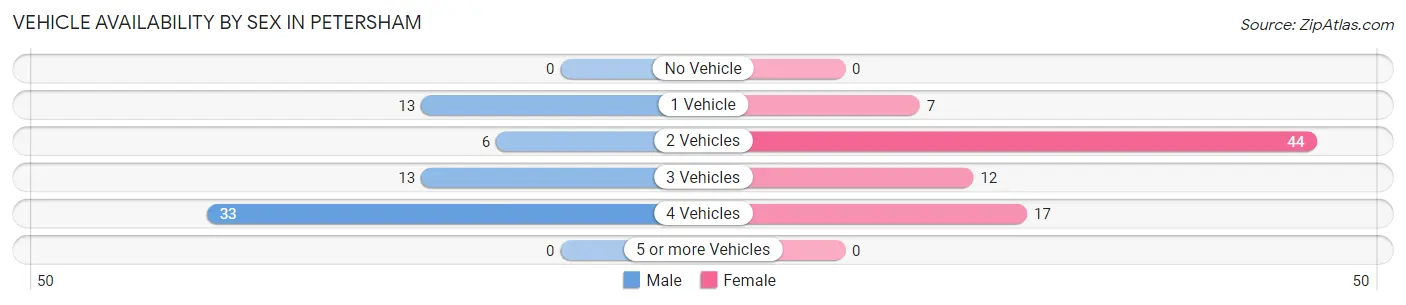
| Vehicles Available | Male | Female |
| No Vehicle | 0 (0.0%) | 0 (0.0%) |
| 1 Vehicle | 13 (20.0%) | 7 (8.7%) |
| 2 Vehicles | 6 (9.2%) | 44 (55.0%) |
| 3 Vehicles | 13 (20.0%) | 12 (15.0%) |
| 4 Vehicles | 33 (50.8%) | 17 (21.2%) |
| 5 or more Vehicles | 0 (0.0%) | 0 (0.0%) |
| Total | 65 (100.0%) | 80 (100.0%) |
Commute Time in Petersham
The most frequently occuring commute durations in Petersham are 30 to 34 minutes (34 commuters, 26.2%), 60 to 89 minutes (32 commuters, 24.6%), and 20 to 24 minutes (19 commuters, 14.6%).
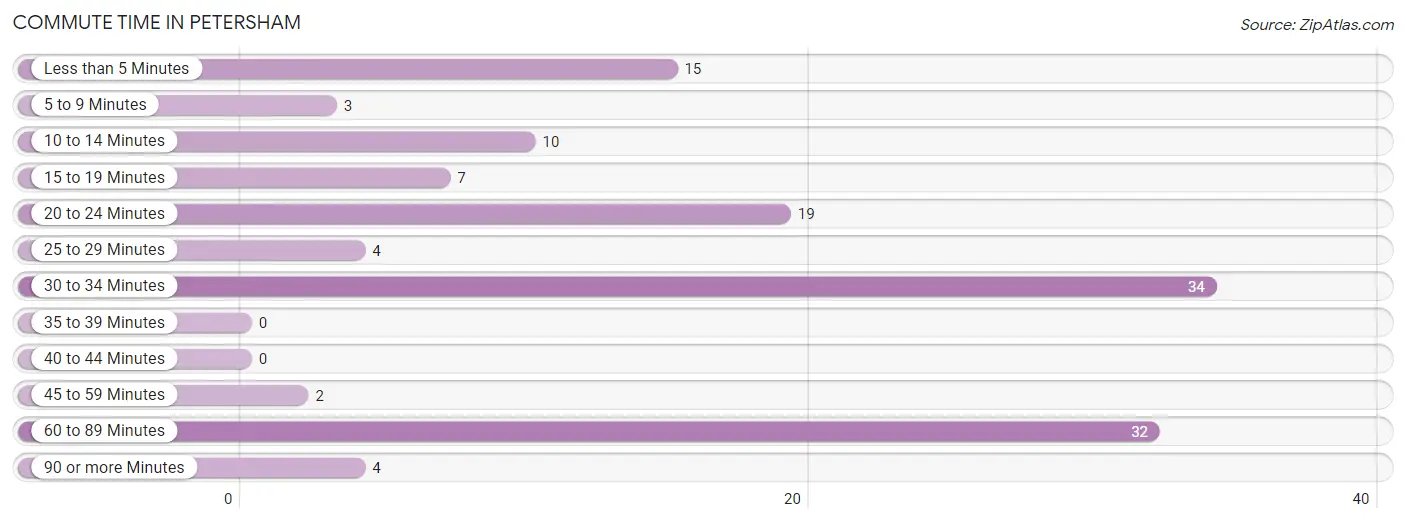
| Commute Time | # Commuters | % Commuters |
| Less than 5 Minutes | 15 | 11.5% |
| 5 to 9 Minutes | 3 | 2.3% |
| 10 to 14 Minutes | 10 | 7.7% |
| 15 to 19 Minutes | 7 | 5.4% |
| 20 to 24 Minutes | 19 | 14.6% |
| 25 to 29 Minutes | 4 | 3.1% |
| 30 to 34 Minutes | 34 | 26.2% |
| 35 to 39 Minutes | 0 | 0.0% |
| 40 to 44 Minutes | 0 | 0.0% |
| 45 to 59 Minutes | 2 | 1.5% |
| 60 to 89 Minutes | 32 | 24.6% |
| 90 or more Minutes | 4 | 3.1% |
Commute Time by Sex in Petersham
The most common commute times in Petersham are 30 to 34 minutes (27 commuters, 45.8%) for males and 20 to 24 minutes (19 commuters, 26.8%) for females.
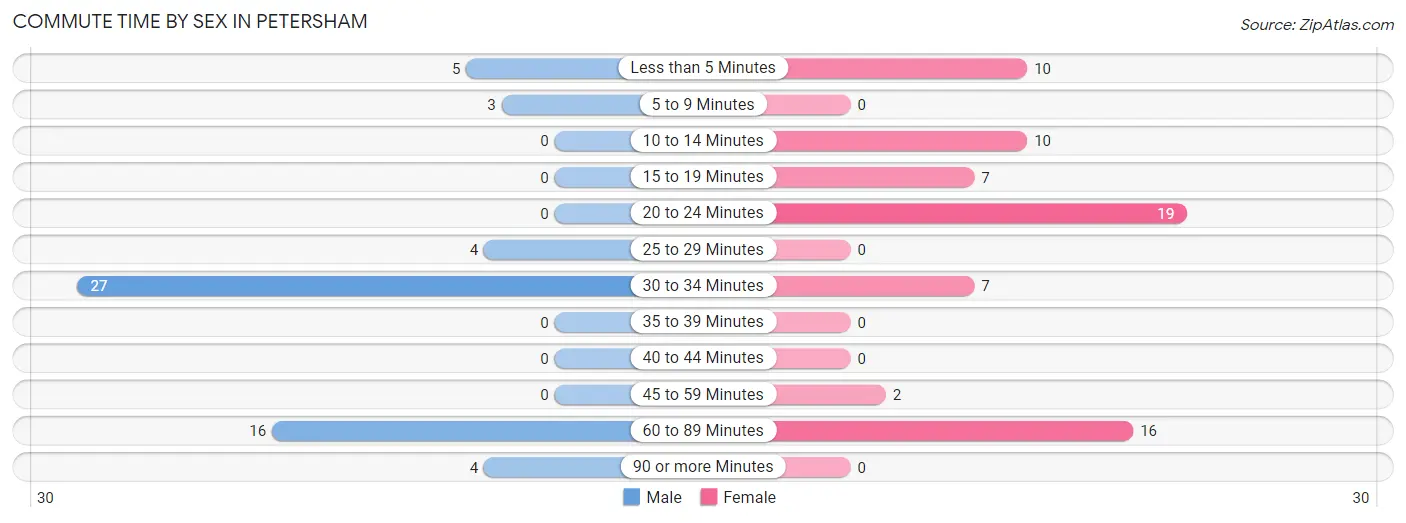
| Commute Time | Male | Female |
| Less than 5 Minutes | 5 (8.5%) | 10 (14.1%) |
| 5 to 9 Minutes | 3 (5.1%) | 0 (0.0%) |
| 10 to 14 Minutes | 0 (0.0%) | 10 (14.1%) |
| 15 to 19 Minutes | 0 (0.0%) | 7 (9.9%) |
| 20 to 24 Minutes | 0 (0.0%) | 19 (26.8%) |
| 25 to 29 Minutes | 4 (6.8%) | 0 (0.0%) |
| 30 to 34 Minutes | 27 (45.8%) | 7 (9.9%) |
| 35 to 39 Minutes | 0 (0.0%) | 0 (0.0%) |
| 40 to 44 Minutes | 0 (0.0%) | 0 (0.0%) |
| 45 to 59 Minutes | 0 (0.0%) | 2 (2.8%) |
| 60 to 89 Minutes | 16 (27.1%) | 16 (22.5%) |
| 90 or more Minutes | 4 (6.8%) | 0 (0.0%) |
Time of Departure to Work by Sex in Petersham
The most frequent times of departure to work in Petersham are 6:00 AM to 6:29 AM (21, 35.6%) for males and 12:00 AM to 4:59 AM (18, 25.4%) for females.
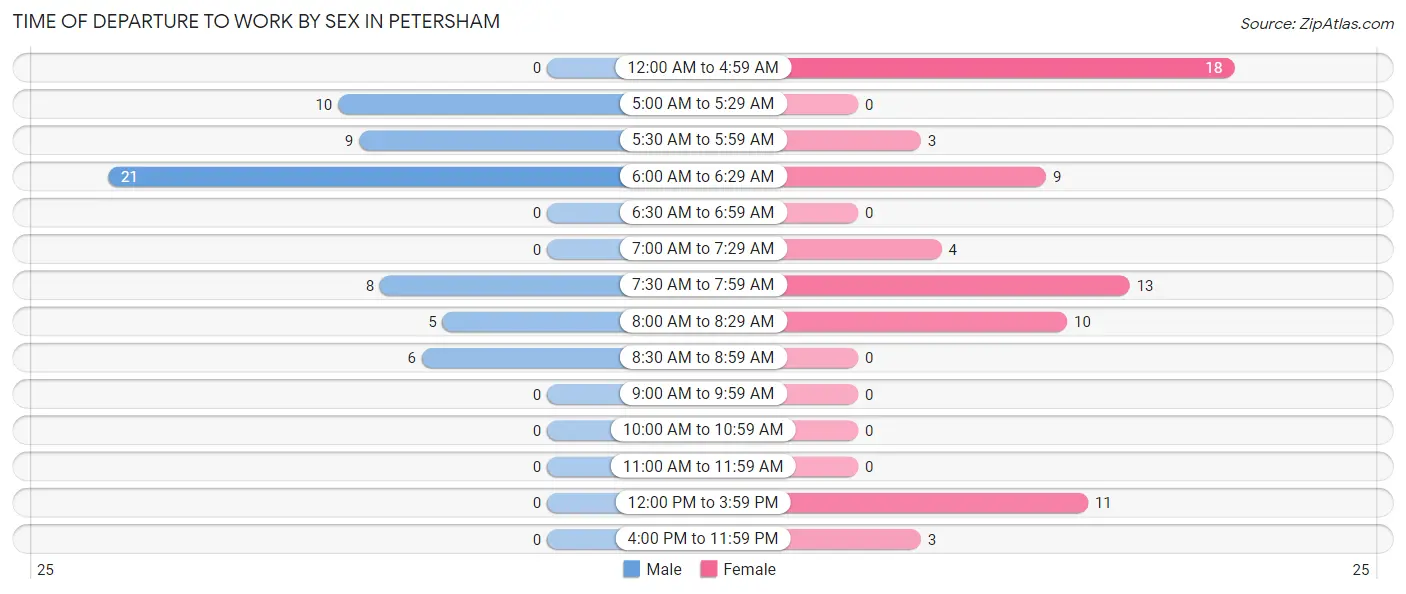
| Time of Departure | Male | Female |
| 12:00 AM to 4:59 AM | 0 (0.0%) | 18 (25.4%) |
| 5:00 AM to 5:29 AM | 10 (17.0%) | 0 (0.0%) |
| 5:30 AM to 5:59 AM | 9 (15.2%) | 3 (4.2%) |
| 6:00 AM to 6:29 AM | 21 (35.6%) | 9 (12.7%) |
| 6:30 AM to 6:59 AM | 0 (0.0%) | 0 (0.0%) |
| 7:00 AM to 7:29 AM | 0 (0.0%) | 4 (5.6%) |
| 7:30 AM to 7:59 AM | 8 (13.6%) | 13 (18.3%) |
| 8:00 AM to 8:29 AM | 5 (8.5%) | 10 (14.1%) |
| 8:30 AM to 8:59 AM | 6 (10.2%) | 0 (0.0%) |
| 9:00 AM to 9:59 AM | 0 (0.0%) | 0 (0.0%) |
| 10:00 AM to 10:59 AM | 0 (0.0%) | 0 (0.0%) |
| 11:00 AM to 11:59 AM | 0 (0.0%) | 0 (0.0%) |
| 12:00 PM to 3:59 PM | 0 (0.0%) | 11 (15.5%) |
| 4:00 PM to 11:59 PM | 0 (0.0%) | 3 (4.2%) |
| Total | 59 (100.0%) | 71 (100.0%) |
Housing Occupancy in Petersham
Occupancy by Ownership in Petersham
Of the total 113 dwellings in Petersham, owner-occupied units account for 102 (90.3%), while renter-occupied units make up 11 (9.7%).
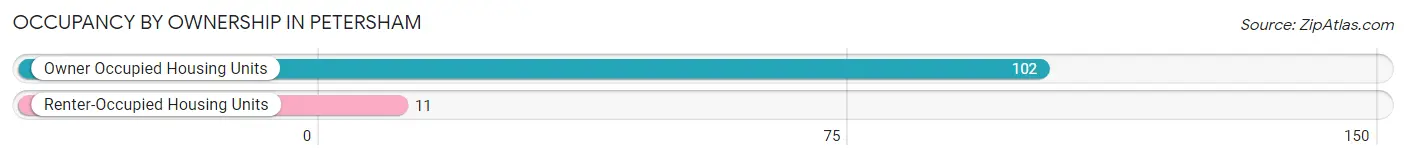
| Occupancy | # Housing Units | % Housing Units |
| Owner Occupied Housing Units | 102 | 90.3% |
| Renter-Occupied Housing Units | 11 | 9.7% |
| Total Occupied Housing Units | 113 | 100.0% |
Occupancy by Household Size in Petersham
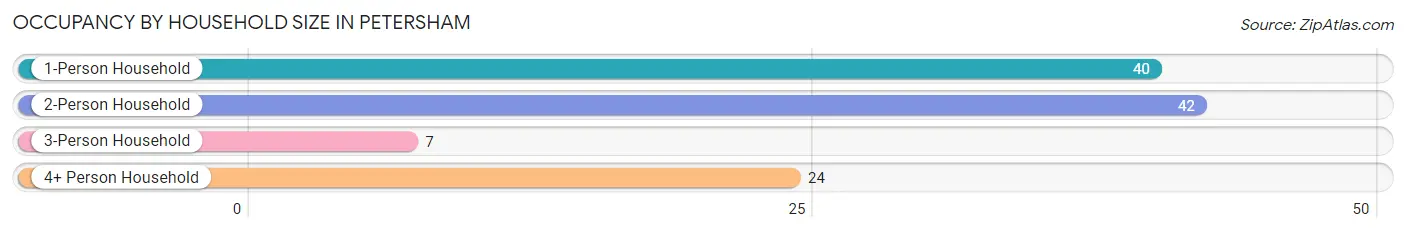
| Household Size | # Housing Units | % Housing Units |
| 1-Person Household | 40 | 35.4% |
| 2-Person Household | 42 | 37.2% |
| 3-Person Household | 7 | 6.2% |
| 4+ Person Household | 24 | 21.2% |
| Total Housing Units | 113 | 100.0% |
Occupancy by Ownership by Household Size in Petersham
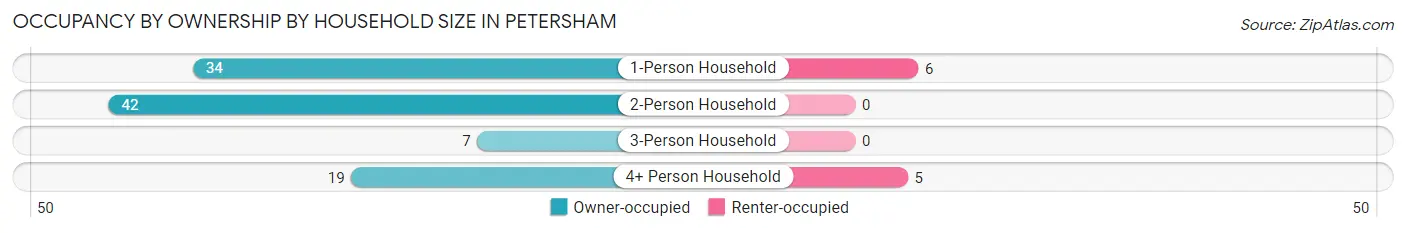
| Household Size | Owner-occupied | Renter-occupied |
| 1-Person Household | 34 (85.0%) | 6 (15.0%) |
| 2-Person Household | 42 (100.0%) | 0 (0.0%) |
| 3-Person Household | 7 (100.0%) | 0 (0.0%) |
| 4+ Person Household | 19 (79.2%) | 5 (20.8%) |
| Total Housing Units | 102 (90.3%) | 11 (9.7%) |
Occupancy by Educational Attainment in Petersham
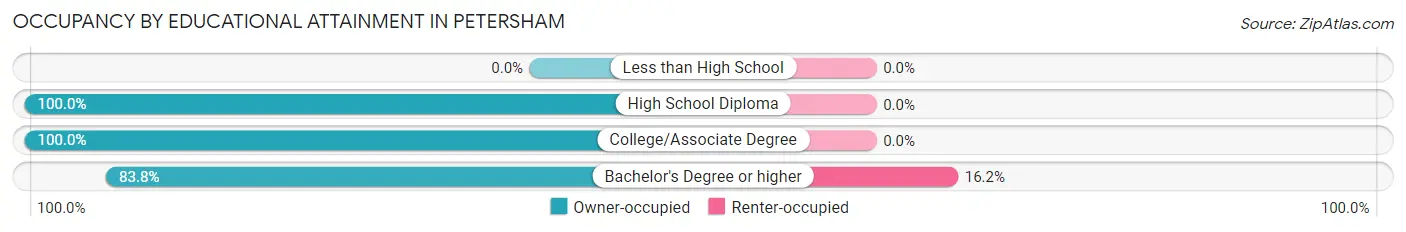
| Household Size | Owner-occupied | Renter-occupied |
| Less than High School | 0 (0.0%) | 0 (0.0%) |
| High School Diploma | 18 (100.0%) | 0 (0.0%) |
| College/Associate Degree | 27 (100.0%) | 0 (0.0%) |
| Bachelor's Degree or higher | 57 (83.8%) | 11 (16.2%) |
Occupancy by Age of Householder in Petersham
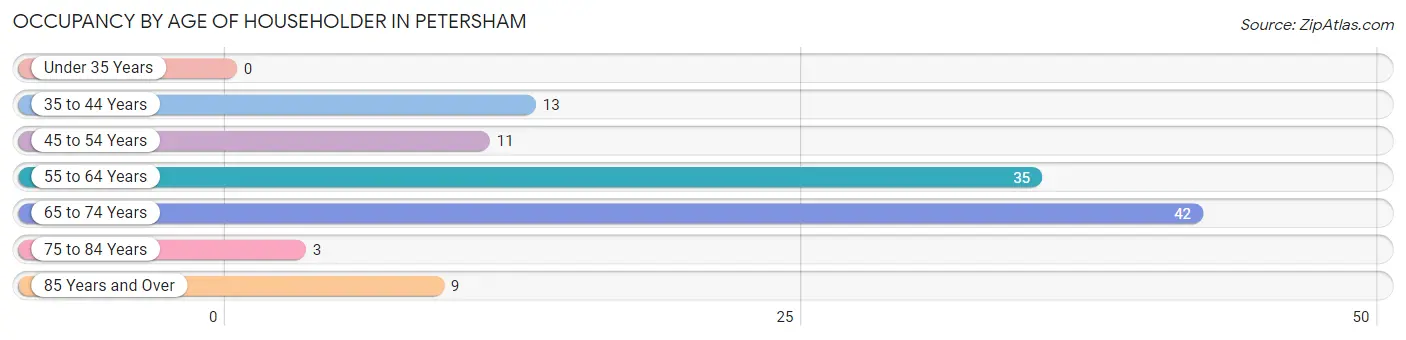
| Age Bracket | # Households | % Households |
| Under 35 Years | 0 | 0.0% |
| 35 to 44 Years | 13 | 11.5% |
| 45 to 54 Years | 11 | 9.7% |
| 55 to 64 Years | 35 | 31.0% |
| 65 to 74 Years | 42 | 37.2% |
| 75 to 84 Years | 3 | 2.6% |
| 85 Years and Over | 9 | 8.0% |
| Total | 113 | 100.0% |
Housing Finances in Petersham
Median Income by Occupancy in Petersham
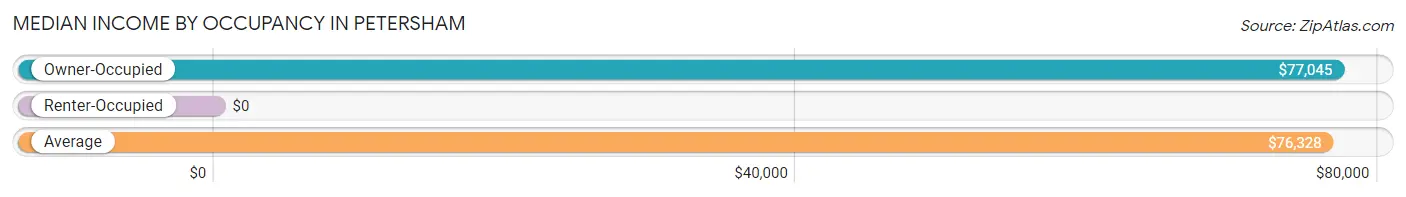
| Occupancy Type | # Households | Median Income |
| Owner-Occupied | 102 (90.3%) | $77,045 |
| Renter-Occupied | 11 (9.7%) | $0 |
| Average | 113 (100.0%) | $76,328 |
Occupancy by Householder Income Bracket in Petersham
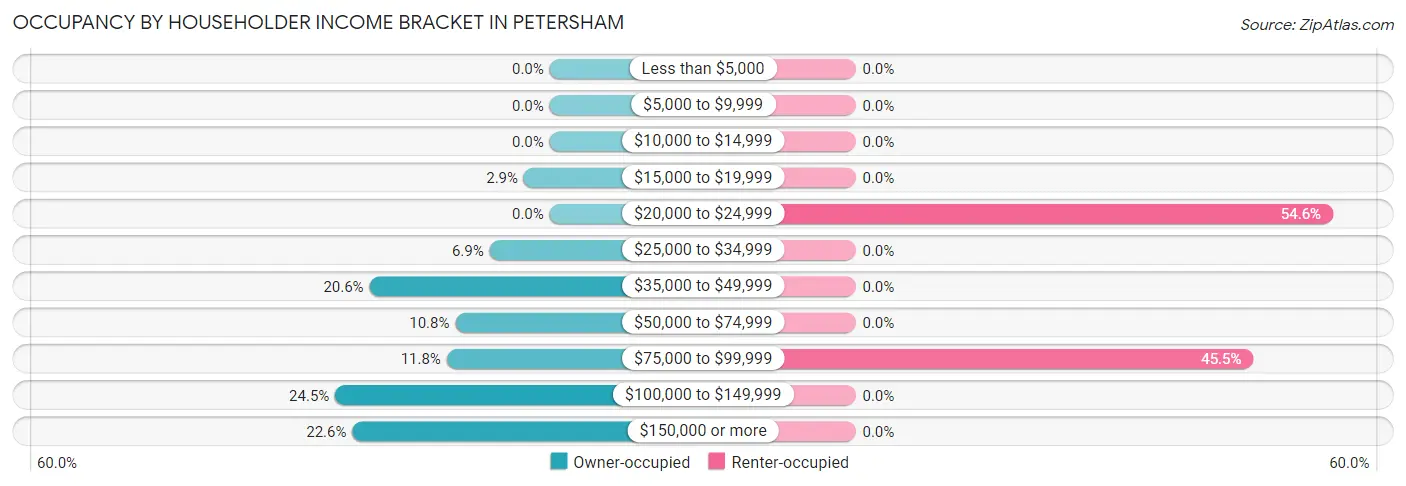
| Income Bracket | Owner-occupied | Renter-occupied |
| Less than $5,000 | 0 (0.0%) | 0 (0.0%) |
| $5,000 to $9,999 | 0 (0.0%) | 0 (0.0%) |
| $10,000 to $14,999 | 0 (0.0%) | 0 (0.0%) |
| $15,000 to $19,999 | 3 (2.9%) | 0 (0.0%) |
| $20,000 to $24,999 | 0 (0.0%) | 6 (54.5%) |
| $25,000 to $34,999 | 7 (6.9%) | 0 (0.0%) |
| $35,000 to $49,999 | 21 (20.6%) | 0 (0.0%) |
| $50,000 to $74,999 | 11 (10.8%) | 0 (0.0%) |
| $75,000 to $99,999 | 12 (11.8%) | 5 (45.5%) |
| $100,000 to $149,999 | 25 (24.5%) | 0 (0.0%) |
| $150,000 or more | 23 (22.6%) | 0 (0.0%) |
| Total | 102 (100.0%) | 11 (100.0%) |
Monthly Housing Cost Tiers in Petersham
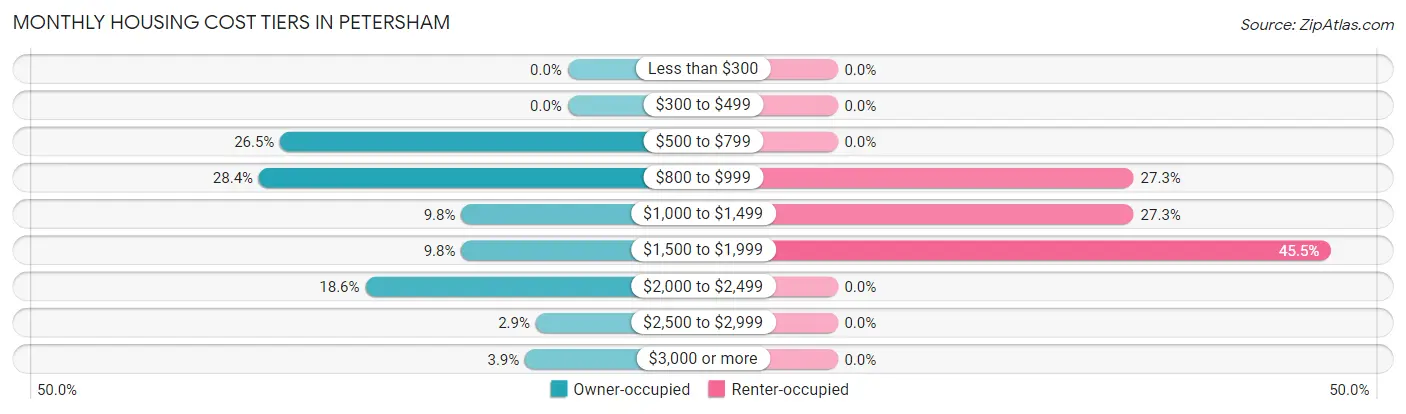
| Monthly Cost | Owner-occupied | Renter-occupied |
| Less than $300 | 0 (0.0%) | 0 (0.0%) |
| $300 to $499 | 0 (0.0%) | 0 (0.0%) |
| $500 to $799 | 27 (26.5%) | 0 (0.0%) |
| $800 to $999 | 29 (28.4%) | 3 (27.3%) |
| $1,000 to $1,499 | 10 (9.8%) | 3 (27.3%) |
| $1,500 to $1,999 | 10 (9.8%) | 5 (45.5%) |
| $2,000 to $2,499 | 19 (18.6%) | 0 (0.0%) |
| $2,500 to $2,999 | 3 (2.9%) | 0 (0.0%) |
| $3,000 or more | 4 (3.9%) | 0 (0.0%) |
| Total | 102 (100.0%) | 11 (100.0%) |
Physical Housing Characteristics in Petersham
Housing Structures in Petersham
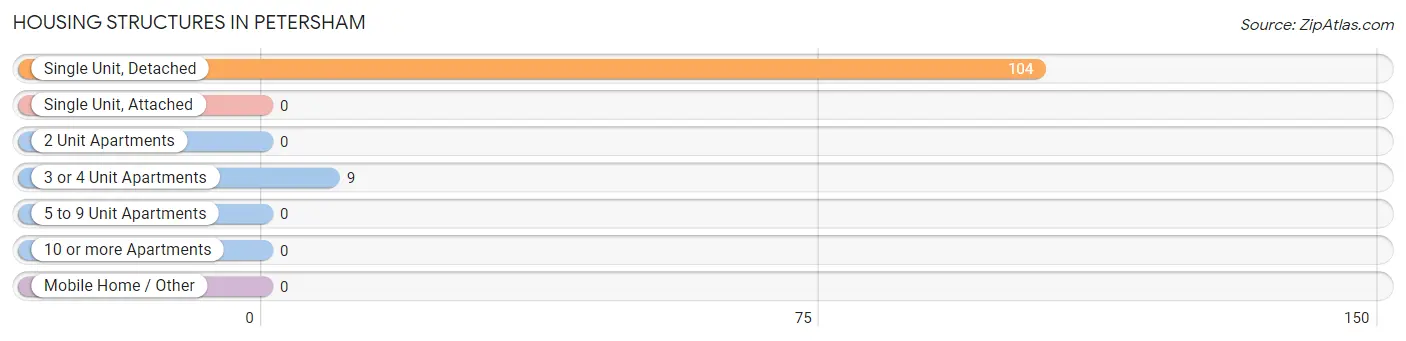
| Structure Type | # Housing Units | % Housing Units |
| Single Unit, Detached | 104 | 92.0% |
| Single Unit, Attached | 0 | 0.0% |
| 2 Unit Apartments | 0 | 0.0% |
| 3 or 4 Unit Apartments | 9 | 8.0% |
| 5 to 9 Unit Apartments | 0 | 0.0% |
| 10 or more Apartments | 0 | 0.0% |
| Mobile Home / Other | 0 | 0.0% |
| Total | 113 | 100.0% |
Housing Structures by Occupancy in Petersham
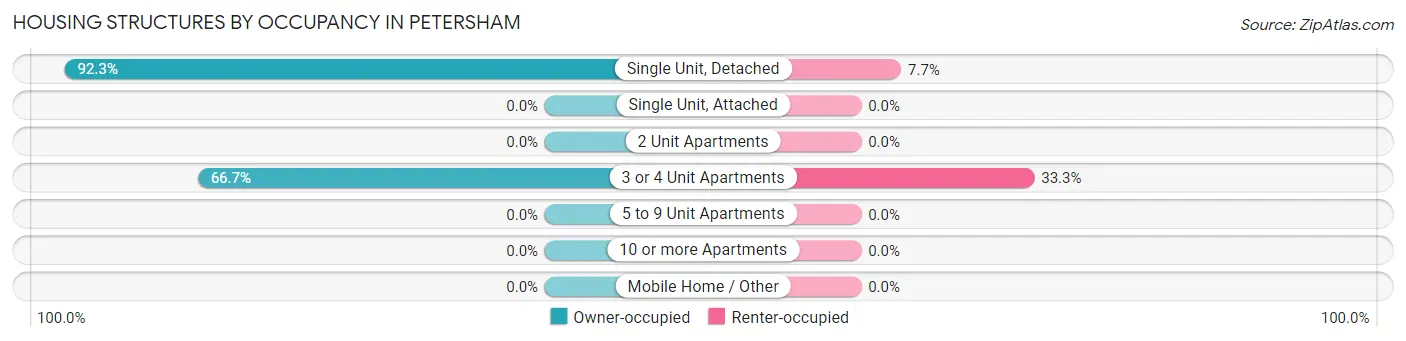
| Structure Type | Owner-occupied | Renter-occupied |
| Single Unit, Detached | 96 (92.3%) | 8 (7.7%) |
| Single Unit, Attached | 0 (0.0%) | 0 (0.0%) |
| 2 Unit Apartments | 0 (0.0%) | 0 (0.0%) |
| 3 or 4 Unit Apartments | 6 (66.7%) | 3 (33.3%) |
| 5 to 9 Unit Apartments | 0 (0.0%) | 0 (0.0%) |
| 10 or more Apartments | 0 (0.0%) | 0 (0.0%) |
| Mobile Home / Other | 0 (0.0%) | 0 (0.0%) |
| Total | 102 (90.3%) | 11 (9.7%) |
Housing Structures by Number of Rooms in Petersham
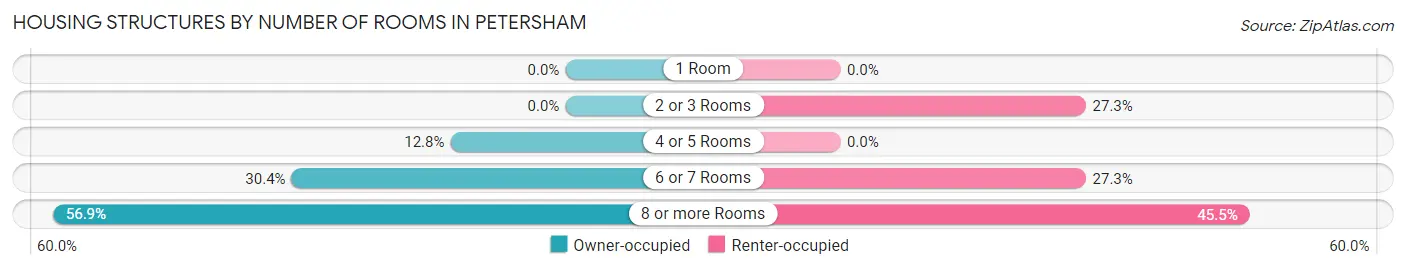
| Number of Rooms | Owner-occupied | Renter-occupied |
| 1 Room | 0 (0.0%) | 0 (0.0%) |
| 2 or 3 Rooms | 0 (0.0%) | 3 (27.3%) |
| 4 or 5 Rooms | 13 (12.8%) | 0 (0.0%) |
| 6 or 7 Rooms | 31 (30.4%) | 3 (27.3%) |
| 8 or more Rooms | 58 (56.9%) | 5 (45.5%) |
| Total | 102 (100.0%) | 11 (100.0%) |
Housing Structure by Heating Type in Petersham
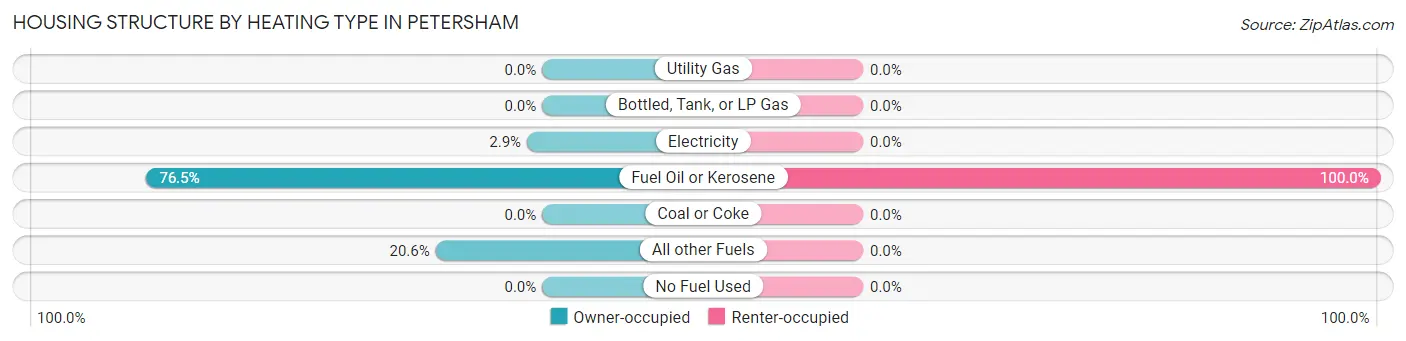
| Heating Type | Owner-occupied | Renter-occupied |
| Utility Gas | 0 (0.0%) | 0 (0.0%) |
| Bottled, Tank, or LP Gas | 0 (0.0%) | 0 (0.0%) |
| Electricity | 3 (2.9%) | 0 (0.0%) |
| Fuel Oil or Kerosene | 78 (76.5%) | 11 (100.0%) |
| Coal or Coke | 0 (0.0%) | 0 (0.0%) |
| All other Fuels | 21 (20.6%) | 0 (0.0%) |
| No Fuel Used | 0 (0.0%) | 0 (0.0%) |
| Total | 102 (100.0%) | 11 (100.0%) |
Household Vehicle Usage in Petersham
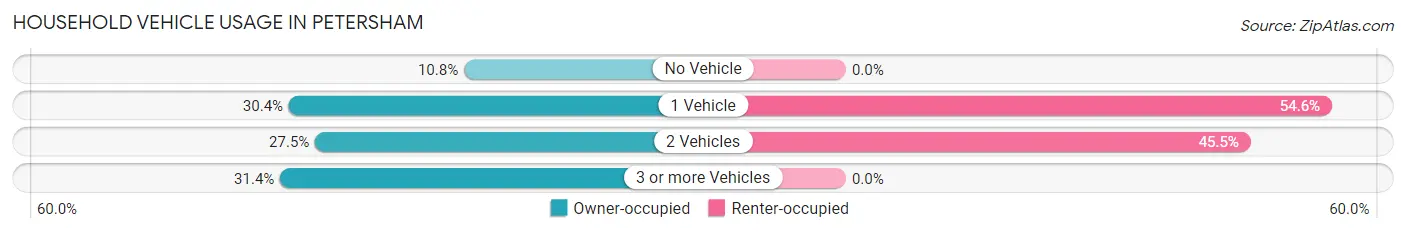
| Vehicles per Household | Owner-occupied | Renter-occupied |
| No Vehicle | 11 (10.8%) | 0 (0.0%) |
| 1 Vehicle | 31 (30.4%) | 6 (54.5%) |
| 2 Vehicles | 28 (27.5%) | 5 (45.5%) |
| 3 or more Vehicles | 32 (31.4%) | 0 (0.0%) |
| Total | 102 (100.0%) | 11 (100.0%) |
Real Estate & Mortgages in Petersham
Real Estate and Mortgage Overview in Petersham
| Characteristic | Without Mortgage | With Mortgage |
| Housing Units | 56 | 46 |
| Median Property Value | $358,100 | $354,300 |
| Median Household Income | $57,188 | $15 |
| Monthly Housing Costs | $807 | $4 |
| Real Estate Taxes | $4,600 | $0 |
Property Value by Mortgage Status in Petersham
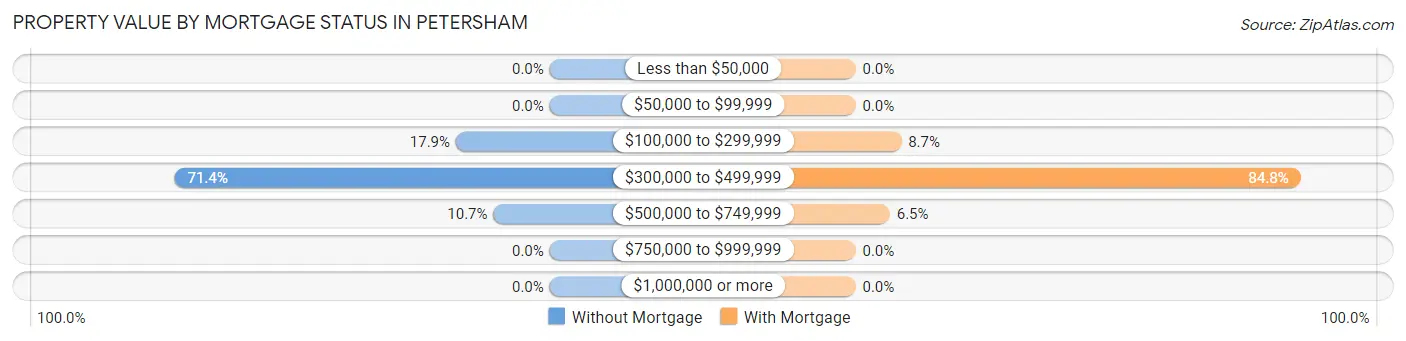
| Property Value | Without Mortgage | With Mortgage |
| Less than $50,000 | 0 (0.0%) | 0 (0.0%) |
| $50,000 to $99,999 | 0 (0.0%) | 0 (0.0%) |
| $100,000 to $299,999 | 10 (17.9%) | 4 (8.7%) |
| $300,000 to $499,999 | 40 (71.4%) | 39 (84.8%) |
| $500,000 to $749,999 | 6 (10.7%) | 3 (6.5%) |
| $750,000 to $999,999 | 0 (0.0%) | 0 (0.0%) |
| $1,000,000 or more | 0 (0.0%) | 0 (0.0%) |
| Total | 56 (100.0%) | 46 (100.0%) |
Household Income by Mortgage Status in Petersham
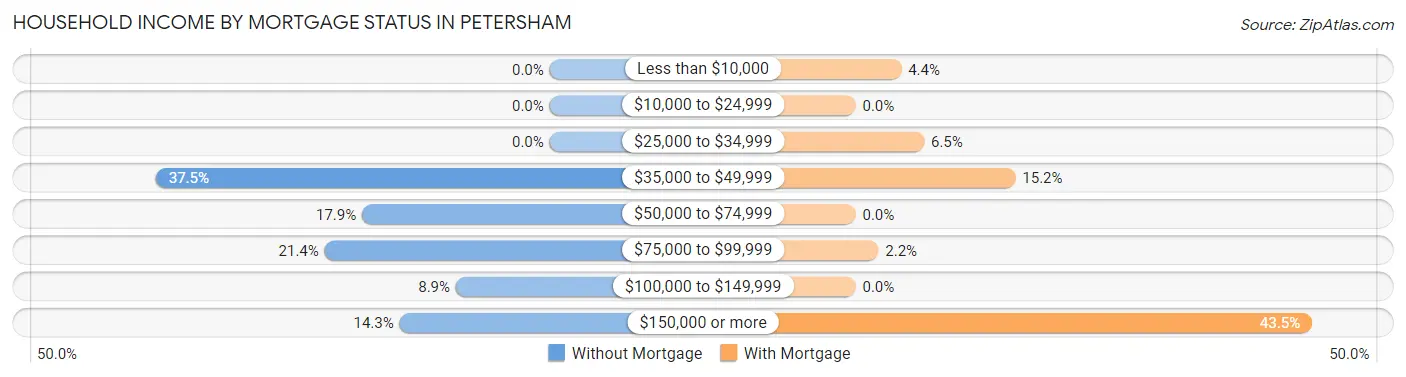
| Household Income | Without Mortgage | With Mortgage |
| Less than $10,000 | 0 (0.0%) | 2 (4.3%) |
| $10,000 to $24,999 | 0 (0.0%) | 0 (0.0%) |
| $25,000 to $34,999 | 0 (0.0%) | 3 (6.5%) |
| $35,000 to $49,999 | 21 (37.5%) | 7 (15.2%) |
| $50,000 to $74,999 | 10 (17.9%) | 0 (0.0%) |
| $75,000 to $99,999 | 12 (21.4%) | 1 (2.2%) |
| $100,000 to $149,999 | 5 (8.9%) | 0 (0.0%) |
| $150,000 or more | 8 (14.3%) | 20 (43.5%) |
| Total | 56 (100.0%) | 46 (100.0%) |
Property Value to Household Income Ratio in Petersham
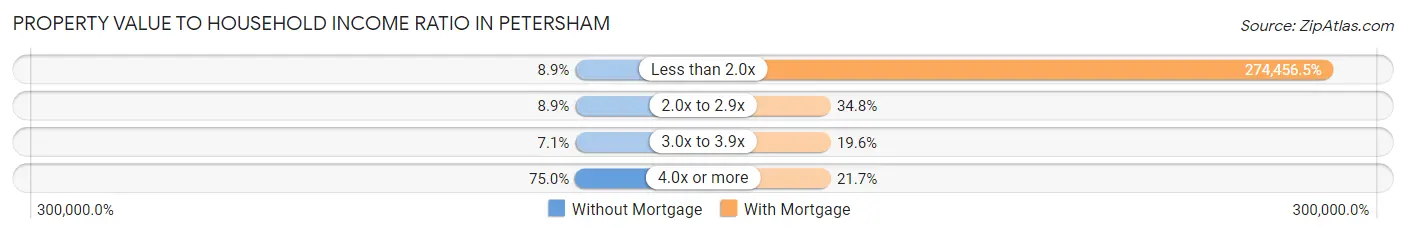
| Value-to-Income Ratio | Without Mortgage | With Mortgage |
| Less than 2.0x | 5 (8.9%) | 126,250 (274,456.5%) |
| 2.0x to 2.9x | 5 (8.9%) | 16 (34.8%) |
| 3.0x to 3.9x | 4 (7.1%) | 9 (19.6%) |
| 4.0x or more | 42 (75.0%) | 10 (21.7%) |
| Total | 56 (100.0%) | 46 (100.0%) |
Real Estate Taxes by Mortgage Status in Petersham
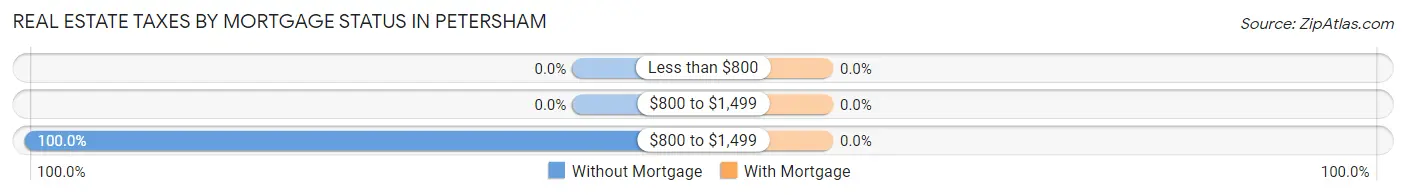
| Property Taxes | Without Mortgage | With Mortgage |
| Less than $800 | 0 (0.0%) | 0 (0.0%) |
| $800 to $1,499 | 0 (0.0%) | 0 (0.0%) |
| $800 to $1,499 | 56 (100.0%) | 0 (0.0%) |
| Total | 56 (100.0%) | 46 (100.0%) |
Health & Disability in Petersham
Health Insurance Coverage by Age in Petersham
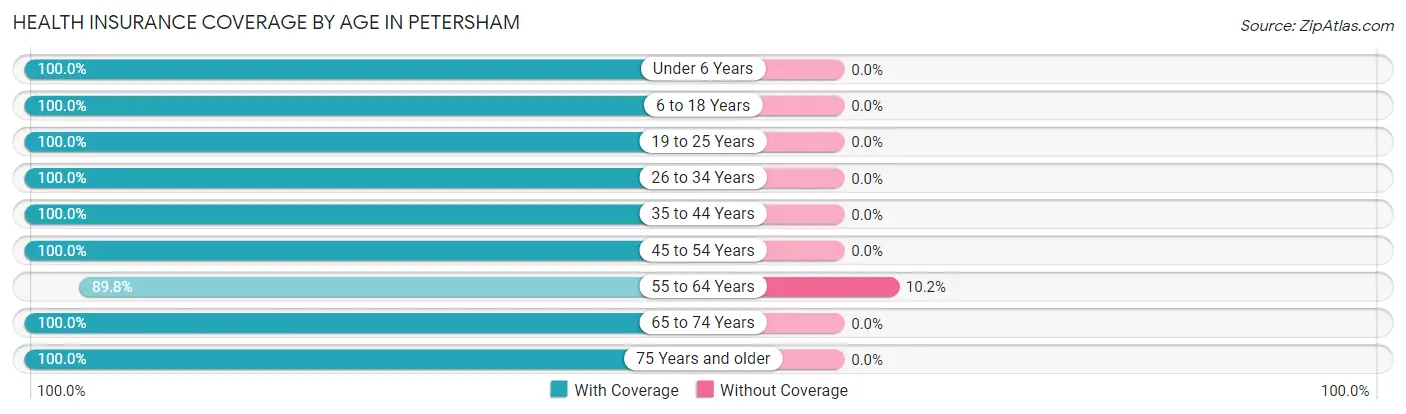
| Age Bracket | With Coverage | Without Coverage |
| Under 6 Years | 11 (100.0%) | 0 (0.0%) |
| 6 to 18 Years | 12 (100.0%) | 0 (0.0%) |
| 19 to 25 Years | 22 (100.0%) | 0 (0.0%) |
| 26 to 34 Years | 29 (100.0%) | 0 (0.0%) |
| 35 to 44 Years | 18 (100.0%) | 0 (0.0%) |
| 45 to 54 Years | 42 (100.0%) | 0 (0.0%) |
| 55 to 64 Years | 53 (89.8%) | 6 (10.2%) |
| 65 to 74 Years | 66 (100.0%) | 0 (0.0%) |
| 75 Years and older | 16 (100.0%) | 0 (0.0%) |
| Total | 269 (97.8%) | 6 (2.2%) |
Health Insurance Coverage by Citizenship Status in Petersham
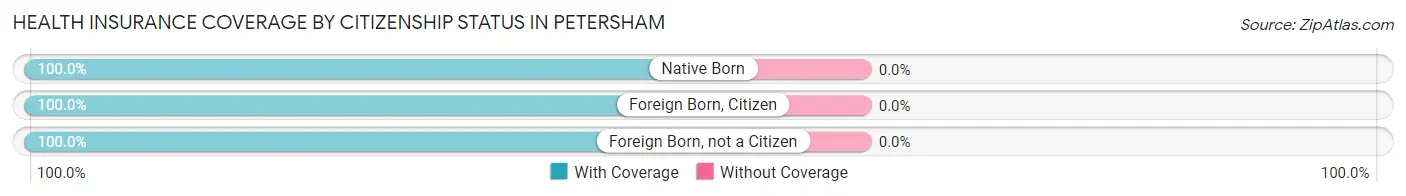
| Citizenship Status | With Coverage | Without Coverage |
| Native Born | 11 (100.0%) | 0 (0.0%) |
| Foreign Born, Citizen | 12 (100.0%) | 0 (0.0%) |
| Foreign Born, not a Citizen | 22 (100.0%) | 0 (0.0%) |
Health Insurance Coverage by Household Income in Petersham
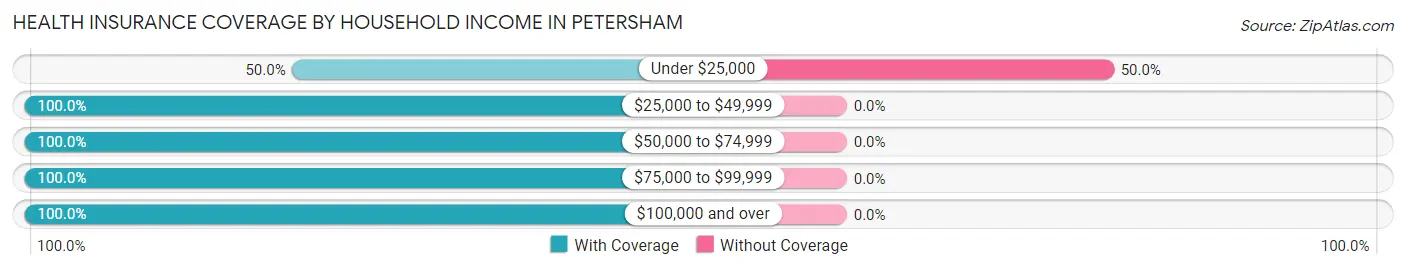
| Household Income | With Coverage | Without Coverage |
| Under $25,000 | 6 (50.0%) | 6 (50.0%) |
| $25,000 to $49,999 | 33 (100.0%) | 0 (0.0%) |
| $50,000 to $74,999 | 30 (100.0%) | 0 (0.0%) |
| $75,000 to $99,999 | 53 (100.0%) | 0 (0.0%) |
| $100,000 and over | 147 (100.0%) | 0 (0.0%) |
Public vs Private Health Insurance Coverage by Age in Petersham
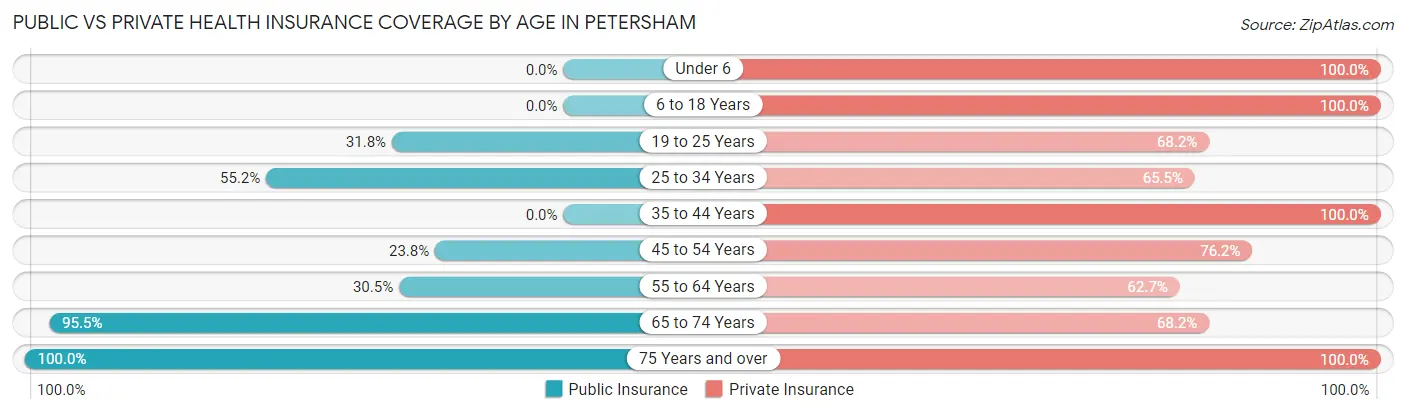
| Age Bracket | Public Insurance | Private Insurance |
| Under 6 | 0 (0.0%) | 11 (100.0%) |
| 6 to 18 Years | 0 (0.0%) | 12 (100.0%) |
| 19 to 25 Years | 7 (31.8%) | 15 (68.2%) |
| 25 to 34 Years | 16 (55.2%) | 19 (65.5%) |
| 35 to 44 Years | 0 (0.0%) | 18 (100.0%) |
| 45 to 54 Years | 10 (23.8%) | 32 (76.2%) |
| 55 to 64 Years | 18 (30.5%) | 37 (62.7%) |
| 65 to 74 Years | 63 (95.5%) | 45 (68.2%) |
| 75 Years and over | 16 (100.0%) | 16 (100.0%) |
| Total | 130 (47.3%) | 205 (74.6%) |
Disability Status by Sex by Age in Petersham
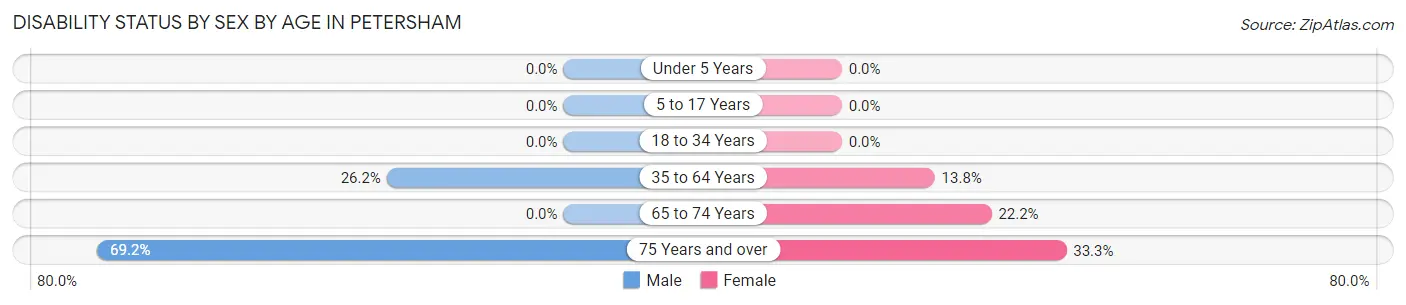
| Age Bracket | Male | Female |
| Under 5 Years | 0 (0.0%) | 0 (0.0%) |
| 5 to 17 Years | 0 (0.0%) | 0 (0.0%) |
| 18 to 34 Years | 0 (0.0%) | 0 (0.0%) |
| 35 to 64 Years | 16 (26.2%) | 8 (13.8%) |
| 65 to 74 Years | 0 (0.0%) | 6 (22.2%) |
| 75 Years and over | 9 (69.2%) | 1 (33.3%) |
Disability Class by Sex by Age in Petersham
Disability Class: Hearing Difficulty
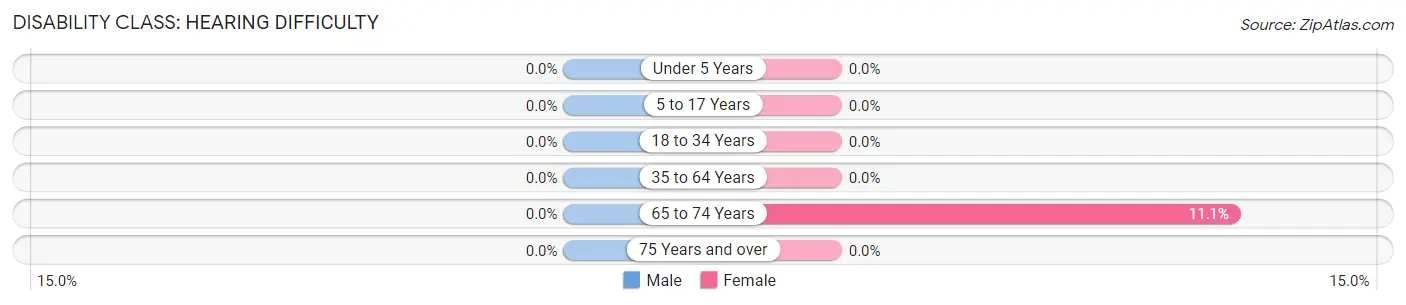
| Age Bracket | Male | Female |
| Under 5 Years | 0 (0.0%) | 0 (0.0%) |
| 5 to 17 Years | 0 (0.0%) | 0 (0.0%) |
| 18 to 34 Years | 0 (0.0%) | 0 (0.0%) |
| 35 to 64 Years | 0 (0.0%) | 0 (0.0%) |
| 65 to 74 Years | 0 (0.0%) | 3 (11.1%) |
| 75 Years and over | 0 (0.0%) | 0 (0.0%) |
Disability Class: Vision Difficulty
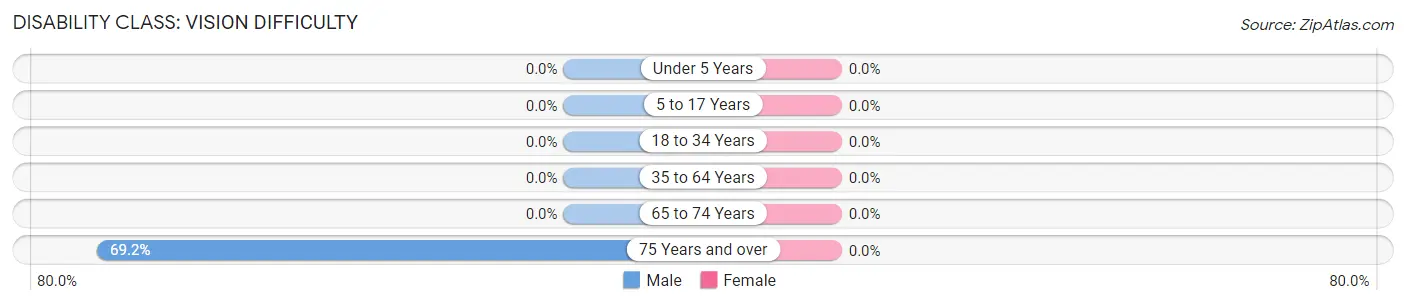
| Age Bracket | Male | Female |
| Under 5 Years | 0 (0.0%) | 0 (0.0%) |
| 5 to 17 Years | 0 (0.0%) | 0 (0.0%) |
| 18 to 34 Years | 0 (0.0%) | 0 (0.0%) |
| 35 to 64 Years | 0 (0.0%) | 0 (0.0%) |
| 65 to 74 Years | 0 (0.0%) | 0 (0.0%) |
| 75 Years and over | 9 (69.2%) | 0 (0.0%) |
Disability Class: Cognitive Difficulty
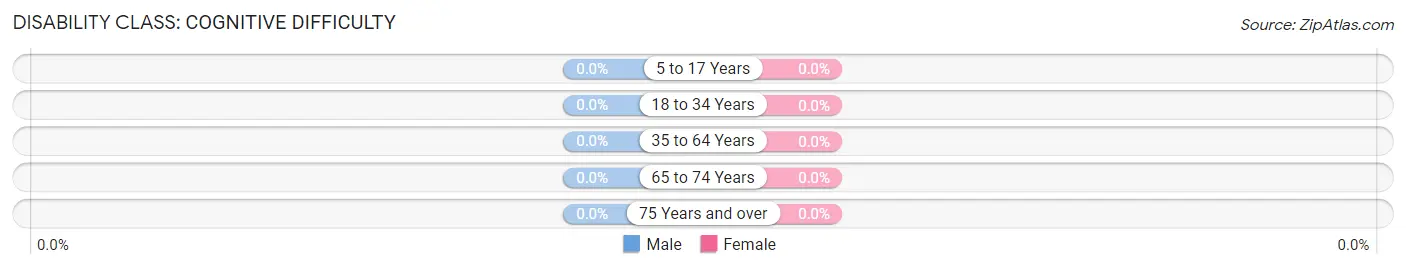
| Age Bracket | Male | Female |
| 5 to 17 Years | 0 (0.0%) | 0 (0.0%) |
| 18 to 34 Years | 0 (0.0%) | 0 (0.0%) |
| 35 to 64 Years | 0 (0.0%) | 0 (0.0%) |
| 65 to 74 Years | 0 (0.0%) | 0 (0.0%) |
| 75 Years and over | 0 (0.0%) | 0 (0.0%) |
Disability Class: Ambulatory Difficulty
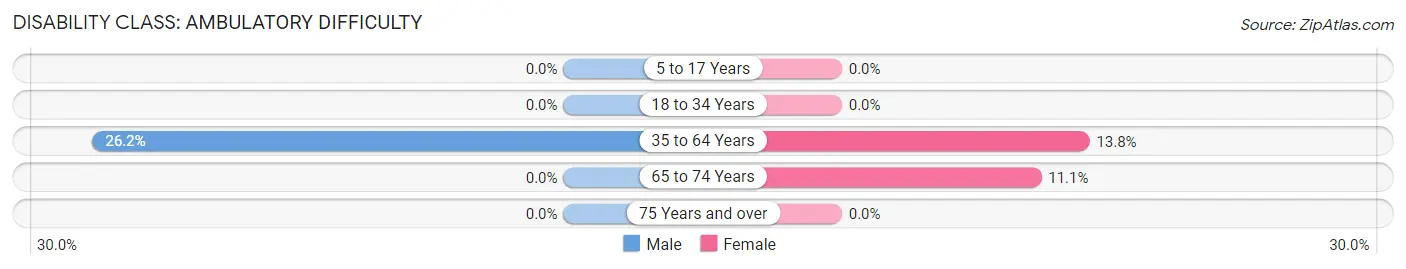
| Age Bracket | Male | Female |
| 5 to 17 Years | 0 (0.0%) | 0 (0.0%) |
| 18 to 34 Years | 0 (0.0%) | 0 (0.0%) |
| 35 to 64 Years | 16 (26.2%) | 8 (13.8%) |
| 65 to 74 Years | 0 (0.0%) | 3 (11.1%) |
| 75 Years and over | 0 (0.0%) | 0 (0.0%) |
Disability Class: Self-Care Difficulty
| Age Bracket | Male | Female |
| 5 to 17 Years | 0 (0.0%) | 0 (0.0%) |
| 18 to 34 Years | 0 (0.0%) | 0 (0.0%) |
| 35 to 64 Years | 0 (0.0%) | 0 (0.0%) |
| 65 to 74 Years | 0 (0.0%) | 0 (0.0%) |
| 75 Years and over | 0 (0.0%) | 0 (0.0%) |
Technology Access in Petersham
Computing Device Access in Petersham
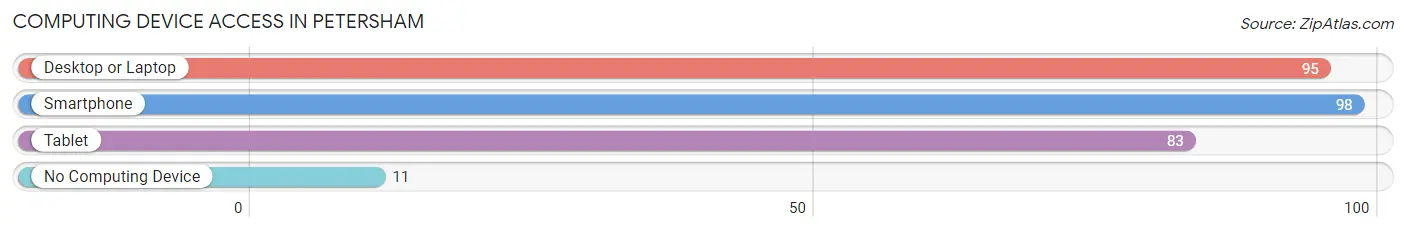
| Device Type | # Households | % Households |
| Desktop or Laptop | 95 | 84.1% |
| Smartphone | 98 | 86.7% |
| Tablet | 83 | 73.5% |
| No Computing Device | 11 | 9.7% |
| Total | 113 | 100.0% |
Internet Access in Petersham
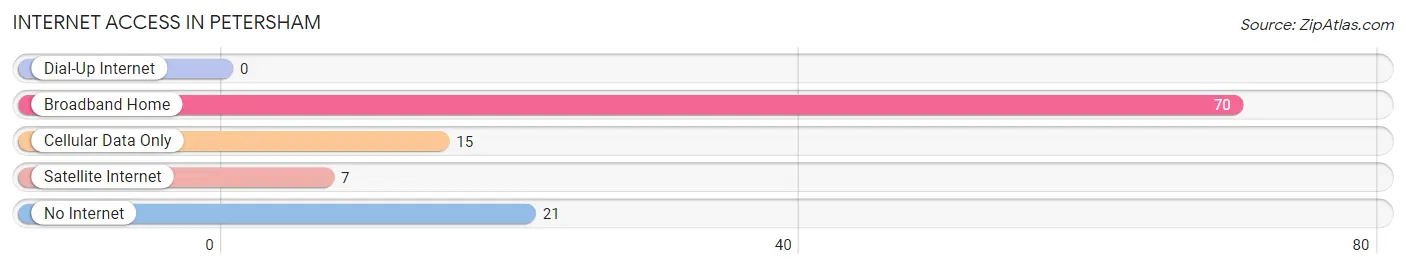
| Internet Type | # Households | % Households |
| Dial-Up Internet | 0 | 0.0% |
| Broadband Home | 70 | 62.0% |
| Cellular Data Only | 15 | 13.3% |
| Satellite Internet | 7 | 6.2% |
| No Internet | 21 | 18.6% |
| Total | 113 | 100.0% |
Petersham Summary
Petersham, Massachusetts is a small town located in Worcester County, in the central part of the state. It is bordered by the towns of Barre, Hardwick, New Salem, Phillipston, Royalston, and Templeton. The town has a population of 1,234, according to the 2010 census.
History
Petersham was first settled in 1733 and was officially incorporated in 1754. The town was named after the Earl of Peterborough, an English nobleman. The town was originally part of the Quaboag Plantation, which was established in 1660. The town was primarily an agricultural community, with a few small mills and factories.
Geography
Petersham is located in central Massachusetts, in Worcester County. It is bordered by the towns of Barre, Hardwick, New Salem, Phillipston, Royalston, and Templeton. The town has a total area of 24.2 square miles, of which 24.1 square miles is land and 0.1 square miles is water. The town is located in the Quaboag River Valley, and is home to several small ponds and lakes, including Lake Rohunta, Lake Mattawa, and Lake Wyola.
Economy
Petersham is a rural, agricultural community. The town is home to several small farms, which produce a variety of crops, including apples, corn, hay, and vegetables. The town is also home to several small businesses, including a general store, a hardware store, and a few restaurants.
Demographics
According to the 2010 census, Petersham has a population of 1,234. The town has a median household income of $60,000, and a median family income of $68,000. The town has a poverty rate of 8.3%, and a median age of 44.7 years. The town is predominantly white, with 92.3% of the population identifying as white. The town also has a small Hispanic population, with 4.2% of the population identifying as Hispanic or Latino.
Conclusion
Petersham, Massachusetts is a small town located in Worcester County, in the central part of the state. It has a population of 1,234, and is primarily an agricultural community. The town is home to several small farms, businesses, and restaurants. The town has a median household income of $60,000, and a median family income of $68,000. The town is predominantly white, with 92.3% of the population identifying as white. Petersham is a rural, agricultural community, and is a great place to live and work.
Common Questions
What is Per Capita Income in Petersham?
Per Capita income in Petersham is $45,723.
What is the Median Family Income in Petersham?
Median Family Income in Petersham is $123,333.
What is the Median Household income in Petersham?
Median Household Income in Petersham is $76,328.
What is Inequality or Gini Index in Petersham?
Inequality or Gini Index in Petersham is 0.43.
What is the Total Population of Petersham?
Total Population of Petersham is 275.
What is the Total Male Population of Petersham?
Total Male Population of Petersham is 151.
What is the Total Female Population of Petersham?
Total Female Population of Petersham is 124.
What is the Ratio of Males per 100 Females in Petersham?
There are 121.77 Males per 100 Females in Petersham.
What is the Ratio of Females per 100 Males in Petersham?
There are 82.12 Females per 100 Males in Petersham.
What is the Median Population Age in Petersham?
Median Population Age in Petersham is 55.2 Years.
What is the Average Family Size in Petersham
Average Family Size in Petersham is 2.9 People.
What is the Average Household Size in Petersham
Average Household Size in Petersham is 2.4 People.
How Large is the Labor Force in Petersham?
There are 147 People in the Labor Forcein in Petersham.
What is the Percentage of People in the Labor Force in Petersham?
58.3% of People are in the Labor Force in Petersham.
What is the Unemployment Rate in Petersham?
Unemployment Rate in Petersham is 1.4%.