Sandwich, MA Map & Demographics
Sandwich Map
Sandwich Overview
$65,470
PER CAPITA INCOME
$116,607
AVG FAMILY INCOME
$99,333
AVG HOUSEHOLD INCOME
18.7%
WAGE / INCOME GAP [ % ]
81.3¢/ $1
WAGE / INCOME GAP [ $ ]
0.46
INEQUALITY / GINI INDEX
2,948
TOTAL POPULATION
1,393
MALE POPULATION
1,555
FEMALE POPULATION
89.58
MALES / 100 FEMALES
111.63
FEMALES / 100 MALES
57.4
MEDIAN AGE
2.6
AVG FAMILY SIZE
2.1
AVG HOUSEHOLD SIZE
1,526
LABOR FORCE [ PEOPLE ]
56.4%
PERCENT IN LABOR FORCE
4.4%
UNEMPLOYMENT RATE
Sandwich Zip Codes
Income in Sandwich
Income Overview in Sandwich
Per Capita Income in Sandwich is $65,470, while median incomes of families and households are $116,607 and $99,333 respectively.
| Characteristic | Number | Measure |
| Per Capita Income | 2,948 | $65,470 |
| Median Family Income | 877 | $116,607 |
| Mean Family Income | 877 | $176,033 |
| Median Household Income | 1,404 | $99,333 |
| Mean Household Income | 1,404 | $134,900 |
| Income Deficit | 877 | $0 |
| Wage / Income Gap (%) | 2,948 | 18.67% |
| Wage / Income Gap ($) | 2,948 | 81.33¢ per $1 |
| Gini / Inequality Index | 2,948 | 0.46 |
Earnings by Sex in Sandwich
Average Earnings in Sandwich are $50,250, $59,940 for men and $48,750 for women, a difference of 18.7%.
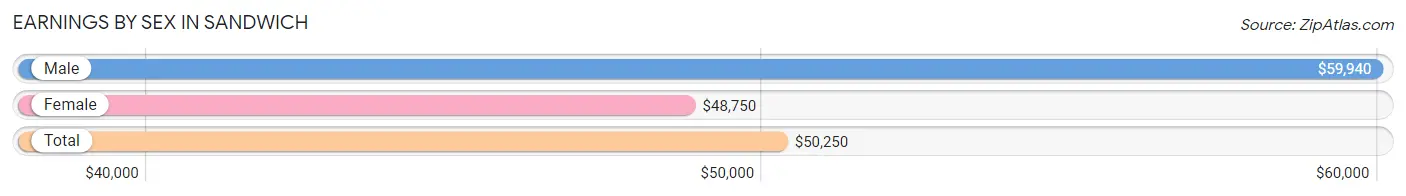
| Sex | Number | Average Earnings |
| Male | 835 (50.9%) | $59,940 |
| Female | 804 (49.0%) | $48,750 |
| Total | 1,639 (100.0%) | $50,250 |
Earnings by Sex by Income Bracket in Sandwich
The most common earnings brackets in Sandwich are $100,000+ for men (310 | 37.1%) and $75,000 to $99,999 for women (133 | 16.5%).
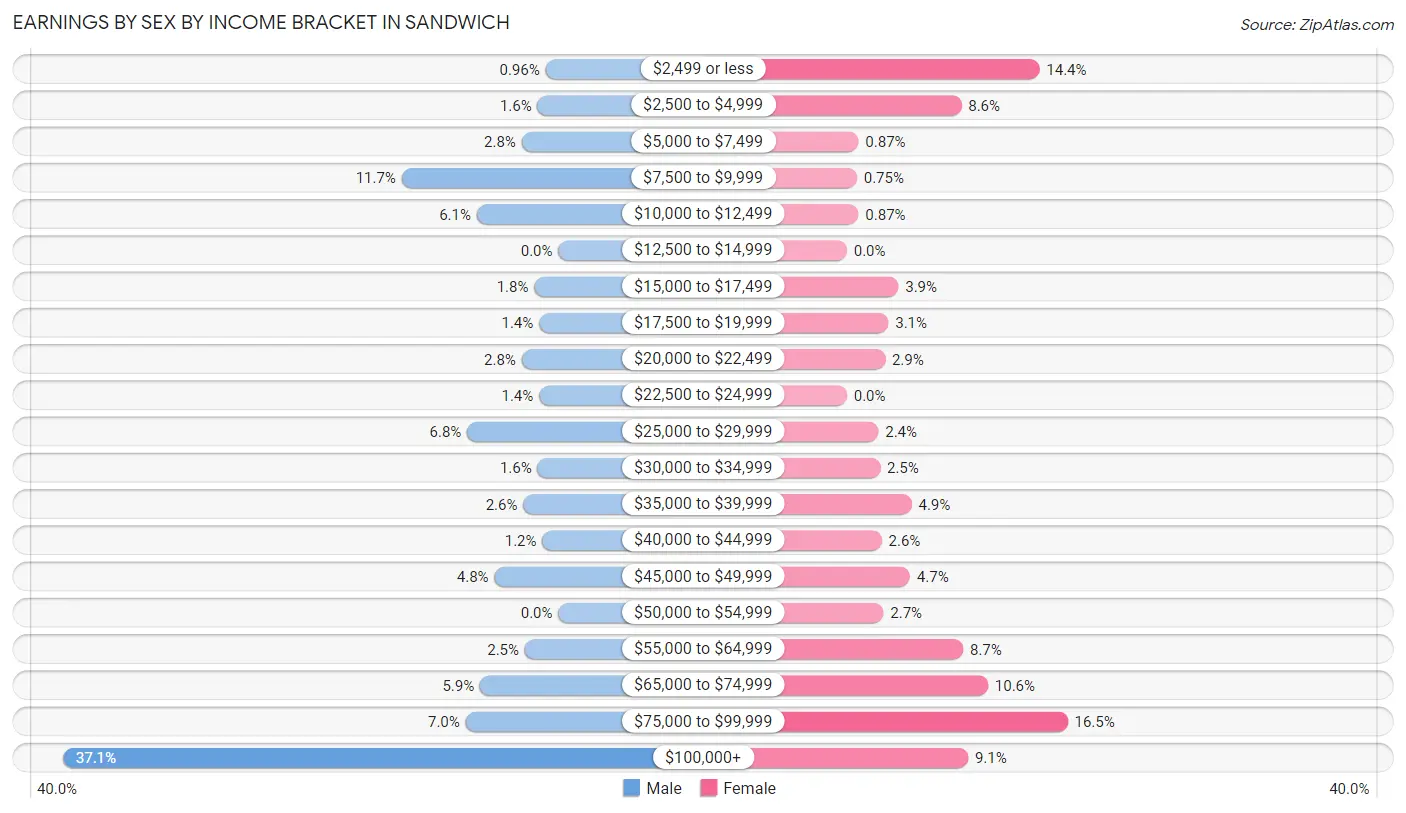
| Income | Male | Female |
| $2,499 or less | 8 (1.0%) | 116 (14.4%) |
| $2,500 to $4,999 | 13 (1.6%) | 69 (8.6%) |
| $5,000 to $7,499 | 23 (2.8%) | 7 (0.9%) |
| $7,500 to $9,999 | 98 (11.7%) | 6 (0.7%) |
| $10,000 to $12,499 | 51 (6.1%) | 7 (0.9%) |
| $12,500 to $14,999 | 0 (0.0%) | 0 (0.0%) |
| $15,000 to $17,499 | 15 (1.8%) | 31 (3.9%) |
| $17,500 to $19,999 | 12 (1.4%) | 25 (3.1%) |
| $20,000 to $22,499 | 23 (2.8%) | 23 (2.9%) |
| $22,500 to $24,999 | 12 (1.4%) | 0 (0.0%) |
| $25,000 to $29,999 | 57 (6.8%) | 19 (2.4%) |
| $30,000 to $34,999 | 13 (1.6%) | 20 (2.5%) |
| $35,000 to $39,999 | 22 (2.6%) | 39 (4.9%) |
| $40,000 to $44,999 | 10 (1.2%) | 21 (2.6%) |
| $45,000 to $49,999 | 40 (4.8%) | 38 (4.7%) |
| $50,000 to $54,999 | 0 (0.0%) | 22 (2.7%) |
| $55,000 to $64,999 | 21 (2.5%) | 70 (8.7%) |
| $65,000 to $74,999 | 49 (5.9%) | 85 (10.6%) |
| $75,000 to $99,999 | 58 (7.0%) | 133 (16.5%) |
| $100,000+ | 310 (37.1%) | 73 (9.1%) |
| Total | 835 (100.0%) | 804 (100.0%) |
Earnings by Sex by Educational Attainment in Sandwich
Average earnings in Sandwich are $79,808 for men and $53,214 for women, a difference of 33.3%. Men with an educational attainment of bachelor's degree enjoy the highest average annual earnings of $209,861, while those with college or associate's degree education earn the least with $97,813. Women with an educational attainment of bachelor's degree earn the most with the average annual earnings of $73,125, while those with graduate degree education have the smallest earnings of $63,188.

| Educational Attainment | Male Income | Female Income |
| Less than High School | - | - |
| High School Diploma | - | - |
| College or Associate's Degree | $97,813 | $0 |
| Bachelor's Degree | $209,861 | $73,125 |
| Graduate Degree | - | - |
| Total | $79,808 | $53,214 |
Family Income in Sandwich
Family Income Brackets in Sandwich
According to the Sandwich family income data, there are 301 families falling into the $200,000+ income range, which is the most common income bracket and makes up 34.3% of all families.
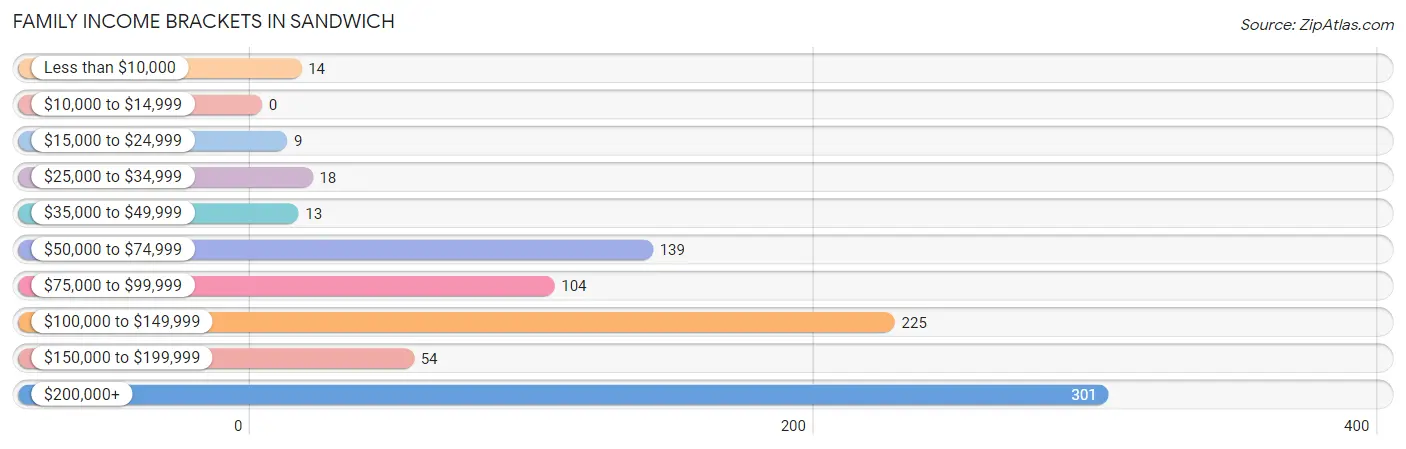
| Income Bracket | # Families | % Families |
| Less than $10,000 | 14 | 1.6% |
| $10,000 to $14,999 | 0 | 0.0% |
| $15,000 to $24,999 | 9 | 1.0% |
| $25,000 to $34,999 | 18 | 2.1% |
| $35,000 to $49,999 | 13 | 1.5% |
| $50,000 to $74,999 | 139 | 15.8% |
| $75,000 to $99,999 | 104 | 11.9% |
| $100,000 to $149,999 | 225 | 25.7% |
| $150,000 to $199,999 | 54 | 6.2% |
| $200,000+ | 301 | 34.3% |
Family Income by Famaliy Size in Sandwich
4-person families (37 | 4.2%) account for the highest median family income in Sandwich with $218,935 per family, while 2-person families (657 | 74.9%) have the highest median income of $57,070 per family member.
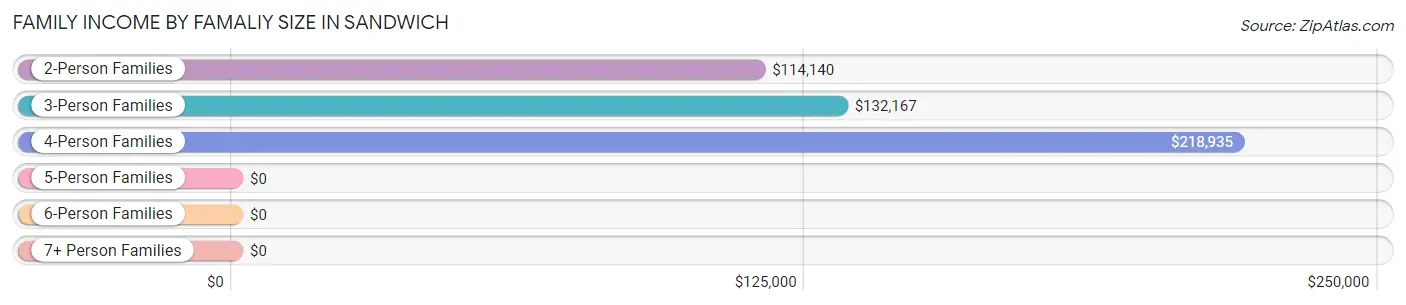
| Income Bracket | # Families | Median Income |
| 2-Person Families | 657 (74.9%) | $114,140 |
| 3-Person Families | 110 (12.5%) | $132,167 |
| 4-Person Families | 37 (4.2%) | $218,935 |
| 5-Person Families | 73 (8.3%) | $0 |
| 6-Person Families | 0 (0.0%) | $0 |
| 7+ Person Families | 0 (0.0%) | $0 |
| Total | 877 (100.0%) | $116,607 |
Family Income by Number of Earners in Sandwich
The median family income in Sandwich is $116,607, with families comprising 1 earner (207) having the highest median family income of $226,125, while families with no earners (162) have the lowest median family income of $77,692, accounting for 23.6% and 18.5% of families, respectively.
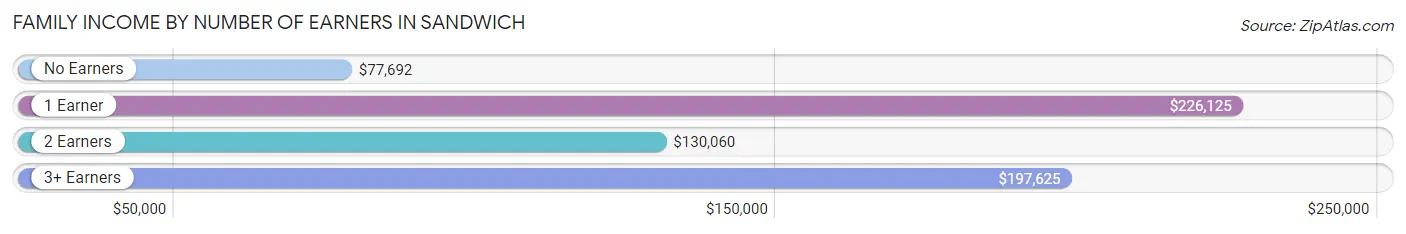
| Number of Earners | # Families | Median Income |
| No Earners | 162 (18.5%) | $77,692 |
| 1 Earner | 207 (23.6%) | $226,125 |
| 2 Earners | 421 (48.0%) | $130,060 |
| 3+ Earners | 87 (9.9%) | $197,625 |
| Total | 877 (100.0%) | $116,607 |
Household Income in Sandwich
Household Income Brackets in Sandwich
With 322 households falling in the category, the $200,000+ income range is the most frequent in Sandwich, accounting for 22.9% of all households. In contrast, only 15 households (1.1%) fall into the $10,000 to $14,999 income bracket, making it the least populous group.
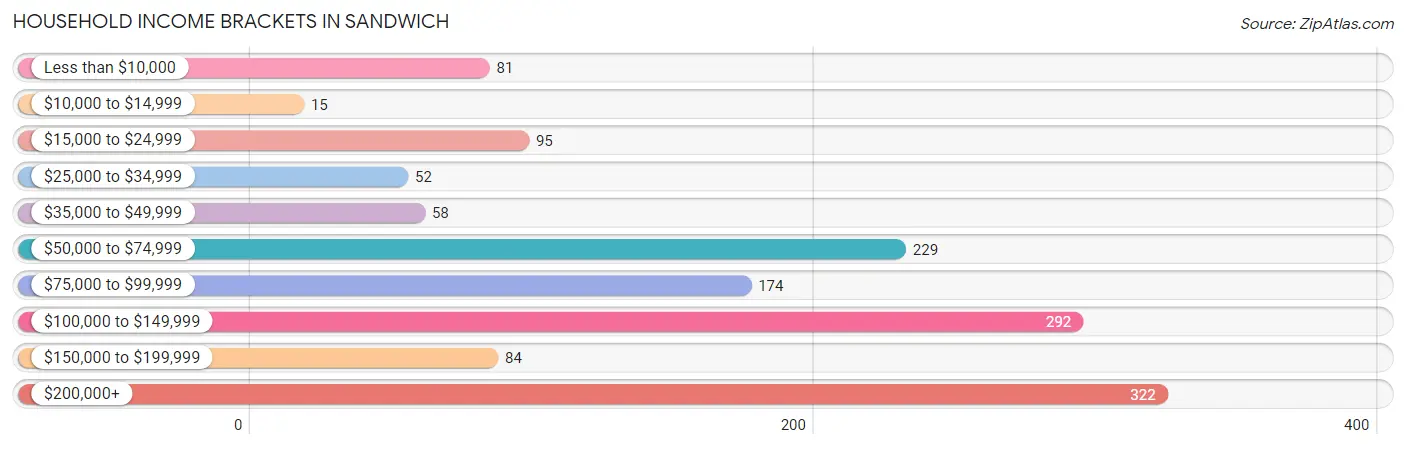
| Income Bracket | # Households | % Households |
| Less than $10,000 | 81 | 5.8% |
| $10,000 to $14,999 | 15 | 1.1% |
| $15,000 to $24,999 | 95 | 6.8% |
| $25,000 to $34,999 | 52 | 3.7% |
| $35,000 to $49,999 | 58 | 4.1% |
| $50,000 to $74,999 | 229 | 16.3% |
| $75,000 to $99,999 | 174 | 12.4% |
| $100,000 to $149,999 | 292 | 20.8% |
| $150,000 to $199,999 | 84 | 6.0% |
| $200,000+ | 322 | 22.9% |
Household Income by Householder Age in Sandwich
The median household income in Sandwich is $99,333, with the highest median household income of $150,521 found in the 45 to 64 years age bracket for the primary householder. A total of 423 households (30.1%) fall into this category. Meanwhile, the 15 to 24 years age bracket for the primary householder has the lowest median household income of $0, with 14 households (1.0%) in this group.
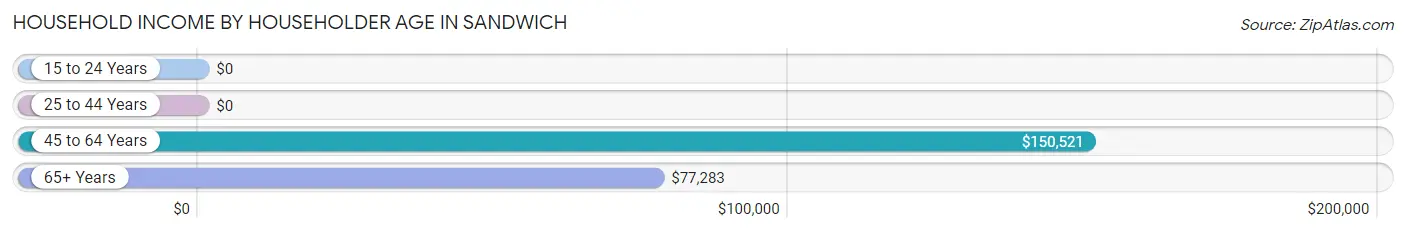
| Income Bracket | # Households | Median Income |
| 15 to 24 Years | 14 (1.0%) | $0 |
| 25 to 44 Years | 229 (16.3%) | $0 |
| 45 to 64 Years | 423 (30.1%) | $150,521 |
| 65+ Years | 738 (52.6%) | $77,283 |
| Total | 1,404 (100.0%) | $99,333 |
Poverty in Sandwich
Income Below Poverty by Sex and Age in Sandwich
With 6.7% poverty level for males and 6.0% for females among the residents of Sandwich, under 5 year old males and 18 to 24 year old females are the most vulnerable to poverty, with 10 males (100.0%) and 14 females (21.2%) in their respective age groups living below the poverty level.
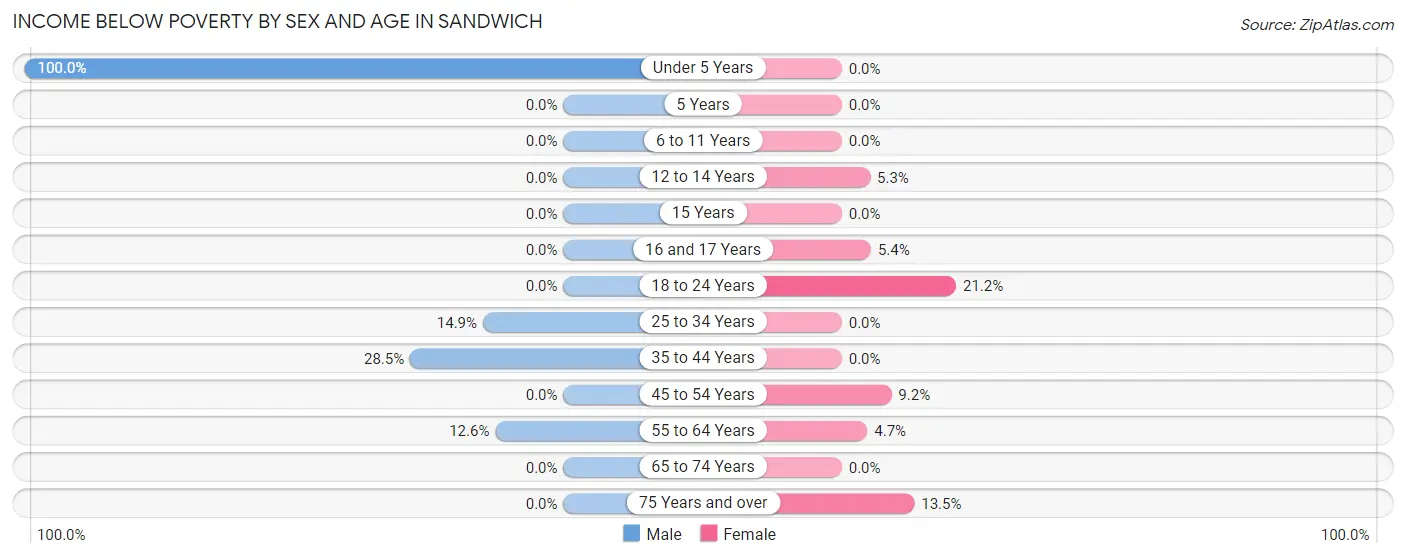
| Age Bracket | Male | Female |
| Under 5 Years | 10 (100.0%) | 0 (0.0%) |
| 5 Years | 0 (0.0%) | 0 (0.0%) |
| 6 to 11 Years | 0 (0.0%) | 0 (0.0%) |
| 12 to 14 Years | 0 (0.0%) | 3 (5.3%) |
| 15 Years | 0 (0.0%) | 0 (0.0%) |
| 16 and 17 Years | 0 (0.0%) | 4 (5.4%) |
| 18 to 24 Years | 0 (0.0%) | 14 (21.2%) |
| 25 to 34 Years | 13 (14.9%) | 0 (0.0%) |
| 35 to 44 Years | 37 (28.5%) | 0 (0.0%) |
| 45 to 54 Years | 0 (0.0%) | 14 (9.2%) |
| 55 to 64 Years | 33 (12.6%) | 17 (4.7%) |
| 65 to 74 Years | 0 (0.0%) | 0 (0.0%) |
| 75 Years and over | 0 (0.0%) | 42 (13.5%) |
| Total | 93 (6.7%) | 94 (6.0%) |
Income Above Poverty by Sex and Age in Sandwich
According to the poverty statistics in Sandwich, males aged 6 to 11 years and females aged under 5 years are the age groups that are most secure financially, with 100.0% of males and 100.0% of females in these age groups living above the poverty line.
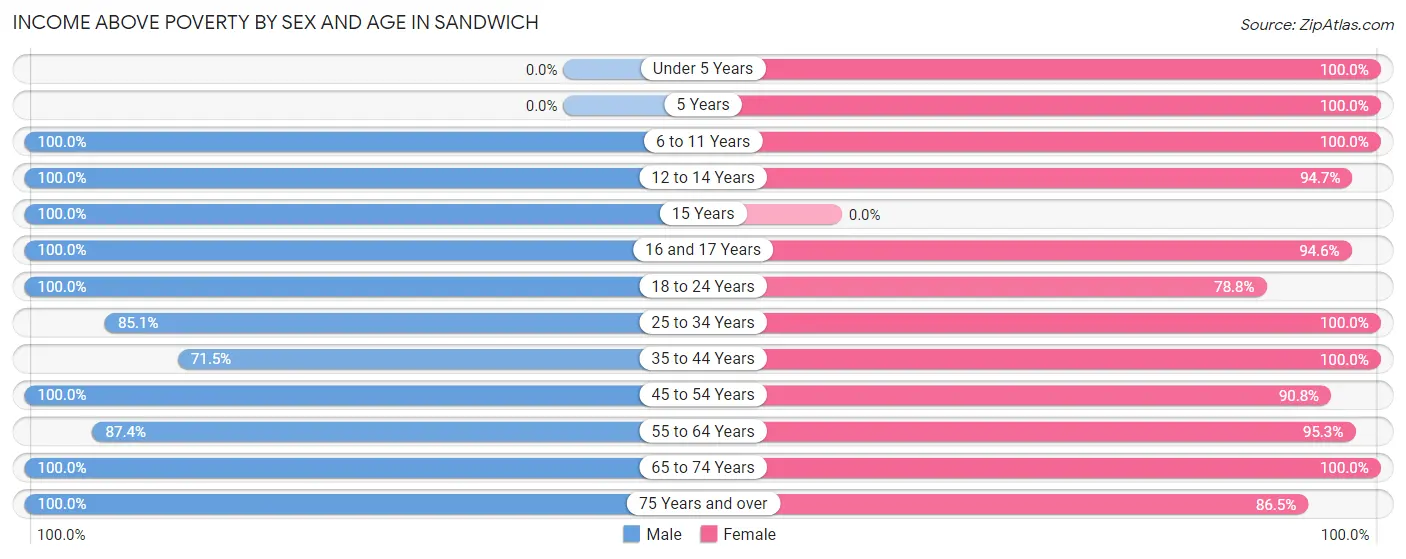
| Age Bracket | Male | Female |
| Under 5 Years | 0 (0.0%) | 14 (100.0%) |
| 5 Years | 0 (0.0%) | 25 (100.0%) |
| 6 to 11 Years | 54 (100.0%) | 37 (100.0%) |
| 12 to 14 Years | 29 (100.0%) | 54 (94.7%) |
| 15 Years | 17 (100.0%) | 0 (0.0%) |
| 16 and 17 Years | 56 (100.0%) | 70 (94.6%) |
| 18 to 24 Years | 125 (100.0%) | 52 (78.8%) |
| 25 to 34 Years | 74 (85.1%) | 48 (100.0%) |
| 35 to 44 Years | 93 (71.5%) | 136 (100.0%) |
| 45 to 54 Years | 146 (100.0%) | 138 (90.8%) |
| 55 to 64 Years | 228 (87.4%) | 342 (95.3%) |
| 65 to 74 Years | 341 (100.0%) | 275 (100.0%) |
| 75 Years and over | 123 (100.0%) | 270 (86.5%) |
| Total | 1,286 (93.3%) | 1,461 (94.0%) |
Income Below Poverty Among Married-Couple Families in Sandwich
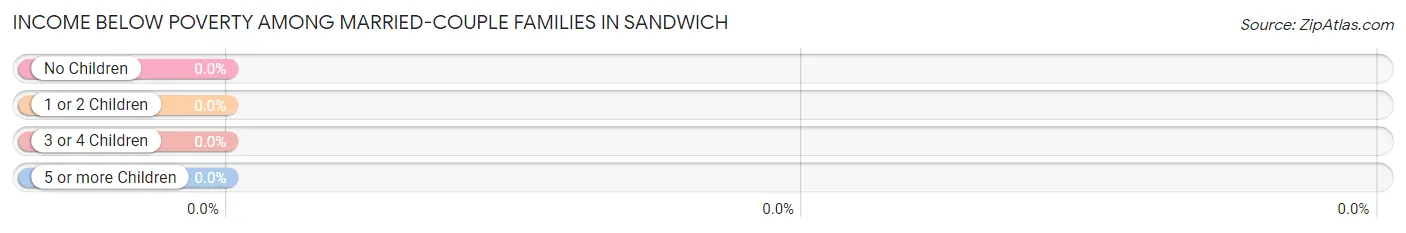
| Children | Above Poverty | Below Poverty |
| No Children | 545 (100.0%) | 0 (0.0%) |
| 1 or 2 Children | 118 (100.0%) | 0 (0.0%) |
| 3 or 4 Children | 0 (0.0%) | 0 (0.0%) |
| 5 or more Children | 0 (0.0%) | 0 (0.0%) |
| Total | 663 (100.0%) | 0 (0.0%) |
Income Below Poverty Among Single-Parent Households in Sandwich
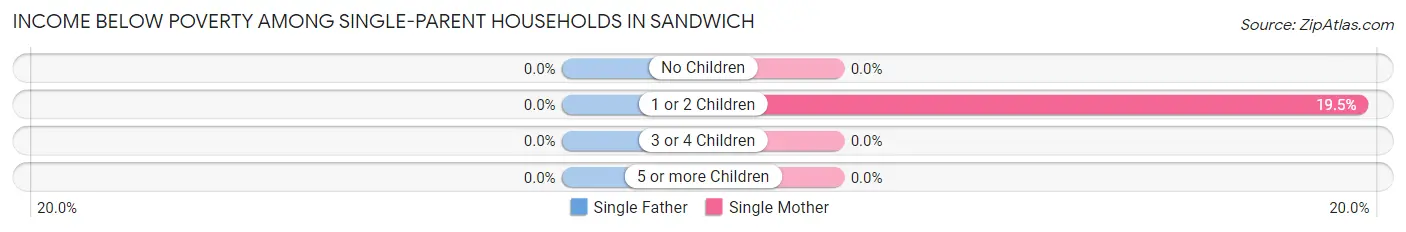
| Children | Single Father | Single Mother |
| No Children | 0 (0.0%) | 0 (0.0%) |
| 1 or 2 Children | 0 (0.0%) | 17 (19.5%) |
| 3 or 4 Children | 0 (0.0%) | 0 (0.0%) |
| 5 or more Children | 0 (0.0%) | 0 (0.0%) |
| Total | 0 (0.0%) | 17 (12.8%) |
Income Below Poverty Among Married-Couple vs Single-Parent Households in Sandwich
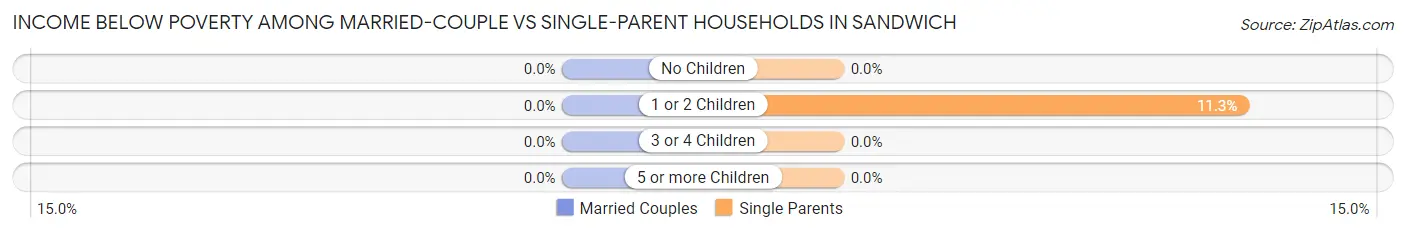
| Children | Married-Couple Families | Single-Parent Households |
| No Children | 0 (0.0%) | 0 (0.0%) |
| 1 or 2 Children | 0 (0.0%) | 17 (11.3%) |
| 3 or 4 Children | 0 (0.0%) | 0 (0.0%) |
| 5 or more Children | 0 (0.0%) | 0 (0.0%) |
| Total | 0 (0.0%) | 17 (7.9%) |
Race in Sandwich
The most populous races in Sandwich are White / Caucasian (2,817 | 95.6%), Hispanic or Latino (113 | 3.8%), and Asian (73 | 2.5%).
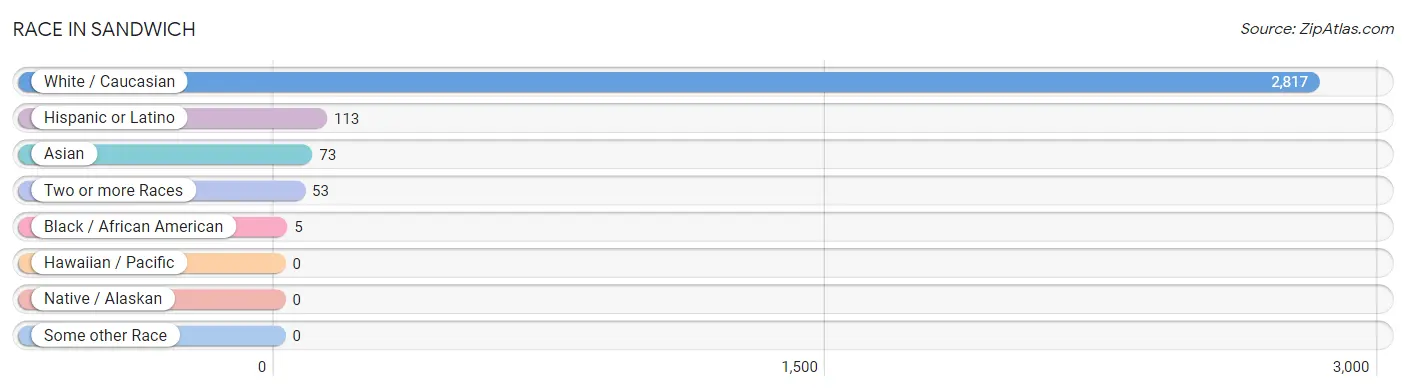
| Race | # Population | % Population |
| Asian | 73 | 2.5% |
| Black / African American | 5 | 0.2% |
| Hawaiian / Pacific | 0 | 0.0% |
| Hispanic or Latino | 113 | 3.8% |
| Native / Alaskan | 0 | 0.0% |
| White / Caucasian | 2,817 | 95.6% |
| Two or more Races | 53 | 1.8% |
| Some other Race | 0 | 0.0% |
| Total | 2,948 | 100.0% |
Ancestry in Sandwich
The most populous ancestries reported in Sandwich are Irish (905 | 30.7%), English (709 | 24.0%), Italian (446 | 15.1%), Scottish (299 | 10.1%), and German (281 | 9.5%), together accounting for 89.5% of all Sandwich residents.
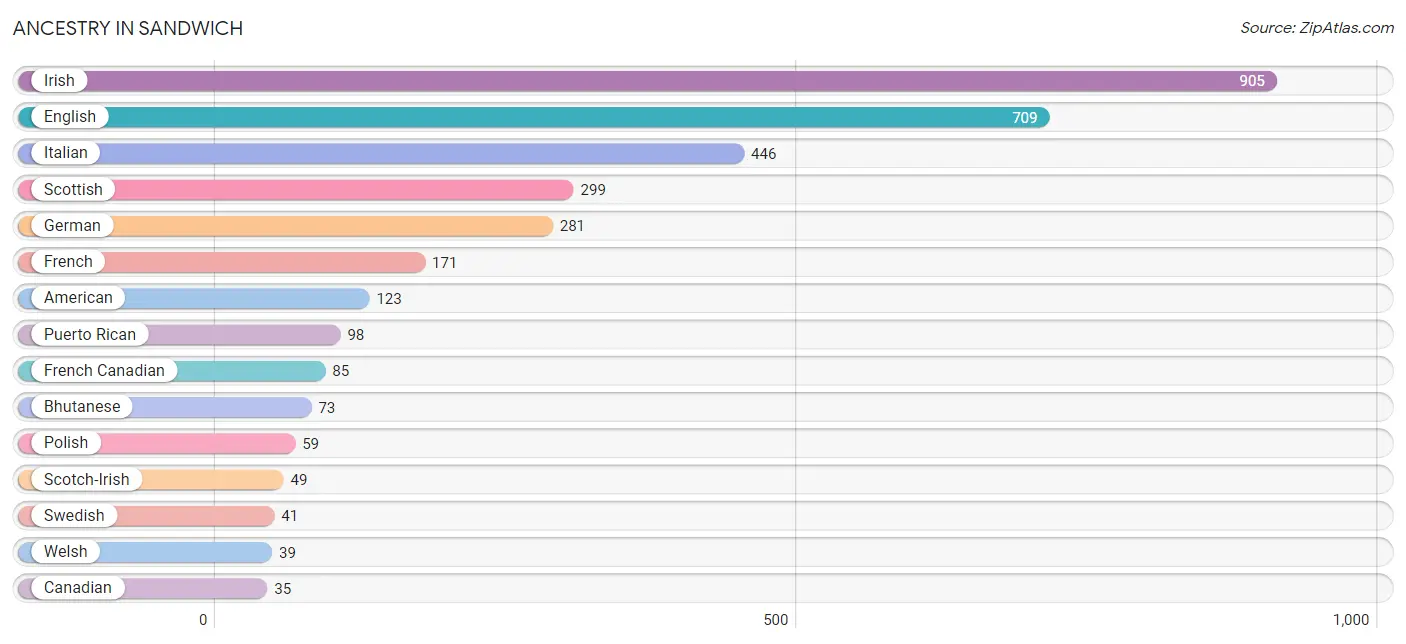
| Ancestry | # Population | % Population |
| American | 123 | 4.2% |
| Arab | 20 | 0.7% |
| Armenian | 14 | 0.5% |
| Bhutanese | 73 | 2.5% |
| Canadian | 35 | 1.2% |
| Central American | 7 | 0.2% |
| Costa Rican | 7 | 0.2% |
| Czechoslovakian | 8 | 0.3% |
| Danish | 7 | 0.2% |
| Dutch | 13 | 0.4% |
| Eastern European | 4 | 0.1% |
| English | 709 | 24.0% |
| European | 13 | 0.4% |
| Finnish | 21 | 0.7% |
| French | 171 | 5.8% |
| French Canadian | 85 | 2.9% |
| German | 281 | 9.5% |
| Greek | 22 | 0.7% |
| Irish | 905 | 30.7% |
| Italian | 446 | 15.1% |
| Lebanese | 20 | 0.7% |
| Northern European | 24 | 0.8% |
| Polish | 59 | 2.0% |
| Portuguese | 30 | 1.0% |
| Puerto Rican | 98 | 3.3% |
| Russian | 19 | 0.6% |
| Scandinavian | 6 | 0.2% |
| Scotch-Irish | 49 | 1.7% |
| Scottish | 299 | 10.1% |
| South American | 8 | 0.3% |
| Swedish | 41 | 1.4% |
| Uruguayan | 8 | 0.3% |
| Welsh | 39 | 1.3% | View All 33 Rows |
Immigrants in Sandwich
The most numerous immigrant groups reported in Sandwich came from Asia (87 | 2.9%), Eastern Asia (73 | 2.5%), Japan (73 | 2.5%), Canada (15 | 0.5%), and Western Asia (14 | 0.5%), together accounting for 8.9% of all Sandwich residents.
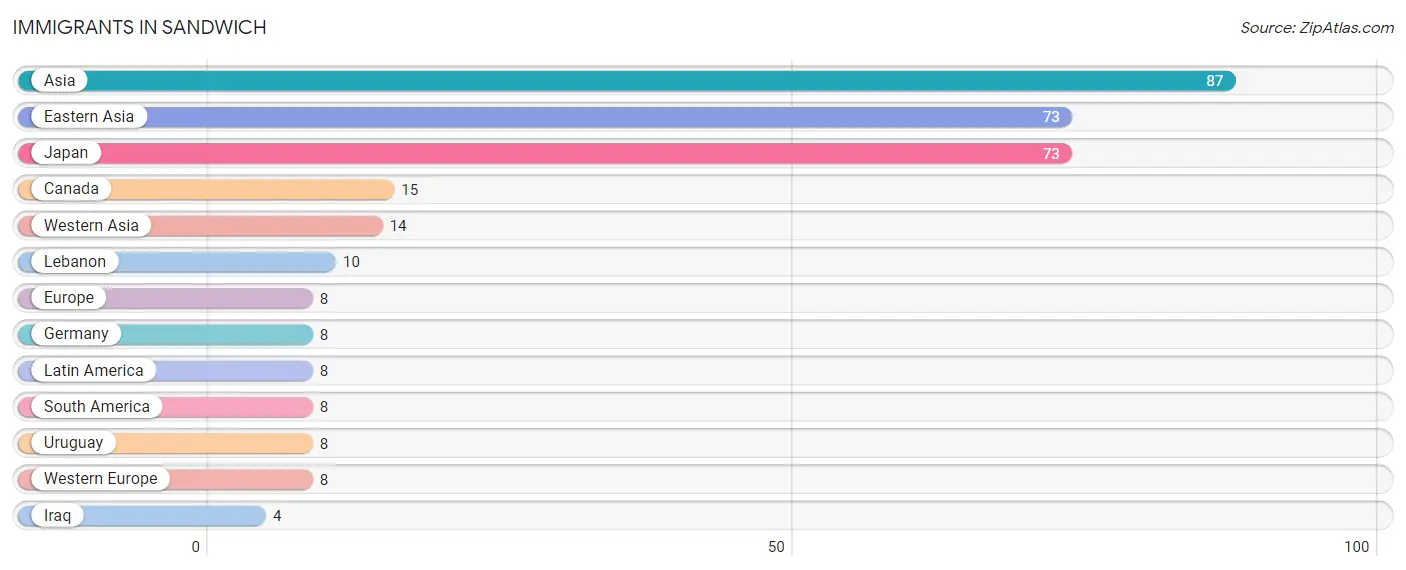
| Immigration Origin | # Population | % Population |
| Asia | 87 | 2.9% |
| Canada | 15 | 0.5% |
| Eastern Asia | 73 | 2.5% |
| Europe | 8 | 0.3% |
| Germany | 8 | 0.3% |
| Iraq | 4 | 0.1% |
| Japan | 73 | 2.5% |
| Latin America | 8 | 0.3% |
| Lebanon | 10 | 0.3% |
| South America | 8 | 0.3% |
| Uruguay | 8 | 0.3% |
| Western Asia | 14 | 0.5% |
| Western Europe | 8 | 0.3% | View All 13 Rows |
Sex and Age in Sandwich
Sex and Age in Sandwich
The most populous age groups in Sandwich are 65 to 69 Years (210 | 15.1%) for men and 55 to 59 Years (216 | 13.9%) for women.
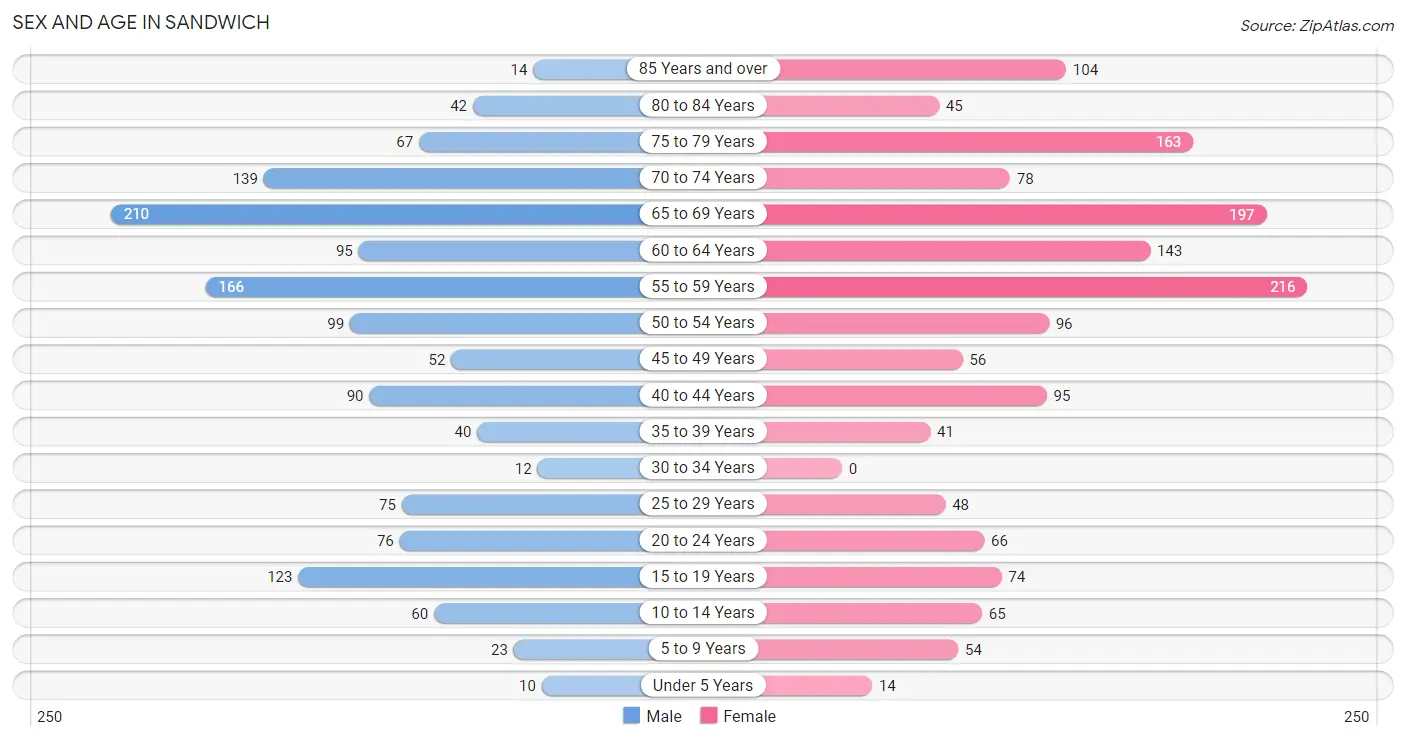
| Age Bracket | Male | Female |
| Under 5 Years | 10 (0.7%) | 14 (0.9%) |
| 5 to 9 Years | 23 (1.7%) | 54 (3.5%) |
| 10 to 14 Years | 60 (4.3%) | 65 (4.2%) |
| 15 to 19 Years | 123 (8.8%) | 74 (4.8%) |
| 20 to 24 Years | 76 (5.5%) | 66 (4.2%) |
| 25 to 29 Years | 75 (5.4%) | 48 (3.1%) |
| 30 to 34 Years | 12 (0.9%) | 0 (0.0%) |
| 35 to 39 Years | 40 (2.9%) | 41 (2.6%) |
| 40 to 44 Years | 90 (6.5%) | 95 (6.1%) |
| 45 to 49 Years | 52 (3.7%) | 56 (3.6%) |
| 50 to 54 Years | 99 (7.1%) | 96 (6.2%) |
| 55 to 59 Years | 166 (11.9%) | 216 (13.9%) |
| 60 to 64 Years | 95 (6.8%) | 143 (9.2%) |
| 65 to 69 Years | 210 (15.1%) | 197 (12.7%) |
| 70 to 74 Years | 139 (10.0%) | 78 (5.0%) |
| 75 to 79 Years | 67 (4.8%) | 163 (10.5%) |
| 80 to 84 Years | 42 (3.0%) | 45 (2.9%) |
| 85 Years and over | 14 (1.0%) | 104 (6.7%) |
| Total | 1,393 (100.0%) | 1,555 (100.0%) |
Families and Households in Sandwich
Median Family Size in Sandwich
The median family size in Sandwich is 2.57 persons per family, with single female/mother families (133 | 15.2%) accounting for the largest median family size of 2.84 persons per family. On the other hand, single male/father families (81 | 9.2%) represent the smallest median family size with 2.11 persons per family.
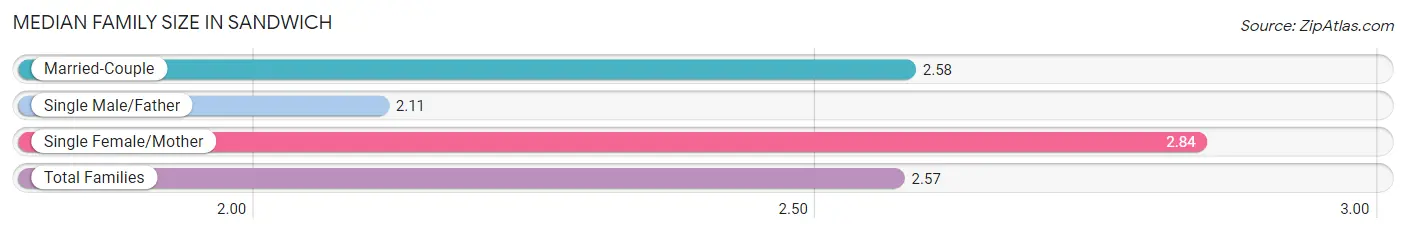
| Family Type | # Families | Family Size |
| Married-Couple | 663 (75.6%) | 2.58 |
| Single Male/Father | 81 (9.2%) | 2.11 |
| Single Female/Mother | 133 (15.2%) | 2.84 |
| Total Families | 877 (100.0%) | 2.57 |
Median Household Size in Sandwich
The median household size in Sandwich is 2.09 persons per household, with single female/mother households (133 | 9.5%) accounting for the largest median household size of 3.01 persons per household. non-family households (527 | 37.5%) represent the smallest median household size with 1.24 persons per household.
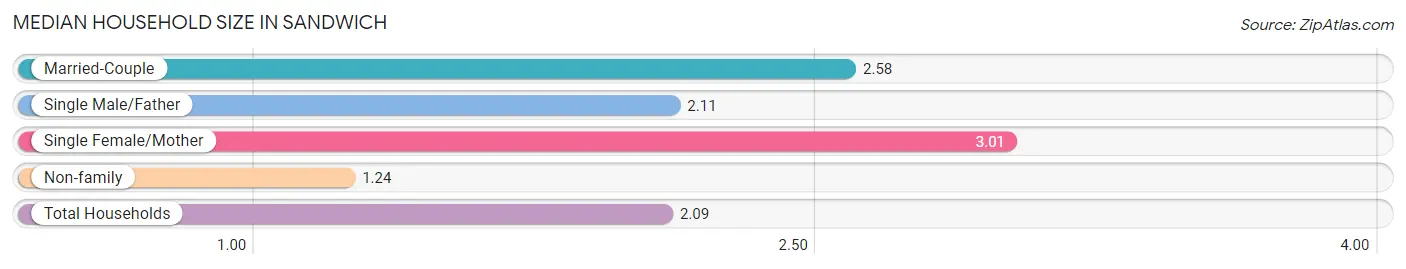
| Household Type | # Households | Household Size |
| Married-Couple | 663 (47.2%) | 2.58 |
| Single Male/Father | 81 (5.8%) | 2.11 |
| Single Female/Mother | 133 (9.5%) | 3.01 |
| Non-family | 527 (37.5%) | 1.24 |
| Total Households | 1,404 (100.0%) | 2.09 |
Household Size by Marriage Status in Sandwich
Out of a total of 1,404 households in Sandwich, 877 (62.5%) are family households, while 527 (37.5%) are nonfamily households. The most numerous type of family households are 2-person households, comprising 643, and the most common type of nonfamily households are 1-person households, comprising 421.
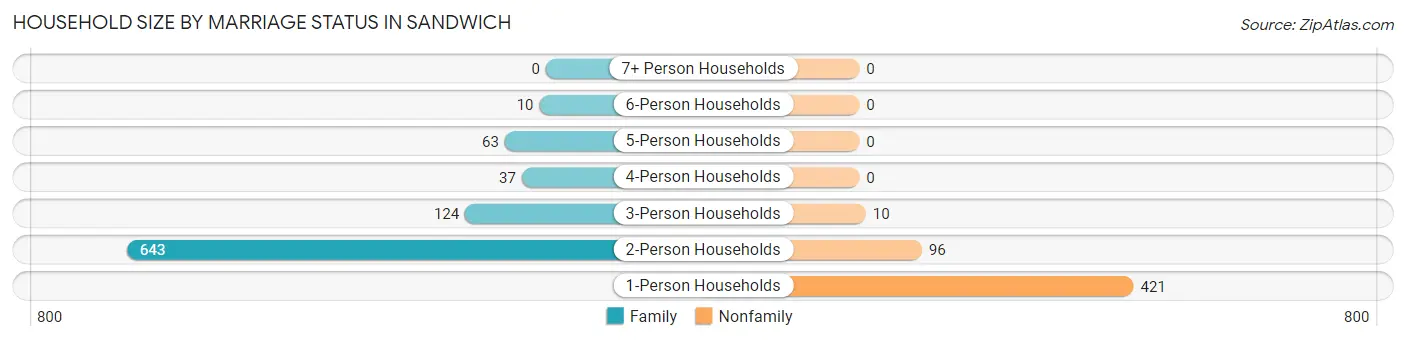
| Household Size | Family Households | Nonfamily Households |
| 1-Person Households | - | 421 (30.0%) |
| 2-Person Households | 643 (45.8%) | 96 (6.8%) |
| 3-Person Households | 124 (8.8%) | 10 (0.7%) |
| 4-Person Households | 37 (2.6%) | 0 (0.0%) |
| 5-Person Households | 63 (4.5%) | 0 (0.0%) |
| 6-Person Households | 10 (0.7%) | 0 (0.0%) |
| 7+ Person Households | 0 (0.0%) | 0 (0.0%) |
| Total | 877 (62.5%) | 527 (37.5%) |
Female Fertility in Sandwich
Fertility by Age in Sandwich
| Age Bracket | Women with Births | Births / 1,000 Women |
| 15 to 19 years | 0 (0.0%) | 0.0 |
| 20 to 34 years | 0 (0.0%) | 0.0 |
| 35 to 50 years | 0 (0.0%) | 0.0 |
| Total | 0 (0.0%) | 0.0 |
Fertility by Age by Marriage Status in Sandwich
| Age Bracket | Married | Unmarried |
| 15 to 19 years | 0 (0.0%) | 0 (0.0%) |
| 20 to 34 years | 0 (0.0%) | 0 (0.0%) |
| 35 to 50 years | 0 (0.0%) | 0 (0.0%) |
| Total | 0 (0.0%) | 0 (0.0%) |
Fertility by Education in Sandwich
| Educational Attainment | Women with Births | Births / 1,000 Women |
| Less than High School | 0 (0.0%) | 0.0 |
| High School Diploma | 0 (0.0%) | 0.0 |
| College or Associate's Degree | 0 (0.0%) | 0.0 |
| Bachelor's Degree | 0 (0.0%) | 0.0 |
| Graduate Degree | 0 (0.0%) | 0.0 |
| Total | 0 (0.0%) | 0.0 |
Fertility by Education by Marriage Status in Sandwich
| Educational Attainment | Married | Unmarried |
| Less than High School | 0 (0.0%) | 0 (0.0%) |
| High School Diploma | 0 (0.0%) | 0 (0.0%) |
| College or Associate's Degree | 0 (0.0%) | 0 (0.0%) |
| Bachelor's Degree | 0 (0.0%) | 0 (0.0%) |
| Graduate Degree | 0 (0.0%) | 0 (0.0%) |
| Total | 0 (0.0%) | 0 (0.0%) |
Employment Characteristics in Sandwich
Employment by Class of Employer in Sandwich
Among the 1,458 employed individuals in Sandwich, private company employees (728 | 49.9%), not-for-profit organizations (263 | 18.0%), and local government employees (172 | 11.8%) make up the most common classes of employment.
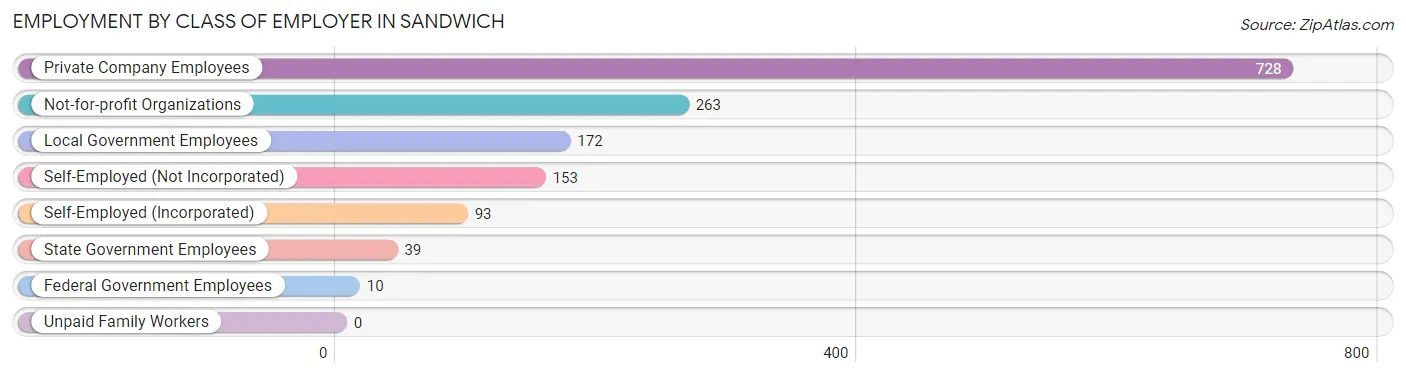
| Employer Class | # Employees | % Employees |
| Private Company Employees | 728 | 49.9% |
| Self-Employed (Incorporated) | 93 | 6.4% |
| Self-Employed (Not Incorporated) | 153 | 10.5% |
| Not-for-profit Organizations | 263 | 18.0% |
| Local Government Employees | 172 | 11.8% |
| State Government Employees | 39 | 2.7% |
| Federal Government Employees | 10 | 0.7% |
| Unpaid Family Workers | 0 | 0.0% |
| Total | 1,458 | 100.0% |
Employment Status by Age in Sandwich
According to the labor force statistics for Sandwich, out of the total population over 16 years of age (2,705), 56.4% or 1,526 individuals are in the labor force, with 4.4% or 67 of them unemployed. The age group with the highest labor force participation rate is 30 to 34 years, with 100.0% or 12 individuals in the labor force. Within the labor force, the 25 to 29 years age range has the highest percentage of unemployed individuals, with 16.0% or 13 of them being unemployed.
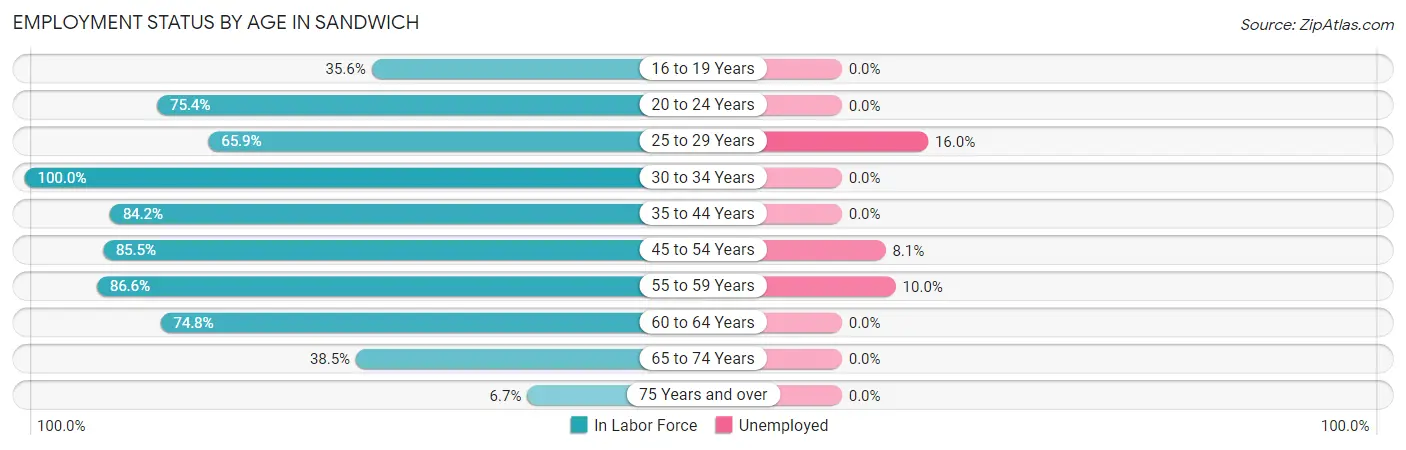
| Age Bracket | In Labor Force | Unemployed |
| 16 to 19 Years | 64 (35.6%) | 0 (0.0%) |
| 20 to 24 Years | 107 (75.4%) | 0 (0.0%) |
| 25 to 29 Years | 81 (65.9%) | 13 (16.0%) |
| 30 to 34 Years | 12 (100.0%) | 0 (0.0%) |
| 35 to 44 Years | 224 (84.2%) | 0 (0.0%) |
| 45 to 54 Years | 259 (85.5%) | 21 (8.1%) |
| 55 to 59 Years | 331 (86.6%) | 33 (10.0%) |
| 60 to 64 Years | 178 (74.8%) | 0 (0.0%) |
| 65 to 74 Years | 240 (38.5%) | 0 (0.0%) |
| 75 Years and over | 29 (6.7%) | 0 (0.0%) |
| Total | 1,526 (56.4%) | 67 (4.4%) |
Employment Status by Educational Attainment in Sandwich
According to labor force statistics for Sandwich, 81.9% of individuals (1,084) out of the total population between 25 and 64 years of age (1,324) are in the labor force, with 6.2% or 67 of them being unemployed. The group with the highest labor force participation rate are those with the educational attainment of college / associate degree, with 84.5% or 239 individuals in the labor force. Within the labor force, individuals with high school diploma education have the highest percentage of unemployment, with 22.8% or 33 of them being unemployed.
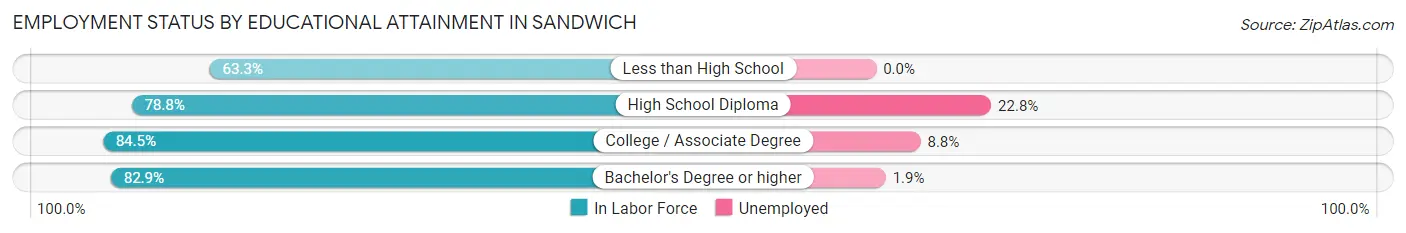
| Educational Attainment | In Labor Force | Unemployed |
| Less than High School | 31 (63.3%) | 0 (0.0%) |
| High School Diploma | 145 (78.8%) | 42 (22.8%) |
| College / Associate Degree | 239 (84.5%) | 25 (8.8%) |
| Bachelor's Degree or higher | 670 (82.9%) | 15 (1.9%) |
| Total | 1,084 (81.9%) | 82 (6.2%) |
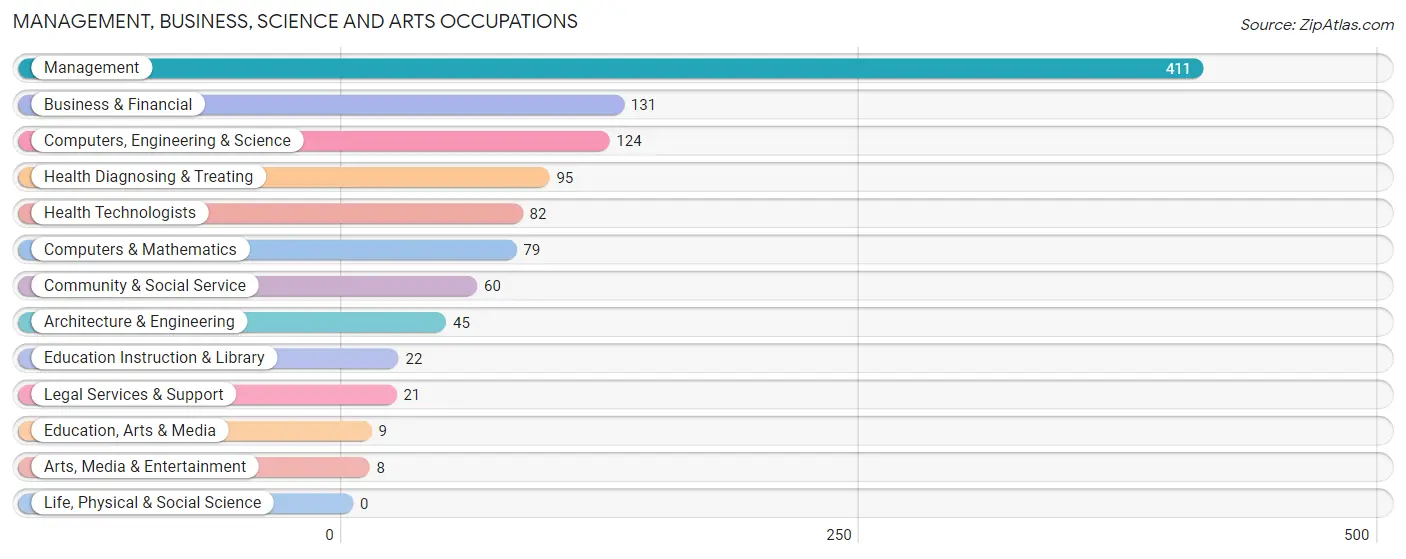
Employment Occupations by Sex in Sandwich
Management, Business, Science and Arts Occupations
The most common Management, Business, Science and Arts occupations in Sandwich are Management (411 | 28.2%), Business & Financial (131 | 9.0%), Computers, Engineering & Science (124 | 8.5%), Health Diagnosing & Treating (95 | 6.5%), and Health Technologists (82 | 5.6%).
Management, Business, Science and Arts Occupations by Sex
Within the Management, Business, Science and Arts occupations in Sandwich, the most male-oriented occupations are Legal Services & Support (100.0%), Computers & Mathematics (88.6%), and Computers, Engineering & Science (79.8%), while the most female-oriented occupations are Education, Arts & Media (100.0%), Arts, Media & Entertainment (100.0%), and Health Diagnosing & Treating (84.2%).
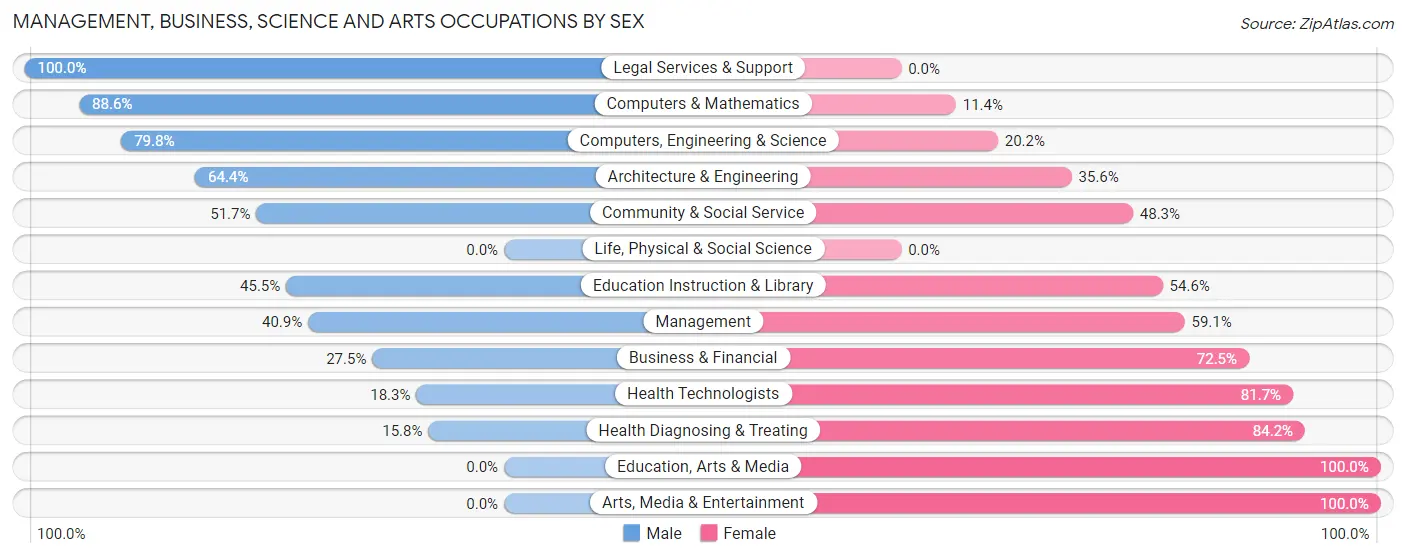
| Occupation | Male | Female |
| Management | 168 (40.9%) | 243 (59.1%) |
| Business & Financial | 36 (27.5%) | 95 (72.5%) |
| Computers, Engineering & Science | 99 (79.8%) | 25 (20.2%) |
| Computers & Mathematics | 70 (88.6%) | 9 (11.4%) |
| Architecture & Engineering | 29 (64.4%) | 16 (35.6%) |
| Life, Physical & Social Science | 0 (0.0%) | 0 (0.0%) |
| Community & Social Service | 31 (51.7%) | 29 (48.3%) |
| Education, Arts & Media | 0 (0.0%) | 9 (100.0%) |
| Legal Services & Support | 21 (100.0%) | 0 (0.0%) |
| Education Instruction & Library | 10 (45.5%) | 12 (54.5%) |
| Arts, Media & Entertainment | 0 (0.0%) | 8 (100.0%) |
| Health Diagnosing & Treating | 15 (15.8%) | 80 (84.2%) |
| Health Technologists | 15 (18.3%) | 67 (81.7%) |
| Total (Category) | 349 (42.5%) | 472 (57.5%) |
| Total (Overall) | 760 (52.1%) | 698 (47.9%) |
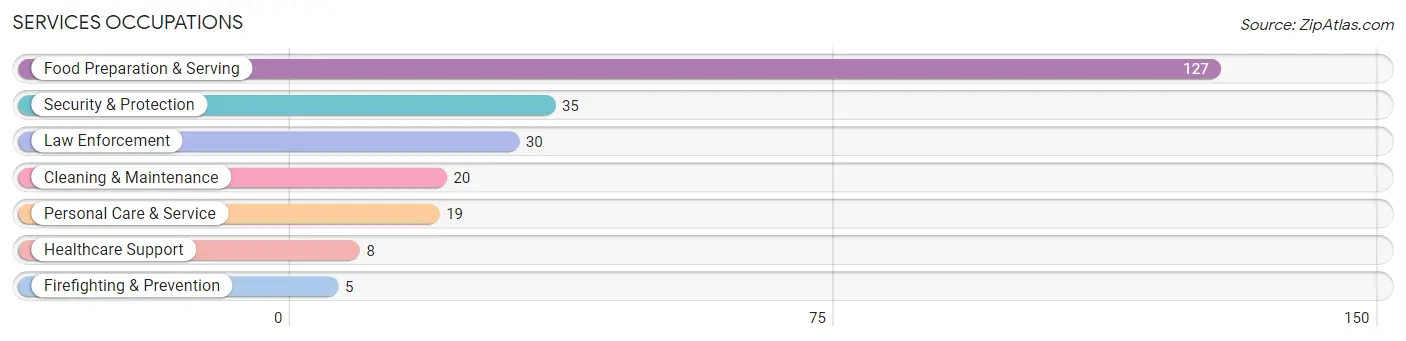
Services Occupations
The most common Services occupations in Sandwich are Food Preparation & Serving (127 | 8.7%), Security & Protection (35 | 2.4%), Law Enforcement (30 | 2.1%), Cleaning & Maintenance (20 | 1.4%), and Personal Care & Service (19 | 1.3%).
Services Occupations by Sex
Within the Services occupations in Sandwich, the most male-oriented occupations are Law Enforcement (100.0%), Security & Protection (85.7%), and Food Preparation & Serving (59.8%), while the most female-oriented occupations are Healthcare Support (100.0%), Firefighting & Prevention (100.0%), and Cleaning & Maintenance (100.0%).
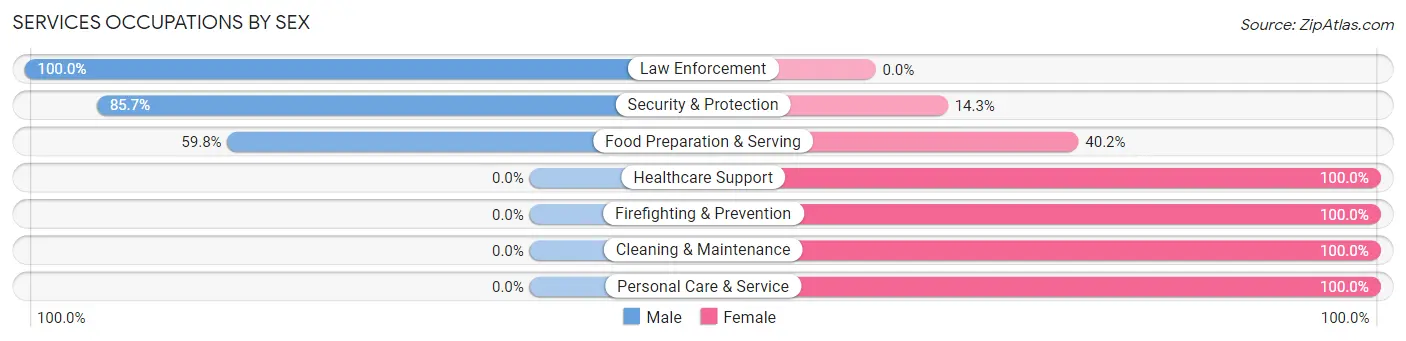
| Occupation | Male | Female |
| Healthcare Support | 0 (0.0%) | 8 (100.0%) |
| Security & Protection | 30 (85.7%) | 5 (14.3%) |
| Firefighting & Prevention | 0 (0.0%) | 5 (100.0%) |
| Law Enforcement | 30 (100.0%) | 0 (0.0%) |
| Food Preparation & Serving | 76 (59.8%) | 51 (40.2%) |
| Cleaning & Maintenance | 0 (0.0%) | 20 (100.0%) |
| Personal Care & Service | 0 (0.0%) | 19 (100.0%) |
| Total (Category) | 106 (50.7%) | 103 (49.3%) |
| Total (Overall) | 760 (52.1%) | 698 (47.9%) |
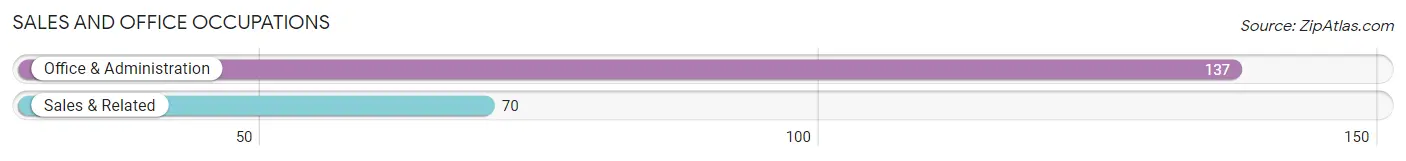
Sales and Office Occupations
The most common Sales and Office occupations in Sandwich are Office & Administration (137 | 9.4%), and Sales & Related (70 | 4.8%).
Sales and Office Occupations by Sex
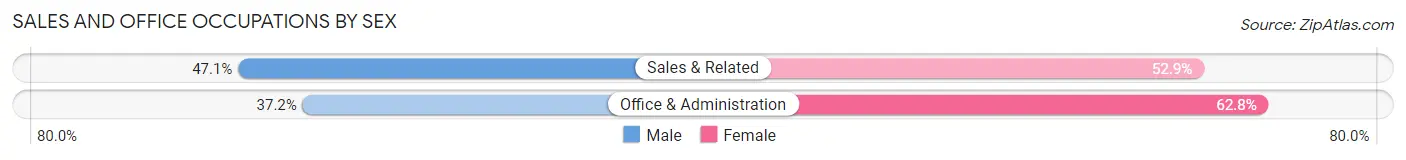
| Occupation | Male | Female |
| Sales & Related | 33 (47.1%) | 37 (52.9%) |
| Office & Administration | 51 (37.2%) | 86 (62.8%) |
| Total (Category) | 84 (40.6%) | 123 (59.4%) |
| Total (Overall) | 760 (52.1%) | 698 (47.9%) |
Natural Resources, Construction and Maintenance Occupations
The most common Natural Resources, Construction and Maintenance occupations in Sandwich are Construction & Extraction (69 | 4.7%), and Installation, Maintenance & Repair (33 | 2.3%).
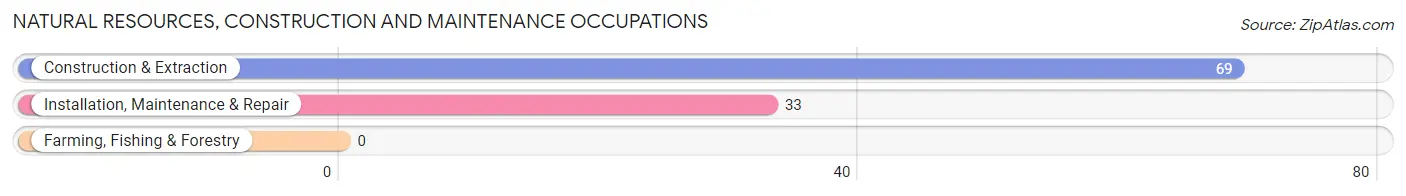
Natural Resources, Construction and Maintenance Occupations by Sex
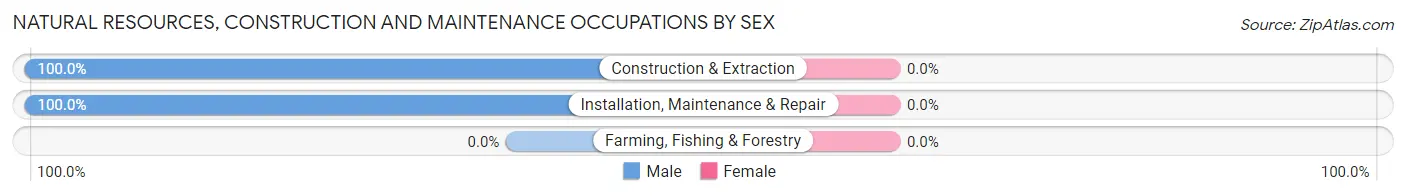
| Occupation | Male | Female |
| Farming, Fishing & Forestry | 0 (0.0%) | 0 (0.0%) |
| Construction & Extraction | 69 (100.0%) | 0 (0.0%) |
| Installation, Maintenance & Repair | 33 (100.0%) | 0 (0.0%) |
| Total (Category) | 102 (100.0%) | 0 (0.0%) |
| Total (Overall) | 760 (52.1%) | 698 (47.9%) |
Production, Transportation and Moving Occupations
The most common Production, Transportation and Moving occupations in Sandwich are Transportation (74 | 5.1%), and Production (45 | 3.1%).
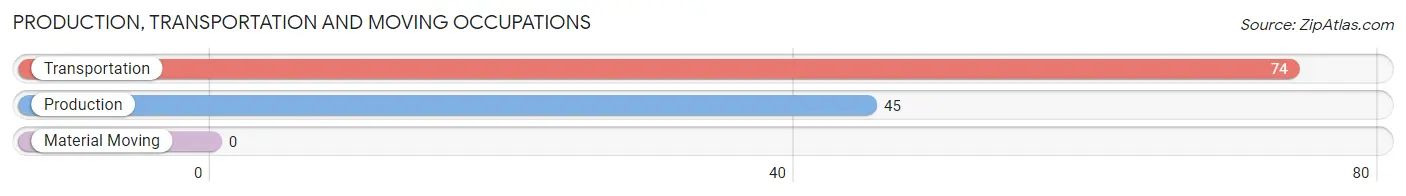
Production, Transportation and Moving Occupations by Sex
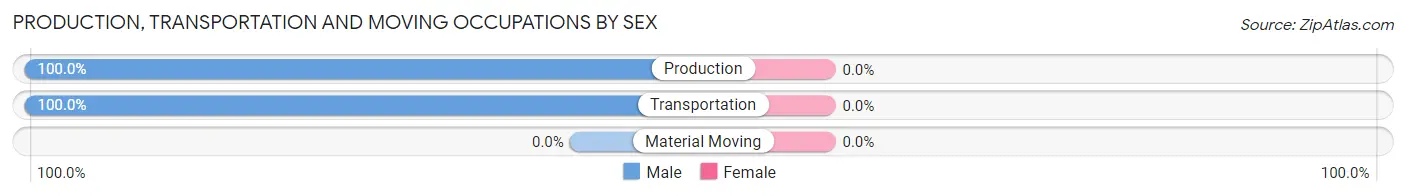
| Occupation | Male | Female |
| Production | 45 (100.0%) | 0 (0.0%) |
| Transportation | 74 (100.0%) | 0 (0.0%) |
| Material Moving | 0 (0.0%) | 0 (0.0%) |
| Total (Category) | 119 (100.0%) | 0 (0.0%) |
| Total (Overall) | 760 (52.1%) | 698 (47.9%) |
Employment Industries by Sex in Sandwich
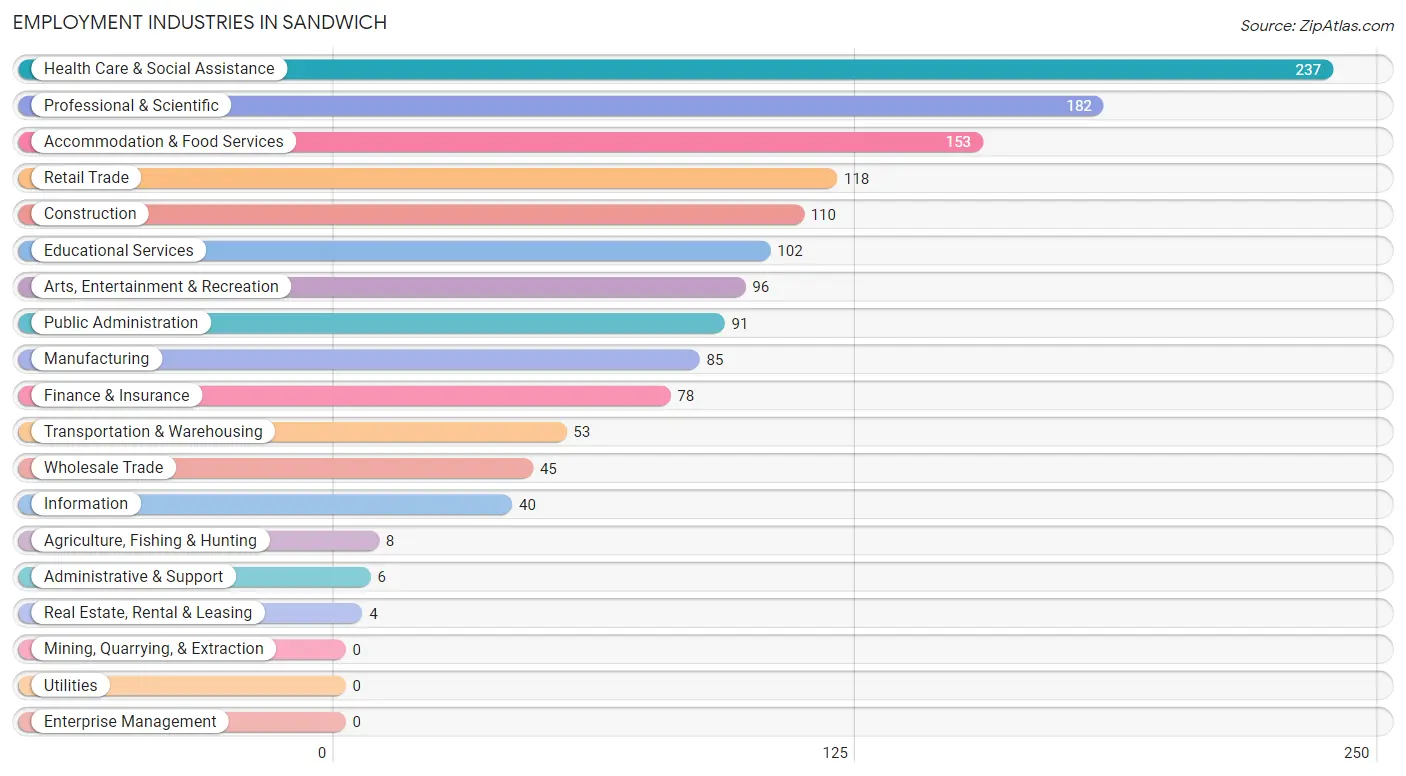
Employment Industries in Sandwich
The major employment industries in Sandwich include Health Care & Social Assistance (237 | 16.3%), Professional & Scientific (182 | 12.5%), Accommodation & Food Services (153 | 10.5%), Retail Trade (118 | 8.1%), and Construction (110 | 7.5%).
Employment Industries by Sex in Sandwich
The Sandwich industries that see more men than women are Manufacturing (100.0%), Wholesale Trade (100.0%), and Real Estate, Rental & Leasing (100.0%), whereas the industries that tend to have a higher number of women are Agriculture, Fishing & Hunting (100.0%), Finance & Insurance (100.0%), and Administrative & Support (100.0%).
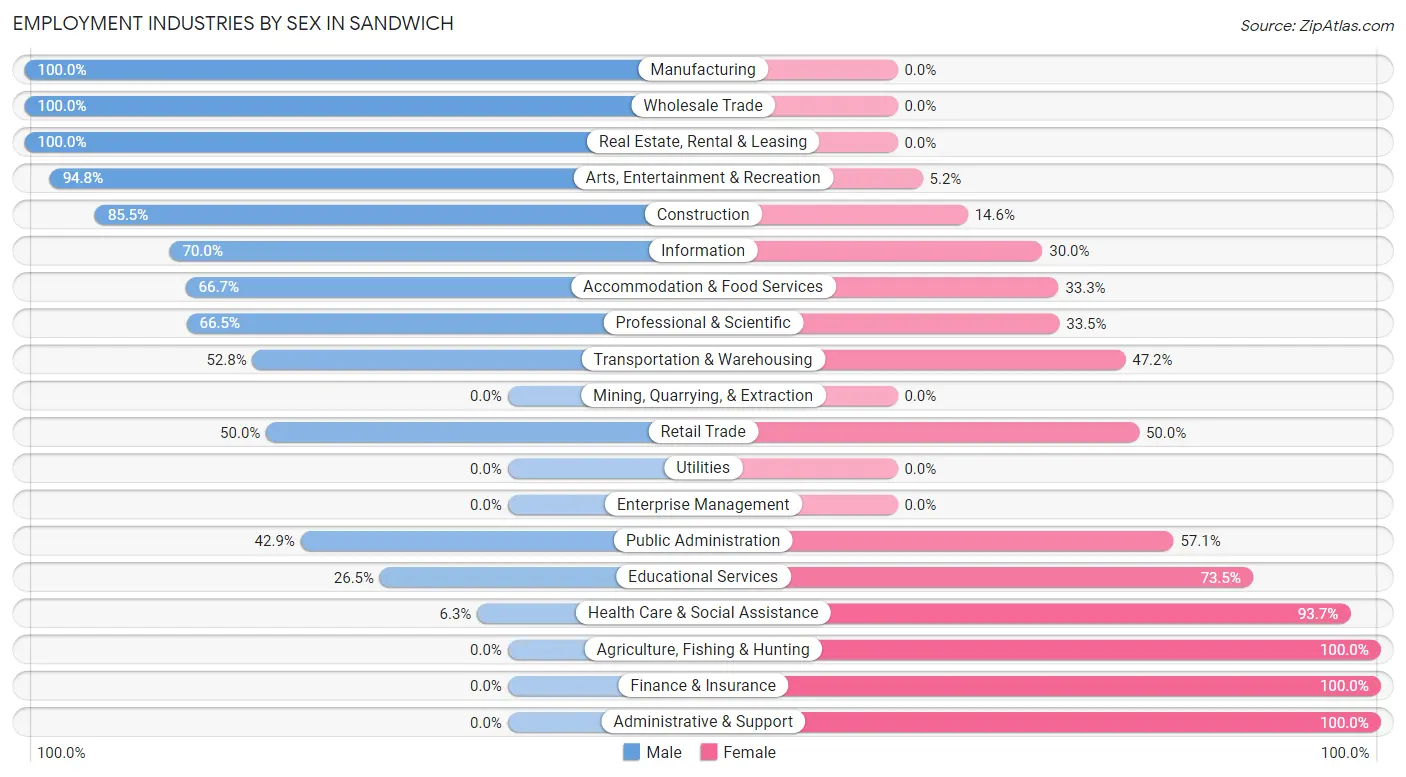
| Industry | Male | Female |
| Agriculture, Fishing & Hunting | 0 (0.0%) | 8 (100.0%) |
| Mining, Quarrying, & Extraction | 0 (0.0%) | 0 (0.0%) |
| Construction | 94 (85.5%) | 16 (14.5%) |
| Manufacturing | 85 (100.0%) | 0 (0.0%) |
| Wholesale Trade | 45 (100.0%) | 0 (0.0%) |
| Retail Trade | 59 (50.0%) | 59 (50.0%) |
| Transportation & Warehousing | 28 (52.8%) | 25 (47.2%) |
| Utilities | 0 (0.0%) | 0 (0.0%) |
| Information | 28 (70.0%) | 12 (30.0%) |
| Finance & Insurance | 0 (0.0%) | 78 (100.0%) |
| Real Estate, Rental & Leasing | 4 (100.0%) | 0 (0.0%) |
| Professional & Scientific | 121 (66.5%) | 61 (33.5%) |
| Enterprise Management | 0 (0.0%) | 0 (0.0%) |
| Administrative & Support | 0 (0.0%) | 6 (100.0%) |
| Educational Services | 27 (26.5%) | 75 (73.5%) |
| Health Care & Social Assistance | 15 (6.3%) | 222 (93.7%) |
| Arts, Entertainment & Recreation | 91 (94.8%) | 5 (5.2%) |
| Accommodation & Food Services | 102 (66.7%) | 51 (33.3%) |
| Public Administration | 39 (42.9%) | 52 (57.1%) |
| Total | 760 (52.1%) | 698 (47.9%) |
Education in Sandwich
School Enrollment in Sandwich
The most common levels of schooling among the 468 students in Sandwich are high school (184 | 39.3%), middle school (120 | 25.6%), and college / undergraduate (54 | 11.5%).
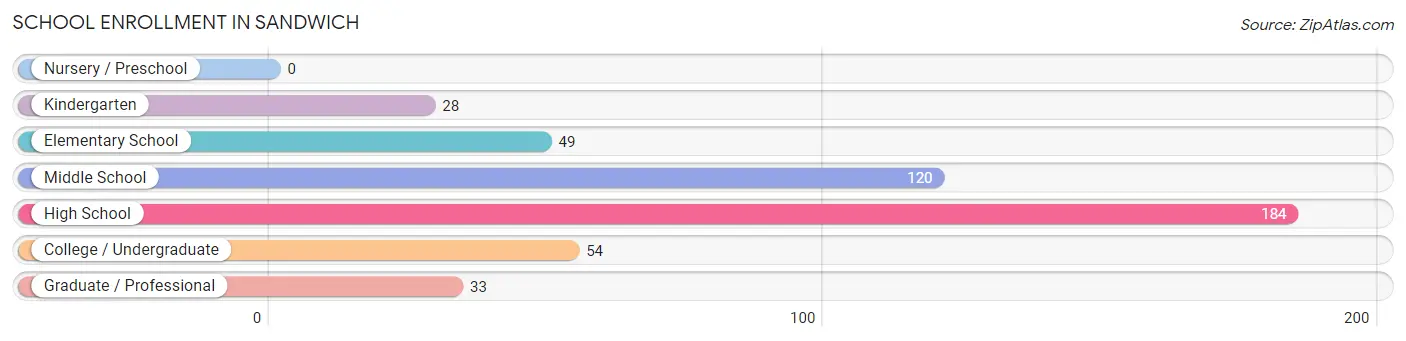
| School Level | # Students | % Students |
| Nursery / Preschool | 0 | 0.0% |
| Kindergarten | 28 | 6.0% |
| Elementary School | 49 | 10.5% |
| Middle School | 120 | 25.6% |
| High School | 184 | 39.3% |
| College / Undergraduate | 54 | 11.5% |
| Graduate / Professional | 33 | 7.0% |
| Total | 468 | 100.0% |
School Enrollment by Age by Funding Source in Sandwich
Out of a total of 468 students who are enrolled in schools in Sandwich, 105 (22.4%) attend a private institution, while the remaining 363 (77.6%) are enrolled in public schools. The age group of 20 to 24 year olds has the highest likelihood of being enrolled in private schools, with 12 (100.0% in the age bracket) enrolled. Conversely, the age group of 5 to 9 year old has the lowest likelihood of being enrolled in a private school, with 77 (100.0% in the age bracket) attending a public institution.
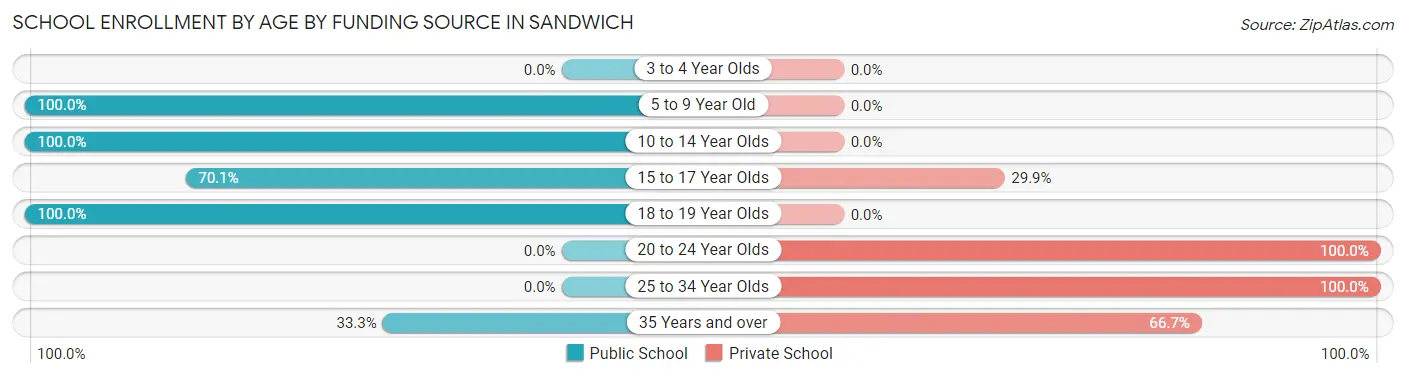
| Age Bracket | Public School | Private School |
| 3 to 4 Year Olds | 0 (0.0%) | 0 (0.0%) |
| 5 to 9 Year Old | 77 (100.0%) | 0 (0.0%) |
| 10 to 14 Year Olds | 125 (100.0%) | 0 (0.0%) |
| 15 to 17 Year Olds | 103 (70.1%) | 44 (29.9%) |
| 18 to 19 Year Olds | 50 (100.0%) | 0 (0.0%) |
| 20 to 24 Year Olds | 0 (0.0%) | 12 (100.0%) |
| 25 to 34 Year Olds | 0 (0.0%) | 33 (100.0%) |
| 35 Years and over | 8 (33.3%) | 16 (66.7%) |
| Total | 363 (77.6%) | 105 (22.4%) |
Educational Attainment by Field of Study in Sandwich
Business (196 | 14.0%), arts & humanities (174 | 12.5%), education (169 | 12.1%), social sciences (148 | 10.6%), and engineering (122 | 8.7%) are the most common fields of study among 1,397 individuals in Sandwich who have obtained a bachelor's degree or higher.
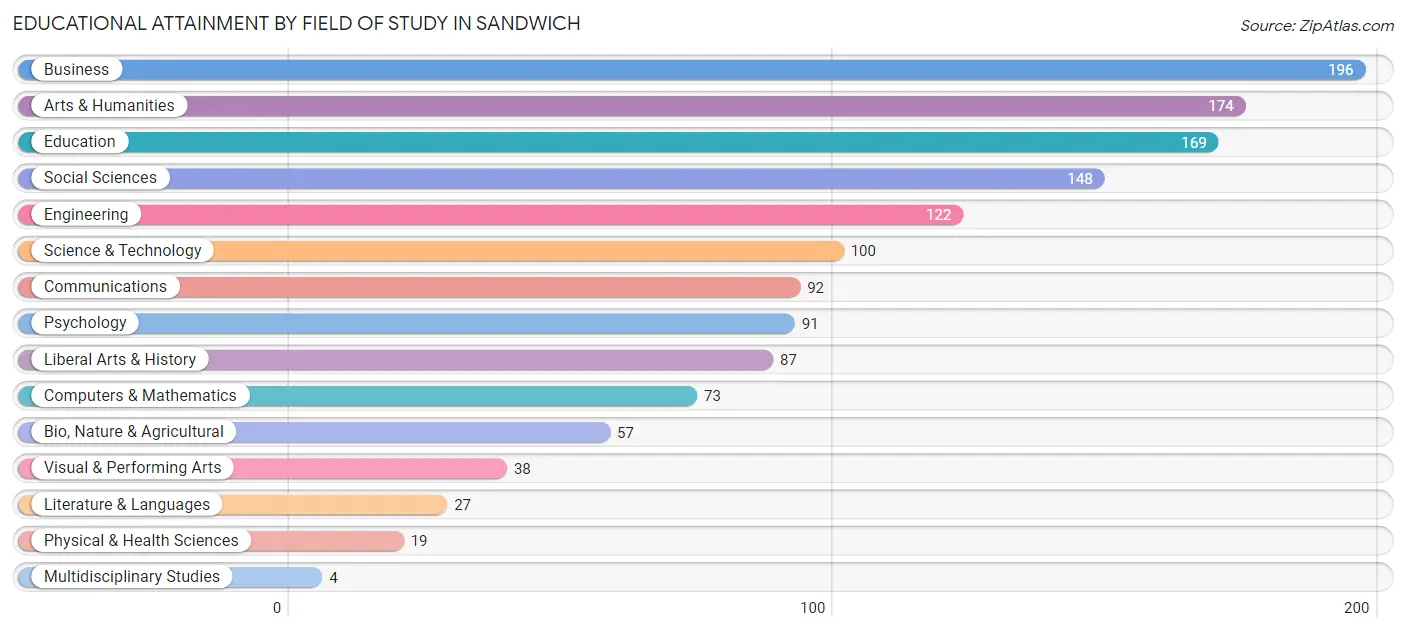
| Field of Study | # Graduates | % Graduates |
| Computers & Mathematics | 73 | 5.2% |
| Bio, Nature & Agricultural | 57 | 4.1% |
| Physical & Health Sciences | 19 | 1.4% |
| Psychology | 91 | 6.5% |
| Social Sciences | 148 | 10.6% |
| Engineering | 122 | 8.7% |
| Multidisciplinary Studies | 4 | 0.3% |
| Science & Technology | 100 | 7.2% |
| Business | 196 | 14.0% |
| Education | 169 | 12.1% |
| Literature & Languages | 27 | 1.9% |
| Liberal Arts & History | 87 | 6.2% |
| Visual & Performing Arts | 38 | 2.7% |
| Communications | 92 | 6.6% |
| Arts & Humanities | 174 | 12.5% |
| Total | 1,397 | 100.0% |
Transportation & Commute in Sandwich
Vehicle Availability by Sex in Sandwich
The most prevalent vehicle ownership categories in Sandwich are males with 3 vehicles (327, accounting for 43.1%) and females with 3 vehicles (231, making up 46.9%).
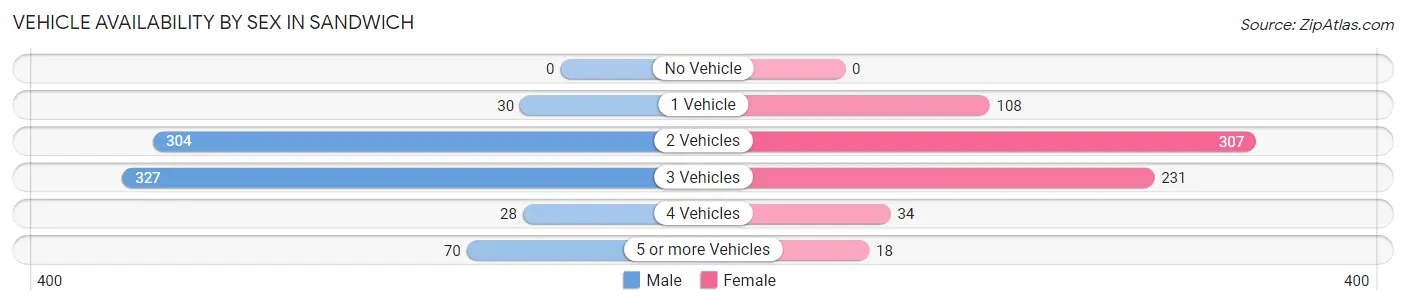
| Vehicles Available | Male | Female |
| No Vehicle | 0 (0.0%) | 0 (0.0%) |
| 1 Vehicle | 30 (4.0%) | 108 (15.5%) |
| 2 Vehicles | 304 (40.1%) | 307 (44.0%) |
| 3 Vehicles | 327 (43.1%) | 231 (33.1%) |
| 4 Vehicles | 28 (3.7%) | 34 (4.9%) |
| 5 or more Vehicles | 70 (9.2%) | 18 (2.6%) |
| Total | 759 (100.0%) | 698 (100.0%) |
Commute Time in Sandwich
The most frequently occuring commute durations in Sandwich are 5 to 9 minutes (312 commuters, 26.8%), 20 to 24 minutes (208 commuters, 17.9%), and 30 to 34 minutes (139 commuters, 11.9%).
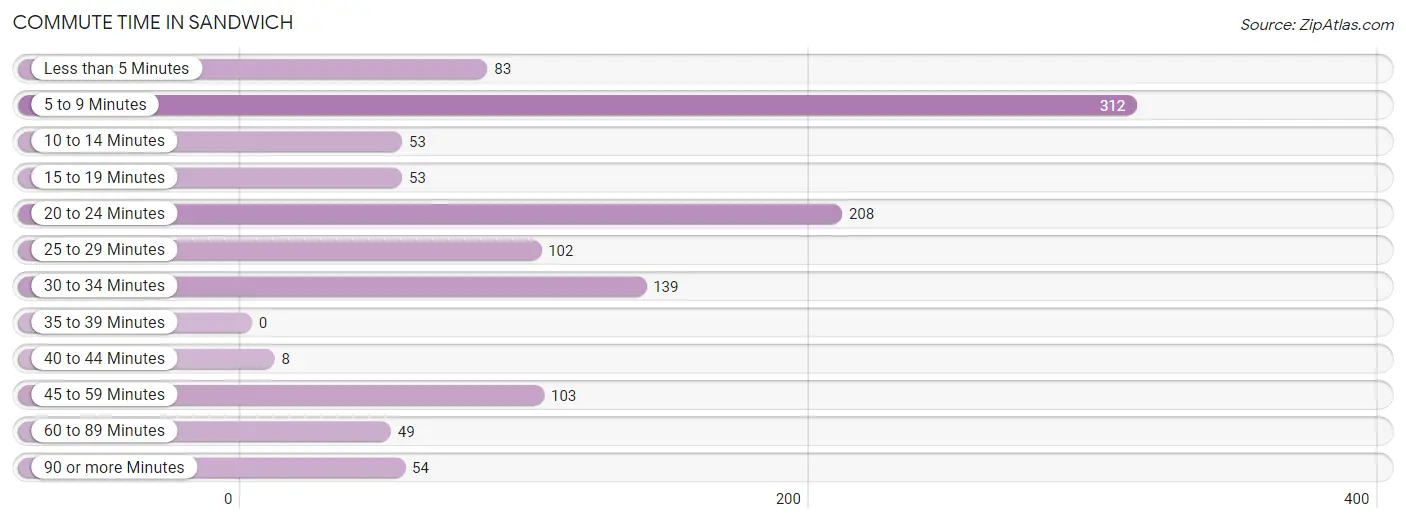
| Commute Time | # Commuters | % Commuters |
| Less than 5 Minutes | 83 | 7.1% |
| 5 to 9 Minutes | 312 | 26.8% |
| 10 to 14 Minutes | 53 | 4.5% |
| 15 to 19 Minutes | 53 | 4.5% |
| 20 to 24 Minutes | 208 | 17.9% |
| 25 to 29 Minutes | 102 | 8.8% |
| 30 to 34 Minutes | 139 | 11.9% |
| 35 to 39 Minutes | 0 | 0.0% |
| 40 to 44 Minutes | 8 | 0.7% |
| 45 to 59 Minutes | 103 | 8.8% |
| 60 to 89 Minutes | 49 | 4.2% |
| 90 or more Minutes | 54 | 4.6% |
Commute Time by Sex in Sandwich
The most common commute times in Sandwich are 5 to 9 minutes (150 commuters, 25.5%) for males and 5 to 9 minutes (162 commuters, 28.1%) for females.
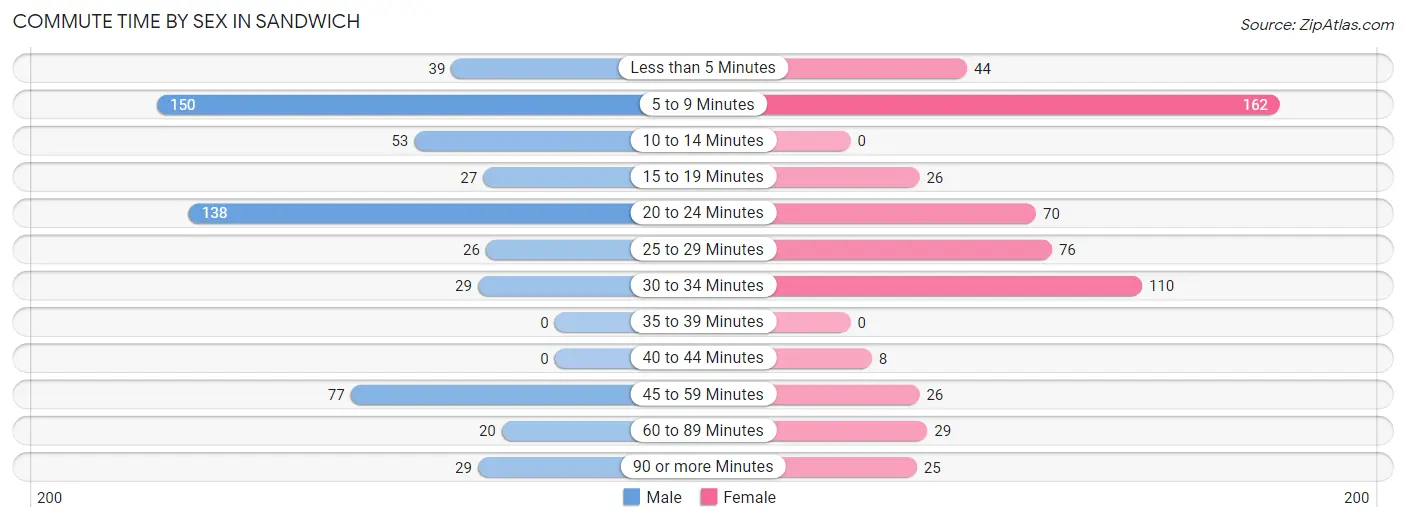
| Commute Time | Male | Female |
| Less than 5 Minutes | 39 (6.6%) | 44 (7.6%) |
| 5 to 9 Minutes | 150 (25.5%) | 162 (28.1%) |
| 10 to 14 Minutes | 53 (9.0%) | 0 (0.0%) |
| 15 to 19 Minutes | 27 (4.6%) | 26 (4.5%) |
| 20 to 24 Minutes | 138 (23.5%) | 70 (12.1%) |
| 25 to 29 Minutes | 26 (4.4%) | 76 (13.2%) |
| 30 to 34 Minutes | 29 (4.9%) | 110 (19.1%) |
| 35 to 39 Minutes | 0 (0.0%) | 0 (0.0%) |
| 40 to 44 Minutes | 0 (0.0%) | 8 (1.4%) |
| 45 to 59 Minutes | 77 (13.1%) | 26 (4.5%) |
| 60 to 89 Minutes | 20 (3.4%) | 29 (5.0%) |
| 90 or more Minutes | 29 (4.9%) | 25 (4.3%) |
Time of Departure to Work by Sex in Sandwich
The most frequent times of departure to work in Sandwich are 8:00 AM to 8:29 AM (172, 29.2%) for males and 7:30 AM to 7:59 AM (107, 18.6%) for females.
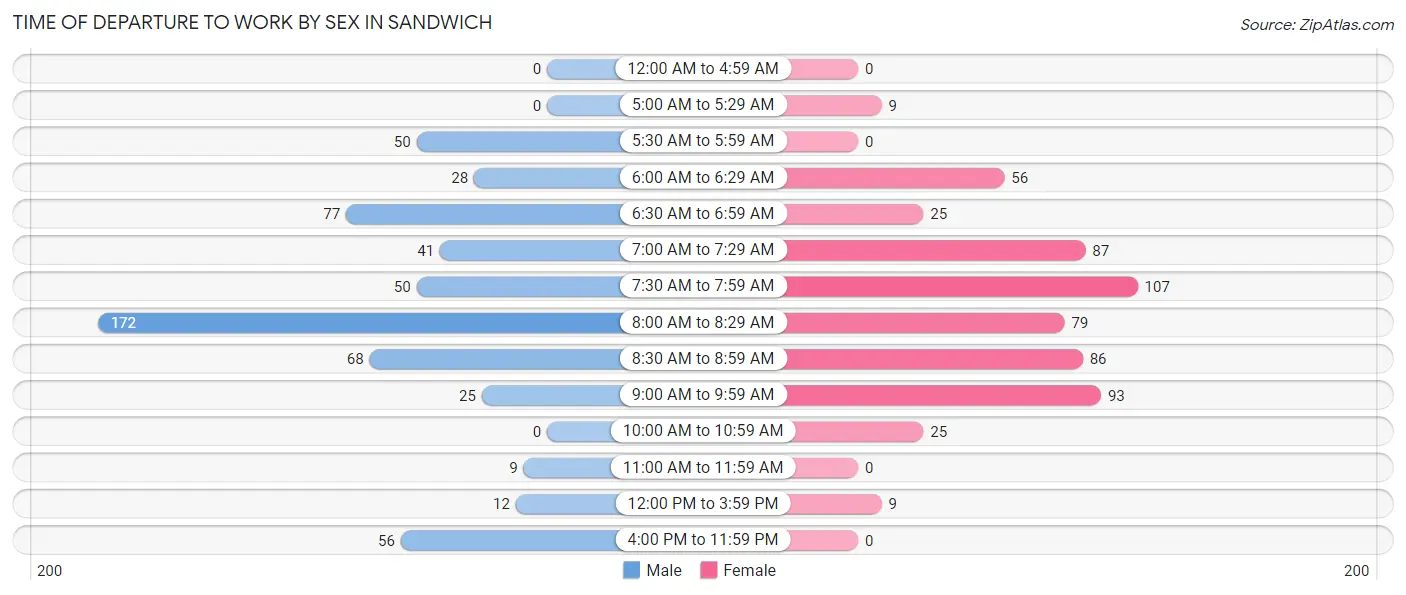
| Time of Departure | Male | Female |
| 12:00 AM to 4:59 AM | 0 (0.0%) | 0 (0.0%) |
| 5:00 AM to 5:29 AM | 0 (0.0%) | 9 (1.6%) |
| 5:30 AM to 5:59 AM | 50 (8.5%) | 0 (0.0%) |
| 6:00 AM to 6:29 AM | 28 (4.8%) | 56 (9.7%) |
| 6:30 AM to 6:59 AM | 77 (13.1%) | 25 (4.3%) |
| 7:00 AM to 7:29 AM | 41 (7.0%) | 87 (15.1%) |
| 7:30 AM to 7:59 AM | 50 (8.5%) | 107 (18.6%) |
| 8:00 AM to 8:29 AM | 172 (29.2%) | 79 (13.7%) |
| 8:30 AM to 8:59 AM | 68 (11.6%) | 86 (14.9%) |
| 9:00 AM to 9:59 AM | 25 (4.3%) | 93 (16.2%) |
| 10:00 AM to 10:59 AM | 0 (0.0%) | 25 (4.3%) |
| 11:00 AM to 11:59 AM | 9 (1.5%) | 0 (0.0%) |
| 12:00 PM to 3:59 PM | 12 (2.0%) | 9 (1.6%) |
| 4:00 PM to 11:59 PM | 56 (9.5%) | 0 (0.0%) |
| Total | 588 (100.0%) | 576 (100.0%) |
Housing Occupancy in Sandwich
Occupancy by Ownership in Sandwich
Of the total 1,404 dwellings in Sandwich, owner-occupied units account for 1,056 (75.2%), while renter-occupied units make up 348 (24.8%).
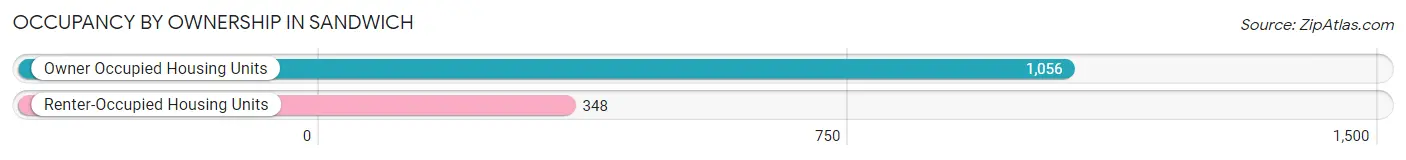
| Occupancy | # Housing Units | % Housing Units |
| Owner Occupied Housing Units | 1,056 | 75.2% |
| Renter-Occupied Housing Units | 348 | 24.8% |
| Total Occupied Housing Units | 1,404 | 100.0% |
Occupancy by Household Size in Sandwich
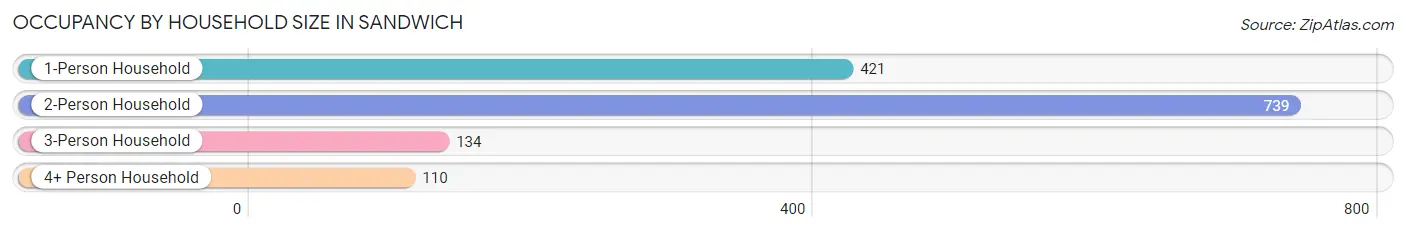
| Household Size | # Housing Units | % Housing Units |
| 1-Person Household | 421 | 30.0% |
| 2-Person Household | 739 | 52.6% |
| 3-Person Household | 134 | 9.5% |
| 4+ Person Household | 110 | 7.8% |
| Total Housing Units | 1,404 | 100.0% |
Occupancy by Ownership by Household Size in Sandwich
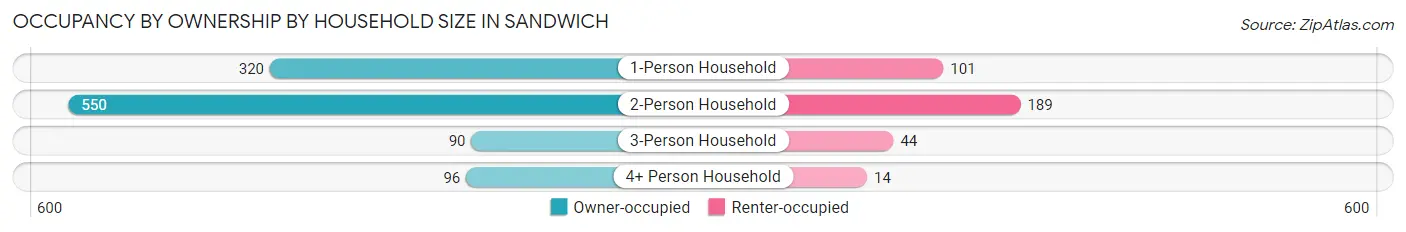
| Household Size | Owner-occupied | Renter-occupied |
| 1-Person Household | 320 (76.0%) | 101 (24.0%) |
| 2-Person Household | 550 (74.4%) | 189 (25.6%) |
| 3-Person Household | 90 (67.2%) | 44 (32.8%) |
| 4+ Person Household | 96 (87.3%) | 14 (12.7%) |
| Total Housing Units | 1,056 (75.2%) | 348 (24.8%) |
Occupancy by Educational Attainment in Sandwich
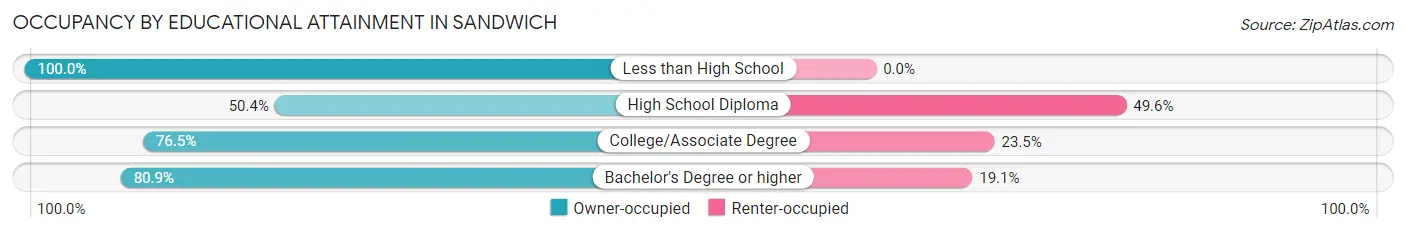
| Household Size | Owner-occupied | Renter-occupied |
| Less than High School | 27 (100.0%) | 0 (0.0%) |
| High School Diploma | 122 (50.4%) | 120 (49.6%) |
| College/Associate Degree | 202 (76.5%) | 62 (23.5%) |
| Bachelor's Degree or higher | 705 (80.9%) | 166 (19.1%) |
Occupancy by Age of Householder in Sandwich
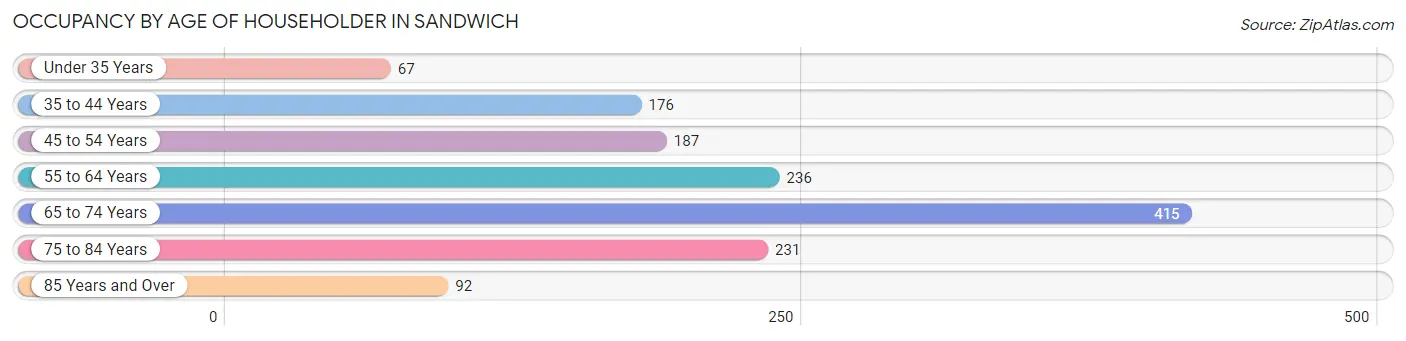
| Age Bracket | # Households | % Households |
| Under 35 Years | 67 | 4.8% |
| 35 to 44 Years | 176 | 12.5% |
| 45 to 54 Years | 187 | 13.3% |
| 55 to 64 Years | 236 | 16.8% |
| 65 to 74 Years | 415 | 29.6% |
| 75 to 84 Years | 231 | 16.5% |
| 85 Years and Over | 92 | 6.6% |
| Total | 1,404 | 100.0% |
Housing Finances in Sandwich
Median Income by Occupancy in Sandwich
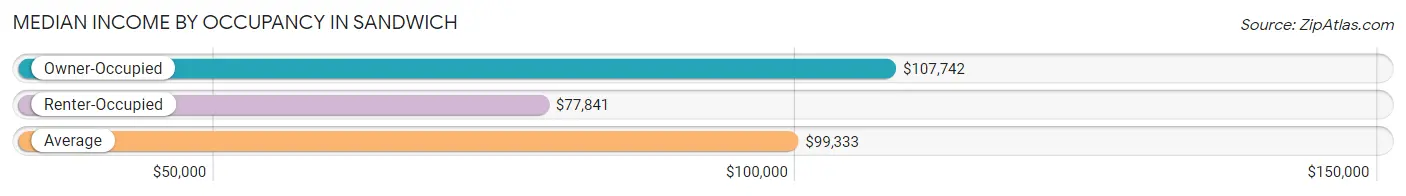
| Occupancy Type | # Households | Median Income |
| Owner-Occupied | 1,056 (75.2%) | $107,742 |
| Renter-Occupied | 348 (24.8%) | $77,841 |
| Average | 1,404 (100.0%) | $99,333 |
Occupancy by Householder Income Bracket in Sandwich
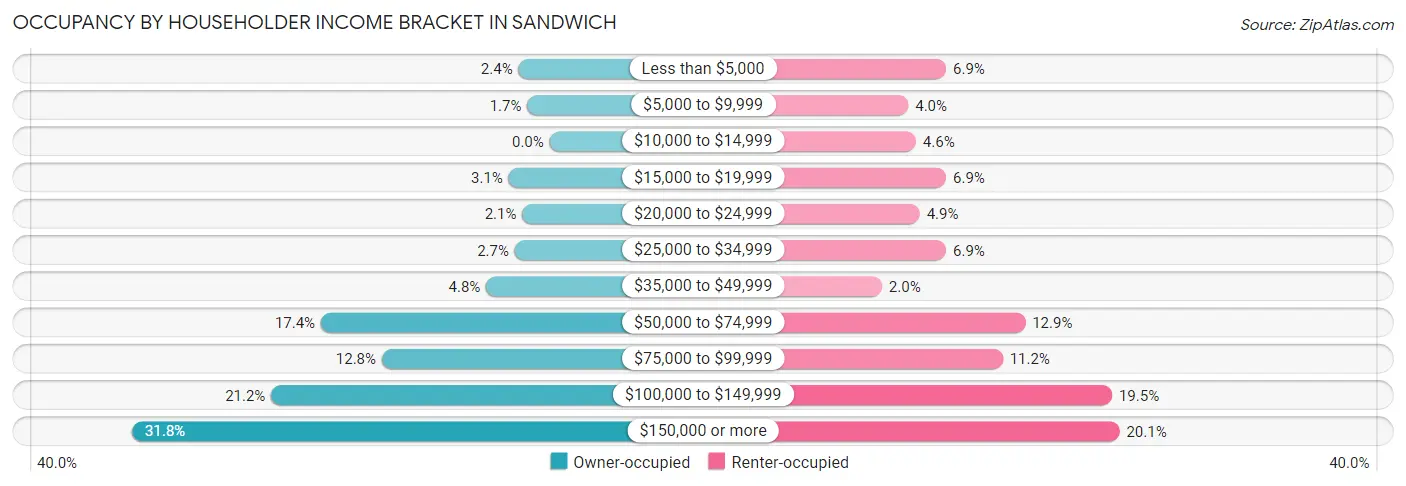
| Income Bracket | Owner-occupied | Renter-occupied |
| Less than $5,000 | 25 (2.4%) | 24 (6.9%) |
| $5,000 to $9,999 | 18 (1.7%) | 14 (4.0%) |
| $10,000 to $14,999 | 0 (0.0%) | 16 (4.6%) |
| $15,000 to $19,999 | 33 (3.1%) | 24 (6.9%) |
| $20,000 to $24,999 | 22 (2.1%) | 17 (4.9%) |
| $25,000 to $34,999 | 28 (2.6%) | 24 (6.9%) |
| $35,000 to $49,999 | 51 (4.8%) | 7 (2.0%) |
| $50,000 to $74,999 | 184 (17.4%) | 45 (12.9%) |
| $75,000 to $99,999 | 135 (12.8%) | 39 (11.2%) |
| $100,000 to $149,999 | 224 (21.2%) | 68 (19.5%) |
| $150,000 or more | 336 (31.8%) | 70 (20.1%) |
| Total | 1,056 (100.0%) | 348 (100.0%) |
Monthly Housing Cost Tiers in Sandwich
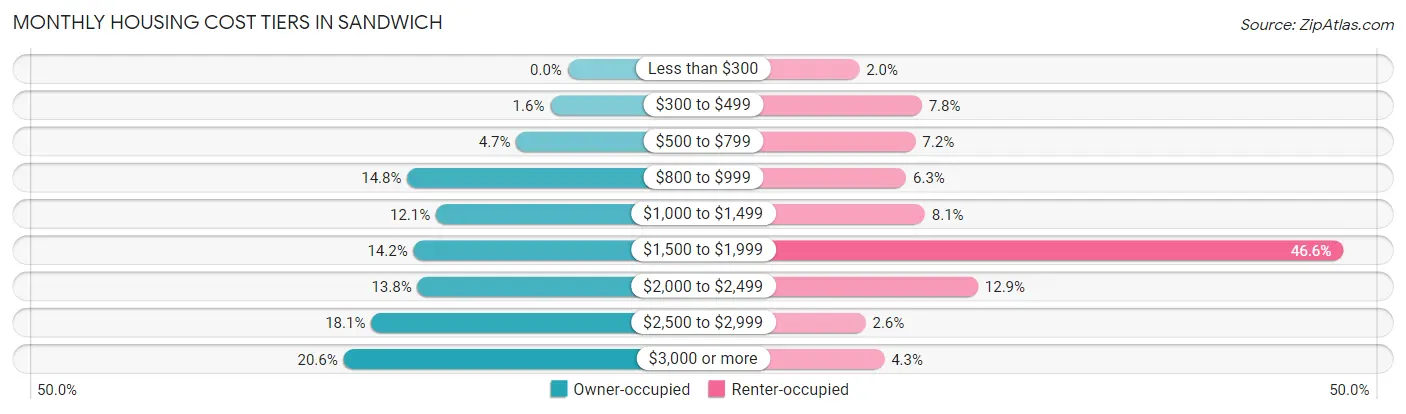
| Monthly Cost | Owner-occupied | Renter-occupied |
| Less than $300 | 0 (0.0%) | 7 (2.0%) |
| $300 to $499 | 17 (1.6%) | 27 (7.8%) |
| $500 to $799 | 50 (4.7%) | 25 (7.2%) |
| $800 to $999 | 156 (14.8%) | 22 (6.3%) |
| $1,000 to $1,499 | 128 (12.1%) | 28 (8.1%) |
| $1,500 to $1,999 | 150 (14.2%) | 162 (46.6%) |
| $2,000 to $2,499 | 146 (13.8%) | 45 (12.9%) |
| $2,500 to $2,999 | 191 (18.1%) | 9 (2.6%) |
| $3,000 or more | 218 (20.6%) | 15 (4.3%) |
| Total | 1,056 (100.0%) | 348 (100.0%) |
Physical Housing Characteristics in Sandwich
Housing Structures in Sandwich
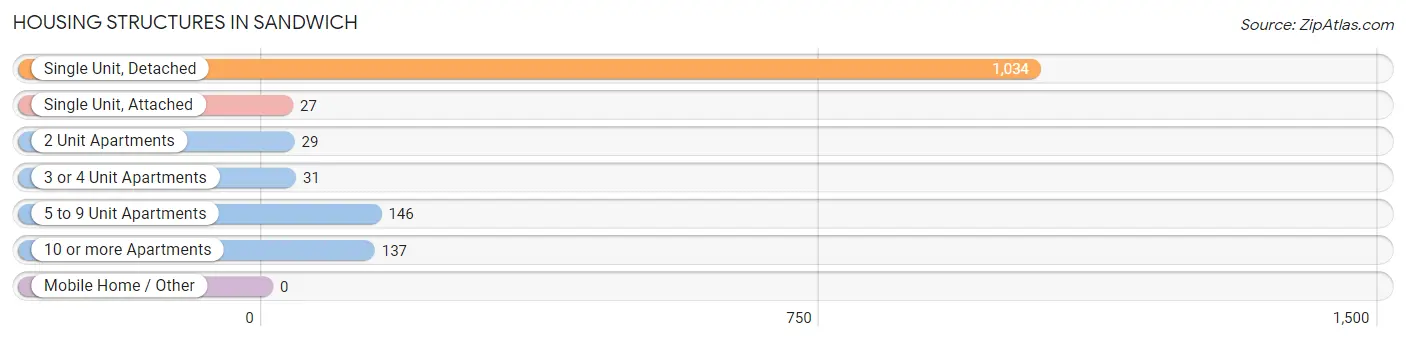
| Structure Type | # Housing Units | % Housing Units |
| Single Unit, Detached | 1,034 | 73.7% |
| Single Unit, Attached | 27 | 1.9% |
| 2 Unit Apartments | 29 | 2.1% |
| 3 or 4 Unit Apartments | 31 | 2.2% |
| 5 to 9 Unit Apartments | 146 | 10.4% |
| 10 or more Apartments | 137 | 9.8% |
| Mobile Home / Other | 0 | 0.0% |
| Total | 1,404 | 100.0% |
Housing Structures by Occupancy in Sandwich
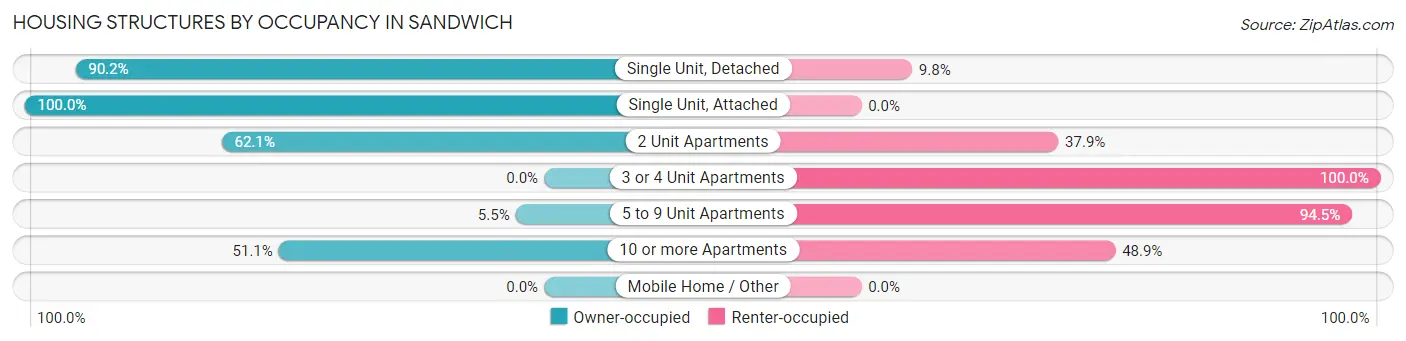
| Structure Type | Owner-occupied | Renter-occupied |
| Single Unit, Detached | 933 (90.2%) | 101 (9.8%) |
| Single Unit, Attached | 27 (100.0%) | 0 (0.0%) |
| 2 Unit Apartments | 18 (62.1%) | 11 (37.9%) |
| 3 or 4 Unit Apartments | 0 (0.0%) | 31 (100.0%) |
| 5 to 9 Unit Apartments | 8 (5.5%) | 138 (94.5%) |
| 10 or more Apartments | 70 (51.1%) | 67 (48.9%) |
| Mobile Home / Other | 0 (0.0%) | 0 (0.0%) |
| Total | 1,056 (75.2%) | 348 (24.8%) |
Housing Structures by Number of Rooms in Sandwich
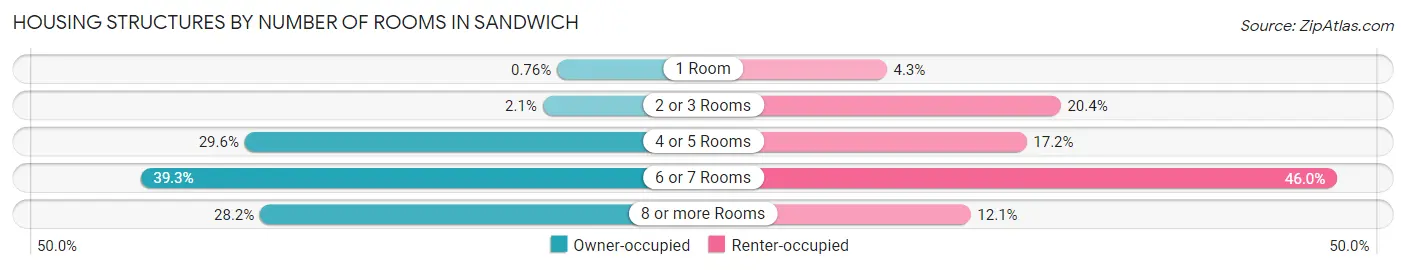
| Number of Rooms | Owner-occupied | Renter-occupied |
| 1 Room | 8 (0.8%) | 15 (4.3%) |
| 2 or 3 Rooms | 22 (2.1%) | 71 (20.4%) |
| 4 or 5 Rooms | 313 (29.6%) | 60 (17.2%) |
| 6 or 7 Rooms | 415 (39.3%) | 160 (46.0%) |
| 8 or more Rooms | 298 (28.2%) | 42 (12.1%) |
| Total | 1,056 (100.0%) | 348 (100.0%) |
Housing Structure by Heating Type in Sandwich
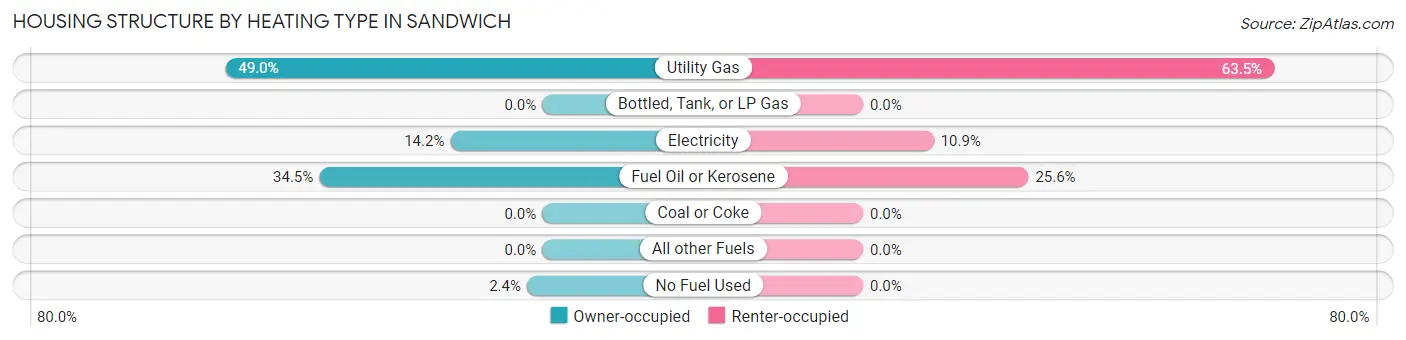
| Heating Type | Owner-occupied | Renter-occupied |
| Utility Gas | 517 (49.0%) | 221 (63.5%) |
| Bottled, Tank, or LP Gas | 0 (0.0%) | 0 (0.0%) |
| Electricity | 150 (14.2%) | 38 (10.9%) |
| Fuel Oil or Kerosene | 364 (34.5%) | 89 (25.6%) |
| Coal or Coke | 0 (0.0%) | 0 (0.0%) |
| All other Fuels | 0 (0.0%) | 0 (0.0%) |
| No Fuel Used | 25 (2.4%) | 0 (0.0%) |
| Total | 1,056 (100.0%) | 348 (100.0%) |
Household Vehicle Usage in Sandwich
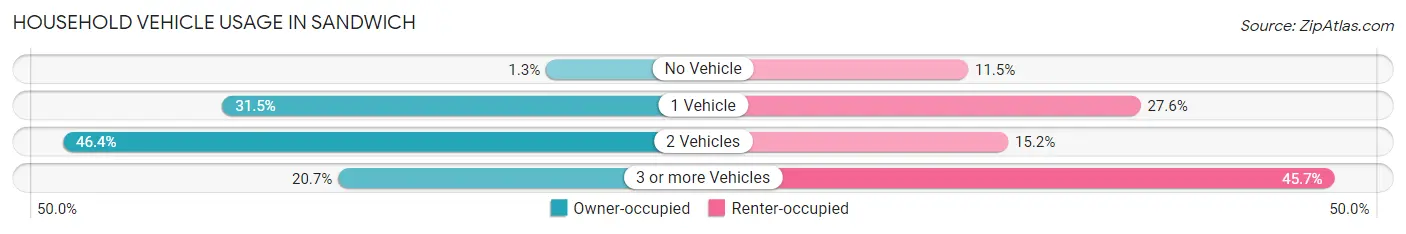
| Vehicles per Household | Owner-occupied | Renter-occupied |
| No Vehicle | 14 (1.3%) | 40 (11.5%) |
| 1 Vehicle | 333 (31.5%) | 96 (27.6%) |
| 2 Vehicles | 490 (46.4%) | 53 (15.2%) |
| 3 or more Vehicles | 219 (20.7%) | 159 (45.7%) |
| Total | 1,056 (100.0%) | 348 (100.0%) |
Real Estate & Mortgages in Sandwich
Real Estate and Mortgage Overview in Sandwich
| Characteristic | Without Mortgage | With Mortgage |
| Housing Units | 331 | 725 |
| Median Property Value | $452,900 | $511,300 |
| Median Household Income | $87,330 | $278 |
| Monthly Housing Costs | $895 | $218 |
| Real Estate Taxes | $6,540 | $0 |
Property Value by Mortgage Status in Sandwich
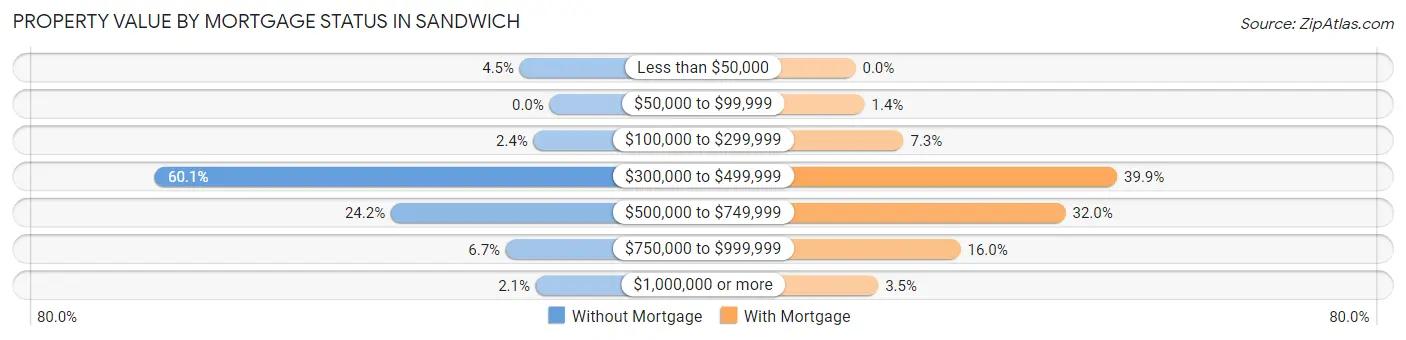
| Property Value | Without Mortgage | With Mortgage |
| Less than $50,000 | 15 (4.5%) | 0 (0.0%) |
| $50,000 to $99,999 | 0 (0.0%) | 10 (1.4%) |
| $100,000 to $299,999 | 8 (2.4%) | 53 (7.3%) |
| $300,000 to $499,999 | 199 (60.1%) | 289 (39.9%) |
| $500,000 to $749,999 | 80 (24.2%) | 232 (32.0%) |
| $750,000 to $999,999 | 22 (6.7%) | 116 (16.0%) |
| $1,000,000 or more | 7 (2.1%) | 25 (3.5%) |
| Total | 331 (100.0%) | 725 (100.0%) |
Household Income by Mortgage Status in Sandwich
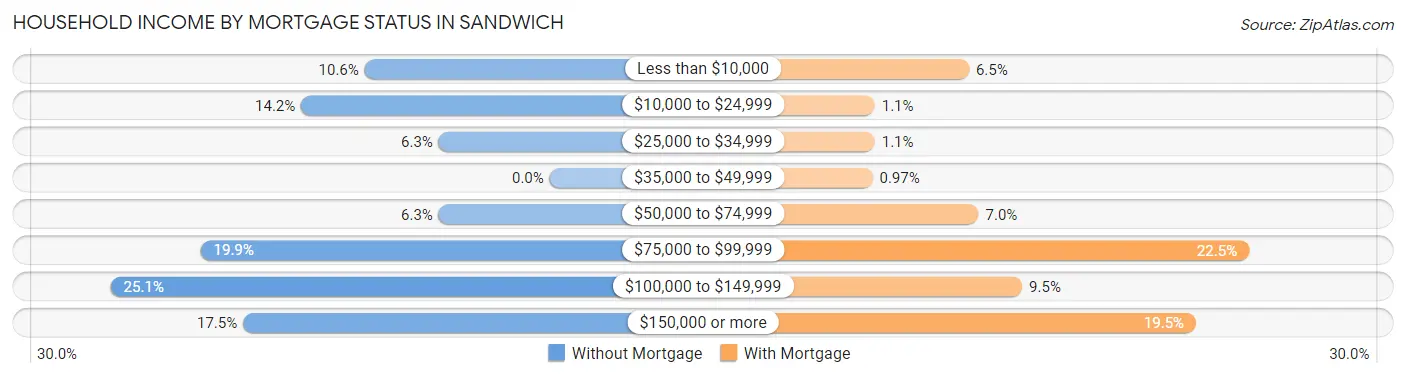
| Household Income | Without Mortgage | With Mortgage |
| Less than $10,000 | 35 (10.6%) | 47 (6.5%) |
| $10,000 to $24,999 | 47 (14.2%) | 8 (1.1%) |
| $25,000 to $34,999 | 21 (6.3%) | 8 (1.1%) |
| $35,000 to $49,999 | 0 (0.0%) | 7 (1.0%) |
| $50,000 to $74,999 | 21 (6.3%) | 51 (7.0%) |
| $75,000 to $99,999 | 66 (19.9%) | 163 (22.5%) |
| $100,000 to $149,999 | 83 (25.1%) | 69 (9.5%) |
| $150,000 or more | 58 (17.5%) | 141 (19.5%) |
| Total | 331 (100.0%) | 725 (100.0%) |
Property Value to Household Income Ratio in Sandwich
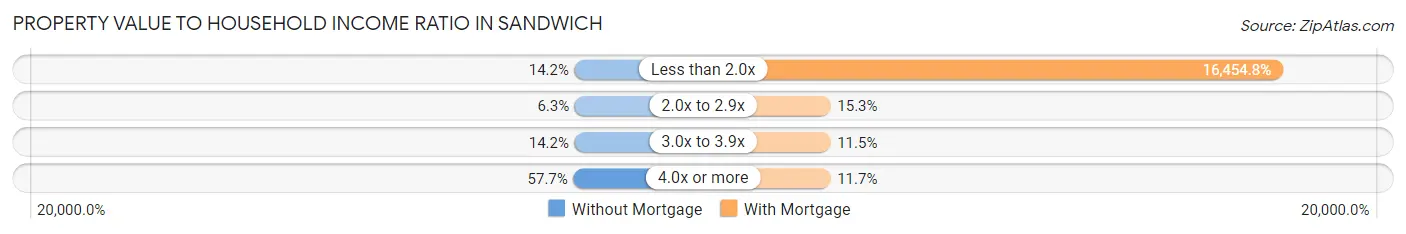
| Value-to-Income Ratio | Without Mortgage | With Mortgage |
| Less than 2.0x | 47 (14.2%) | 119,297 (16,454.8%) |
| 2.0x to 2.9x | 21 (6.3%) | 111 (15.3%) |
| 3.0x to 3.9x | 47 (14.2%) | 83 (11.5%) |
| 4.0x or more | 191 (57.7%) | 85 (11.7%) |
| Total | 331 (100.0%) | 725 (100.0%) |
Real Estate Taxes by Mortgage Status in Sandwich
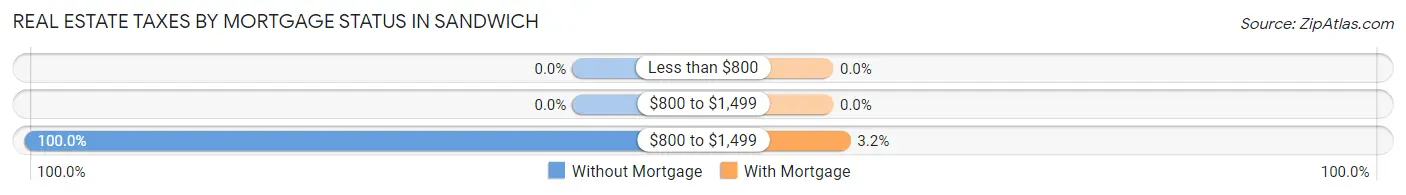
| Property Taxes | Without Mortgage | With Mortgage |
| Less than $800 | 0 (0.0%) | 0 (0.0%) |
| $800 to $1,499 | 0 (0.0%) | 0 (0.0%) |
| $800 to $1,499 | 331 (100.0%) | 23 (3.2%) |
| Total | 331 (100.0%) | 725 (100.0%) |
Health & Disability in Sandwich
Health Insurance Coverage by Age in Sandwich
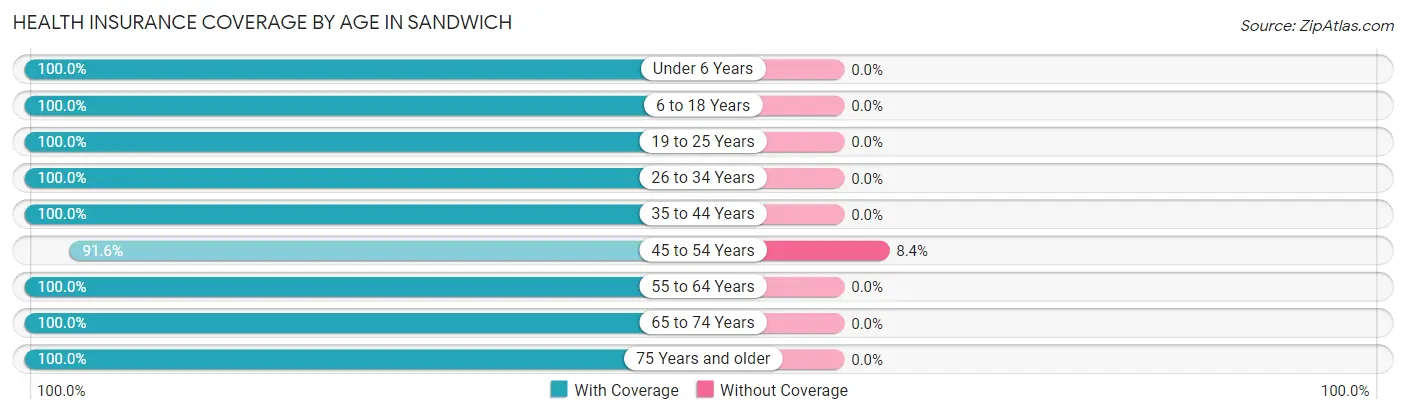
| Age Bracket | With Coverage | Without Coverage |
| Under 6 Years | 49 (100.0%) | 0 (0.0%) |
| 6 to 18 Years | 336 (100.0%) | 0 (0.0%) |
| 19 to 25 Years | 210 (100.0%) | 0 (0.0%) |
| 26 to 34 Years | 104 (100.0%) | 0 (0.0%) |
| 35 to 44 Years | 266 (100.0%) | 0 (0.0%) |
| 45 to 54 Years | 273 (91.6%) | 25 (8.4%) |
| 55 to 64 Years | 620 (100.0%) | 0 (0.0%) |
| 65 to 74 Years | 616 (100.0%) | 0 (0.0%) |
| 75 Years and older | 435 (100.0%) | 0 (0.0%) |
| Total | 2,909 (99.2%) | 25 (0.9%) |
Health Insurance Coverage by Citizenship Status in Sandwich
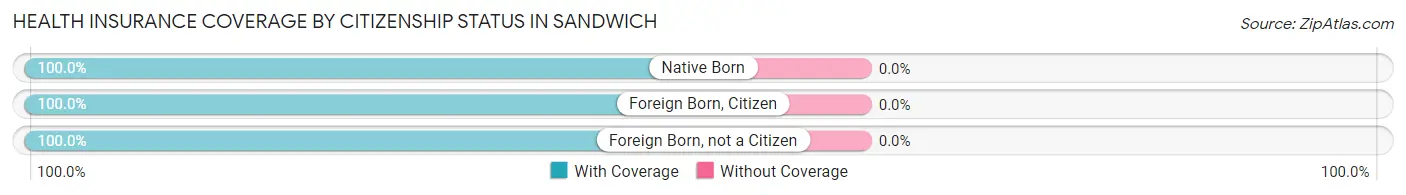
| Citizenship Status | With Coverage | Without Coverage |
| Native Born | 49 (100.0%) | 0 (0.0%) |
| Foreign Born, Citizen | 336 (100.0%) | 0 (0.0%) |
| Foreign Born, not a Citizen | 210 (100.0%) | 0 (0.0%) |
Health Insurance Coverage by Household Income in Sandwich
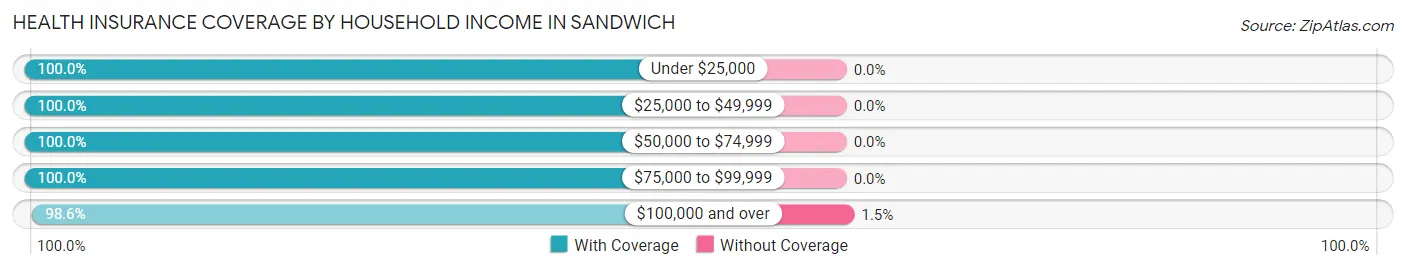
| Household Income | With Coverage | Without Coverage |
| Under $25,000 | 229 (100.0%) | 0 (0.0%) |
| $25,000 to $49,999 | 171 (100.0%) | 0 (0.0%) |
| $50,000 to $74,999 | 470 (100.0%) | 0 (0.0%) |
| $75,000 to $99,999 | 335 (100.0%) | 0 (0.0%) |
| $100,000 and over | 1,704 (98.6%) | 25 (1.5%) |
Public vs Private Health Insurance Coverage by Age in Sandwich
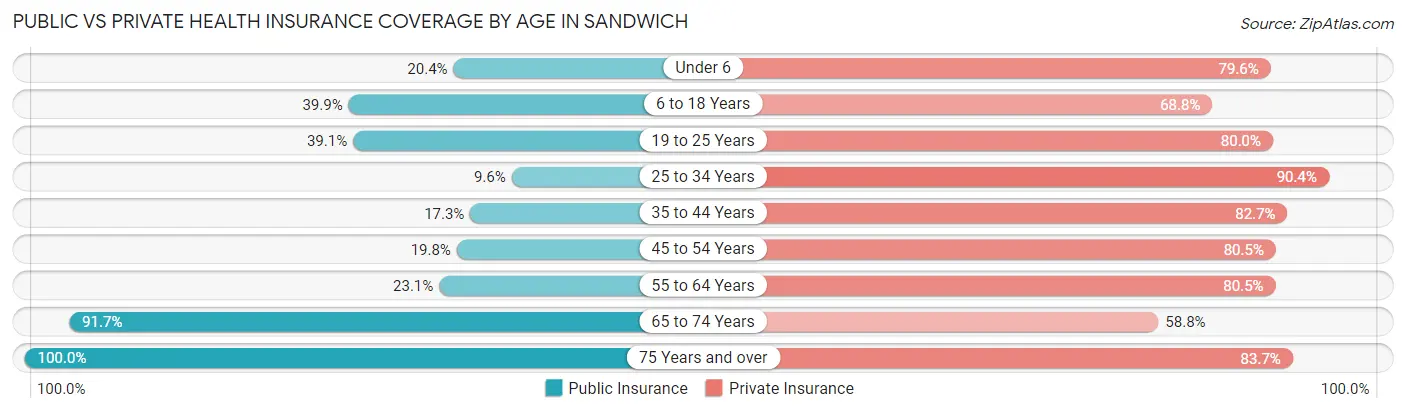
| Age Bracket | Public Insurance | Private Insurance |
| Under 6 | 10 (20.4%) | 39 (79.6%) |
| 6 to 18 Years | 134 (39.9%) | 231 (68.8%) |
| 19 to 25 Years | 82 (39.1%) | 168 (80.0%) |
| 25 to 34 Years | 10 (9.6%) | 94 (90.4%) |
| 35 to 44 Years | 46 (17.3%) | 220 (82.7%) |
| 45 to 54 Years | 59 (19.8%) | 240 (80.5%) |
| 55 to 64 Years | 143 (23.1%) | 499 (80.5%) |
| 65 to 74 Years | 565 (91.7%) | 362 (58.8%) |
| 75 Years and over | 435 (100.0%) | 364 (83.7%) |
| Total | 1,484 (50.6%) | 2,217 (75.6%) |
Disability Status by Sex by Age in Sandwich
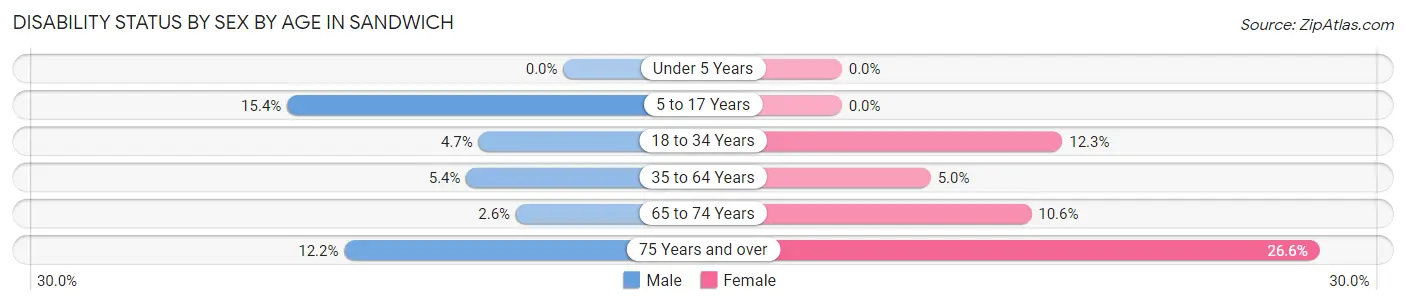
| Age Bracket | Male | Female |
| Under 5 Years | 0 (0.0%) | 0 (0.0%) |
| 5 to 17 Years | 24 (15.4%) | 0 (0.0%) |
| 18 to 34 Years | 10 (4.7%) | 14 (12.3%) |
| 35 to 64 Years | 29 (5.4%) | 32 (5.0%) |
| 65 to 74 Years | 9 (2.6%) | 29 (10.5%) |
| 75 Years and over | 15 (12.2%) | 83 (26.6%) |
Disability Class by Sex by Age in Sandwich
Disability Class: Hearing Difficulty
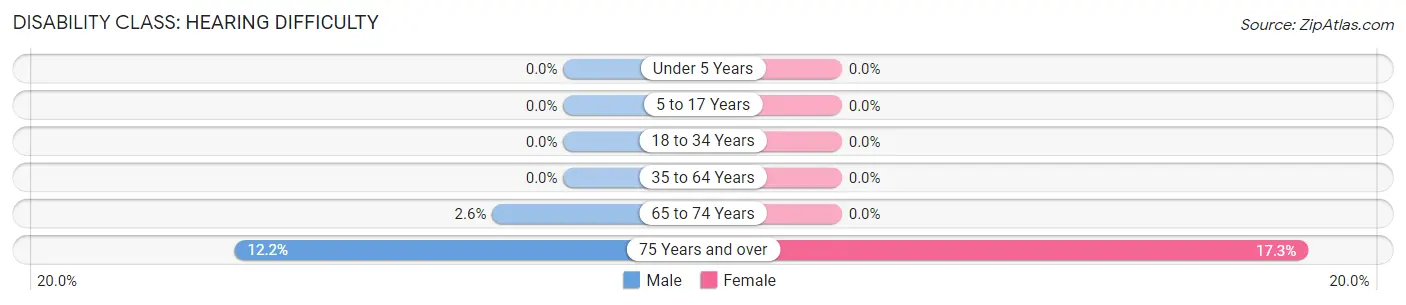
| Age Bracket | Male | Female |
| Under 5 Years | 0 (0.0%) | 0 (0.0%) |
| 5 to 17 Years | 0 (0.0%) | 0 (0.0%) |
| 18 to 34 Years | 0 (0.0%) | 0 (0.0%) |
| 35 to 64 Years | 0 (0.0%) | 0 (0.0%) |
| 65 to 74 Years | 9 (2.6%) | 0 (0.0%) |
| 75 Years and over | 15 (12.2%) | 54 (17.3%) |
Disability Class: Vision Difficulty
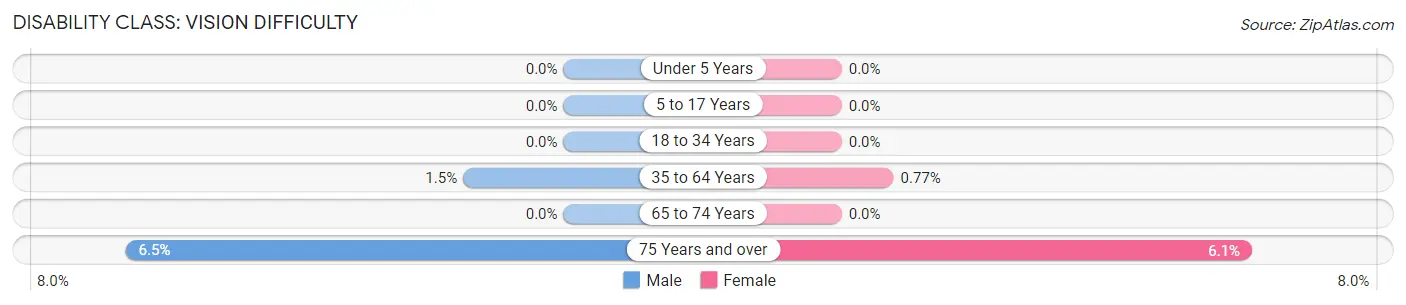
| Age Bracket | Male | Female |
| Under 5 Years | 0 (0.0%) | 0 (0.0%) |
| 5 to 17 Years | 0 (0.0%) | 0 (0.0%) |
| 18 to 34 Years | 0 (0.0%) | 0 (0.0%) |
| 35 to 64 Years | 8 (1.5%) | 5 (0.8%) |
| 65 to 74 Years | 0 (0.0%) | 0 (0.0%) |
| 75 Years and over | 8 (6.5%) | 19 (6.1%) |
Disability Class: Cognitive Difficulty
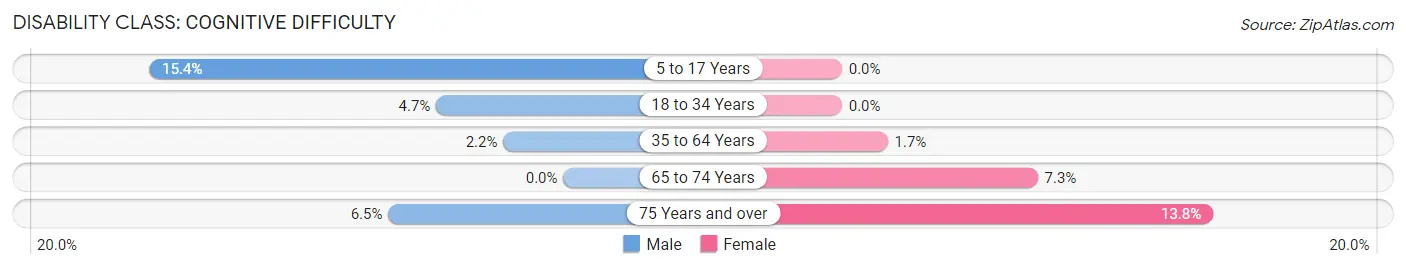
| Age Bracket | Male | Female |
| 5 to 17 Years | 24 (15.4%) | 0 (0.0%) |
| 18 to 34 Years | 10 (4.7%) | 0 (0.0%) |
| 35 to 64 Years | 12 (2.2%) | 11 (1.7%) |
| 65 to 74 Years | 0 (0.0%) | 20 (7.3%) |
| 75 Years and over | 8 (6.5%) | 43 (13.8%) |
Disability Class: Ambulatory Difficulty
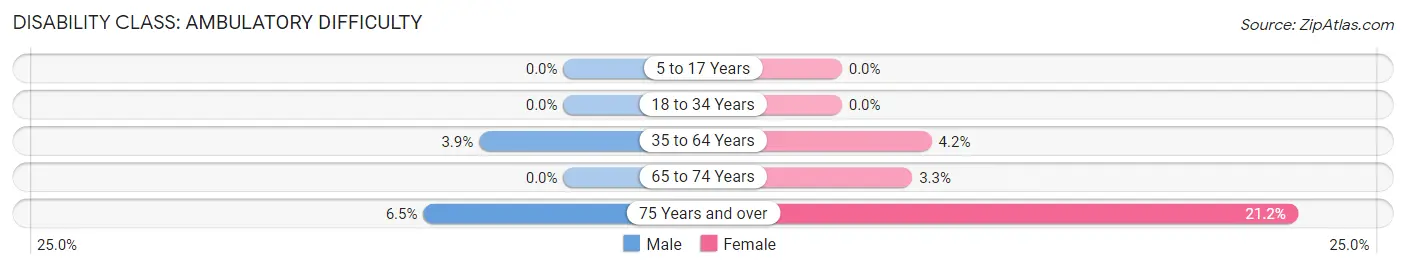
| Age Bracket | Male | Female |
| 5 to 17 Years | 0 (0.0%) | 0 (0.0%) |
| 18 to 34 Years | 0 (0.0%) | 0 (0.0%) |
| 35 to 64 Years | 21 (3.9%) | 27 (4.2%) |
| 65 to 74 Years | 0 (0.0%) | 9 (3.3%) |
| 75 Years and over | 8 (6.5%) | 66 (21.1%) |
Disability Class: Self-Care Difficulty
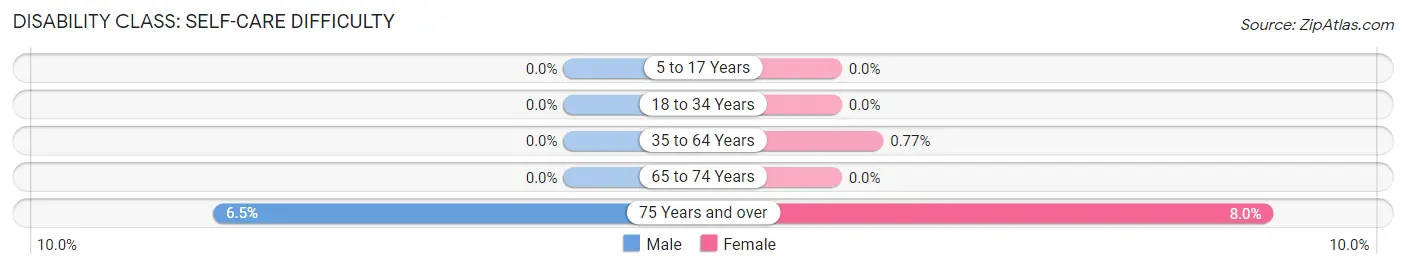
| Age Bracket | Male | Female |
| 5 to 17 Years | 0 (0.0%) | 0 (0.0%) |
| 18 to 34 Years | 0 (0.0%) | 0 (0.0%) |
| 35 to 64 Years | 0 (0.0%) | 5 (0.8%) |
| 65 to 74 Years | 0 (0.0%) | 0 (0.0%) |
| 75 Years and over | 8 (6.5%) | 25 (8.0%) |
Technology Access in Sandwich
Computing Device Access in Sandwich
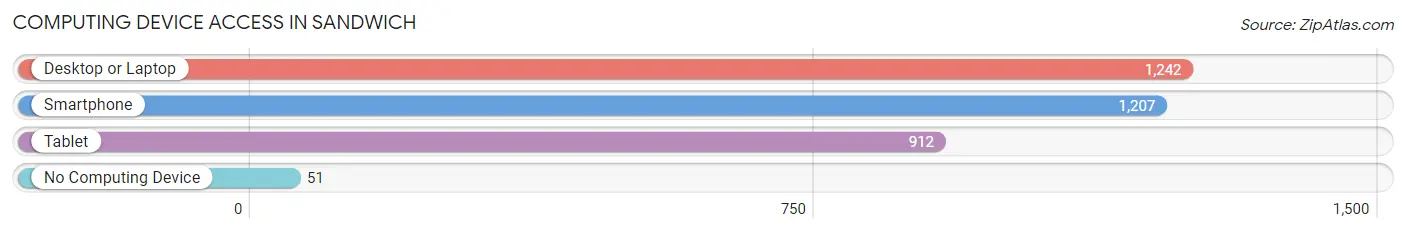
| Device Type | # Households | % Households |
| Desktop or Laptop | 1,242 | 88.5% |
| Smartphone | 1,207 | 86.0% |
| Tablet | 912 | 65.0% |
| No Computing Device | 51 | 3.6% |
| Total | 1,404 | 100.0% |
Internet Access in Sandwich
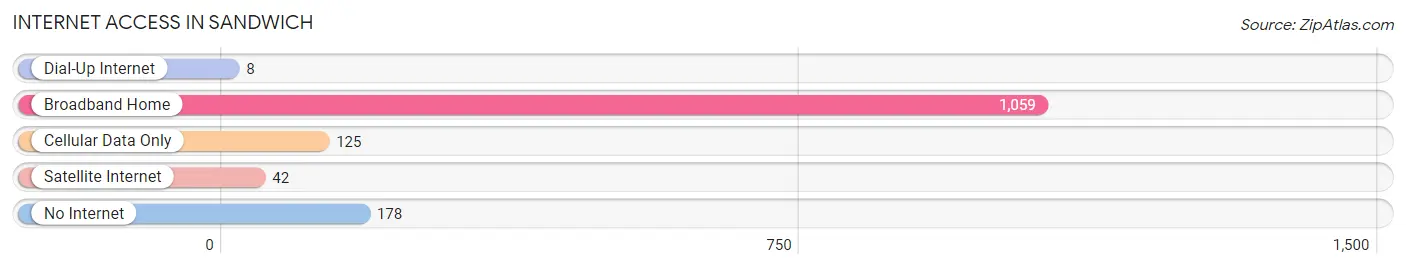
| Internet Type | # Households | % Households |
| Dial-Up Internet | 8 | 0.6% |
| Broadband Home | 1,059 | 75.4% |
| Cellular Data Only | 125 | 8.9% |
| Satellite Internet | 42 | 3.0% |
| No Internet | 178 | 12.7% |
| Total | 1,404 | 100.0% |
Sandwich Summary
Sandwich, Massachusetts is a town located in Barnstable County on Cape Cod. It is the oldest town on the Cape, having been founded in 1637. The town is bordered by Bourne to the north, Mashpee to the east, Barnstable to the south, and Falmouth to the west. It is a popular tourist destination, known for its beaches, historic sites, and recreational activities.
Geography
Sandwich is located on the south side of Cape Cod, approximately 50 miles south of Boston. The town is situated on a peninsula, with the Atlantic Ocean to the east and Cape Cod Bay to the west. The town is divided into two parts by the Cape Cod Canal, which connects the two bodies of water. The town is mostly flat, with some hills in the northern part. The town is home to several ponds, including Shawme Pond, Little Pond, and Mill Pond.
The town has several beaches, including Town Neck Beach, Sandy Neck Beach, and Scusset Beach. There are also several parks, including Shawme-Crowell State Forest, Shawme Pond Wildlife Management Area, and the Sandwich Boardwalk.
Economy
The economy of Sandwich is largely based on tourism. The town is home to several popular attractions, including the Sandwich Glass Museum, the Heritage Museums and Gardens, and the Sandwich Marina. The town is also home to several restaurants, shops, and other businesses.
The town is also home to several industries, including fishing, boatbuilding, and cranberry farming. The town is home to several cranberry bogs, which are used to produce cranberry juice, cranberry sauce, and other products.
Demographics
As of the 2010 census, the population of Sandwich was 20,675. The population is predominantly white (94.3%), with small percentages of African American (1.3%), Asian (1.2%), and Hispanic (1.2%) residents. The median household income is $68,945, and the median home value is $346,400.
The town is home to several religious institutions, including the First Congregational Church of Sandwich, the Sandwich United Methodist Church, and the St. Mary's Episcopal Church.
Conclusion
Sandwich, Massachusetts is a town located in Barnstable County on Cape Cod. It is the oldest town on the Cape, having been founded in 1637. The town is bordered by Bourne to the north, Mashpee to the east, Barnstable to the south, and Falmouth to the west. It is a popular tourist destination, known for its beaches, historic sites, and recreational activities. The economy of Sandwich is largely based on tourism, and the town is home to several industries, including fishing, boatbuilding, and cranberry farming. As of the 2010 census, the population of Sandwich was 20,675. The population is predominantly white (94.3%), with small percentages of African American (1.3%), Asian (1.2%), and Hispanic (1.2%) residents.
Common Questions
What is Per Capita Income in Sandwich?
Per Capita income in Sandwich is $65,470.
What is the Median Family Income in Sandwich?
Median Family Income in Sandwich is $116,607.
What is the Median Household income in Sandwich?
Median Household Income in Sandwich is $99,333.
What is Income or Wage Gap in Sandwich?
Income or Wage Gap in Sandwich is 18.7%.
Women in Sandwich earn 81.3 cents for every dollar earned by a man.
What is Inequality or Gini Index in Sandwich?
Inequality or Gini Index in Sandwich is 0.46.
What is the Total Population of Sandwich?
Total Population of Sandwich is 2,948.
What is the Total Male Population of Sandwich?
Total Male Population of Sandwich is 1,393.
What is the Total Female Population of Sandwich?
Total Female Population of Sandwich is 1,555.
What is the Ratio of Males per 100 Females in Sandwich?
There are 89.58 Males per 100 Females in Sandwich.
What is the Ratio of Females per 100 Males in Sandwich?
There are 111.63 Females per 100 Males in Sandwich.
What is the Median Population Age in Sandwich?
Median Population Age in Sandwich is 57.4 Years.
What is the Average Family Size in Sandwich
Average Family Size in Sandwich is 2.6 People.
What is the Average Household Size in Sandwich
Average Household Size in Sandwich is 2.1 People.
How Large is the Labor Force in Sandwich?
There are 1,526 People in the Labor Forcein in Sandwich.
What is the Percentage of People in the Labor Force in Sandwich?
56.4% of People are in the Labor Force in Sandwich.
What is the Unemployment Rate in Sandwich?
Unemployment Rate in Sandwich is 4.4%.