Hopedale, MA Map & Demographics
Hopedale Map
Hopedale Overview
$54,213
PER CAPITA INCOME
$138,523
AVG FAMILY INCOME
$117,135
AVG HOUSEHOLD INCOME
52.5%
WAGE / INCOME GAP [ % ]
47.5¢/ $1
WAGE / INCOME GAP [ $ ]
0.39
INEQUALITY / GINI INDEX
4,137
TOTAL POPULATION
1,721
MALE POPULATION
2,416
FEMALE POPULATION
71.23
MALES / 100 FEMALES
140.38
FEMALES / 100 MALES
38.9
MEDIAN AGE
3.2
AVG FAMILY SIZE
2.7
AVG HOUSEHOLD SIZE
2,323
LABOR FORCE [ PEOPLE ]
70.8%
PERCENT IN LABOR FORCE
5.4%
UNEMPLOYMENT RATE
Hopedale Zip Codes
Income in Hopedale
Income Overview in Hopedale
Per Capita Income in Hopedale is $54,213, while median incomes of families and households are $138,523 and $117,135 respectively.
| Characteristic | Number | Measure |
| Per Capita Income | 4,137 | $54,213 |
| Median Family Income | 1,098 | $138,523 |
| Mean Family Income | 1,098 | $168,121 |
| Median Household Income | 1,511 | $117,135 |
| Mean Household Income | 1,511 | $144,055 |
| Income Deficit | 1,098 | $0 |
| Wage / Income Gap (%) | 4,137 | 52.48% |
| Wage / Income Gap ($) | 4,137 | 47.52¢ per $1 |
| Gini / Inequality Index | 4,137 | 0.39 |
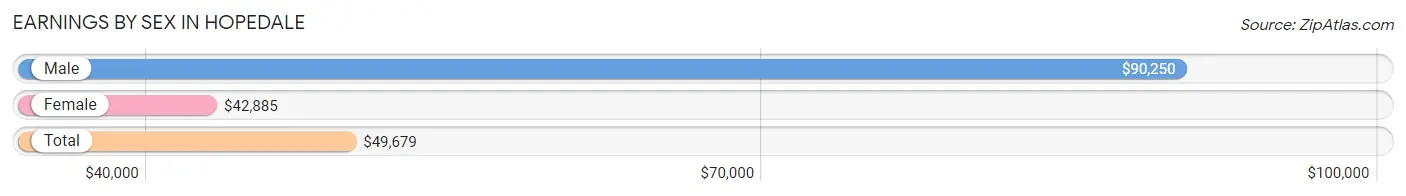
Earnings by Sex in Hopedale
Average Earnings in Hopedale are $49,679, $90,250 for men and $42,885 for women, a difference of 52.5%.
| Sex | Number | Average Earnings |
| Male | 1,133 (46.3%) | $90,250 |
| Female | 1,312 (53.7%) | $42,885 |
| Total | 2,445 (100.0%) | $49,679 |
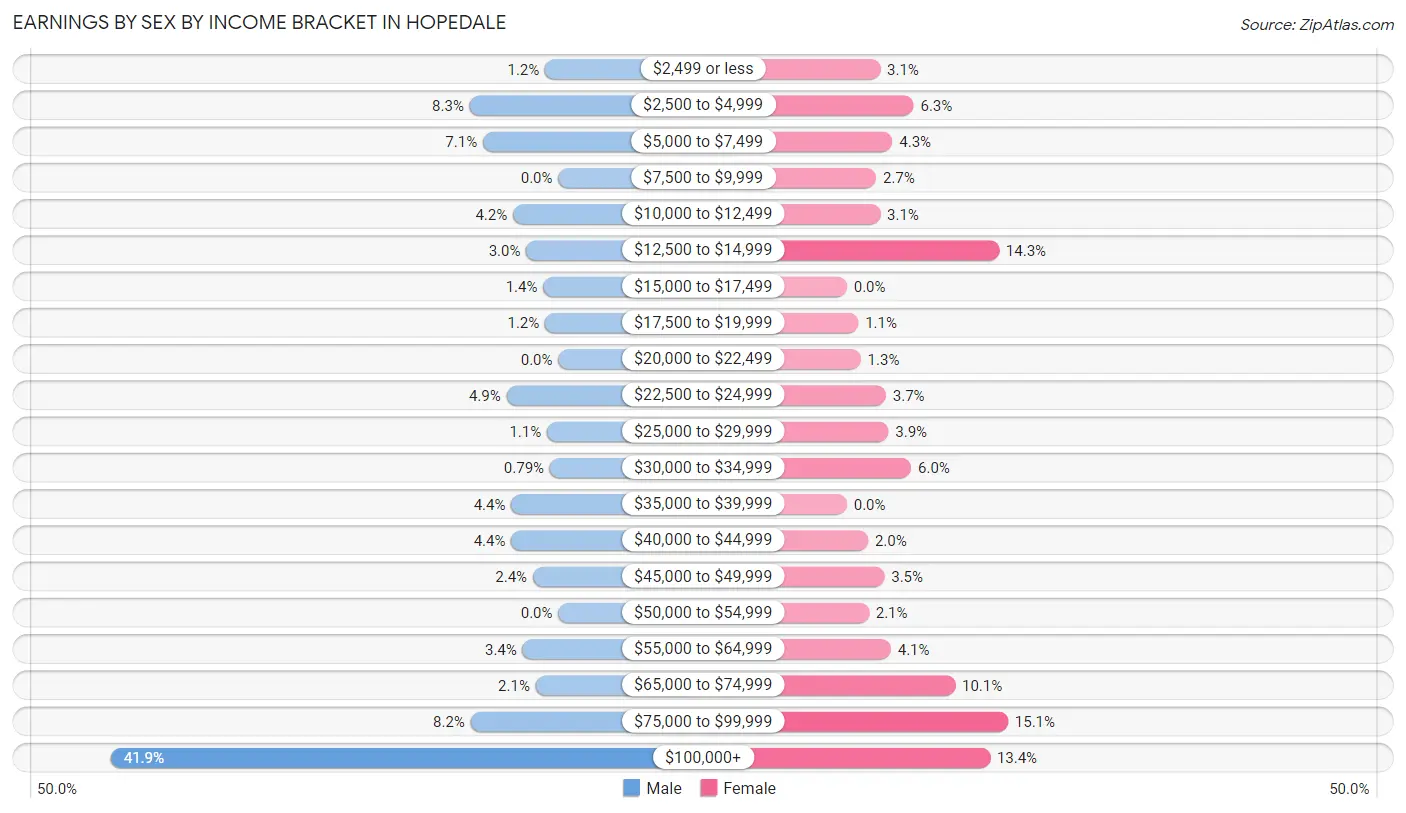
Earnings by Sex by Income Bracket in Hopedale
The most common earnings brackets in Hopedale are $100,000+ for men (475 | 41.9%) and $75,000 to $99,999 for women (198 | 15.1%).
| Income | Male | Female |
| $2,499 or less | 14 (1.2%) | 41 (3.1%) |
| $2,500 to $4,999 | 94 (8.3%) | 82 (6.2%) |
| $5,000 to $7,499 | 80 (7.1%) | 56 (4.3%) |
| $7,500 to $9,999 | 0 (0.0%) | 36 (2.7%) |
| $10,000 to $12,499 | 48 (4.2%) | 41 (3.1%) |
| $12,500 to $14,999 | 34 (3.0%) | 187 (14.2%) |
| $15,000 to $17,499 | 16 (1.4%) | 0 (0.0%) |
| $17,500 to $19,999 | 14 (1.2%) | 14 (1.1%) |
| $20,000 to $22,499 | 0 (0.0%) | 17 (1.3%) |
| $22,500 to $24,999 | 55 (4.9%) | 48 (3.7%) |
| $25,000 to $29,999 | 12 (1.1%) | 51 (3.9%) |
| $30,000 to $34,999 | 9 (0.8%) | 79 (6.0%) |
| $35,000 to $39,999 | 50 (4.4%) | 0 (0.0%) |
| $40,000 to $44,999 | 50 (4.4%) | 26 (2.0%) |
| $45,000 to $49,999 | 27 (2.4%) | 46 (3.5%) |
| $50,000 to $54,999 | 0 (0.0%) | 27 (2.1%) |
| $55,000 to $64,999 | 38 (3.4%) | 54 (4.1%) |
| $65,000 to $74,999 | 24 (2.1%) | 133 (10.1%) |
| $75,000 to $99,999 | 93 (8.2%) | 198 (15.1%) |
| $100,000+ | 475 (41.9%) | 176 (13.4%) |
| Total | 1,133 (100.0%) | 1,312 (100.0%) |
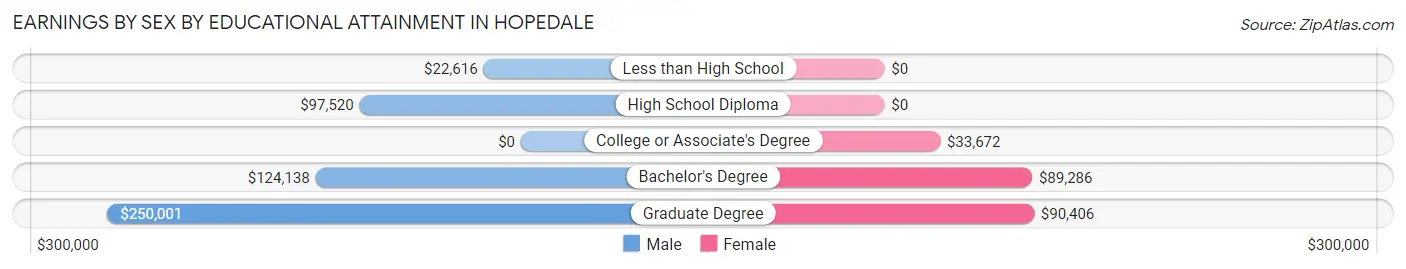
Earnings by Sex by Educational Attainment in Hopedale
Average earnings in Hopedale are $99,199 for men and $67,673 for women, a difference of 31.8%. Men with an educational attainment of graduate degree enjoy the highest average annual earnings of $250,001, while those with less than high school education earn the least with $22,616. Women with an educational attainment of graduate degree earn the most with the average annual earnings of $90,406, while those with college or associate's degree education have the smallest earnings of $33,672.
| Educational Attainment | Male Income | Female Income |
| Less than High School | $22,616 | $0 |
| High School Diploma | $97,520 | $0 |
| College or Associate's Degree | - | - |
| Bachelor's Degree | $124,138 | $89,286 |
| Graduate Degree | $250,001 | $90,406 |
| Total | $99,199 | $67,673 |
Family Income in Hopedale
Family Income Brackets in Hopedale
According to the Hopedale family income data, there are 439 families falling into the $200,000+ income range, which is the most common income bracket and makes up 40.0% of all families.
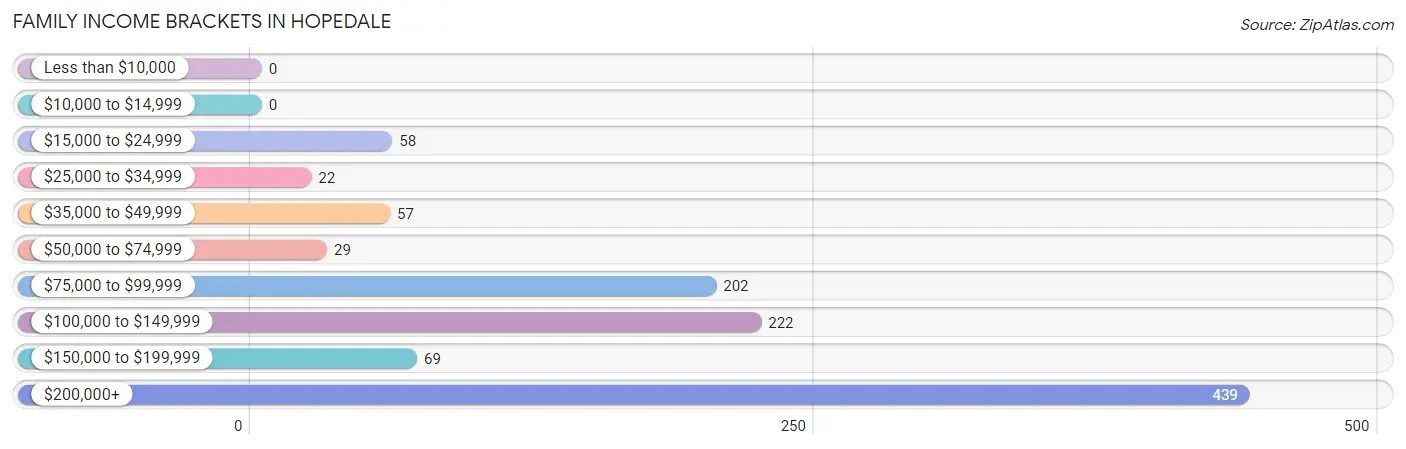
| Income Bracket | # Families | % Families |
| Less than $10,000 | 0 | 0.0% |
| $10,000 to $14,999 | 0 | 0.0% |
| $15,000 to $24,999 | 58 | 5.3% |
| $25,000 to $34,999 | 22 | 2.0% |
| $35,000 to $49,999 | 57 | 5.2% |
| $50,000 to $74,999 | 29 | 2.6% |
| $75,000 to $99,999 | 202 | 18.4% |
| $100,000 to $149,999 | 222 | 20.2% |
| $150,000 to $199,999 | 69 | 6.3% |
| $200,000+ | 439 | 40.0% |
Family Income by Famaliy Size in Hopedale
4-person families (162 | 14.7%) account for the highest median family income in Hopedale with $202,222 per family, while 4-person families (162 | 14.7%) have the highest median income of $50,556 per family member.
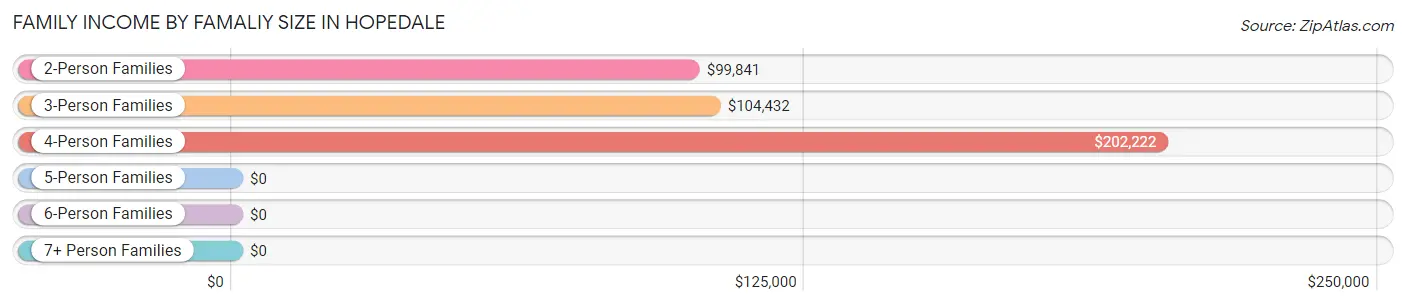
| Income Bracket | # Families | Median Income |
| 2-Person Families | 554 (50.5%) | $99,841 |
| 3-Person Families | 221 (20.1%) | $104,432 |
| 4-Person Families | 162 (14.7%) | $202,222 |
| 5-Person Families | 63 (5.7%) | $0 |
| 6-Person Families | 98 (8.9%) | $0 |
| 7+ Person Families | 0 (0.0%) | $0 |
| Total | 1,098 (100.0%) | $138,523 |
Family Income by Number of Earners in Hopedale
The median family income in Hopedale is $138,523, with families comprising 3+ earners (303) having the highest median family income of $243,890, while families with no earners (116) have the lowest median family income of $73,167, accounting for 27.6% and 10.6% of families, respectively.
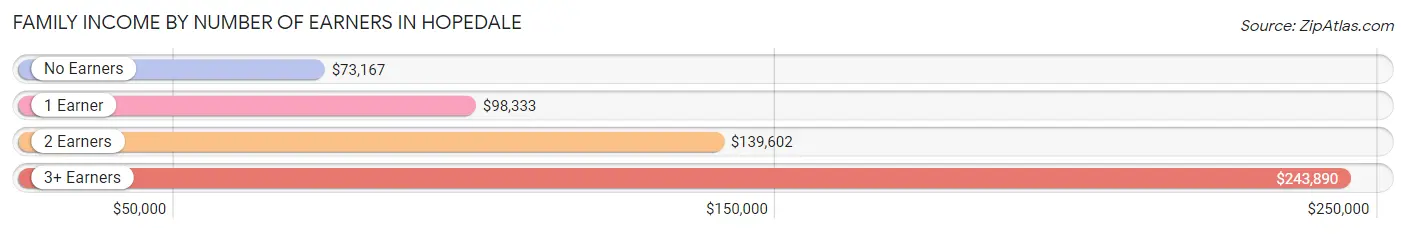
| Number of Earners | # Families | Median Income |
| No Earners | 116 (10.6%) | $73,167 |
| 1 Earner | 316 (28.8%) | $98,333 |
| 2 Earners | 363 (33.1%) | $139,602 |
| 3+ Earners | 303 (27.6%) | $243,890 |
| Total | 1,098 (100.0%) | $138,523 |
Household Income in Hopedale
Household Income Brackets in Hopedale
With 440 households falling in the category, the $200,000+ income range is the most frequent in Hopedale, accounting for 29.1% of all households. In contrast, only 18 households (1.2%) fall into the less than $10,000 income bracket, making it the least populous group.
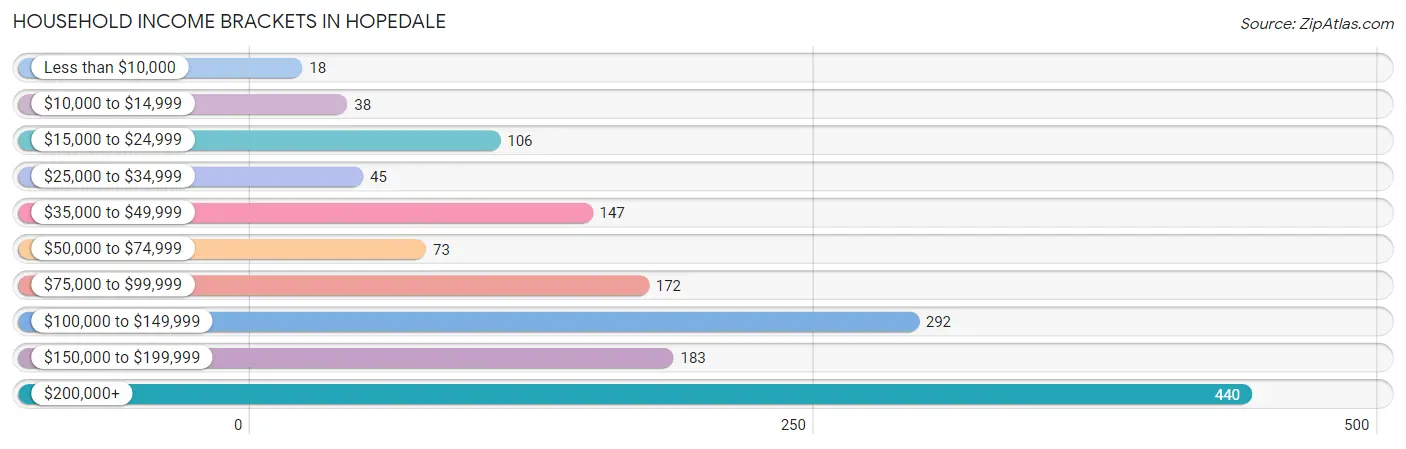
| Income Bracket | # Households | % Households |
| Less than $10,000 | 18 | 1.2% |
| $10,000 to $14,999 | 38 | 2.5% |
| $15,000 to $24,999 | 106 | 7.0% |
| $25,000 to $34,999 | 45 | 3.0% |
| $35,000 to $49,999 | 147 | 9.7% |
| $50,000 to $74,999 | 73 | 4.8% |
| $75,000 to $99,999 | 172 | 11.4% |
| $100,000 to $149,999 | 292 | 19.3% |
| $150,000 to $199,999 | 183 | 12.1% |
| $200,000+ | 440 | 29.1% |
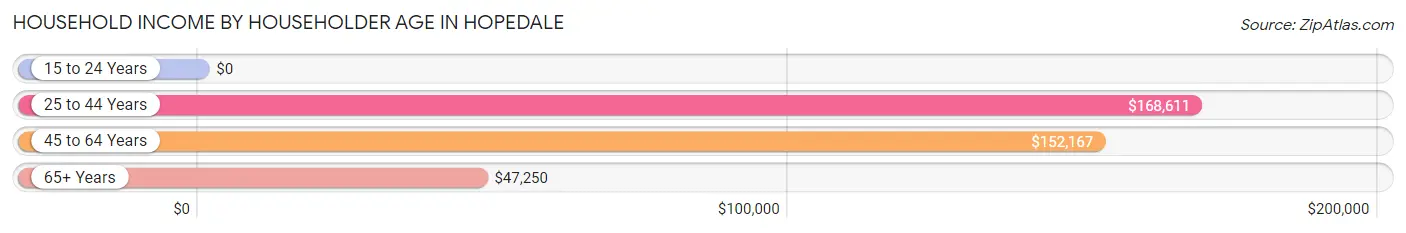
Household Income by Householder Age in Hopedale
The median household income in Hopedale is $117,135, with the highest median household income of $168,611 found in the 25 to 44 years age bracket for the primary householder. A total of 332 households (22.0%) fall into this category.
| Income Bracket | # Households | Median Income |
| 15 to 24 Years | 0 (0.0%) | $0 |
| 25 to 44 Years | 332 (22.0%) | $168,611 |
| 45 to 64 Years | 702 (46.5%) | $152,167 |
| 65+ Years | 477 (31.6%) | $47,250 |
| Total | 1,511 (100.0%) | $117,135 |
Poverty in Hopedale
Income Below Poverty by Sex and Age in Hopedale
With 4.9% poverty level for males and 6.9% for females among the residents of Hopedale, 55 to 64 year old males and 55 to 64 year old females are the most vulnerable to poverty, with 30 males (14.6%) and 70 females (27.7%) in their respective age groups living below the poverty level.
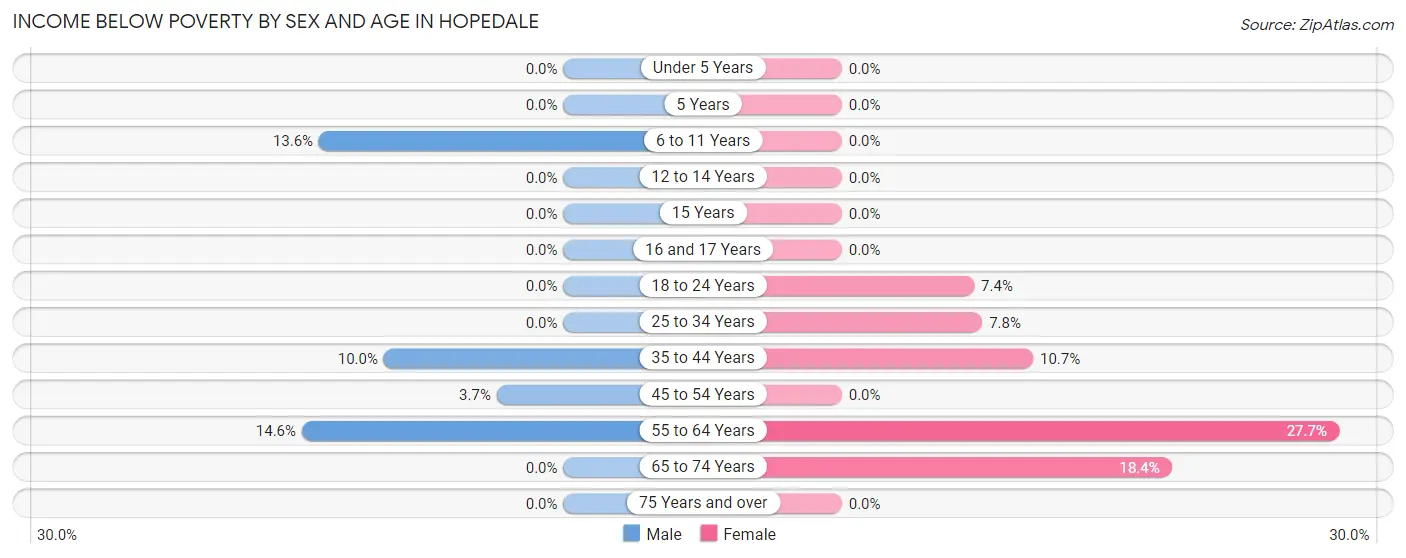
| Age Bracket | Male | Female |
| Under 5 Years | 0 (0.0%) | 0 (0.0%) |
| 5 Years | 0 (0.0%) | 0 (0.0%) |
| 6 to 11 Years | 20 (13.6%) | 0 (0.0%) |
| 12 to 14 Years | 0 (0.0%) | 0 (0.0%) |
| 15 Years | 0 (0.0%) | 0 (0.0%) |
| 16 and 17 Years | 0 (0.0%) | 0 (0.0%) |
| 18 to 24 Years | 0 (0.0%) | 21 (7.4%) |
| 25 to 34 Years | 0 (0.0%) | 19 (7.8%) |
| 35 to 44 Years | 18 (10.0%) | 18 (10.6%) |
| 45 to 54 Years | 16 (3.7%) | 0 (0.0%) |
| 55 to 64 Years | 30 (14.6%) | 70 (27.7%) |
| 65 to 74 Years | 0 (0.0%) | 38 (18.4%) |
| 75 Years and over | 0 (0.0%) | 0 (0.0%) |
| Total | 84 (4.9%) | 166 (6.9%) |
Income Above Poverty by Sex and Age in Hopedale
According to the poverty statistics in Hopedale, males aged under 5 years and females aged under 5 years are the age groups that are most secure financially, with 100.0% of males and 100.0% of females in these age groups living above the poverty line.
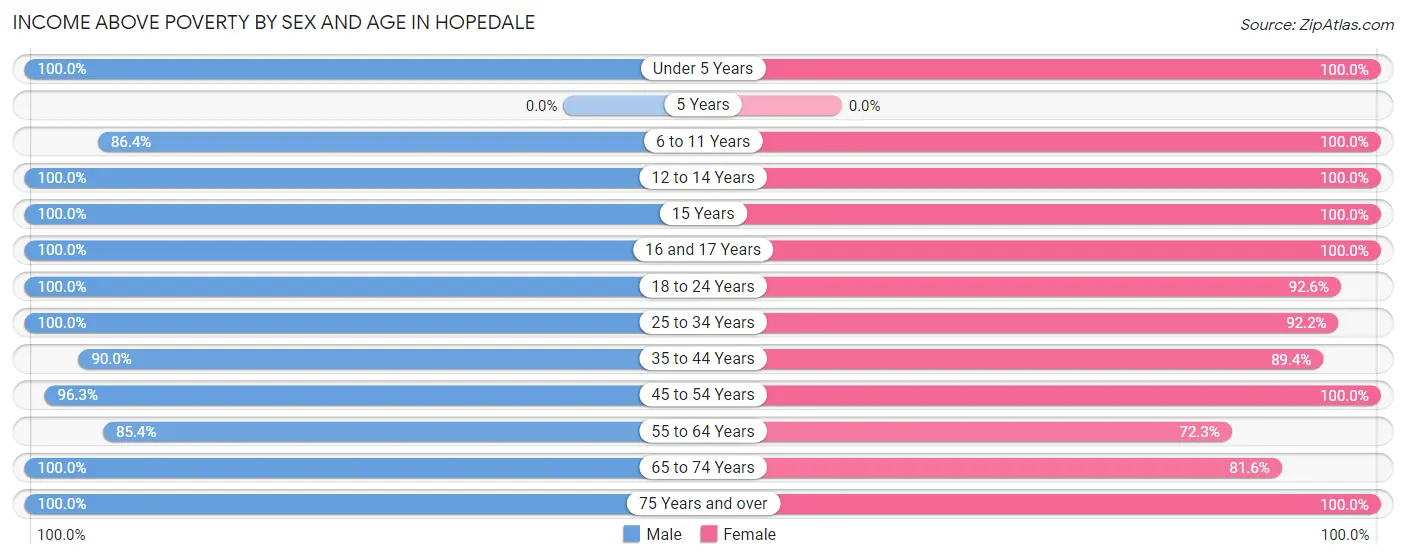
| Age Bracket | Male | Female |
| Under 5 Years | 21 (100.0%) | 20 (100.0%) |
| 5 Years | 0 (0.0%) | 0 (0.0%) |
| 6 to 11 Years | 127 (86.4%) | 160 (100.0%) |
| 12 to 14 Years | 76 (100.0%) | 273 (100.0%) |
| 15 Years | 42 (100.0%) | 117 (100.0%) |
| 16 and 17 Years | 38 (100.0%) | 124 (100.0%) |
| 18 to 24 Years | 111 (100.0%) | 264 (92.6%) |
| 25 to 34 Years | 159 (100.0%) | 224 (92.2%) |
| 35 to 44 Years | 162 (90.0%) | 151 (89.3%) |
| 45 to 54 Years | 415 (96.3%) | 377 (100.0%) |
| 55 to 64 Years | 176 (85.4%) | 183 (72.3%) |
| 65 to 74 Years | 135 (100.0%) | 169 (81.6%) |
| 75 Years and over | 171 (100.0%) | 185 (100.0%) |
| Total | 1,633 (95.1%) | 2,247 (93.1%) |
Income Below Poverty Among Married-Couple Families in Hopedale
The poverty statistics for married-couple families in Hopedale show that 4.4% or 34 of the total 777 families live below the poverty line. Families with 1 or 2 children have the highest poverty rate of 7.6%, comprising of 18 families. On the other hand, families with 3 or 4 children have the lowest poverty rate of 0.0%, which includes 0 families.
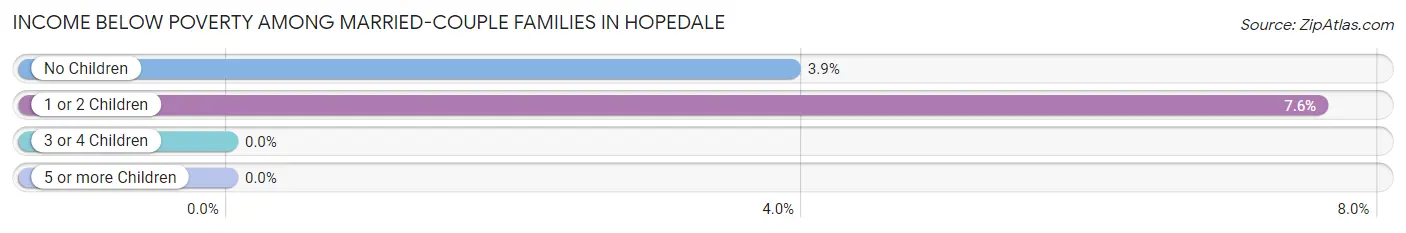
| Children | Above Poverty | Below Poverty |
| No Children | 392 (96.1%) | 16 (3.9%) |
| 1 or 2 Children | 219 (92.4%) | 18 (7.6%) |
| 3 or 4 Children | 132 (100.0%) | 0 (0.0%) |
| 5 or more Children | 0 (0.0%) | 0 (0.0%) |
| Total | 743 (95.6%) | 34 (4.4%) |
Income Below Poverty Among Single-Parent Households in Hopedale
| Children | Single Father | Single Mother |
| No Children | 0 (0.0%) | 0 (0.0%) |
| 1 or 2 Children | 0 (0.0%) | 0 (0.0%) |
| 3 or 4 Children | 0 (0.0%) | 0 (0.0%) |
| 5 or more Children | 0 (0.0%) | 0 (0.0%) |
| Total | 0 (0.0%) | 0 (0.0%) |
Income Below Poverty Among Married-Couple vs Single-Parent Households in Hopedale
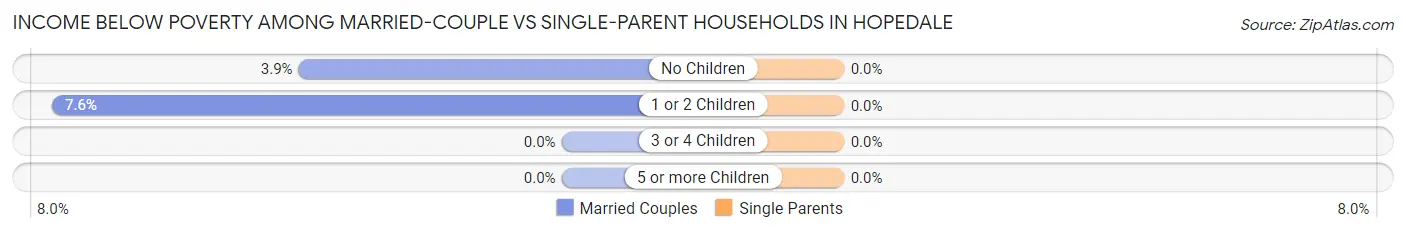
| Children | Married-Couple Families | Single-Parent Households |
| No Children | 16 (3.9%) | 0 (0.0%) |
| 1 or 2 Children | 18 (7.6%) | 0 (0.0%) |
| 3 or 4 Children | 0 (0.0%) | 0 (0.0%) |
| 5 or more Children | 0 (0.0%) | 0 (0.0%) |
| Total | 34 (4.4%) | 0 (0.0%) |
Race in Hopedale
The most populous races in Hopedale are White / Caucasian (3,885 | 93.9%), Hispanic or Latino (190 | 4.6%), and Two or more Races (144 | 3.5%).
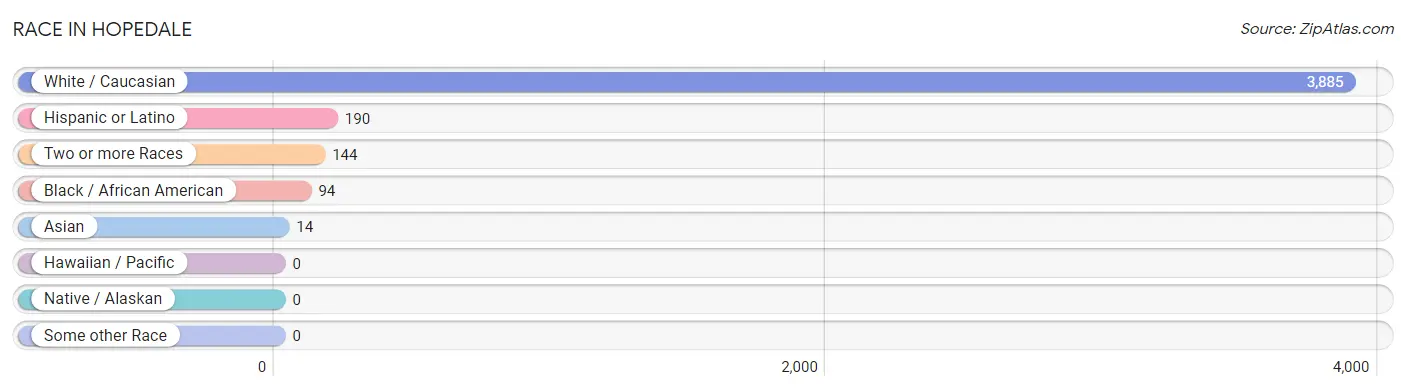
| Race | # Population | % Population |
| Asian | 14 | 0.3% |
| Black / African American | 94 | 2.3% |
| Hawaiian / Pacific | 0 | 0.0% |
| Hispanic or Latino | 190 | 4.6% |
| Native / Alaskan | 0 | 0.0% |
| White / Caucasian | 3,885 | 93.9% |
| Two or more Races | 144 | 3.5% |
| Some other Race | 0 | 0.0% |
| Total | 4,137 | 100.0% |
Ancestry in Hopedale
The most populous ancestries reported in Hopedale are Irish (1,077 | 26.0%), Italian (641 | 15.5%), English (494 | 11.9%), Scottish (463 | 11.2%), and French Canadian (306 | 7.4%), together accounting for 72.0% of all Hopedale residents.
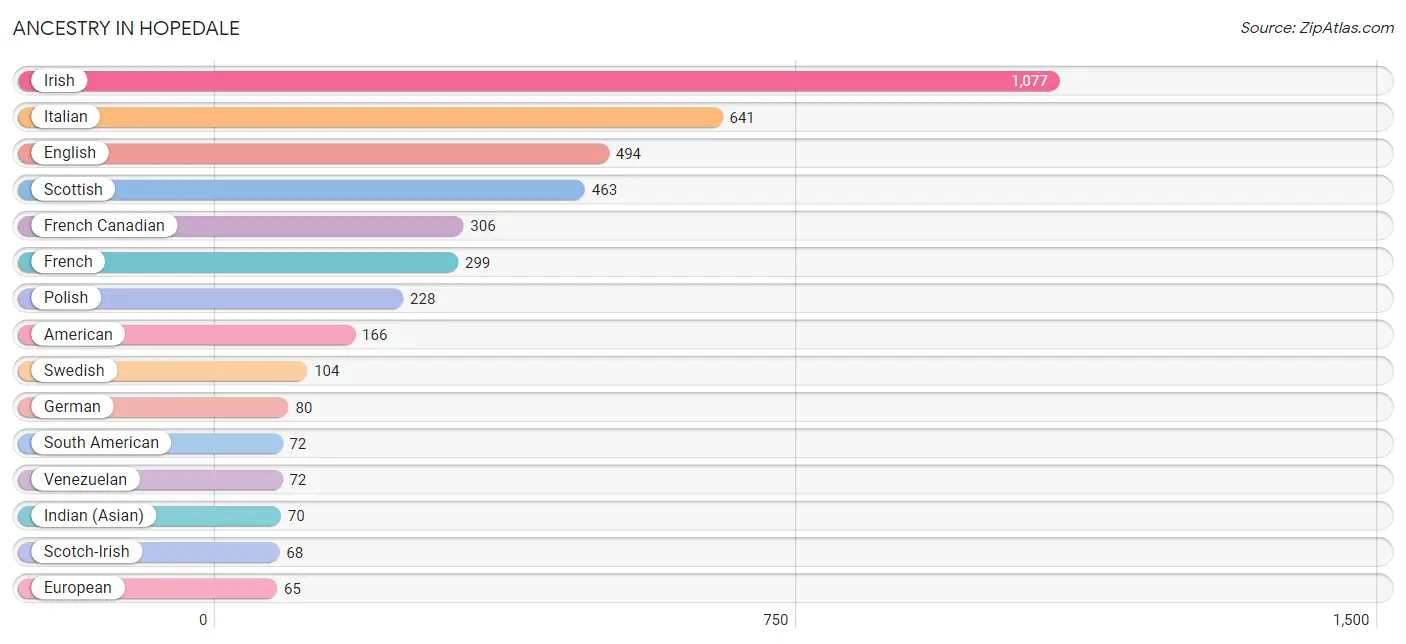
| Ancestry | # Population | % Population |
| American | 166 | 4.0% |
| British | 38 | 0.9% |
| Canadian | 17 | 0.4% |
| Central American | 14 | 0.3% |
| Cuban | 12 | 0.3% |
| Czech | 46 | 1.1% |
| Dutch | 14 | 0.3% |
| English | 494 | 11.9% |
| European | 65 | 1.6% |
| French | 299 | 7.2% |
| French Canadian | 306 | 7.4% |
| German | 80 | 1.9% |
| Guatemalan | 14 | 0.3% |
| Haitian | 12 | 0.3% |
| Indian (Asian) | 70 | 1.7% |
| Irish | 1,077 | 26.0% |
| Italian | 641 | 15.5% |
| Jamaican | 12 | 0.3% |
| Lithuanian | 29 | 0.7% |
| Mexican | 58 | 1.4% |
| Norwegian | 12 | 0.3% |
| Pakistani | 14 | 0.3% |
| Polish | 228 | 5.5% |
| Portuguese | 55 | 1.3% |
| Puerto Rican | 33 | 0.8% |
| Russian | 33 | 0.8% |
| Scandinavian | 56 | 1.3% |
| Scotch-Irish | 68 | 1.6% |
| Scottish | 463 | 11.2% |
| South American | 72 | 1.7% |
| Swedish | 104 | 2.5% |
| Venezuelan | 72 | 1.7% | View All 32 Rows |
Immigrants in Hopedale
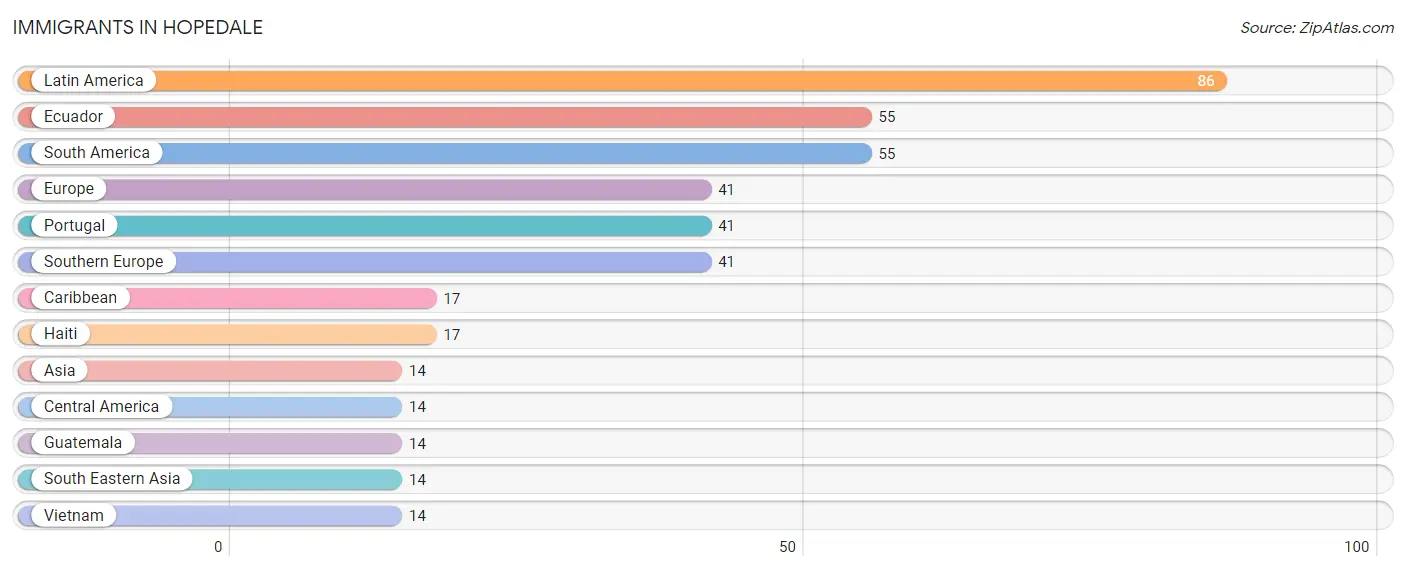
The most numerous immigrant groups reported in Hopedale came from Latin America (86 | 2.1%), Ecuador (55 | 1.3%), South America (55 | 1.3%), Europe (41 | 1.0%), and Portugal (41 | 1.0%), together accounting for 6.7% of all Hopedale residents.
| Immigration Origin | # Population | % Population |
| Asia | 14 | 0.3% |
| Caribbean | 17 | 0.4% |
| Central America | 14 | 0.3% |
| Ecuador | 55 | 1.3% |
| Europe | 41 | 1.0% |
| Guatemala | 14 | 0.3% |
| Haiti | 17 | 0.4% |
| Latin America | 86 | 2.1% |
| Portugal | 41 | 1.0% |
| South America | 55 | 1.3% |
| South Eastern Asia | 14 | 0.3% |
| Southern Europe | 41 | 1.0% |
| Vietnam | 14 | 0.3% | View All 13 Rows |
Sex and Age in Hopedale
Sex and Age in Hopedale
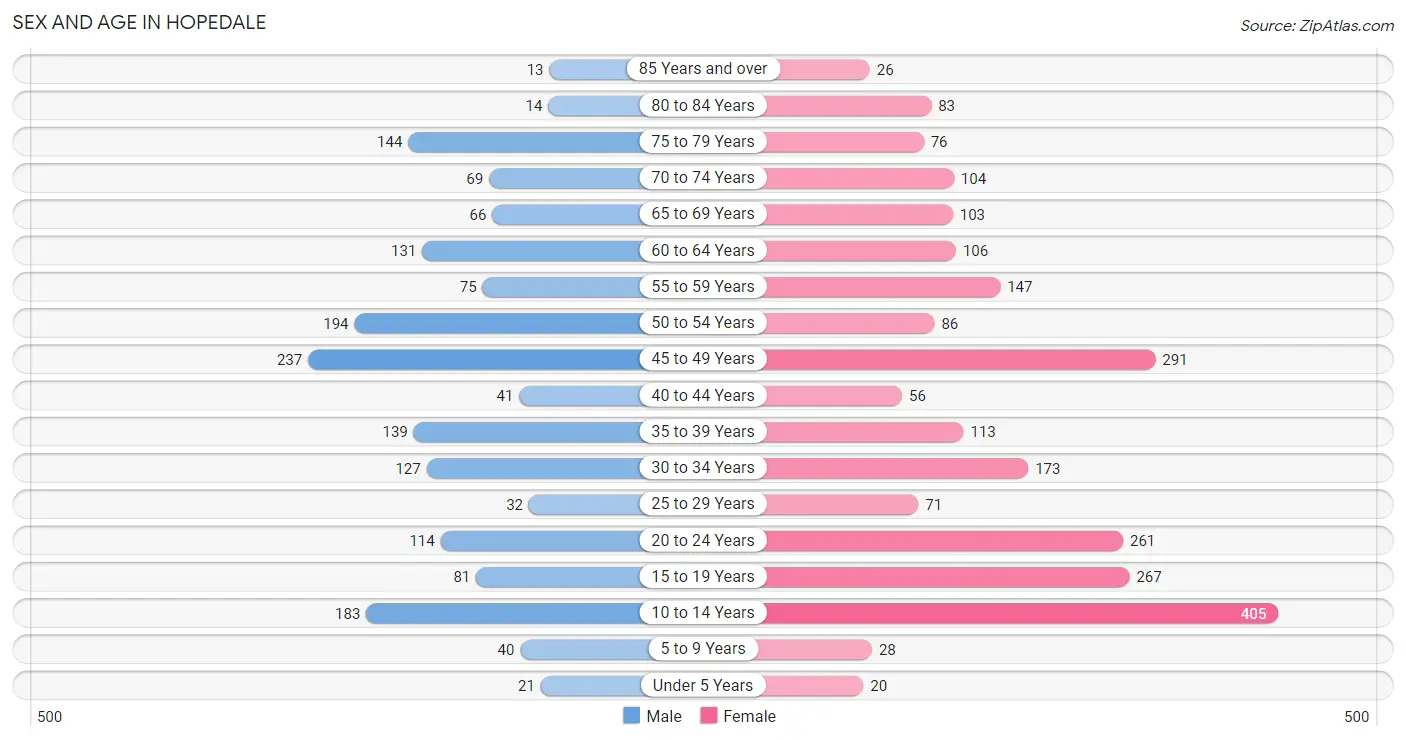
The most populous age groups in Hopedale are 45 to 49 Years (237 | 13.8%) for men and 10 to 14 Years (405 | 16.8%) for women.
| Age Bracket | Male | Female |
| Under 5 Years | 21 (1.2%) | 20 (0.8%) |
| 5 to 9 Years | 40 (2.3%) | 28 (1.2%) |
| 10 to 14 Years | 183 (10.6%) | 405 (16.8%) |
| 15 to 19 Years | 81 (4.7%) | 267 (11.1%) |
| 20 to 24 Years | 114 (6.6%) | 261 (10.8%) |
| 25 to 29 Years | 32 (1.9%) | 71 (2.9%) |
| 30 to 34 Years | 127 (7.4%) | 173 (7.2%) |
| 35 to 39 Years | 139 (8.1%) | 113 (4.7%) |
| 40 to 44 Years | 41 (2.4%) | 56 (2.3%) |
| 45 to 49 Years | 237 (13.8%) | 291 (12.0%) |
| 50 to 54 Years | 194 (11.3%) | 86 (3.6%) |
| 55 to 59 Years | 75 (4.4%) | 147 (6.1%) |
| 60 to 64 Years | 131 (7.6%) | 106 (4.4%) |
| 65 to 69 Years | 66 (3.8%) | 103 (4.3%) |
| 70 to 74 Years | 69 (4.0%) | 104 (4.3%) |
| 75 to 79 Years | 144 (8.4%) | 76 (3.2%) |
| 80 to 84 Years | 14 (0.8%) | 83 (3.4%) |
| 85 Years and over | 13 (0.8%) | 26 (1.1%) |
| Total | 1,721 (100.0%) | 2,416 (100.0%) |
Families and Households in Hopedale
Median Family Size in Hopedale
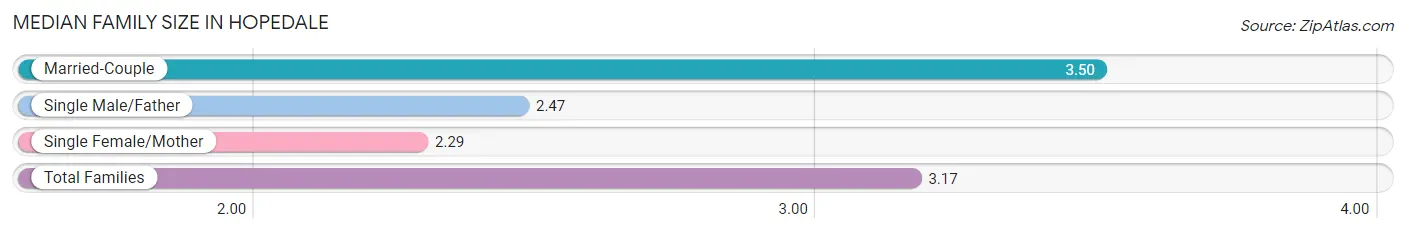
The median family size in Hopedale is 3.17 persons per family, with married-couple families (777 | 70.8%) accounting for the largest median family size of 3.5 persons per family. On the other hand, single female/mother families (164 | 14.9%) represent the smallest median family size with 2.29 persons per family.
| Family Type | # Families | Family Size |
| Married-Couple | 777 (70.8%) | 3.50 |
| Single Male/Father | 157 (14.3%) | 2.47 |
| Single Female/Mother | 164 (14.9%) | 2.29 |
| Total Families | 1,098 (100.0%) | 3.17 |
Median Household Size in Hopedale
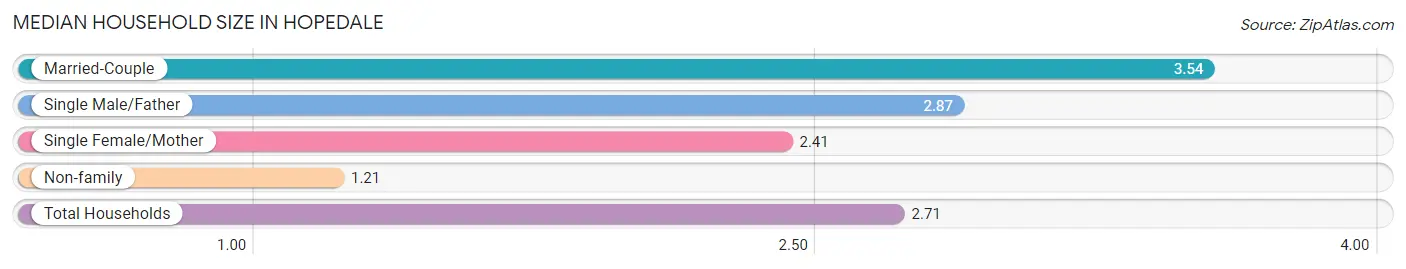
The median household size in Hopedale is 2.71 persons per household, with married-couple households (777 | 51.4%) accounting for the largest median household size of 3.54 persons per household. non-family households (413 | 27.3%) represent the smallest median household size with 1.21 persons per household.
| Household Type | # Households | Household Size |
| Married-Couple | 777 (51.4%) | 3.54 |
| Single Male/Father | 157 (10.4%) | 2.87 |
| Single Female/Mother | 164 (10.8%) | 2.41 |
| Non-family | 413 (27.3%) | 1.21 |
| Total Households | 1,511 (100.0%) | 2.71 |
Household Size by Marriage Status in Hopedale
Out of a total of 1,511 households in Hopedale, 1,098 (72.7%) are family households, while 413 (27.3%) are nonfamily households. The most numerous type of family households are 2-person households, comprising 460, and the most common type of nonfamily households are 1-person households, comprising 335.
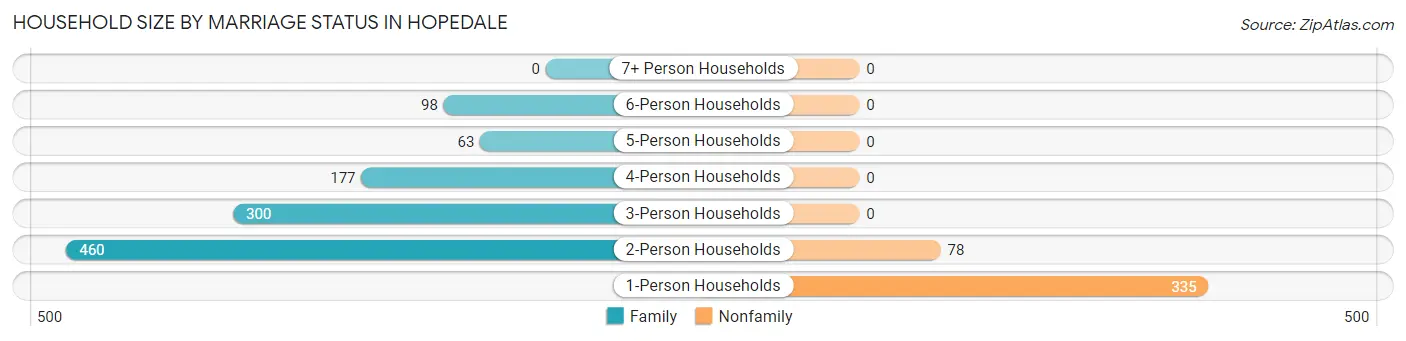
| Household Size | Family Households | Nonfamily Households |
| 1-Person Households | - | 335 (22.2%) |
| 2-Person Households | 460 (30.4%) | 78 (5.2%) |
| 3-Person Households | 300 (19.9%) | 0 (0.0%) |
| 4-Person Households | 177 (11.7%) | 0 (0.0%) |
| 5-Person Households | 63 (4.2%) | 0 (0.0%) |
| 6-Person Households | 98 (6.5%) | 0 (0.0%) |
| 7+ Person Households | 0 (0.0%) | 0 (0.0%) |
| Total | 1,098 (72.7%) | 413 (27.3%) |
Female Fertility in Hopedale
Fertility by Age in Hopedale
Average fertility rate in Hopedale is 41.0 births per 1,000 women. Women in the age bracket of 20 to 34 years have the highest fertility rate with 75.0 births per 1,000 women. Women in the age bracket of 20 to 34 years acount for 76.0% of all women with births.
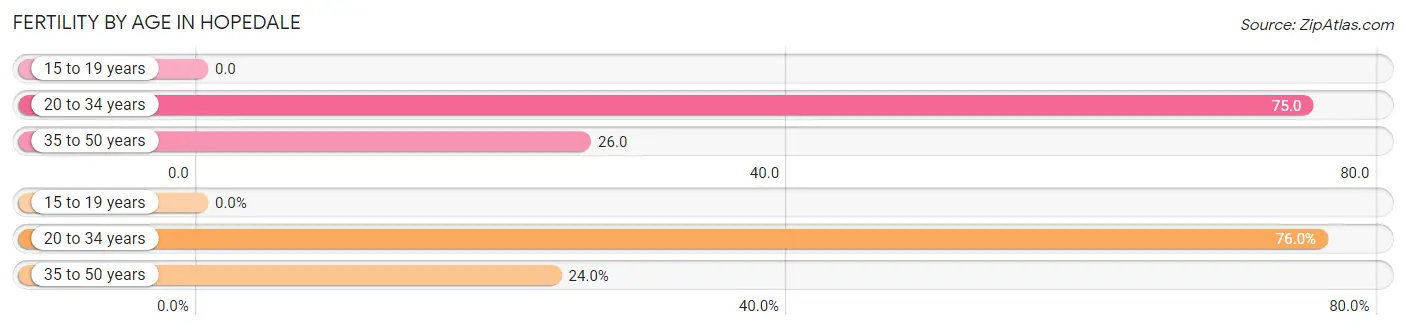
| Age Bracket | Women with Births | Births / 1,000 Women |
| 15 to 19 years | 0 (0.0%) | 0.0 |
| 20 to 34 years | 38 (76.0%) | 75.0 |
| 35 to 50 years | 12 (24.0%) | 26.0 |
| Total | 50 (100.0%) | 41.0 |
Fertility by Age by Marriage Status in Hopedale
38.0% of women with births (50) in Hopedale are married. The highest percentage of unmarried women with births falls into 35 to 50 years age bracket with 100.0% of them unmarried at the time of birth, while the lowest percentage of unmarried women with births belong to 20 to 34 years age bracket with 50.0% of them unmarried.
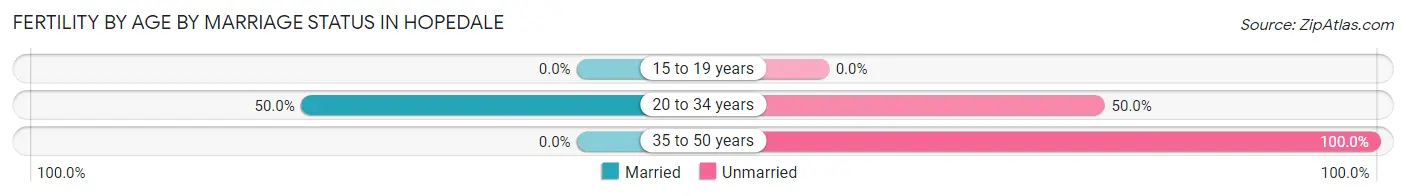
| Age Bracket | Married | Unmarried |
| 15 to 19 years | 0 (0.0%) | 0 (0.0%) |
| 20 to 34 years | 19 (50.0%) | 19 (50.0%) |
| 35 to 50 years | 0 (0.0%) | 12 (100.0%) |
| Total | 19 (38.0%) | 31 (62.0%) |
Fertility by Education in Hopedale
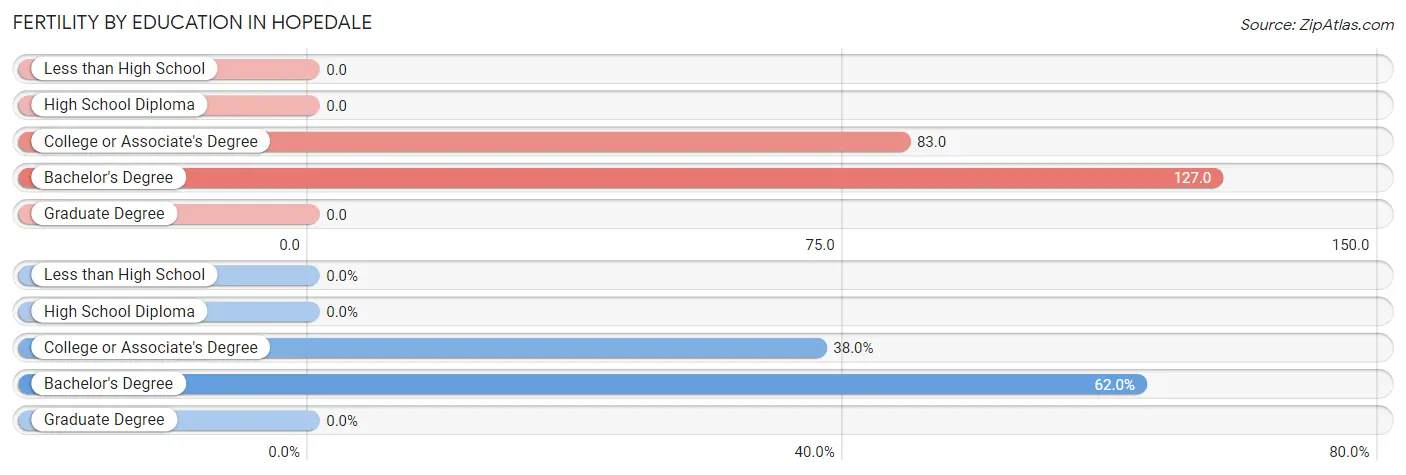
| Educational Attainment | Women with Births | Births / 1,000 Women |
| Less than High School | 0 (0.0%) | 0.0 |
| High School Diploma | 0 (0.0%) | 0.0 |
| College or Associate's Degree | 19 (38.0%) | 83.0 |
| Bachelor's Degree | 31 (62.0%) | 127.0 |
| Graduate Degree | 0 (0.0%) | 0.0 |
| Total | 50 (100.0%) | 41.0 |
Fertility by Education by Marriage Status in Hopedale
62.0% of women with births in Hopedale are unmarried. Women with the educational attainment of bachelor's degree are most likely to be married with 61.3% of them married at childbirth, while women with the educational attainment of college or associate's degree are least likely to be married with 100.0% of them unmarried at childbirth.
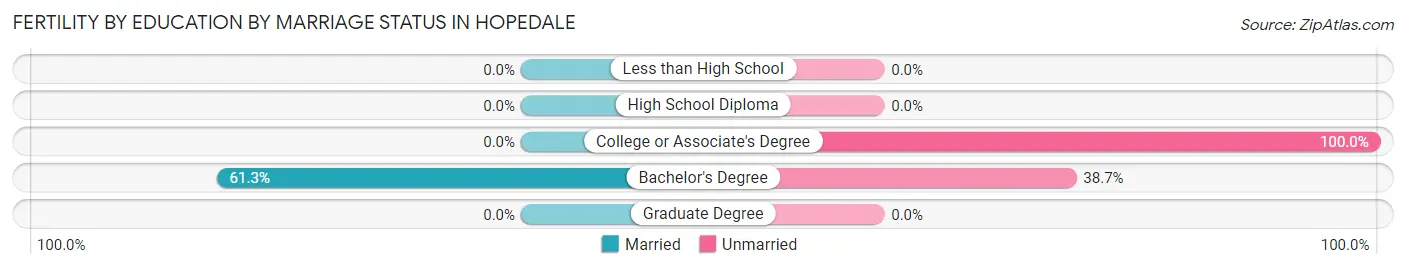
| Educational Attainment | Married | Unmarried |
| Less than High School | 0 (0.0%) | 0 (0.0%) |
| High School Diploma | 0 (0.0%) | 0 (0.0%) |
| College or Associate's Degree | 0 (0.0%) | 19 (100.0%) |
| Bachelor's Degree | 19 (61.3%) | 12 (38.7%) |
| Graduate Degree | 0 (0.0%) | 0 (0.0%) |
| Total | 19 (38.0%) | 31 (62.0%) |
Employment Characteristics in Hopedale
Employment by Class of Employer in Hopedale
Among the 2,010 employed individuals in Hopedale, private company employees (1,451 | 72.2%), not-for-profit organizations (265 | 13.2%), and local government employees (218 | 10.8%) make up the most common classes of employment.
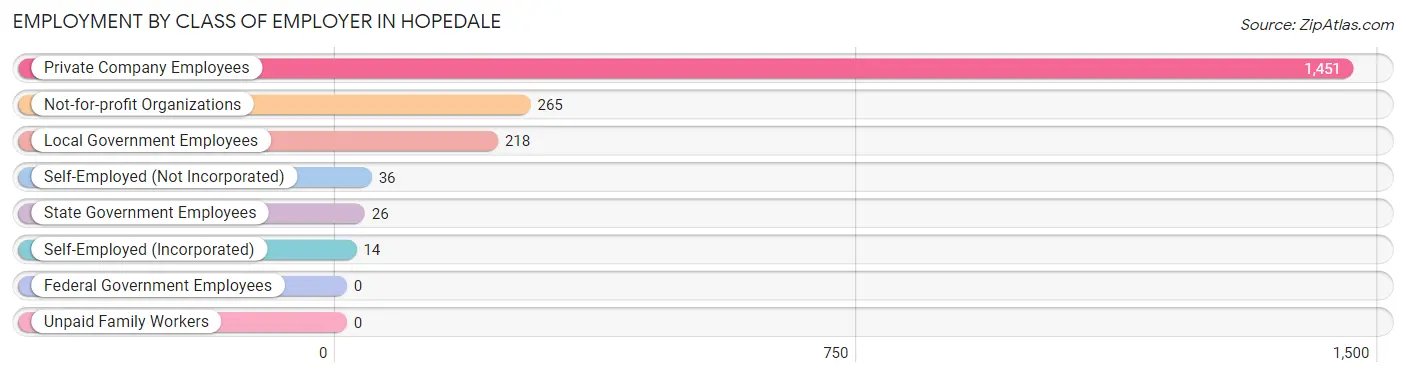
| Employer Class | # Employees | % Employees |
| Private Company Employees | 1,451 | 72.2% |
| Self-Employed (Incorporated) | 14 | 0.7% |
| Self-Employed (Not Incorporated) | 36 | 1.8% |
| Not-for-profit Organizations | 265 | 13.2% |
| Local Government Employees | 218 | 10.8% |
| State Government Employees | 26 | 1.3% |
| Federal Government Employees | 0 | 0.0% |
| Unpaid Family Workers | 0 | 0.0% |
| Total | 2,010 | 100.0% |
Employment Status by Age in Hopedale
According to the labor force statistics for Hopedale, out of the total population over 16 years of age (3,281), 70.8% or 2,323 individuals are in the labor force, with 5.4% or 125 of them unemployed. The age group with the highest labor force participation rate is 45 to 54 years, with 96.3% or 778 individuals in the labor force. Within the labor force, the 30 to 34 years age range has the highest percentage of unemployed individuals, with 24.8% or 63 of them being unemployed.
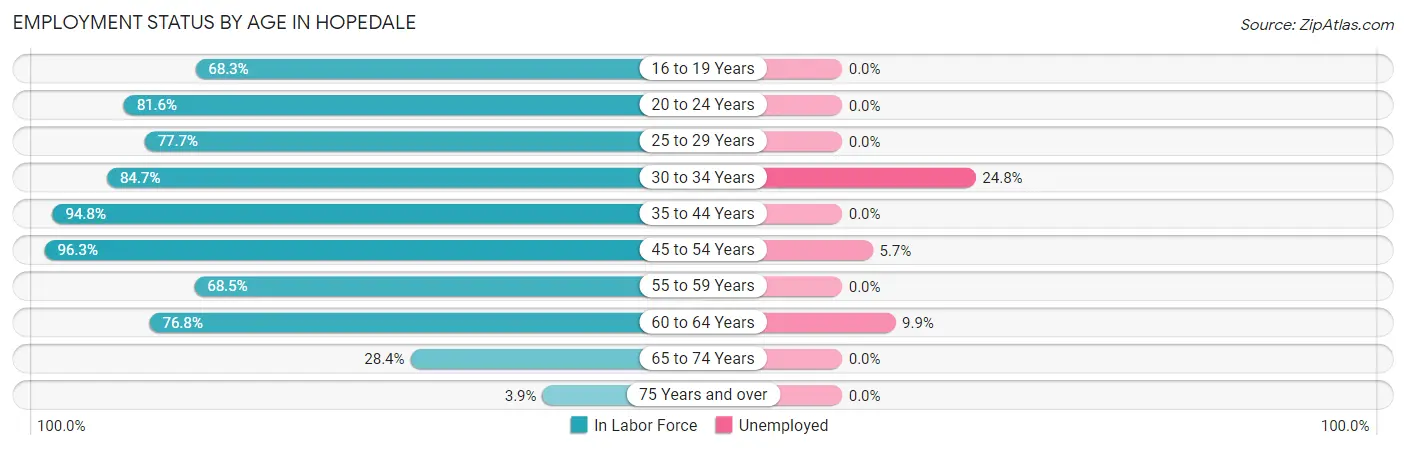
| Age Bracket | In Labor Force | Unemployed |
| 16 to 19 Years | 129 (68.3%) | 0 (0.0%) |
| 20 to 24 Years | 306 (81.6%) | 0 (0.0%) |
| 25 to 29 Years | 80 (77.7%) | 0 (0.0%) |
| 30 to 34 Years | 254 (84.7%) | 63 (24.8%) |
| 35 to 44 Years | 331 (94.8%) | 0 (0.0%) |
| 45 to 54 Years | 778 (96.3%) | 44 (5.7%) |
| 55 to 59 Years | 152 (68.5%) | 0 (0.0%) |
| 60 to 64 Years | 182 (76.8%) | 18 (9.9%) |
| 65 to 74 Years | 97 (28.4%) | 0 (0.0%) |
| 75 Years and over | 14 (3.9%) | 0 (0.0%) |
| Total | 2,323 (70.8%) | 125 (5.4%) |
Employment Status by Educational Attainment in Hopedale
According to labor force statistics for Hopedale, 88.0% of individuals (1,777) out of the total population between 25 and 64 years of age (2,019) are in the labor force, with 7.0% or 124 of them being unemployed. The group with the highest labor force participation rate are those with the educational attainment of bachelor's degree or higher, with 92.4% or 851 individuals in the labor force. Within the labor force, individuals with high school diploma education have the highest percentage of unemployment, with 14.5% or 72 of them being unemployed.
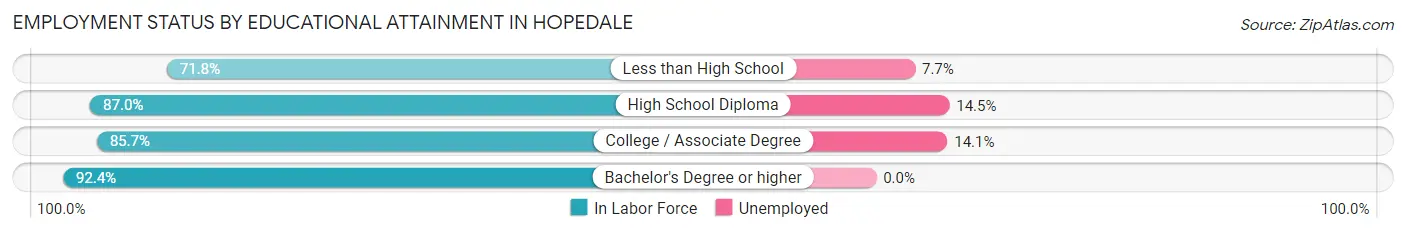
| Educational Attainment | In Labor Force | Unemployed |
| Less than High School | 117 (71.8%) | 13 (7.7%) |
| High School Diploma | 497 (87.0%) | 83 (14.5%) |
| College / Associate Degree | 312 (85.7%) | 51 (14.1%) |
| Bachelor's Degree or higher | 851 (92.4%) | 0 (0.0%) |
| Total | 1,777 (88.0%) | 141 (7.0%) |
Employment Occupations by Sex in Hopedale
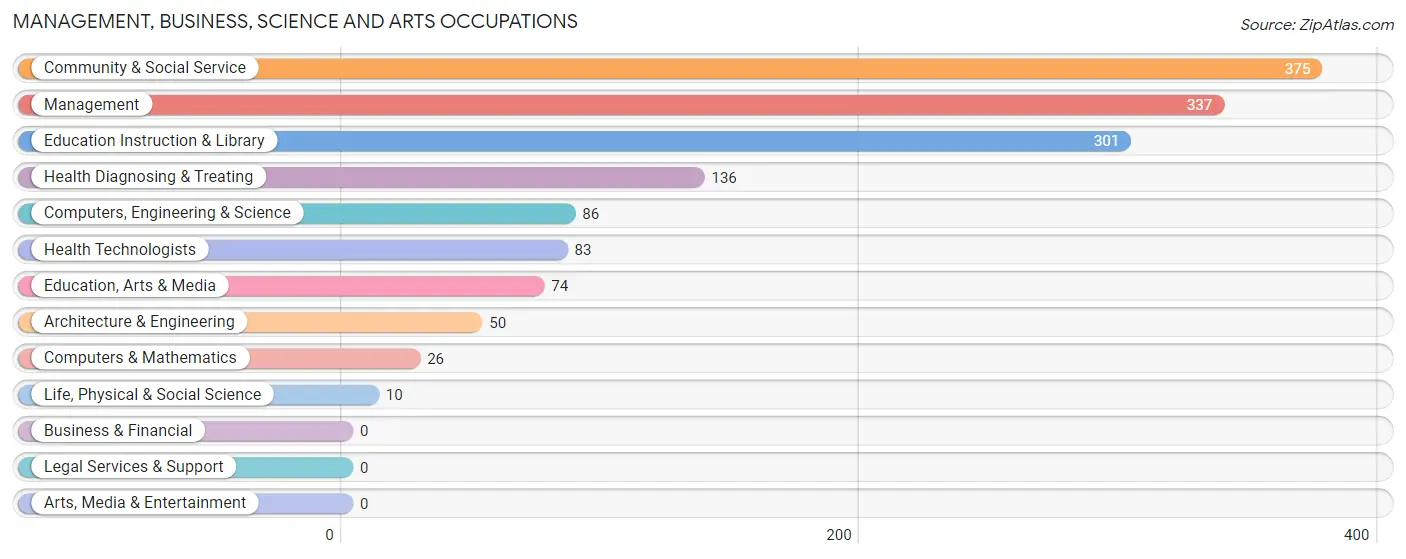
Management, Business, Science and Arts Occupations
The most common Management, Business, Science and Arts occupations in Hopedale are Community & Social Service (375 | 17.1%), Management (337 | 15.3%), Education Instruction & Library (301 | 13.7%), Health Diagnosing & Treating (136 | 6.2%), and Computers, Engineering & Science (86 | 3.9%).
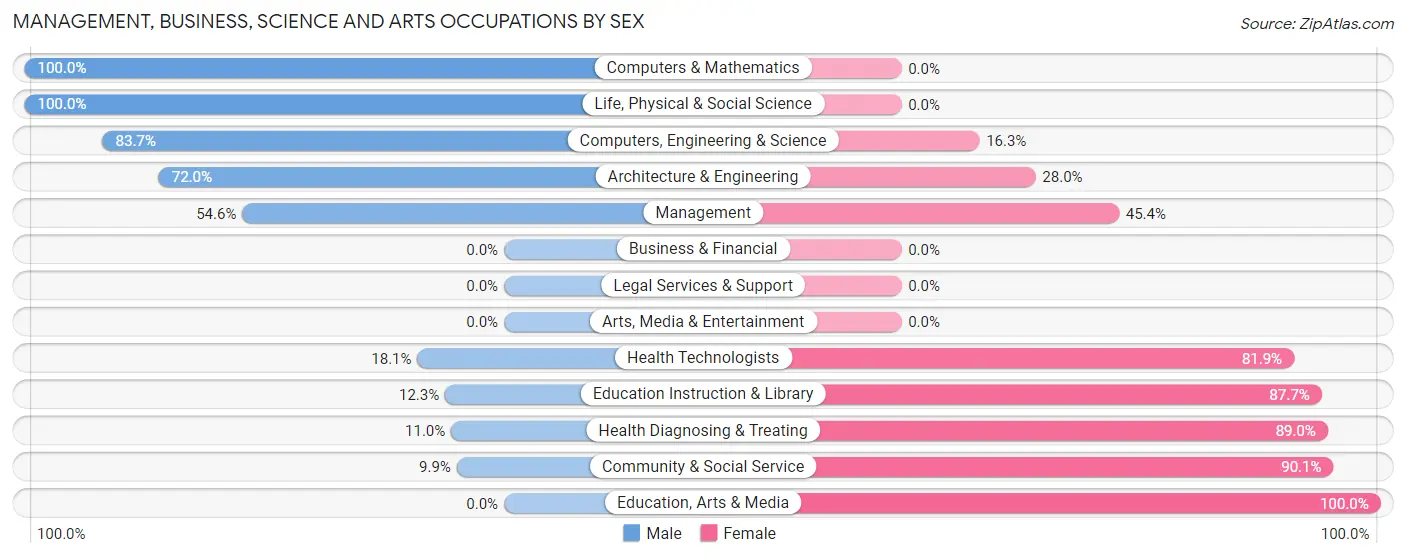
Management, Business, Science and Arts Occupations by Sex
Within the Management, Business, Science and Arts occupations in Hopedale, the most male-oriented occupations are Computers & Mathematics (100.0%), Life, Physical & Social Science (100.0%), and Computers, Engineering & Science (83.7%), while the most female-oriented occupations are Education, Arts & Media (100.0%), Community & Social Service (90.1%), and Health Diagnosing & Treating (89.0%).
| Occupation | Male | Female |
| Management | 184 (54.6%) | 153 (45.4%) |
| Business & Financial | 0 (0.0%) | 0 (0.0%) |
| Computers, Engineering & Science | 72 (83.7%) | 14 (16.3%) |
| Computers & Mathematics | 26 (100.0%) | 0 (0.0%) |
| Architecture & Engineering | 36 (72.0%) | 14 (28.0%) |
| Life, Physical & Social Science | 10 (100.0%) | 0 (0.0%) |
| Community & Social Service | 37 (9.9%) | 338 (90.1%) |
| Education, Arts & Media | 0 (0.0%) | 74 (100.0%) |
| Legal Services & Support | 0 (0.0%) | 0 (0.0%) |
| Education Instruction & Library | 37 (12.3%) | 264 (87.7%) |
| Arts, Media & Entertainment | 0 (0.0%) | 0 (0.0%) |
| Health Diagnosing & Treating | 15 (11.0%) | 121 (89.0%) |
| Health Technologists | 15 (18.1%) | 68 (81.9%) |
| Total (Category) | 308 (33.0%) | 626 (67.0%) |
| Total (Overall) | 964 (43.9%) | 1,234 (56.1%) |
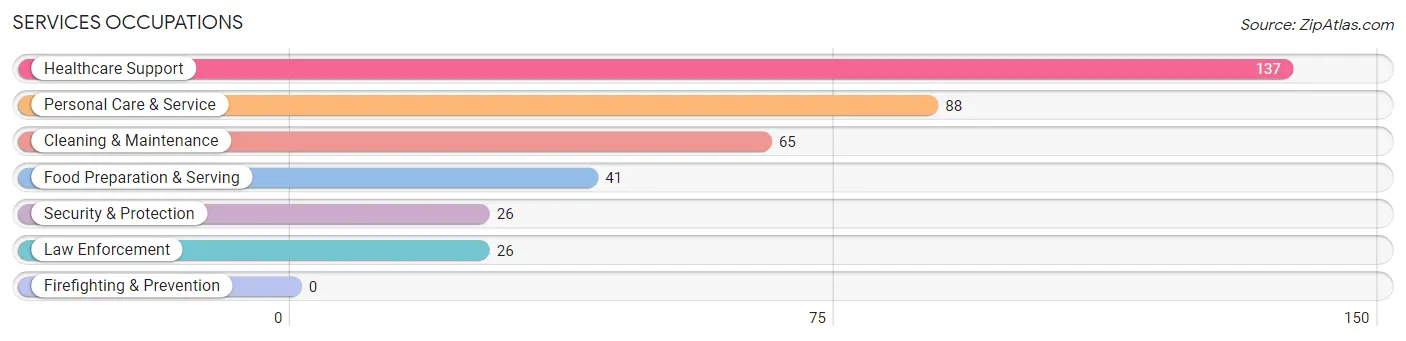
Services Occupations
The most common Services occupations in Hopedale are Healthcare Support (137 | 6.2%), Personal Care & Service (88 | 4.0%), Cleaning & Maintenance (65 | 3.0%), Food Preparation & Serving (41 | 1.9%), and Security & Protection (26 | 1.2%).
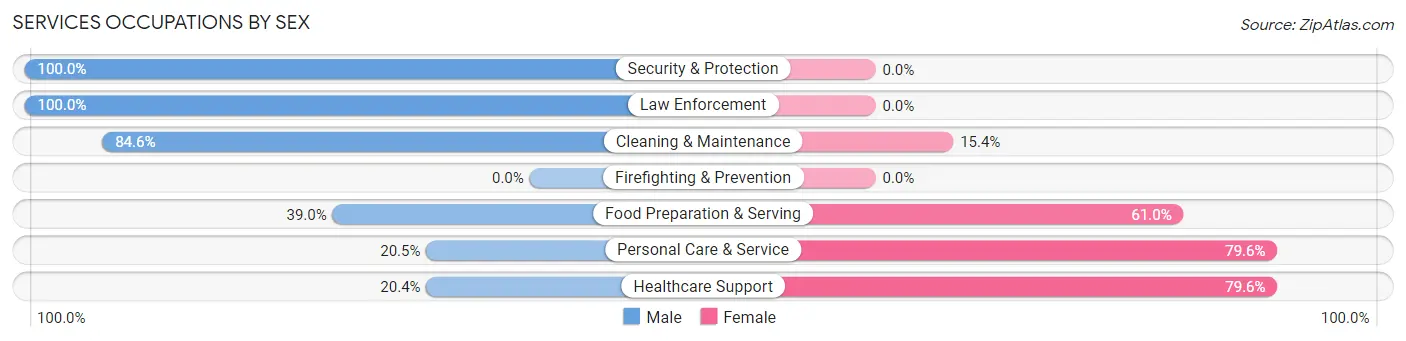
Services Occupations by Sex
Within the Services occupations in Hopedale, the most male-oriented occupations are Security & Protection (100.0%), Law Enforcement (100.0%), and Cleaning & Maintenance (84.6%), while the most female-oriented occupations are Healthcare Support (79.6%), Personal Care & Service (79.5%), and Food Preparation & Serving (61.0%).
| Occupation | Male | Female |
| Healthcare Support | 28 (20.4%) | 109 (79.6%) |
| Security & Protection | 26 (100.0%) | 0 (0.0%) |
| Firefighting & Prevention | 0 (0.0%) | 0 (0.0%) |
| Law Enforcement | 26 (100.0%) | 0 (0.0%) |
| Food Preparation & Serving | 16 (39.0%) | 25 (61.0%) |
| Cleaning & Maintenance | 55 (84.6%) | 10 (15.4%) |
| Personal Care & Service | 18 (20.4%) | 70 (79.5%) |
| Total (Category) | 143 (40.1%) | 214 (59.9%) |
| Total (Overall) | 964 (43.9%) | 1,234 (56.1%) |
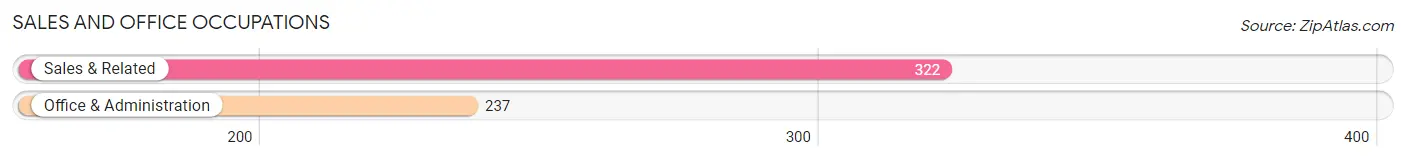
Sales and Office Occupations
The most common Sales and Office occupations in Hopedale are Sales & Related (322 | 14.6%), and Office & Administration (237 | 10.8%).
Sales and Office Occupations by Sex
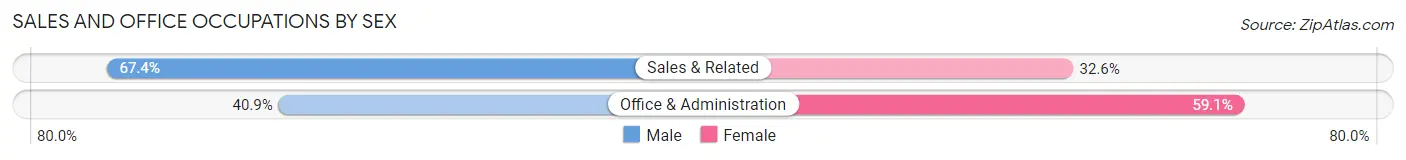
| Occupation | Male | Female |
| Sales & Related | 217 (67.4%) | 105 (32.6%) |
| Office & Administration | 97 (40.9%) | 140 (59.1%) |
| Total (Category) | 314 (56.2%) | 245 (43.8%) |
| Total (Overall) | 964 (43.9%) | 1,234 (56.1%) |
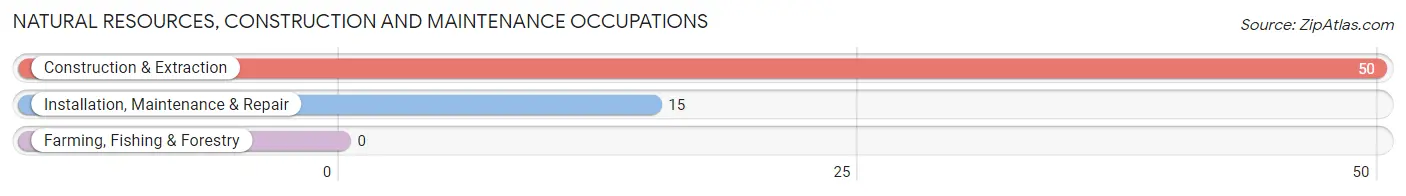
Natural Resources, Construction and Maintenance Occupations
The most common Natural Resources, Construction and Maintenance occupations in Hopedale are Construction & Extraction (50 | 2.3%), and Installation, Maintenance & Repair (15 | 0.7%).
Natural Resources, Construction and Maintenance Occupations by Sex
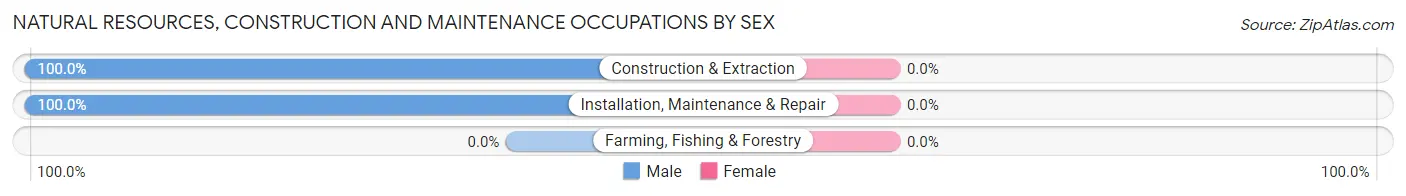
| Occupation | Male | Female |
| Farming, Fishing & Forestry | 0 (0.0%) | 0 (0.0%) |
| Construction & Extraction | 50 (100.0%) | 0 (0.0%) |
| Installation, Maintenance & Repair | 15 (100.0%) | 0 (0.0%) |
| Total (Category) | 65 (100.0%) | 0 (0.0%) |
| Total (Overall) | 964 (43.9%) | 1,234 (56.1%) |
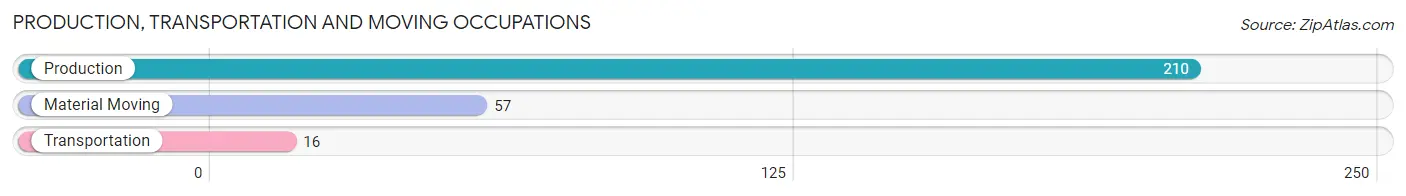
Production, Transportation and Moving Occupations
The most common Production, Transportation and Moving occupations in Hopedale are Production (210 | 9.6%), Material Moving (57 | 2.6%), and Transportation (16 | 0.7%).
Production, Transportation and Moving Occupations by Sex
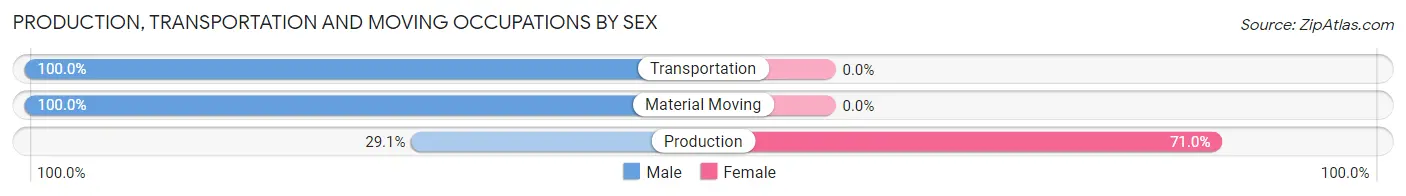
| Occupation | Male | Female |
| Production | 61 (29.0%) | 149 (71.0%) |
| Transportation | 16 (100.0%) | 0 (0.0%) |
| Material Moving | 57 (100.0%) | 0 (0.0%) |
| Total (Category) | 134 (47.3%) | 149 (52.6%) |
| Total (Overall) | 964 (43.9%) | 1,234 (56.1%) |
Employment Industries by Sex in Hopedale
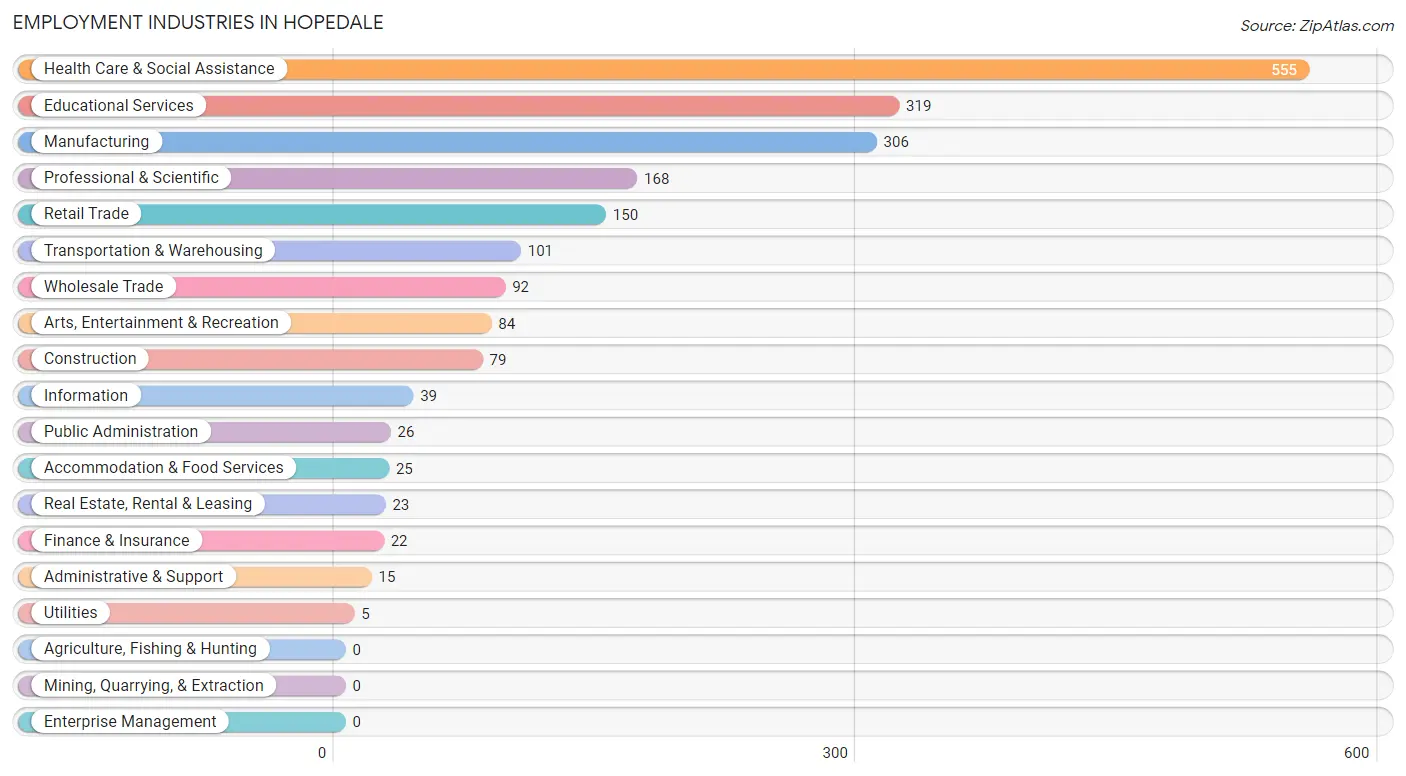
Employment Industries in Hopedale
The major employment industries in Hopedale include Health Care & Social Assistance (555 | 25.3%), Educational Services (319 | 14.5%), Manufacturing (306 | 13.9%), Professional & Scientific (168 | 7.6%), and Retail Trade (150 | 6.8%).
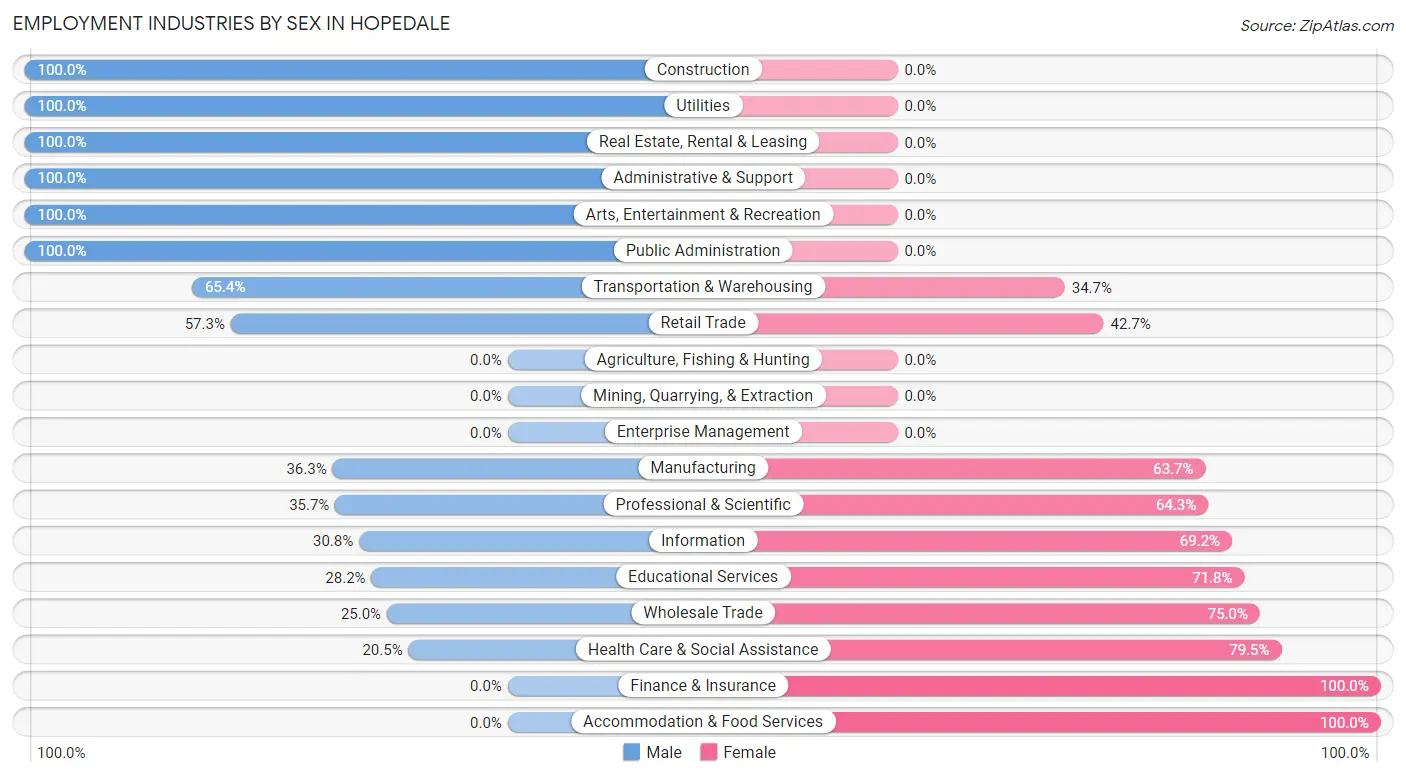
Employment Industries by Sex in Hopedale
The Hopedale industries that see more men than women are Construction (100.0%), Utilities (100.0%), and Real Estate, Rental & Leasing (100.0%), whereas the industries that tend to have a higher number of women are Finance & Insurance (100.0%), Accommodation & Food Services (100.0%), and Health Care & Social Assistance (79.5%).
| Industry | Male | Female |
| Agriculture, Fishing & Hunting | 0 (0.0%) | 0 (0.0%) |
| Mining, Quarrying, & Extraction | 0 (0.0%) | 0 (0.0%) |
| Construction | 79 (100.0%) | 0 (0.0%) |
| Manufacturing | 111 (36.3%) | 195 (63.7%) |
| Wholesale Trade | 23 (25.0%) | 69 (75.0%) |
| Retail Trade | 86 (57.3%) | 64 (42.7%) |
| Transportation & Warehousing | 66 (65.3%) | 35 (34.6%) |
| Utilities | 5 (100.0%) | 0 (0.0%) |
| Information | 12 (30.8%) | 27 (69.2%) |
| Finance & Insurance | 0 (0.0%) | 22 (100.0%) |
| Real Estate, Rental & Leasing | 23 (100.0%) | 0 (0.0%) |
| Professional & Scientific | 60 (35.7%) | 108 (64.3%) |
| Enterprise Management | 0 (0.0%) | 0 (0.0%) |
| Administrative & Support | 15 (100.0%) | 0 (0.0%) |
| Educational Services | 90 (28.2%) | 229 (71.8%) |
| Health Care & Social Assistance | 114 (20.5%) | 441 (79.5%) |
| Arts, Entertainment & Recreation | 84 (100.0%) | 0 (0.0%) |
| Accommodation & Food Services | 0 (0.0%) | 25 (100.0%) |
| Public Administration | 26 (100.0%) | 0 (0.0%) |
| Total | 964 (43.9%) | 1,234 (56.1%) |
Education in Hopedale
School Enrollment in Hopedale
The most common levels of schooling among the 1,270 students in Hopedale are high school (363 | 28.6%), middle school (350 | 27.6%), and elementary school (276 | 21.7%).
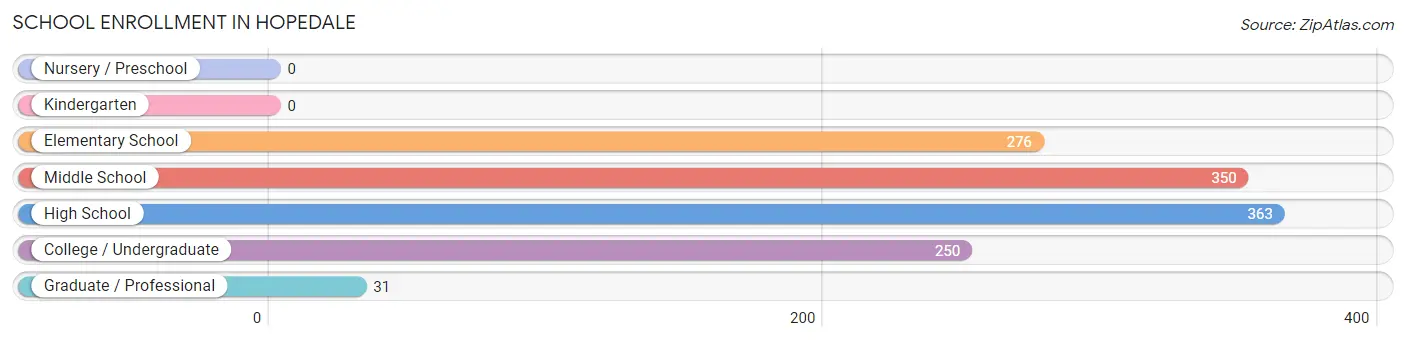
| School Level | # Students | % Students |
| Nursery / Preschool | 0 | 0.0% |
| Kindergarten | 0 | 0.0% |
| Elementary School | 276 | 21.7% |
| Middle School | 350 | 27.6% |
| High School | 363 | 28.6% |
| College / Undergraduate | 250 | 19.7% |
| Graduate / Professional | 31 | 2.4% |
| Total | 1,270 | 100.0% |
School Enrollment by Age by Funding Source in Hopedale
Out of a total of 1,270 students who are enrolled in schools in Hopedale, 211 (16.6%) attend a private institution, while the remaining 1,059 (83.4%) are enrolled in public schools. The age group of 18 to 19 year olds has the highest likelihood of being enrolled in private schools, with 1 (100.0% in the age bracket) enrolled. Conversely, the age group of 5 to 9 year old has the lowest likelihood of being enrolled in a private school, with 68 (100.0% in the age bracket) attending a public institution.
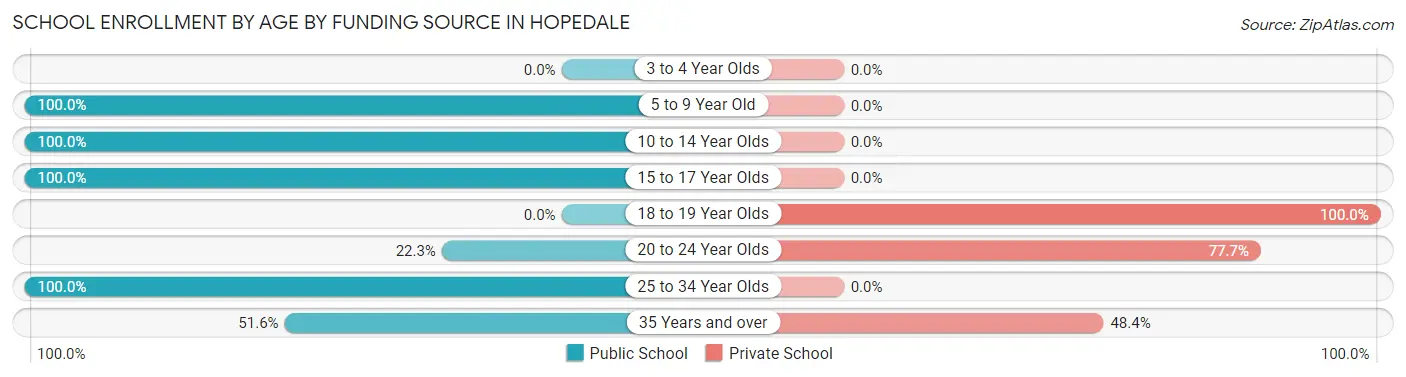
| Age Bracket | Public School | Private School |
| 3 to 4 Year Olds | 0 (0.0%) | 0 (0.0%) |
| 5 to 9 Year Old | 68 (100.0%) | 0 (0.0%) |
| 10 to 14 Year Olds | 588 (100.0%) | 0 (0.0%) |
| 15 to 17 Year Olds | 321 (100.0%) | 0 (0.0%) |
| 18 to 19 Year Olds | 0 (0.0%) | 1 (100.0%) |
| 20 to 24 Year Olds | 56 (22.3%) | 195 (77.7%) |
| 25 to 34 Year Olds | 10 (100.0%) | 0 (0.0%) |
| 35 Years and over | 16 (51.6%) | 15 (48.4%) |
| Total | 1,059 (83.4%) | 211 (16.6%) |
Educational Attainment by Field of Study in Hopedale
Business (329 | 26.6%), education (241 | 19.5%), social sciences (160 | 12.9%), science & technology (121 | 9.8%), and engineering (78 | 6.3%) are the most common fields of study among 1,236 individuals in Hopedale who have obtained a bachelor's degree or higher.
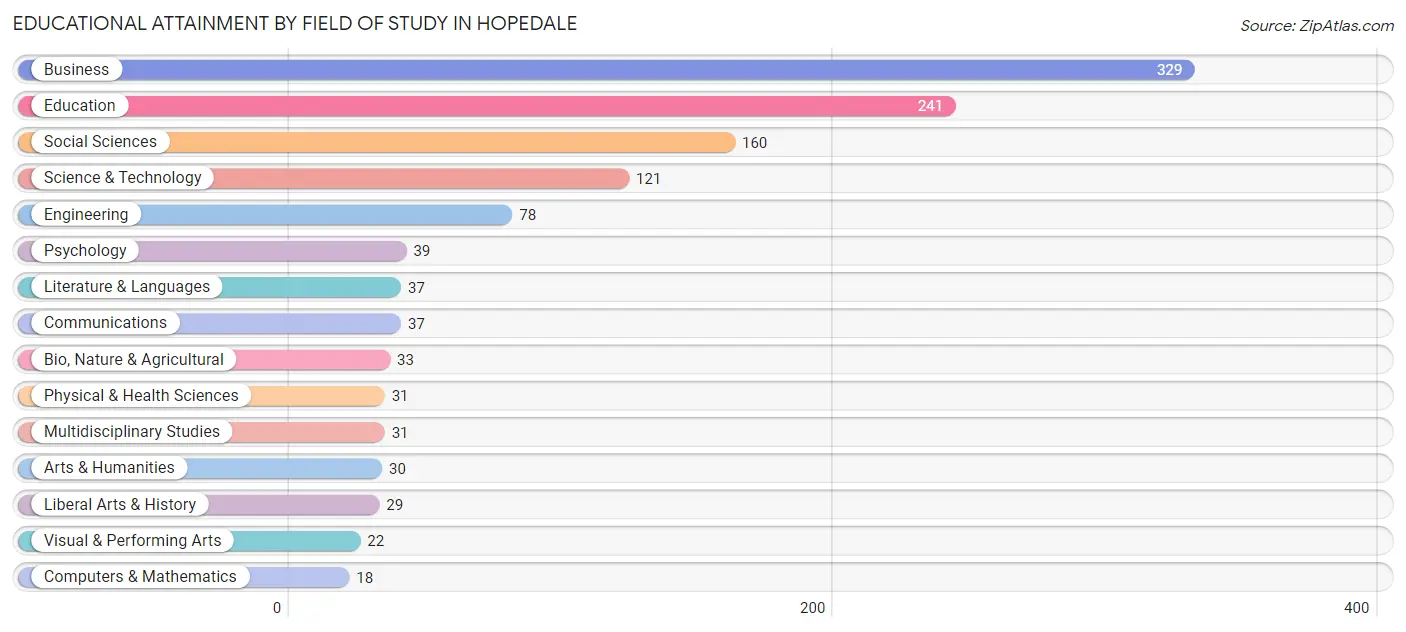
| Field of Study | # Graduates | % Graduates |
| Computers & Mathematics | 18 | 1.5% |
| Bio, Nature & Agricultural | 33 | 2.7% |
| Physical & Health Sciences | 31 | 2.5% |
| Psychology | 39 | 3.2% |
| Social Sciences | 160 | 12.9% |
| Engineering | 78 | 6.3% |
| Multidisciplinary Studies | 31 | 2.5% |
| Science & Technology | 121 | 9.8% |
| Business | 329 | 26.6% |
| Education | 241 | 19.5% |
| Literature & Languages | 37 | 3.0% |
| Liberal Arts & History | 29 | 2.4% |
| Visual & Performing Arts | 22 | 1.8% |
| Communications | 37 | 3.0% |
| Arts & Humanities | 30 | 2.4% |
| Total | 1,236 | 100.0% |
Transportation & Commute in Hopedale
Vehicle Availability by Sex in Hopedale
The most prevalent vehicle ownership categories in Hopedale are males with 2 vehicles (349, accounting for 39.9%) and females with 2 vehicles (402, making up 30.7%).
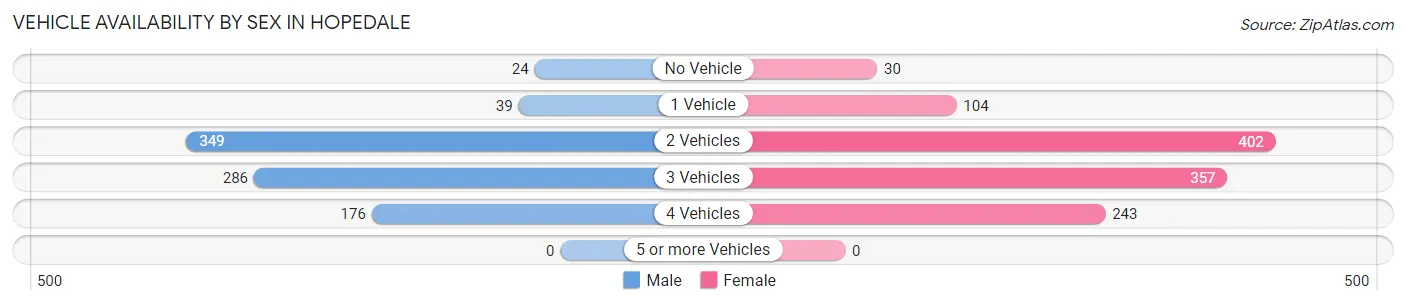
| Vehicles Available | Male | Female |
| No Vehicle | 24 (2.8%) | 30 (2.6%) |
| 1 Vehicle | 39 (4.5%) | 104 (9.1%) |
| 2 Vehicles | 349 (39.9%) | 402 (35.4%) |
| 3 Vehicles | 286 (32.7%) | 357 (31.4%) |
| 4 Vehicles | 176 (20.1%) | 243 (21.4%) |
| 5 or more Vehicles | 0 (0.0%) | 0 (0.0%) |
| Total | 874 (100.0%) | 1,136 (100.0%) |
Commute Time in Hopedale
The most frequently occuring commute durations in Hopedale are 5 to 9 minutes (275 commuters, 14.8%), 60 to 89 minutes (264 commuters, 14.2%), and 10 to 14 minutes (248 commuters, 13.3%).
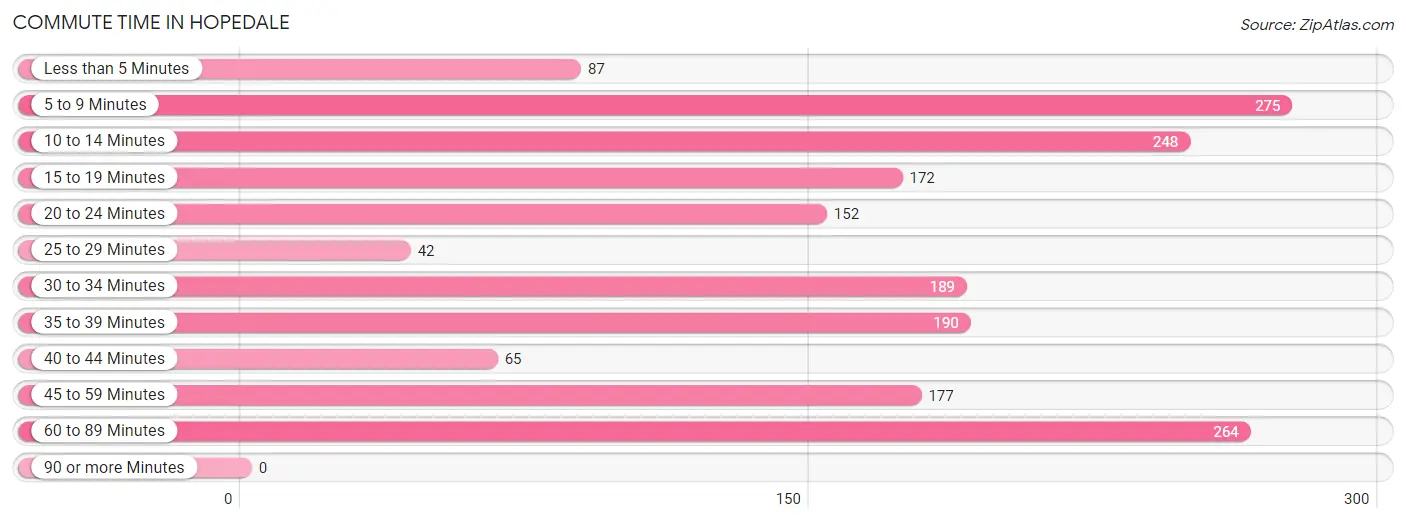
| Commute Time | # Commuters | % Commuters |
| Less than 5 Minutes | 87 | 4.7% |
| 5 to 9 Minutes | 275 | 14.8% |
| 10 to 14 Minutes | 248 | 13.3% |
| 15 to 19 Minutes | 172 | 9.2% |
| 20 to 24 Minutes | 152 | 8.2% |
| 25 to 29 Minutes | 42 | 2.3% |
| 30 to 34 Minutes | 189 | 10.2% |
| 35 to 39 Minutes | 190 | 10.2% |
| 40 to 44 Minutes | 65 | 3.5% |
| 45 to 59 Minutes | 177 | 9.5% |
| 60 to 89 Minutes | 264 | 14.2% |
| 90 or more Minutes | 0 | 0.0% |
Commute Time by Sex in Hopedale
The most common commute times in Hopedale are 60 to 89 minutes (206 commuters, 24.5%) for males and 5 to 9 minutes (181 commuters, 17.7%) for females.
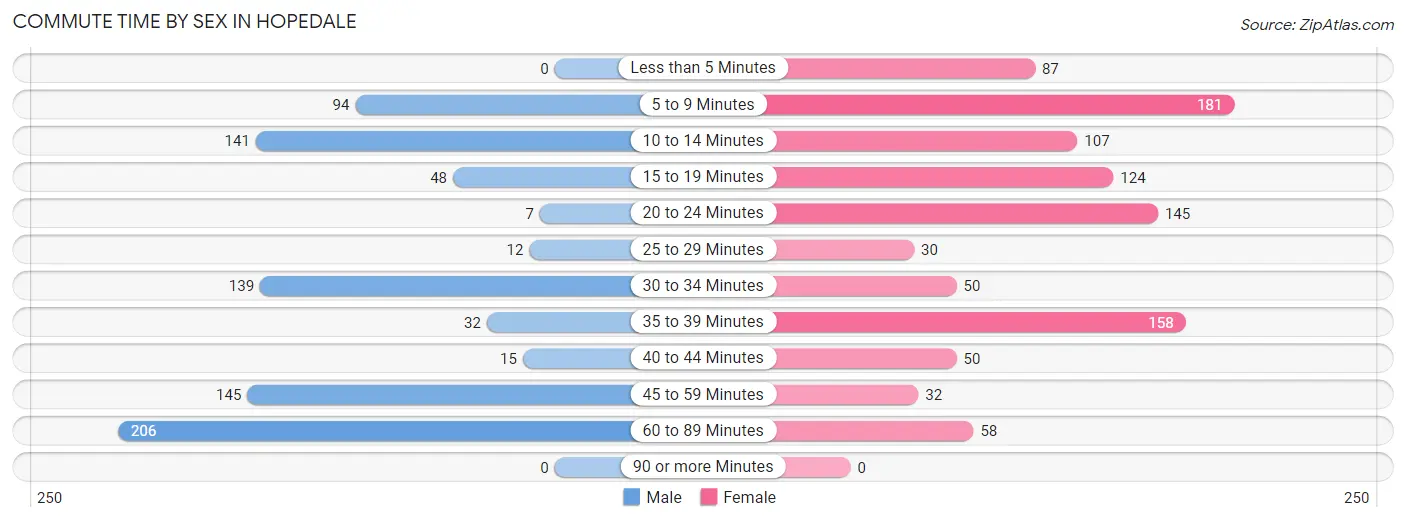
| Commute Time | Male | Female |
| Less than 5 Minutes | 0 (0.0%) | 87 (8.5%) |
| 5 to 9 Minutes | 94 (11.2%) | 181 (17.7%) |
| 10 to 14 Minutes | 141 (16.8%) | 107 (10.5%) |
| 15 to 19 Minutes | 48 (5.7%) | 124 (12.1%) |
| 20 to 24 Minutes | 7 (0.8%) | 145 (14.2%) |
| 25 to 29 Minutes | 12 (1.4%) | 30 (2.9%) |
| 30 to 34 Minutes | 139 (16.6%) | 50 (4.9%) |
| 35 to 39 Minutes | 32 (3.8%) | 158 (15.5%) |
| 40 to 44 Minutes | 15 (1.8%) | 50 (4.9%) |
| 45 to 59 Minutes | 145 (17.3%) | 32 (3.1%) |
| 60 to 89 Minutes | 206 (24.5%) | 58 (5.7%) |
| 90 or more Minutes | 0 (0.0%) | 0 (0.0%) |
Time of Departure to Work by Sex in Hopedale
The most frequent times of departure to work in Hopedale are 5:30 AM to 5:59 AM (173, 20.6%) for males and 6:00 AM to 6:29 AM (244, 23.9%) for females.
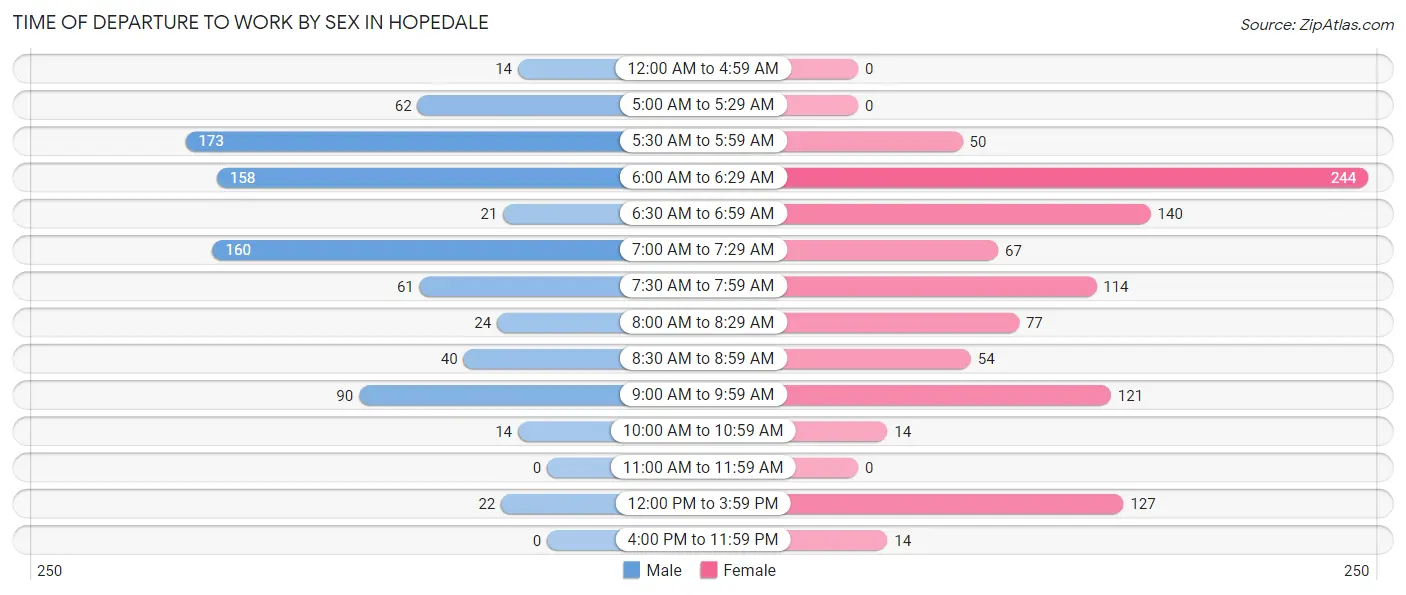
| Time of Departure | Male | Female |
| 12:00 AM to 4:59 AM | 14 (1.7%) | 0 (0.0%) |
| 5:00 AM to 5:29 AM | 62 (7.4%) | 0 (0.0%) |
| 5:30 AM to 5:59 AM | 173 (20.6%) | 50 (4.9%) |
| 6:00 AM to 6:29 AM | 158 (18.8%) | 244 (23.9%) |
| 6:30 AM to 6:59 AM | 21 (2.5%) | 140 (13.7%) |
| 7:00 AM to 7:29 AM | 160 (19.1%) | 67 (6.6%) |
| 7:30 AM to 7:59 AM | 61 (7.3%) | 114 (11.2%) |
| 8:00 AM to 8:29 AM | 24 (2.9%) | 77 (7.5%) |
| 8:30 AM to 8:59 AM | 40 (4.8%) | 54 (5.3%) |
| 9:00 AM to 9:59 AM | 90 (10.7%) | 121 (11.8%) |
| 10:00 AM to 10:59 AM | 14 (1.7%) | 14 (1.4%) |
| 11:00 AM to 11:59 AM | 0 (0.0%) | 0 (0.0%) |
| 12:00 PM to 3:59 PM | 22 (2.6%) | 127 (12.4%) |
| 4:00 PM to 11:59 PM | 0 (0.0%) | 14 (1.4%) |
| Total | 839 (100.0%) | 1,022 (100.0%) |
Housing Occupancy in Hopedale
Occupancy by Ownership in Hopedale
Of the total 1,511 dwellings in Hopedale, owner-occupied units account for 1,102 (72.9%), while renter-occupied units make up 409 (27.1%).
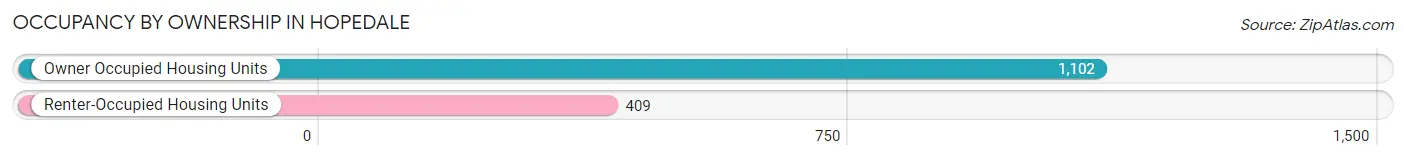
| Occupancy | # Housing Units | % Housing Units |
| Owner Occupied Housing Units | 1,102 | 72.9% |
| Renter-Occupied Housing Units | 409 | 27.1% |
| Total Occupied Housing Units | 1,511 | 100.0% |
Occupancy by Household Size in Hopedale
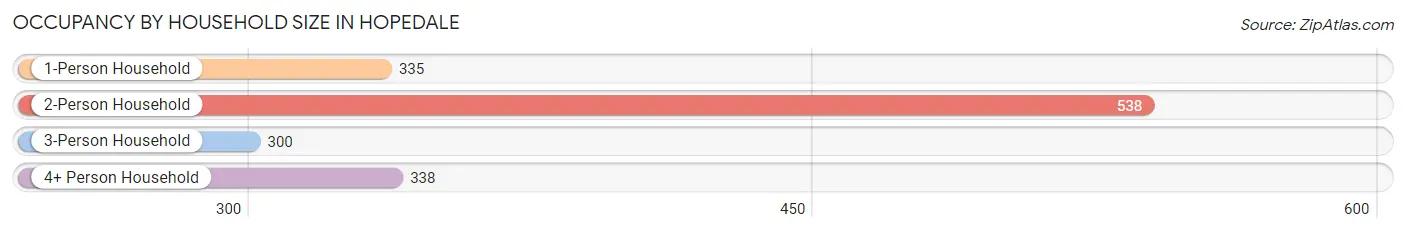
| Household Size | # Housing Units | % Housing Units |
| 1-Person Household | 335 | 22.2% |
| 2-Person Household | 538 | 35.6% |
| 3-Person Household | 300 | 19.9% |
| 4+ Person Household | 338 | 22.4% |
| Total Housing Units | 1,511 | 100.0% |
Occupancy by Ownership by Household Size in Hopedale
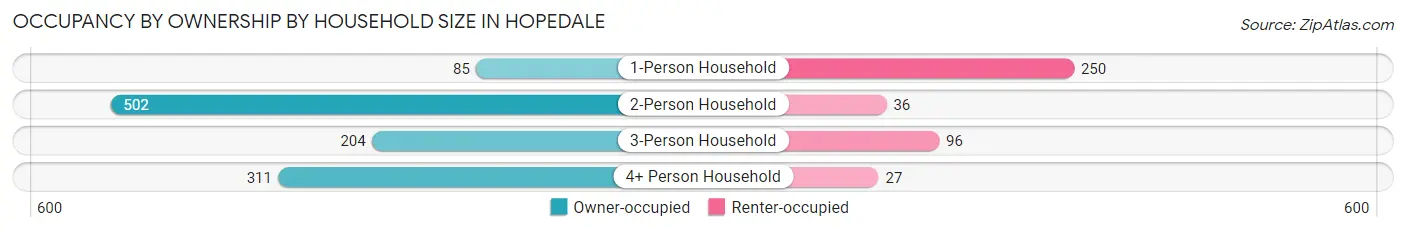
| Household Size | Owner-occupied | Renter-occupied |
| 1-Person Household | 85 (25.4%) | 250 (74.6%) |
| 2-Person Household | 502 (93.3%) | 36 (6.7%) |
| 3-Person Household | 204 (68.0%) | 96 (32.0%) |
| 4+ Person Household | 311 (92.0%) | 27 (8.0%) |
| Total Housing Units | 1,102 (72.9%) | 409 (27.1%) |
Occupancy by Educational Attainment in Hopedale
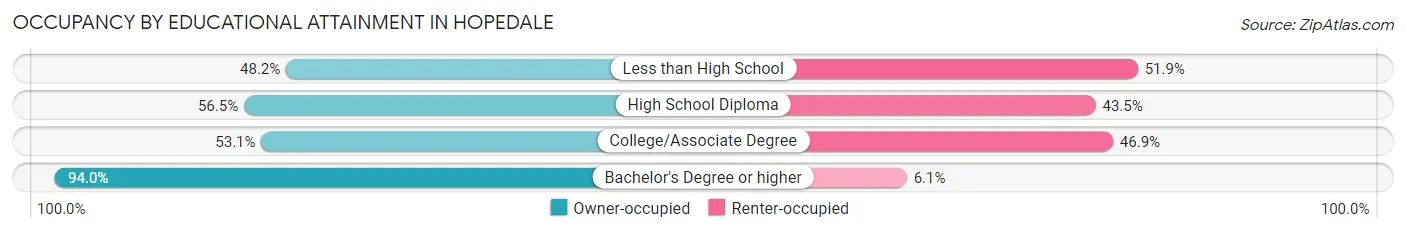
| Household Size | Owner-occupied | Renter-occupied |
| Less than High School | 26 (48.1%) | 28 (51.8%) |
| High School Diploma | 200 (56.5%) | 154 (43.5%) |
| College/Associate Degree | 208 (53.1%) | 184 (46.9%) |
| Bachelor's Degree or higher | 668 (94.0%) | 43 (6.0%) |
Occupancy by Age of Householder in Hopedale
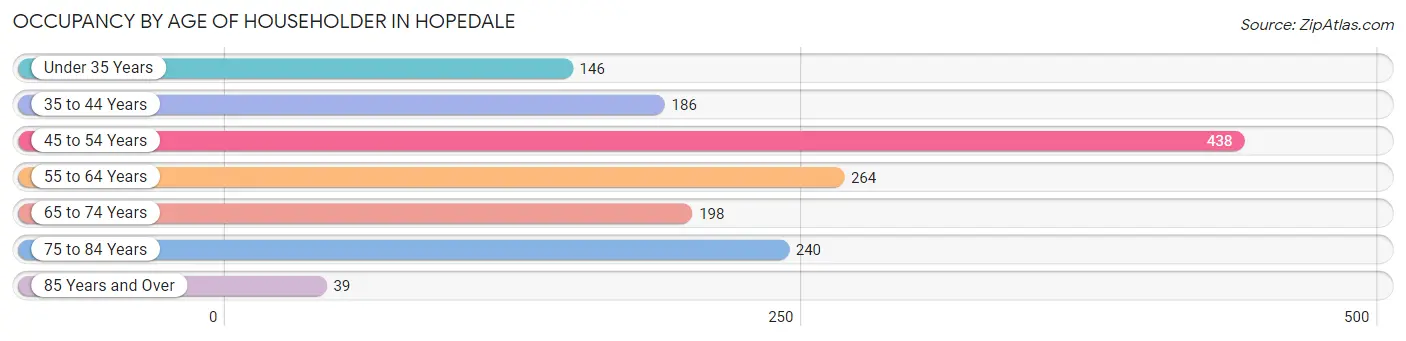
| Age Bracket | # Households | % Households |
| Under 35 Years | 146 | 9.7% |
| 35 to 44 Years | 186 | 12.3% |
| 45 to 54 Years | 438 | 29.0% |
| 55 to 64 Years | 264 | 17.5% |
| 65 to 74 Years | 198 | 13.1% |
| 75 to 84 Years | 240 | 15.9% |
| 85 Years and Over | 39 | 2.6% |
| Total | 1,511 | 100.0% |
Housing Finances in Hopedale
Median Income by Occupancy in Hopedale
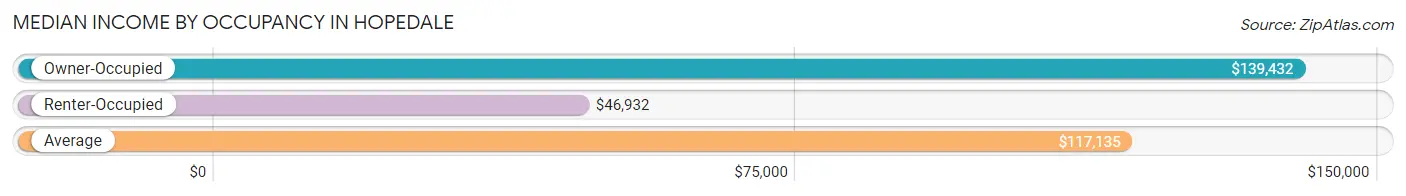
| Occupancy Type | # Households | Median Income |
| Owner-Occupied | 1,102 (72.9%) | $139,432 |
| Renter-Occupied | 409 (27.1%) | $46,932 |
| Average | 1,511 (100.0%) | $117,135 |
Occupancy by Householder Income Bracket in Hopedale
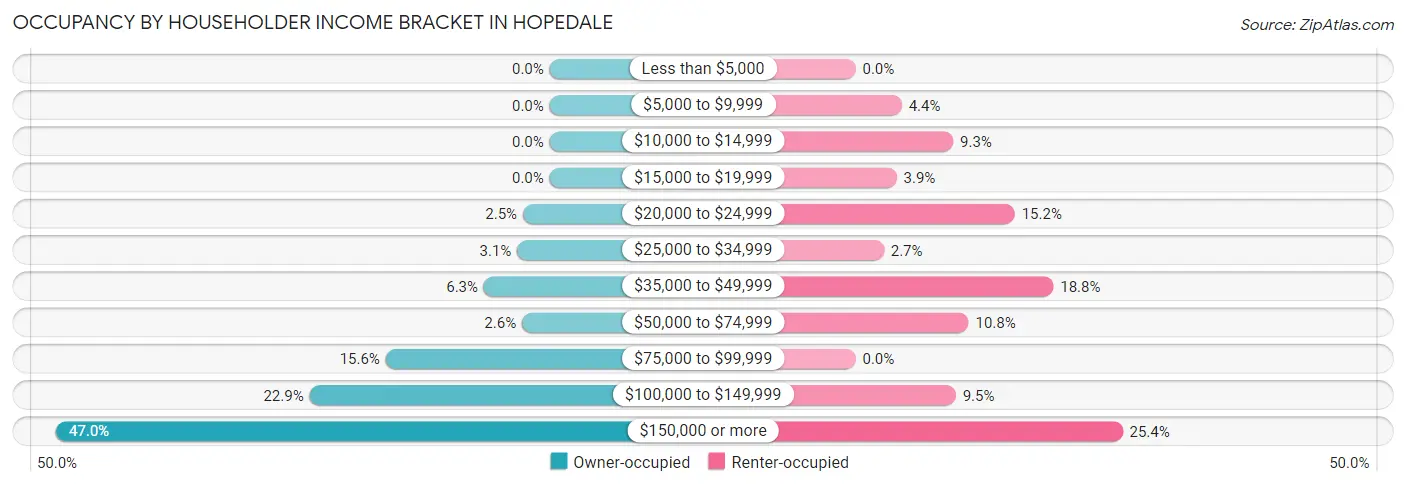
| Income Bracket | Owner-occupied | Renter-occupied |
| Less than $5,000 | 0 (0.0%) | 0 (0.0%) |
| $5,000 to $9,999 | 0 (0.0%) | 18 (4.4%) |
| $10,000 to $14,999 | 0 (0.0%) | 38 (9.3%) |
| $15,000 to $19,999 | 0 (0.0%) | 16 (3.9%) |
| $20,000 to $24,999 | 28 (2.5%) | 62 (15.2%) |
| $25,000 to $34,999 | 34 (3.1%) | 11 (2.7%) |
| $35,000 to $49,999 | 69 (6.3%) | 77 (18.8%) |
| $50,000 to $74,999 | 29 (2.6%) | 44 (10.8%) |
| $75,000 to $99,999 | 172 (15.6%) | 0 (0.0%) |
| $100,000 to $149,999 | 252 (22.9%) | 39 (9.5%) |
| $150,000 or more | 518 (47.0%) | 104 (25.4%) |
| Total | 1,102 (100.0%) | 409 (100.0%) |
Monthly Housing Cost Tiers in Hopedale
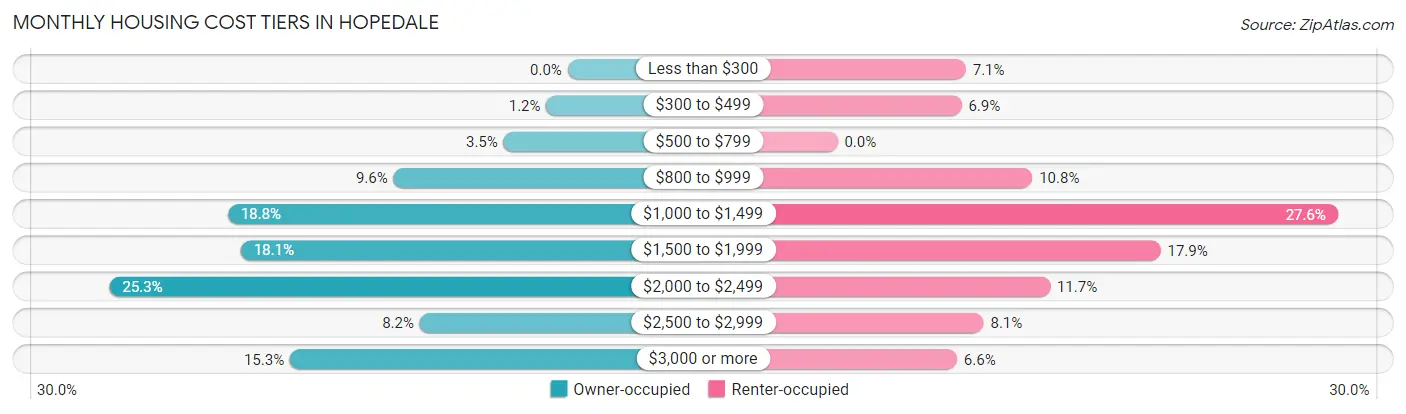
| Monthly Cost | Owner-occupied | Renter-occupied |
| Less than $300 | 0 (0.0%) | 29 (7.1%) |
| $300 to $499 | 13 (1.2%) | 28 (6.9%) |
| $500 to $799 | 39 (3.5%) | 0 (0.0%) |
| $800 to $999 | 106 (9.6%) | 44 (10.8%) |
| $1,000 to $1,499 | 207 (18.8%) | 113 (27.6%) |
| $1,500 to $1,999 | 199 (18.1%) | 73 (17.8%) |
| $2,000 to $2,499 | 279 (25.3%) | 48 (11.7%) |
| $2,500 to $2,999 | 90 (8.2%) | 33 (8.1%) |
| $3,000 or more | 169 (15.3%) | 27 (6.6%) |
| Total | 1,102 (100.0%) | 409 (100.0%) |
Physical Housing Characteristics in Hopedale
Housing Structures in Hopedale
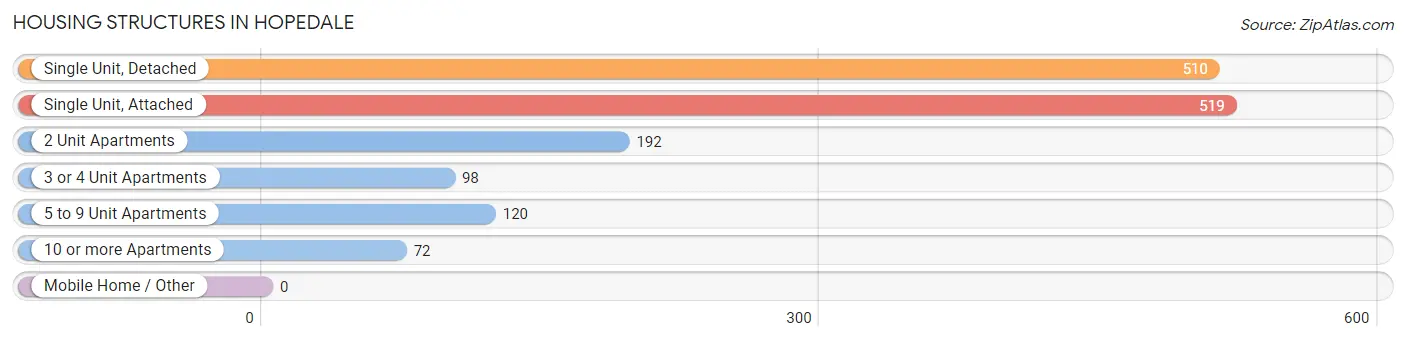
| Structure Type | # Housing Units | % Housing Units |
| Single Unit, Detached | 510 | 33.8% |
| Single Unit, Attached | 519 | 34.4% |
| 2 Unit Apartments | 192 | 12.7% |
| 3 or 4 Unit Apartments | 98 | 6.5% |
| 5 to 9 Unit Apartments | 120 | 7.9% |
| 10 or more Apartments | 72 | 4.8% |
| Mobile Home / Other | 0 | 0.0% |
| Total | 1,511 | 100.0% |
Housing Structures by Occupancy in Hopedale
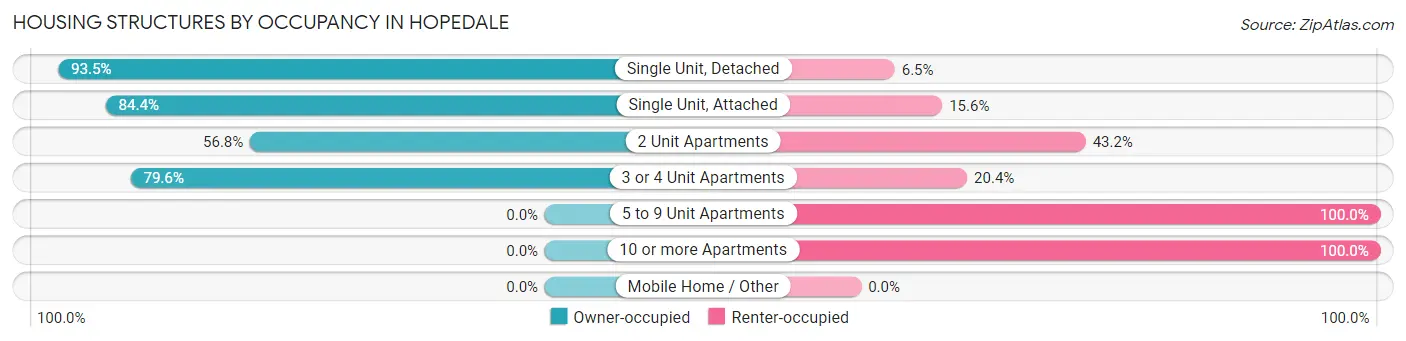
| Structure Type | Owner-occupied | Renter-occupied |
| Single Unit, Detached | 477 (93.5%) | 33 (6.5%) |
| Single Unit, Attached | 438 (84.4%) | 81 (15.6%) |
| 2 Unit Apartments | 109 (56.8%) | 83 (43.2%) |
| 3 or 4 Unit Apartments | 78 (79.6%) | 20 (20.4%) |
| 5 to 9 Unit Apartments | 0 (0.0%) | 120 (100.0%) |
| 10 or more Apartments | 0 (0.0%) | 72 (100.0%) |
| Mobile Home / Other | 0 (0.0%) | 0 (0.0%) |
| Total | 1,102 (72.9%) | 409 (27.1%) |
Housing Structures by Number of Rooms in Hopedale
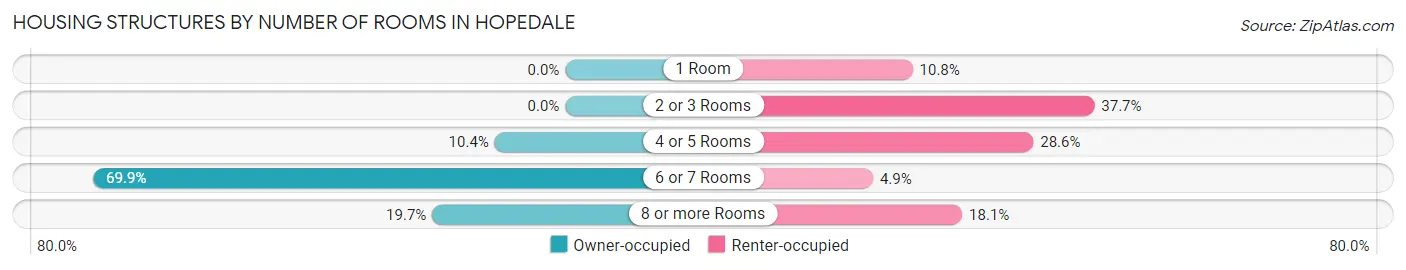
| Number of Rooms | Owner-occupied | Renter-occupied |
| 1 Room | 0 (0.0%) | 44 (10.8%) |
| 2 or 3 Rooms | 0 (0.0%) | 154 (37.7%) |
| 4 or 5 Rooms | 115 (10.4%) | 117 (28.6%) |
| 6 or 7 Rooms | 770 (69.9%) | 20 (4.9%) |
| 8 or more Rooms | 217 (19.7%) | 74 (18.1%) |
| Total | 1,102 (100.0%) | 409 (100.0%) |
Housing Structure by Heating Type in Hopedale
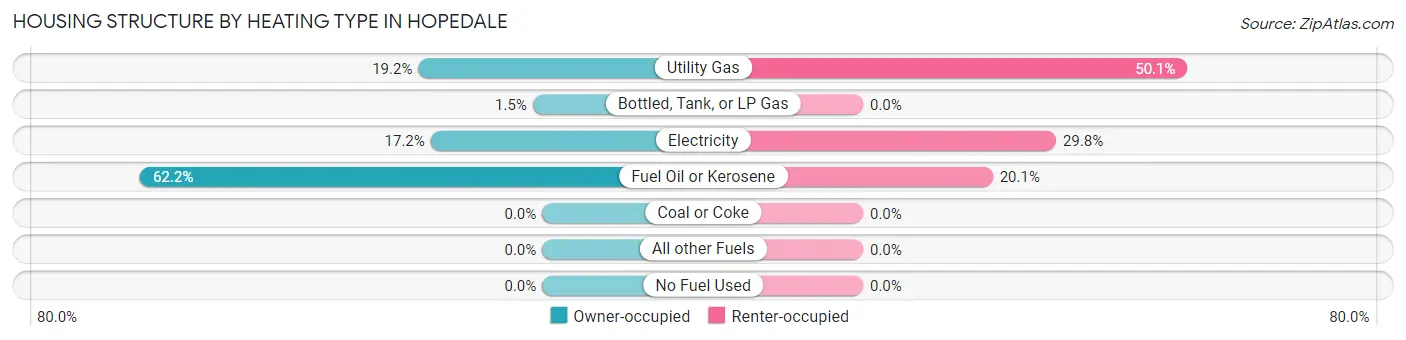
| Heating Type | Owner-occupied | Renter-occupied |
| Utility Gas | 211 (19.2%) | 205 (50.1%) |
| Bottled, Tank, or LP Gas | 16 (1.5%) | 0 (0.0%) |
| Electricity | 190 (17.2%) | 122 (29.8%) |
| Fuel Oil or Kerosene | 685 (62.2%) | 82 (20.1%) |
| Coal or Coke | 0 (0.0%) | 0 (0.0%) |
| All other Fuels | 0 (0.0%) | 0 (0.0%) |
| No Fuel Used | 0 (0.0%) | 0 (0.0%) |
| Total | 1,102 (100.0%) | 409 (100.0%) |
Household Vehicle Usage in Hopedale
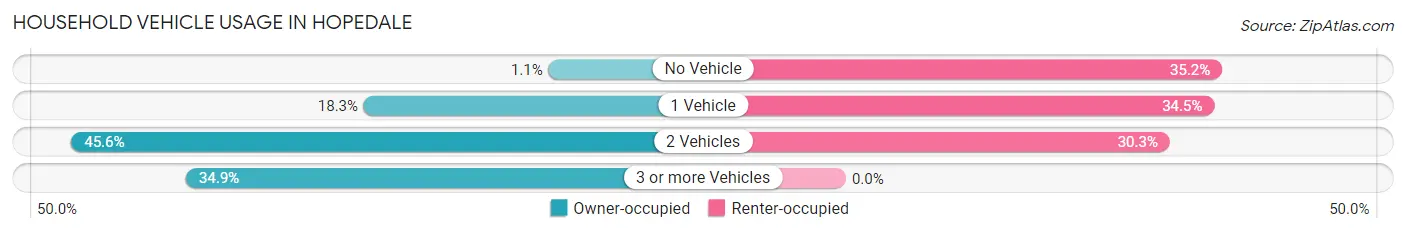
| Vehicles per Household | Owner-occupied | Renter-occupied |
| No Vehicle | 12 (1.1%) | 144 (35.2%) |
| 1 Vehicle | 202 (18.3%) | 141 (34.5%) |
| 2 Vehicles | 503 (45.6%) | 124 (30.3%) |
| 3 or more Vehicles | 385 (34.9%) | 0 (0.0%) |
| Total | 1,102 (100.0%) | 409 (100.0%) |
Real Estate & Mortgages in Hopedale
Real Estate and Mortgage Overview in Hopedale
| Characteristic | Without Mortgage | With Mortgage |
| Housing Units | 442 | 660 |
| Median Property Value | $352,900 | $396,900 |
| Median Household Income | $113,846 | $363 |
| Monthly Housing Costs | $1,309 | $169 |
| Real Estate Taxes | $4,988 | $0 |
Property Value by Mortgage Status in Hopedale
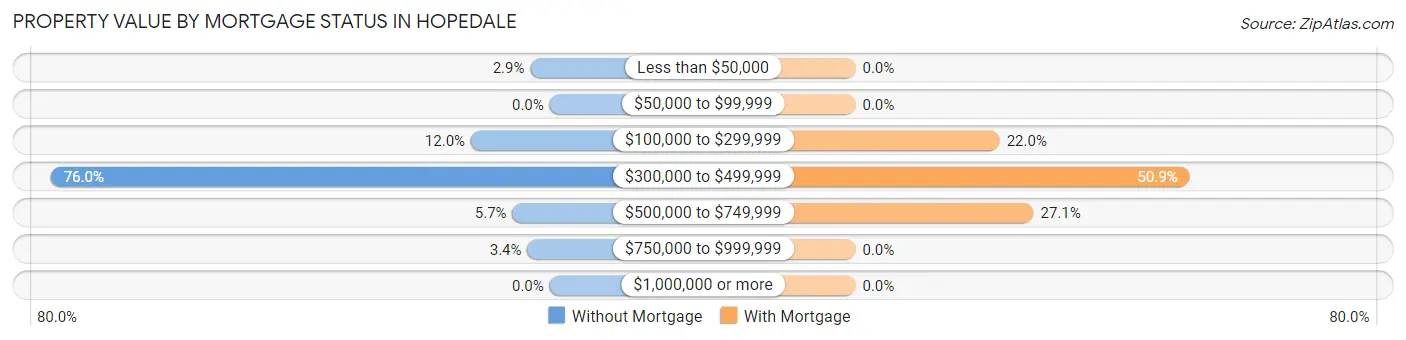
| Property Value | Without Mortgage | With Mortgage |
| Less than $50,000 | 13 (2.9%) | 0 (0.0%) |
| $50,000 to $99,999 | 0 (0.0%) | 0 (0.0%) |
| $100,000 to $299,999 | 53 (12.0%) | 145 (22.0%) |
| $300,000 to $499,999 | 336 (76.0%) | 336 (50.9%) |
| $500,000 to $749,999 | 25 (5.7%) | 179 (27.1%) |
| $750,000 to $999,999 | 15 (3.4%) | 0 (0.0%) |
| $1,000,000 or more | 0 (0.0%) | 0 (0.0%) |
| Total | 442 (100.0%) | 660 (100.0%) |
Household Income by Mortgage Status in Hopedale
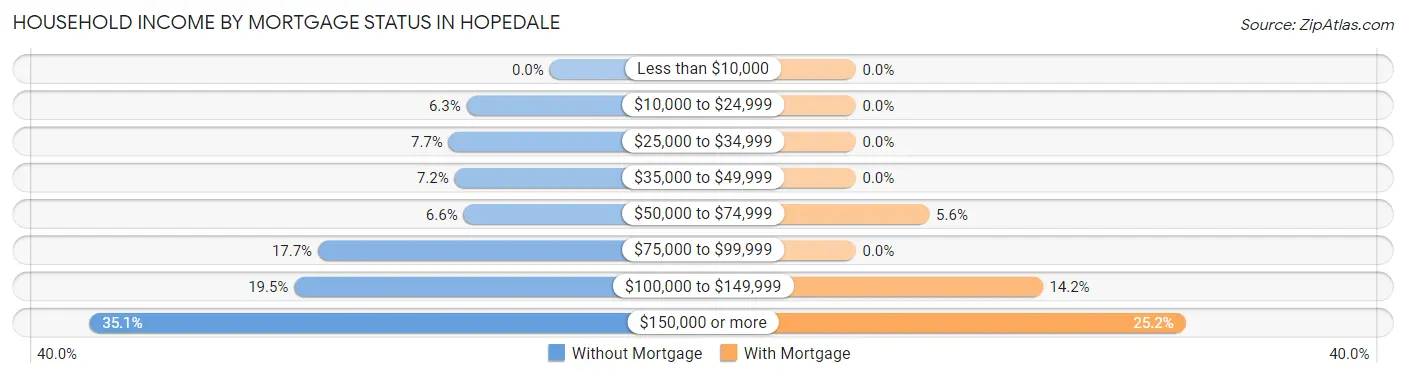
| Household Income | Without Mortgage | With Mortgage |
| Less than $10,000 | 0 (0.0%) | 0 (0.0%) |
| $10,000 to $24,999 | 28 (6.3%) | 0 (0.0%) |
| $25,000 to $34,999 | 34 (7.7%) | 0 (0.0%) |
| $35,000 to $49,999 | 32 (7.2%) | 0 (0.0%) |
| $50,000 to $74,999 | 29 (6.6%) | 37 (5.6%) |
| $75,000 to $99,999 | 78 (17.6%) | 0 (0.0%) |
| $100,000 to $149,999 | 86 (19.5%) | 94 (14.2%) |
| $150,000 or more | 155 (35.1%) | 166 (25.2%) |
| Total | 442 (100.0%) | 660 (100.0%) |
Property Value to Household Income Ratio in Hopedale
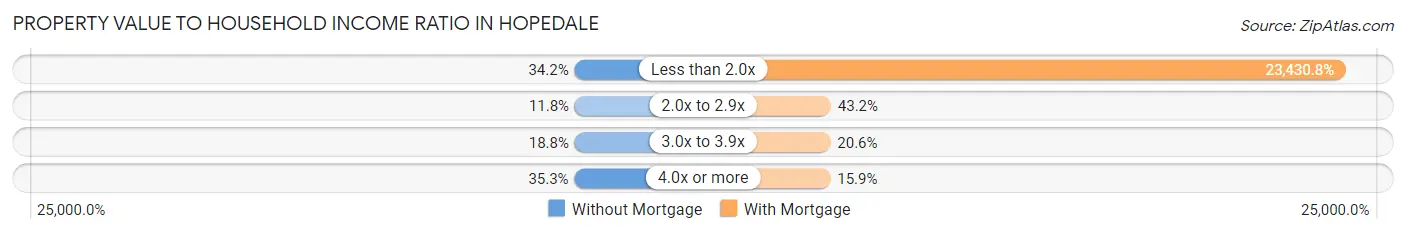
| Value-to-Income Ratio | Without Mortgage | With Mortgage |
| Less than 2.0x | 151 (34.2%) | 154,643 (23,430.8%) |
| 2.0x to 2.9x | 52 (11.8%) | 285 (43.2%) |
| 3.0x to 3.9x | 83 (18.8%) | 136 (20.6%) |
| 4.0x or more | 156 (35.3%) | 105 (15.9%) |
| Total | 442 (100.0%) | 660 (100.0%) |
Real Estate Taxes by Mortgage Status in Hopedale
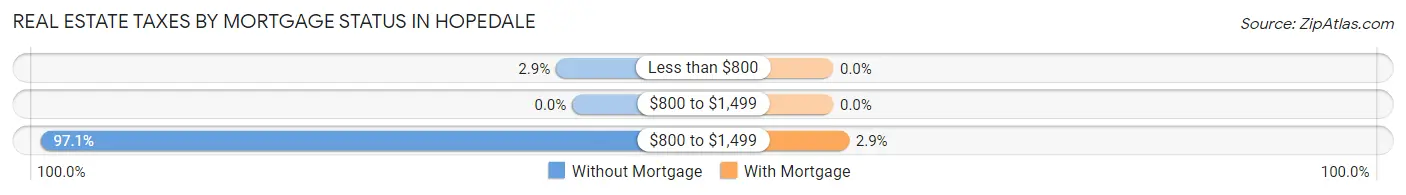
| Property Taxes | Without Mortgage | With Mortgage |
| Less than $800 | 13 (2.9%) | 0 (0.0%) |
| $800 to $1,499 | 0 (0.0%) | 0 (0.0%) |
| $800 to $1,499 | 429 (97.1%) | 19 (2.9%) |
| Total | 442 (100.0%) | 660 (100.0%) |
Health & Disability in Hopedale
Health Insurance Coverage by Age in Hopedale
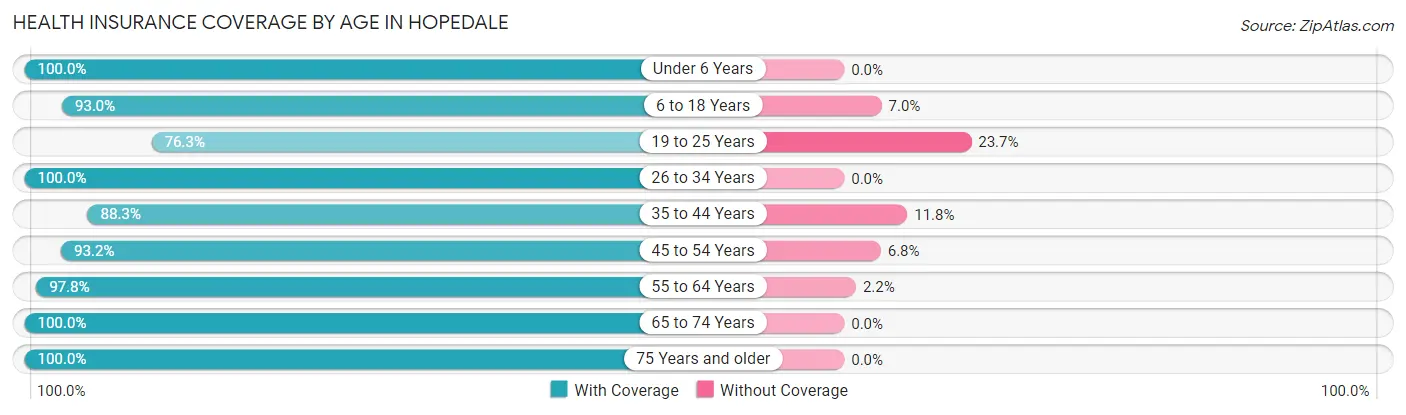
| Age Bracket | With Coverage | Without Coverage |
| Under 6 Years | 41 (100.0%) | 0 (0.0%) |
| 6 to 18 Years | 909 (93.0%) | 68 (7.0%) |
| 19 to 25 Years | 319 (76.3%) | 99 (23.7%) |
| 26 to 34 Years | 380 (100.0%) | 0 (0.0%) |
| 35 to 44 Years | 308 (88.2%) | 41 (11.7%) |
| 45 to 54 Years | 753 (93.2%) | 55 (6.8%) |
| 55 to 64 Years | 449 (97.8%) | 10 (2.2%) |
| 65 to 74 Years | 342 (100.0%) | 0 (0.0%) |
| 75 Years and older | 356 (100.0%) | 0 (0.0%) |
| Total | 3,857 (93.4%) | 273 (6.6%) |
Health Insurance Coverage by Citizenship Status in Hopedale
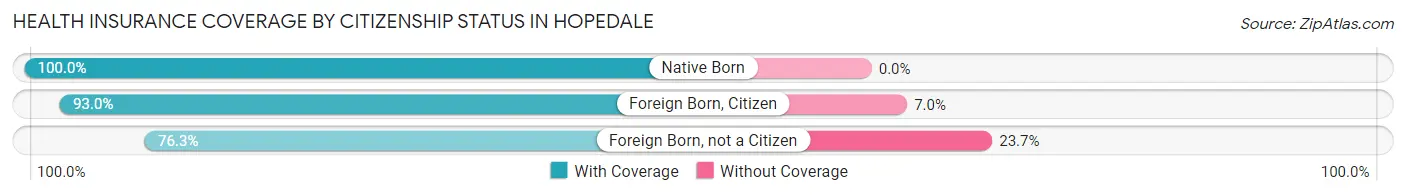
| Citizenship Status | With Coverage | Without Coverage |
| Native Born | 41 (100.0%) | 0 (0.0%) |
| Foreign Born, Citizen | 909 (93.0%) | 68 (7.0%) |
| Foreign Born, not a Citizen | 319 (76.3%) | 99 (23.7%) |
Health Insurance Coverage by Household Income in Hopedale
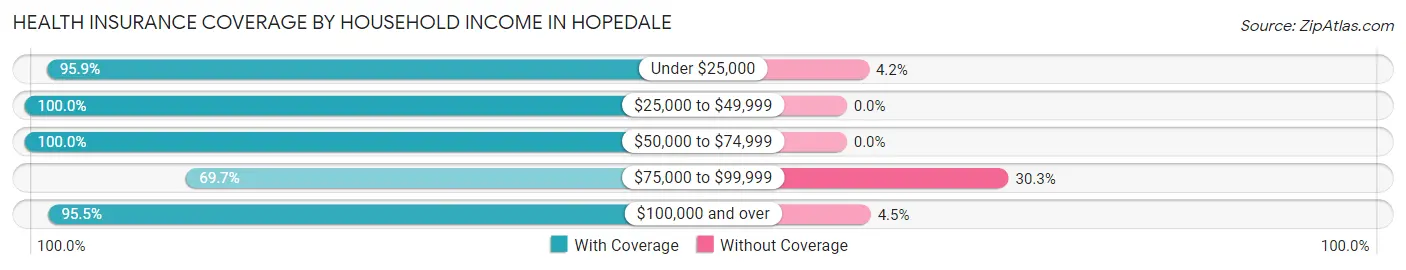
| Household Income | With Coverage | Without Coverage |
| Under $25,000 | 231 (95.9%) | 10 (4.2%) |
| $25,000 to $49,999 | 299 (100.0%) | 0 (0.0%) |
| $50,000 to $74,999 | 101 (100.0%) | 0 (0.0%) |
| $75,000 to $99,999 | 292 (69.7%) | 127 (30.3%) |
| $100,000 and over | 2,898 (95.5%) | 136 (4.5%) |
Public vs Private Health Insurance Coverage by Age in Hopedale
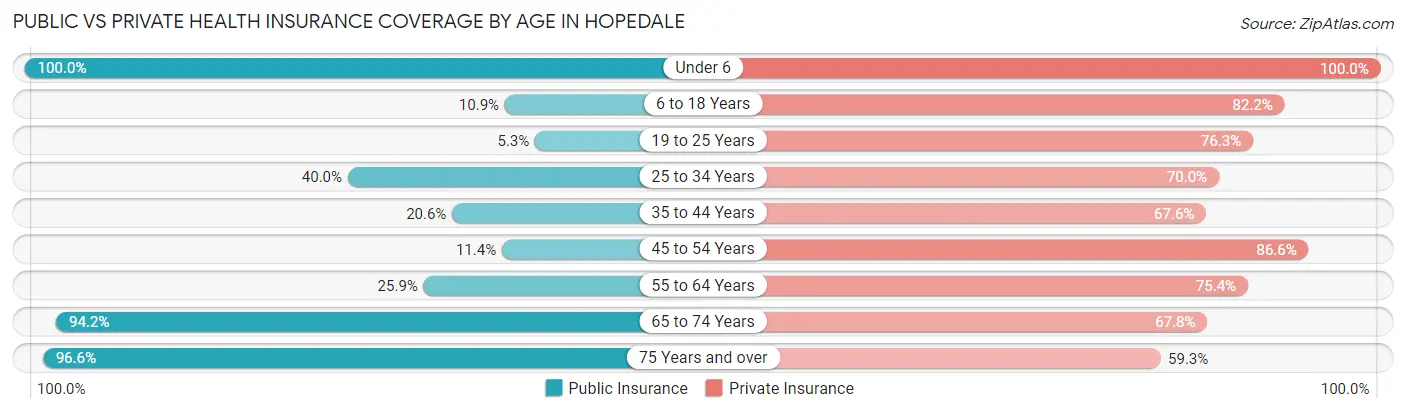
| Age Bracket | Public Insurance | Private Insurance |
| Under 6 | 41 (100.0%) | 41 (100.0%) |
| 6 to 18 Years | 106 (10.8%) | 803 (82.2%) |
| 19 to 25 Years | 22 (5.3%) | 319 (76.3%) |
| 25 to 34 Years | 152 (40.0%) | 266 (70.0%) |
| 35 to 44 Years | 72 (20.6%) | 236 (67.6%) |
| 45 to 54 Years | 92 (11.4%) | 700 (86.6%) |
| 55 to 64 Years | 119 (25.9%) | 346 (75.4%) |
| 65 to 74 Years | 322 (94.2%) | 232 (67.8%) |
| 75 Years and over | 344 (96.6%) | 211 (59.3%) |
| Total | 1,270 (30.7%) | 3,154 (76.4%) |
Disability Status by Sex by Age in Hopedale
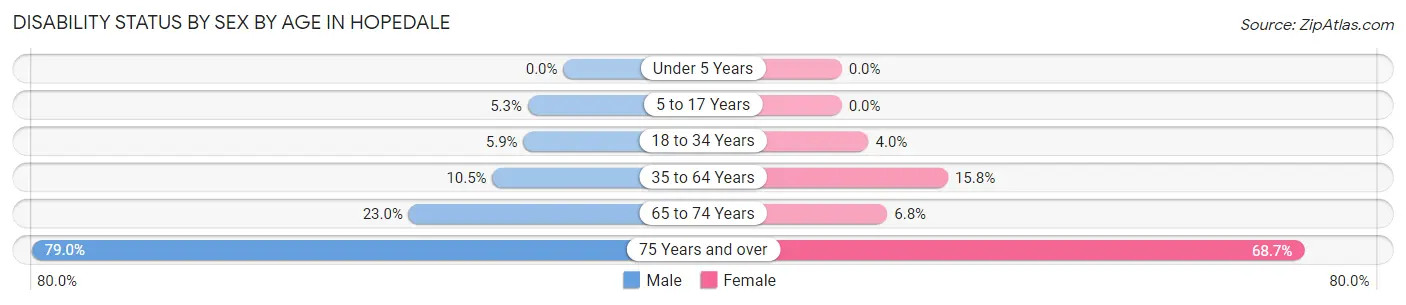
| Age Bracket | Male | Female |
| Under 5 Years | 0 (0.0%) | 0 (0.0%) |
| 5 to 17 Years | 16 (5.3%) | 0 (0.0%) |
| 18 to 34 Years | 16 (5.9%) | 21 (4.0%) |
| 35 to 64 Years | 86 (10.5%) | 126 (15.8%) |
| 65 to 74 Years | 31 (23.0%) | 14 (6.8%) |
| 75 Years and over | 135 (78.9%) | 127 (68.6%) |
Disability Class by Sex by Age in Hopedale
Disability Class: Hearing Difficulty
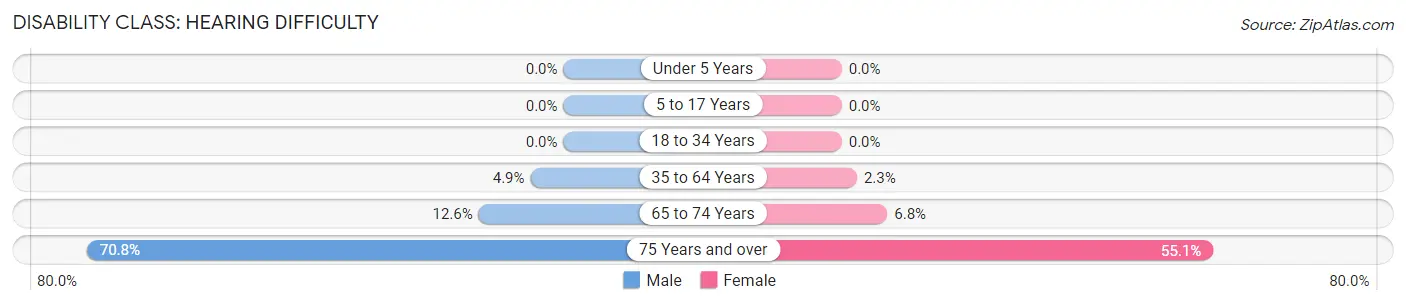
| Age Bracket | Male | Female |
| Under 5 Years | 0 (0.0%) | 0 (0.0%) |
| 5 to 17 Years | 0 (0.0%) | 0 (0.0%) |
| 18 to 34 Years | 0 (0.0%) | 0 (0.0%) |
| 35 to 64 Years | 40 (4.9%) | 18 (2.2%) |
| 65 to 74 Years | 17 (12.6%) | 14 (6.8%) |
| 75 Years and over | 121 (70.8%) | 102 (55.1%) |
Disability Class: Vision Difficulty
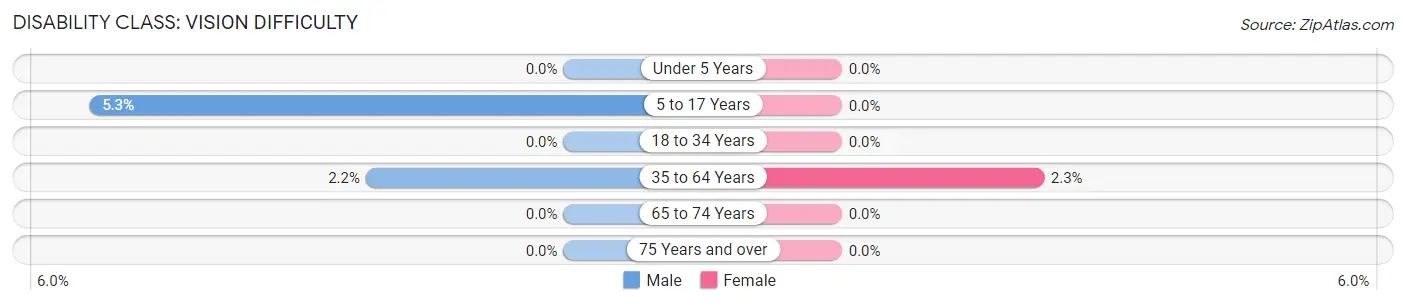
| Age Bracket | Male | Female |
| Under 5 Years | 0 (0.0%) | 0 (0.0%) |
| 5 to 17 Years | 16 (5.3%) | 0 (0.0%) |
| 18 to 34 Years | 0 (0.0%) | 0 (0.0%) |
| 35 to 64 Years | 18 (2.2%) | 18 (2.2%) |
| 65 to 74 Years | 0 (0.0%) | 0 (0.0%) |
| 75 Years and over | 0 (0.0%) | 0 (0.0%) |
Disability Class: Cognitive Difficulty
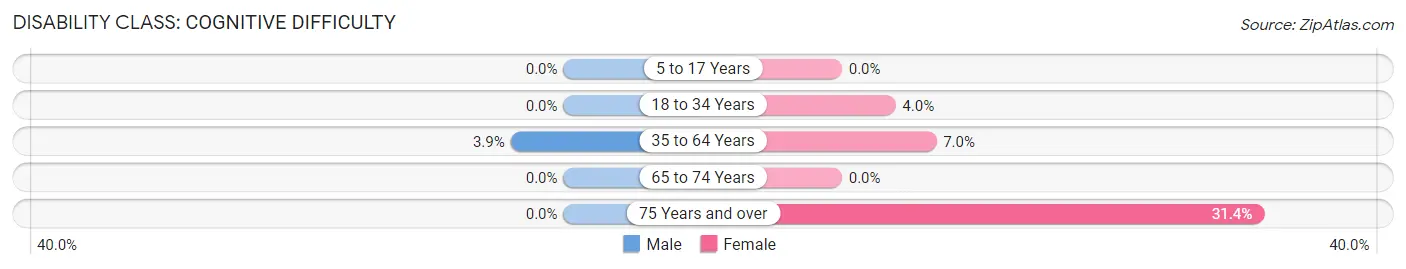
| Age Bracket | Male | Female |
| 5 to 17 Years | 0 (0.0%) | 0 (0.0%) |
| 18 to 34 Years | 0 (0.0%) | 21 (4.0%) |
| 35 to 64 Years | 32 (3.9%) | 56 (7.0%) |
| 65 to 74 Years | 0 (0.0%) | 0 (0.0%) |
| 75 Years and over | 0 (0.0%) | 58 (31.4%) |
Disability Class: Ambulatory Difficulty
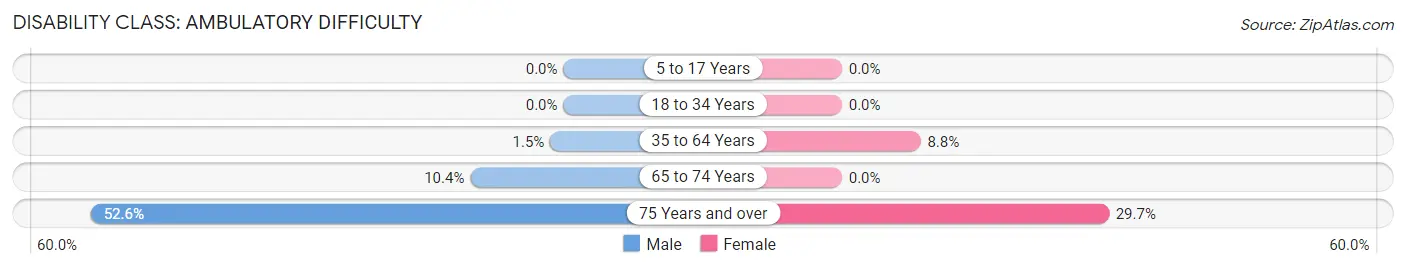
| Age Bracket | Male | Female |
| 5 to 17 Years | 0 (0.0%) | 0 (0.0%) |
| 18 to 34 Years | 0 (0.0%) | 0 (0.0%) |
| 35 to 64 Years | 12 (1.5%) | 70 (8.8%) |
| 65 to 74 Years | 14 (10.4%) | 0 (0.0%) |
| 75 Years and over | 90 (52.6%) | 55 (29.7%) |
Disability Class: Self-Care Difficulty
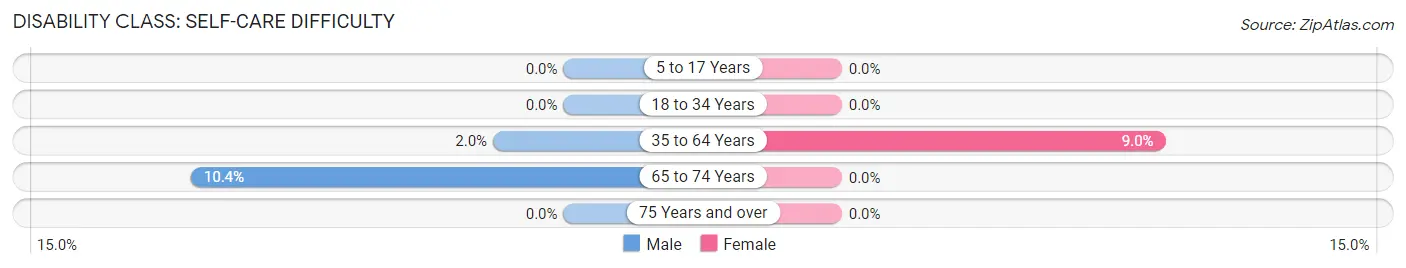
| Age Bracket | Male | Female |
| 5 to 17 Years | 0 (0.0%) | 0 (0.0%) |
| 18 to 34 Years | 0 (0.0%) | 0 (0.0%) |
| 35 to 64 Years | 16 (2.0%) | 72 (9.0%) |
| 65 to 74 Years | 14 (10.4%) | 0 (0.0%) |
| 75 Years and over | 0 (0.0%) | 0 (0.0%) |
Technology Access in Hopedale
Computing Device Access in Hopedale
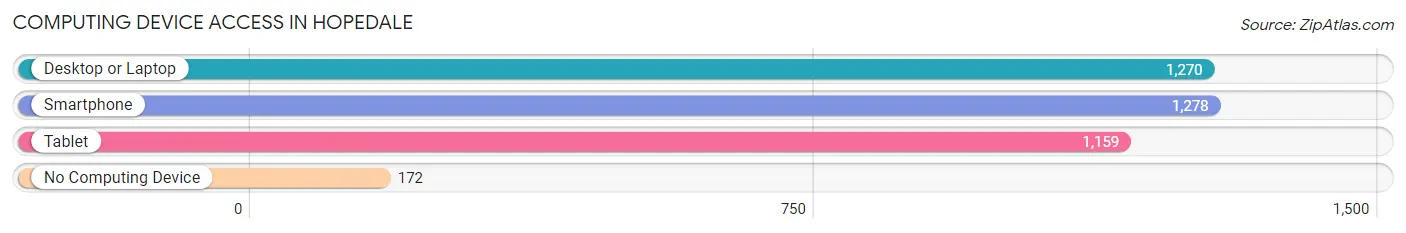
| Device Type | # Households | % Households |
| Desktop or Laptop | 1,270 | 84.1% |
| Smartphone | 1,278 | 84.6% |
| Tablet | 1,159 | 76.7% |
| No Computing Device | 172 | 11.4% |
| Total | 1,511 | 100.0% |
Internet Access in Hopedale
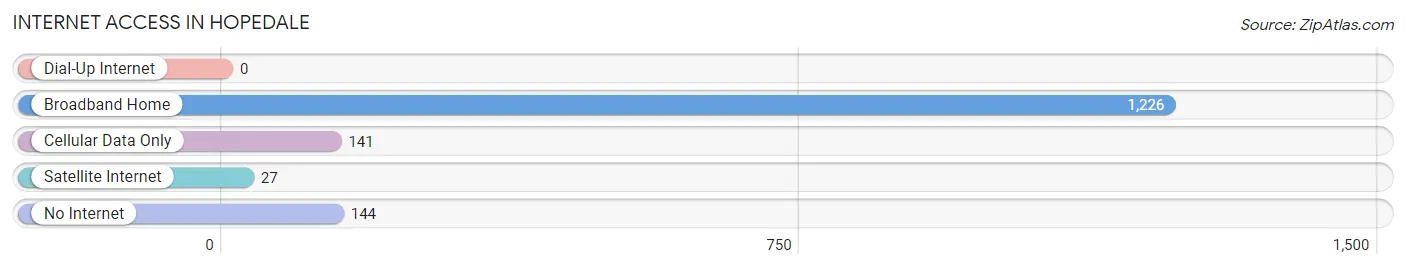
| Internet Type | # Households | % Households |
| Dial-Up Internet | 0 | 0.0% |
| Broadband Home | 1,226 | 81.1% |
| Cellular Data Only | 141 | 9.3% |
| Satellite Internet | 27 | 1.8% |
| No Internet | 144 | 9.5% |
| Total | 1,511 | 100.0% |
Hopedale Summary
Hopedale, Massachusetts is a small town located in the Blackstone Valley region of Worcester County. It is situated on the banks of the Blackstone River, and is bordered by the towns of Mendon, Milford, Upton, and Hopedale. The town has a population of 5,959 as of the 2010 census, and is part of the Greater Boston metropolitan area.
History
Hopedale was first settled in 1660 by John Thayer, who purchased land from the Nipmuc Indians. The town was originally known as “Thayer’s Pond”, and was later renamed “Hopedale” in 1841. The name was chosen to reflect the town’s optimism for the future.
In 1841, the town was incorporated as a separate municipality from Mendon. The town was home to several successful textile mills, which were built along the Blackstone River. The mills were owned by the Draper family, who were prominent in the town’s history. The Drapers were also responsible for the construction of the town’s first public library, which opened in 1871.
The town was also home to the Hopedale Community, a utopian socialist commune founded in 1841 by Adin Ballou. The commune was based on the principles of Christian socialism, and was home to over 200 members at its peak. The commune disbanded in 1856, but the town still retains many of its utopian ideals.
Geography
Hopedale is located in the Blackstone Valley region of Worcester County, Massachusetts. It is situated on the banks of the Blackstone River, and is bordered by the towns of Mendon, Milford, Upton, and Hopedale. The town has a total area of 8.2 square miles, of which 7.9 square miles is land and 0.3 square miles is water.
The town is located in the Blackstone Valley National Heritage Corridor, which is a National Park Service-designated area that includes parts of Massachusetts and Rhode Island. The corridor is home to a variety of historic sites, including the Blackstone River Valley National Heritage Corridor Visitor Center in Worcester.
Economy
Hopedale’s economy is largely based on the textile industry. The town is home to several large textile mills, which are owned by the Draper Corporation. The company is the largest employer in the town, and is responsible for the majority of the town’s economic activity.
The town is also home to several small businesses, including restaurants, retail stores, and professional services. The town is also home to a number of technology companies, including the Hopedale Technology Park.
Demographics
As of the 2010 census, the town had a population of 5,959. The racial makeup of the town was 94.3% White, 1.3% African American, 0.3% Native American, 1.2% Asian, 0.1% Pacific Islander, 1.2% from other races, and 1.7% from two or more races. Hispanic or Latino of any race were 3.2% of the population.
The median income for a household in the town was $68,958, and the median income for a family was $77,917. The per capita income for the town was $30,945. About 4.2% of families and 5.3% of the population were below the poverty line, including 6.2% of those under age 18 and 4.2% of those age 65 or over.
Common Questions
What is Per Capita Income in Hopedale?
Per Capita income in Hopedale is $54,213.
What is the Median Family Income in Hopedale?
Median Family Income in Hopedale is $138,523.
What is the Median Household income in Hopedale?
Median Household Income in Hopedale is $117,135.
What is Income or Wage Gap in Hopedale?
Income or Wage Gap in Hopedale is 52.5%.
Women in Hopedale earn 47.5 cents for every dollar earned by a man.
What is Inequality or Gini Index in Hopedale?
Inequality or Gini Index in Hopedale is 0.39.
What is the Total Population of Hopedale?
Total Population of Hopedale is 4,137.
What is the Total Male Population of Hopedale?
Total Male Population of Hopedale is 1,721.
What is the Total Female Population of Hopedale?
Total Female Population of Hopedale is 2,416.
What is the Ratio of Males per 100 Females in Hopedale?
There are 71.23 Males per 100 Females in Hopedale.
What is the Ratio of Females per 100 Males in Hopedale?
There are 140.38 Females per 100 Males in Hopedale.
What is the Median Population Age in Hopedale?
Median Population Age in Hopedale is 38.9 Years.
What is the Average Family Size in Hopedale
Average Family Size in Hopedale is 3.2 People.
What is the Average Household Size in Hopedale
Average Household Size in Hopedale is 2.7 People.
How Large is the Labor Force in Hopedale?
There are 2,323 People in the Labor Forcein in Hopedale.
What is the Percentage of People in the Labor Force in Hopedale?
70.8% of People are in the Labor Force in Hopedale.
What is the Unemployment Rate in Hopedale?
Unemployment Rate in Hopedale is 5.4%.