Cities with the Highest Percentage of Local Government Employees in Pennsylvania
RELATED REPORTS & OPTIONS
Local Government Employees
Pennsylvania
Compare Cities
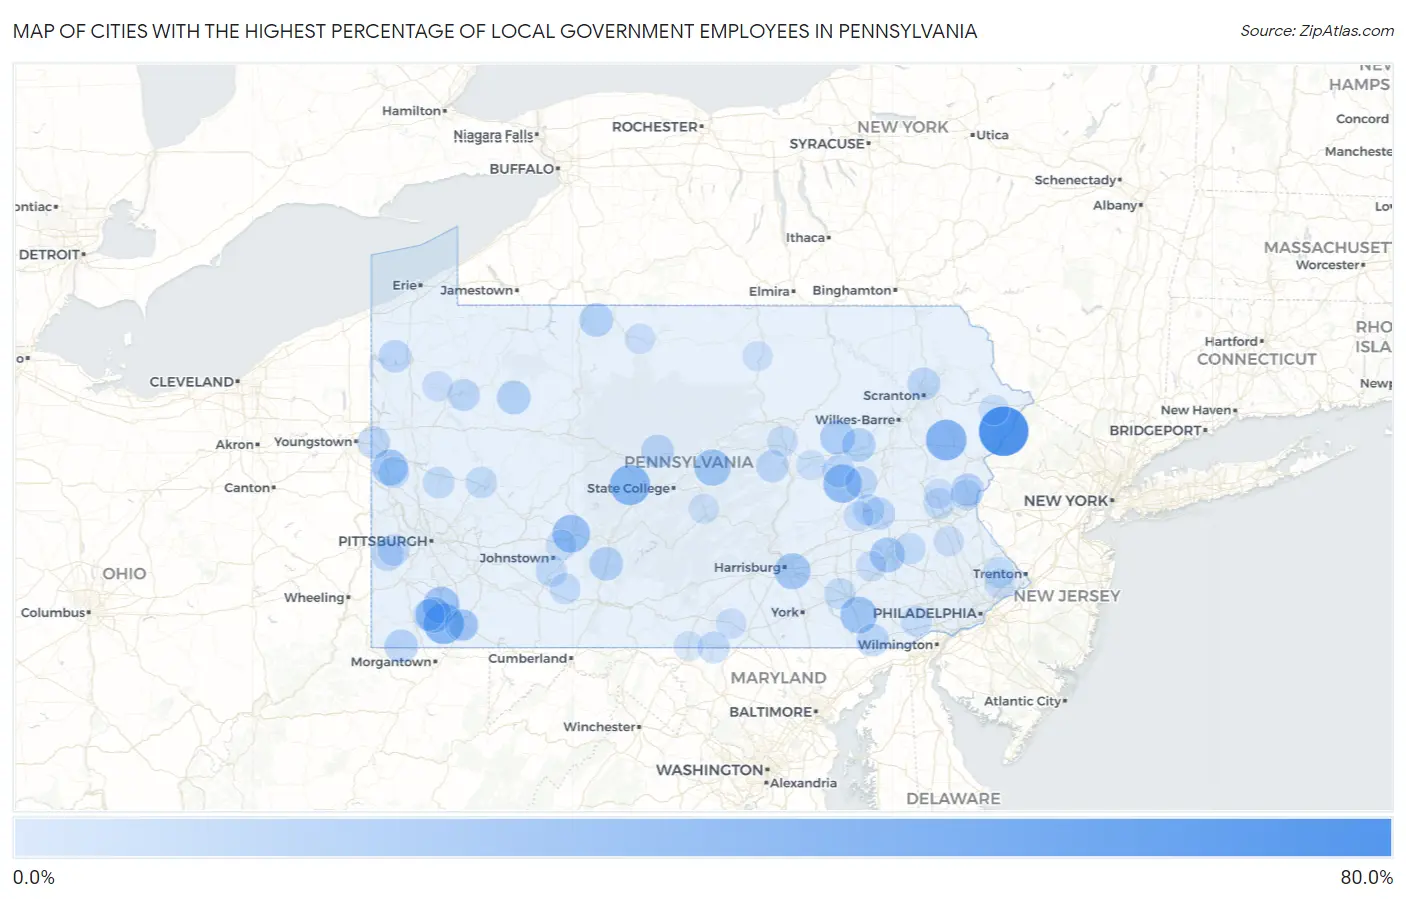
Map of Cities with the Highest Percentage of Local Government Employees in Pennsylvania
0.0%
80.0%
Cities with the Highest Percentage of Local Government Employees in Pennsylvania
| City | % Local Government Employees | vs State | vs National | |
| 1. | Pocono Ranch Lands | 60.7% | 6.0%(+54.7)#1 | 7.2%(+53.4)#164 |
| 2. | Curryville | 40.0% | 6.0%(+34.0)#2 | 7.2%(+32.8)#474 |
| 3. | Pocono Pines | 39.0% | 6.0%(+33.0)#3 | 7.2%(+31.8)#496 |
| 4. | Edenborn | 38.1% | 6.0%(+32.1)#4 | 7.2%(+30.9)#527 |
| 5. | Sandy Ridge | 37.7% | 6.0%(+31.7)#5 | 7.2%(+30.5)#541 |
| 6. | Franklin Forge | 37.5% | 6.0%(+31.5)#6 | 7.2%(+30.3)#554 |
| 7. | Wilburton Number Two | 33.3% | 6.0%(+27.3)#7 | 7.2%(+26.1)#728 |
| 8. | Revloc | 32.0% | 6.0%(+26.0)#8 | 7.2%(+24.8)#784 |
| 9. | Mount Carbon Borough | 31.6% | 6.0%(+25.6)#9 | 7.2%(+24.4)#805 |
| 10. | Refton | 29.5% | 6.0%(+23.5)#10 | 7.2%(+22.3)#930 |
| 11. | Hiller | 29.3% | 6.0%(+23.3)#11 | 7.2%(+22.1)#942 |
| 12. | Madisonburg | 28.6% | 6.0%(+22.6)#12 | 7.2%(+21.3)#983 |
| 13. | Oberlin | 27.8% | 6.0%(+21.8)#13 | 7.2%(+20.6)#1,037 |
| 14. | West Pittsburg | 27.7% | 6.0%(+21.7)#14 | 7.2%(+20.5)#1,045 |
| 15. | Crucible | 27.5% | 6.0%(+21.5)#15 | 7.2%(+20.3)#1,057 |
| 16. | Laporte Borough | 27.3% | 6.0%(+21.3)#16 | 7.2%(+20.0)#1,078 |
| 17. | New Boston | 25.8% | 6.0%(+19.8)#17 | 7.2%(+18.6)#1,211 |
| 18. | Colony Park | 25.4% | 6.0%(+19.4)#18 | 7.2%(+18.1)#1,252 |
| 19. | Rohrsburg | 24.6% | 6.0%(+18.6)#19 | 7.2%(+17.4)#1,346 |
| 20. | Port Allegany Borough | 23.9% | 6.0%(+18.0)#20 | 7.2%(+16.7)#1,406 |
| 21. | Landingville Borough | 23.9% | 6.0%(+17.9)#21 | 7.2%(+16.7)#1,413 |
| 22. | Woolrich | 23.0% | 6.0%(+17.0)#22 | 7.2%(+15.8)#1,530 |
| 23. | Callimont Borough | 22.7% | 6.0%(+16.7)#23 | 7.2%(+15.5)#1,563 |
| 24. | Ohiopyle Borough | 22.7% | 6.0%(+16.7)#24 | 7.2%(+15.5)#1,564 |
| 25. | Rew | 22.6% | 6.0%(+16.6)#25 | 7.2%(+15.4)#1,575 |
| 26. | Claysburg | 22.5% | 6.0%(+16.5)#26 | 7.2%(+15.3)#1,606 |
| 27. | Crown | 22.4% | 6.0%(+16.4)#27 | 7.2%(+15.1)#1,619 |
| 28. | Foundryville | 22.2% | 6.0%(+16.2)#28 | 7.2%(+15.0)#1,660 |
| 29. | Brave | 21.7% | 6.0%(+15.7)#29 | 7.2%(+14.4)#1,734 |
| 30. | West Middletown Borough | 21.1% | 6.0%(+15.1)#30 | 7.2%(+13.8)#1,847 |
| 31. | Moshannon | 21.0% | 6.0%(+15.0)#31 | 7.2%(+13.7)#1,859 |
| 32. | Belfast | 20.8% | 6.0%(+14.9)#32 | 7.2%(+13.6)#1,878 |
| 33. | Foxburg Borough | 20.0% | 6.0%(+14.0)#33 | 7.2%(+12.8)#2,040 |
| 34. | Little Britain | 19.9% | 6.0%(+13.9)#34 | 7.2%(+12.6)#2,090 |
| 35. | Chinchilla | 19.8% | 6.0%(+13.8)#35 | 7.2%(+12.6)#2,099 |
| 36. | Harmonsburg | 19.7% | 6.0%(+13.7)#36 | 7.2%(+12.5)#2,112 |
| 37. | Slabtown | 19.6% | 6.0%(+13.6)#37 | 7.2%(+12.4)#2,138 |
| 38. | Deer Lake | 19.4% | 6.0%(+13.4)#38 | 7.2%(+12.2)#2,168 |
| 39. | New Bedford | 19.4% | 6.0%(+13.4)#39 | 7.2%(+12.1)#2,181 |
| 40. | Leith Hatfield | 19.4% | 6.0%(+13.4)#40 | 7.2%(+12.1)#2,182 |
| 41. | Vicksburg | 19.3% | 6.0%(+13.3)#41 | 7.2%(+12.0)#2,204 |
| 42. | Applewold Borough | 19.1% | 6.0%(+13.1)#42 | 7.2%(+11.9)#2,254 |
| 43. | Shenandoah Heights | 19.0% | 6.0%(+13.0)#43 | 7.2%(+11.8)#2,284 |
| 44. | Bethany Borough | 18.6% | 6.0%(+12.6)#44 | 7.2%(+11.3)#2,415 |
| 45. | Atlasburg | 18.5% | 6.0%(+12.5)#45 | 7.2%(+11.2)#2,435 |
| 46. | Woodland Heights | 18.4% | 6.0%(+12.4)#46 | 7.2%(+11.2)#2,460 |
| 47. | Bulger | 18.2% | 6.0%(+12.3)#47 | 7.2%(+11.0)#2,502 |
| 48. | Casanova | 18.0% | 6.0%(+12.0)#48 | 7.2%(+10.8)#2,573 |
| 49. | Linds Crossing | 18.0% | 6.0%(+12.0)#49 | 7.2%(+10.7)#2,575 |
| 50. | Pen Mar | 18.0% | 6.0%(+12.0)#50 | 7.2%(+10.7)#2,578 |
| 51. | Saltillo Borough | 17.9% | 6.0%(+11.9)#51 | 7.2%(+10.7)#2,588 |
| 52. | Skelp | 17.7% | 6.0%(+11.7)#52 | 7.2%(+10.5)#2,651 |
| 53. | Dry Tavern | 17.6% | 6.0%(+11.6)#53 | 7.2%(+10.4)#2,682 |
| 54. | Davidsville | 17.5% | 6.0%(+11.6)#54 | 7.2%(+10.3)#2,703 |
| 55. | Oak Hills | 17.4% | 6.0%(+11.4)#55 | 7.2%(+10.2)#2,752 |
| 56. | Glen Hope Borough | 17.3% | 6.0%(+11.3)#56 | 7.2%(+10.1)#2,788 |
| 57. | Landisville | 17.2% | 6.0%(+11.2)#57 | 7.2%(+10.00)#2,819 |
| 58. | Summerhill Borough | 17.2% | 6.0%(+11.2)#58 | 7.2%(+9.94)#2,836 |
| 59. | West Hills | 17.0% | 6.0%(+11.0)#59 | 7.2%(+9.80)#2,877 |
| 60. | Renningers | 16.9% | 6.0%(+10.9)#60 | 7.2%(+9.71)#2,903 |
| 61. | Chewton | 16.8% | 6.0%(+10.8)#61 | 7.2%(+9.56)#2,958 |
| 62. | Orbisonia Borough | 16.7% | 6.0%(+10.7)#62 | 7.2%(+9.44)#3,001 |
| 63. | Chestnut Hill | 16.6% | 6.0%(+10.6)#63 | 7.2%(+9.39)#3,058 |
| 64. | Egypt | 16.6% | 6.0%(+10.6)#64 | 7.2%(+9.38)#3,061 |
| 65. | Oley | 16.6% | 6.0%(+10.6)#65 | 7.2%(+9.34)#3,082 |
| 66. | Sheakleyville Borough | 16.4% | 6.0%(+10.5)#66 | 7.2%(+9.21)#3,138 |
| 67. | Richboro | 16.2% | 6.0%(+10.2)#67 | 7.2%(+8.99)#3,229 |
| 68. | Catawissa Borough | 16.2% | 6.0%(+10.2)#68 | 7.2%(+8.98)#3,238 |
| 69. | Unionville | 16.2% | 6.0%(+10.2)#69 | 7.2%(+8.96)#3,241 |
| 70. | Cairnbrook | 16.0% | 6.0%(+10.0)#70 | 7.2%(+8.79)#3,330 |
| 71. | Eastlawn Gardens | 16.0% | 6.0%(+9.99)#71 | 7.2%(+8.75)#3,343 |
| 72. | Shelltown | 15.9% | 6.0%(+9.92)#72 | 7.2%(+8.68)#3,373 |
| 73. | Girard Borough | 15.7% | 6.0%(+9.69)#73 | 7.2%(+8.46)#3,505 |
| 74. | Vinco | 15.6% | 6.0%(+9.57)#74 | 7.2%(+8.33)#3,574 |
| 75. | Allenwood | 15.5% | 6.0%(+9.50)#75 | 7.2%(+8.27)#3,600 |
| 76. | Reinholds | 15.2% | 6.0%(+9.19)#76 | 7.2%(+7.95)#3,780 |
| 77. | Feasterville | 15.2% | 6.0%(+9.17)#77 | 7.2%(+7.93)#3,789 |
| 78. | Jefferson Borough Greene County | 15.1% | 6.0%(+9.14)#78 | 7.2%(+7.90)#3,810 |
| 79. | Hemlock Farms | 15.0% | 6.0%(+8.99)#79 | 7.2%(+7.75)#3,908 |
| 80. | Cashtown | 15.0% | 6.0%(+8.97)#80 | 7.2%(+7.73)#3,912 |
| 81. | Hannasville | 14.9% | 6.0%(+8.94)#81 | 7.2%(+7.70)#3,933 |
| 82. | Carroll Valley Borough | 14.9% | 6.0%(+8.91)#82 | 7.2%(+7.67)#3,948 |
| 83. | Spinnerstown | 14.8% | 6.0%(+8.85)#83 | 7.2%(+7.61)#3,984 |
| 84. | Saxton Borough | 14.8% | 6.0%(+8.84)#84 | 7.2%(+7.60)#3,987 |
| 85. | Lenhartsville Borough | 14.8% | 6.0%(+8.83)#85 | 7.2%(+7.59)#3,996 |
| 86. | Friedensburg | 14.8% | 6.0%(+8.81)#86 | 7.2%(+7.57)#4,004 |
| 87. | Berlin Borough | 14.8% | 6.0%(+8.79)#87 | 7.2%(+7.55)#4,014 |
| 88. | Hopwood | 14.7% | 6.0%(+8.76)#88 | 7.2%(+7.52)#4,033 |
| 89. | Roulette | 14.7% | 6.0%(+8.73)#89 | 7.2%(+7.49)#4,044 |
| 90. | Riverside | 14.4% | 6.0%(+8.42)#90 | 7.2%(+7.18)#4,259 |
| 91. | Exeter Borough | 14.4% | 6.0%(+8.41)#91 | 7.2%(+7.17)#4,263 |
| 92. | Cherryville | 14.3% | 6.0%(+8.36)#92 | 7.2%(+7.12)#4,296 |
| 93. | West Easton Borough | 14.3% | 6.0%(+8.30)#93 | 7.2%(+7.06)#4,321 |
| 94. | Lumber City | 14.3% | 6.0%(+8.30)#94 | 7.2%(+7.06)#4,344 |
| 95. | State Line | 14.3% | 6.0%(+8.27)#95 | 7.2%(+7.03)#4,394 |
| 96. | Arnot | 14.2% | 6.0%(+8.17)#96 | 7.2%(+6.94)#4,460 |
| 97. | Chalfont Borough | 14.1% | 6.0%(+8.14)#97 | 7.2%(+6.91)#4,487 |
| 98. | Penbrook Borough | 14.1% | 6.0%(+8.14)#98 | 7.2%(+6.90)#4,495 |
| 99. | Sligo Borough | 14.1% | 6.0%(+8.11)#99 | 7.2%(+6.87)#4,521 |
| 100. | South New Castle Borough | 14.1% | 6.0%(+8.07)#100 | 7.2%(+6.83)#4,549 |
Common Questions
What are the Top 10 Cities with the Highest Percentage of Local Government Employees in Pennsylvania?
Top 10 Cities with the Highest Percentage of Local Government Employees in Pennsylvania are:
#1
60.7%
#2
39.0%
#3
38.1%
#4
37.7%
#5
33.3%
#6
32.0%
#7
29.5%
#8
29.3%
#9
28.6%
#10
27.8%
What city has the Highest Percentage of Local Government Employees in Pennsylvania?
Pocono Ranch Lands has the Highest Percentage of Local Government Employees in Pennsylvania with 60.7%.
What is the Percentage of Local Government Employees in the State of Pennsylvania?
Percentage of Local Government Employees in Pennsylvania is 6.0%.
What is the Percentage of Local Government Employees in the United States?
Percentage of Local Government Employees in the United States is 7.2%.