Northfield, MA Map & Demographics
Northfield Map
Northfield Overview
$44,739
PER CAPITA INCOME
$86,406
AVG FAMILY INCOME
$62,969
AVG HOUSEHOLD INCOME
34.9%
WAGE / INCOME GAP [ % ]
65.1¢/ $1
WAGE / INCOME GAP [ $ ]
0.45
INEQUALITY / GINI INDEX
908
TOTAL POPULATION
354
MALE POPULATION
554
FEMALE POPULATION
63.90
MALES / 100 FEMALES
156.50
FEMALES / 100 MALES
49.5
MEDIAN AGE
2.2
AVG FAMILY SIZE
1.9
AVG HOUSEHOLD SIZE
554
LABOR FORCE [ PEOPLE ]
64.3%
PERCENT IN LABOR FORCE
2.2%
UNEMPLOYMENT RATE
Northfield Zip Codes
Northfield Area Codes
Income in Northfield
Income Overview in Northfield
Per Capita Income in Northfield is $44,739, while median incomes of families and households are $86,406 and $62,969 respectively.
| Characteristic | Number | Measure |
| Per Capita Income | 908 | $44,739 |
| Median Family Income | 323 | $86,406 |
| Mean Family Income | 323 | $104,082 |
| Median Household Income | 473 | $62,969 |
| Mean Household Income | 473 | $86,112 |
| Income Deficit | 323 | $0 |
| Wage / Income Gap (%) | 908 | 34.87% |
| Wage / Income Gap ($) | 908 | 65.13¢ per $1 |
| Gini / Inequality Index | 908 | 0.45 |
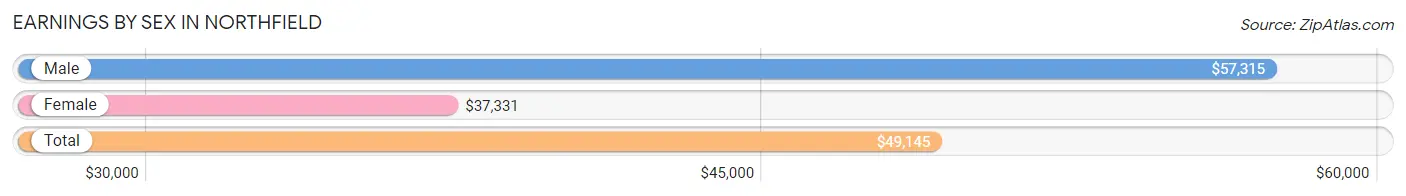
Earnings by Sex in Northfield
Average Earnings in Northfield are $49,145, $57,315 for men and $37,331 for women, a difference of 34.9%.
| Sex | Number | Average Earnings |
| Male | 200 (35.4%) | $57,315 |
| Female | 365 (64.6%) | $37,331 |
| Total | 565 (100.0%) | $49,145 |
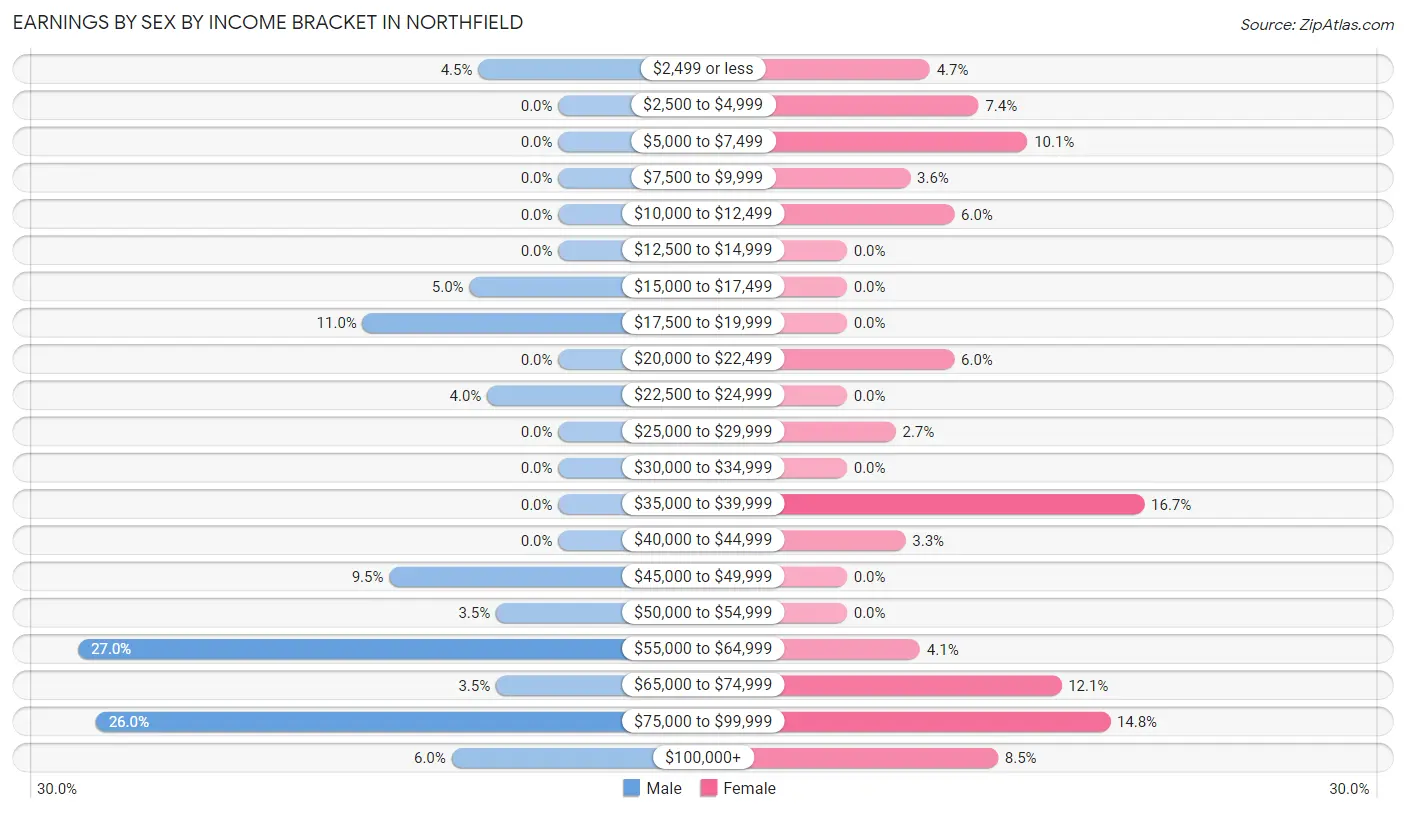
Earnings by Sex by Income Bracket in Northfield
The most common earnings brackets in Northfield are $55,000 to $64,999 for men (54 | 27.0%) and $35,000 to $39,999 for women (61 | 16.7%).
| Income | Male | Female |
| $2,499 or less | 9 (4.5%) | 17 (4.7%) |
| $2,500 to $4,999 | 0 (0.0%) | 27 (7.4%) |
| $5,000 to $7,499 | 0 (0.0%) | 37 (10.1%) |
| $7,500 to $9,999 | 0 (0.0%) | 13 (3.6%) |
| $10,000 to $12,499 | 0 (0.0%) | 22 (6.0%) |
| $12,500 to $14,999 | 0 (0.0%) | 0 (0.0%) |
| $15,000 to $17,499 | 10 (5.0%) | 0 (0.0%) |
| $17,500 to $19,999 | 22 (11.0%) | 0 (0.0%) |
| $20,000 to $22,499 | 0 (0.0%) | 22 (6.0%) |
| $22,500 to $24,999 | 8 (4.0%) | 0 (0.0%) |
| $25,000 to $29,999 | 0 (0.0%) | 10 (2.7%) |
| $30,000 to $34,999 | 0 (0.0%) | 0 (0.0%) |
| $35,000 to $39,999 | 0 (0.0%) | 61 (16.7%) |
| $40,000 to $44,999 | 0 (0.0%) | 12 (3.3%) |
| $45,000 to $49,999 | 19 (9.5%) | 0 (0.0%) |
| $50,000 to $54,999 | 7 (3.5%) | 0 (0.0%) |
| $55,000 to $64,999 | 54 (27.0%) | 15 (4.1%) |
| $65,000 to $74,999 | 7 (3.5%) | 44 (12.0%) |
| $75,000 to $99,999 | 52 (26.0%) | 54 (14.8%) |
| $100,000+ | 12 (6.0%) | 31 (8.5%) |
| Total | 200 (100.0%) | 365 (100.0%) |
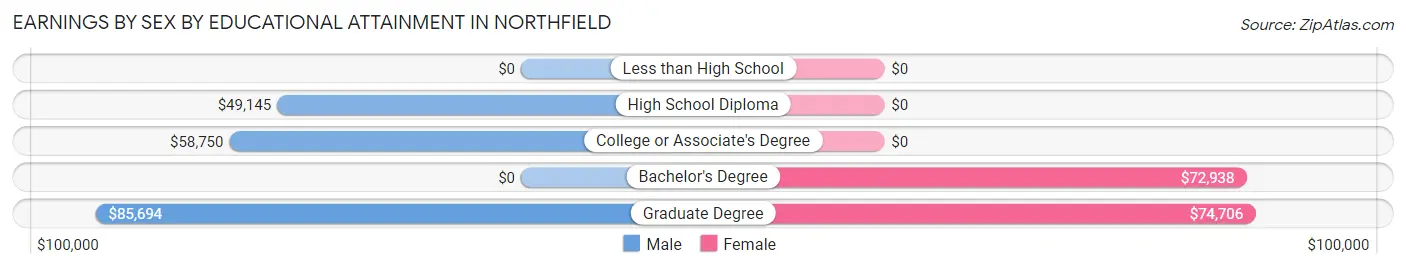
Earnings by Sex by Educational Attainment in Northfield
Average earnings in Northfield are $58,333 for men and $44,375 for women, a difference of 23.9%. Men with an educational attainment of graduate degree enjoy the highest average annual earnings of $85,694, while those with high school diploma education earn the least with $49,145. Women with an educational attainment of graduate degree earn the most with the average annual earnings of $74,706, while those with bachelor's degree education have the smallest earnings of $72,938.
| Educational Attainment | Male Income | Female Income |
| Less than High School | - | - |
| High School Diploma | $49,145 | $0 |
| College or Associate's Degree | $58,750 | $0 |
| Bachelor's Degree | - | - |
| Graduate Degree | $85,694 | $74,706 |
| Total | $58,333 | $44,375 |
Family Income in Northfield
Family Income Brackets in Northfield
According to the Northfield family income data, there are 82 families falling into the $100,000 to $149,999 income range, which is the most common income bracket and makes up 25.4% of all families.
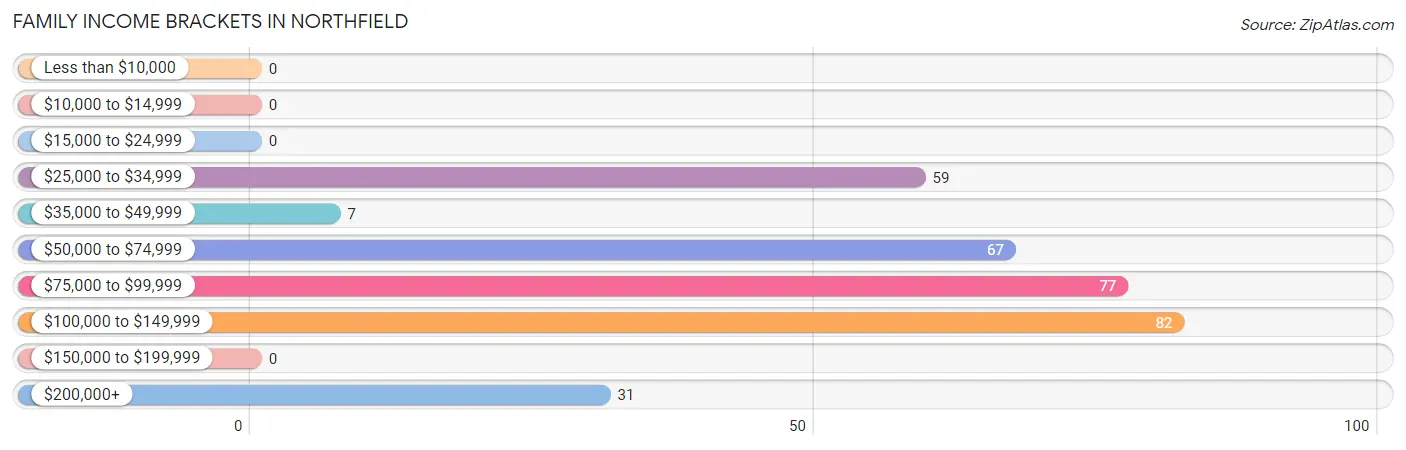
| Income Bracket | # Families | % Families |
| Less than $10,000 | 0 | 0.0% |
| $10,000 to $14,999 | 0 | 0.0% |
| $15,000 to $24,999 | 0 | 0.0% |
| $25,000 to $34,999 | 59 | 18.3% |
| $35,000 to $49,999 | 7 | 2.2% |
| $50,000 to $74,999 | 67 | 20.7% |
| $75,000 to $99,999 | 77 | 23.8% |
| $100,000 to $149,999 | 82 | 25.4% |
| $150,000 to $199,999 | 0 | 0.0% |
| $200,000+ | 31 | 9.6% |
Family Income by Famaliy Size in Northfield
4-person families (56 | 17.3%) account for the highest median family income in Northfield with $143,889 per family, while 2-person families (267 | 82.7%) have the highest median income of $38,820 per family member.
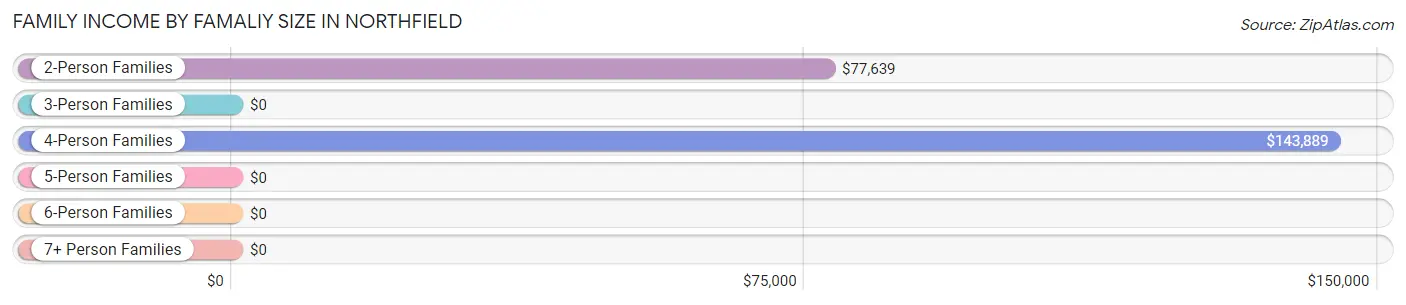
| Income Bracket | # Families | Median Income |
| 2-Person Families | 267 (82.7%) | $77,639 |
| 3-Person Families | 0 (0.0%) | $0 |
| 4-Person Families | 56 (17.3%) | $143,889 |
| 5-Person Families | 0 (0.0%) | $0 |
| 6-Person Families | 0 (0.0%) | $0 |
| 7+ Person Families | 0 (0.0%) | $0 |
| Total | 323 (100.0%) | $86,406 |
Family Income by Number of Earners in Northfield
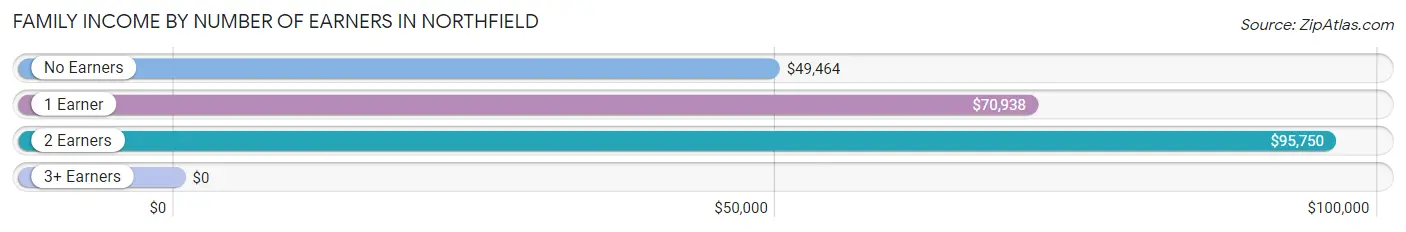
| Number of Earners | # Families | Median Income |
| No Earners | 85 (26.3%) | $49,464 |
| 1 Earner | 38 (11.8%) | $70,938 |
| 2 Earners | 167 (51.7%) | $95,750 |
| 3+ Earners | 33 (10.2%) | $0 |
| Total | 323 (100.0%) | $86,406 |
Household Income in Northfield
Household Income Brackets in Northfield
With 93 households falling in the category, the $50,000 to $74,999 income range is the most frequent in Northfield, accounting for 19.7% of all households. In contrast, only 15 households (3.2%) fall into the $10,000 to $14,999 income bracket, making it the least populous group.
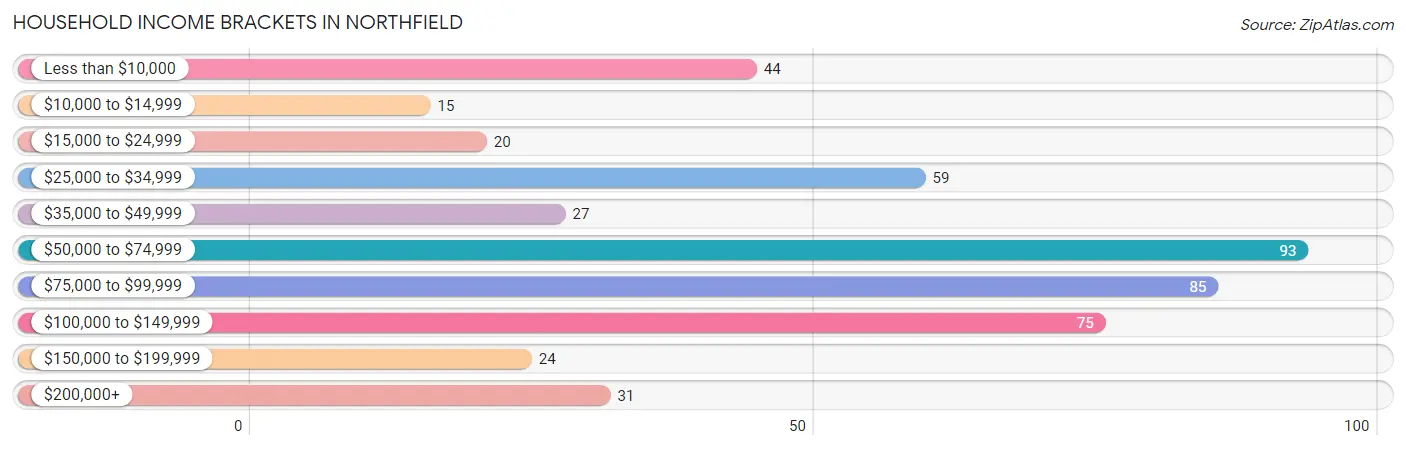
| Income Bracket | # Households | % Households |
| Less than $10,000 | 44 | 9.3% |
| $10,000 to $14,999 | 15 | 3.2% |
| $15,000 to $24,999 | 20 | 4.2% |
| $25,000 to $34,999 | 59 | 12.5% |
| $35,000 to $49,999 | 27 | 5.7% |
| $50,000 to $74,999 | 93 | 19.7% |
| $75,000 to $99,999 | 85 | 18.0% |
| $100,000 to $149,999 | 75 | 15.9% |
| $150,000 to $199,999 | 24 | 5.1% |
| $200,000+ | 31 | 6.6% |
Household Income by Householder Age in Northfield
The median household income in Northfield is $62,969, with the highest median household income of $96,050 found in the 25 to 44 years age bracket for the primary householder. A total of 109 households (23.0%) fall into this category.
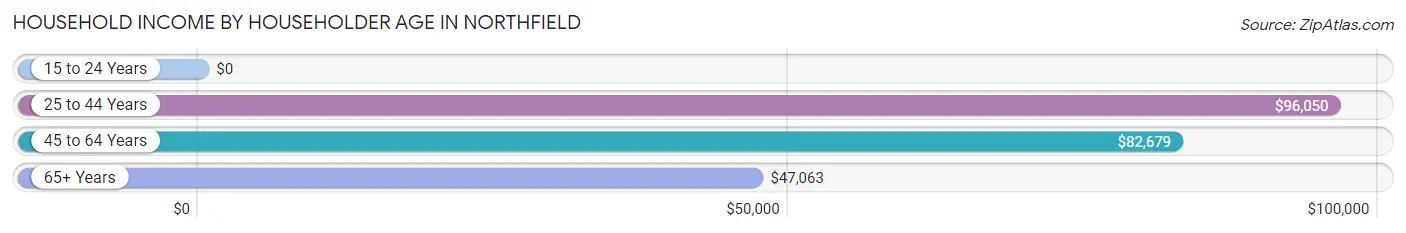
| Income Bracket | # Households | Median Income |
| 15 to 24 Years | 0 (0.0%) | $0 |
| 25 to 44 Years | 109 (23.0%) | $96,050 |
| 45 to 64 Years | 187 (39.5%) | $82,679 |
| 65+ Years | 177 (37.4%) | $47,063 |
| Total | 473 (100.0%) | $62,969 |
Poverty in Northfield
Income Below Poverty by Sex and Age in Northfield
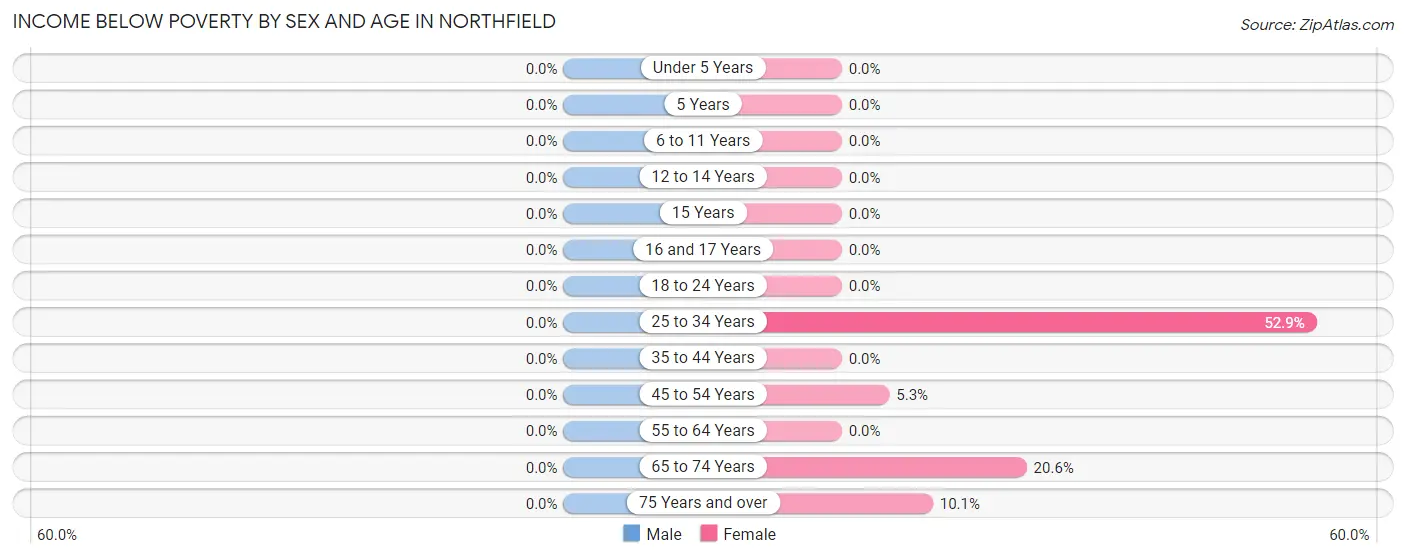
| Age Bracket | Male | Female |
| Under 5 Years | 0 (0.0%) | 0 (0.0%) |
| 5 Years | 0 (0.0%) | 0 (0.0%) |
| 6 to 11 Years | 0 (0.0%) | 0 (0.0%) |
| 12 to 14 Years | 0 (0.0%) | 0 (0.0%) |
| 15 Years | 0 (0.0%) | 0 (0.0%) |
| 16 and 17 Years | 0 (0.0%) | 0 (0.0%) |
| 18 to 24 Years | 0 (0.0%) | 0 (0.0%) |
| 25 to 34 Years | 0 (0.0%) | 37 (52.9%) |
| 35 to 44 Years | 0 (0.0%) | 0 (0.0%) |
| 45 to 54 Years | 0 (0.0%) | 7 (5.3%) |
| 55 to 64 Years | 0 (0.0%) | 0 (0.0%) |
| 65 to 74 Years | 0 (0.0%) | 14 (20.6%) |
| 75 Years and over | 0 (0.0%) | 8 (10.1%) |
| Total | 0 (0.0%) | 66 (11.9%) |
Income Above Poverty by Sex and Age in Northfield
According to the poverty statistics in Northfield, males aged 12 to 14 years and females aged under 5 years are the age groups that are most secure financially, with 100.0% of males and 100.0% of females in these age groups living above the poverty line.
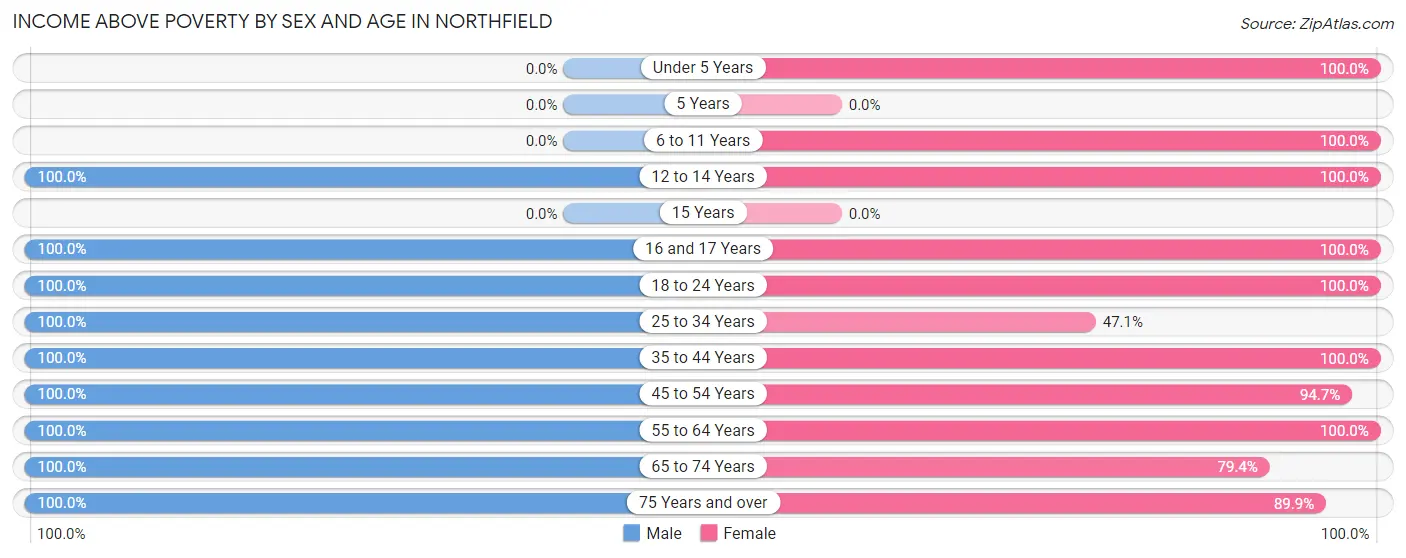
| Age Bracket | Male | Female |
| Under 5 Years | 0 (0.0%) | 14 (100.0%) |
| 5 Years | 0 (0.0%) | 0 (0.0%) |
| 6 to 11 Years | 0 (0.0%) | 16 (100.0%) |
| 12 to 14 Years | 7 (100.0%) | 10 (100.0%) |
| 15 Years | 0 (0.0%) | 0 (0.0%) |
| 16 and 17 Years | 13 (100.0%) | 28 (100.0%) |
| 18 to 24 Years | 22 (100.0%) | 43 (100.0%) |
| 25 to 34 Years | 26 (100.0%) | 33 (47.1%) |
| 35 to 44 Years | 54 (100.0%) | 44 (100.0%) |
| 45 to 54 Years | 58 (100.0%) | 125 (94.7%) |
| 55 to 64 Years | 30 (100.0%) | 50 (100.0%) |
| 65 to 74 Years | 71 (100.0%) | 54 (79.4%) |
| 75 Years and over | 73 (100.0%) | 71 (89.9%) |
| Total | 354 (100.0%) | 488 (88.1%) |
Income Below Poverty Among Married-Couple Families in Northfield
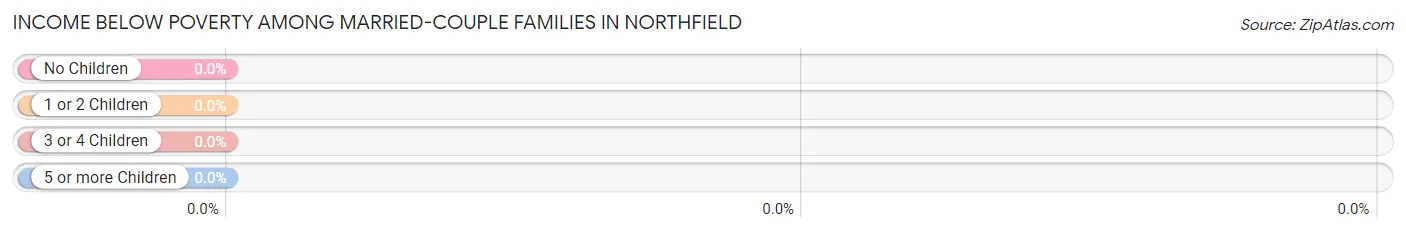
| Children | Above Poverty | Below Poverty |
| No Children | 171 (100.0%) | 0 (0.0%) |
| 1 or 2 Children | 56 (100.0%) | 0 (0.0%) |
| 3 or 4 Children | 0 (0.0%) | 0 (0.0%) |
| 5 or more Children | 0 (0.0%) | 0 (0.0%) |
| Total | 227 (100.0%) | 0 (0.0%) |
Income Below Poverty Among Single-Parent Households in Northfield
| Children | Single Father | Single Mother |
| No Children | 0 (0.0%) | 0 (0.0%) |
| 1 or 2 Children | 0 (0.0%) | 0 (0.0%) |
| 3 or 4 Children | 0 (0.0%) | 0 (0.0%) |
| 5 or more Children | 0 (0.0%) | 0 (0.0%) |
| Total | 0 (0.0%) | 0 (0.0%) |
Income Below Poverty Among Married-Couple vs Single-Parent Households in Northfield
| Children | Married-Couple Families | Single-Parent Households |
| No Children | 0 (0.0%) | 0 (0.0%) |
| 1 or 2 Children | 0 (0.0%) | 0 (0.0%) |
| 3 or 4 Children | 0 (0.0%) | 0 (0.0%) |
| 5 or more Children | 0 (0.0%) | 0 (0.0%) |
| Total | 0 (0.0%) | 0 (0.0%) |
Race in Northfield
The most populous races in Northfield are White / Caucasian (868 | 95.6%), and Two or more Races (40 | 4.4%).
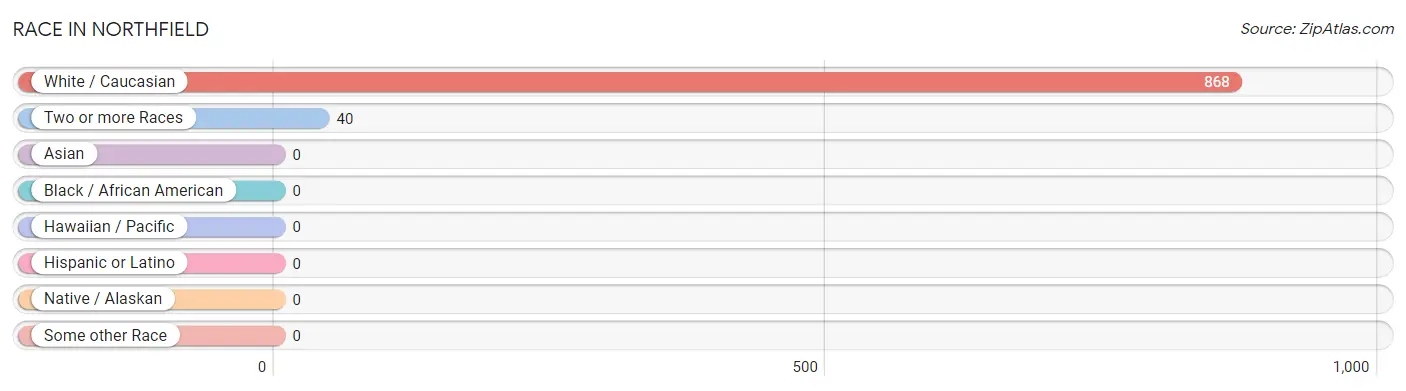
| Race | # Population | % Population |
| Asian | 0 | 0.0% |
| Black / African American | 0 | 0.0% |
| Hawaiian / Pacific | 0 | 0.0% |
| Hispanic or Latino | 0 | 0.0% |
| Native / Alaskan | 0 | 0.0% |
| White / Caucasian | 868 | 95.6% |
| Two or more Races | 40 | 4.4% |
| Some other Race | 0 | 0.0% |
| Total | 908 | 100.0% |
Ancestry in Northfield
The most populous ancestries reported in Northfield are English (296 | 32.6%), German (179 | 19.7%), French (112 | 12.3%), Irish (105 | 11.6%), and Polish (93 | 10.2%), together accounting for 86.4% of all Northfield residents.
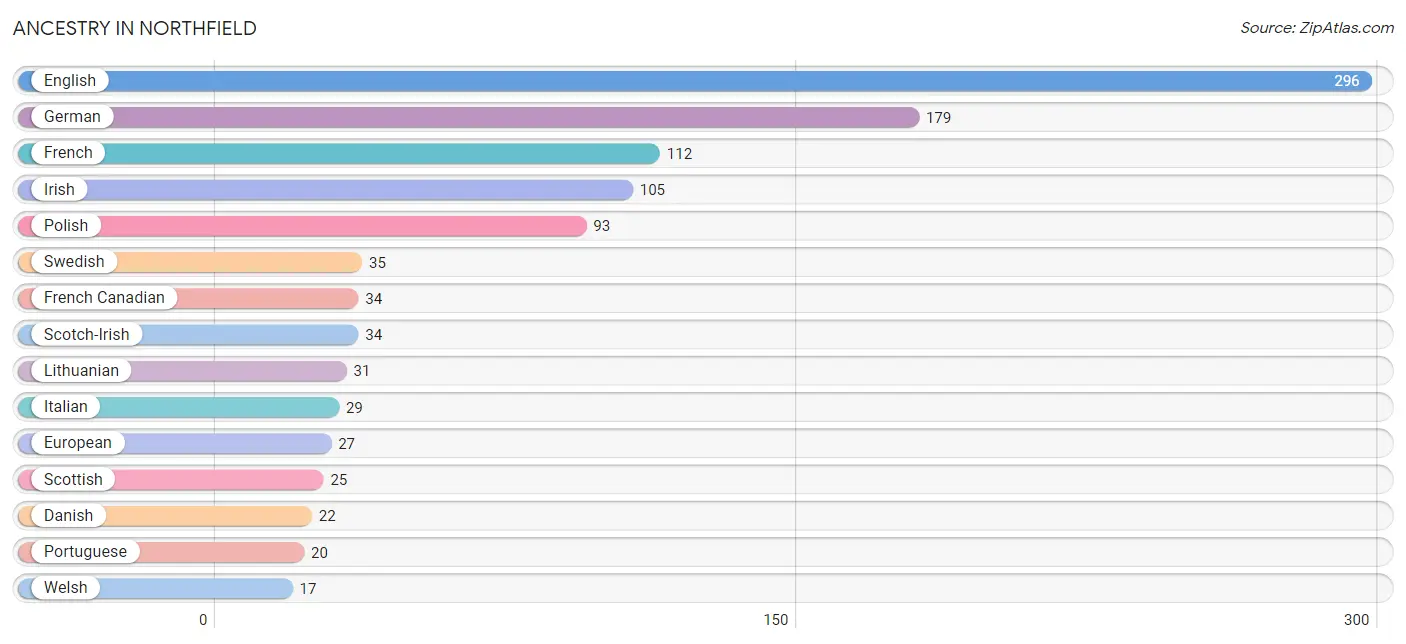
| Ancestry | # Population | % Population |
| American | 14 | 1.5% |
| Canadian | 8 | 0.9% |
| Danish | 22 | 2.4% |
| Eastern European | 7 | 0.8% |
| English | 296 | 32.6% |
| European | 27 | 3.0% |
| French | 112 | 12.3% |
| French Canadian | 34 | 3.7% |
| German | 179 | 19.7% |
| Irish | 105 | 11.6% |
| Italian | 29 | 3.2% |
| Lithuanian | 31 | 3.4% |
| Polish | 93 | 10.2% |
| Portuguese | 20 | 2.2% |
| Russian | 12 | 1.3% |
| Scandinavian | 11 | 1.2% |
| Scotch-Irish | 34 | 3.7% |
| Scottish | 25 | 2.8% |
| Swedish | 35 | 3.8% |
| Ukrainian | 12 | 1.3% |
| Welsh | 17 | 1.9% | View All 21 Rows |
Immigrants in Northfield

| Immigration Origin | # Population | % Population | View All 0 Rows |
Sex and Age in Northfield
Sex and Age in Northfield
The most populous age groups in Northfield are 70 to 74 Years (40 | 11.3%) for men and 45 to 49 Years (79 | 14.3%) for women.
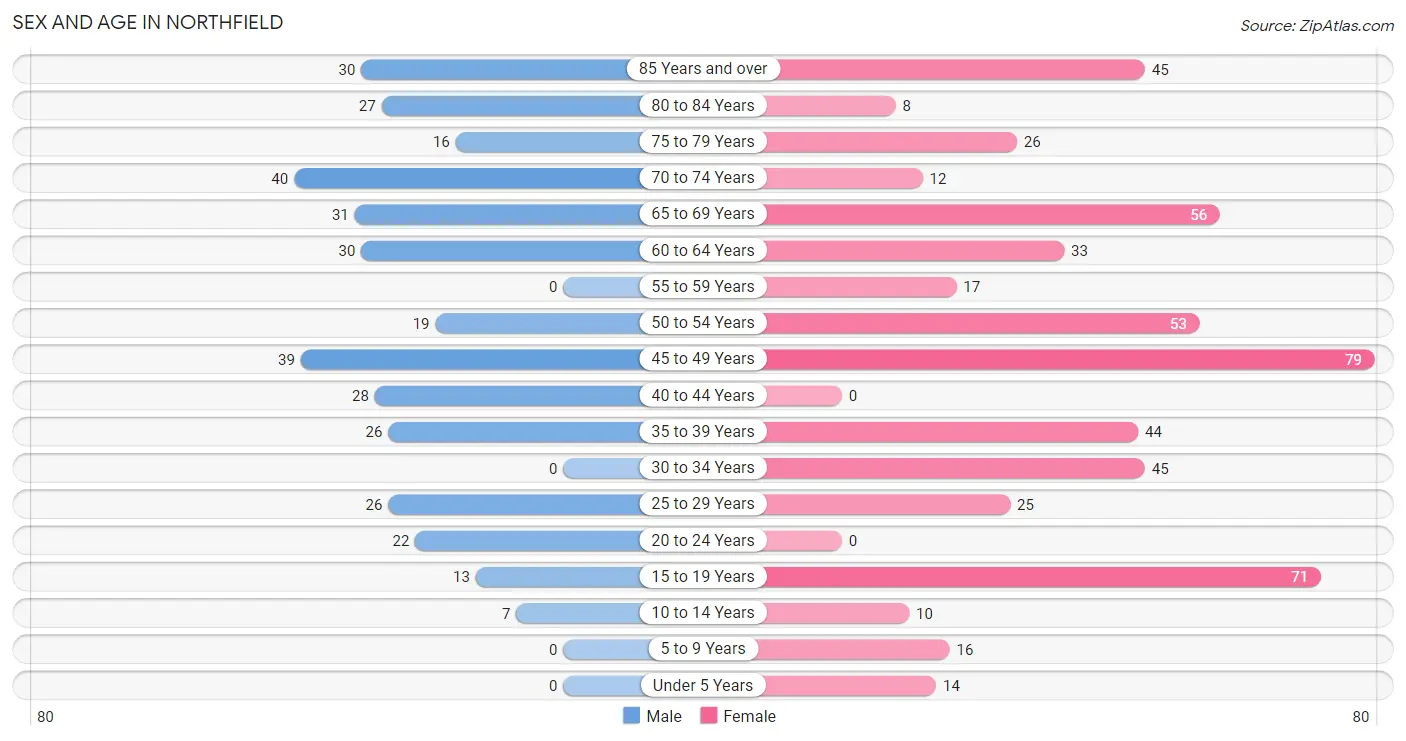
| Age Bracket | Male | Female |
| Under 5 Years | 0 (0.0%) | 14 (2.5%) |
| 5 to 9 Years | 0 (0.0%) | 16 (2.9%) |
| 10 to 14 Years | 7 (2.0%) | 10 (1.8%) |
| 15 to 19 Years | 13 (3.7%) | 71 (12.8%) |
| 20 to 24 Years | 22 (6.2%) | 0 (0.0%) |
| 25 to 29 Years | 26 (7.3%) | 25 (4.5%) |
| 30 to 34 Years | 0 (0.0%) | 45 (8.1%) |
| 35 to 39 Years | 26 (7.3%) | 44 (7.9%) |
| 40 to 44 Years | 28 (7.9%) | 0 (0.0%) |
| 45 to 49 Years | 39 (11.0%) | 79 (14.3%) |
| 50 to 54 Years | 19 (5.4%) | 53 (9.6%) |
| 55 to 59 Years | 0 (0.0%) | 17 (3.1%) |
| 60 to 64 Years | 30 (8.5%) | 33 (6.0%) |
| 65 to 69 Years | 31 (8.8%) | 56 (10.1%) |
| 70 to 74 Years | 40 (11.3%) | 12 (2.2%) |
| 75 to 79 Years | 16 (4.5%) | 26 (4.7%) |
| 80 to 84 Years | 27 (7.6%) | 8 (1.4%) |
| 85 Years and over | 30 (8.5%) | 45 (8.1%) |
| Total | 354 (100.0%) | 554 (100.0%) |
Families and Households in Northfield
Median Family Size in Northfield
The median family size in Northfield is 2.24 persons per family, with married-couple families (227 | 70.3%) accounting for the largest median family size of 2.41 persons per family. On the other hand, single female/mother families (81 | 25.1%) represent the smallest median family size with 1.80 persons per family.
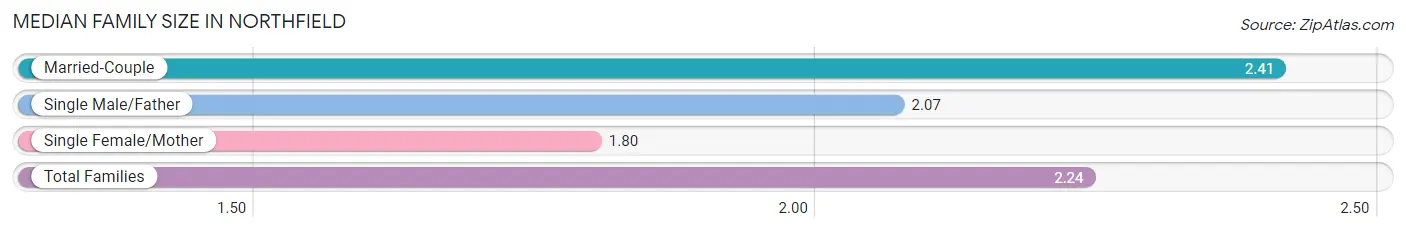
| Family Type | # Families | Family Size |
| Married-Couple | 227 (70.3%) | 2.41 |
| Single Male/Father | 15 (4.6%) | 2.07 |
| Single Female/Mother | 81 (25.1%) | 1.80 |
| Total Families | 323 (100.0%) | 2.24 |
Median Household Size in Northfield
The median household size in Northfield is 1.92 persons per household, with single male/father households (15 | 3.2%) accounting for the largest median household size of 2.53 persons per household. non-family households (150 | 31.7%) represent the smallest median household size with 1.13 persons per household.
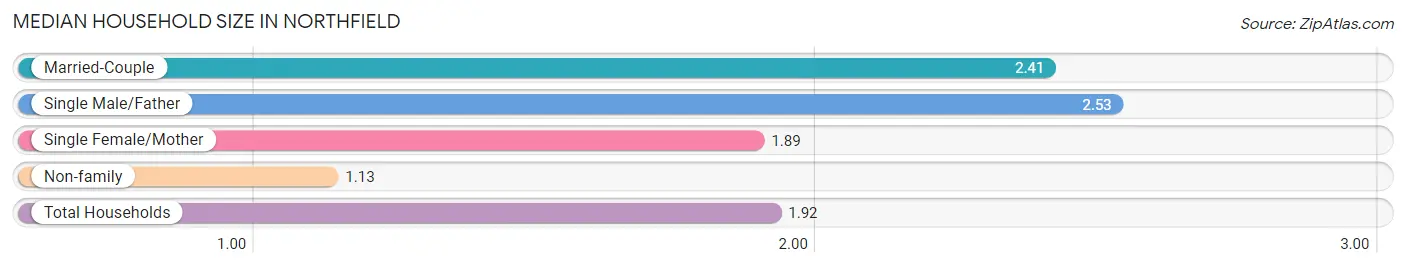
| Household Type | # Households | Household Size |
| Married-Couple | 227 (48.0%) | 2.41 |
| Single Male/Father | 15 (3.2%) | 2.53 |
| Single Female/Mother | 81 (17.1%) | 1.89 |
| Non-family | 150 (31.7%) | 1.13 |
| Total Households | 473 (100.0%) | 1.92 |
Household Size by Marriage Status in Northfield
Out of a total of 473 households in Northfield, 323 (68.3%) are family households, while 150 (31.7%) are nonfamily households. The most numerous type of family households are 2-person households, comprising 252, and the most common type of nonfamily households are 1-person households, comprising 133.
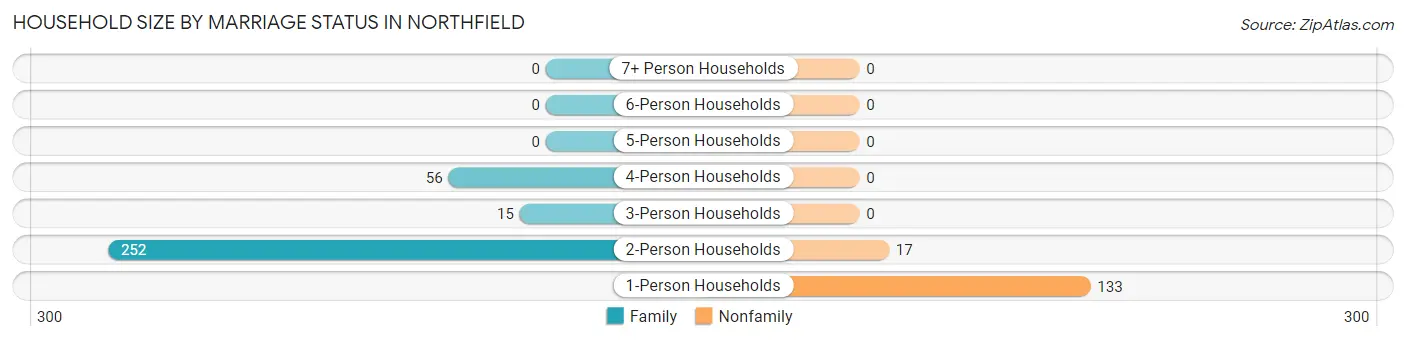
| Household Size | Family Households | Nonfamily Households |
| 1-Person Households | - | 133 (28.1%) |
| 2-Person Households | 252 (53.3%) | 17 (3.6%) |
| 3-Person Households | 15 (3.2%) | 0 (0.0%) |
| 4-Person Households | 56 (11.8%) | 0 (0.0%) |
| 5-Person Households | 0 (0.0%) | 0 (0.0%) |
| 6-Person Households | 0 (0.0%) | 0 (0.0%) |
| 7+ Person Households | 0 (0.0%) | 0 (0.0%) |
| Total | 323 (68.3%) | 150 (31.7%) |
Female Fertility in Northfield
Fertility by Age in Northfield
| Age Bracket | Women with Births | Births / 1,000 Women |
| 15 to 19 years | 0 (0.0%) | 0.0 |
| 20 to 34 years | 0 (0.0%) | 0.0 |
| 35 to 50 years | 0 (0.0%) | 0.0 |
| Total | 0 (0.0%) | 0.0 |
Fertility by Age by Marriage Status in Northfield
| Age Bracket | Married | Unmarried |
| 15 to 19 years | 0 (0.0%) | 0 (0.0%) |
| 20 to 34 years | 0 (0.0%) | 0 (0.0%) |
| 35 to 50 years | 0 (0.0%) | 0 (0.0%) |
| Total | 0 (0.0%) | 0 (0.0%) |
Fertility by Education in Northfield
| Educational Attainment | Women with Births | Births / 1,000 Women |
| Less than High School | 0 (0.0%) | 0.0 |
| High School Diploma | 0 (0.0%) | 0.0 |
| College or Associate's Degree | 0 (0.0%) | 0.0 |
| Bachelor's Degree | 0 (0.0%) | 0.0 |
| Graduate Degree | 0 (0.0%) | 0.0 |
| Total | 0 (0.0%) | 0.0 |
Fertility by Education by Marriage Status in Northfield
| Educational Attainment | Married | Unmarried |
| Less than High School | 0 (0.0%) | 0 (0.0%) |
| High School Diploma | 0 (0.0%) | 0 (0.0%) |
| College or Associate's Degree | 0 (0.0%) | 0 (0.0%) |
| Bachelor's Degree | 0 (0.0%) | 0 (0.0%) |
| Graduate Degree | 0 (0.0%) | 0 (0.0%) |
| Total | 0 (0.0%) | 0 (0.0%) |
Employment Characteristics in Northfield
Employment by Class of Employer in Northfield
Among the 542 employed individuals in Northfield, private company employees (315 | 58.1%), local government employees (126 | 23.3%), and not-for-profit organizations (60 | 11.1%) make up the most common classes of employment.
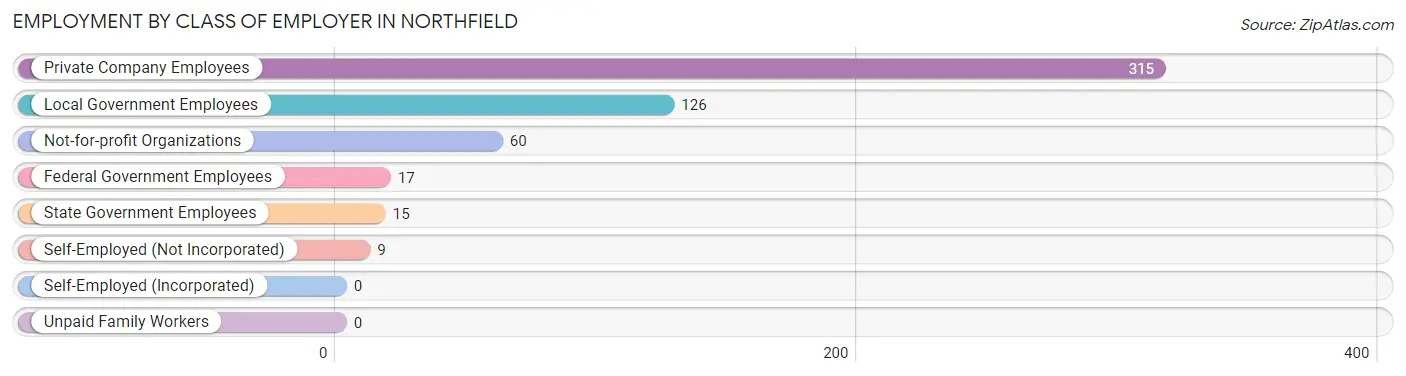
| Employer Class | # Employees | % Employees |
| Private Company Employees | 315 | 58.1% |
| Self-Employed (Incorporated) | 0 | 0.0% |
| Self-Employed (Not Incorporated) | 9 | 1.7% |
| Not-for-profit Organizations | 60 | 11.1% |
| Local Government Employees | 126 | 23.3% |
| State Government Employees | 15 | 2.8% |
| Federal Government Employees | 17 | 3.1% |
| Unpaid Family Workers | 0 | 0.0% |
| Total | 542 | 100.0% |
Employment Status by Age in Northfield
According to the labor force statistics for Northfield, out of the total population over 16 years of age (861), 64.3% or 554 individuals are in the labor force, with 2.2% or 12 of them unemployed. The age group with the highest labor force participation rate is 20 to 24 years, with 100.0% or 22 individuals in the labor force. Within the labor force, the 65 to 74 years age range has the highest percentage of unemployed individuals, with 26.1% or 12 of them being unemployed.
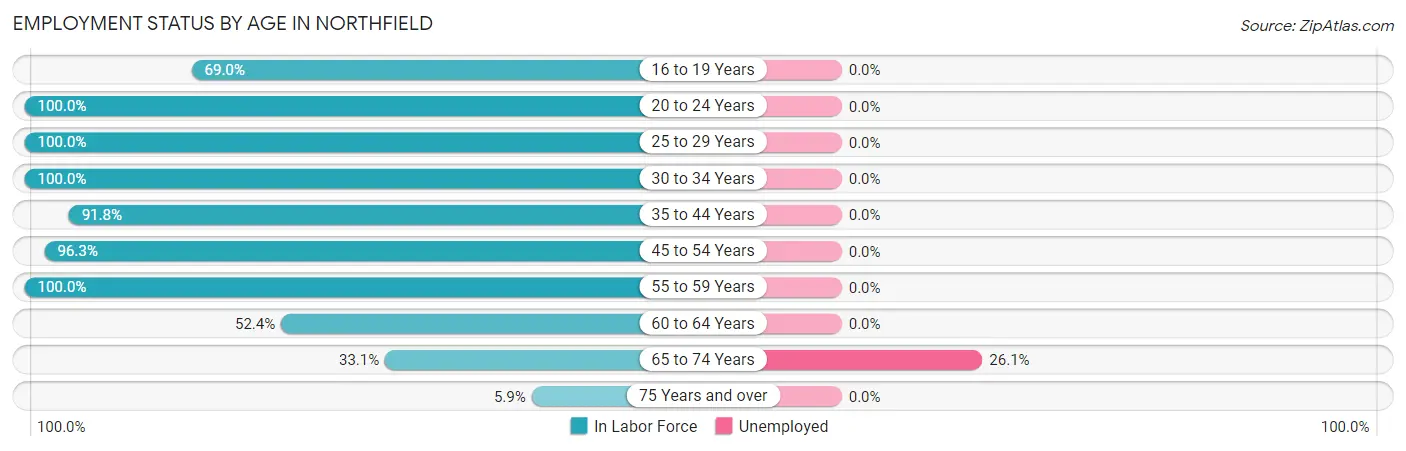
| Age Bracket | In Labor Force | Unemployed |
| 16 to 19 Years | 58 (69.0%) | 0 (0.0%) |
| 20 to 24 Years | 22 (100.0%) | 0 (0.0%) |
| 25 to 29 Years | 51 (100.0%) | 0 (0.0%) |
| 30 to 34 Years | 45 (100.0%) | 0 (0.0%) |
| 35 to 44 Years | 90 (91.8%) | 0 (0.0%) |
| 45 to 54 Years | 183 (96.3%) | 0 (0.0%) |
| 55 to 59 Years | 17 (100.0%) | 0 (0.0%) |
| 60 to 64 Years | 33 (52.4%) | 0 (0.0%) |
| 65 to 74 Years | 46 (33.1%) | 12 (26.1%) |
| 75 Years and over | 9 (5.9%) | 0 (0.0%) |
| Total | 554 (64.3%) | 12 (2.2%) |
Employment Status by Educational Attainment in Northfield
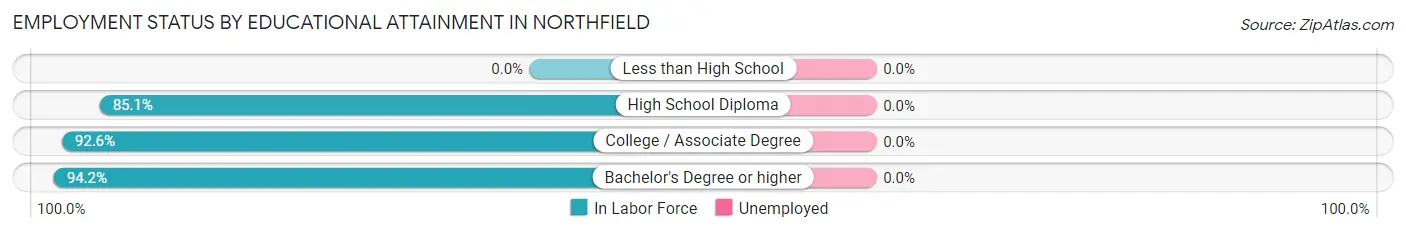
| Educational Attainment | In Labor Force | Unemployed |
| Less than High School | 0 (0.0%) | 0 (0.0%) |
| High School Diploma | 86 (85.1%) | 0 (0.0%) |
| College / Associate Degree | 88 (92.6%) | 0 (0.0%) |
| Bachelor's Degree or higher | 245 (94.2%) | 0 (0.0%) |
| Total | 419 (90.3%) | 0 (0.0%) |
Employment Occupations by Sex in Northfield
Management, Business, Science and Arts Occupations
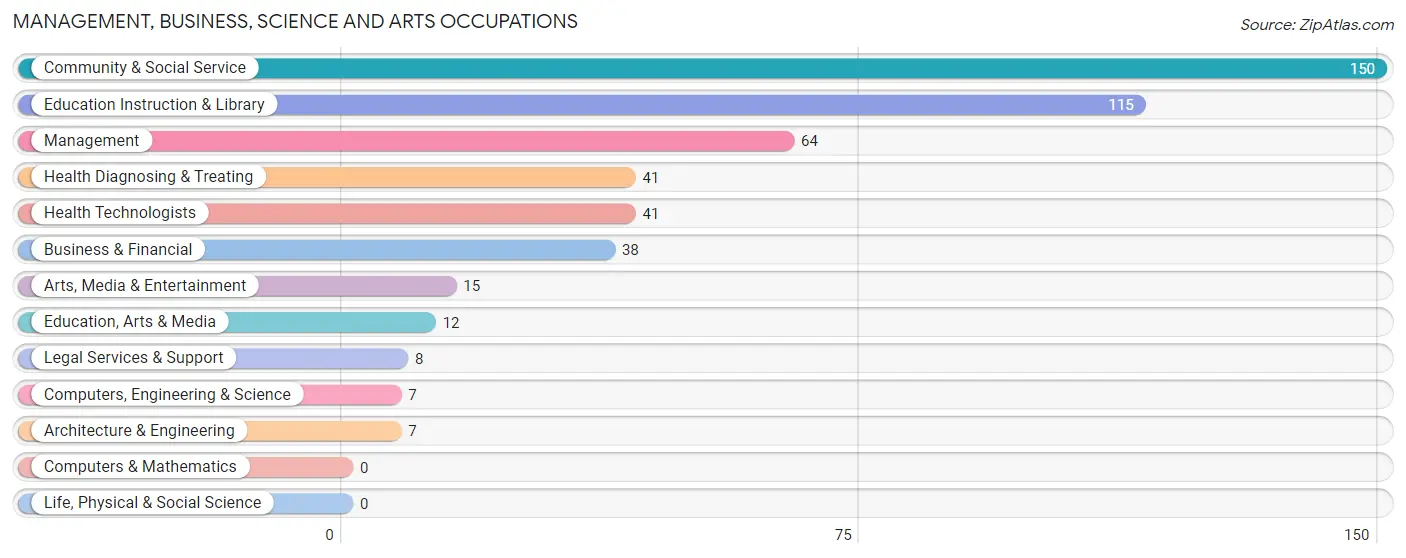
The most common Management, Business, Science and Arts occupations in Northfield are Community & Social Service (150 | 27.7%), Education Instruction & Library (115 | 21.2%), Management (64 | 11.8%), Health Diagnosing & Treating (41 | 7.6%), and Health Technologists (41 | 7.6%).
Management, Business, Science and Arts Occupations by Sex
Within the Management, Business, Science and Arts occupations in Northfield, the most male-oriented occupations are Computers, Engineering & Science (100.0%), Architecture & Engineering (100.0%), and Management (54.7%), while the most female-oriented occupations are Education, Arts & Media (100.0%), Legal Services & Support (100.0%), and Arts, Media & Entertainment (100.0%).
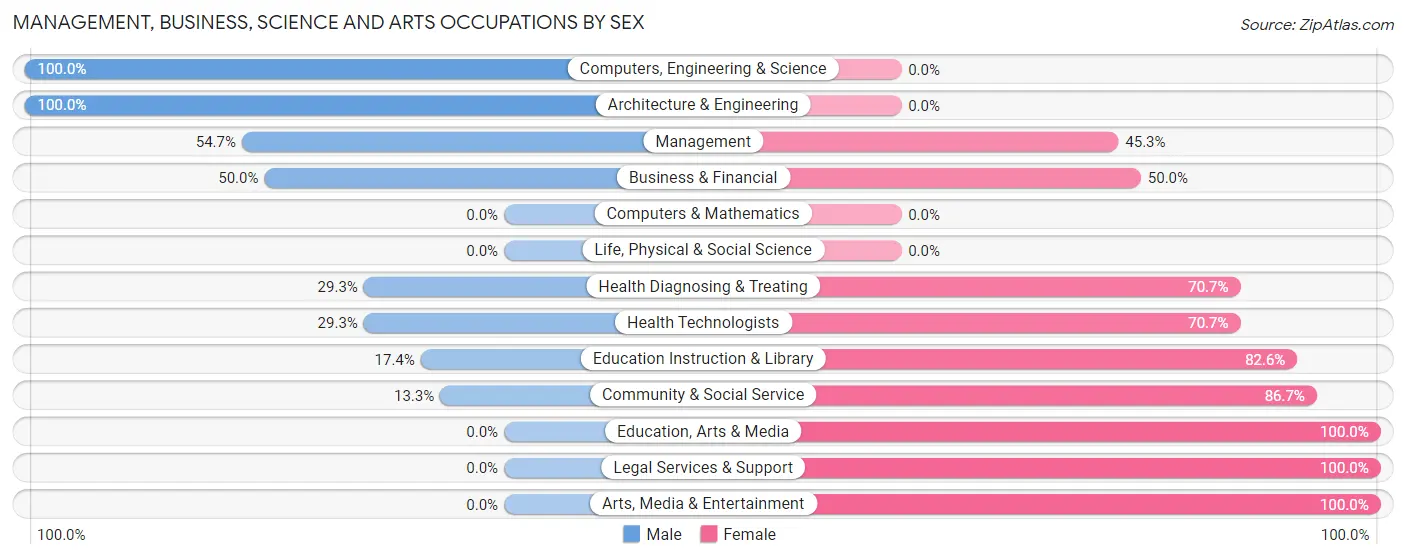
| Occupation | Male | Female |
| Management | 35 (54.7%) | 29 (45.3%) |
| Business & Financial | 19 (50.0%) | 19 (50.0%) |
| Computers, Engineering & Science | 7 (100.0%) | 0 (0.0%) |
| Computers & Mathematics | 0 (0.0%) | 0 (0.0%) |
| Architecture & Engineering | 7 (100.0%) | 0 (0.0%) |
| Life, Physical & Social Science | 0 (0.0%) | 0 (0.0%) |
| Community & Social Service | 20 (13.3%) | 130 (86.7%) |
| Education, Arts & Media | 0 (0.0%) | 12 (100.0%) |
| Legal Services & Support | 0 (0.0%) | 8 (100.0%) |
| Education Instruction & Library | 20 (17.4%) | 95 (82.6%) |
| Arts, Media & Entertainment | 0 (0.0%) | 15 (100.0%) |
| Health Diagnosing & Treating | 12 (29.3%) | 29 (70.7%) |
| Health Technologists | 12 (29.3%) | 29 (70.7%) |
| Total (Category) | 93 (31.0%) | 207 (69.0%) |
| Total (Overall) | 190 (35.1%) | 352 (64.9%) |
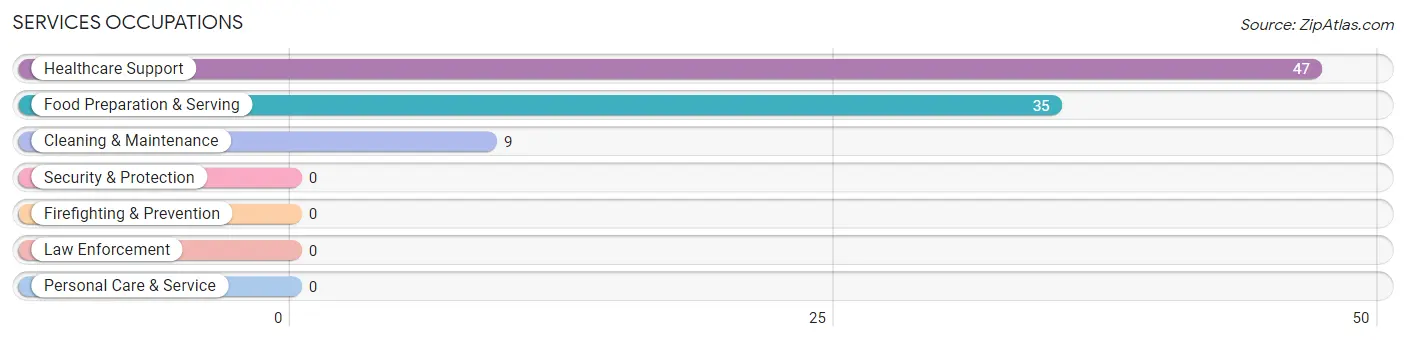
Services Occupations
The most common Services occupations in Northfield are Healthcare Support (47 | 8.7%), Food Preparation & Serving (35 | 6.5%), and Cleaning & Maintenance (9 | 1.7%).
Services Occupations by Sex
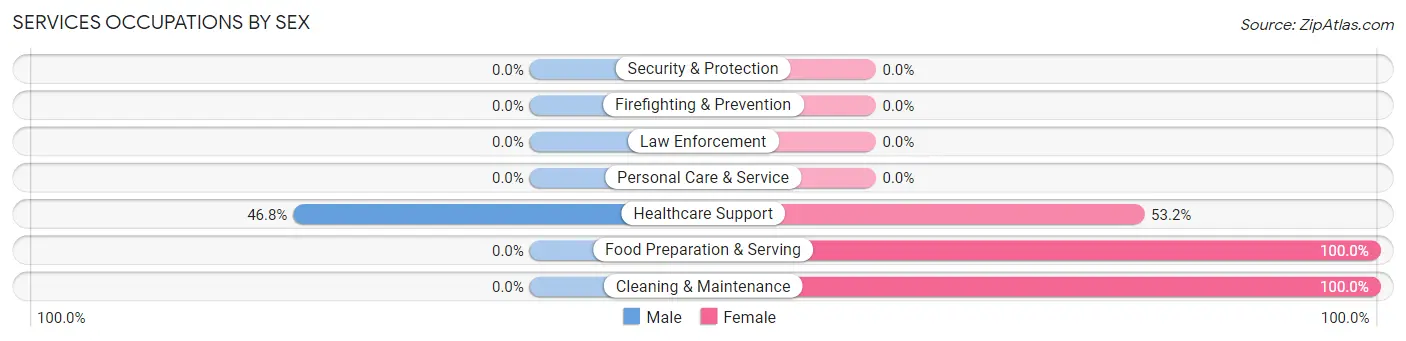
| Occupation | Male | Female |
| Healthcare Support | 22 (46.8%) | 25 (53.2%) |
| Security & Protection | 0 (0.0%) | 0 (0.0%) |
| Firefighting & Prevention | 0 (0.0%) | 0 (0.0%) |
| Law Enforcement | 0 (0.0%) | 0 (0.0%) |
| Food Preparation & Serving | 0 (0.0%) | 35 (100.0%) |
| Cleaning & Maintenance | 0 (0.0%) | 9 (100.0%) |
| Personal Care & Service | 0 (0.0%) | 0 (0.0%) |
| Total (Category) | 22 (24.2%) | 69 (75.8%) |
| Total (Overall) | 190 (35.1%) | 352 (64.9%) |
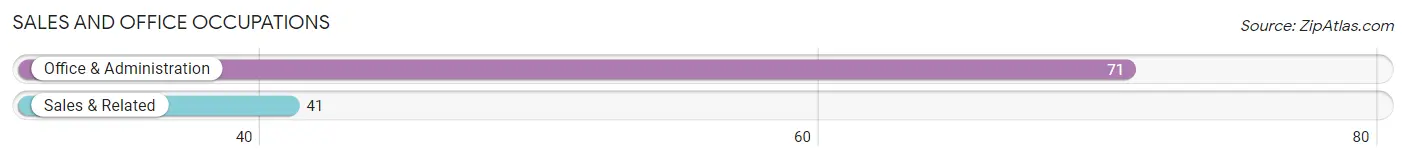
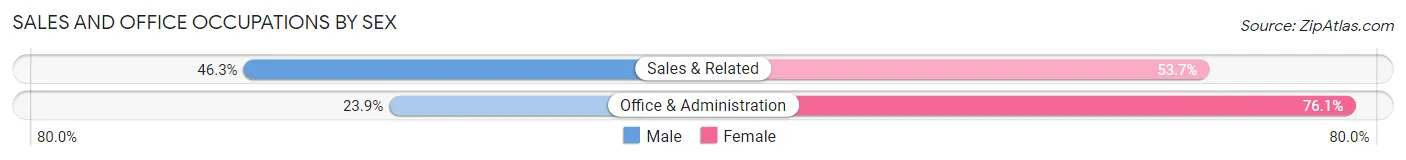
Sales and Office Occupations
The most common Sales and Office occupations in Northfield are Office & Administration (71 | 13.1%), and Sales & Related (41 | 7.6%).
Sales and Office Occupations by Sex
| Occupation | Male | Female |
| Sales & Related | 19 (46.3%) | 22 (53.7%) |
| Office & Administration | 17 (23.9%) | 54 (76.1%) |
| Total (Category) | 36 (32.1%) | 76 (67.9%) |
| Total (Overall) | 190 (35.1%) | 352 (64.9%) |
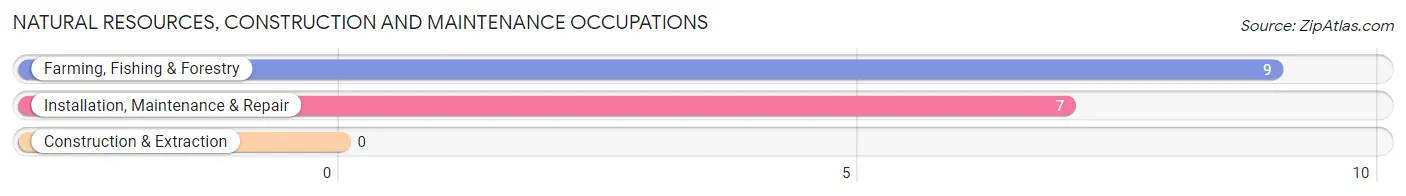
Natural Resources, Construction and Maintenance Occupations
The most common Natural Resources, Construction and Maintenance occupations in Northfield are Farming, Fishing & Forestry (9 | 1.7%), and Installation, Maintenance & Repair (7 | 1.3%).
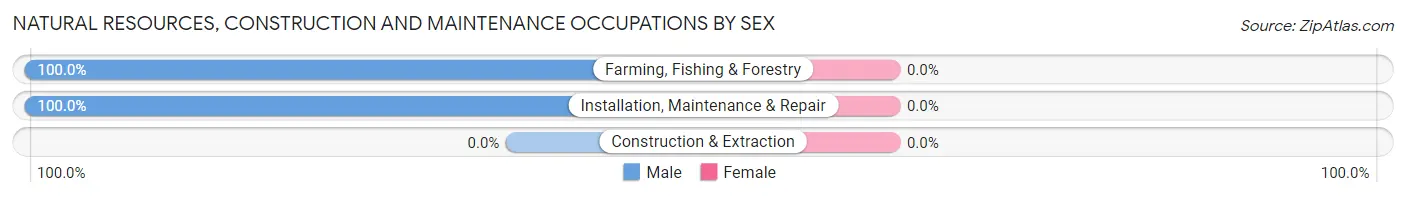
Natural Resources, Construction and Maintenance Occupations by Sex
| Occupation | Male | Female |
| Farming, Fishing & Forestry | 9 (100.0%) | 0 (0.0%) |
| Construction & Extraction | 0 (0.0%) | 0 (0.0%) |
| Installation, Maintenance & Repair | 7 (100.0%) | 0 (0.0%) |
| Total (Category) | 16 (100.0%) | 0 (0.0%) |
| Total (Overall) | 190 (35.1%) | 352 (64.9%) |
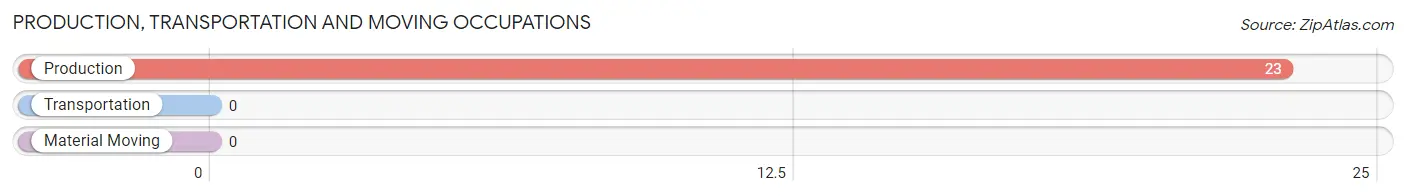
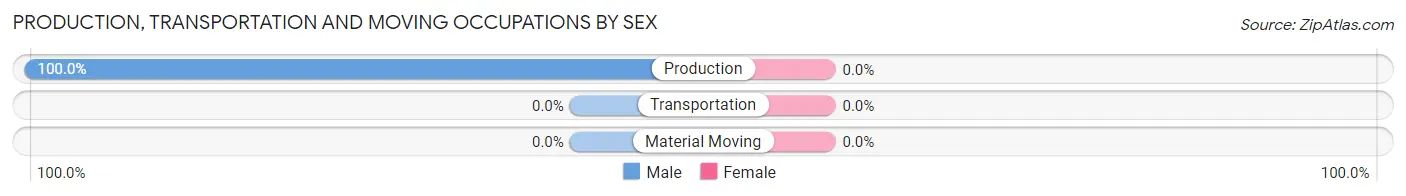
Production, Transportation and Moving Occupations
The most common Production, Transportation and Moving occupations in Northfield are , and Production (23 | 4.2%).
Production, Transportation and Moving Occupations by Sex
| Occupation | Male | Female |
| Production | 23 (100.0%) | 0 (0.0%) |
| Transportation | 0 (0.0%) | 0 (0.0%) |
| Material Moving | 0 (0.0%) | 0 (0.0%) |
| Total (Category) | 23 (100.0%) | 0 (0.0%) |
| Total (Overall) | 190 (35.1%) | 352 (64.9%) |
Employment Industries by Sex in Northfield
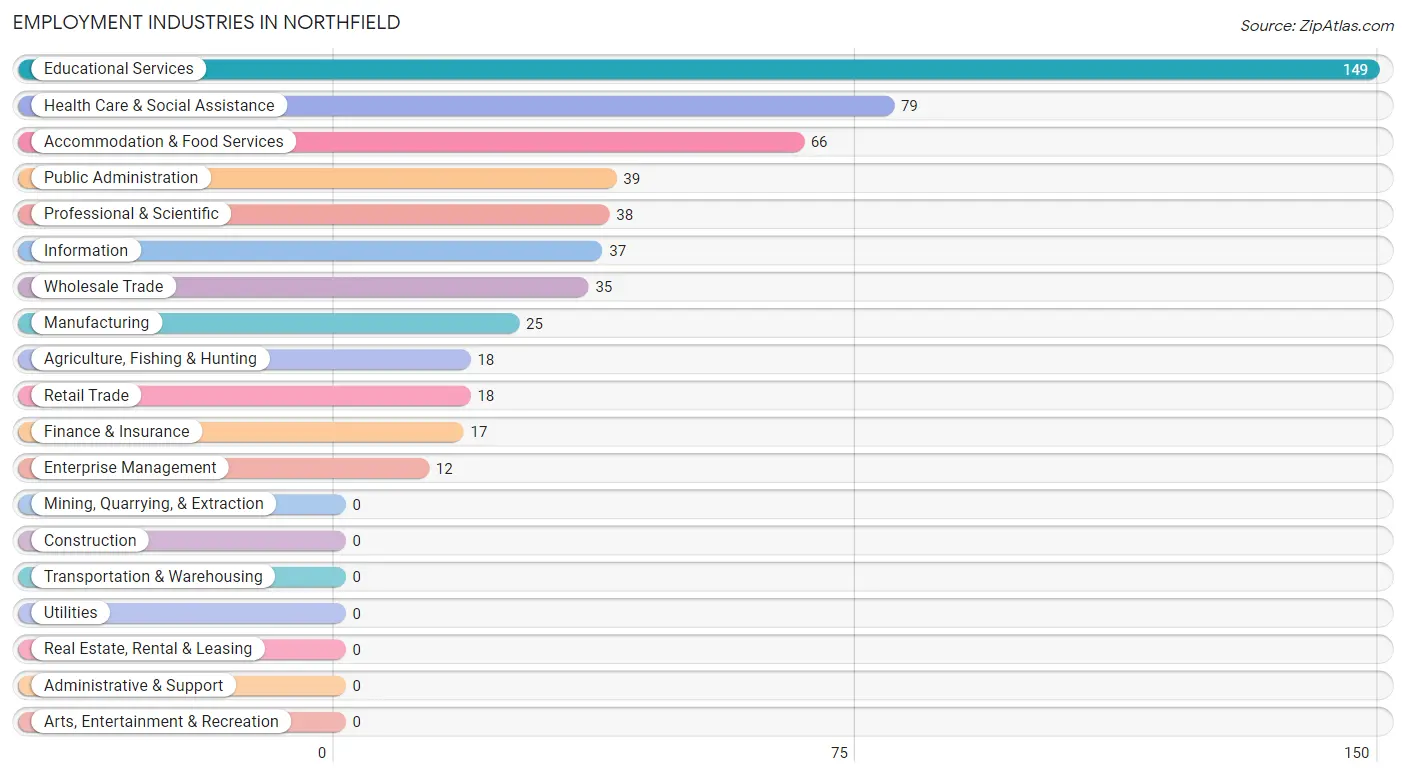
Employment Industries in Northfield
The major employment industries in Northfield include Educational Services (149 | 27.5%), Health Care & Social Assistance (79 | 14.6%), Accommodation & Food Services (66 | 12.2%), Public Administration (39 | 7.2%), and Professional & Scientific (38 | 7.0%).
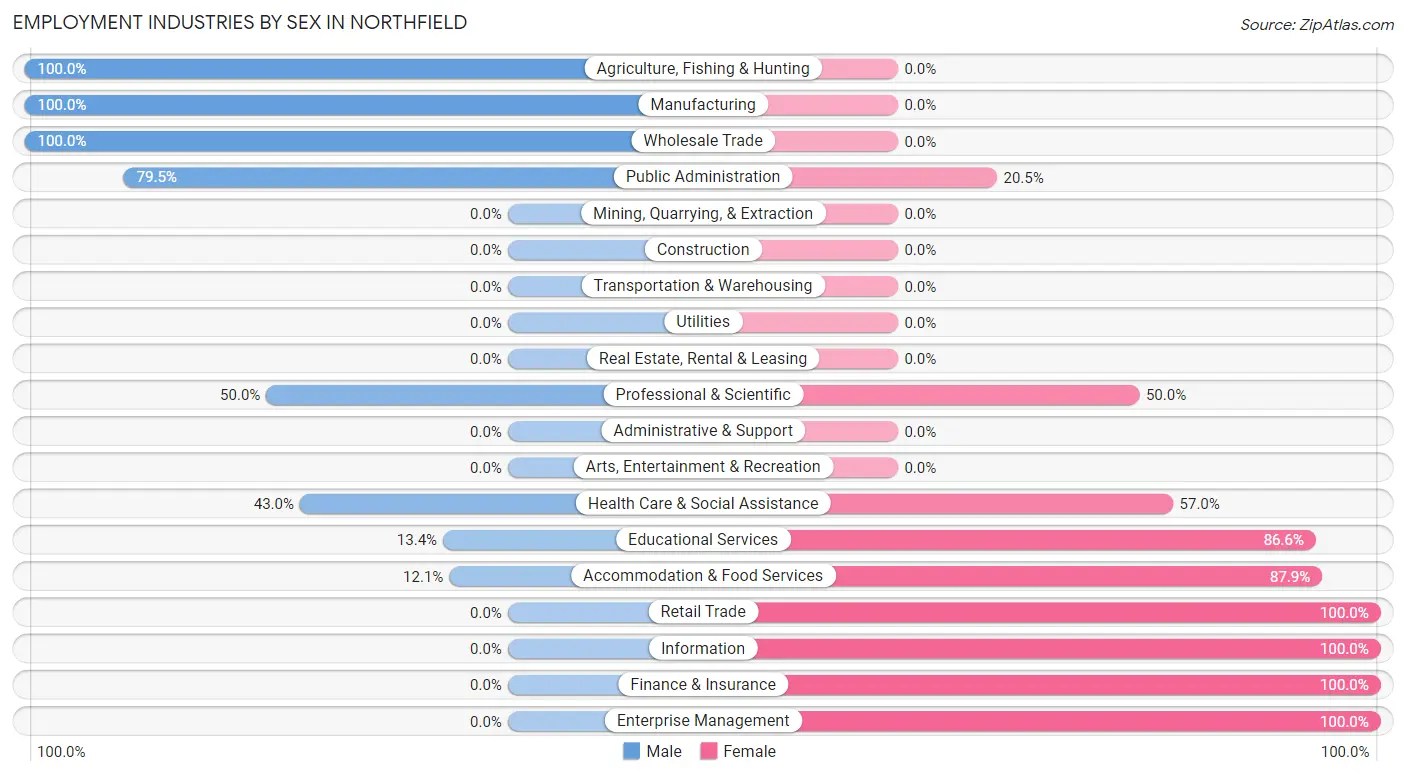
Employment Industries by Sex in Northfield
The Northfield industries that see more men than women are Agriculture, Fishing & Hunting (100.0%), Manufacturing (100.0%), and Wholesale Trade (100.0%), whereas the industries that tend to have a higher number of women are Retail Trade (100.0%), Information (100.0%), and Finance & Insurance (100.0%).
| Industry | Male | Female |
| Agriculture, Fishing & Hunting | 18 (100.0%) | 0 (0.0%) |
| Mining, Quarrying, & Extraction | 0 (0.0%) | 0 (0.0%) |
| Construction | 0 (0.0%) | 0 (0.0%) |
| Manufacturing | 25 (100.0%) | 0 (0.0%) |
| Wholesale Trade | 35 (100.0%) | 0 (0.0%) |
| Retail Trade | 0 (0.0%) | 18 (100.0%) |
| Transportation & Warehousing | 0 (0.0%) | 0 (0.0%) |
| Utilities | 0 (0.0%) | 0 (0.0%) |
| Information | 0 (0.0%) | 37 (100.0%) |
| Finance & Insurance | 0 (0.0%) | 17 (100.0%) |
| Real Estate, Rental & Leasing | 0 (0.0%) | 0 (0.0%) |
| Professional & Scientific | 19 (50.0%) | 19 (50.0%) |
| Enterprise Management | 0 (0.0%) | 12 (100.0%) |
| Administrative & Support | 0 (0.0%) | 0 (0.0%) |
| Educational Services | 20 (13.4%) | 129 (86.6%) |
| Health Care & Social Assistance | 34 (43.0%) | 45 (57.0%) |
| Arts, Entertainment & Recreation | 0 (0.0%) | 0 (0.0%) |
| Accommodation & Food Services | 8 (12.1%) | 58 (87.9%) |
| Public Administration | 31 (79.5%) | 8 (20.5%) |
| Total | 190 (35.1%) | 352 (64.9%) |
Education in Northfield
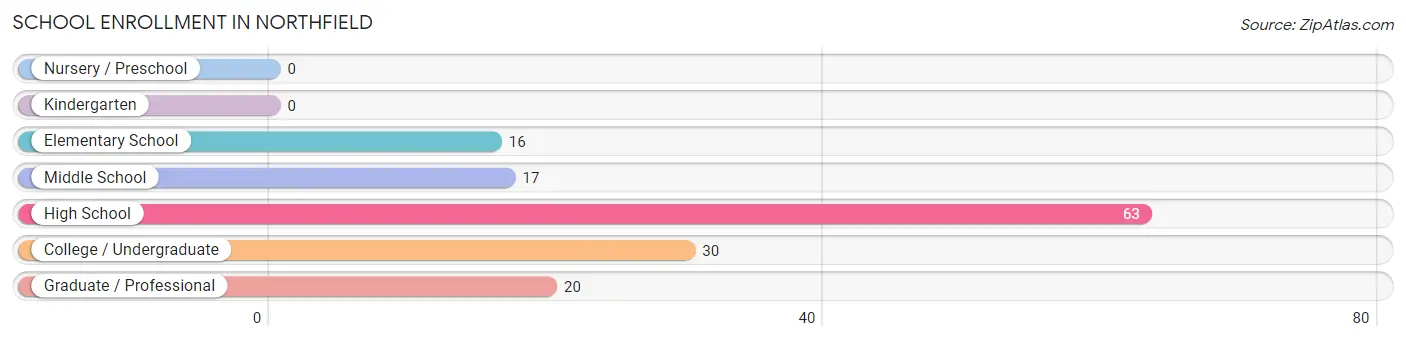
School Enrollment in Northfield
The most common levels of schooling among the 146 students in Northfield are high school (63 | 43.1%), college / undergraduate (30 | 20.5%), and graduate / professional (20 | 13.7%).
| School Level | # Students | % Students |
| Nursery / Preschool | 0 | 0.0% |
| Kindergarten | 0 | 0.0% |
| Elementary School | 16 | 11.0% |
| Middle School | 17 | 11.6% |
| High School | 63 | 43.1% |
| College / Undergraduate | 30 | 20.5% |
| Graduate / Professional | 20 | 13.7% |
| Total | 146 | 100.0% |
School Enrollment by Age by Funding Source in Northfield
Out of a total of 146 students who are enrolled in schools in Northfield, 16 (11.0%) attend a private institution, while the remaining 130 (89.0%) are enrolled in public schools. The age group of 25 to 34 year olds has the highest likelihood of being enrolled in private schools, with 8 (100.0% in the age bracket) enrolled. Conversely, the age group of 5 to 9 year old has the lowest likelihood of being enrolled in a private school, with 16 (100.0% in the age bracket) attending a public institution.
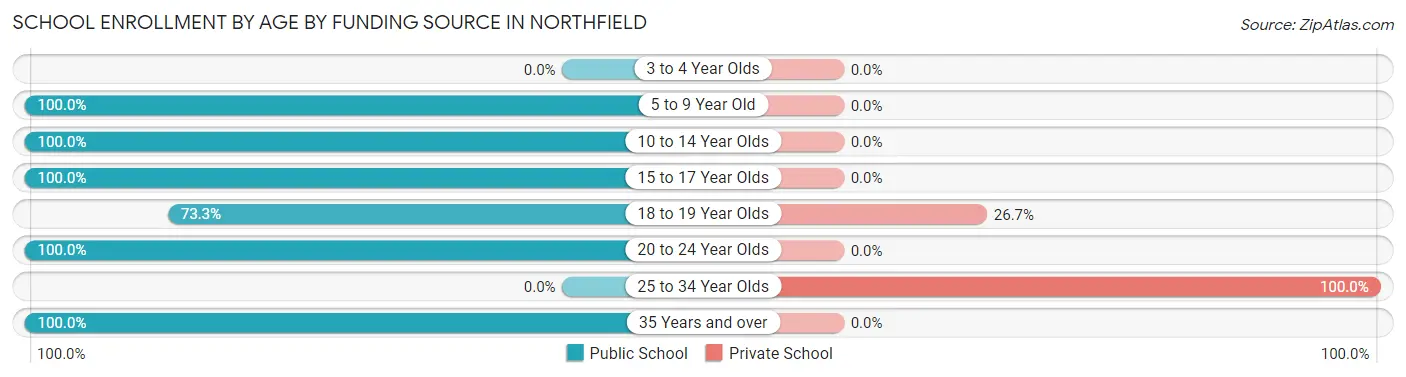
| Age Bracket | Public School | Private School |
| 3 to 4 Year Olds | 0 (0.0%) | 0 (0.0%) |
| 5 to 9 Year Old | 16 (100.0%) | 0 (0.0%) |
| 10 to 14 Year Olds | 17 (100.0%) | 0 (0.0%) |
| 15 to 17 Year Olds | 41 (100.0%) | 0 (0.0%) |
| 18 to 19 Year Olds | 22 (73.3%) | 8 (26.7%) |
| 20 to 24 Year Olds | 22 (100.0%) | 0 (0.0%) |
| 25 to 34 Year Olds | 0 (0.0%) | 8 (100.0%) |
| 35 Years and over | 12 (100.0%) | 0 (0.0%) |
| Total | 130 (89.0%) | 16 (11.0%) |
Educational Attainment by Field of Study in Northfield
Education (67 | 15.9%), bio, nature & agricultural (49 | 11.6%), liberal arts & history (48 | 11.4%), science & technology (44 | 10.4%), and literature & languages (41 | 9.7%) are the most common fields of study among 421 individuals in Northfield who have obtained a bachelor's degree or higher.
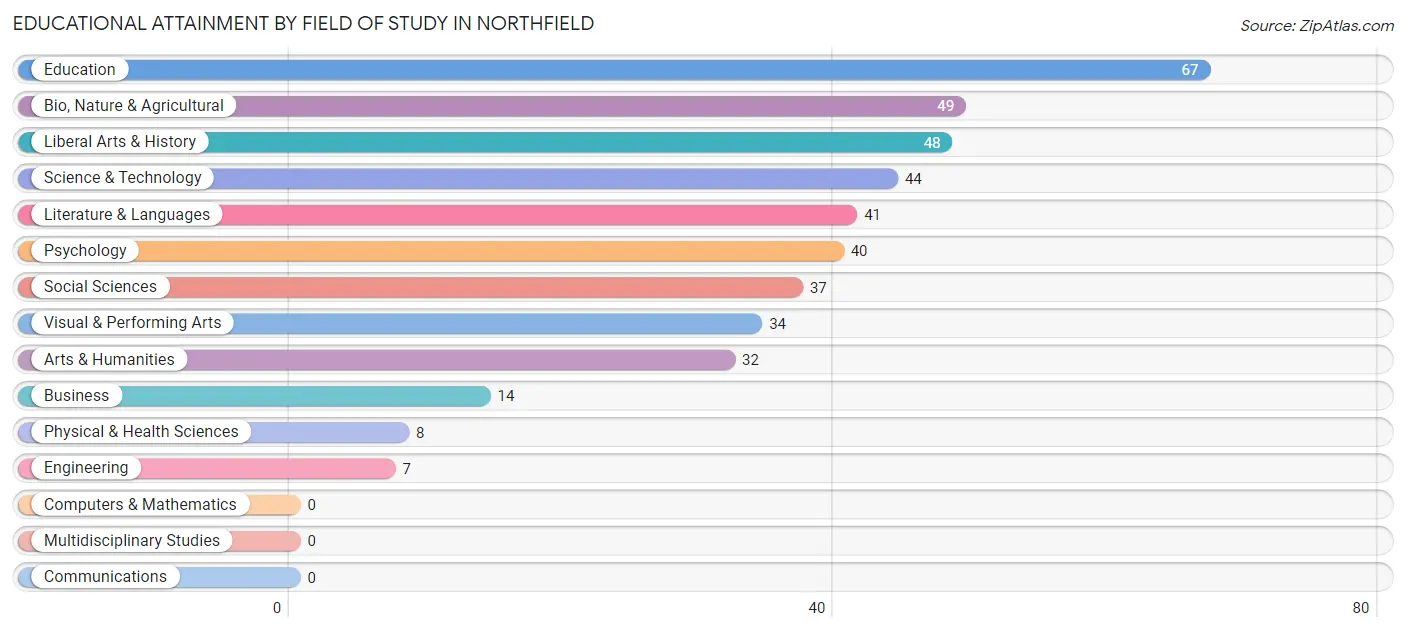
| Field of Study | # Graduates | % Graduates |
| Computers & Mathematics | 0 | 0.0% |
| Bio, Nature & Agricultural | 49 | 11.6% |
| Physical & Health Sciences | 8 | 1.9% |
| Psychology | 40 | 9.5% |
| Social Sciences | 37 | 8.8% |
| Engineering | 7 | 1.7% |
| Multidisciplinary Studies | 0 | 0.0% |
| Science & Technology | 44 | 10.4% |
| Business | 14 | 3.3% |
| Education | 67 | 15.9% |
| Literature & Languages | 41 | 9.7% |
| Liberal Arts & History | 48 | 11.4% |
| Visual & Performing Arts | 34 | 8.1% |
| Communications | 0 | 0.0% |
| Arts & Humanities | 32 | 7.6% |
| Total | 421 | 100.0% |
Transportation & Commute in Northfield
Vehicle Availability by Sex in Northfield
The most prevalent vehicle ownership categories in Northfield are males with 2 vehicles (133, accounting for 70.0%) and females with 2 vehicles (195, making up 37.8%).
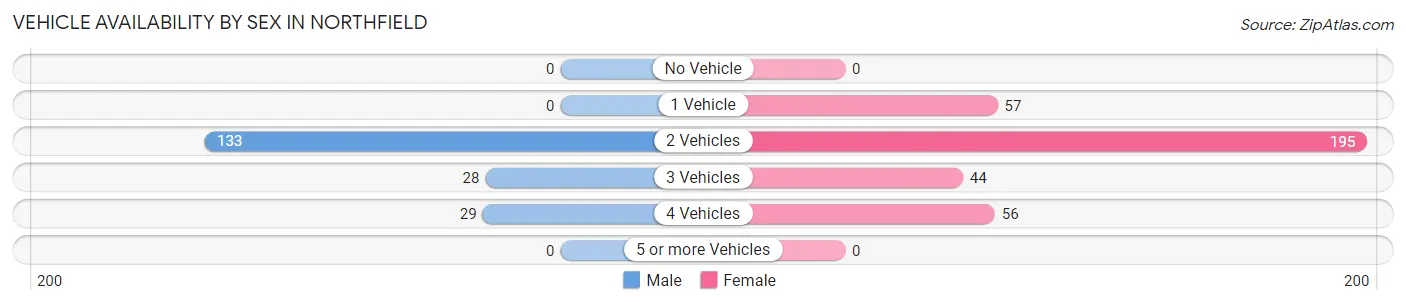
| Vehicles Available | Male | Female |
| No Vehicle | 0 (0.0%) | 0 (0.0%) |
| 1 Vehicle | 0 (0.0%) | 57 (16.2%) |
| 2 Vehicles | 133 (70.0%) | 195 (55.4%) |
| 3 Vehicles | 28 (14.7%) | 44 (12.5%) |
| 4 Vehicles | 29 (15.3%) | 56 (15.9%) |
| 5 or more Vehicles | 0 (0.0%) | 0 (0.0%) |
| Total | 190 (100.0%) | 352 (100.0%) |
Commute Time in Northfield
The most frequently occuring commute durations in Northfield are 20 to 24 minutes (123 commuters, 26.6%), 15 to 19 minutes (63 commuters, 13.6%), and 30 to 34 minutes (60 commuters, 13.0%).
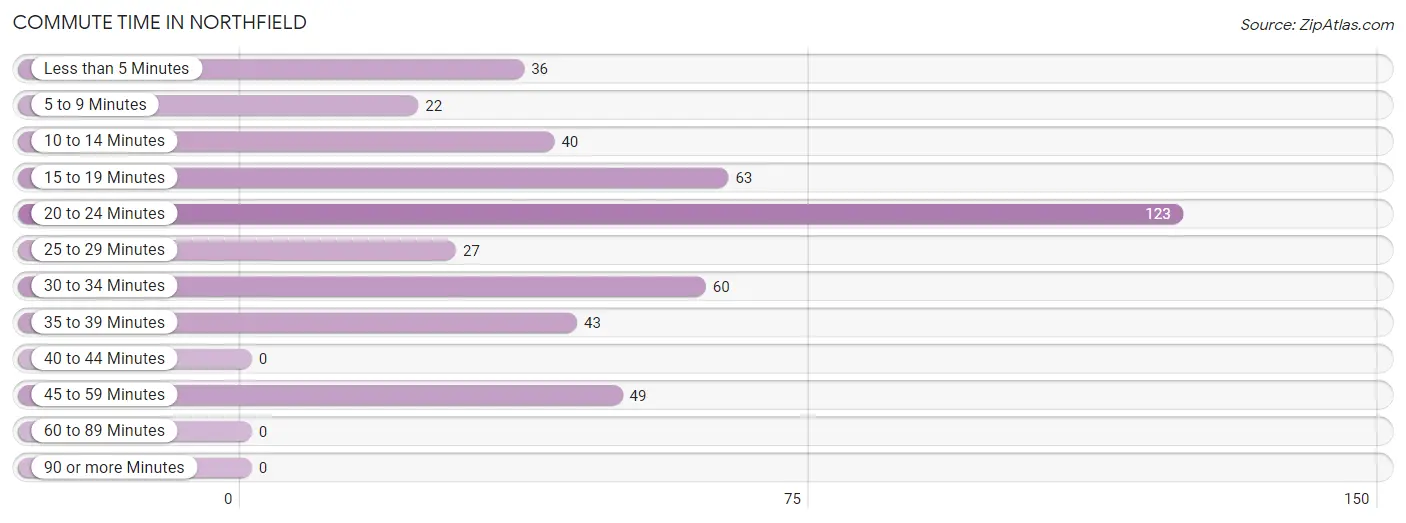
| Commute Time | # Commuters | % Commuters |
| Less than 5 Minutes | 36 | 7.8% |
| 5 to 9 Minutes | 22 | 4.8% |
| 10 to 14 Minutes | 40 | 8.6% |
| 15 to 19 Minutes | 63 | 13.6% |
| 20 to 24 Minutes | 123 | 26.6% |
| 25 to 29 Minutes | 27 | 5.8% |
| 30 to 34 Minutes | 60 | 13.0% |
| 35 to 39 Minutes | 43 | 9.3% |
| 40 to 44 Minutes | 0 | 0.0% |
| 45 to 59 Minutes | 49 | 10.6% |
| 60 to 89 Minutes | 0 | 0.0% |
| 90 or more Minutes | 0 | 0.0% |
Commute Time by Sex in Northfield
The most common commute times in Northfield are 45 to 59 minutes (49 commuters, 30.2%) for males and 20 to 24 minutes (87 commuters, 28.9%) for females.
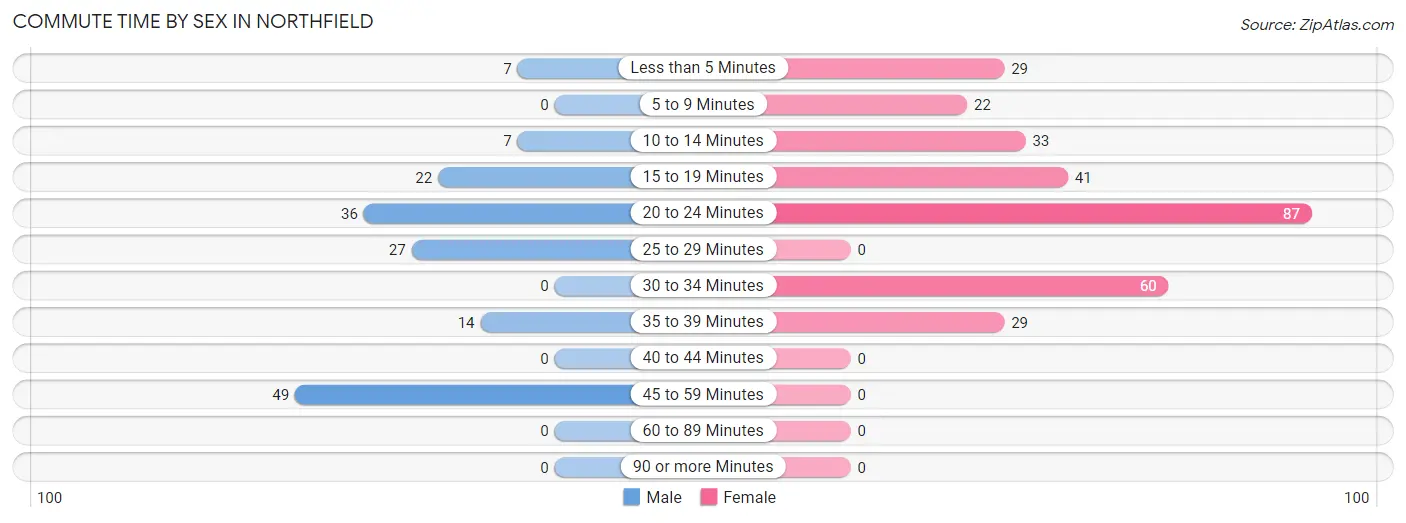
| Commute Time | Male | Female |
| Less than 5 Minutes | 7 (4.3%) | 29 (9.6%) |
| 5 to 9 Minutes | 0 (0.0%) | 22 (7.3%) |
| 10 to 14 Minutes | 7 (4.3%) | 33 (11.0%) |
| 15 to 19 Minutes | 22 (13.6%) | 41 (13.6%) |
| 20 to 24 Minutes | 36 (22.2%) | 87 (28.9%) |
| 25 to 29 Minutes | 27 (16.7%) | 0 (0.0%) |
| 30 to 34 Minutes | 0 (0.0%) | 60 (19.9%) |
| 35 to 39 Minutes | 14 (8.6%) | 29 (9.6%) |
| 40 to 44 Minutes | 0 (0.0%) | 0 (0.0%) |
| 45 to 59 Minutes | 49 (30.2%) | 0 (0.0%) |
| 60 to 89 Minutes | 0 (0.0%) | 0 (0.0%) |
| 90 or more Minutes | 0 (0.0%) | 0 (0.0%) |
Time of Departure to Work by Sex in Northfield
The most frequent times of departure to work in Northfield are 7:00 AM to 7:29 AM (46, 28.4%) for males and 8:00 AM to 8:29 AM (95, 31.6%) for females.
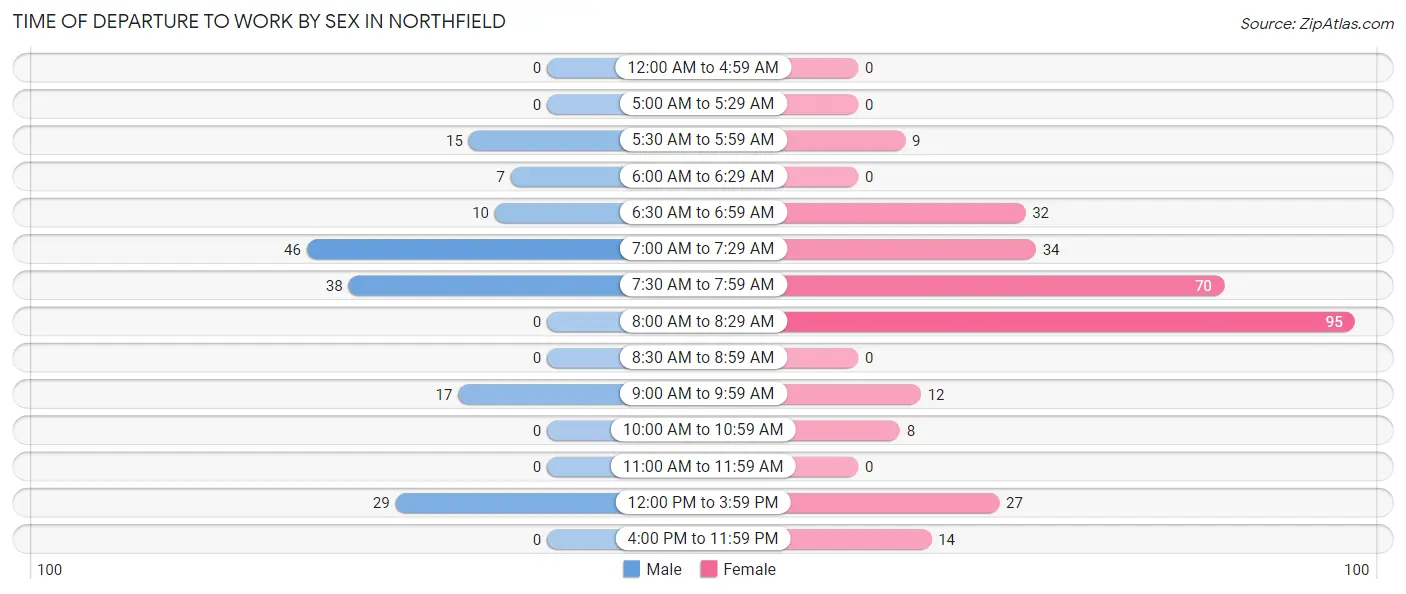
| Time of Departure | Male | Female |
| 12:00 AM to 4:59 AM | 0 (0.0%) | 0 (0.0%) |
| 5:00 AM to 5:29 AM | 0 (0.0%) | 0 (0.0%) |
| 5:30 AM to 5:59 AM | 15 (9.3%) | 9 (3.0%) |
| 6:00 AM to 6:29 AM | 7 (4.3%) | 0 (0.0%) |
| 6:30 AM to 6:59 AM | 10 (6.2%) | 32 (10.6%) |
| 7:00 AM to 7:29 AM | 46 (28.4%) | 34 (11.3%) |
| 7:30 AM to 7:59 AM | 38 (23.5%) | 70 (23.3%) |
| 8:00 AM to 8:29 AM | 0 (0.0%) | 95 (31.6%) |
| 8:30 AM to 8:59 AM | 0 (0.0%) | 0 (0.0%) |
| 9:00 AM to 9:59 AM | 17 (10.5%) | 12 (4.0%) |
| 10:00 AM to 10:59 AM | 0 (0.0%) | 8 (2.7%) |
| 11:00 AM to 11:59 AM | 0 (0.0%) | 0 (0.0%) |
| 12:00 PM to 3:59 PM | 29 (17.9%) | 27 (9.0%) |
| 4:00 PM to 11:59 PM | 0 (0.0%) | 14 (4.6%) |
| Total | 162 (100.0%) | 301 (100.0%) |
Housing Occupancy in Northfield
Occupancy by Ownership in Northfield
Of the total 473 dwellings in Northfield, owner-occupied units account for 378 (79.9%), while renter-occupied units make up 95 (20.1%).
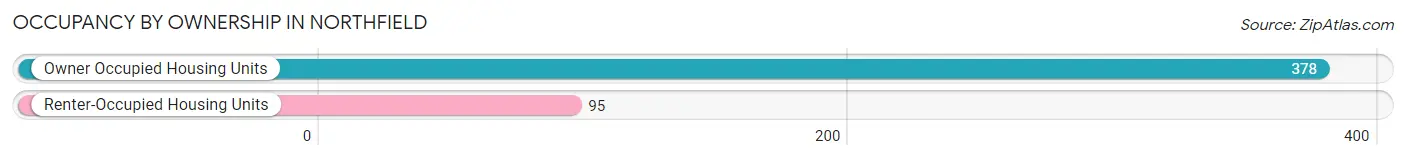
| Occupancy | # Housing Units | % Housing Units |
| Owner Occupied Housing Units | 378 | 79.9% |
| Renter-Occupied Housing Units | 95 | 20.1% |
| Total Occupied Housing Units | 473 | 100.0% |
Occupancy by Household Size in Northfield
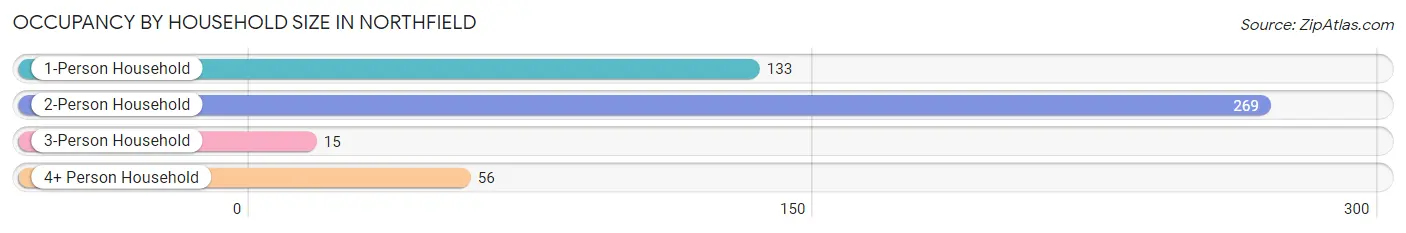
| Household Size | # Housing Units | % Housing Units |
| 1-Person Household | 133 | 28.1% |
| 2-Person Household | 269 | 56.9% |
| 3-Person Household | 15 | 3.2% |
| 4+ Person Household | 56 | 11.8% |
| Total Housing Units | 473 | 100.0% |
Occupancy by Ownership by Household Size in Northfield
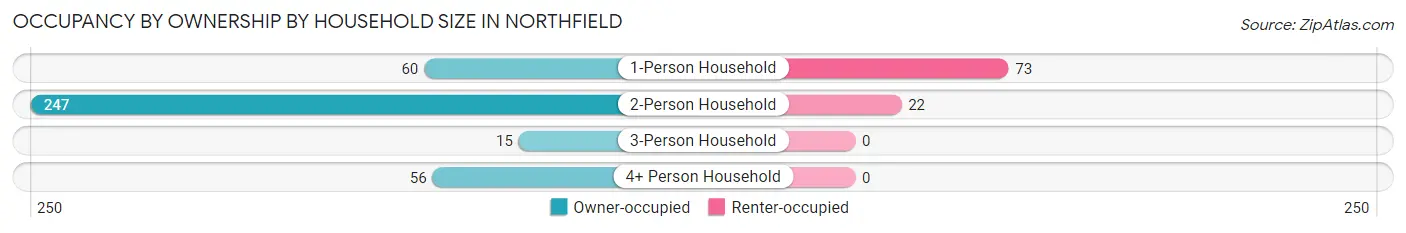
| Household Size | Owner-occupied | Renter-occupied |
| 1-Person Household | 60 (45.1%) | 73 (54.9%) |
| 2-Person Household | 247 (91.8%) | 22 (8.2%) |
| 3-Person Household | 15 (100.0%) | 0 (0.0%) |
| 4+ Person Household | 56 (100.0%) | 0 (0.0%) |
| Total Housing Units | 378 (79.9%) | 95 (20.1%) |
Occupancy by Educational Attainment in Northfield
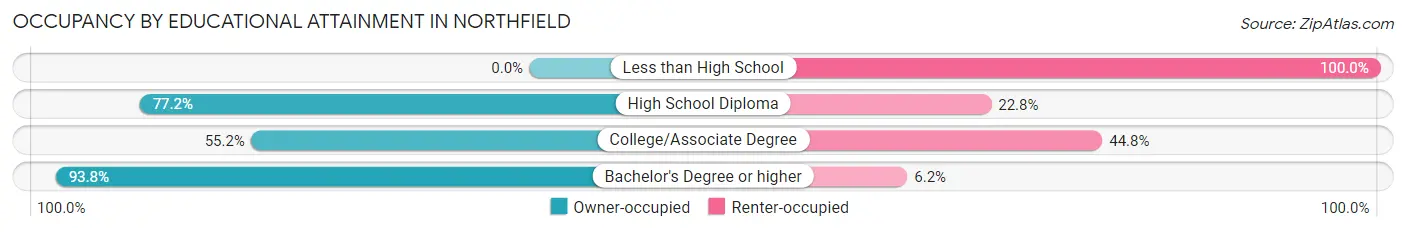
| Household Size | Owner-occupied | Renter-occupied |
| Less than High School | 0 (0.0%) | 6 (100.0%) |
| High School Diploma | 71 (77.2%) | 21 (22.8%) |
| College/Associate Degree | 64 (55.2%) | 52 (44.8%) |
| Bachelor's Degree or higher | 243 (93.8%) | 16 (6.2%) |
Occupancy by Age of Householder in Northfield
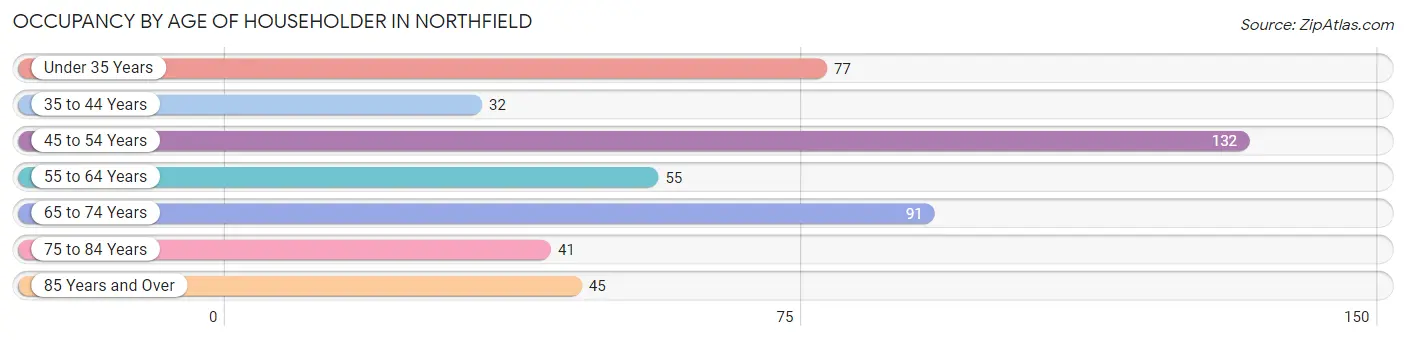
| Age Bracket | # Households | % Households |
| Under 35 Years | 77 | 16.3% |
| 35 to 44 Years | 32 | 6.8% |
| 45 to 54 Years | 132 | 27.9% |
| 55 to 64 Years | 55 | 11.6% |
| 65 to 74 Years | 91 | 19.2% |
| 75 to 84 Years | 41 | 8.7% |
| 85 Years and Over | 45 | 9.5% |
| Total | 473 | 100.0% |
Housing Finances in Northfield
Median Income by Occupancy in Northfield
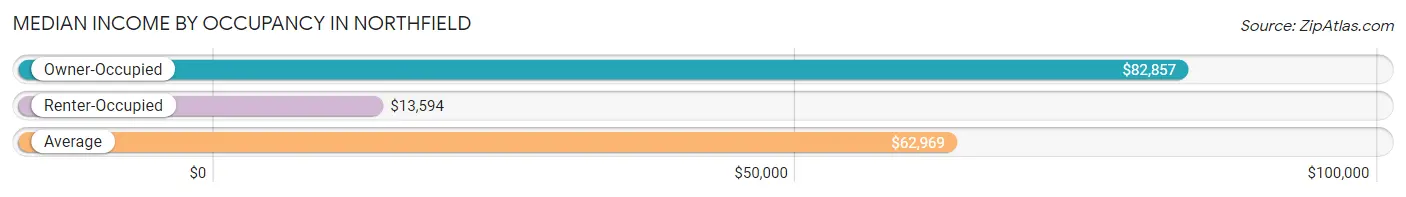
| Occupancy Type | # Households | Median Income |
| Owner-Occupied | 378 (79.9%) | $82,857 |
| Renter-Occupied | 95 (20.1%) | $13,594 |
| Average | 473 (100.0%) | $62,969 |
Occupancy by Householder Income Bracket in Northfield
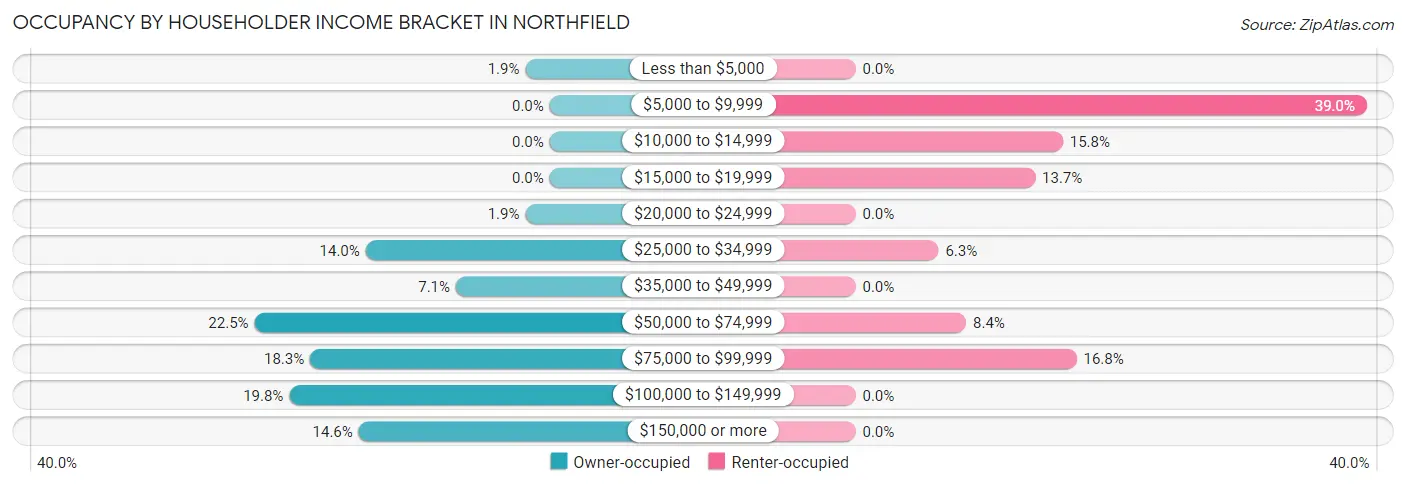
| Income Bracket | Owner-occupied | Renter-occupied |
| Less than $5,000 | 7 (1.8%) | 0 (0.0%) |
| $5,000 to $9,999 | 0 (0.0%) | 37 (39.0%) |
| $10,000 to $14,999 | 0 (0.0%) | 15 (15.8%) |
| $15,000 to $19,999 | 0 (0.0%) | 13 (13.7%) |
| $20,000 to $24,999 | 7 (1.8%) | 0 (0.0%) |
| $25,000 to $34,999 | 53 (14.0%) | 6 (6.3%) |
| $35,000 to $49,999 | 27 (7.1%) | 0 (0.0%) |
| $50,000 to $74,999 | 85 (22.5%) | 8 (8.4%) |
| $75,000 to $99,999 | 69 (18.2%) | 16 (16.8%) |
| $100,000 to $149,999 | 75 (19.8%) | 0 (0.0%) |
| $150,000 or more | 55 (14.5%) | 0 (0.0%) |
| Total | 378 (100.0%) | 95 (100.0%) |
Monthly Housing Cost Tiers in Northfield
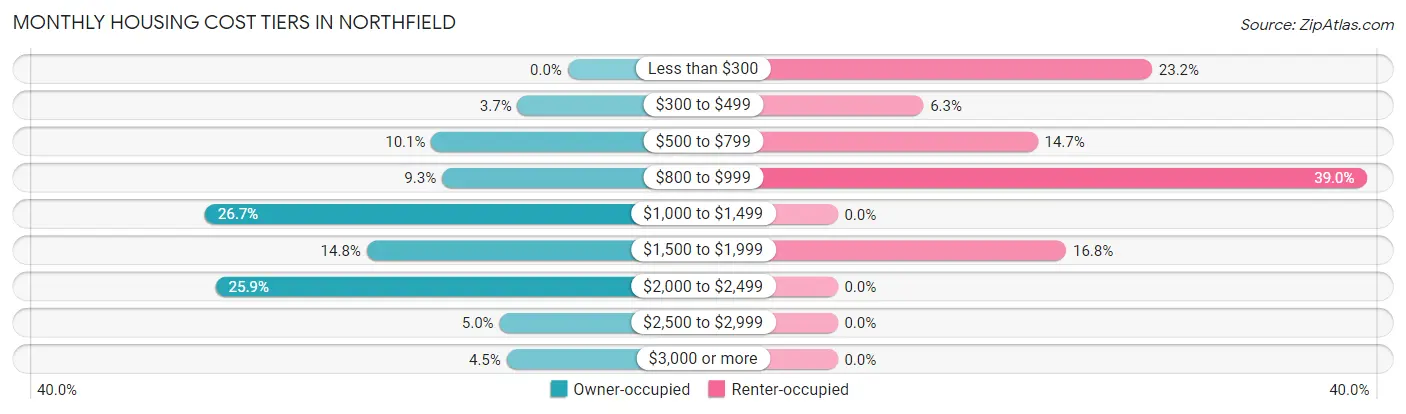
| Monthly Cost | Owner-occupied | Renter-occupied |
| Less than $300 | 0 (0.0%) | 22 (23.2%) |
| $300 to $499 | 14 (3.7%) | 6 (6.3%) |
| $500 to $799 | 38 (10.1%) | 14 (14.7%) |
| $800 to $999 | 35 (9.3%) | 37 (39.0%) |
| $1,000 to $1,499 | 101 (26.7%) | 0 (0.0%) |
| $1,500 to $1,999 | 56 (14.8%) | 16 (16.8%) |
| $2,000 to $2,499 | 98 (25.9%) | 0 (0.0%) |
| $2,500 to $2,999 | 19 (5.0%) | 0 (0.0%) |
| $3,000 or more | 17 (4.5%) | 0 (0.0%) |
| Total | 378 (100.0%) | 95 (100.0%) |
Physical Housing Characteristics in Northfield
Housing Structures in Northfield
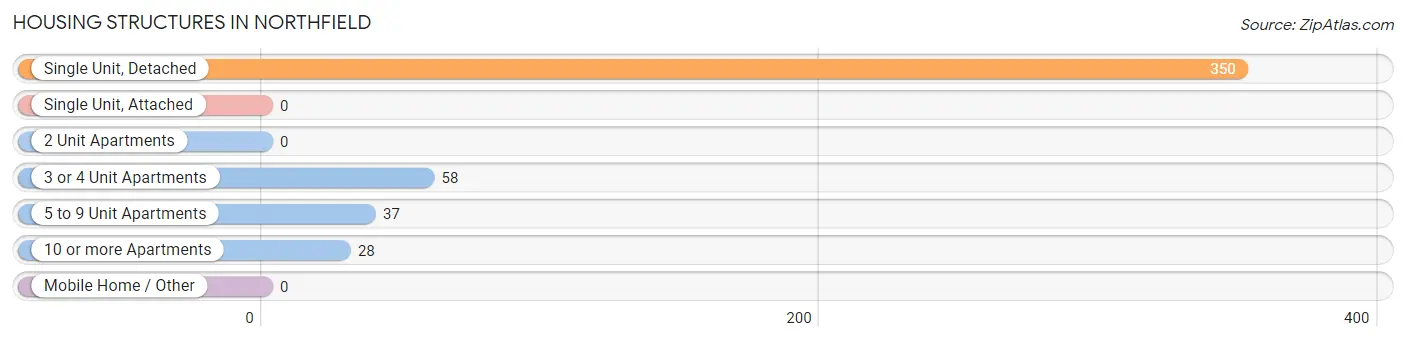
| Structure Type | # Housing Units | % Housing Units |
| Single Unit, Detached | 350 | 74.0% |
| Single Unit, Attached | 0 | 0.0% |
| 2 Unit Apartments | 0 | 0.0% |
| 3 or 4 Unit Apartments | 58 | 12.3% |
| 5 to 9 Unit Apartments | 37 | 7.8% |
| 10 or more Apartments | 28 | 5.9% |
| Mobile Home / Other | 0 | 0.0% |
| Total | 473 | 100.0% |
Housing Structures by Occupancy in Northfield
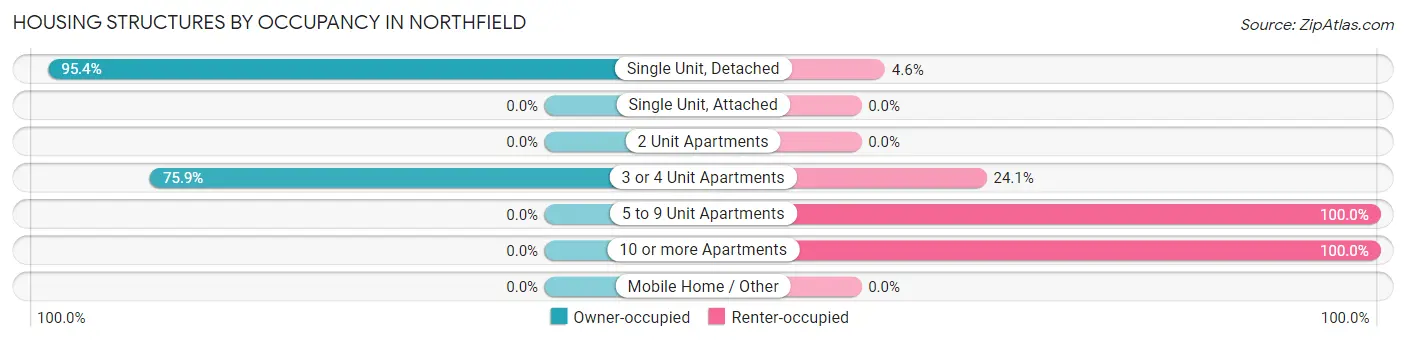
| Structure Type | Owner-occupied | Renter-occupied |
| Single Unit, Detached | 334 (95.4%) | 16 (4.6%) |
| Single Unit, Attached | 0 (0.0%) | 0 (0.0%) |
| 2 Unit Apartments | 0 (0.0%) | 0 (0.0%) |
| 3 or 4 Unit Apartments | 44 (75.9%) | 14 (24.1%) |
| 5 to 9 Unit Apartments | 0 (0.0%) | 37 (100.0%) |
| 10 or more Apartments | 0 (0.0%) | 28 (100.0%) |
| Mobile Home / Other | 0 (0.0%) | 0 (0.0%) |
| Total | 378 (79.9%) | 95 (20.1%) |
Housing Structures by Number of Rooms in Northfield
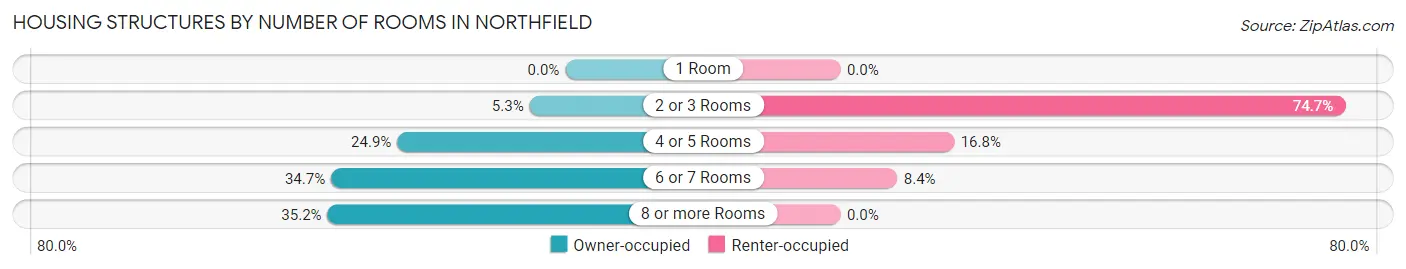
| Number of Rooms | Owner-occupied | Renter-occupied |
| 1 Room | 0 (0.0%) | 0 (0.0%) |
| 2 or 3 Rooms | 20 (5.3%) | 71 (74.7%) |
| 4 or 5 Rooms | 94 (24.9%) | 16 (16.8%) |
| 6 or 7 Rooms | 131 (34.7%) | 8 (8.4%) |
| 8 or more Rooms | 133 (35.2%) | 0 (0.0%) |
| Total | 378 (100.0%) | 95 (100.0%) |
Housing Structure by Heating Type in Northfield
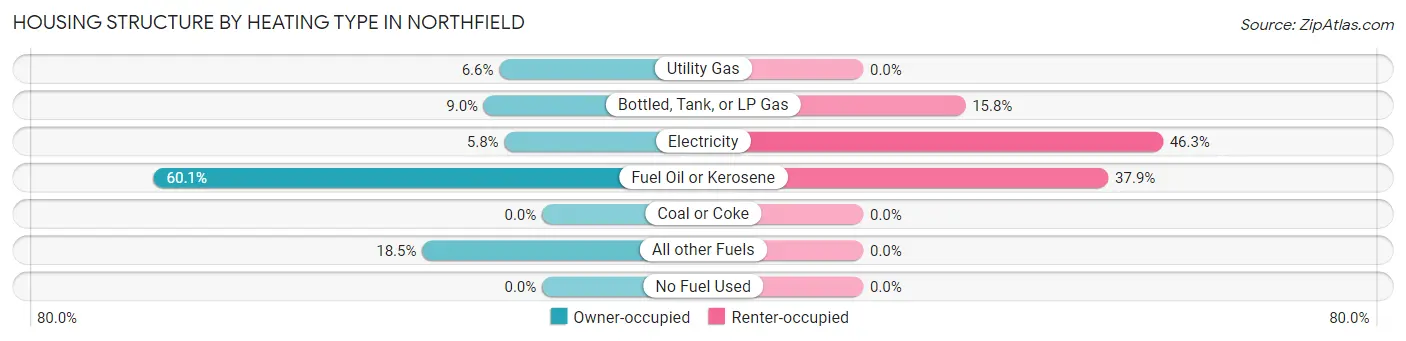
| Heating Type | Owner-occupied | Renter-occupied |
| Utility Gas | 25 (6.6%) | 0 (0.0%) |
| Bottled, Tank, or LP Gas | 34 (9.0%) | 15 (15.8%) |
| Electricity | 22 (5.8%) | 44 (46.3%) |
| Fuel Oil or Kerosene | 227 (60.1%) | 36 (37.9%) |
| Coal or Coke | 0 (0.0%) | 0 (0.0%) |
| All other Fuels | 70 (18.5%) | 0 (0.0%) |
| No Fuel Used | 0 (0.0%) | 0 (0.0%) |
| Total | 378 (100.0%) | 95 (100.0%) |
Household Vehicle Usage in Northfield
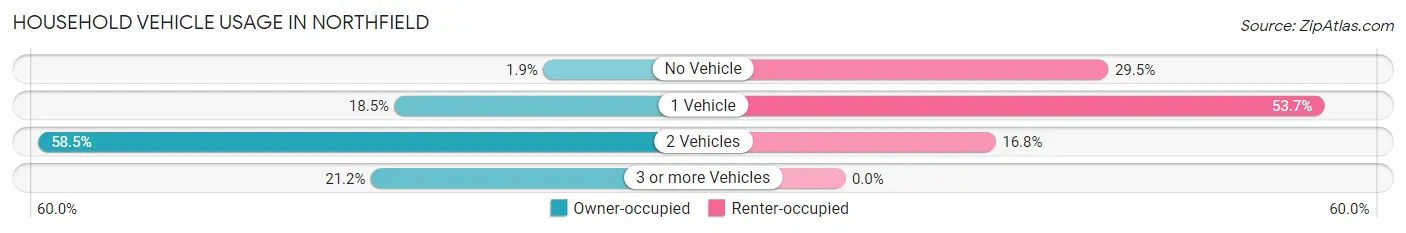
| Vehicles per Household | Owner-occupied | Renter-occupied |
| No Vehicle | 7 (1.8%) | 28 (29.5%) |
| 1 Vehicle | 70 (18.5%) | 51 (53.7%) |
| 2 Vehicles | 221 (58.5%) | 16 (16.8%) |
| 3 or more Vehicles | 80 (21.2%) | 0 (0.0%) |
| Total | 378 (100.0%) | 95 (100.0%) |
Real Estate & Mortgages in Northfield
Real Estate and Mortgage Overview in Northfield
| Characteristic | Without Mortgage | With Mortgage |
| Housing Units | 108 | 270 |
| Median Property Value | $325,000 | $262,100 |
| Median Household Income | $56,875 | $48 |
| Monthly Housing Costs | $822 | $17 |
| Real Estate Taxes | $3,947 | $24 |
Property Value by Mortgage Status in Northfield
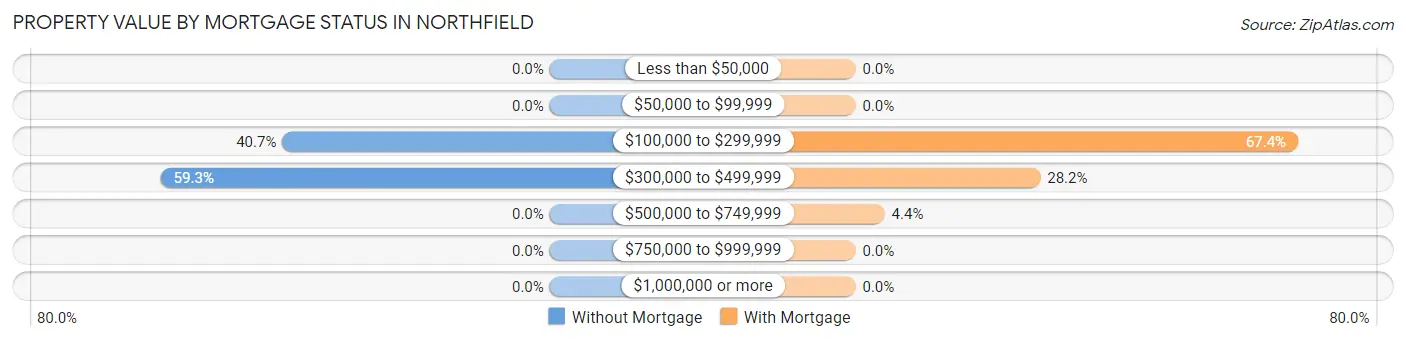
| Property Value | Without Mortgage | With Mortgage |
| Less than $50,000 | 0 (0.0%) | 0 (0.0%) |
| $50,000 to $99,999 | 0 (0.0%) | 0 (0.0%) |
| $100,000 to $299,999 | 44 (40.7%) | 182 (67.4%) |
| $300,000 to $499,999 | 64 (59.3%) | 76 (28.1%) |
| $500,000 to $749,999 | 0 (0.0%) | 12 (4.4%) |
| $750,000 to $999,999 | 0 (0.0%) | 0 (0.0%) |
| $1,000,000 or more | 0 (0.0%) | 0 (0.0%) |
| Total | 108 (100.0%) | 270 (100.0%) |
Household Income by Mortgage Status in Northfield
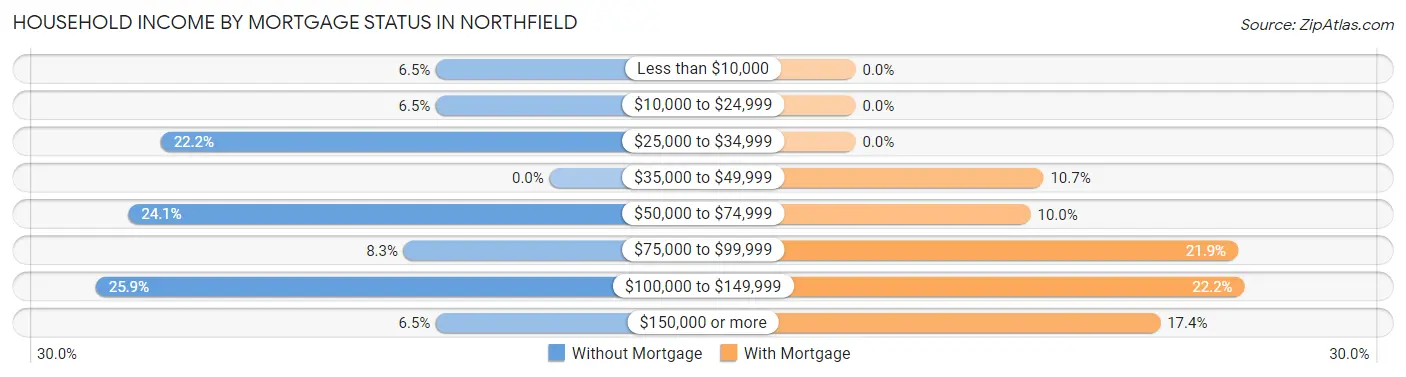
| Household Income | Without Mortgage | With Mortgage |
| Less than $10,000 | 7 (6.5%) | 0 (0.0%) |
| $10,000 to $24,999 | 7 (6.5%) | 0 (0.0%) |
| $25,000 to $34,999 | 24 (22.2%) | 0 (0.0%) |
| $35,000 to $49,999 | 0 (0.0%) | 29 (10.7%) |
| $50,000 to $74,999 | 26 (24.1%) | 27 (10.0%) |
| $75,000 to $99,999 | 9 (8.3%) | 59 (21.8%) |
| $100,000 to $149,999 | 28 (25.9%) | 60 (22.2%) |
| $150,000 or more | 7 (6.5%) | 47 (17.4%) |
| Total | 108 (100.0%) | 270 (100.0%) |
Property Value to Household Income Ratio in Northfield
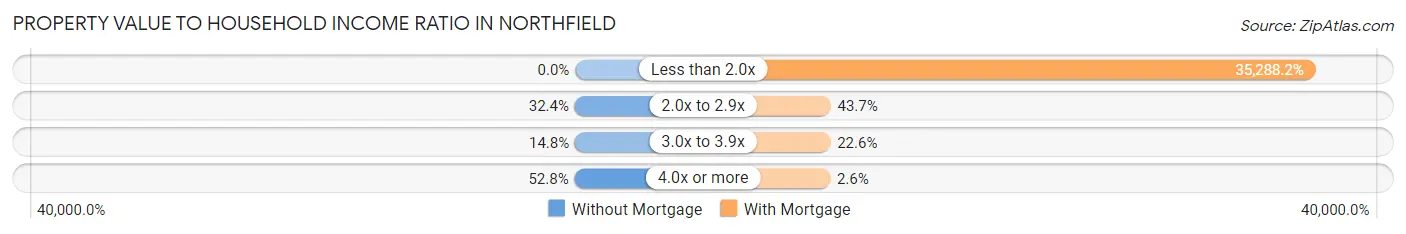
| Value-to-Income Ratio | Without Mortgage | With Mortgage |
| Less than 2.0x | 0 (0.0%) | 95,278 (35,288.2%) |
| 2.0x to 2.9x | 35 (32.4%) | 118 (43.7%) |
| 3.0x to 3.9x | 16 (14.8%) | 61 (22.6%) |
| 4.0x or more | 57 (52.8%) | 7 (2.6%) |
| Total | 108 (100.0%) | 270 (100.0%) |
Real Estate Taxes by Mortgage Status in Northfield
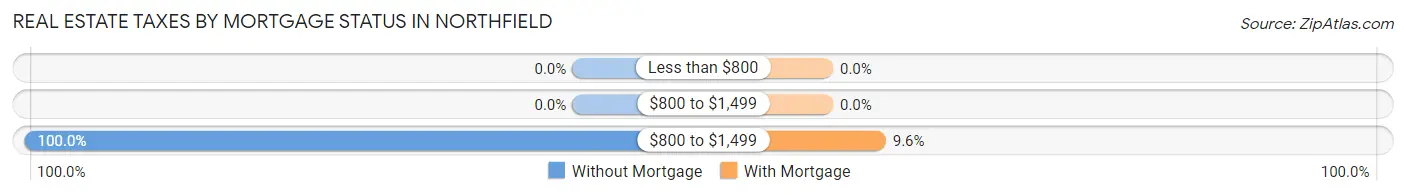
| Property Taxes | Without Mortgage | With Mortgage |
| Less than $800 | 0 (0.0%) | 0 (0.0%) |
| $800 to $1,499 | 0 (0.0%) | 0 (0.0%) |
| $800 to $1,499 | 108 (100.0%) | 26 (9.6%) |
| Total | 108 (100.0%) | 270 (100.0%) |
Health & Disability in Northfield
Health Insurance Coverage by Age in Northfield
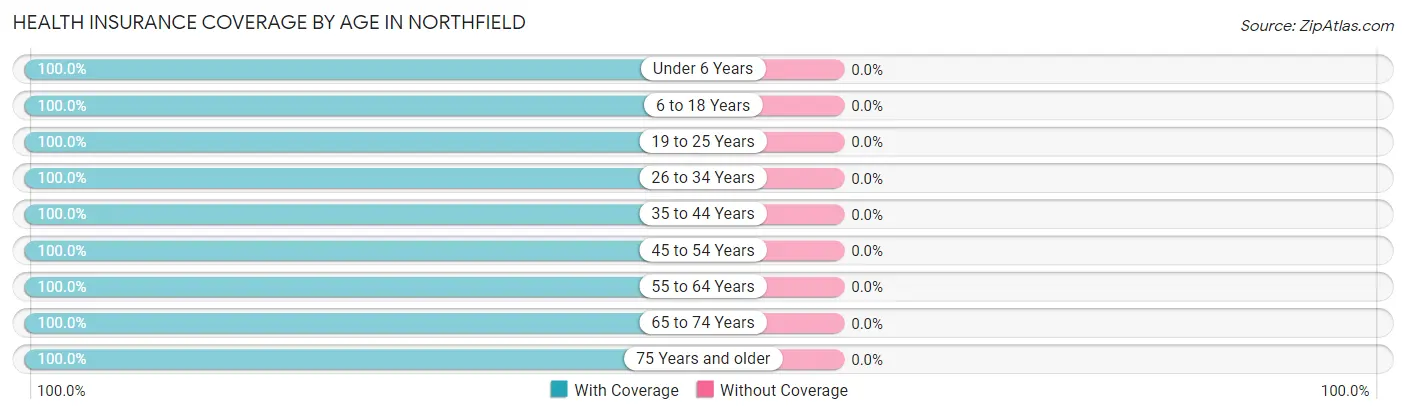
| Age Bracket | With Coverage | Without Coverage |
| Under 6 Years | 14 (100.0%) | 0 (0.0%) |
| 6 to 18 Years | 104 (100.0%) | 0 (0.0%) |
| 19 to 25 Years | 35 (100.0%) | 0 (0.0%) |
| 26 to 34 Years | 96 (100.0%) | 0 (0.0%) |
| 35 to 44 Years | 98 (100.0%) | 0 (0.0%) |
| 45 to 54 Years | 190 (100.0%) | 0 (0.0%) |
| 55 to 64 Years | 80 (100.0%) | 0 (0.0%) |
| 65 to 74 Years | 139 (100.0%) | 0 (0.0%) |
| 75 Years and older | 152 (100.0%) | 0 (0.0%) |
| Total | 908 (100.0%) | 0 (0.0%) |
Health Insurance Coverage by Citizenship Status in Northfield
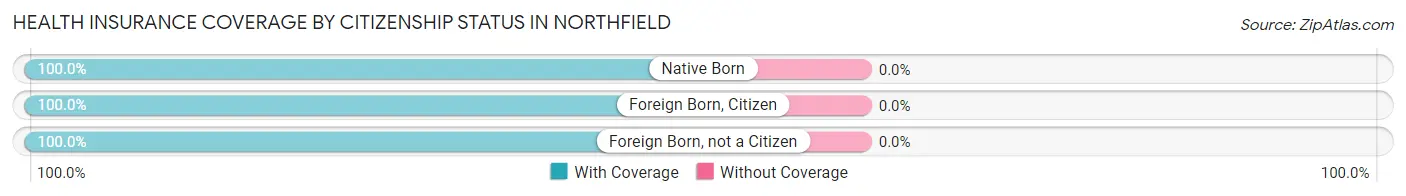
| Citizenship Status | With Coverage | Without Coverage |
| Native Born | 14 (100.0%) | 0 (0.0%) |
| Foreign Born, Citizen | 104 (100.0%) | 0 (0.0%) |
| Foreign Born, not a Citizen | 35 (100.0%) | 0 (0.0%) |
Health Insurance Coverage by Household Income in Northfield
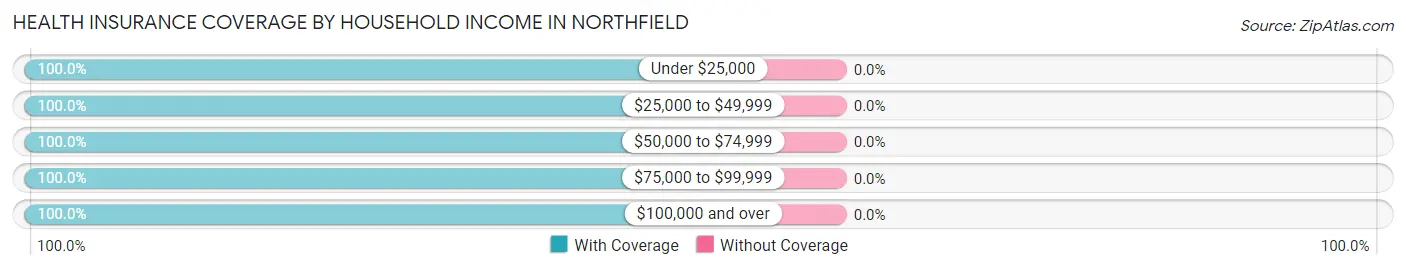
| Household Income | With Coverage | Without Coverage |
| Under $25,000 | 79 (100.0%) | 0 (0.0%) |
| $25,000 to $49,999 | 135 (100.0%) | 0 (0.0%) |
| $50,000 to $74,999 | 165 (100.0%) | 0 (0.0%) |
| $75,000 to $99,999 | 160 (100.0%) | 0 (0.0%) |
| $100,000 and over | 369 (100.0%) | 0 (0.0%) |
Public vs Private Health Insurance Coverage by Age in Northfield
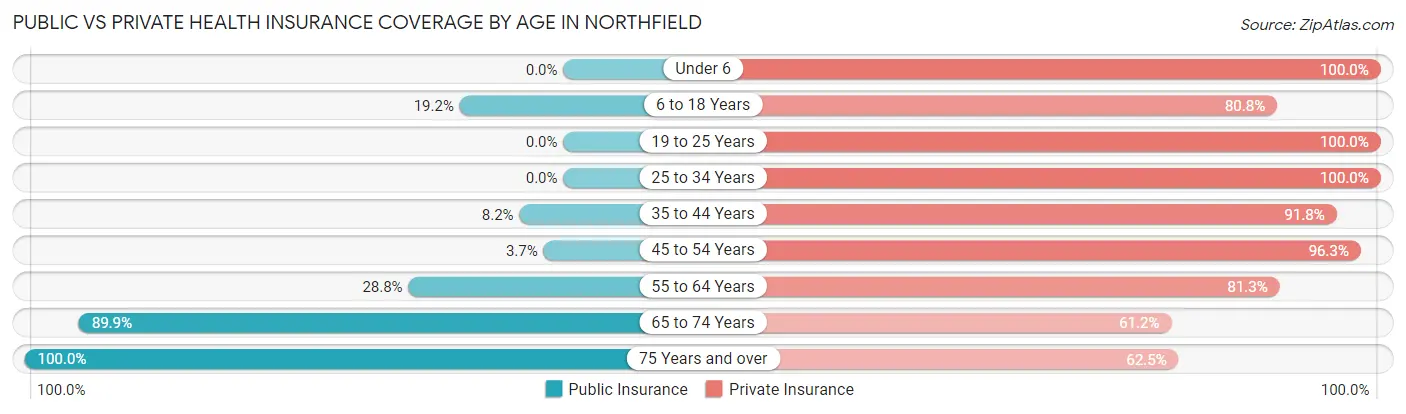
| Age Bracket | Public Insurance | Private Insurance |
| Under 6 | 0 (0.0%) | 14 (100.0%) |
| 6 to 18 Years | 20 (19.2%) | 84 (80.8%) |
| 19 to 25 Years | 0 (0.0%) | 35 (100.0%) |
| 25 to 34 Years | 0 (0.0%) | 96 (100.0%) |
| 35 to 44 Years | 8 (8.2%) | 90 (91.8%) |
| 45 to 54 Years | 7 (3.7%) | 183 (96.3%) |
| 55 to 64 Years | 23 (28.7%) | 65 (81.2%) |
| 65 to 74 Years | 125 (89.9%) | 85 (61.2%) |
| 75 Years and over | 152 (100.0%) | 95 (62.5%) |
| Total | 335 (36.9%) | 747 (82.3%) |
Disability Status by Sex by Age in Northfield
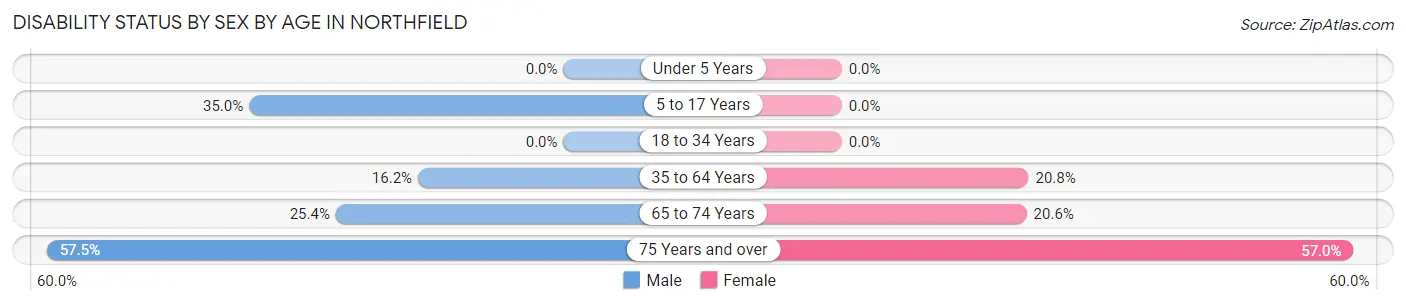
| Age Bracket | Male | Female |
| Under 5 Years | 0 (0.0%) | 0 (0.0%) |
| 5 to 17 Years | 7 (35.0%) | 0 (0.0%) |
| 18 to 34 Years | 0 (0.0%) | 0 (0.0%) |
| 35 to 64 Years | 23 (16.2%) | 47 (20.8%) |
| 65 to 74 Years | 18 (25.4%) | 14 (20.6%) |
| 75 Years and over | 42 (57.5%) | 45 (57.0%) |
Disability Class by Sex by Age in Northfield
Disability Class: Hearing Difficulty
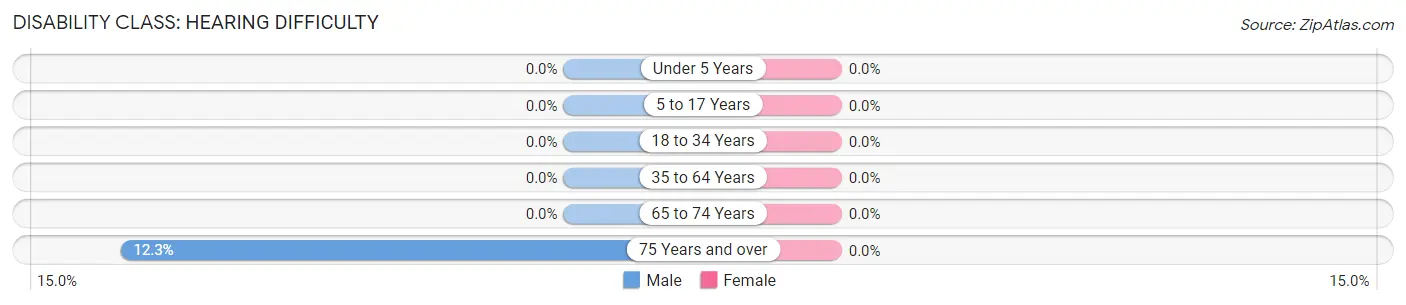
| Age Bracket | Male | Female |
| Under 5 Years | 0 (0.0%) | 0 (0.0%) |
| 5 to 17 Years | 0 (0.0%) | 0 (0.0%) |
| 18 to 34 Years | 0 (0.0%) | 0 (0.0%) |
| 35 to 64 Years | 0 (0.0%) | 0 (0.0%) |
| 65 to 74 Years | 0 (0.0%) | 0 (0.0%) |
| 75 Years and over | 9 (12.3%) | 0 (0.0%) |
Disability Class: Vision Difficulty
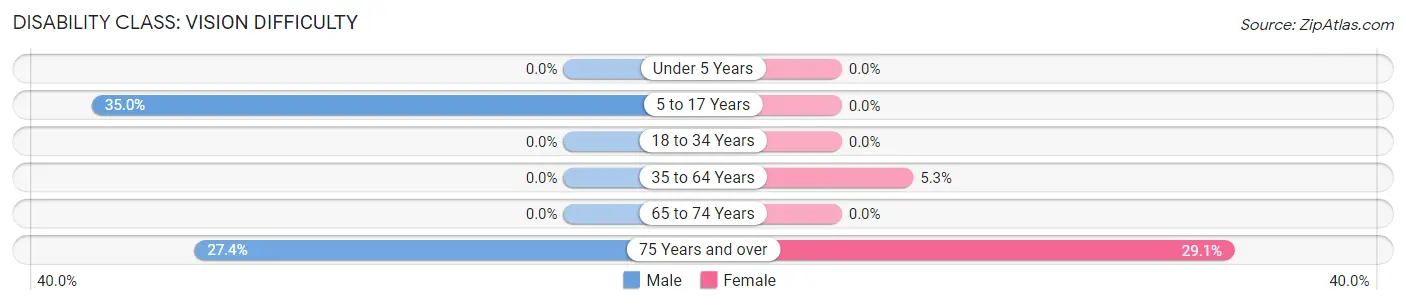
| Age Bracket | Male | Female |
| Under 5 Years | 0 (0.0%) | 0 (0.0%) |
| 5 to 17 Years | 7 (35.0%) | 0 (0.0%) |
| 18 to 34 Years | 0 (0.0%) | 0 (0.0%) |
| 35 to 64 Years | 0 (0.0%) | 12 (5.3%) |
| 65 to 74 Years | 0 (0.0%) | 0 (0.0%) |
| 75 Years and over | 20 (27.4%) | 23 (29.1%) |
Disability Class: Cognitive Difficulty
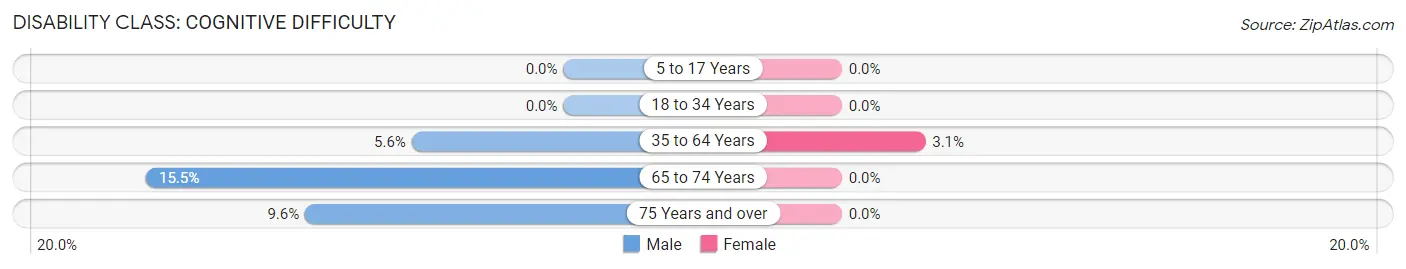
| Age Bracket | Male | Female |
| 5 to 17 Years | 0 (0.0%) | 0 (0.0%) |
| 18 to 34 Years | 0 (0.0%) | 0 (0.0%) |
| 35 to 64 Years | 8 (5.6%) | 7 (3.1%) |
| 65 to 74 Years | 11 (15.5%) | 0 (0.0%) |
| 75 Years and over | 7 (9.6%) | 0 (0.0%) |
Disability Class: Ambulatory Difficulty
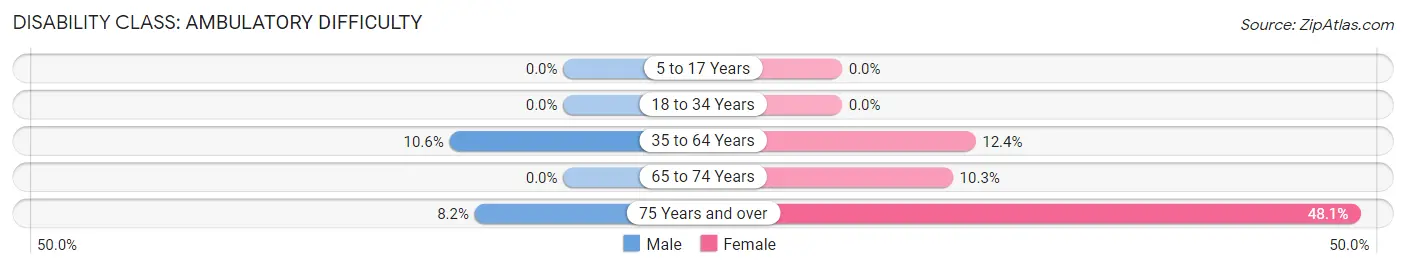
| Age Bracket | Male | Female |
| 5 to 17 Years | 0 (0.0%) | 0 (0.0%) |
| 18 to 34 Years | 0 (0.0%) | 0 (0.0%) |
| 35 to 64 Years | 15 (10.6%) | 28 (12.4%) |
| 65 to 74 Years | 0 (0.0%) | 7 (10.3%) |
| 75 Years and over | 6 (8.2%) | 38 (48.1%) |
Disability Class: Self-Care Difficulty
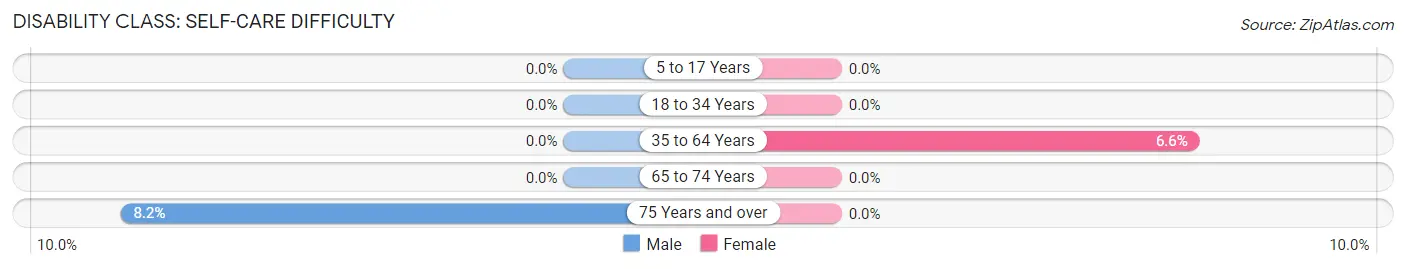
| Age Bracket | Male | Female |
| 5 to 17 Years | 0 (0.0%) | 0 (0.0%) |
| 18 to 34 Years | 0 (0.0%) | 0 (0.0%) |
| 35 to 64 Years | 0 (0.0%) | 15 (6.6%) |
| 65 to 74 Years | 0 (0.0%) | 0 (0.0%) |
| 75 Years and over | 6 (8.2%) | 0 (0.0%) |
Technology Access in Northfield
Computing Device Access in Northfield
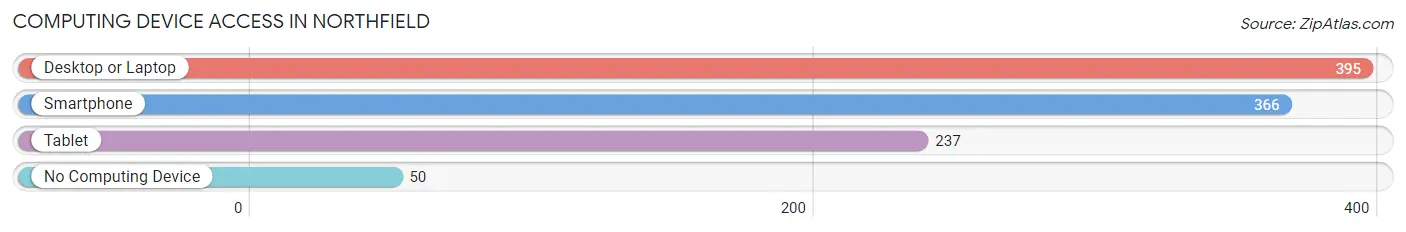
| Device Type | # Households | % Households |
| Desktop or Laptop | 395 | 83.5% |
| Smartphone | 366 | 77.4% |
| Tablet | 237 | 50.1% |
| No Computing Device | 50 | 10.6% |
| Total | 473 | 100.0% |
Internet Access in Northfield
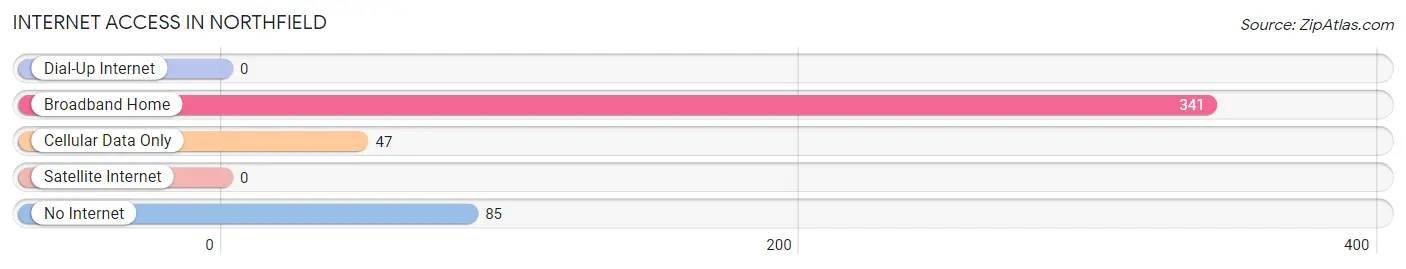
| Internet Type | # Households | % Households |
| Dial-Up Internet | 0 | 0.0% |
| Broadband Home | 341 | 72.1% |
| Cellular Data Only | 47 | 9.9% |
| Satellite Internet | 0 | 0.0% |
| No Internet | 85 | 18.0% |
| Total | 473 | 100.0% |
Northfield Summary
Northfield, Massachusetts is a small town located in Franklin County, in the western part of the state. It is bordered by the towns of Bernardston, Warwick, and Gill. The town has a population of approximately 3,000 people, and is located about 25 miles north of Springfield.
History
Northfield was first settled in 1735 by a group of settlers from Deerfield, Massachusetts. The town was originally known as Squakheag, and was part of the town of Deerfield until 1753, when it was incorporated as its own town. The town was named after Northfield, England, and was the first town in the area to be named after a place in England.
The town was an agricultural community for much of its history, and was known for its dairy farms and apple orchards. The town also had a number of mills, including a grist mill, a saw mill, and a paper mill. The paper mill was the largest employer in town for many years, and was in operation until the late 1970s.
Geography
Northfield is located in the western part of Franklin County, and is bordered by the towns of Bernardston, Warwick, and Gill. The town is located in the Pioneer Valley, and is about 25 miles north of Springfield. The town is located in the foothills of the Berkshire Mountains, and is home to several small hills and mountains, including Mount Toby and Mount Warner.
The town is located on the banks of the Connecticut River, and is home to several small streams and ponds, including the Millers River and the Northfield Pond. The town is also home to several small lakes, including Lake Wyola and Lake Warner.
Economy
Northfield is a small, rural town, and the economy is largely based on agriculture and tourism. The town is home to several small farms, and is known for its dairy farms and apple orchards. The town is also home to several small businesses, including a few restaurants, a grocery store, and a few small shops.
The town is also home to several small manufacturing companies, including a plastics manufacturer and a metal fabrication company. The town is also home to a number of small technology companies, including a software development company and a web design company.
Demographics
As of the 2010 census, the population of Northfield was 3,037. The racial makeup of the town was 97.2% White, 0.7% African American, 0.3% Native American, 0.4% Asian, 0.1% Pacific Islander, 0.3% from other races, and 1.0% from two or more races. Hispanic or Latino of any race were 1.2% of the population.
The median household income in Northfield was $60,938, and the median family income was $68,750. The per capita income for the town was $27,945. About 5.2% of families and 6.7% of the population were below the poverty line, including 8.2% of those under age 18 and 4.2% of those age 65 or over.
Common Questions
What is Per Capita Income in Northfield?
Per Capita income in Northfield is $44,739.
What is the Median Family Income in Northfield?
Median Family Income in Northfield is $86,406.
What is the Median Household income in Northfield?
Median Household Income in Northfield is $62,969.
What is Income or Wage Gap in Northfield?
Income or Wage Gap in Northfield is 34.9%.
Women in Northfield earn 65.1 cents for every dollar earned by a man.
What is Inequality or Gini Index in Northfield?
Inequality or Gini Index in Northfield is 0.45.
What is the Total Population of Northfield?
Total Population of Northfield is 908.
What is the Total Male Population of Northfield?
Total Male Population of Northfield is 354.
What is the Total Female Population of Northfield?
Total Female Population of Northfield is 554.
What is the Ratio of Males per 100 Females in Northfield?
There are 63.90 Males per 100 Females in Northfield.
What is the Ratio of Females per 100 Males in Northfield?
There are 156.50 Females per 100 Males in Northfield.
What is the Median Population Age in Northfield?
Median Population Age in Northfield is 49.5 Years.
What is the Average Family Size in Northfield
Average Family Size in Northfield is 2.2 People.
What is the Average Household Size in Northfield
Average Household Size in Northfield is 1.9 People.
How Large is the Labor Force in Northfield?
There are 554 People in the Labor Forcein in Northfield.
What is the Percentage of People in the Labor Force in Northfield?
64.3% of People are in the Labor Force in Northfield.
What is the Unemployment Rate in Northfield?
Unemployment Rate in Northfield is 2.2%.