Forestdale, MA Map & Demographics
Forestdale Map
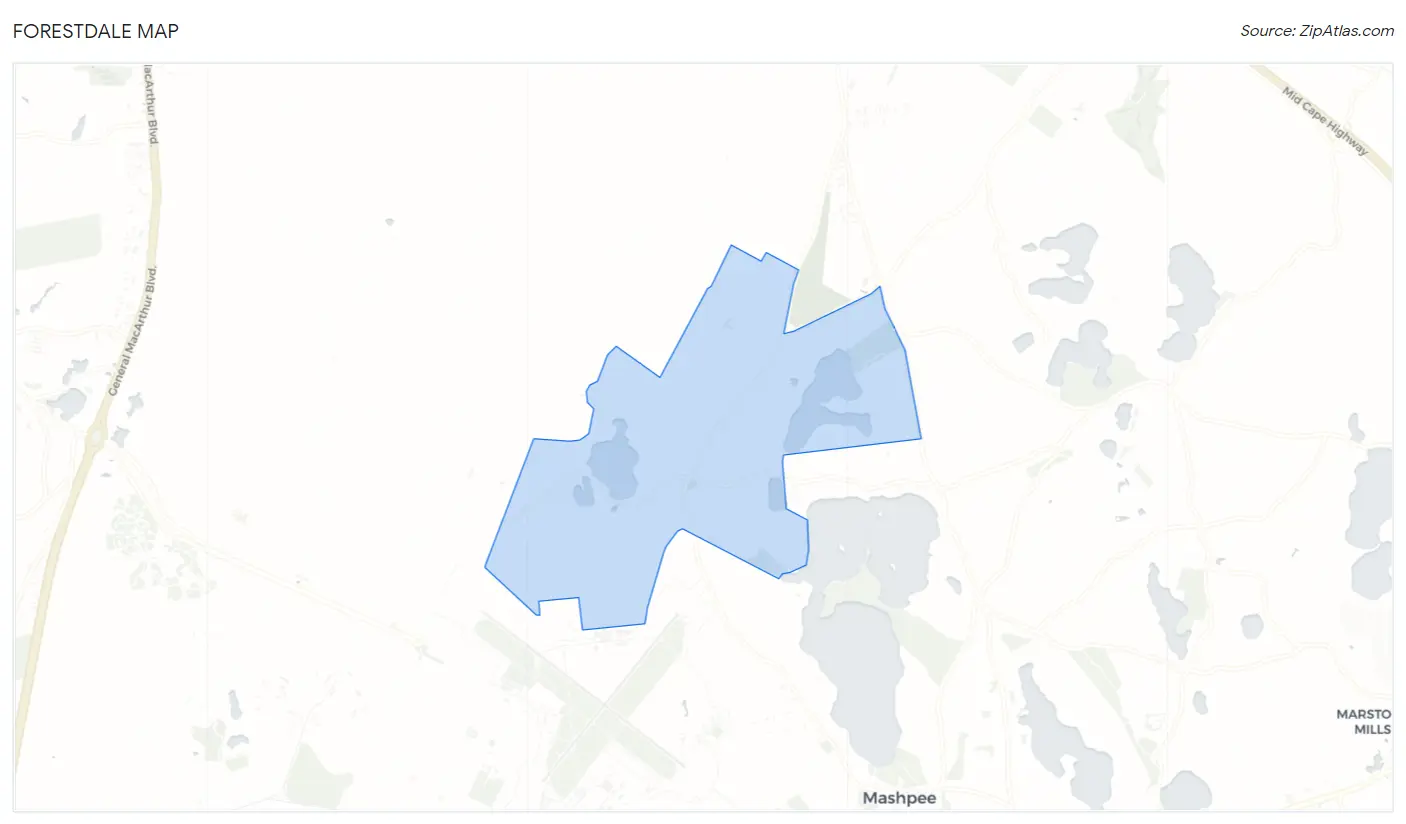
Forestdale Overview
$53,484
PER CAPITA INCOME
$149,817
AVG FAMILY INCOME
$118,382
AVG HOUSEHOLD INCOME
30.5%
WAGE / INCOME GAP [ % ]
69.5¢/ $1
WAGE / INCOME GAP [ $ ]
0.38
INEQUALITY / GINI INDEX
3,912
TOTAL POPULATION
1,718
MALE POPULATION
2,194
FEMALE POPULATION
78.30
MALES / 100 FEMALES
127.71
FEMALES / 100 MALES
50.2
MEDIAN AGE
3.0
AVG FAMILY SIZE
2.5
AVG HOUSEHOLD SIZE
2,460
LABOR FORCE [ PEOPLE ]
74.0%
PERCENT IN LABOR FORCE
2.2%
UNEMPLOYMENT RATE
Forestdale Zip Codes
Forestdale Area Codes
Income in Forestdale
Income Overview in Forestdale
Per Capita Income in Forestdale is $53,484, while median incomes of families and households are $149,817 and $118,382 respectively.
| Characteristic | Number | Measure |
| Per Capita Income | 3,912 | $53,484 |
| Median Family Income | 1,067 | $149,817 |
| Mean Family Income | 1,067 | $158,178 |
| Median Household Income | 1,532 | $118,382 |
| Mean Household Income | 1,532 | $130,273 |
| Income Deficit | 1,067 | $0 |
| Wage / Income Gap (%) | 3,912 | 30.49% |
| Wage / Income Gap ($) | 3,912 | 69.51¢ per $1 |
| Gini / Inequality Index | 3,912 | 0.38 |
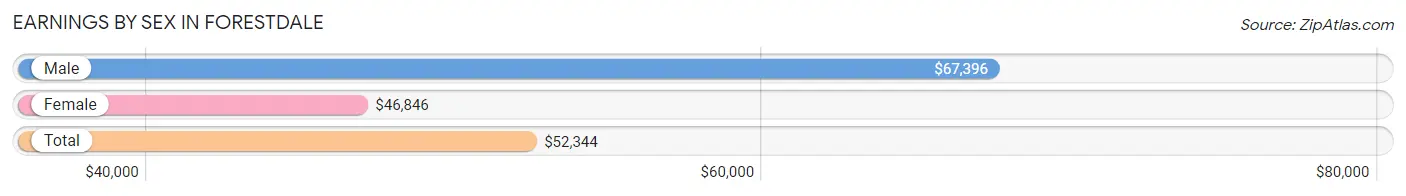
Earnings by Sex in Forestdale
Average Earnings in Forestdale are $52,344, $67,396 for men and $46,846 for women, a difference of 30.5%.
| Sex | Number | Average Earnings |
| Male | 1,246 (48.3%) | $67,396 |
| Female | 1,331 (51.6%) | $46,846 |
| Total | 2,577 (100.0%) | $52,344 |
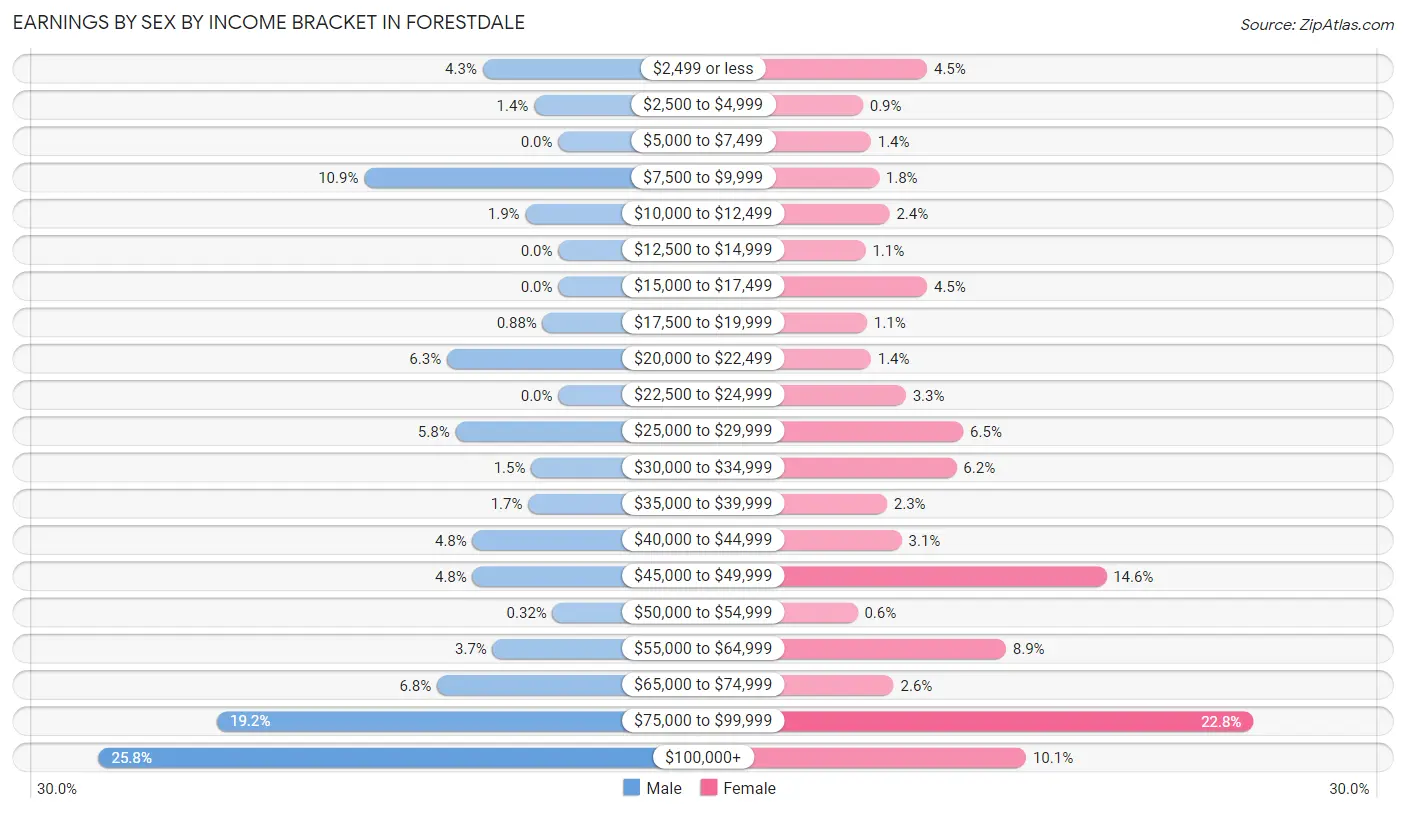
Earnings by Sex by Income Bracket in Forestdale
The most common earnings brackets in Forestdale are $100,000+ for men (322 | 25.8%) and $75,000 to $99,999 for women (304 | 22.8%).
| Income | Male | Female |
| $2,499 or less | 53 (4.3%) | 60 (4.5%) |
| $2,500 to $4,999 | 17 (1.4%) | 12 (0.9%) |
| $5,000 to $7,499 | 0 (0.0%) | 18 (1.3%) |
| $7,500 to $9,999 | 136 (10.9%) | 24 (1.8%) |
| $10,000 to $12,499 | 23 (1.8%) | 32 (2.4%) |
| $12,500 to $14,999 | 0 (0.0%) | 14 (1.1%) |
| $15,000 to $17,499 | 0 (0.0%) | 60 (4.5%) |
| $17,500 to $19,999 | 11 (0.9%) | 15 (1.1%) |
| $20,000 to $22,499 | 78 (6.3%) | 18 (1.3%) |
| $22,500 to $24,999 | 0 (0.0%) | 44 (3.3%) |
| $25,000 to $29,999 | 72 (5.8%) | 87 (6.5%) |
| $30,000 to $34,999 | 19 (1.5%) | 82 (6.2%) |
| $35,000 to $39,999 | 21 (1.7%) | 30 (2.2%) |
| $40,000 to $44,999 | 60 (4.8%) | 41 (3.1%) |
| $45,000 to $49,999 | 60 (4.8%) | 194 (14.6%) |
| $50,000 to $54,999 | 4 (0.3%) | 8 (0.6%) |
| $55,000 to $64,999 | 46 (3.7%) | 119 (8.9%) |
| $65,000 to $74,999 | 85 (6.8%) | 35 (2.6%) |
| $75,000 to $99,999 | 239 (19.2%) | 304 (22.8%) |
| $100,000+ | 322 (25.8%) | 134 (10.1%) |
| Total | 1,246 (100.0%) | 1,331 (100.0%) |
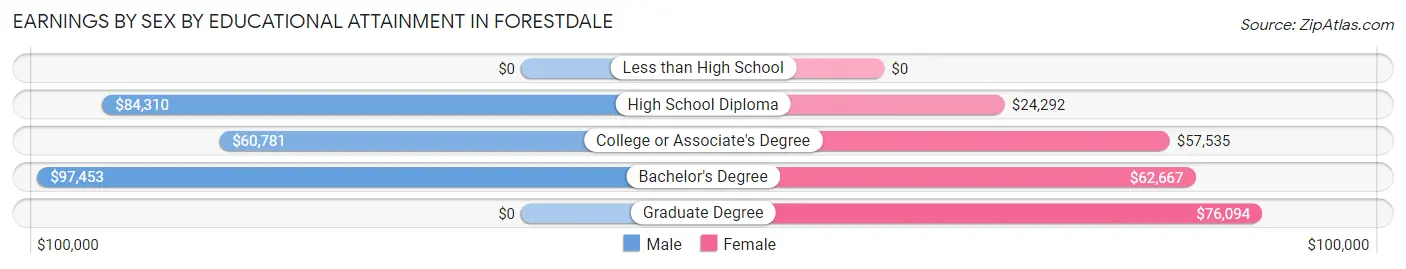
Earnings by Sex by Educational Attainment in Forestdale
Average earnings in Forestdale are $78,065 for men and $48,438 for women, a difference of 38.0%. Men with an educational attainment of bachelor's degree enjoy the highest average annual earnings of $97,453, while those with college or associate's degree education earn the least with $60,781. Women with an educational attainment of graduate degree earn the most with the average annual earnings of $76,094, while those with high school diploma education have the smallest earnings of $24,292.
| Educational Attainment | Male Income | Female Income |
| Less than High School | - | - |
| High School Diploma | $84,310 | $24,292 |
| College or Associate's Degree | $60,781 | $57,535 |
| Bachelor's Degree | $97,453 | $62,667 |
| Graduate Degree | - | - |
| Total | $78,065 | $48,438 |
Family Income in Forestdale
Family Income Brackets in Forestdale
According to the Forestdale family income data, there are 372 families falling into the $150,000 to $199,999 income range, which is the most common income bracket and makes up 34.9% of all families.
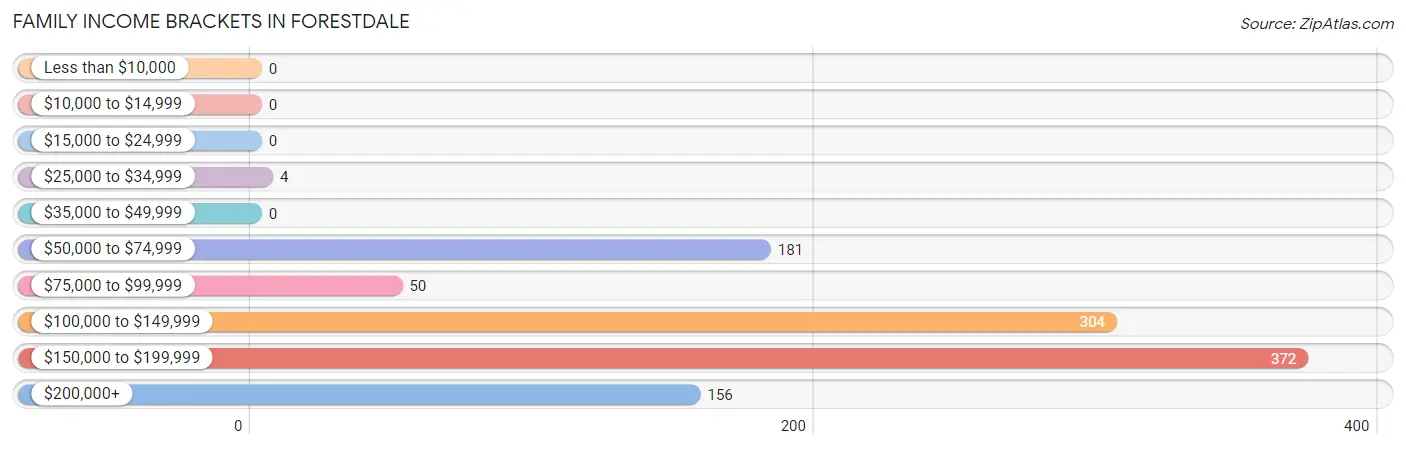
| Income Bracket | # Families | % Families |
| Less than $10,000 | 0 | 0.0% |
| $10,000 to $14,999 | 0 | 0.0% |
| $15,000 to $24,999 | 0 | 0.0% |
| $25,000 to $34,999 | 4 | 0.4% |
| $35,000 to $49,999 | 0 | 0.0% |
| $50,000 to $74,999 | 181 | 17.0% |
| $75,000 to $99,999 | 50 | 4.7% |
| $100,000 to $149,999 | 304 | 28.5% |
| $150,000 to $199,999 | 372 | 34.9% |
| $200,000+ | 156 | 14.6% |
Family Income by Famaliy Size in Forestdale
5-person families (104 | 9.8%) account for the highest median family income in Forestdale with $184,917 per family, while 2-person families (587 | 55.0%) have the highest median income of $63,906 per family member.
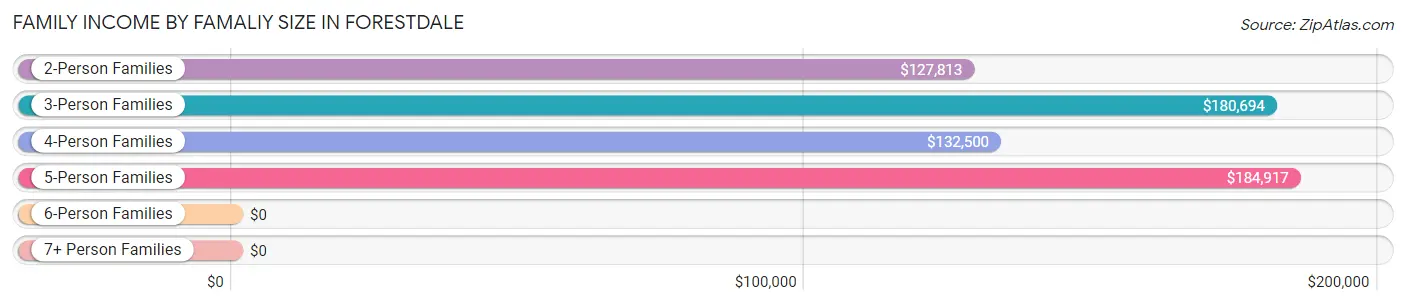
| Income Bracket | # Families | Median Income |
| 2-Person Families | 587 (55.0%) | $127,813 |
| 3-Person Families | 182 (17.1%) | $180,694 |
| 4-Person Families | 194 (18.2%) | $132,500 |
| 5-Person Families | 104 (9.8%) | $184,917 |
| 6-Person Families | 0 (0.0%) | $0 |
| 7+ Person Families | 0 (0.0%) | $0 |
| Total | 1,067 (100.0%) | $149,817 |
Family Income by Number of Earners in Forestdale
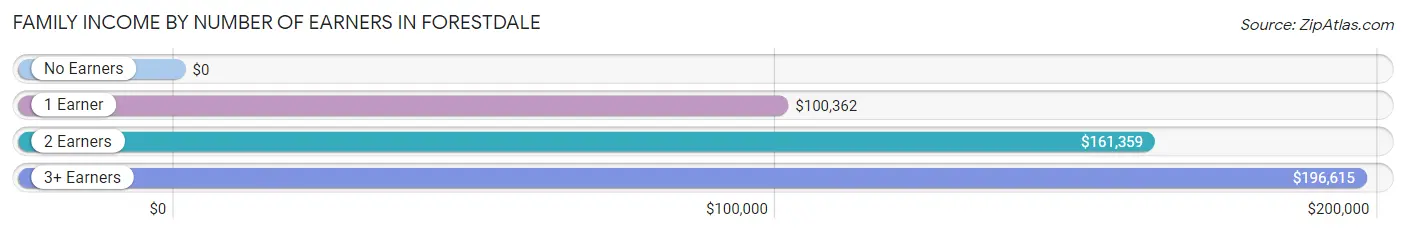
| Number of Earners | # Families | Median Income |
| No Earners | 115 (10.8%) | $0 |
| 1 Earner | 248 (23.2%) | $100,362 |
| 2 Earners | 433 (40.6%) | $161,359 |
| 3+ Earners | 271 (25.4%) | $196,615 |
| Total | 1,067 (100.0%) | $149,817 |
Household Income in Forestdale
Household Income Brackets in Forestdale
With 385 households falling in the category, the $150,000 to $199,999 income range is the most frequent in Forestdale, accounting for 25.1% of all households.
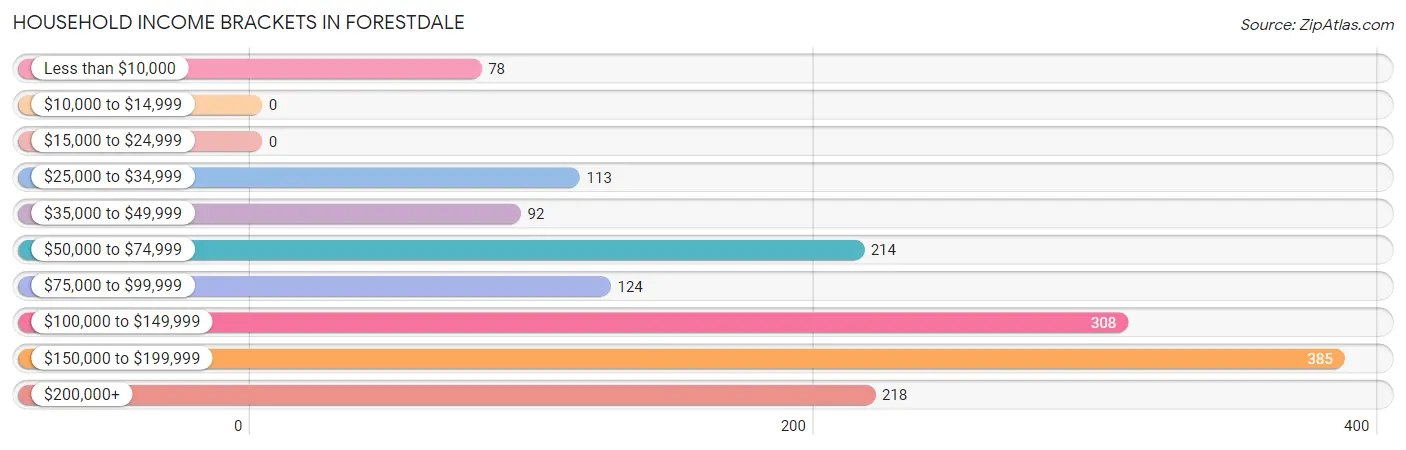
| Income Bracket | # Households | % Households |
| Less than $10,000 | 78 | 5.1% |
| $10,000 to $14,999 | 0 | 0.0% |
| $15,000 to $24,999 | 0 | 0.0% |
| $25,000 to $34,999 | 113 | 7.4% |
| $35,000 to $49,999 | 92 | 6.0% |
| $50,000 to $74,999 | 214 | 14.0% |
| $75,000 to $99,999 | 124 | 8.1% |
| $100,000 to $149,999 | 308 | 20.1% |
| $150,000 to $199,999 | 385 | 25.1% |
| $200,000+ | 218 | 14.2% |
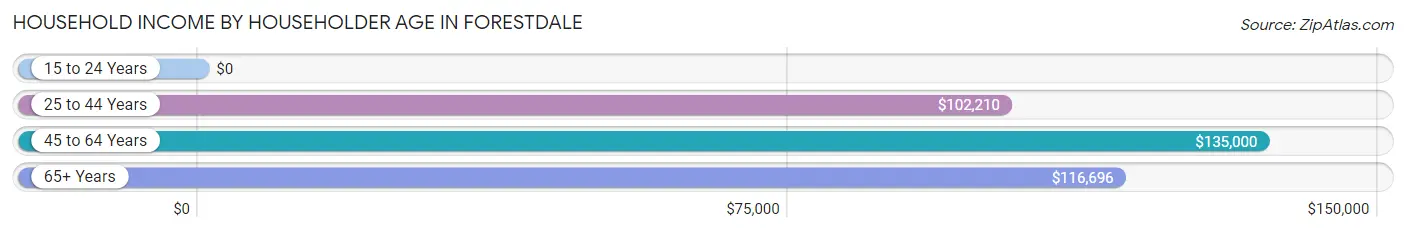
Household Income by Householder Age in Forestdale
The median household income in Forestdale is $118,382, with the highest median household income of $135,000 found in the 45 to 64 years age bracket for the primary householder. A total of 854 households (55.7%) fall into this category.
| Income Bracket | # Households | Median Income |
| 15 to 24 Years | 0 (0.0%) | $0 |
| 25 to 44 Years | 353 (23.0%) | $102,210 |
| 45 to 64 Years | 854 (55.7%) | $135,000 |
| 65+ Years | 325 (21.2%) | $116,696 |
| Total | 1,532 (100.0%) | $118,382 |
Poverty in Forestdale
Income Below Poverty by Sex and Age in Forestdale
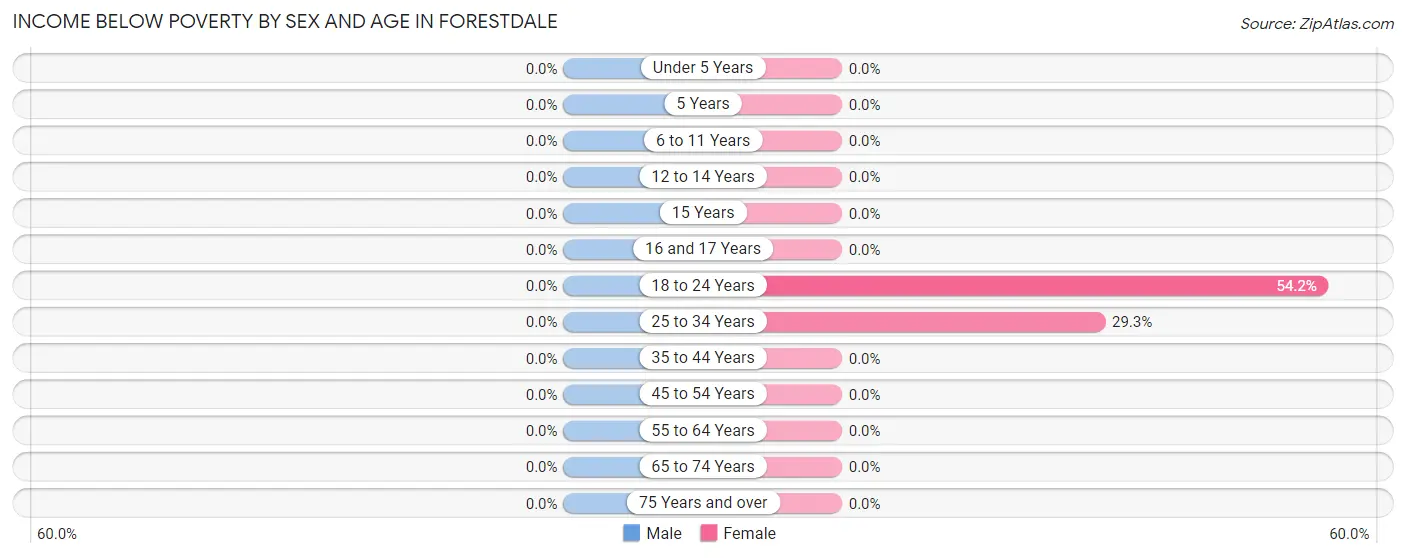
| Age Bracket | Male | Female |
| Under 5 Years | 0 (0.0%) | 0 (0.0%) |
| 5 Years | 0 (0.0%) | 0 (0.0%) |
| 6 to 11 Years | 0 (0.0%) | 0 (0.0%) |
| 12 to 14 Years | 0 (0.0%) | 0 (0.0%) |
| 15 Years | 0 (0.0%) | 0 (0.0%) |
| 16 and 17 Years | 0 (0.0%) | 0 (0.0%) |
| 18 to 24 Years | 0 (0.0%) | 90 (54.2%) |
| 25 to 34 Years | 0 (0.0%) | 78 (29.3%) |
| 35 to 44 Years | 0 (0.0%) | 0 (0.0%) |
| 45 to 54 Years | 0 (0.0%) | 0 (0.0%) |
| 55 to 64 Years | 0 (0.0%) | 0 (0.0%) |
| 65 to 74 Years | 0 (0.0%) | 0 (0.0%) |
| 75 Years and over | 0 (0.0%) | 0 (0.0%) |
| Total | 0 (0.0%) | 168 (7.8%) |
Income Above Poverty by Sex and Age in Forestdale
According to the poverty statistics in Forestdale, males aged under 5 years and females aged under 5 years are the age groups that are most secure financially, with 100.0% of males and 100.0% of females in these age groups living above the poverty line.
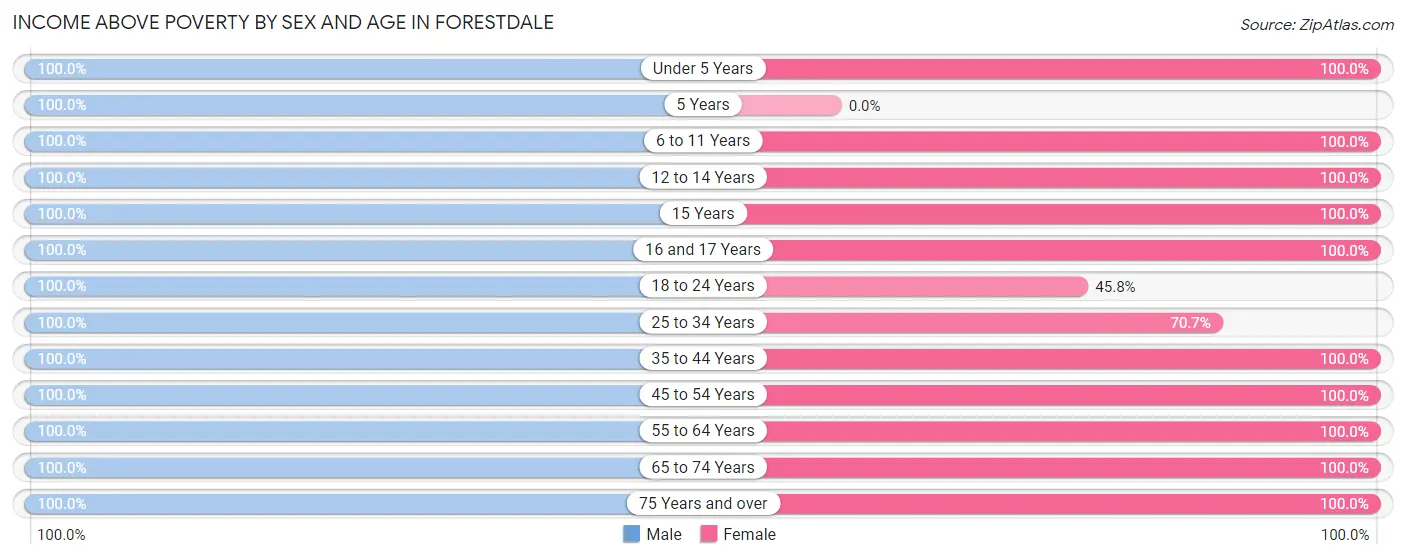
| Age Bracket | Male | Female |
| Under 5 Years | 51 (100.0%) | 61 (100.0%) |
| 5 Years | 21 (100.0%) | 0 (0.0%) |
| 6 to 11 Years | 107 (100.0%) | 173 (100.0%) |
| 12 to 14 Years | 27 (100.0%) | 38 (100.0%) |
| 15 Years | 13 (100.0%) | 24 (100.0%) |
| 16 and 17 Years | 41 (100.0%) | 41 (100.0%) |
| 18 to 24 Years | 160 (100.0%) | 76 (45.8%) |
| 25 to 34 Years | 157 (100.0%) | 188 (70.7%) |
| 35 to 44 Years | 178 (100.0%) | 229 (100.0%) |
| 45 to 54 Years | 168 (100.0%) | 187 (100.0%) |
| 55 to 64 Years | 383 (100.0%) | 713 (100.0%) |
| 65 to 74 Years | 255 (100.0%) | 93 (100.0%) |
| 75 Years and over | 113 (100.0%) | 175 (100.0%) |
| Total | 1,674 (100.0%) | 1,998 (92.2%) |
Income Below Poverty Among Married-Couple Families in Forestdale
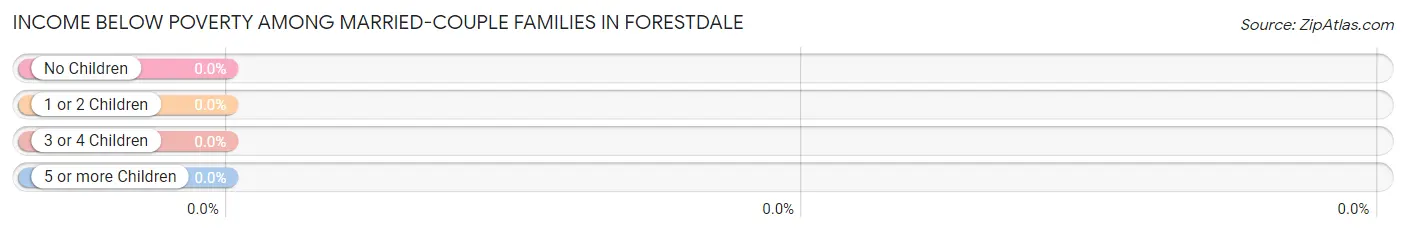
| Children | Above Poverty | Below Poverty |
| No Children | 674 (100.0%) | 0 (0.0%) |
| 1 or 2 Children | 201 (100.0%) | 0 (0.0%) |
| 3 or 4 Children | 23 (100.0%) | 0 (0.0%) |
| 5 or more Children | 0 (0.0%) | 0 (0.0%) |
| Total | 898 (100.0%) | 0 (0.0%) |
Income Below Poverty Among Single-Parent Households in Forestdale
| Children | Single Father | Single Mother |
| No Children | 0 (0.0%) | 0 (0.0%) |
| 1 or 2 Children | 0 (0.0%) | 0 (0.0%) |
| 3 or 4 Children | 0 (0.0%) | 0 (0.0%) |
| 5 or more Children | 0 (0.0%) | 0 (0.0%) |
| Total | 0 (0.0%) | 0 (0.0%) |
Income Below Poverty Among Married-Couple vs Single-Parent Households in Forestdale
| Children | Married-Couple Families | Single-Parent Households |
| No Children | 0 (0.0%) | 0 (0.0%) |
| 1 or 2 Children | 0 (0.0%) | 0 (0.0%) |
| 3 or 4 Children | 0 (0.0%) | 0 (0.0%) |
| 5 or more Children | 0 (0.0%) | 0 (0.0%) |
| Total | 0 (0.0%) | 0 (0.0%) |
Race in Forestdale
The most populous races in Forestdale are White / Caucasian (3,825 | 97.8%), Two or more Races (53 | 1.3%), and Hispanic or Latino (51 | 1.3%).
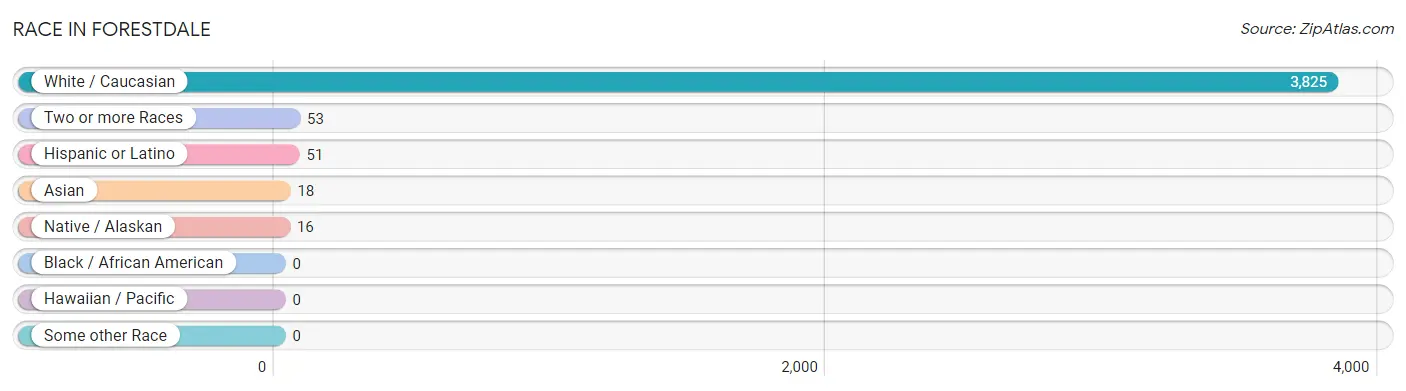
| Race | # Population | % Population |
| Asian | 18 | 0.5% |
| Black / African American | 0 | 0.0% |
| Hawaiian / Pacific | 0 | 0.0% |
| Hispanic or Latino | 51 | 1.3% |
| Native / Alaskan | 16 | 0.4% |
| White / Caucasian | 3,825 | 97.8% |
| Two or more Races | 53 | 1.3% |
| Some other Race | 0 | 0.0% |
| Total | 3,912 | 100.0% |
Ancestry in Forestdale
The most populous ancestries reported in Forestdale are Irish (1,774 | 45.4%), English (965 | 24.7%), Italian (676 | 17.3%), French (383 | 9.8%), and German (308 | 7.9%), together accounting for 105.0% of all Forestdale residents.
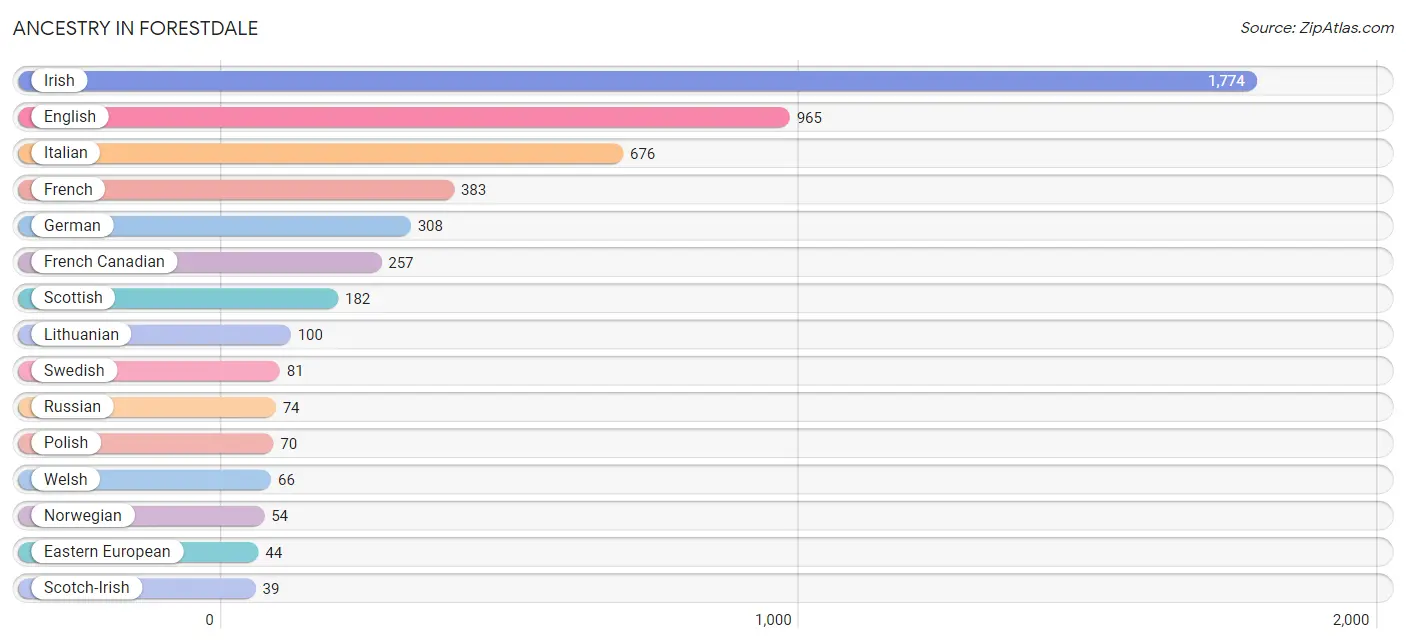
| Ancestry | # Population | % Population |
| American | 30 | 0.8% |
| Belgian | 22 | 0.6% |
| Bhutanese | 18 | 0.5% |
| Canadian | 20 | 0.5% |
| Cape Verdean | 16 | 0.4% |
| Danish | 33 | 0.8% |
| Dutch | 23 | 0.6% |
| Eastern European | 44 | 1.1% |
| English | 965 | 24.7% |
| European | 9 | 0.2% |
| Finnish | 20 | 0.5% |
| French | 383 | 9.8% |
| French Canadian | 257 | 6.6% |
| German | 308 | 7.9% |
| Irish | 1,774 | 45.4% |
| Italian | 676 | 17.3% |
| Lithuanian | 100 | 2.6% |
| Norwegian | 54 | 1.4% |
| Polish | 70 | 1.8% |
| Portuguese | 18 | 0.5% |
| Russian | 74 | 1.9% |
| Scandinavian | 20 | 0.5% |
| Scotch-Irish | 39 | 1.0% |
| Scottish | 182 | 4.6% |
| Spaniard | 35 | 0.9% |
| Subsaharan African | 16 | 0.4% |
| Swedish | 81 | 2.1% |
| Welsh | 66 | 1.7% | View All 28 Rows |
Immigrants in Forestdale
The most numerous immigrant groups reported in Forestdale came from Canada (65 | 1.7%), Asia (18 | 0.5%), Eastern Asia (18 | 0.5%), and Japan (18 | 0.5%), together accounting for 3.0% of all Forestdale residents.
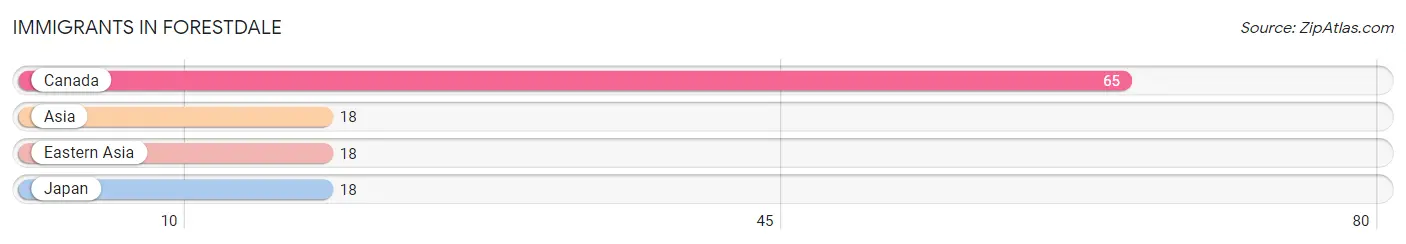
| Immigration Origin | # Population | % Population |
| Asia | 18 | 0.5% |
| Canada | 65 | 1.7% |
| Eastern Asia | 18 | 0.5% |
| Japan | 18 | 0.5% | View All 4 Rows |
Sex and Age in Forestdale
Sex and Age in Forestdale
The most populous age groups in Forestdale are 65 to 69 Years (223 | 13.0%) for men and 55 to 59 Years (464 | 21.1%) for women.
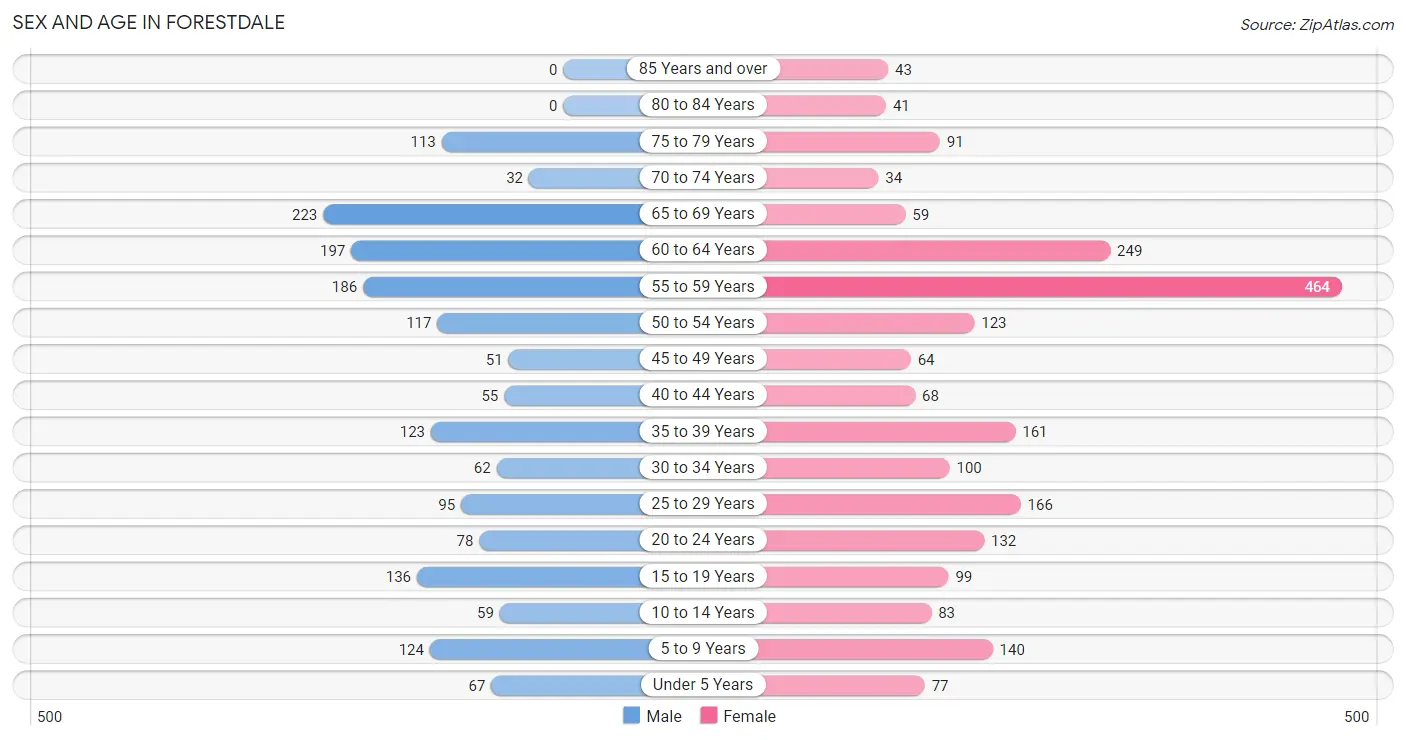
| Age Bracket | Male | Female |
| Under 5 Years | 67 (3.9%) | 77 (3.5%) |
| 5 to 9 Years | 124 (7.2%) | 140 (6.4%) |
| 10 to 14 Years | 59 (3.4%) | 83 (3.8%) |
| 15 to 19 Years | 136 (7.9%) | 99 (4.5%) |
| 20 to 24 Years | 78 (4.5%) | 132 (6.0%) |
| 25 to 29 Years | 95 (5.5%) | 166 (7.6%) |
| 30 to 34 Years | 62 (3.6%) | 100 (4.6%) |
| 35 to 39 Years | 123 (7.2%) | 161 (7.3%) |
| 40 to 44 Years | 55 (3.2%) | 68 (3.1%) |
| 45 to 49 Years | 51 (3.0%) | 64 (2.9%) |
| 50 to 54 Years | 117 (6.8%) | 123 (5.6%) |
| 55 to 59 Years | 186 (10.8%) | 464 (21.1%) |
| 60 to 64 Years | 197 (11.5%) | 249 (11.4%) |
| 65 to 69 Years | 223 (13.0%) | 59 (2.7%) |
| 70 to 74 Years | 32 (1.9%) | 34 (1.5%) |
| 75 to 79 Years | 113 (6.6%) | 91 (4.2%) |
| 80 to 84 Years | 0 (0.0%) | 41 (1.9%) |
| 85 Years and over | 0 (0.0%) | 43 (2.0%) |
| Total | 1,718 (100.0%) | 2,194 (100.0%) |
Families and Households in Forestdale
Median Family Size in Forestdale
The median family size in Forestdale is 2.96 persons per family, with married-couple families (898 | 84.2%) accounting for the largest median family size of 3 persons per family. On the other hand, single female/mother families (156 | 14.6%) represent the smallest median family size with 2.76 persons per family.
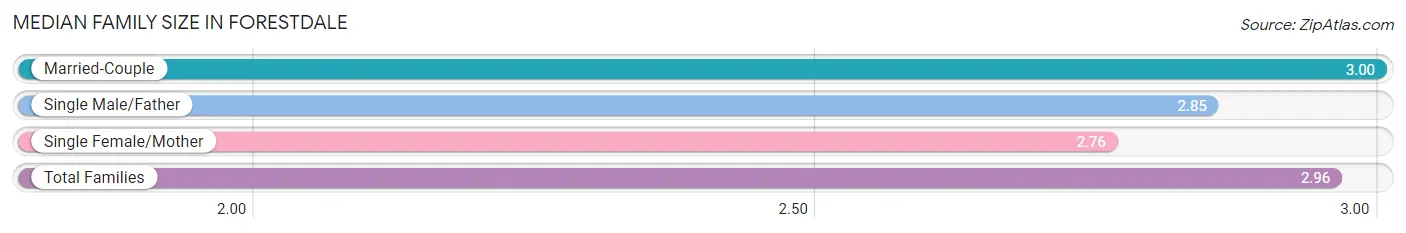
| Family Type | # Families | Family Size |
| Married-Couple | 898 (84.2%) | 3.00 |
| Single Male/Father | 13 (1.2%) | 2.85 |
| Single Female/Mother | 156 (14.6%) | 2.76 |
| Total Families | 1,067 (100.0%) | 2.96 |
Median Household Size in Forestdale
The median household size in Forestdale is 2.55 persons per household, with single male/father households (13 | 0.9%) accounting for the largest median household size of 5.69 persons per household. non-family households (465 | 30.3%) represent the smallest median household size with 1.31 persons per household.
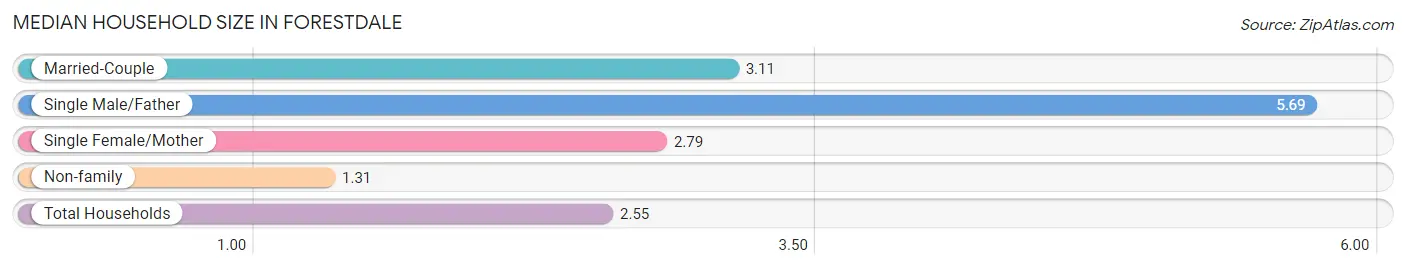
| Household Type | # Households | Household Size |
| Married-Couple | 898 (58.6%) | 3.11 |
| Single Male/Father | 13 (0.9%) | 5.69 |
| Single Female/Mother | 156 (10.2%) | 2.79 |
| Non-family | 465 (30.3%) | 1.31 |
| Total Households | 1,532 (100.0%) | 2.55 |
Household Size by Marriage Status in Forestdale
Out of a total of 1,532 households in Forestdale, 1,067 (69.7%) are family households, while 465 (30.3%) are nonfamily households. The most numerous type of family households are 2-person households, comprising 539, and the most common type of nonfamily households are 1-person households, comprising 387.
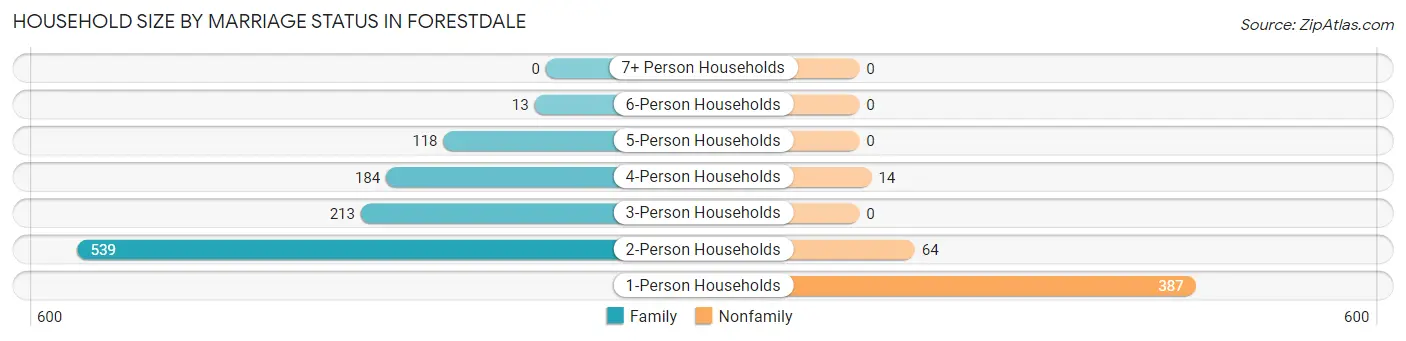
| Household Size | Family Households | Nonfamily Households |
| 1-Person Households | - | 387 (25.3%) |
| 2-Person Households | 539 (35.2%) | 64 (4.2%) |
| 3-Person Households | 213 (13.9%) | 0 (0.0%) |
| 4-Person Households | 184 (12.0%) | 14 (0.9%) |
| 5-Person Households | 118 (7.7%) | 0 (0.0%) |
| 6-Person Households | 13 (0.9%) | 0 (0.0%) |
| 7+ Person Households | 0 (0.0%) | 0 (0.0%) |
| Total | 1,067 (69.7%) | 465 (30.3%) |
Female Fertility in Forestdale
Fertility by Age in Forestdale
Average fertility rate in Forestdale is 35.0 births per 1,000 women. Women in the age bracket of 35 to 50 years have the highest fertility rate with 85.0 births per 1,000 women. Women in the age bracket of 35 to 50 years acount for 100.0% of all women with births.
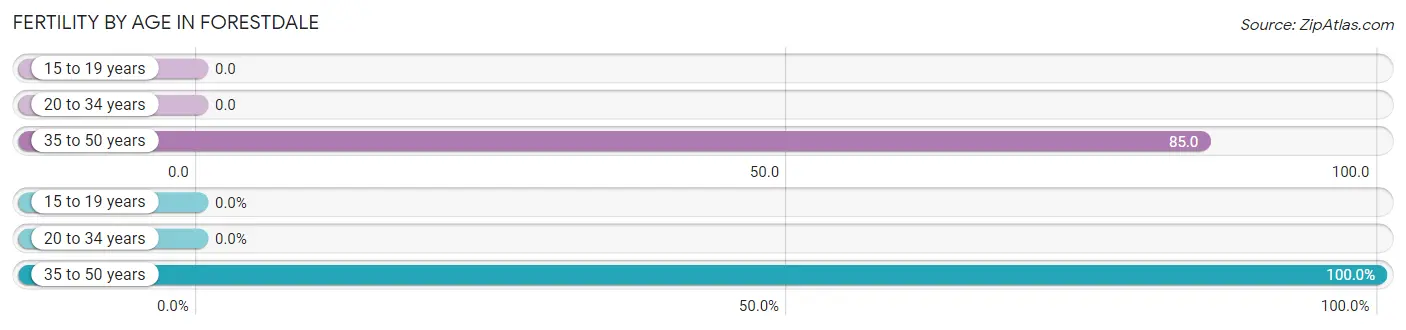
| Age Bracket | Women with Births | Births / 1,000 Women |
| 15 to 19 years | 0 (0.0%) | 0.0 |
| 20 to 34 years | 0 (0.0%) | 0.0 |
| 35 to 50 years | 30 (100.0%) | 85.0 |
| Total | 30 (100.0%) | 35.0 |
Fertility by Age by Marriage Status in Forestdale
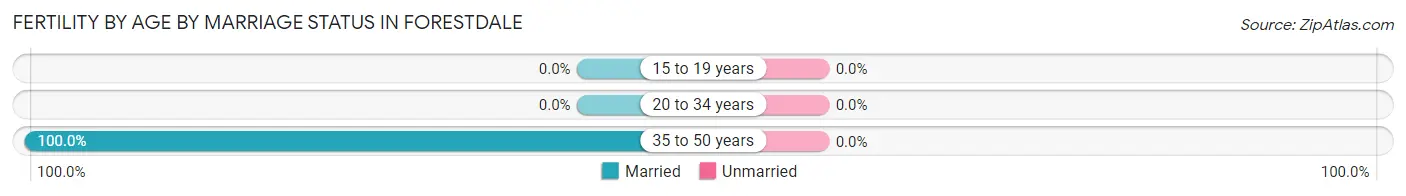
| Age Bracket | Married | Unmarried |
| 15 to 19 years | 0 (0.0%) | 0 (0.0%) |
| 20 to 34 years | 0 (0.0%) | 0 (0.0%) |
| 35 to 50 years | 30 (100.0%) | 0 (0.0%) |
| Total | 30 (100.0%) | 0 (0.0%) |
Fertility by Education in Forestdale
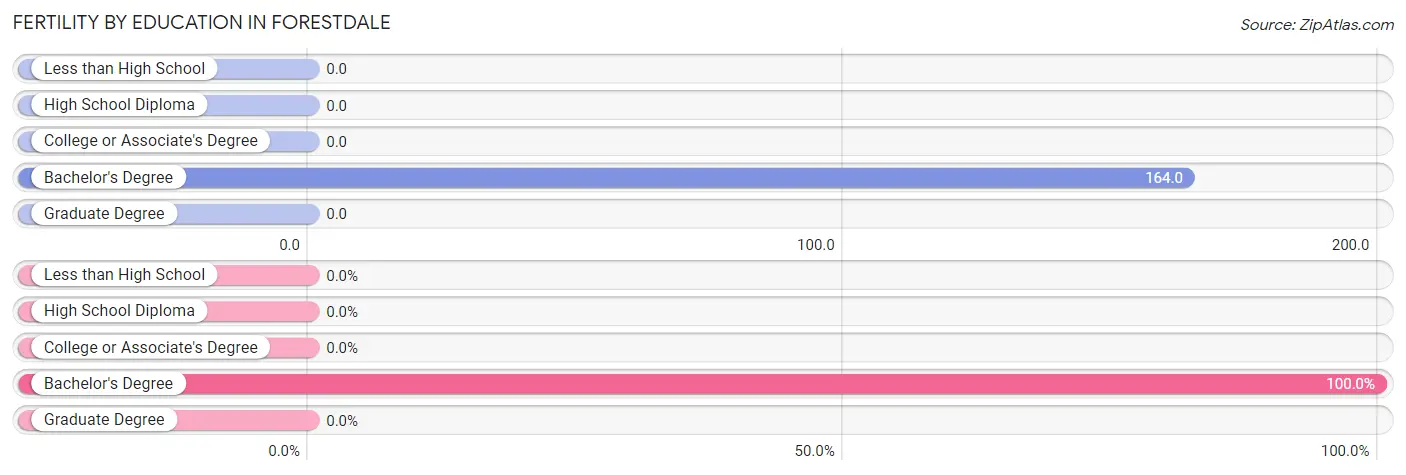
| Educational Attainment | Women with Births | Births / 1,000 Women |
| Less than High School | 0 (0.0%) | 0.0 |
| High School Diploma | 0 (0.0%) | 0.0 |
| College or Associate's Degree | 0 (0.0%) | 0.0 |
| Bachelor's Degree | 30 (100.0%) | 164.0 |
| Graduate Degree | 0 (0.0%) | 0.0 |
| Total | 30 (100.0%) | 35.0 |
Fertility by Education by Marriage Status in Forestdale
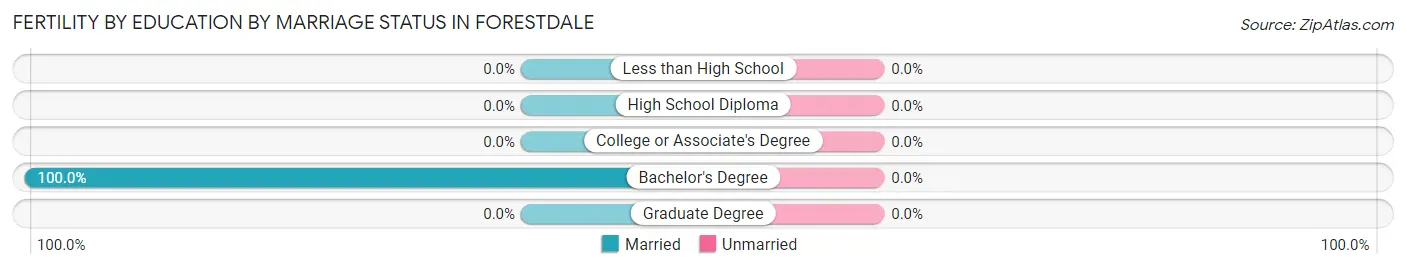
| Educational Attainment | Married | Unmarried |
| Less than High School | 0 (0.0%) | 0 (0.0%) |
| High School Diploma | 0 (0.0%) | 0 (0.0%) |
| College or Associate's Degree | 0 (0.0%) | 0 (0.0%) |
| Bachelor's Degree | 30 (100.0%) | 0 (0.0%) |
| Graduate Degree | 0 (0.0%) | 0 (0.0%) |
| Total | 30 (100.0%) | 0 (0.0%) |
Employment Characteristics in Forestdale
Employment by Class of Employer in Forestdale
Among the 2,361 employed individuals in Forestdale, private company employees (1,677 | 71.0%), local government employees (201 | 8.5%), and self-employed (not incorporated) (143 | 6.1%) make up the most common classes of employment.
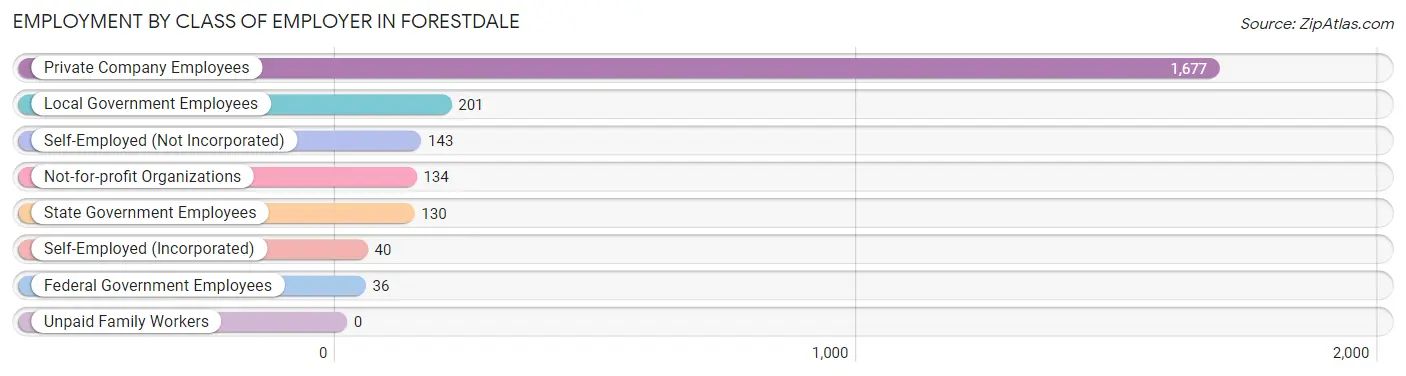
| Employer Class | # Employees | % Employees |
| Private Company Employees | 1,677 | 71.0% |
| Self-Employed (Incorporated) | 40 | 1.7% |
| Self-Employed (Not Incorporated) | 143 | 6.1% |
| Not-for-profit Organizations | 134 | 5.7% |
| Local Government Employees | 201 | 8.5% |
| State Government Employees | 130 | 5.5% |
| Federal Government Employees | 36 | 1.5% |
| Unpaid Family Workers | 0 | 0.0% |
| Total | 2,361 | 100.0% |
Employment Status by Age in Forestdale
According to the labor force statistics for Forestdale, out of the total population over 16 years of age (3,325), 74.0% or 2,460 individuals are in the labor force, with 2.2% or 54 of them unemployed. The age group with the highest labor force participation rate is 35 to 44 years, with 100.0% or 407 individuals in the labor force. Within the labor force, the 35 to 44 years age range has the highest percentage of unemployed individuals, with 8.1% or 33 of them being unemployed.
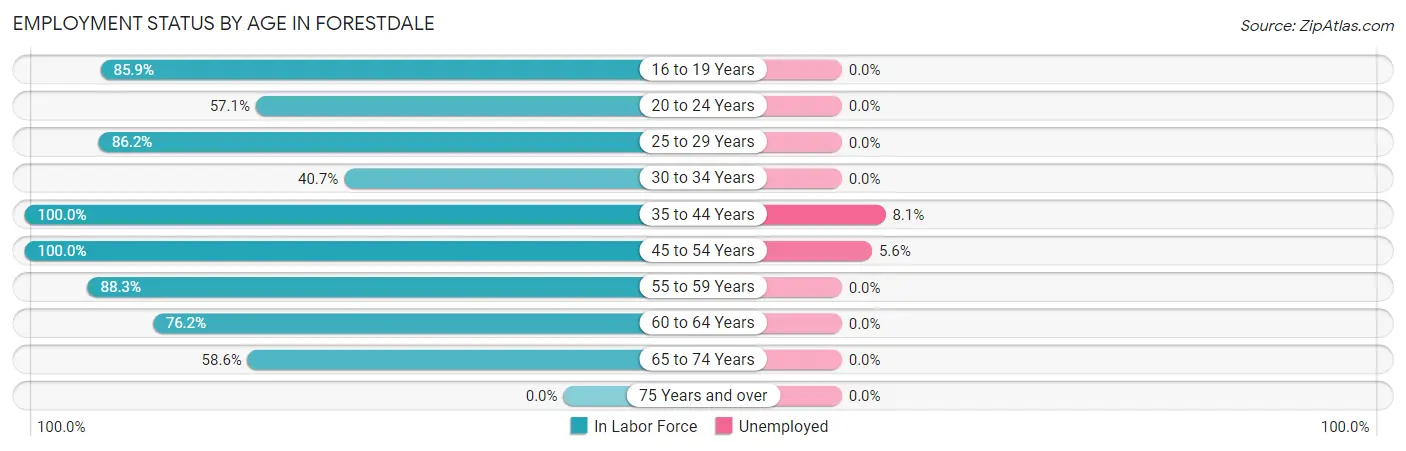
| Age Bracket | In Labor Force | Unemployed |
| 16 to 19 Years | 170 (85.9%) | 0 (0.0%) |
| 20 to 24 Years | 120 (57.1%) | 0 (0.0%) |
| 25 to 29 Years | 225 (86.2%) | 0 (0.0%) |
| 30 to 34 Years | 66 (40.7%) | 0 (0.0%) |
| 35 to 44 Years | 407 (100.0%) | 33 (8.1%) |
| 45 to 54 Years | 355 (100.0%) | 20 (5.6%) |
| 55 to 59 Years | 574 (88.3%) | 0 (0.0%) |
| 60 to 64 Years | 340 (76.2%) | 0 (0.0%) |
| 65 to 74 Years | 204 (58.6%) | 0 (0.0%) |
| 75 Years and over | 0 (0.0%) | 0 (0.0%) |
| Total | 2,460 (74.0%) | 54 (2.2%) |
Employment Status by Educational Attainment in Forestdale
According to labor force statistics for Forestdale, 86.2% of individuals (1,966) out of the total population between 25 and 64 years of age (2,281) are in the labor force, with 2.7% or 53 of them being unemployed. The group with the highest labor force participation rate are those with the educational attainment of less than high school, with 100.0% or 35 individuals in the labor force. Within the labor force, individuals with bachelor's degree or higher education have the highest percentage of unemployment, with 6.3% or 53 of them being unemployed.
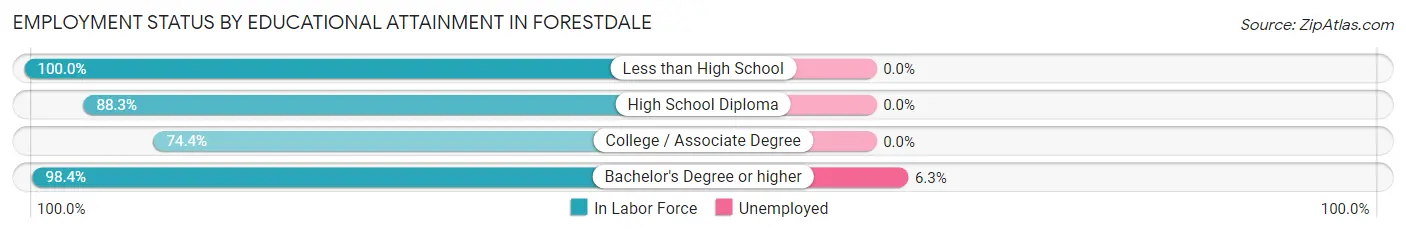
| Educational Attainment | In Labor Force | Unemployed |
| Less than High School | 35 (100.0%) | 0 (0.0%) |
| High School Diploma | 362 (88.3%) | 0 (0.0%) |
| College / Associate Degree | 731 (74.4%) | 0 (0.0%) |
| Bachelor's Degree or higher | 839 (98.4%) | 54 (6.3%) |
| Total | 1,966 (86.2%) | 62 (2.7%) |
Employment Occupations by Sex in Forestdale
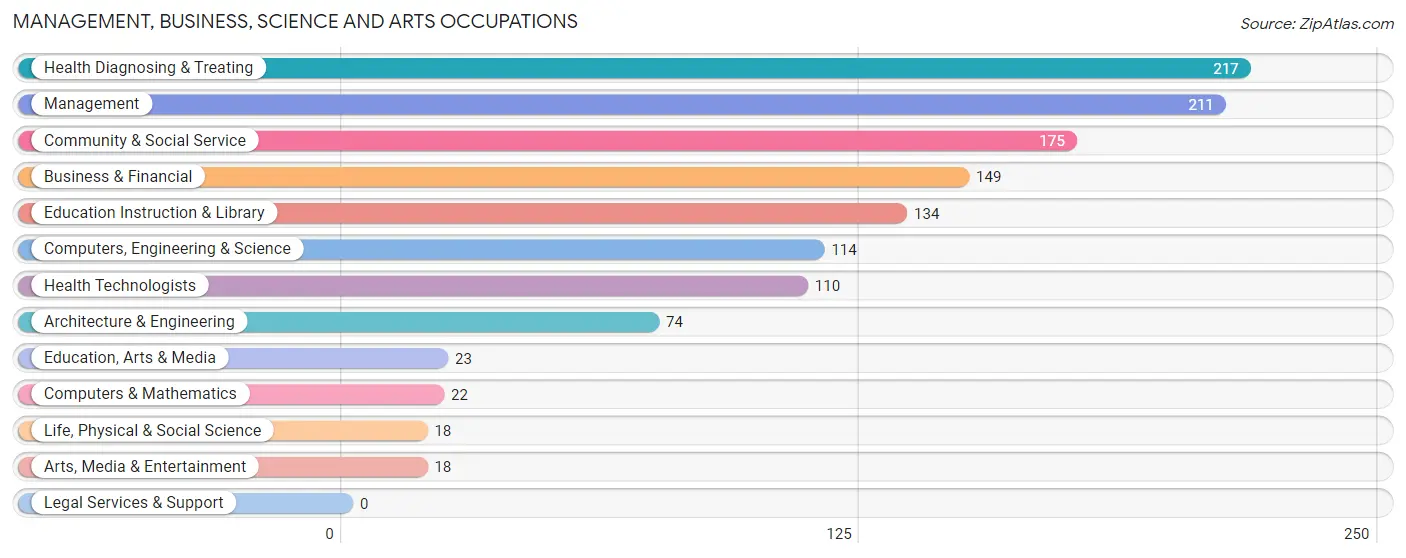
Management, Business, Science and Arts Occupations
The most common Management, Business, Science and Arts occupations in Forestdale are Health Diagnosing & Treating (217 | 9.0%), Management (211 | 8.8%), Community & Social Service (175 | 7.3%), Business & Financial (149 | 6.2%), and Education Instruction & Library (134 | 5.6%).
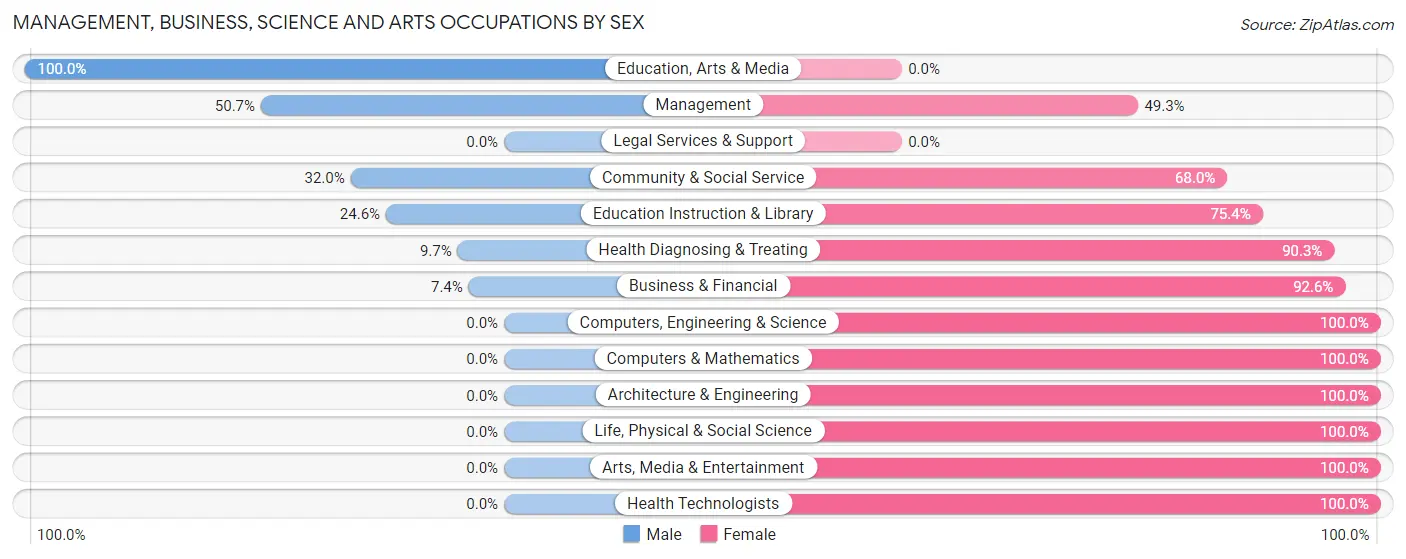
Management, Business, Science and Arts Occupations by Sex
Within the Management, Business, Science and Arts occupations in Forestdale, the most male-oriented occupations are Education, Arts & Media (100.0%), Management (50.7%), and Community & Social Service (32.0%), while the most female-oriented occupations are Computers, Engineering & Science (100.0%), Computers & Mathematics (100.0%), and Architecture & Engineering (100.0%).
| Occupation | Male | Female |
| Management | 107 (50.7%) | 104 (49.3%) |
| Business & Financial | 11 (7.4%) | 138 (92.6%) |
| Computers, Engineering & Science | 0 (0.0%) | 114 (100.0%) |
| Computers & Mathematics | 0 (0.0%) | 22 (100.0%) |
| Architecture & Engineering | 0 (0.0%) | 74 (100.0%) |
| Life, Physical & Social Science | 0 (0.0%) | 18 (100.0%) |
| Community & Social Service | 56 (32.0%) | 119 (68.0%) |
| Education, Arts & Media | 23 (100.0%) | 0 (0.0%) |
| Legal Services & Support | 0 (0.0%) | 0 (0.0%) |
| Education Instruction & Library | 33 (24.6%) | 101 (75.4%) |
| Arts, Media & Entertainment | 0 (0.0%) | 18 (100.0%) |
| Health Diagnosing & Treating | 21 (9.7%) | 196 (90.3%) |
| Health Technologists | 0 (0.0%) | 110 (100.0%) |
| Total (Category) | 195 (22.5%) | 671 (77.5%) |
| Total (Overall) | 1,133 (47.0%) | 1,275 (52.9%) |
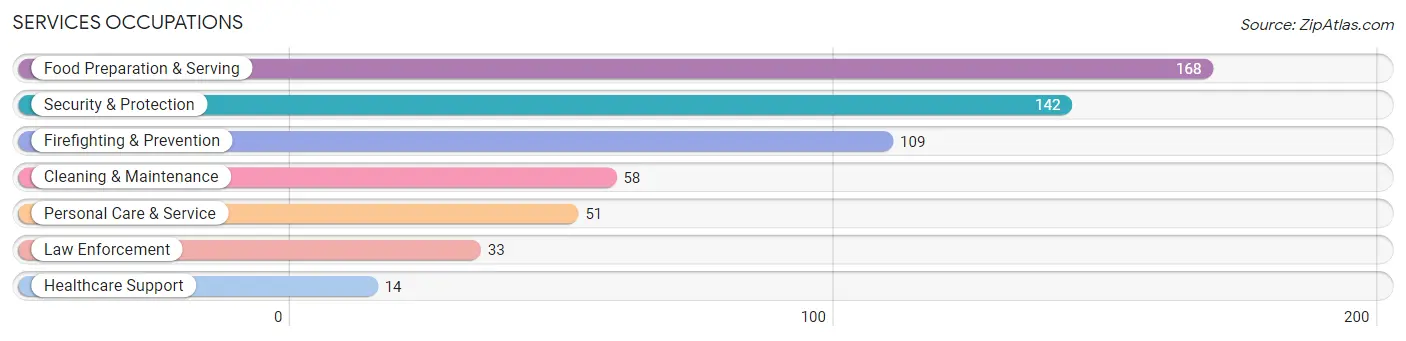
Services Occupations
The most common Services occupations in Forestdale are Food Preparation & Serving (168 | 7.0%), Security & Protection (142 | 5.9%), Firefighting & Prevention (109 | 4.5%), Cleaning & Maintenance (58 | 2.4%), and Personal Care & Service (51 | 2.1%).
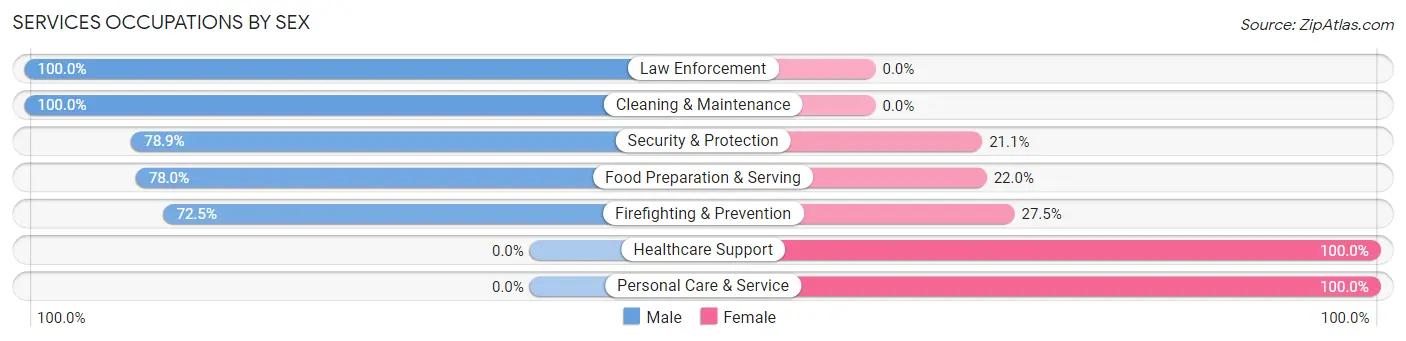
Services Occupations by Sex
Within the Services occupations in Forestdale, the most male-oriented occupations are Law Enforcement (100.0%), Cleaning & Maintenance (100.0%), and Security & Protection (78.9%), while the most female-oriented occupations are Healthcare Support (100.0%), Personal Care & Service (100.0%), and Firefighting & Prevention (27.5%).
| Occupation | Male | Female |
| Healthcare Support | 0 (0.0%) | 14 (100.0%) |
| Security & Protection | 112 (78.9%) | 30 (21.1%) |
| Firefighting & Prevention | 79 (72.5%) | 30 (27.5%) |
| Law Enforcement | 33 (100.0%) | 0 (0.0%) |
| Food Preparation & Serving | 131 (78.0%) | 37 (22.0%) |
| Cleaning & Maintenance | 58 (100.0%) | 0 (0.0%) |
| Personal Care & Service | 0 (0.0%) | 51 (100.0%) |
| Total (Category) | 301 (69.5%) | 132 (30.5%) |
| Total (Overall) | 1,133 (47.0%) | 1,275 (52.9%) |
Sales and Office Occupations
The most common Sales and Office occupations in Forestdale are Office & Administration (303 | 12.6%), and Sales & Related (160 | 6.6%).
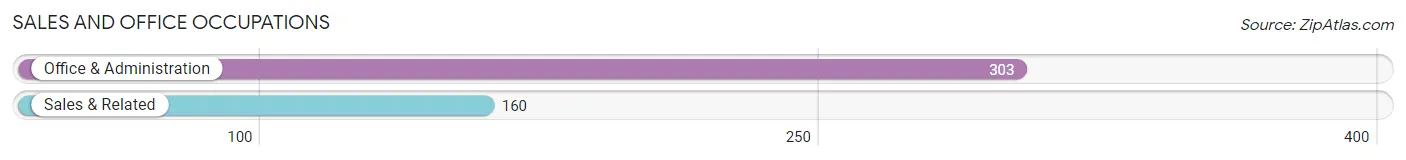
Sales and Office Occupations by Sex
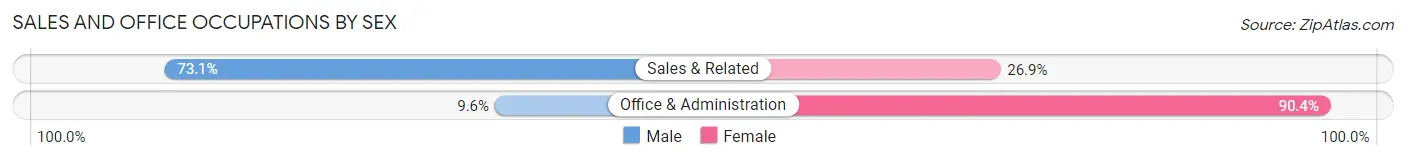
| Occupation | Male | Female |
| Sales & Related | 117 (73.1%) | 43 (26.9%) |
| Office & Administration | 29 (9.6%) | 274 (90.4%) |
| Total (Category) | 146 (31.5%) | 317 (68.5%) |
| Total (Overall) | 1,133 (47.0%) | 1,275 (52.9%) |
Natural Resources, Construction and Maintenance Occupations
The most common Natural Resources, Construction and Maintenance occupations in Forestdale are Construction & Extraction (270 | 11.2%), and Installation, Maintenance & Repair (65 | 2.7%).
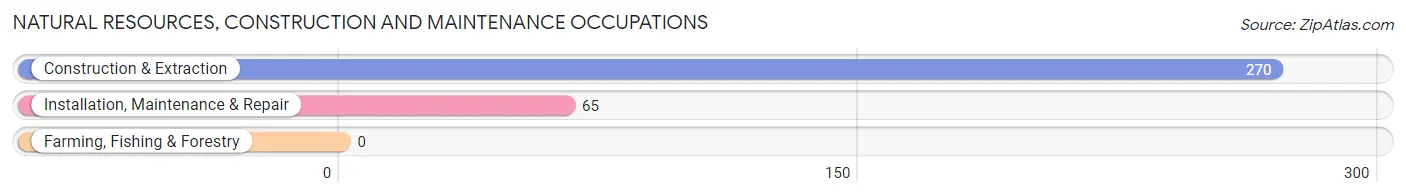
Natural Resources, Construction and Maintenance Occupations by Sex
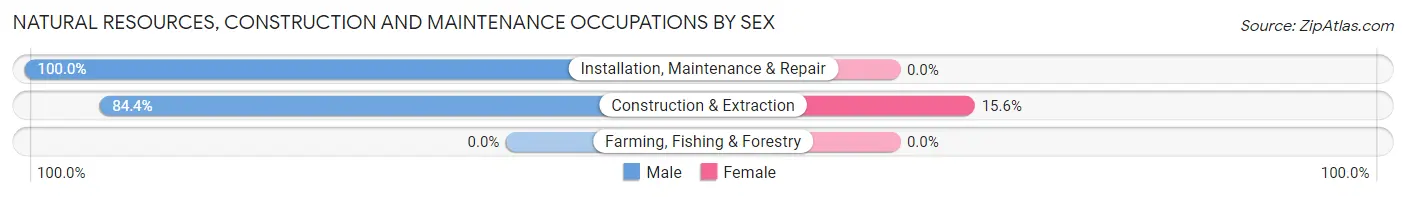
| Occupation | Male | Female |
| Farming, Fishing & Forestry | 0 (0.0%) | 0 (0.0%) |
| Construction & Extraction | 228 (84.4%) | 42 (15.6%) |
| Installation, Maintenance & Repair | 65 (100.0%) | 0 (0.0%) |
| Total (Category) | 293 (87.5%) | 42 (12.5%) |
| Total (Overall) | 1,133 (47.0%) | 1,275 (52.9%) |
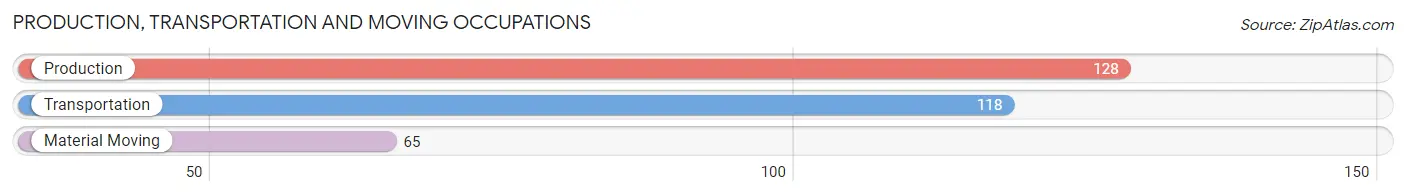
Production, Transportation and Moving Occupations
The most common Production, Transportation and Moving occupations in Forestdale are Production (128 | 5.3%), Transportation (118 | 4.9%), and Material Moving (65 | 2.7%).
Production, Transportation and Moving Occupations by Sex
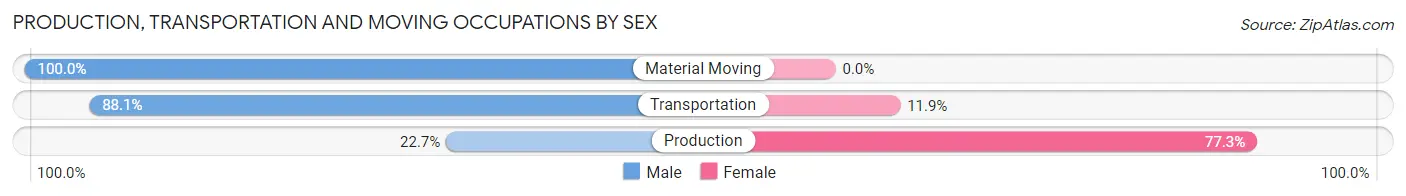
| Occupation | Male | Female |
| Production | 29 (22.7%) | 99 (77.3%) |
| Transportation | 104 (88.1%) | 14 (11.9%) |
| Material Moving | 65 (100.0%) | 0 (0.0%) |
| Total (Category) | 198 (63.7%) | 113 (36.3%) |
| Total (Overall) | 1,133 (47.0%) | 1,275 (52.9%) |
Employment Industries by Sex in Forestdale
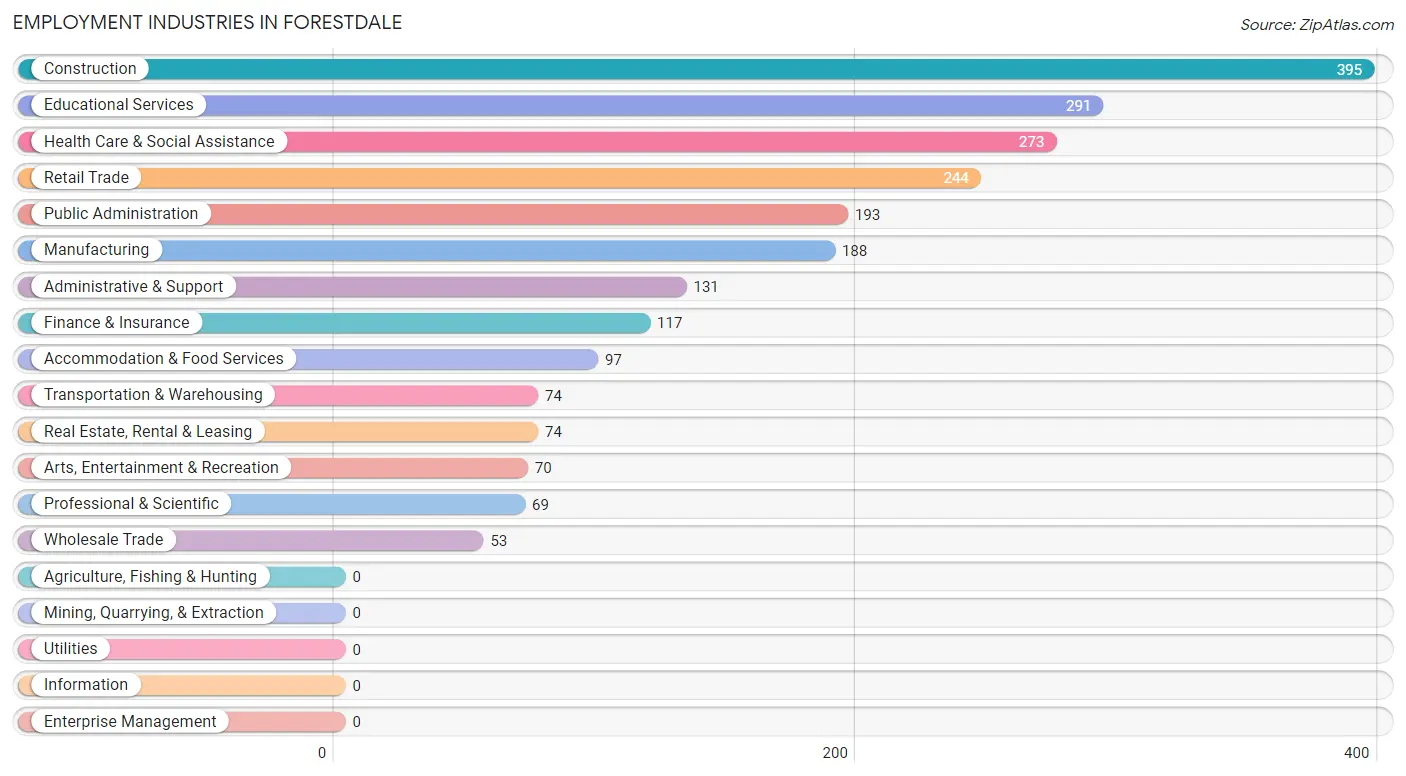
Employment Industries in Forestdale
The major employment industries in Forestdale include Construction (395 | 16.4%), Educational Services (291 | 12.1%), Health Care & Social Assistance (273 | 11.3%), Retail Trade (244 | 10.1%), and Public Administration (193 | 8.0%).
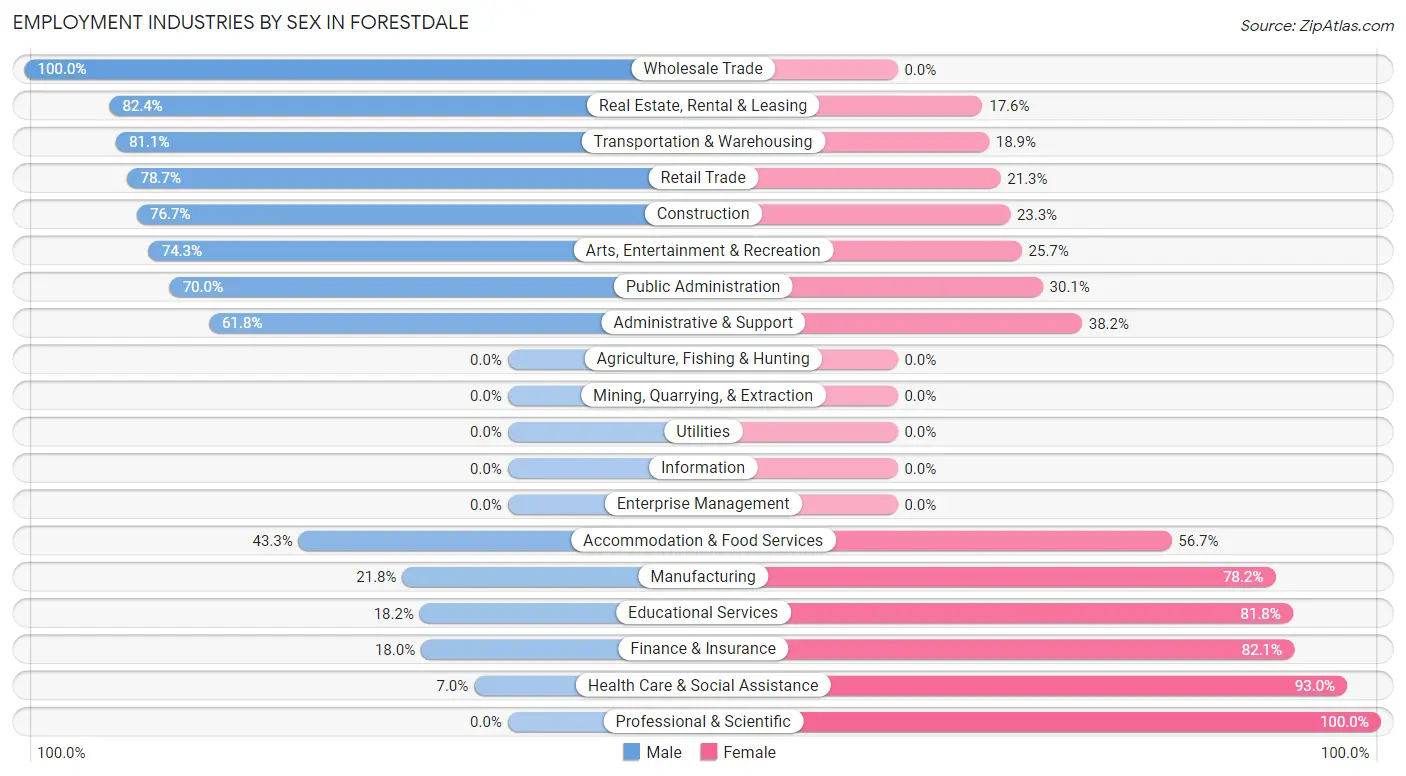
Employment Industries by Sex in Forestdale
The Forestdale industries that see more men than women are Wholesale Trade (100.0%), Real Estate, Rental & Leasing (82.4%), and Transportation & Warehousing (81.1%), whereas the industries that tend to have a higher number of women are Professional & Scientific (100.0%), Health Care & Social Assistance (93.0%), and Finance & Insurance (82.1%).
| Industry | Male | Female |
| Agriculture, Fishing & Hunting | 0 (0.0%) | 0 (0.0%) |
| Mining, Quarrying, & Extraction | 0 (0.0%) | 0 (0.0%) |
| Construction | 303 (76.7%) | 92 (23.3%) |
| Manufacturing | 41 (21.8%) | 147 (78.2%) |
| Wholesale Trade | 53 (100.0%) | 0 (0.0%) |
| Retail Trade | 192 (78.7%) | 52 (21.3%) |
| Transportation & Warehousing | 60 (81.1%) | 14 (18.9%) |
| Utilities | 0 (0.0%) | 0 (0.0%) |
| Information | 0 (0.0%) | 0 (0.0%) |
| Finance & Insurance | 21 (17.9%) | 96 (82.1%) |
| Real Estate, Rental & Leasing | 61 (82.4%) | 13 (17.6%) |
| Professional & Scientific | 0 (0.0%) | 69 (100.0%) |
| Enterprise Management | 0 (0.0%) | 0 (0.0%) |
| Administrative & Support | 81 (61.8%) | 50 (38.2%) |
| Educational Services | 53 (18.2%) | 238 (81.8%) |
| Health Care & Social Assistance | 19 (7.0%) | 254 (93.0%) |
| Arts, Entertainment & Recreation | 52 (74.3%) | 18 (25.7%) |
| Accommodation & Food Services | 42 (43.3%) | 55 (56.7%) |
| Public Administration | 135 (70.0%) | 58 (30.0%) |
| Total | 1,133 (47.0%) | 1,275 (52.9%) |
Education in Forestdale
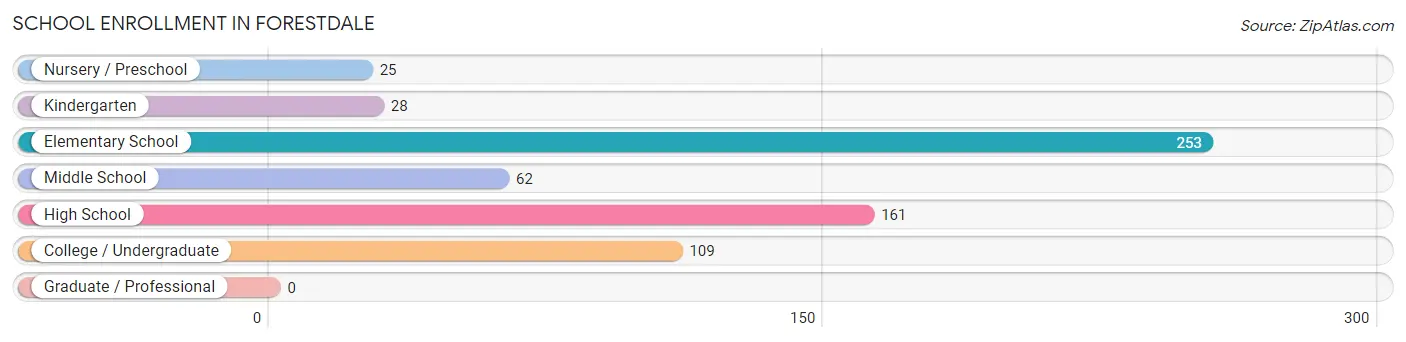
School Enrollment in Forestdale
The most common levels of schooling among the 638 students in Forestdale are elementary school (253 | 39.7%), high school (161 | 25.2%), and college / undergraduate (109 | 17.1%).
| School Level | # Students | % Students |
| Nursery / Preschool | 25 | 3.9% |
| Kindergarten | 28 | 4.4% |
| Elementary School | 253 | 39.7% |
| Middle School | 62 | 9.7% |
| High School | 161 | 25.2% |
| College / Undergraduate | 109 | 17.1% |
| Graduate / Professional | 0 | 0.0% |
| Total | 638 | 100.0% |
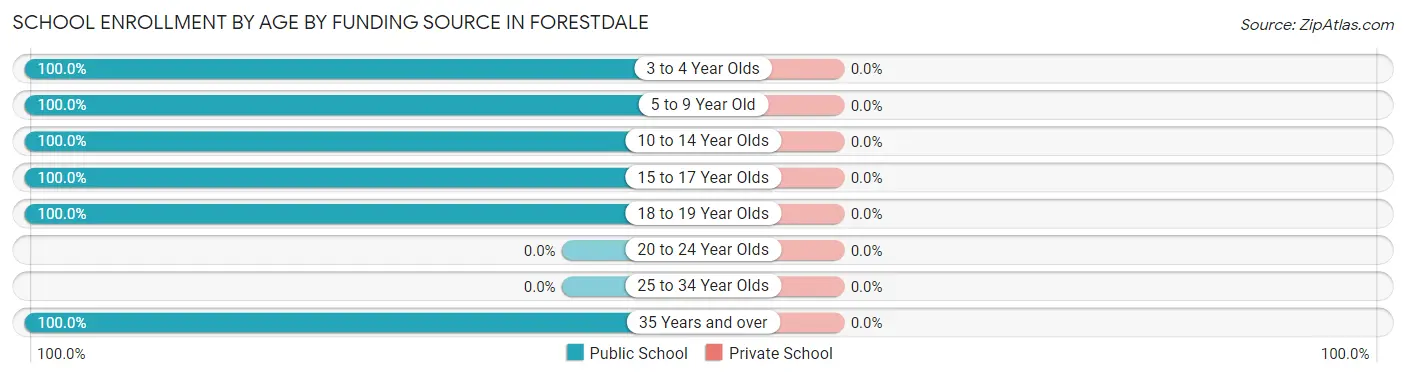
School Enrollment by Age by Funding Source in Forestdale
| Age Bracket | Public School | Private School |
| 3 to 4 Year Olds | 4 (100.0%) | 0 (0.0%) |
| 5 to 9 Year Old | 264 (100.0%) | 0 (0.0%) |
| 10 to 14 Year Olds | 142 (100.0%) | 0 (0.0%) |
| 15 to 17 Year Olds | 119 (100.0%) | 0 (0.0%) |
| 18 to 19 Year Olds | 36 (100.0%) | 0 (0.0%) |
| 20 to 24 Year Olds | 0 (0.0%) | 0 (0.0%) |
| 25 to 34 Year Olds | 0 (0.0%) | 0 (0.0%) |
| 35 Years and over | 73 (100.0%) | 0 (0.0%) |
| Total | 638 (100.0%) | 0 (0.0%) |
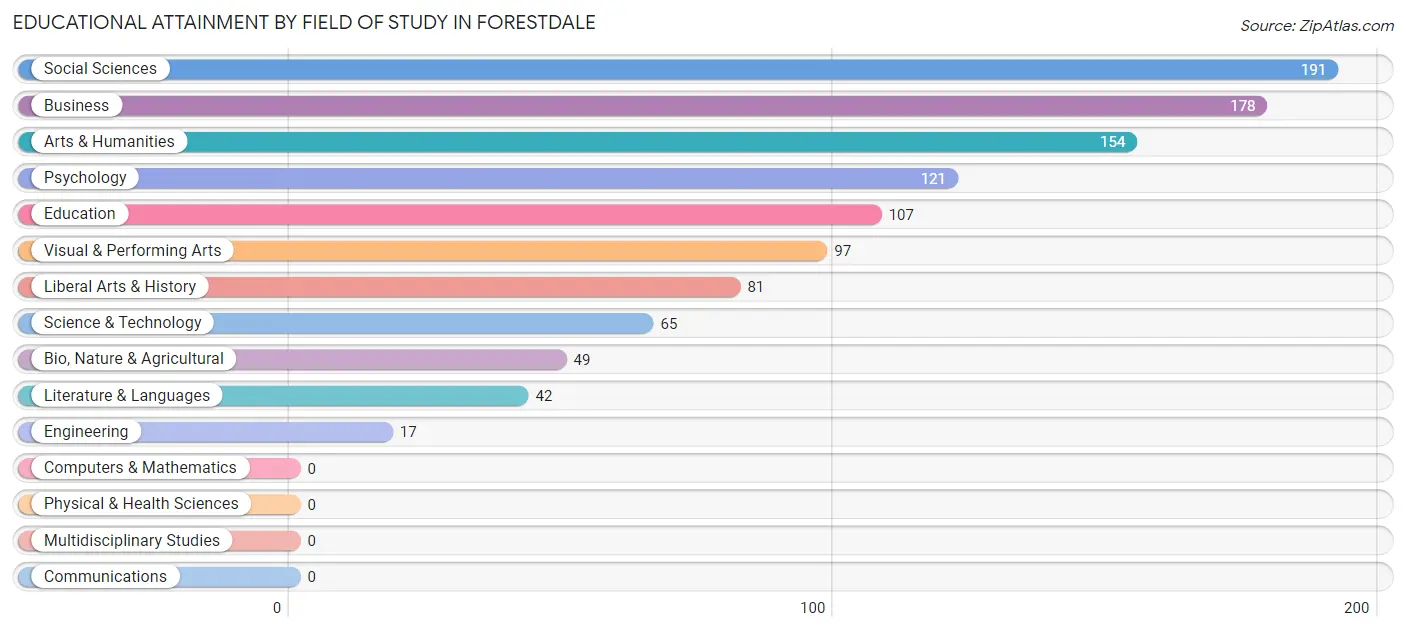
Educational Attainment by Field of Study in Forestdale
Social sciences (191 | 17.3%), business (178 | 16.2%), arts & humanities (154 | 14.0%), psychology (121 | 11.0%), and education (107 | 9.7%) are the most common fields of study among 1,102 individuals in Forestdale who have obtained a bachelor's degree or higher.
| Field of Study | # Graduates | % Graduates |
| Computers & Mathematics | 0 | 0.0% |
| Bio, Nature & Agricultural | 49 | 4.4% |
| Physical & Health Sciences | 0 | 0.0% |
| Psychology | 121 | 11.0% |
| Social Sciences | 191 | 17.3% |
| Engineering | 17 | 1.5% |
| Multidisciplinary Studies | 0 | 0.0% |
| Science & Technology | 65 | 5.9% |
| Business | 178 | 16.2% |
| Education | 107 | 9.7% |
| Literature & Languages | 42 | 3.8% |
| Liberal Arts & History | 81 | 7.3% |
| Visual & Performing Arts | 97 | 8.8% |
| Communications | 0 | 0.0% |
| Arts & Humanities | 154 | 14.0% |
| Total | 1,102 | 100.0% |
Transportation & Commute in Forestdale
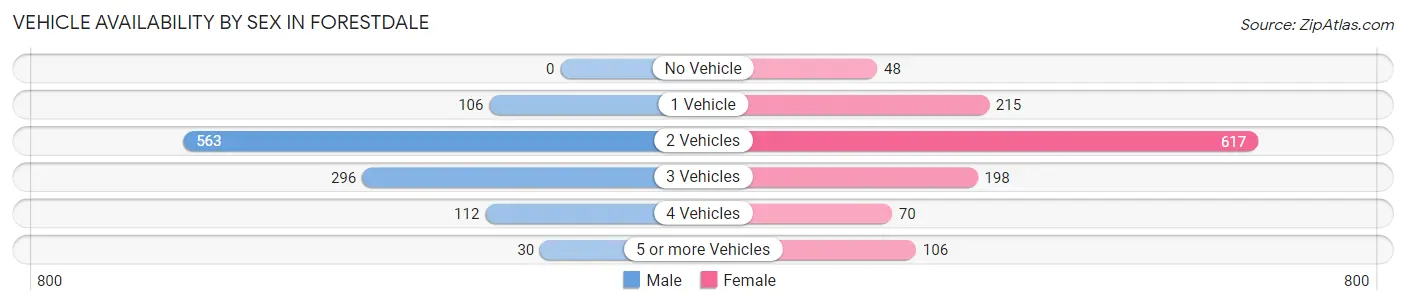
Vehicle Availability by Sex in Forestdale
The most prevalent vehicle ownership categories in Forestdale are males with 2 vehicles (563, accounting for 50.9%) and females with 2 vehicles (617, making up 44.9%).
| Vehicles Available | Male | Female |
| No Vehicle | 0 (0.0%) | 48 (3.8%) |
| 1 Vehicle | 106 (9.6%) | 215 (17.2%) |
| 2 Vehicles | 563 (50.9%) | 617 (49.2%) |
| 3 Vehicles | 296 (26.7%) | 198 (15.8%) |
| 4 Vehicles | 112 (10.1%) | 70 (5.6%) |
| 5 or more Vehicles | 30 (2.7%) | 106 (8.5%) |
| Total | 1,107 (100.0%) | 1,254 (100.0%) |
Commute Time in Forestdale
The most frequently occuring commute durations in Forestdale are 10 to 14 minutes (383 commuters, 17.2%), 30 to 34 minutes (348 commuters, 15.7%), and 60 to 89 minutes (253 commuters, 11.4%).
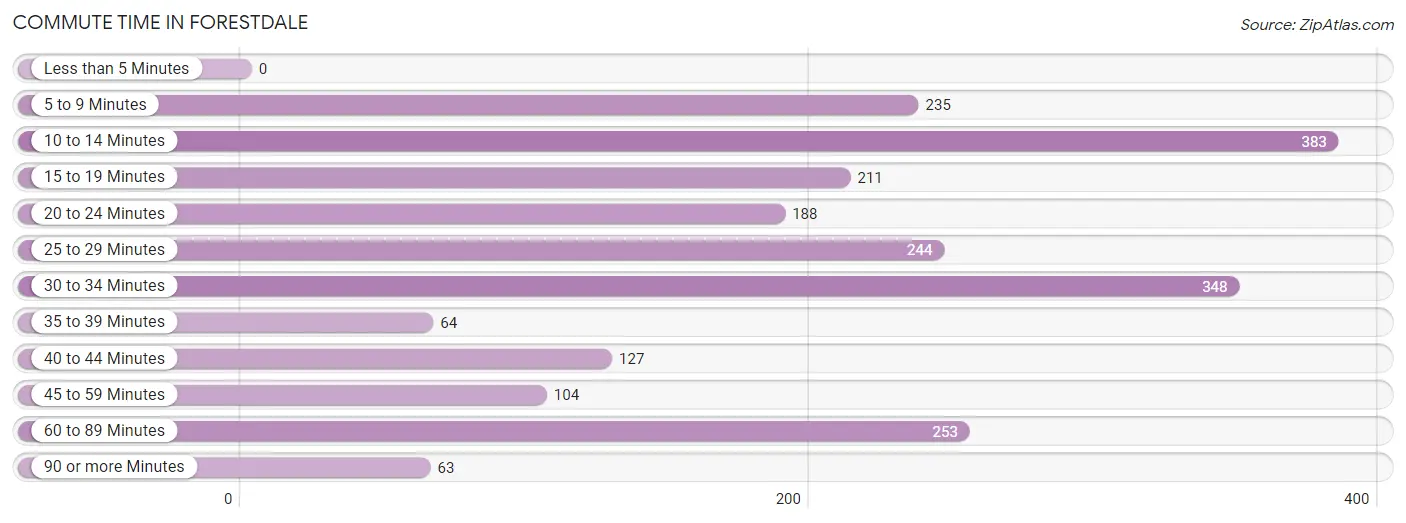
| Commute Time | # Commuters | % Commuters |
| Less than 5 Minutes | 0 | 0.0% |
| 5 to 9 Minutes | 235 | 10.6% |
| 10 to 14 Minutes | 383 | 17.2% |
| 15 to 19 Minutes | 211 | 9.5% |
| 20 to 24 Minutes | 188 | 8.5% |
| 25 to 29 Minutes | 244 | 11.0% |
| 30 to 34 Minutes | 348 | 15.7% |
| 35 to 39 Minutes | 64 | 2.9% |
| 40 to 44 Minutes | 127 | 5.7% |
| 45 to 59 Minutes | 104 | 4.7% |
| 60 to 89 Minutes | 253 | 11.4% |
| 90 or more Minutes | 63 | 2.8% |
Commute Time by Sex in Forestdale
The most common commute times in Forestdale are 10 to 14 minutes (233 commuters, 22.0%) for males and 30 to 34 minutes (302 commuters, 26.0%) for females.
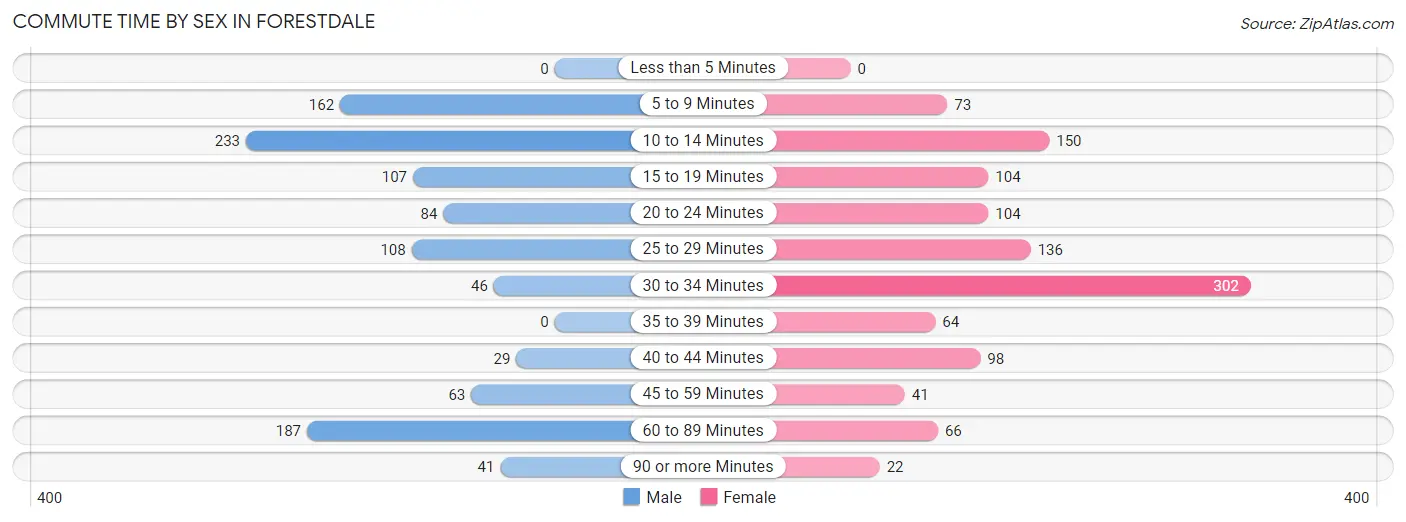
| Commute Time | Male | Female |
| Less than 5 Minutes | 0 (0.0%) | 0 (0.0%) |
| 5 to 9 Minutes | 162 (15.3%) | 73 (6.3%) |
| 10 to 14 Minutes | 233 (22.0%) | 150 (12.9%) |
| 15 to 19 Minutes | 107 (10.1%) | 104 (9.0%) |
| 20 to 24 Minutes | 84 (7.9%) | 104 (9.0%) |
| 25 to 29 Minutes | 108 (10.2%) | 136 (11.7%) |
| 30 to 34 Minutes | 46 (4.3%) | 302 (26.0%) |
| 35 to 39 Minutes | 0 (0.0%) | 64 (5.5%) |
| 40 to 44 Minutes | 29 (2.7%) | 98 (8.5%) |
| 45 to 59 Minutes | 63 (5.9%) | 41 (3.5%) |
| 60 to 89 Minutes | 187 (17.6%) | 66 (5.7%) |
| 90 or more Minutes | 41 (3.9%) | 22 (1.9%) |
Time of Departure to Work by Sex in Forestdale
The most frequent times of departure to work in Forestdale are 6:00 AM to 6:29 AM (190, 17.9%) for males and 7:00 AM to 7:29 AM (274, 23.6%) for females.
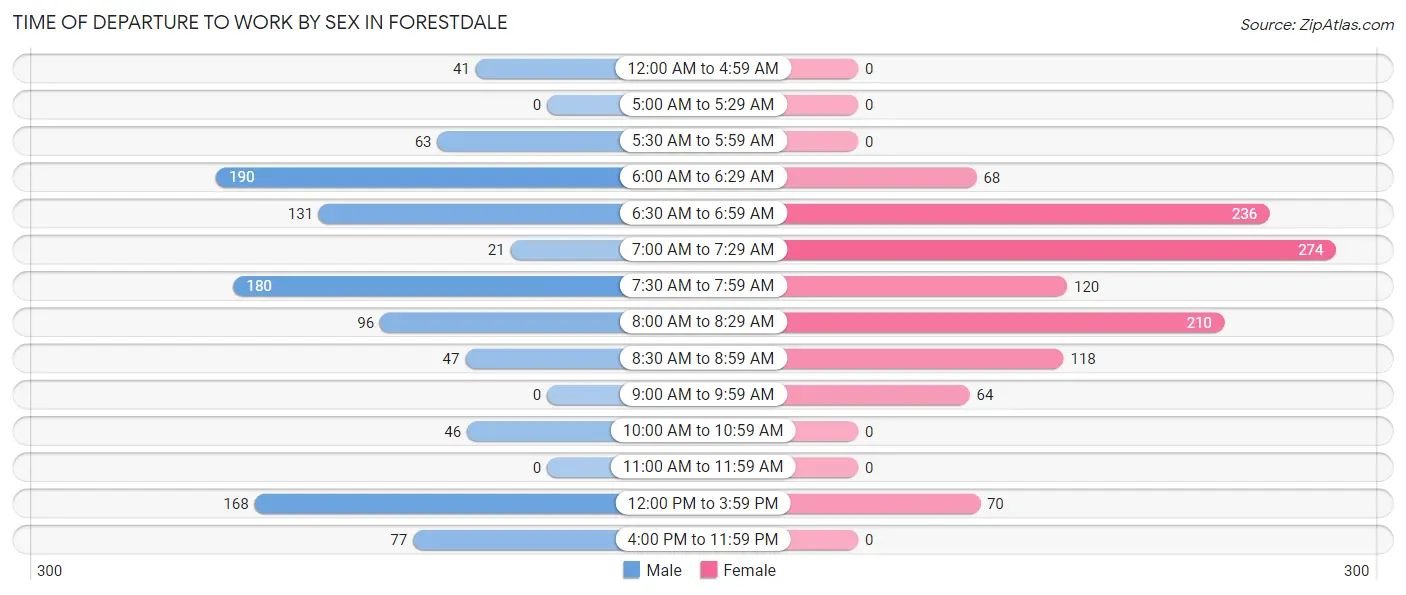
| Time of Departure | Male | Female |
| 12:00 AM to 4:59 AM | 41 (3.9%) | 0 (0.0%) |
| 5:00 AM to 5:29 AM | 0 (0.0%) | 0 (0.0%) |
| 5:30 AM to 5:59 AM | 63 (5.9%) | 0 (0.0%) |
| 6:00 AM to 6:29 AM | 190 (17.9%) | 68 (5.9%) |
| 6:30 AM to 6:59 AM | 131 (12.4%) | 236 (20.3%) |
| 7:00 AM to 7:29 AM | 21 (2.0%) | 274 (23.6%) |
| 7:30 AM to 7:59 AM | 180 (17.0%) | 120 (10.3%) |
| 8:00 AM to 8:29 AM | 96 (9.1%) | 210 (18.1%) |
| 8:30 AM to 8:59 AM | 47 (4.4%) | 118 (10.2%) |
| 9:00 AM to 9:59 AM | 0 (0.0%) | 64 (5.5%) |
| 10:00 AM to 10:59 AM | 46 (4.3%) | 0 (0.0%) |
| 11:00 AM to 11:59 AM | 0 (0.0%) | 0 (0.0%) |
| 12:00 PM to 3:59 PM | 168 (15.9%) | 70 (6.0%) |
| 4:00 PM to 11:59 PM | 77 (7.3%) | 0 (0.0%) |
| Total | 1,060 (100.0%) | 1,160 (100.0%) |
Housing Occupancy in Forestdale
Occupancy by Ownership in Forestdale
Of the total 1,532 dwellings in Forestdale, owner-occupied units account for 1,352 (88.2%), while renter-occupied units make up 180 (11.7%).
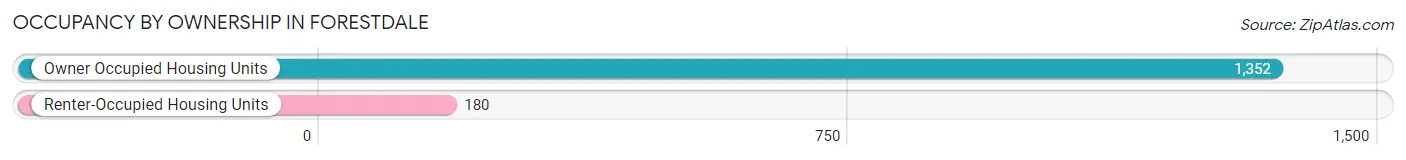
| Occupancy | # Housing Units | % Housing Units |
| Owner Occupied Housing Units | 1,352 | 88.2% |
| Renter-Occupied Housing Units | 180 | 11.7% |
| Total Occupied Housing Units | 1,532 | 100.0% |
Occupancy by Household Size in Forestdale
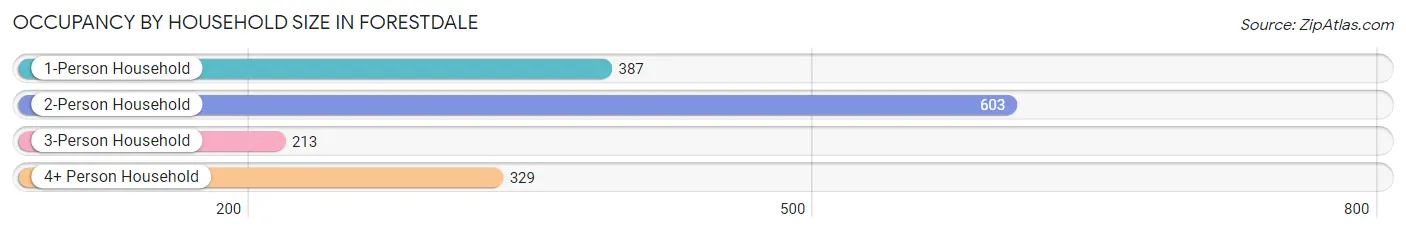
| Household Size | # Housing Units | % Housing Units |
| 1-Person Household | 387 | 25.3% |
| 2-Person Household | 603 | 39.4% |
| 3-Person Household | 213 | 13.9% |
| 4+ Person Household | 329 | 21.5% |
| Total Housing Units | 1,532 | 100.0% |
Occupancy by Ownership by Household Size in Forestdale
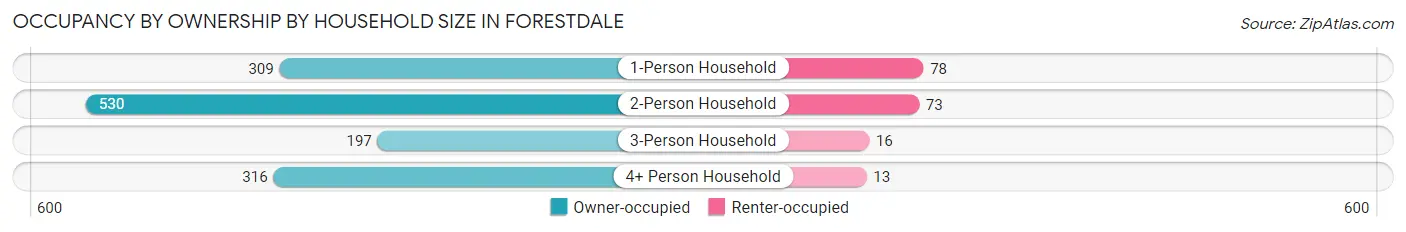
| Household Size | Owner-occupied | Renter-occupied |
| 1-Person Household | 309 (79.8%) | 78 (20.2%) |
| 2-Person Household | 530 (87.9%) | 73 (12.1%) |
| 3-Person Household | 197 (92.5%) | 16 (7.5%) |
| 4+ Person Household | 316 (96.1%) | 13 (4.0%) |
| Total Housing Units | 1,352 (88.2%) | 180 (11.7%) |
Occupancy by Educational Attainment in Forestdale
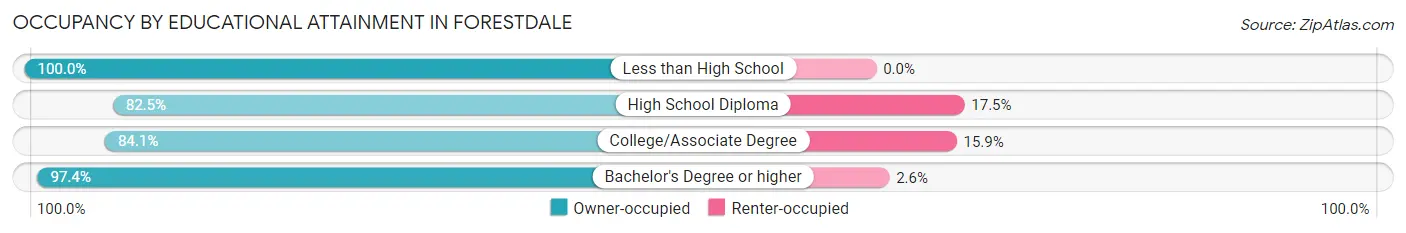
| Household Size | Owner-occupied | Renter-occupied |
| Less than High School | 10 (100.0%) | 0 (0.0%) |
| High School Diploma | 250 (82.5%) | 53 (17.5%) |
| College/Associate Degree | 601 (84.1%) | 114 (15.9%) |
| Bachelor's Degree or higher | 491 (97.4%) | 13 (2.6%) |
Occupancy by Age of Householder in Forestdale
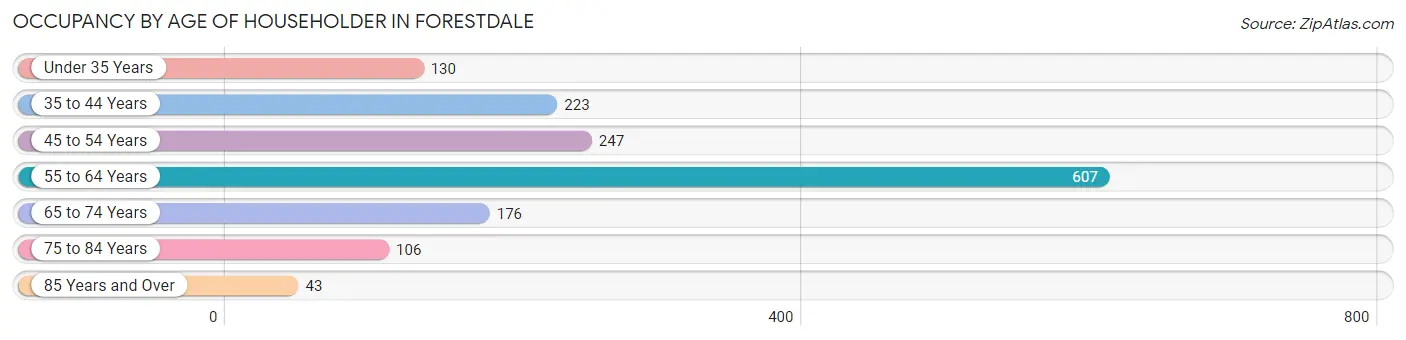
| Age Bracket | # Households | % Households |
| Under 35 Years | 130 | 8.5% |
| 35 to 44 Years | 223 | 14.6% |
| 45 to 54 Years | 247 | 16.1% |
| 55 to 64 Years | 607 | 39.6% |
| 65 to 74 Years | 176 | 11.5% |
| 75 to 84 Years | 106 | 6.9% |
| 85 Years and Over | 43 | 2.8% |
| Total | 1,532 | 100.0% |
Housing Finances in Forestdale
Median Income by Occupancy in Forestdale
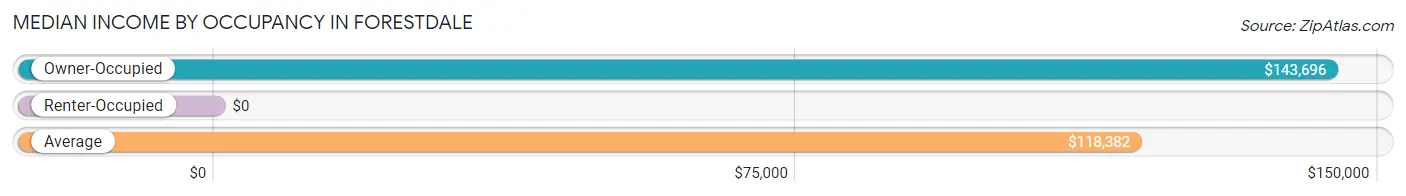
| Occupancy Type | # Households | Median Income |
| Owner-Occupied | 1,352 (88.2%) | $143,696 |
| Renter-Occupied | 180 (11.7%) | $0 |
| Average | 1,532 (100.0%) | $118,382 |
Occupancy by Householder Income Bracket in Forestdale
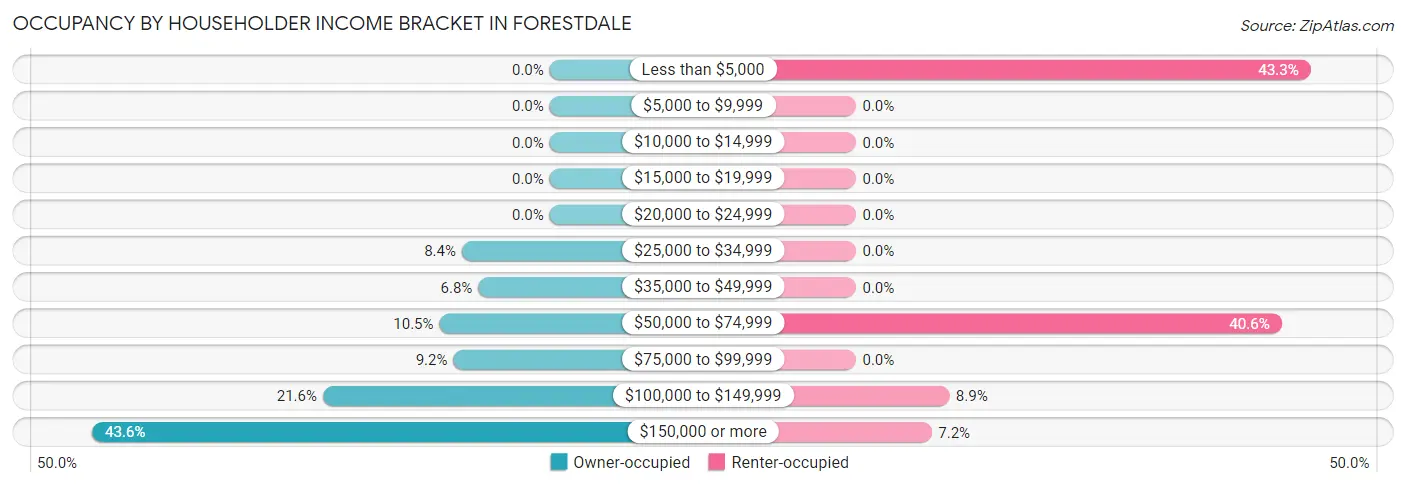
| Income Bracket | Owner-occupied | Renter-occupied |
| Less than $5,000 | 0 (0.0%) | 78 (43.3%) |
| $5,000 to $9,999 | 0 (0.0%) | 0 (0.0%) |
| $10,000 to $14,999 | 0 (0.0%) | 0 (0.0%) |
| $15,000 to $19,999 | 0 (0.0%) | 0 (0.0%) |
| $20,000 to $24,999 | 0 (0.0%) | 0 (0.0%) |
| $25,000 to $34,999 | 113 (8.4%) | 0 (0.0%) |
| $35,000 to $49,999 | 92 (6.8%) | 0 (0.0%) |
| $50,000 to $74,999 | 142 (10.5%) | 73 (40.6%) |
| $75,000 to $99,999 | 124 (9.2%) | 0 (0.0%) |
| $100,000 to $149,999 | 292 (21.6%) | 16 (8.9%) |
| $150,000 or more | 589 (43.6%) | 13 (7.2%) |
| Total | 1,352 (100.0%) | 180 (100.0%) |
Monthly Housing Cost Tiers in Forestdale
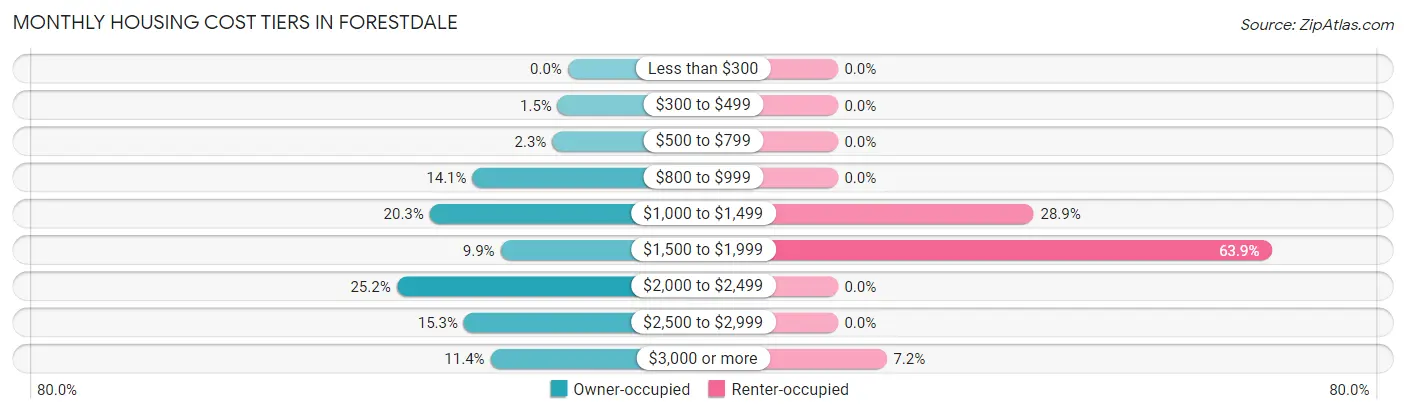
| Monthly Cost | Owner-occupied | Renter-occupied |
| Less than $300 | 0 (0.0%) | 0 (0.0%) |
| $300 to $499 | 20 (1.5%) | 0 (0.0%) |
| $500 to $799 | 31 (2.3%) | 0 (0.0%) |
| $800 to $999 | 190 (14.1%) | 0 (0.0%) |
| $1,000 to $1,499 | 275 (20.3%) | 52 (28.9%) |
| $1,500 to $1,999 | 134 (9.9%) | 115 (63.9%) |
| $2,000 to $2,499 | 341 (25.2%) | 0 (0.0%) |
| $2,500 to $2,999 | 207 (15.3%) | 0 (0.0%) |
| $3,000 or more | 154 (11.4%) | 13 (7.2%) |
| Total | 1,352 (100.0%) | 180 (100.0%) |
Physical Housing Characteristics in Forestdale
Housing Structures in Forestdale
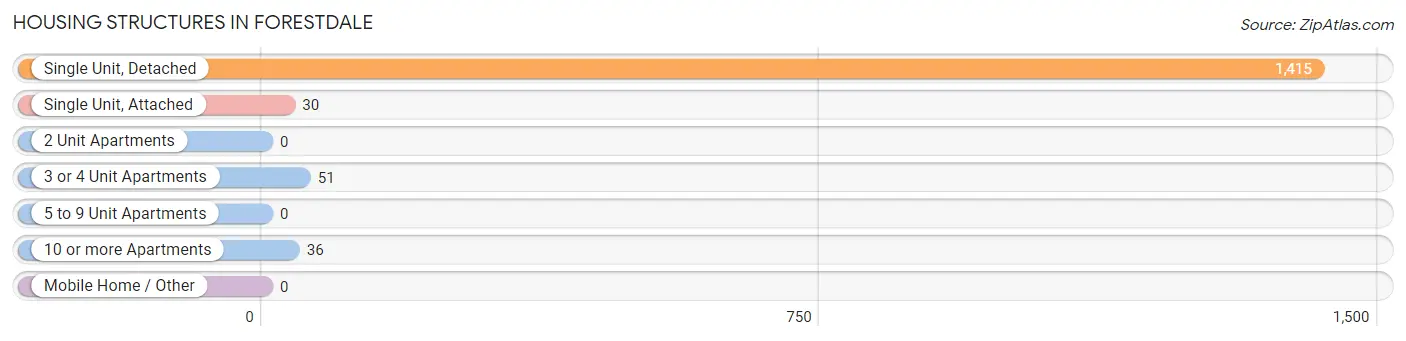
| Structure Type | # Housing Units | % Housing Units |
| Single Unit, Detached | 1,415 | 92.4% |
| Single Unit, Attached | 30 | 2.0% |
| 2 Unit Apartments | 0 | 0.0% |
| 3 or 4 Unit Apartments | 51 | 3.3% |
| 5 to 9 Unit Apartments | 0 | 0.0% |
| 10 or more Apartments | 36 | 2.4% |
| Mobile Home / Other | 0 | 0.0% |
| Total | 1,532 | 100.0% |
Housing Structures by Occupancy in Forestdale
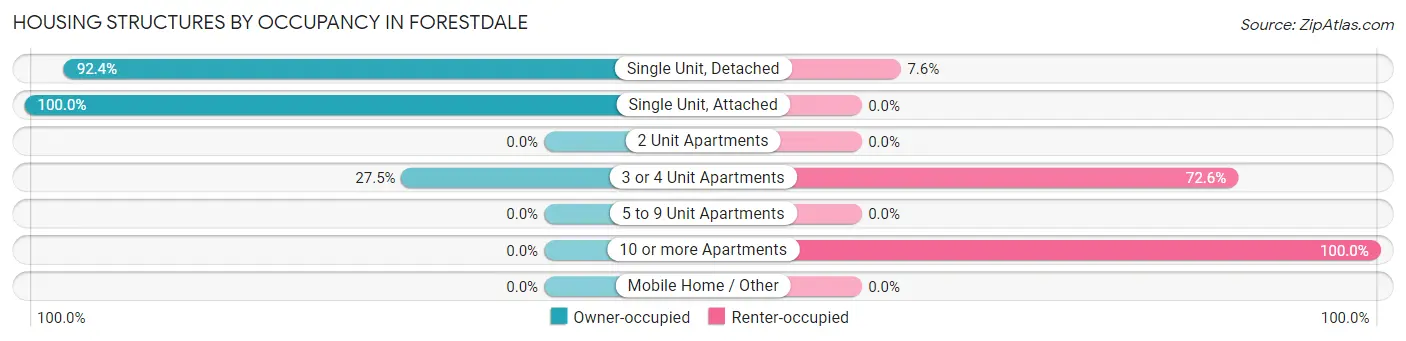
| Structure Type | Owner-occupied | Renter-occupied |
| Single Unit, Detached | 1,308 (92.4%) | 107 (7.6%) |
| Single Unit, Attached | 30 (100.0%) | 0 (0.0%) |
| 2 Unit Apartments | 0 (0.0%) | 0 (0.0%) |
| 3 or 4 Unit Apartments | 14 (27.5%) | 37 (72.6%) |
| 5 to 9 Unit Apartments | 0 (0.0%) | 0 (0.0%) |
| 10 or more Apartments | 0 (0.0%) | 36 (100.0%) |
| Mobile Home / Other | 0 (0.0%) | 0 (0.0%) |
| Total | 1,352 (88.2%) | 180 (11.7%) |
Housing Structures by Number of Rooms in Forestdale
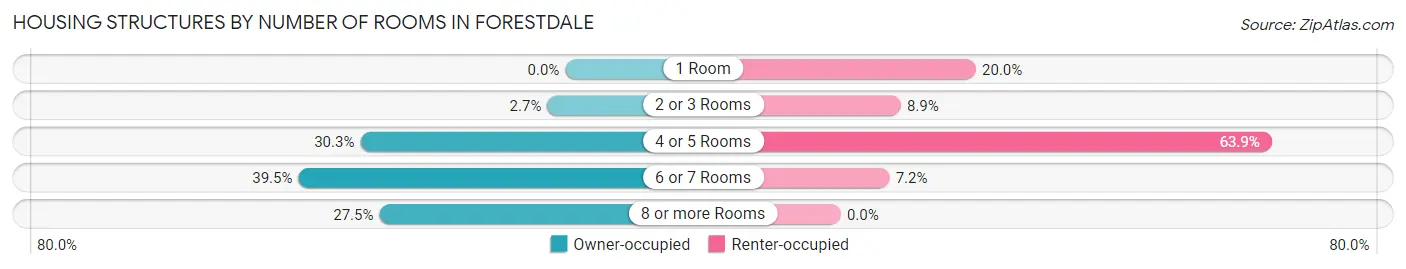
| Number of Rooms | Owner-occupied | Renter-occupied |
| 1 Room | 0 (0.0%) | 36 (20.0%) |
| 2 or 3 Rooms | 36 (2.7%) | 16 (8.9%) |
| 4 or 5 Rooms | 410 (30.3%) | 115 (63.9%) |
| 6 or 7 Rooms | 534 (39.5%) | 13 (7.2%) |
| 8 or more Rooms | 372 (27.5%) | 0 (0.0%) |
| Total | 1,352 (100.0%) | 180 (100.0%) |
Housing Structure by Heating Type in Forestdale
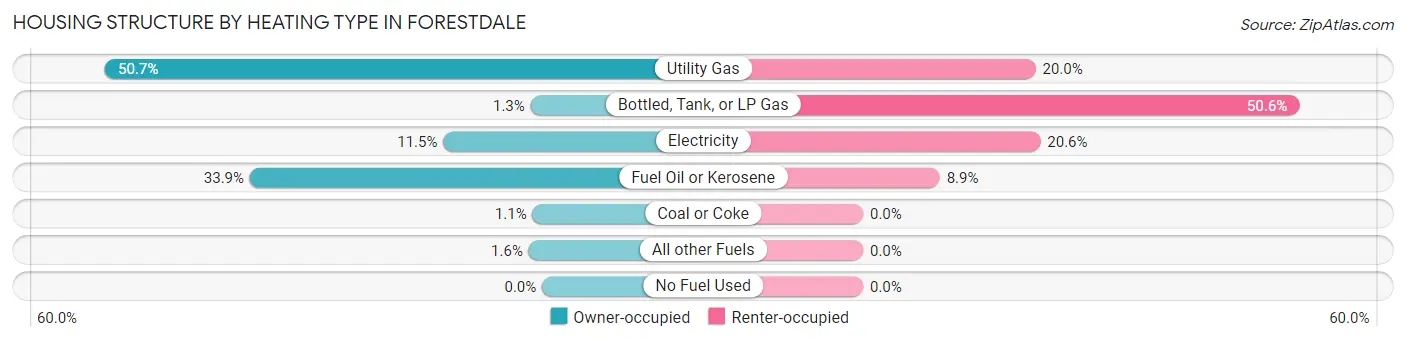
| Heating Type | Owner-occupied | Renter-occupied |
| Utility Gas | 685 (50.7%) | 36 (20.0%) |
| Bottled, Tank, or LP Gas | 18 (1.3%) | 91 (50.6%) |
| Electricity | 155 (11.5%) | 37 (20.6%) |
| Fuel Oil or Kerosene | 458 (33.9%) | 16 (8.9%) |
| Coal or Coke | 15 (1.1%) | 0 (0.0%) |
| All other Fuels | 21 (1.5%) | 0 (0.0%) |
| No Fuel Used | 0 (0.0%) | 0 (0.0%) |
| Total | 1,352 (100.0%) | 180 (100.0%) |
Household Vehicle Usage in Forestdale
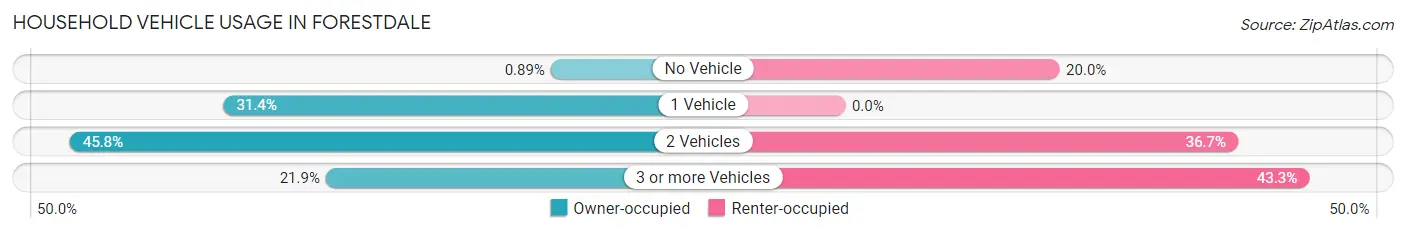
| Vehicles per Household | Owner-occupied | Renter-occupied |
| No Vehicle | 12 (0.9%) | 36 (20.0%) |
| 1 Vehicle | 425 (31.4%) | 0 (0.0%) |
| 2 Vehicles | 619 (45.8%) | 66 (36.7%) |
| 3 or more Vehicles | 296 (21.9%) | 78 (43.3%) |
| Total | 1,352 (100.0%) | 180 (100.0%) |
Real Estate & Mortgages in Forestdale
Real Estate and Mortgage Overview in Forestdale
| Characteristic | Without Mortgage | With Mortgage |
| Housing Units | 339 | 1,013 |
| Median Property Value | $457,200 | $444,700 |
| Median Household Income | $94,063 | $461 |
| Monthly Housing Costs | $956 | $154 |
| Real Estate Taxes | $5,430 | $0 |
Property Value by Mortgage Status in Forestdale
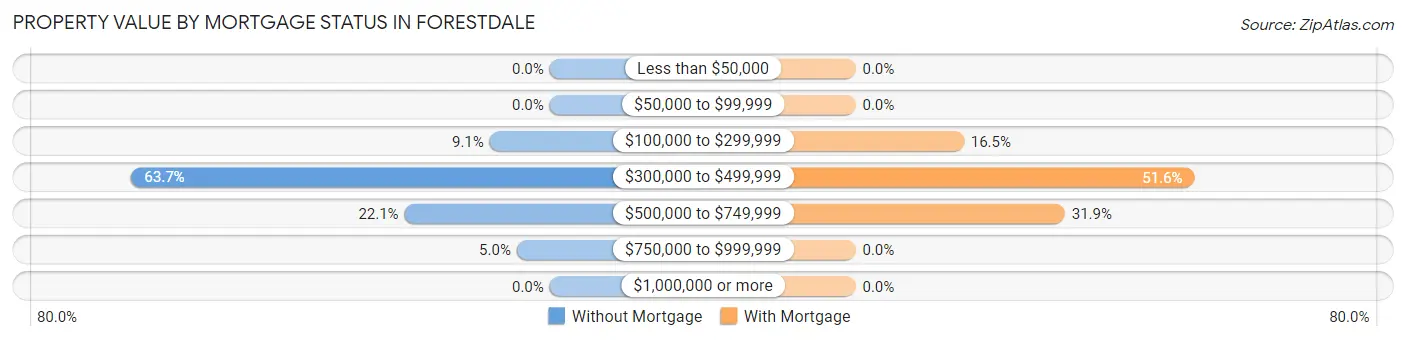
| Property Value | Without Mortgage | With Mortgage |
| Less than $50,000 | 0 (0.0%) | 0 (0.0%) |
| $50,000 to $99,999 | 0 (0.0%) | 0 (0.0%) |
| $100,000 to $299,999 | 31 (9.1%) | 167 (16.5%) |
| $300,000 to $499,999 | 216 (63.7%) | 523 (51.6%) |
| $500,000 to $749,999 | 75 (22.1%) | 323 (31.9%) |
| $750,000 to $999,999 | 17 (5.0%) | 0 (0.0%) |
| $1,000,000 or more | 0 (0.0%) | 0 (0.0%) |
| Total | 339 (100.0%) | 1,013 (100.0%) |
Household Income by Mortgage Status in Forestdale
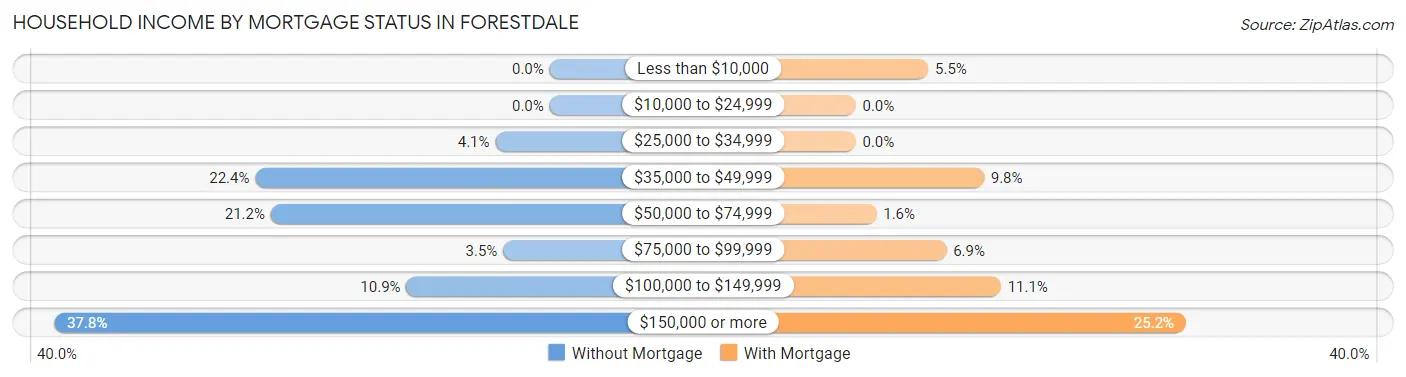
| Household Income | Without Mortgage | With Mortgage |
| Less than $10,000 | 0 (0.0%) | 56 (5.5%) |
| $10,000 to $24,999 | 0 (0.0%) | 0 (0.0%) |
| $25,000 to $34,999 | 14 (4.1%) | 0 (0.0%) |
| $35,000 to $49,999 | 76 (22.4%) | 99 (9.8%) |
| $50,000 to $74,999 | 72 (21.2%) | 16 (1.6%) |
| $75,000 to $99,999 | 12 (3.5%) | 70 (6.9%) |
| $100,000 to $149,999 | 37 (10.9%) | 112 (11.1%) |
| $150,000 or more | 128 (37.8%) | 255 (25.2%) |
| Total | 339 (100.0%) | 1,013 (100.0%) |
Property Value to Household Income Ratio in Forestdale
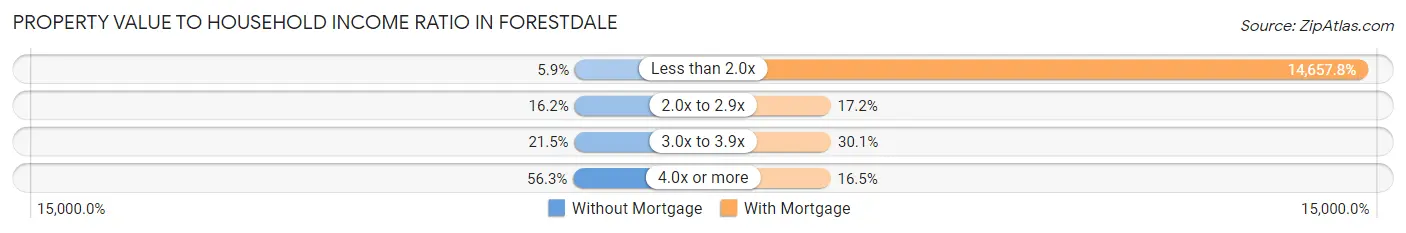
| Value-to-Income Ratio | Without Mortgage | With Mortgage |
| Less than 2.0x | 20 (5.9%) | 148,483 (14,657.7%) |
| 2.0x to 2.9x | 55 (16.2%) | 174 (17.2%) |
| 3.0x to 3.9x | 73 (21.5%) | 305 (30.1%) |
| 4.0x or more | 191 (56.3%) | 167 (16.5%) |
| Total | 339 (100.0%) | 1,013 (100.0%) |
Real Estate Taxes by Mortgage Status in Forestdale
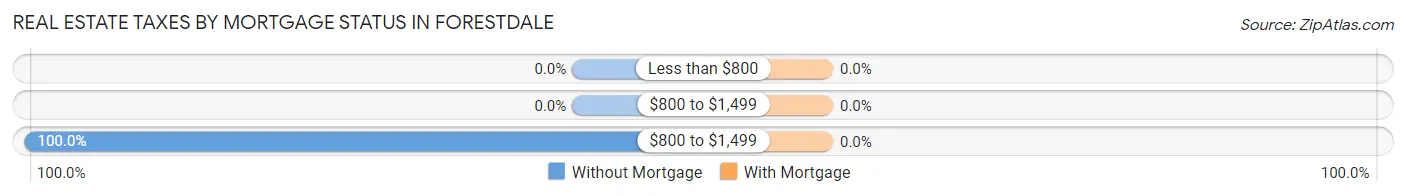
| Property Taxes | Without Mortgage | With Mortgage |
| Less than $800 | 0 (0.0%) | 0 (0.0%) |
| $800 to $1,499 | 0 (0.0%) | 0 (0.0%) |
| $800 to $1,499 | 339 (100.0%) | 0 (0.0%) |
| Total | 339 (100.0%) | 1,013 (100.0%) |
Health & Disability in Forestdale
Health Insurance Coverage by Age in Forestdale
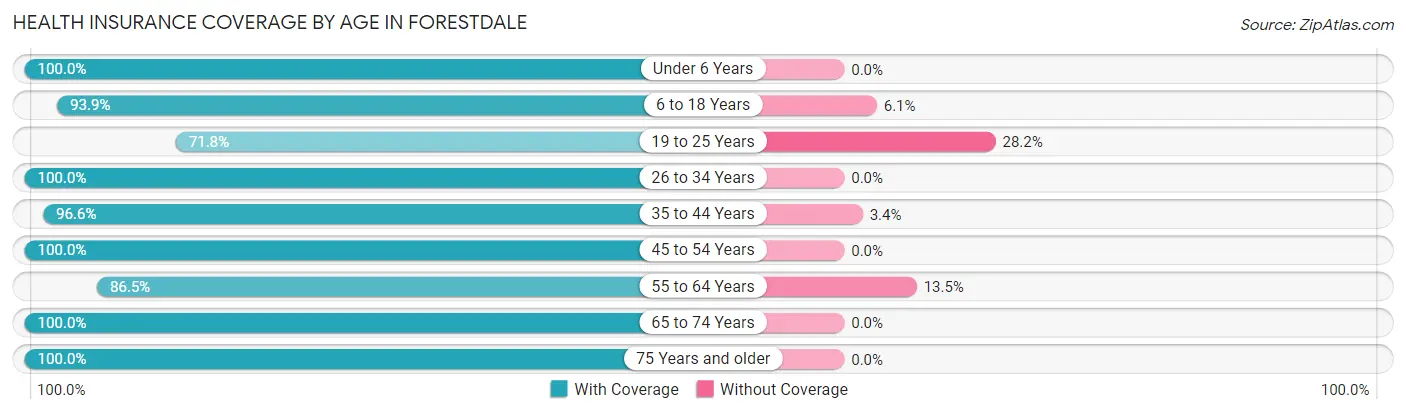
| Age Bracket | With Coverage | Without Coverage |
| Under 6 Years | 177 (100.0%) | 0 (0.0%) |
| 6 to 18 Years | 496 (93.9%) | 32 (6.1%) |
| 19 to 25 Years | 229 (71.8%) | 90 (28.2%) |
| 26 to 34 Years | 394 (100.0%) | 0 (0.0%) |
| 35 to 44 Years | 393 (96.6%) | 14 (3.4%) |
| 45 to 54 Years | 355 (100.0%) | 0 (0.0%) |
| 55 to 64 Years | 948 (86.5%) | 148 (13.5%) |
| 65 to 74 Years | 348 (100.0%) | 0 (0.0%) |
| 75 Years and older | 288 (100.0%) | 0 (0.0%) |
| Total | 3,628 (92.7%) | 284 (7.3%) |
Health Insurance Coverage by Citizenship Status in Forestdale
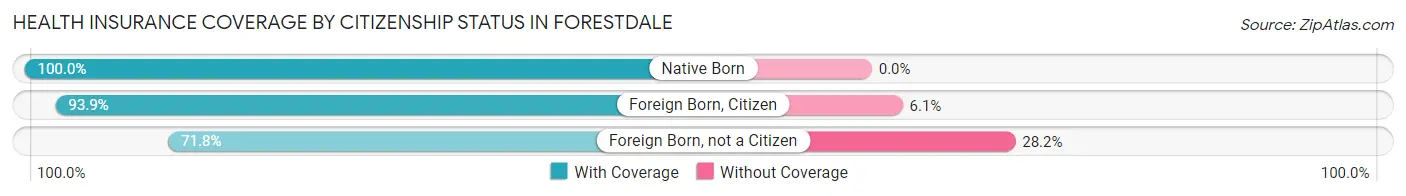
| Citizenship Status | With Coverage | Without Coverage |
| Native Born | 177 (100.0%) | 0 (0.0%) |
| Foreign Born, Citizen | 496 (93.9%) | 32 (6.1%) |
| Foreign Born, not a Citizen | 229 (71.8%) | 90 (28.2%) |
Health Insurance Coverage by Household Income in Forestdale
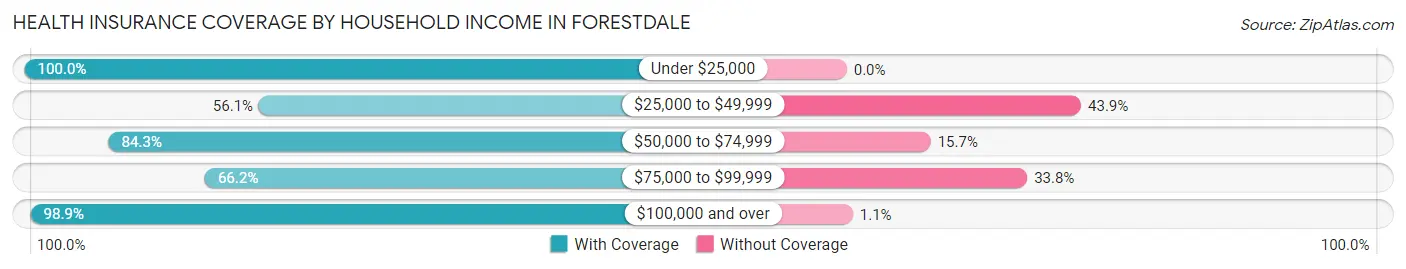
| Household Income | With Coverage | Without Coverage |
| Under $25,000 | 78 (100.0%) | 0 (0.0%) |
| $25,000 to $49,999 | 115 (56.1%) | 90 (43.9%) |
| $50,000 to $74,999 | 482 (84.3%) | 90 (15.7%) |
| $75,000 to $99,999 | 141 (66.2%) | 72 (33.8%) |
| $100,000 and over | 2,812 (98.9%) | 32 (1.1%) |
Public vs Private Health Insurance Coverage by Age in Forestdale
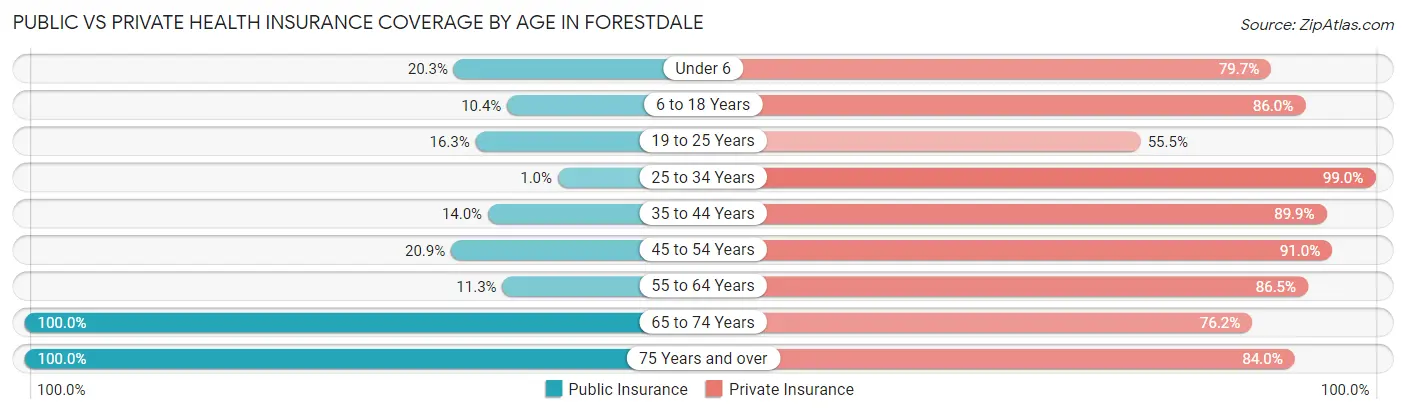
| Age Bracket | Public Insurance | Private Insurance |
| Under 6 | 36 (20.3%) | 141 (79.7%) |
| 6 to 18 Years | 55 (10.4%) | 454 (86.0%) |
| 19 to 25 Years | 52 (16.3%) | 177 (55.5%) |
| 25 to 34 Years | 4 (1.0%) | 390 (99.0%) |
| 35 to 44 Years | 57 (14.0%) | 366 (89.9%) |
| 45 to 54 Years | 74 (20.8%) | 323 (91.0%) |
| 55 to 64 Years | 124 (11.3%) | 948 (86.5%) |
| 65 to 74 Years | 348 (100.0%) | 265 (76.1%) |
| 75 Years and over | 288 (100.0%) | 242 (84.0%) |
| Total | 1,038 (26.5%) | 3,306 (84.5%) |
Disability Status by Sex by Age in Forestdale
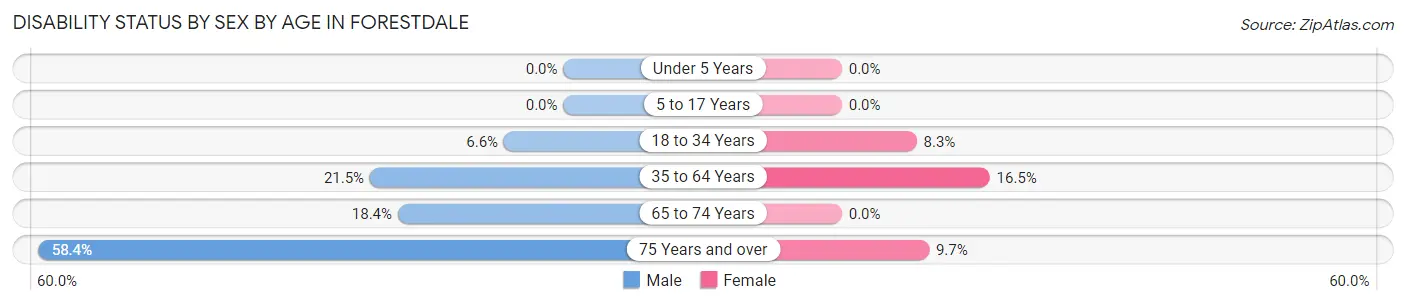
| Age Bracket | Male | Female |
| Under 5 Years | 0 (0.0%) | 0 (0.0%) |
| 5 to 17 Years | 0 (0.0%) | 0 (0.0%) |
| 18 to 34 Years | 21 (6.6%) | 36 (8.3%) |
| 35 to 64 Years | 157 (21.5%) | 186 (16.5%) |
| 65 to 74 Years | 47 (18.4%) | 0 (0.0%) |
| 75 Years and over | 66 (58.4%) | 17 (9.7%) |
Disability Class by Sex by Age in Forestdale
Disability Class: Hearing Difficulty
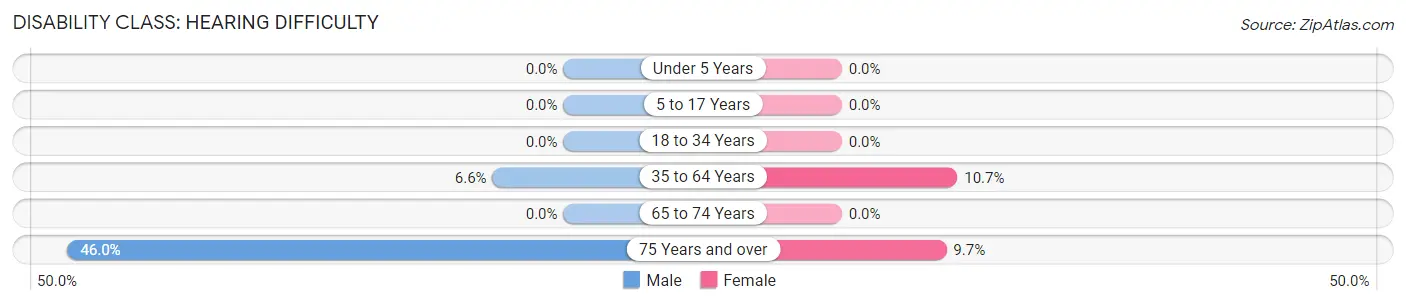
| Age Bracket | Male | Female |
| Under 5 Years | 0 (0.0%) | 0 (0.0%) |
| 5 to 17 Years | 0 (0.0%) | 0 (0.0%) |
| 18 to 34 Years | 0 (0.0%) | 0 (0.0%) |
| 35 to 64 Years | 48 (6.6%) | 121 (10.7%) |
| 65 to 74 Years | 0 (0.0%) | 0 (0.0%) |
| 75 Years and over | 52 (46.0%) | 17 (9.7%) |
Disability Class: Vision Difficulty
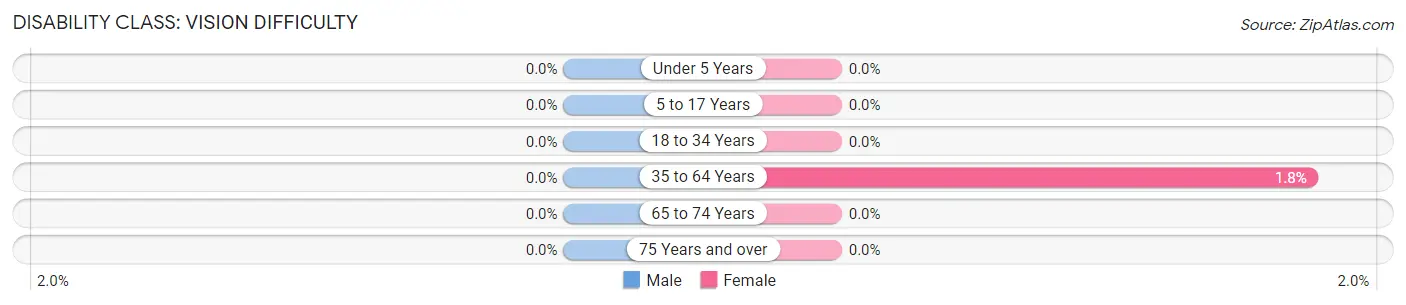
| Age Bracket | Male | Female |
| Under 5 Years | 0 (0.0%) | 0 (0.0%) |
| 5 to 17 Years | 0 (0.0%) | 0 (0.0%) |
| 18 to 34 Years | 0 (0.0%) | 0 (0.0%) |
| 35 to 64 Years | 0 (0.0%) | 20 (1.8%) |
| 65 to 74 Years | 0 (0.0%) | 0 (0.0%) |
| 75 Years and over | 0 (0.0%) | 0 (0.0%) |
Disability Class: Cognitive Difficulty
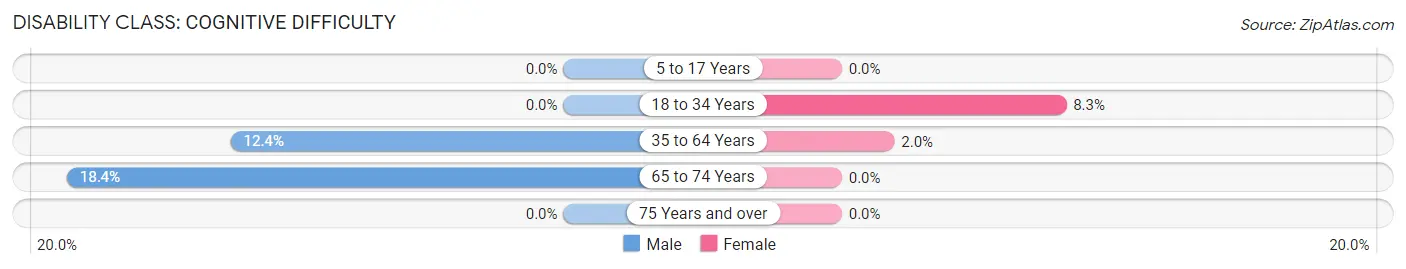
| Age Bracket | Male | Female |
| 5 to 17 Years | 0 (0.0%) | 0 (0.0%) |
| 18 to 34 Years | 0 (0.0%) | 36 (8.3%) |
| 35 to 64 Years | 90 (12.3%) | 22 (1.9%) |
| 65 to 74 Years | 47 (18.4%) | 0 (0.0%) |
| 75 Years and over | 0 (0.0%) | 0 (0.0%) |
Disability Class: Ambulatory Difficulty
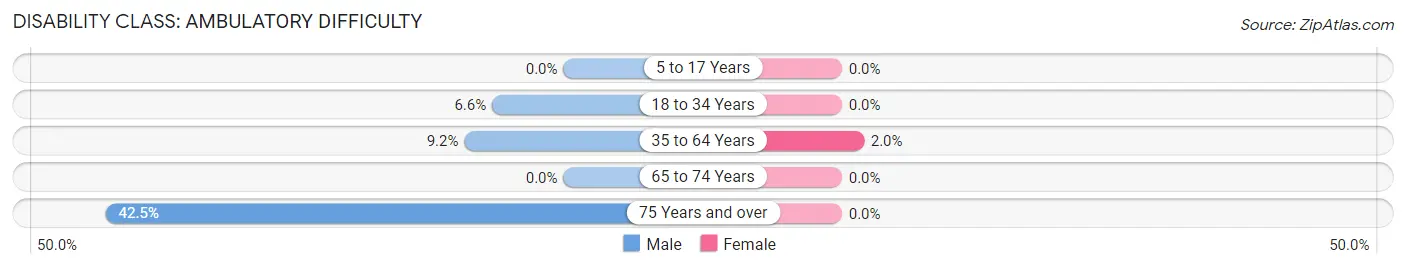
| Age Bracket | Male | Female |
| 5 to 17 Years | 0 (0.0%) | 0 (0.0%) |
| 18 to 34 Years | 21 (6.6%) | 0 (0.0%) |
| 35 to 64 Years | 67 (9.2%) | 23 (2.0%) |
| 65 to 74 Years | 0 (0.0%) | 0 (0.0%) |
| 75 Years and over | 48 (42.5%) | 0 (0.0%) |
Disability Class: Self-Care Difficulty
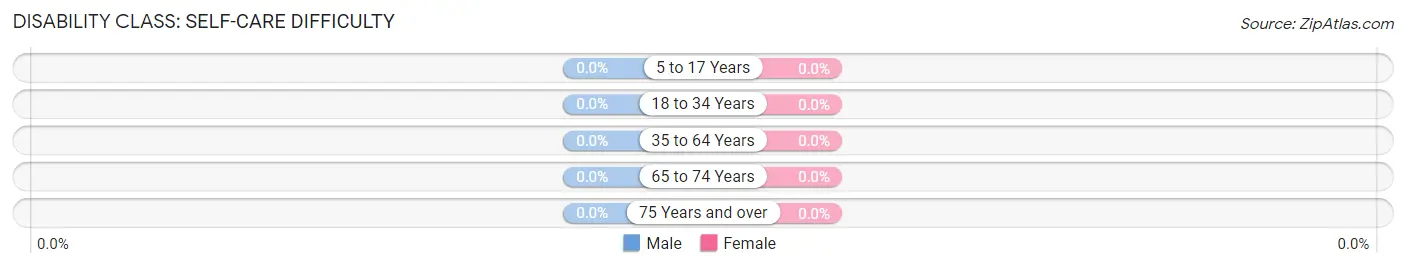
| Age Bracket | Male | Female |
| 5 to 17 Years | 0 (0.0%) | 0 (0.0%) |
| 18 to 34 Years | 0 (0.0%) | 0 (0.0%) |
| 35 to 64 Years | 0 (0.0%) | 0 (0.0%) |
| 65 to 74 Years | 0 (0.0%) | 0 (0.0%) |
| 75 Years and over | 0 (0.0%) | 0 (0.0%) |
Technology Access in Forestdale
Computing Device Access in Forestdale
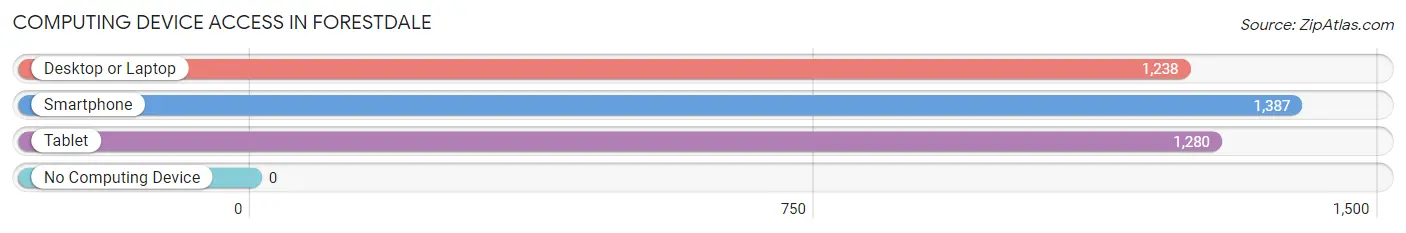
| Device Type | # Households | % Households |
| Desktop or Laptop | 1,238 | 80.8% |
| Smartphone | 1,387 | 90.5% |
| Tablet | 1,280 | 83.6% |
| No Computing Device | 0 | 0.0% |
| Total | 1,532 | 100.0% |
Internet Access in Forestdale
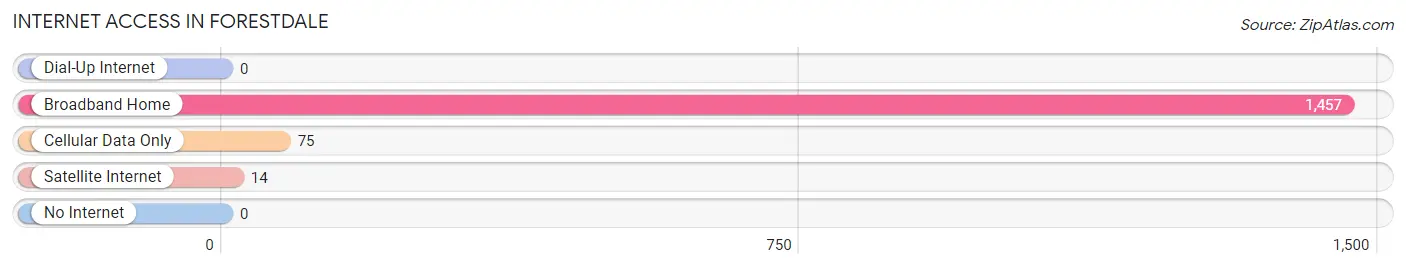
| Internet Type | # Households | % Households |
| Dial-Up Internet | 0 | 0.0% |
| Broadband Home | 1,457 | 95.1% |
| Cellular Data Only | 75 | 4.9% |
| Satellite Internet | 14 | 0.9% |
| No Internet | 0 | 0.0% |
| Total | 1,532 | 100.0% |
Forestdale Summary
History
The town of Forestdale, Massachusetts is located in the southeastern part of the state, in the county of Barnstable. It is bordered by the towns of Sandwich, Mashpee, and Falmouth. The town was originally part of Sandwich, and was known as the “Great Marshes”. In 1717, the town was incorporated as Forestdale, and was named after the many forests in the area.
The town was originally a farming community, and the main crops were corn, potatoes, and hay. In the late 19th century, the town began to develop as a summer resort area, and many wealthy families built large summer homes in the area. The town also became a popular spot for fishing and hunting.
In the early 20th century, the town began to develop as a residential community, and many of the summer homes were converted into year-round residences. The town also began to attract more businesses, and the population began to grow.
Geography
Forestdale is located in the southeastern part of Massachusetts, in the county of Barnstable. It is bordered by the towns of Sandwich, Mashpee, and Falmouth. The town is located on the shores of Cape Cod Bay, and is approximately 25 miles from the city of Boston.
The town has a total area of 8.3 square miles, of which 7.9 square miles is land and 0.4 square miles is water. The town is mostly flat, with some rolling hills in the northern part of town. The highest point in the town is located at an elevation of 85 feet.
The town is home to several ponds, including Great Pond, Little Pond, and Long Pond. The town also has several creeks, including the Herring River, which flows through the town.
Economy
The economy of Forestdale is largely based on tourism and retail. The town is home to several small businesses, including restaurants, shops, and galleries. The town also has several marinas, which attract visitors from all over the region.
The town is also home to several large employers, including the Cape Cod Hospital, the Cape Cod Times, and the Cape Cod National Seashore. The town also has several small manufacturing companies, which produce a variety of products, including furniture, clothing, and electronics.
Demographics
As of the 2010 census, the town of Forestdale had a population of 4,845 people. The population density was 590.7 people per square mile. The racial makeup of the town was 94.3% White, 1.3% African American, 0.3% Native American, 1.2% Asian, 0.1% Pacific Islander, 1.2% from other races, and 1.6% from two or more races. Hispanic or Latino of any race were 3.2% of the population.
The median income for a household in the town was $60,938, and the median income for a family was $71,944. The per capita income for the town was $30,945. About 4.3% of families and 5.7% of the population were below the poverty line, including 6.3% of those under age 18 and 4.2% of those age 65 or over.
Common Questions
What is Per Capita Income in Forestdale?
Per Capita income in Forestdale is $53,484.
What is the Median Family Income in Forestdale?
Median Family Income in Forestdale is $149,817.
What is the Median Household income in Forestdale?
Median Household Income in Forestdale is $118,382.
What is Income or Wage Gap in Forestdale?
Income or Wage Gap in Forestdale is 30.5%.
Women in Forestdale earn 69.5 cents for every dollar earned by a man.
What is Inequality or Gini Index in Forestdale?
Inequality or Gini Index in Forestdale is 0.38.
What is the Total Population of Forestdale?
Total Population of Forestdale is 3,912.
What is the Total Male Population of Forestdale?
Total Male Population of Forestdale is 1,718.
What is the Total Female Population of Forestdale?
Total Female Population of Forestdale is 2,194.
What is the Ratio of Males per 100 Females in Forestdale?
There are 78.30 Males per 100 Females in Forestdale.
What is the Ratio of Females per 100 Males in Forestdale?
There are 127.71 Females per 100 Males in Forestdale.
What is the Median Population Age in Forestdale?
Median Population Age in Forestdale is 50.2 Years.
What is the Average Family Size in Forestdale
Average Family Size in Forestdale is 3.0 People.
What is the Average Household Size in Forestdale
Average Household Size in Forestdale is 2.5 People.
How Large is the Labor Force in Forestdale?
There are 2,460 People in the Labor Forcein in Forestdale.
What is the Percentage of People in the Labor Force in Forestdale?
74.0% of People are in the Labor Force in Forestdale.
What is the Unemployment Rate in Forestdale?
Unemployment Rate in Forestdale is 2.2%.