Sturbridge, MA Map & Demographics
Sturbridge Map
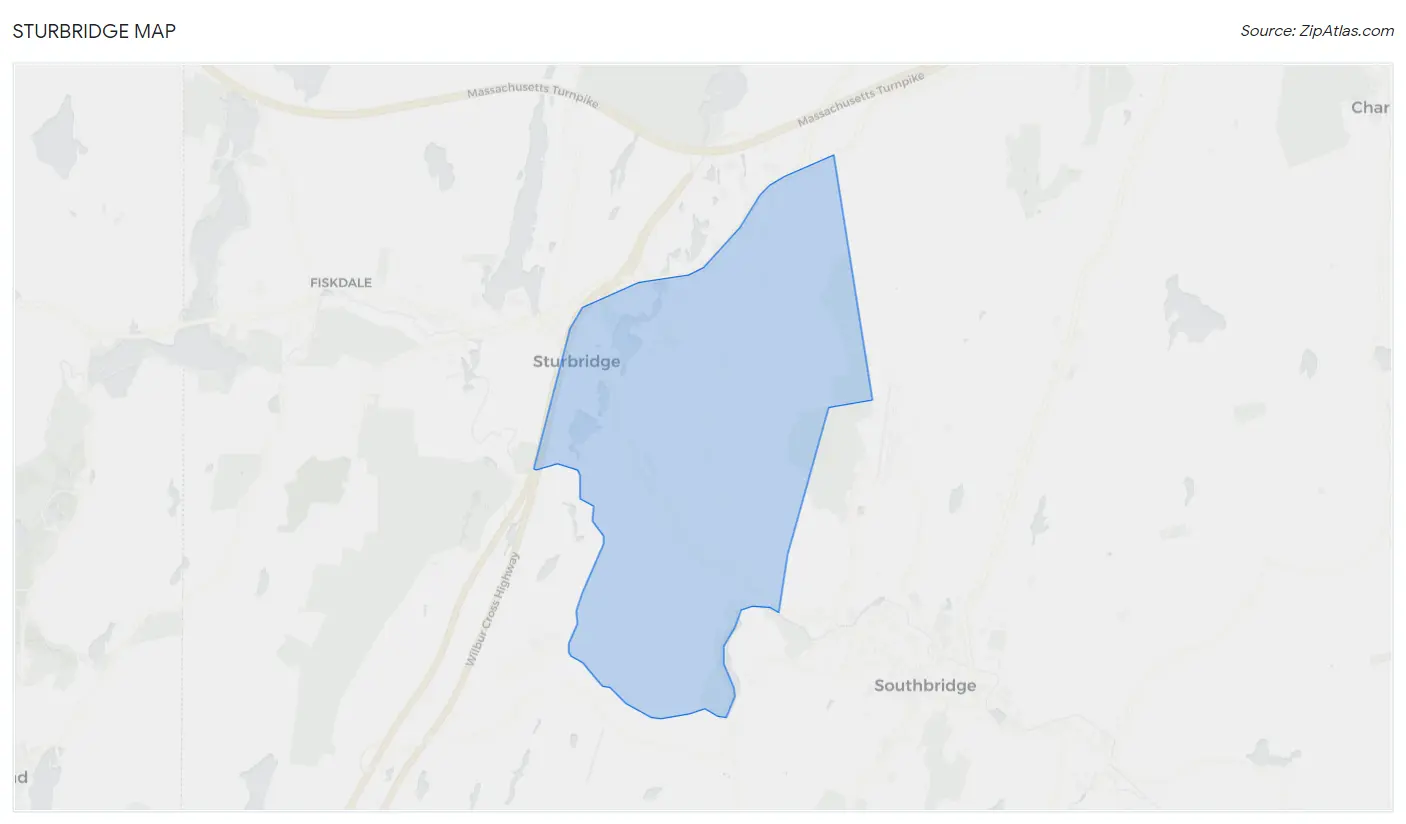
Sturbridge Overview
$56,770
PER CAPITA INCOME
$139,219
AVG FAMILY INCOME
$123,375
AVG HOUSEHOLD INCOME
19.5%
WAGE / INCOME GAP [ % ]
80.5¢/ $1
WAGE / INCOME GAP [ $ ]
0.35
INEQUALITY / GINI INDEX
2,222
TOTAL POPULATION
1,125
MALE POPULATION
1,097
FEMALE POPULATION
102.55
MALES / 100 FEMALES
97.51
FEMALES / 100 MALES
49.2
MEDIAN AGE
2.8
AVG FAMILY SIZE
2.4
AVG HOUSEHOLD SIZE
1,177
LABOR FORCE [ PEOPLE ]
64.3%
PERCENT IN LABOR FORCE
Sturbridge Zip Codes
Income in Sturbridge
Income Overview in Sturbridge
Per Capita Income in Sturbridge is $56,770, while median incomes of families and households are $139,219 and $123,375 respectively.
| Characteristic | Number | Measure |
| Per Capita Income | 2,222 | $56,770 |
| Median Family Income | 673 | $139,219 |
| Mean Family Income | 673 | $163,435 |
| Median Household Income | 910 | $123,375 |
| Mean Household Income | 910 | $143,159 |
| Income Deficit | 673 | $0 |
| Wage / Income Gap (%) | 2,222 | 19.54% |
| Wage / Income Gap ($) | 2,222 | 80.46¢ per $1 |
| Gini / Inequality Index | 2,222 | 0.35 |
Earnings by Sex in Sturbridge
Average Earnings in Sturbridge are $61,989, $67,639 for men and $54,423 for women, a difference of 19.5%.
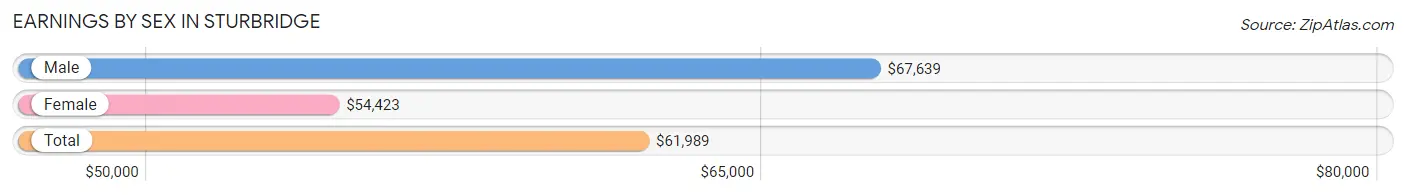
| Sex | Number | Average Earnings |
| Male | 755 (52.5%) | $67,639 |
| Female | 684 (47.5%) | $54,423 |
| Total | 1,439 (100.0%) | $61,989 |
Earnings by Sex by Income Bracket in Sturbridge
The most common earnings brackets in Sturbridge are $100,000+ for men (186 | 24.6%) and $100,000+ for women (219 | 32.0%).
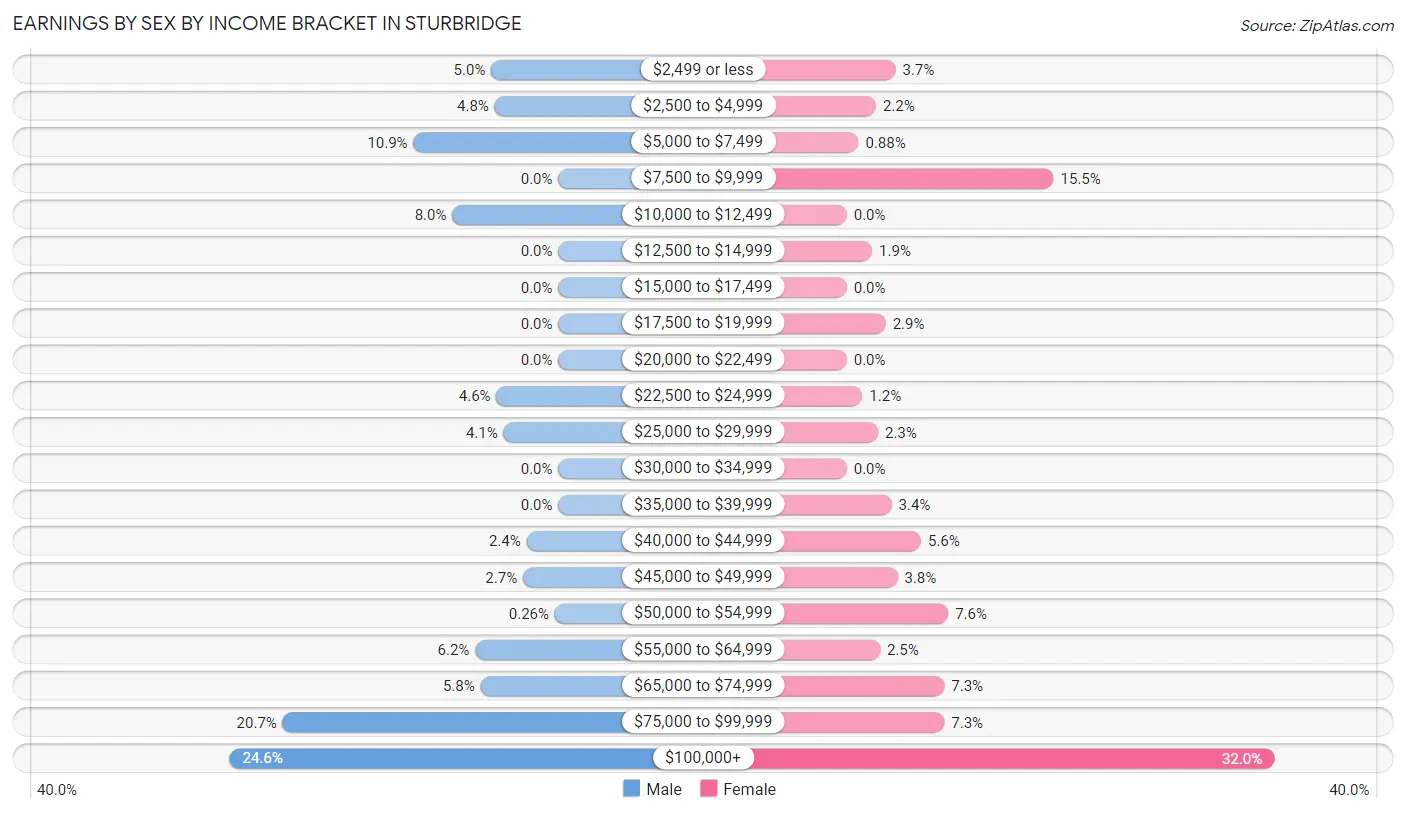
| Income | Male | Female |
| $2,499 or less | 38 (5.0%) | 25 (3.6%) |
| $2,500 to $4,999 | 36 (4.8%) | 15 (2.2%) |
| $5,000 to $7,499 | 82 (10.9%) | 6 (0.9%) |
| $7,500 to $9,999 | 0 (0.0%) | 106 (15.5%) |
| $10,000 to $12,499 | 60 (8.0%) | 0 (0.0%) |
| $12,500 to $14,999 | 0 (0.0%) | 13 (1.9%) |
| $15,000 to $17,499 | 0 (0.0%) | 0 (0.0%) |
| $17,500 to $19,999 | 0 (0.0%) | 20 (2.9%) |
| $20,000 to $22,499 | 0 (0.0%) | 0 (0.0%) |
| $22,500 to $24,999 | 35 (4.6%) | 8 (1.2%) |
| $25,000 to $29,999 | 31 (4.1%) | 16 (2.3%) |
| $30,000 to $34,999 | 0 (0.0%) | 0 (0.0%) |
| $35,000 to $39,999 | 0 (0.0%) | 23 (3.4%) |
| $40,000 to $44,999 | 18 (2.4%) | 38 (5.6%) |
| $45,000 to $49,999 | 20 (2.6%) | 26 (3.8%) |
| $50,000 to $54,999 | 2 (0.3%) | 52 (7.6%) |
| $55,000 to $64,999 | 47 (6.2%) | 17 (2.5%) |
| $65,000 to $74,999 | 44 (5.8%) | 50 (7.3%) |
| $75,000 to $99,999 | 156 (20.7%) | 50 (7.3%) |
| $100,000+ | 186 (24.6%) | 219 (32.0%) |
| Total | 755 (100.0%) | 684 (100.0%) |
Earnings by Sex by Educational Attainment in Sturbridge
Average earnings in Sturbridge are $79,837 for men and $54,423 for women, a difference of 31.8%. Men with an educational attainment of bachelor's degree enjoy the highest average annual earnings of $93,750, while those with college or associate's degree education earn the least with $78,478. Women with an educational attainment of bachelor's degree earn the most with the average annual earnings of $115,625, while those with high school diploma education have the smallest earnings of $35,978.
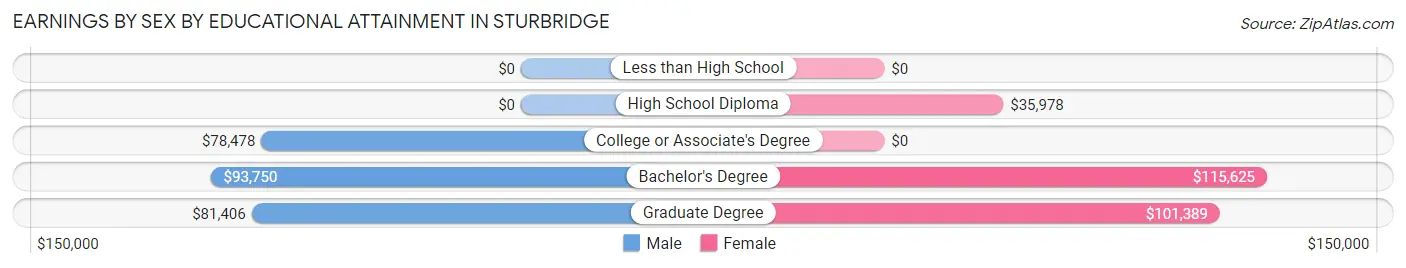
| Educational Attainment | Male Income | Female Income |
| Less than High School | - | - |
| High School Diploma | - | - |
| College or Associate's Degree | $78,478 | $0 |
| Bachelor's Degree | $93,750 | $115,625 |
| Graduate Degree | $81,406 | $101,389 |
| Total | $79,837 | $54,423 |
Family Income in Sturbridge
Family Income Brackets in Sturbridge
According to the Sturbridge family income data, there are 184 families falling into the $200,000+ income range, which is the most common income bracket and makes up 27.3% of all families.
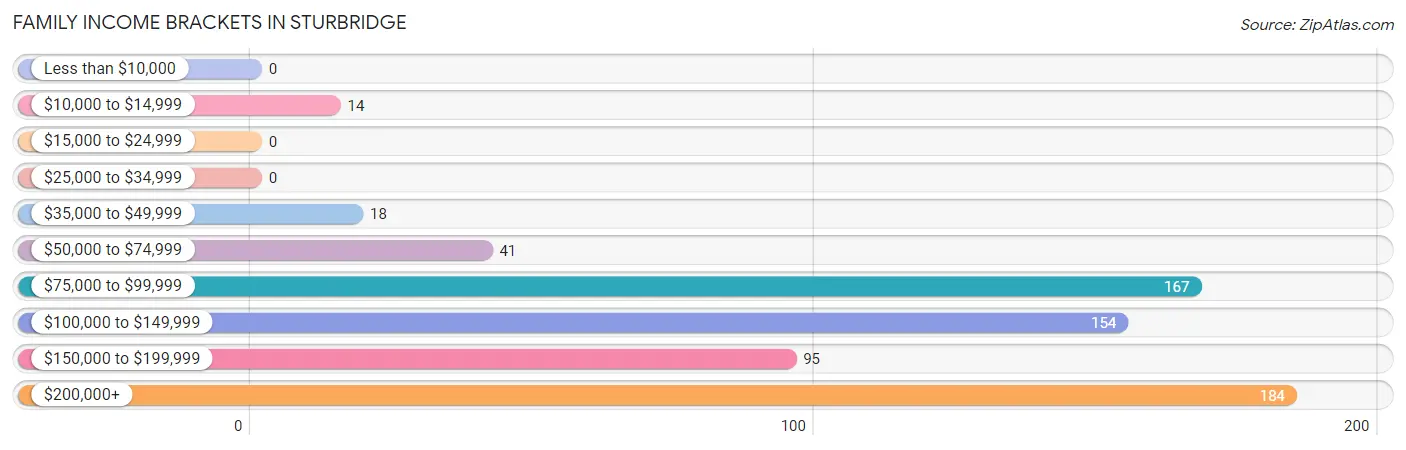
| Income Bracket | # Families | % Families |
| Less than $10,000 | 0 | 0.0% |
| $10,000 to $14,999 | 14 | 2.1% |
| $15,000 to $24,999 | 0 | 0.0% |
| $25,000 to $34,999 | 0 | 0.0% |
| $35,000 to $49,999 | 18 | 2.7% |
| $50,000 to $74,999 | 41 | 6.1% |
| $75,000 to $99,999 | 167 | 24.8% |
| $100,000 to $149,999 | 154 | 22.9% |
| $150,000 to $199,999 | 95 | 14.1% |
| $200,000+ | 184 | 27.3% |
Family Income by Famaliy Size in Sturbridge
4-person families (130 | 19.3%) account for the highest median family income in Sturbridge with $250,001 per family, while 4-person families (130 | 19.3%) have the highest median income of $62,500 per family member.
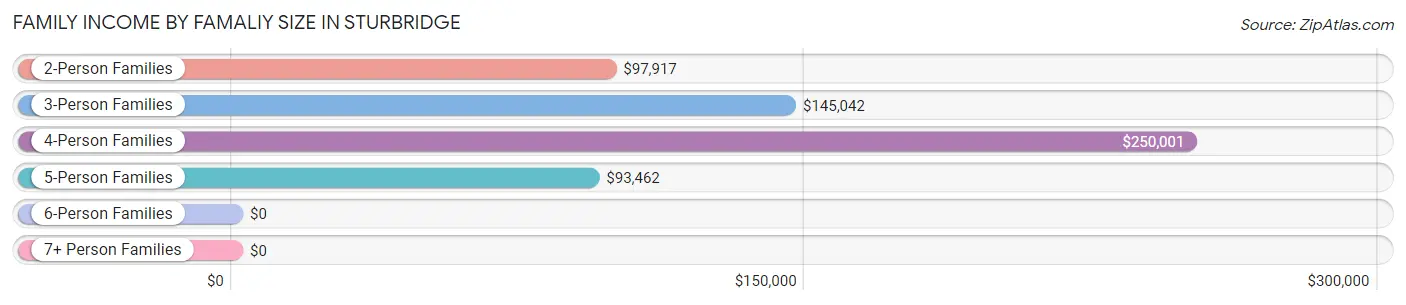
| Income Bracket | # Families | Median Income |
| 2-Person Families | 314 (46.7%) | $97,917 |
| 3-Person Families | 197 (29.3%) | $145,042 |
| 4-Person Families | 130 (19.3%) | $250,001 |
| 5-Person Families | 32 (4.8%) | $93,462 |
| 6-Person Families | 0 (0.0%) | $0 |
| 7+ Person Families | 0 (0.0%) | $0 |
| Total | 673 (100.0%) | $139,219 |
Family Income by Number of Earners in Sturbridge
The median family income in Sturbridge is $139,219, with families comprising 3+ earners (112) having the highest median family income of $250,001, while families with no earners (46) have the lowest median family income of $46,875, accounting for 16.6% and 6.8% of families, respectively.
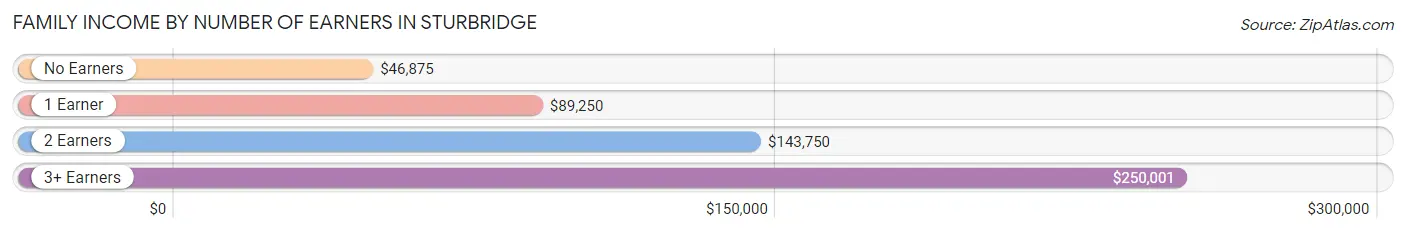
| Number of Earners | # Families | Median Income |
| No Earners | 46 (6.8%) | $46,875 |
| 1 Earner | 179 (26.6%) | $89,250 |
| 2 Earners | 336 (49.9%) | $143,750 |
| 3+ Earners | 112 (16.6%) | $250,001 |
| Total | 673 (100.0%) | $139,219 |
Household Income in Sturbridge
Household Income Brackets in Sturbridge
With 222 households falling in the category, the $100,000 to $149,999 income range is the most frequent in Sturbridge, accounting for 24.4% of all households.
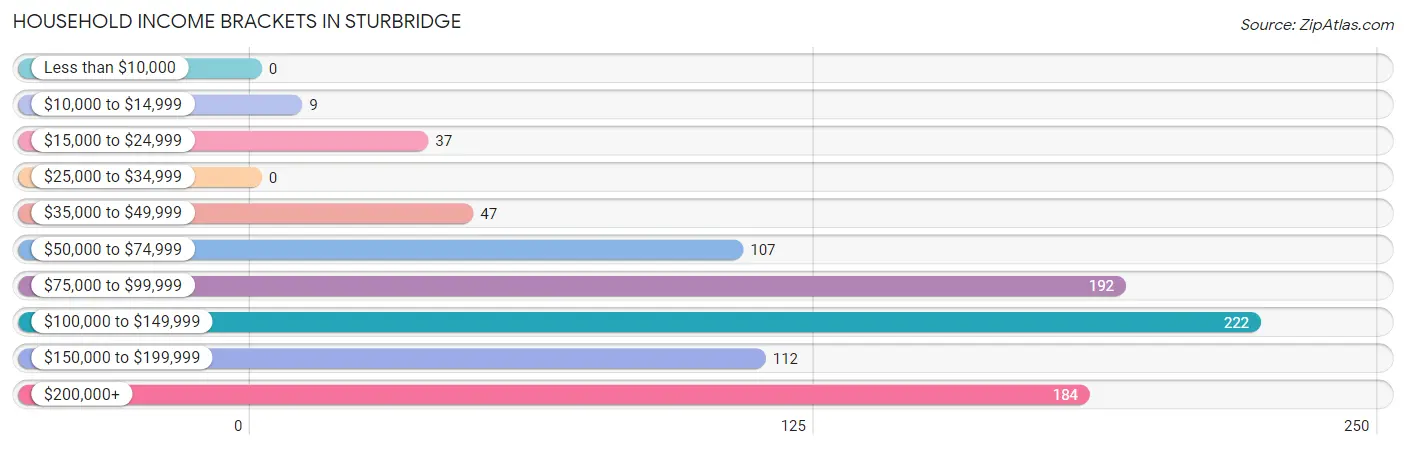
| Income Bracket | # Households | % Households |
| Less than $10,000 | 0 | 0.0% |
| $10,000 to $14,999 | 9 | 1.0% |
| $15,000 to $24,999 | 37 | 4.1% |
| $25,000 to $34,999 | 0 | 0.0% |
| $35,000 to $49,999 | 47 | 5.2% |
| $50,000 to $74,999 | 107 | 11.8% |
| $75,000 to $99,999 | 192 | 21.1% |
| $100,000 to $149,999 | 222 | 24.4% |
| $150,000 to $199,999 | 112 | 12.3% |
| $200,000+ | 184 | 20.2% |
Household Income by Householder Age in Sturbridge
The median household income in Sturbridge is $123,375, with the highest median household income of $141,300 found in the 45 to 64 years age bracket for the primary householder. A total of 448 households (49.2%) fall into this category.
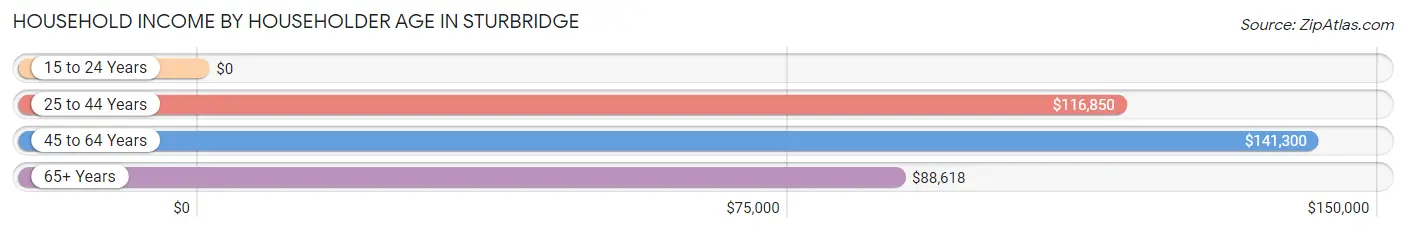
| Income Bracket | # Households | Median Income |
| 15 to 24 Years | 0 (0.0%) | $0 |
| 25 to 44 Years | 263 (28.9%) | $116,850 |
| 45 to 64 Years | 448 (49.2%) | $141,300 |
| 65+ Years | 199 (21.9%) | $88,618 |
| Total | 910 (100.0%) | $123,375 |
Poverty in Sturbridge
Income Below Poverty by Sex and Age in Sturbridge
With 1.5% poverty level for males and 3.5% for females among the residents of Sturbridge, 6 to 11 year old males and 15 year old females are the most vulnerable to poverty, with 15 males (24.6%) and 14 females (35.9%) in their respective age groups living below the poverty level.
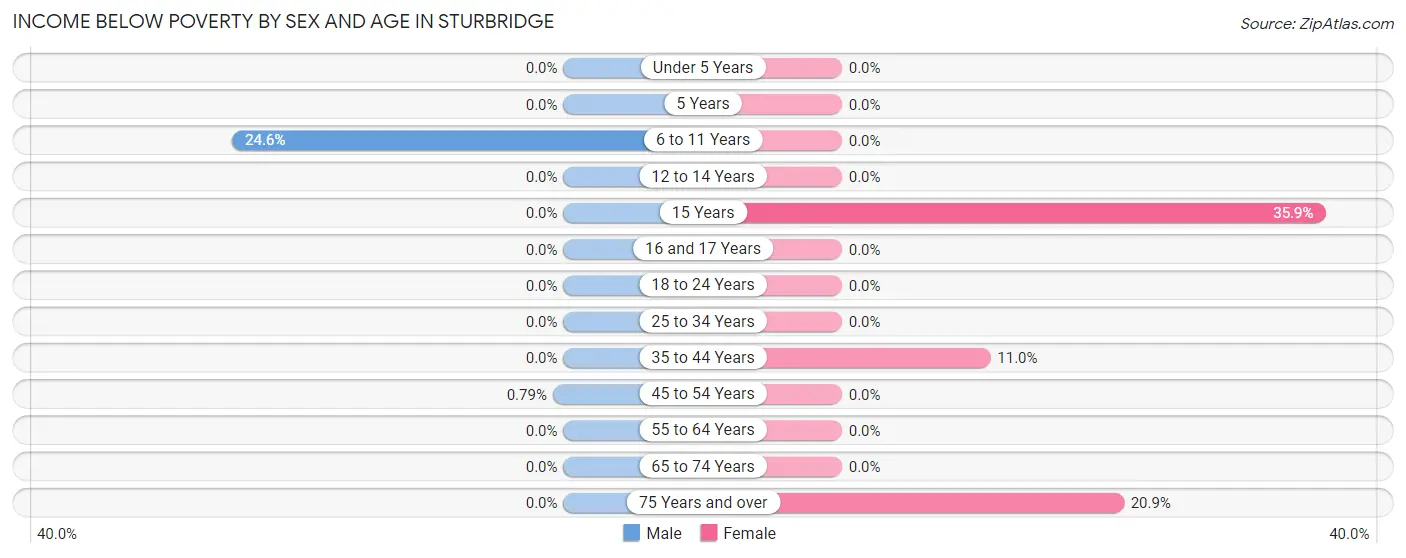
| Age Bracket | Male | Female |
| Under 5 Years | 0 (0.0%) | 0 (0.0%) |
| 5 Years | 0 (0.0%) | 0 (0.0%) |
| 6 to 11 Years | 15 (24.6%) | 0 (0.0%) |
| 12 to 14 Years | 0 (0.0%) | 0 (0.0%) |
| 15 Years | 0 (0.0%) | 14 (35.9%) |
| 16 and 17 Years | 0 (0.0%) | 0 (0.0%) |
| 18 to 24 Years | 0 (0.0%) | 0 (0.0%) |
| 25 to 34 Years | 0 (0.0%) | 0 (0.0%) |
| 35 to 44 Years | 0 (0.0%) | 15 (11.0%) |
| 45 to 54 Years | 2 (0.8%) | 0 (0.0%) |
| 55 to 64 Years | 0 (0.0%) | 0 (0.0%) |
| 65 to 74 Years | 0 (0.0%) | 0 (0.0%) |
| 75 Years and over | 0 (0.0%) | 9 (20.9%) |
| Total | 17 (1.5%) | 38 (3.5%) |
Income Above Poverty by Sex and Age in Sturbridge
According to the poverty statistics in Sturbridge, males aged under 5 years and females aged under 5 years are the age groups that are most secure financially, with 100.0% of males and 100.0% of females in these age groups living above the poverty line.
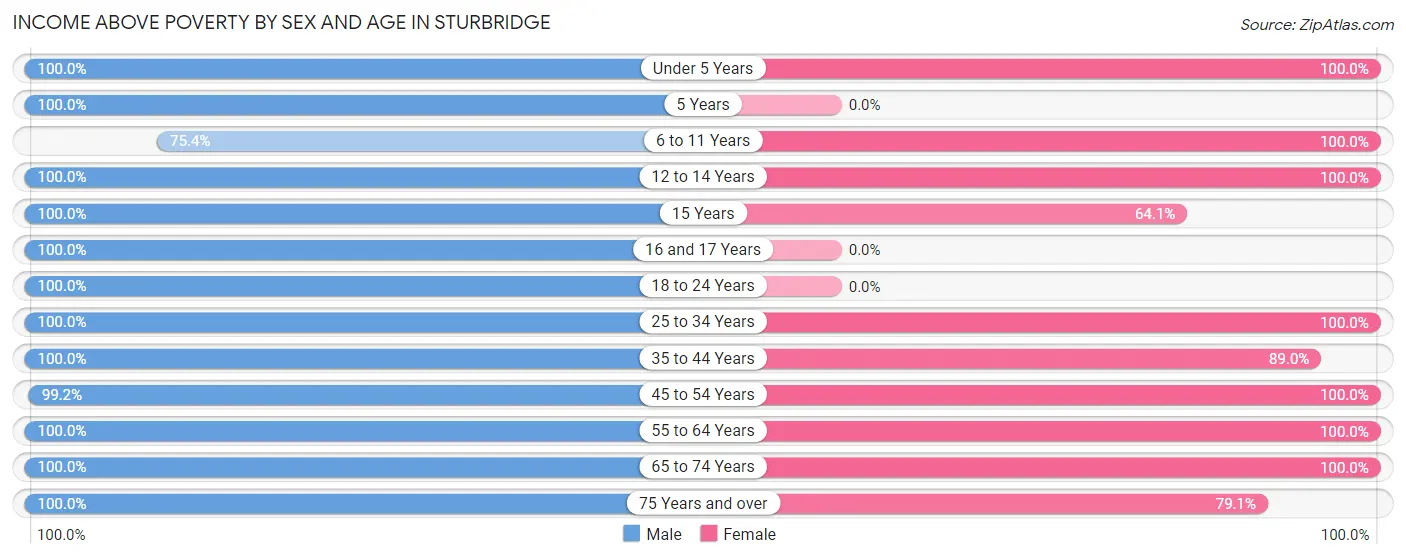
| Age Bracket | Male | Female |
| Under 5 Years | 41 (100.0%) | 69 (100.0%) |
| 5 Years | 6 (100.0%) | 0 (0.0%) |
| 6 to 11 Years | 46 (75.4%) | 70 (100.0%) |
| 12 to 14 Years | 73 (100.0%) | 18 (100.0%) |
| 15 Years | 15 (100.0%) | 25 (64.1%) |
| 16 and 17 Years | 82 (100.0%) | 0 (0.0%) |
| 18 to 24 Years | 50 (100.0%) | 0 (0.0%) |
| 25 to 34 Years | 106 (100.0%) | 144 (100.0%) |
| 35 to 44 Years | 89 (100.0%) | 121 (89.0%) |
| 45 to 54 Years | 251 (99.2%) | 254 (100.0%) |
| 55 to 64 Years | 179 (100.0%) | 174 (100.0%) |
| 65 to 74 Years | 124 (100.0%) | 150 (100.0%) |
| 75 Years and over | 46 (100.0%) | 34 (79.1%) |
| Total | 1,108 (98.5%) | 1,059 (96.5%) |
Income Below Poverty Among Married-Couple Families in Sturbridge
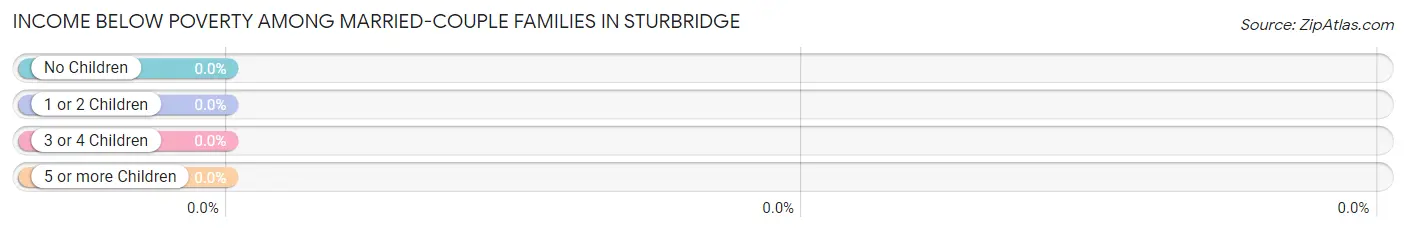
| Children | Above Poverty | Below Poverty |
| No Children | 392 (100.0%) | 0 (0.0%) |
| 1 or 2 Children | 196 (100.0%) | 0 (0.0%) |
| 3 or 4 Children | 24 (100.0%) | 0 (0.0%) |
| 5 or more Children | 0 (0.0%) | 0 (0.0%) |
| Total | 612 (100.0%) | 0 (0.0%) |
Income Below Poverty Among Single-Parent Households in Sturbridge
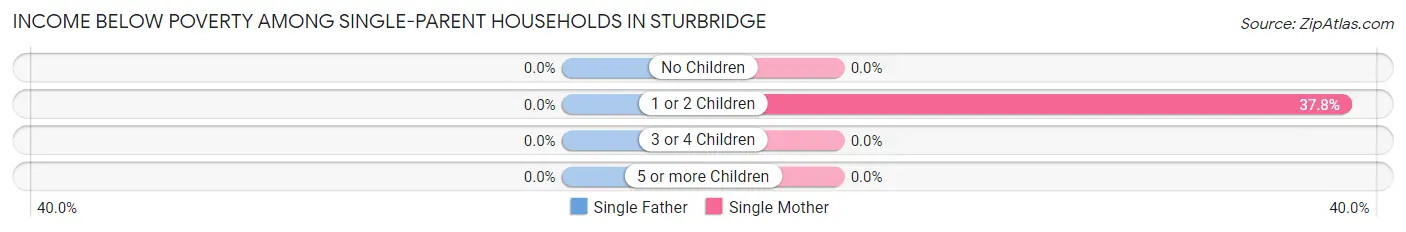
| Children | Single Father | Single Mother |
| No Children | 0 (0.0%) | 0 (0.0%) |
| 1 or 2 Children | 0 (0.0%) | 14 (37.8%) |
| 3 or 4 Children | 0 (0.0%) | 0 (0.0%) |
| 5 or more Children | 0 (0.0%) | 0 (0.0%) |
| Total | 0 (0.0%) | 14 (29.2%) |
Income Below Poverty Among Married-Couple vs Single-Parent Households in Sturbridge
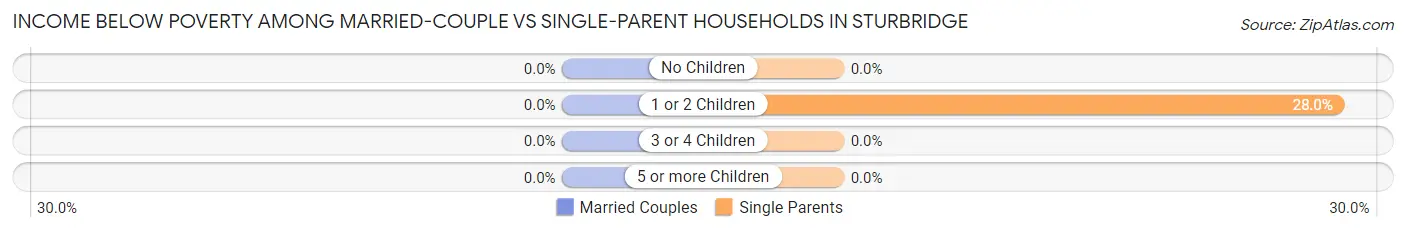
| Children | Married-Couple Families | Single-Parent Households |
| No Children | 0 (0.0%) | 0 (0.0%) |
| 1 or 2 Children | 0 (0.0%) | 14 (28.0%) |
| 3 or 4 Children | 0 (0.0%) | 0 (0.0%) |
| 5 or more Children | 0 (0.0%) | 0 (0.0%) |
| Total | 0 (0.0%) | 14 (23.0%) |
Race in Sturbridge
The most populous races in Sturbridge are White / Caucasian (2,076 | 93.4%), Two or more Races (79 | 3.6%), and Hispanic or Latino (56 | 2.5%).
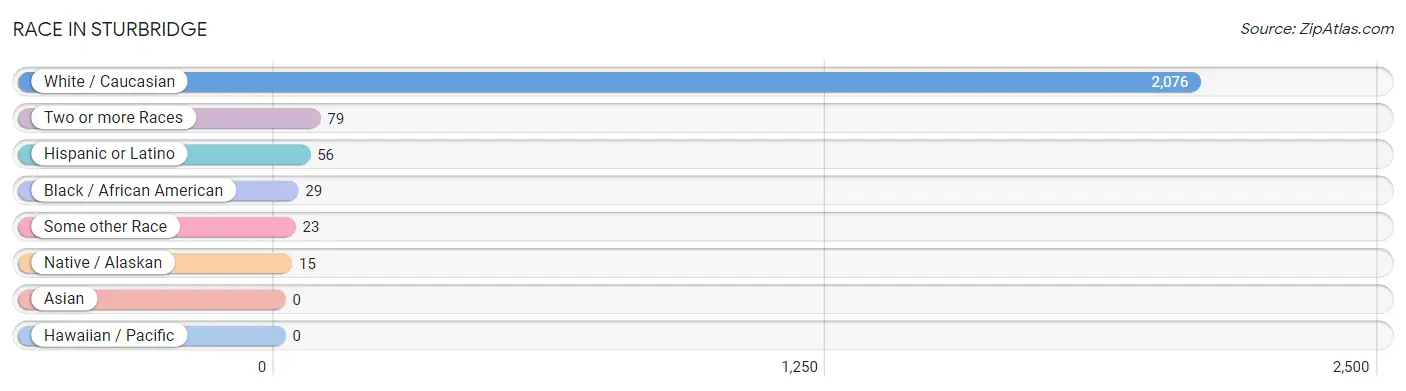
| Race | # Population | % Population |
| Asian | 0 | 0.0% |
| Black / African American | 29 | 1.3% |
| Hawaiian / Pacific | 0 | 0.0% |
| Hispanic or Latino | 56 | 2.5% |
| Native / Alaskan | 15 | 0.7% |
| White / Caucasian | 2,076 | 93.4% |
| Two or more Races | 79 | 3.6% |
| Some other Race | 23 | 1.0% |
| Total | 2,222 | 100.0% |
Ancestry in Sturbridge
The most populous ancestries reported in Sturbridge are Irish (593 | 26.7%), French (469 | 21.1%), English (436 | 19.6%), Italian (344 | 15.5%), and French Canadian (267 | 12.0%), together accounting for 94.9% of all Sturbridge residents.
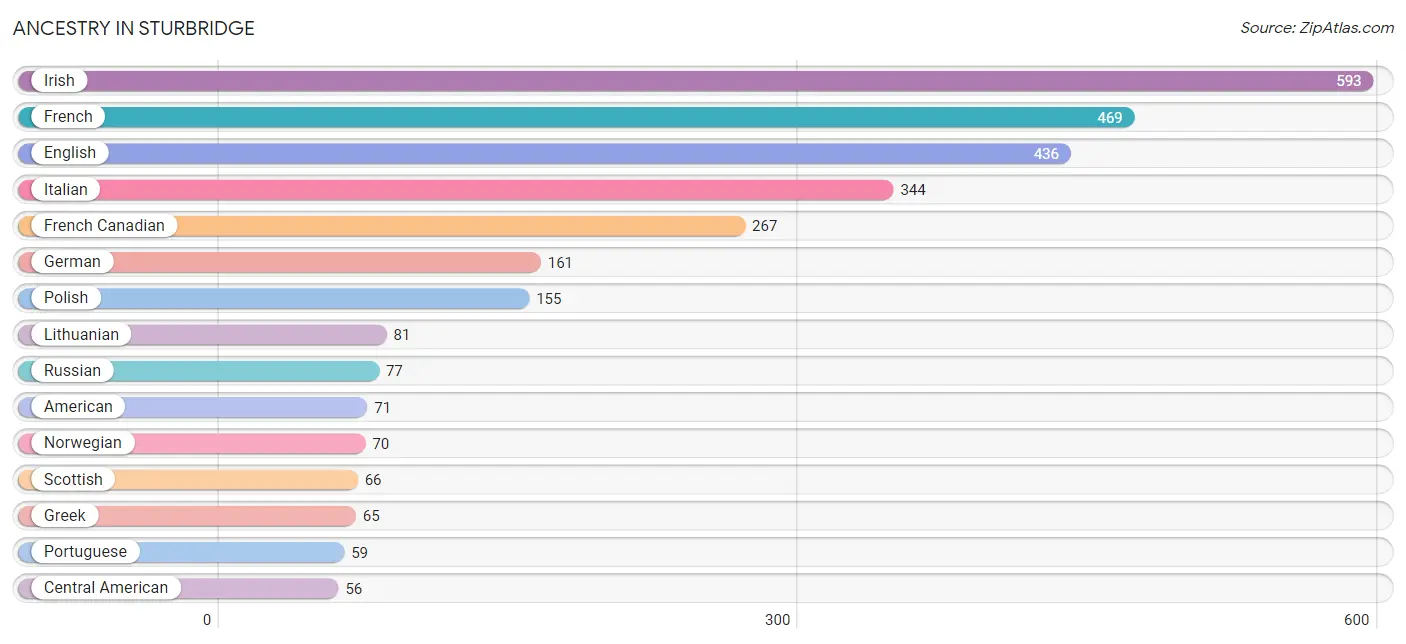
| Ancestry | # Population | % Population |
| African | 19 | 0.9% |
| American | 71 | 3.2% |
| Bhutanese | 13 | 0.6% |
| Blackfeet | 12 | 0.5% |
| Brazilian | 12 | 0.5% |
| British | 13 | 0.6% |
| Central American | 56 | 2.5% |
| Czech | 18 | 0.8% |
| Danish | 6 | 0.3% |
| Dutch | 15 | 0.7% |
| Eastern European | 28 | 1.3% |
| English | 436 | 19.6% |
| French | 469 | 21.1% |
| French Canadian | 267 | 12.0% |
| German | 161 | 7.2% |
| Greek | 65 | 2.9% |
| Iranian | 7 | 0.3% |
| Irish | 593 | 26.7% |
| Italian | 344 | 15.5% |
| Lithuanian | 81 | 3.6% |
| Norwegian | 70 | 3.2% |
| Panamanian | 56 | 2.5% |
| Polish | 155 | 7.0% |
| Portuguese | 59 | 2.7% |
| Romanian | 12 | 0.5% |
| Russian | 77 | 3.5% |
| Scotch-Irish | 12 | 0.5% |
| Scottish | 66 | 3.0% |
| Subsaharan African | 19 | 0.9% |
| Swedish | 16 | 0.7% |
| Welsh | 9 | 0.4% | View All 31 Rows |
Immigrants in Sturbridge
The most numerous immigrant groups reported in Sturbridge came from Latin America (35 | 1.6%), Central America (23 | 1.0%), Panama (23 | 1.0%), Africa (19 | 0.9%), and Eastern Africa (19 | 0.9%), together accounting for 5.4% of all Sturbridge residents.
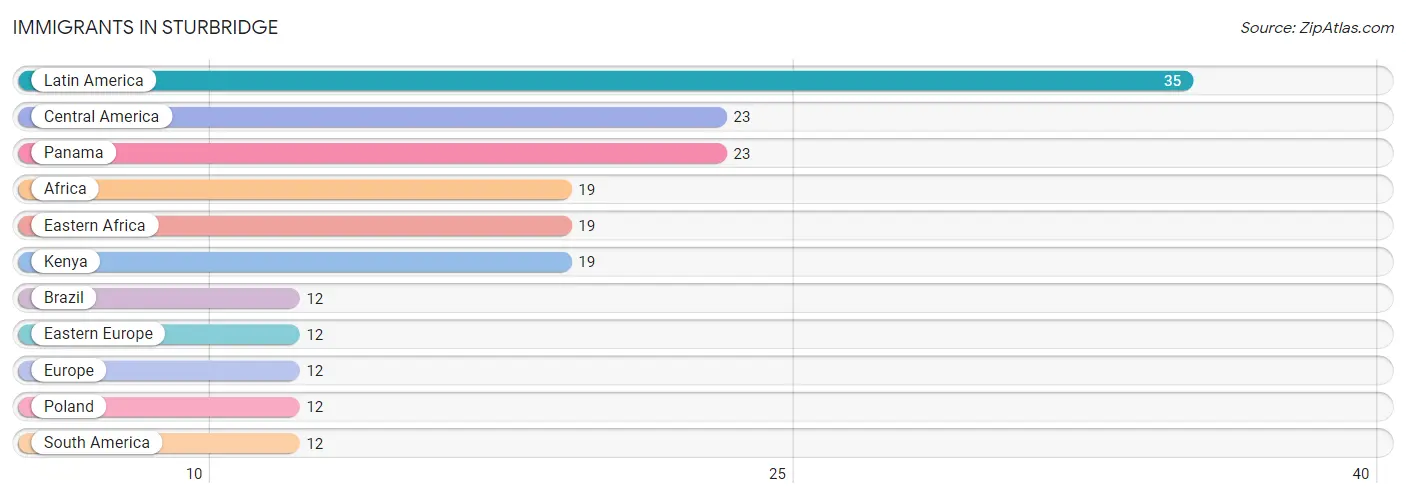
| Immigration Origin | # Population | % Population |
| Africa | 19 | 0.9% |
| Brazil | 12 | 0.5% |
| Central America | 23 | 1.0% |
| Eastern Africa | 19 | 0.9% |
| Eastern Europe | 12 | 0.5% |
| Europe | 12 | 0.5% |
| Kenya | 19 | 0.9% |
| Latin America | 35 | 1.6% |
| Panama | 23 | 1.0% |
| Poland | 12 | 0.5% |
| South America | 12 | 0.5% | View All 11 Rows |
Sex and Age in Sturbridge
Sex and Age in Sturbridge
The most populous age groups in Sturbridge are 50 to 54 Years (181 | 16.1%) for men and 50 to 54 Years (181 | 16.5%) for women.
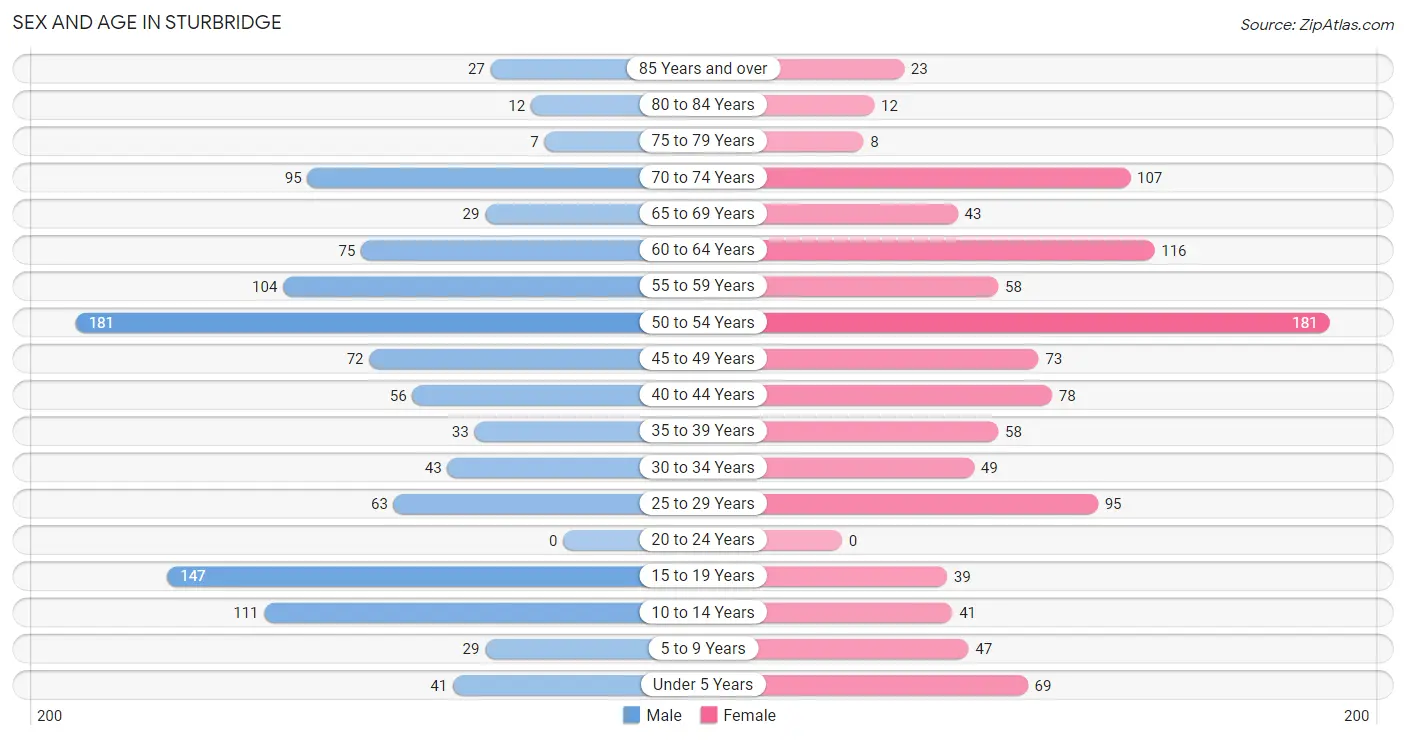
| Age Bracket | Male | Female |
| Under 5 Years | 41 (3.6%) | 69 (6.3%) |
| 5 to 9 Years | 29 (2.6%) | 47 (4.3%) |
| 10 to 14 Years | 111 (9.9%) | 41 (3.7%) |
| 15 to 19 Years | 147 (13.1%) | 39 (3.6%) |
| 20 to 24 Years | 0 (0.0%) | 0 (0.0%) |
| 25 to 29 Years | 63 (5.6%) | 95 (8.7%) |
| 30 to 34 Years | 43 (3.8%) | 49 (4.5%) |
| 35 to 39 Years | 33 (2.9%) | 58 (5.3%) |
| 40 to 44 Years | 56 (5.0%) | 78 (7.1%) |
| 45 to 49 Years | 72 (6.4%) | 73 (6.7%) |
| 50 to 54 Years | 181 (16.1%) | 181 (16.5%) |
| 55 to 59 Years | 104 (9.2%) | 58 (5.3%) |
| 60 to 64 Years | 75 (6.7%) | 116 (10.6%) |
| 65 to 69 Years | 29 (2.6%) | 43 (3.9%) |
| 70 to 74 Years | 95 (8.4%) | 107 (9.8%) |
| 75 to 79 Years | 7 (0.6%) | 8 (0.7%) |
| 80 to 84 Years | 12 (1.1%) | 12 (1.1%) |
| 85 Years and over | 27 (2.4%) | 23 (2.1%) |
| Total | 1,125 (100.0%) | 1,097 (100.0%) |
Families and Households in Sturbridge
Median Family Size in Sturbridge
The median family size in Sturbridge is 2.77 persons per family, with single male/father families (13 | 1.9%) accounting for the largest median family size of 2.92 persons per family. On the other hand, married-couple families (612 | 90.9%) represent the smallest median family size with 2.76 persons per family.
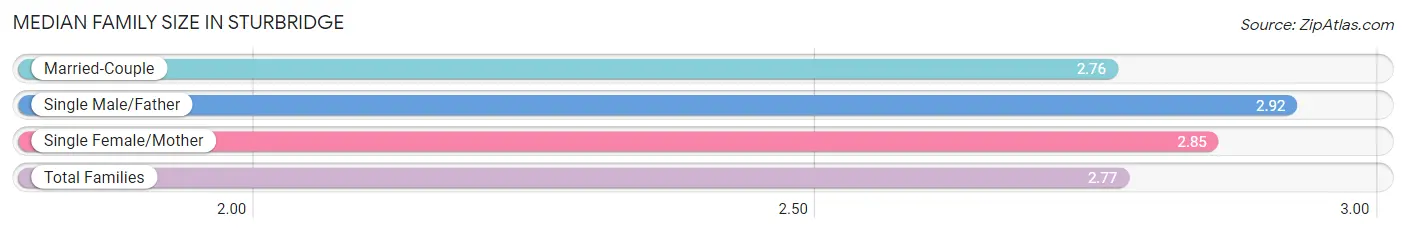
| Family Type | # Families | Family Size |
| Married-Couple | 612 (90.9%) | 2.76 |
| Single Male/Father | 13 (1.9%) | 2.92 |
| Single Female/Mother | 48 (7.1%) | 2.85 |
| Total Families | 673 (100.0%) | 2.77 |
Median Household Size in Sturbridge
The median household size in Sturbridge is 2.43 persons per household, with single male/father households (13 | 1.4%) accounting for the largest median household size of 3.77 persons per household. non-family households (237 | 26.0%) represent the smallest median household size with 1.23 persons per household.
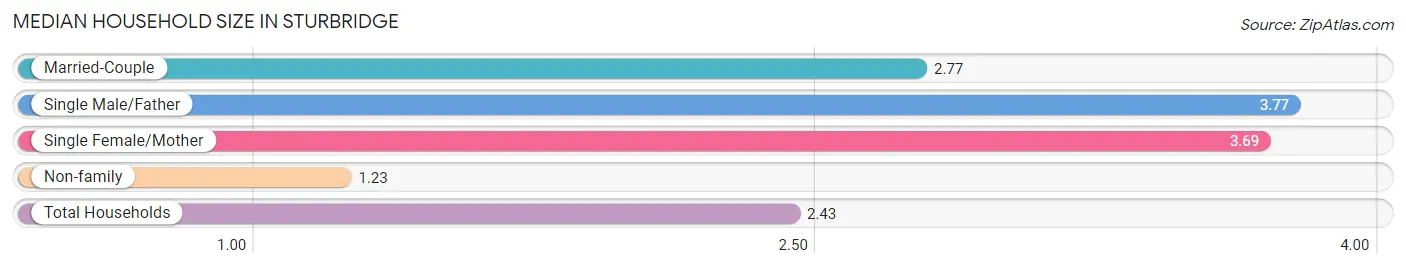
| Household Type | # Households | Household Size |
| Married-Couple | 612 (67.2%) | 2.77 |
| Single Male/Father | 13 (1.4%) | 3.77 |
| Single Female/Mother | 48 (5.3%) | 3.69 |
| Non-family | 237 (26.0%) | 1.23 |
| Total Households | 910 (100.0%) | 2.43 |
Household Size by Marriage Status in Sturbridge
Out of a total of 910 households in Sturbridge, 673 (74.0%) are family households, while 237 (26.0%) are nonfamily households. The most numerous type of family households are 2-person households, comprising 314, and the most common type of nonfamily households are 1-person households, comprising 177.
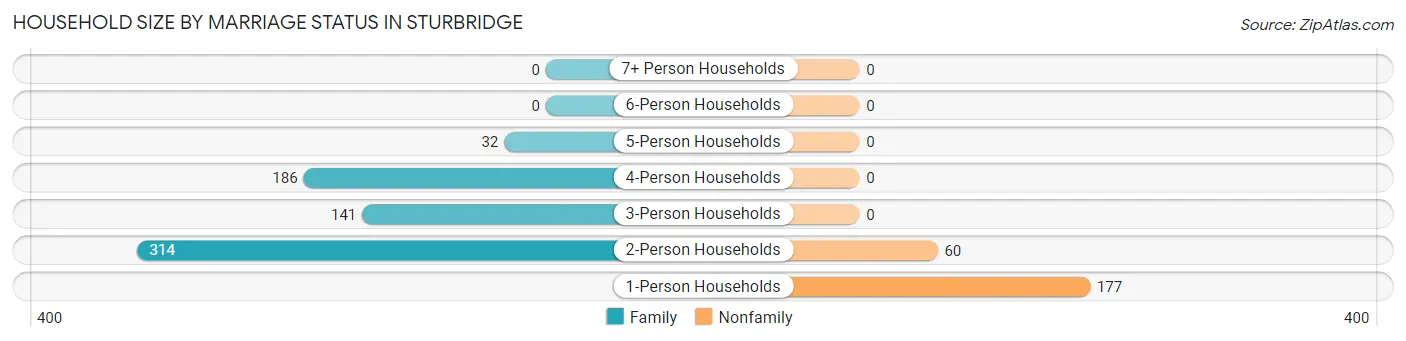
| Household Size | Family Households | Nonfamily Households |
| 1-Person Households | - | 177 (19.5%) |
| 2-Person Households | 314 (34.5%) | 60 (6.6%) |
| 3-Person Households | 141 (15.5%) | 0 (0.0%) |
| 4-Person Households | 186 (20.4%) | 0 (0.0%) |
| 5-Person Households | 32 (3.5%) | 0 (0.0%) |
| 6-Person Households | 0 (0.0%) | 0 (0.0%) |
| 7+ Person Households | 0 (0.0%) | 0 (0.0%) |
| Total | 673 (74.0%) | 237 (26.0%) |
Female Fertility in Sturbridge
Fertility by Age in Sturbridge
Average fertility rate in Sturbridge is 18.0 births per 1,000 women. Women in the age bracket of 20 to 34 years have the highest fertility rate with 63.0 births per 1,000 women. Women in the age bracket of 20 to 34 years acount for 100.0% of all women with births.
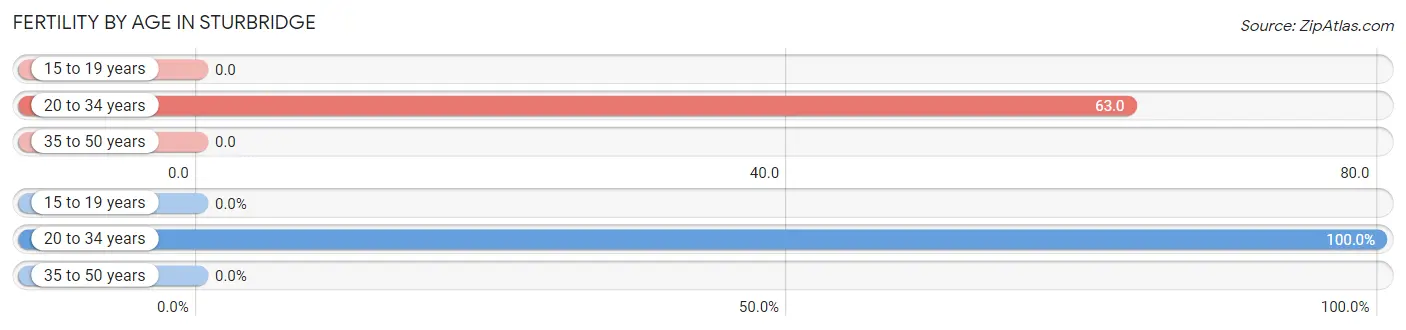
| Age Bracket | Women with Births | Births / 1,000 Women |
| 15 to 19 years | 0 (0.0%) | 0.0 |
| 20 to 34 years | 9 (100.0%) | 63.0 |
| 35 to 50 years | 0 (0.0%) | 0.0 |
| Total | 9 (100.0%) | 18.0 |
Fertility by Age by Marriage Status in Sturbridge
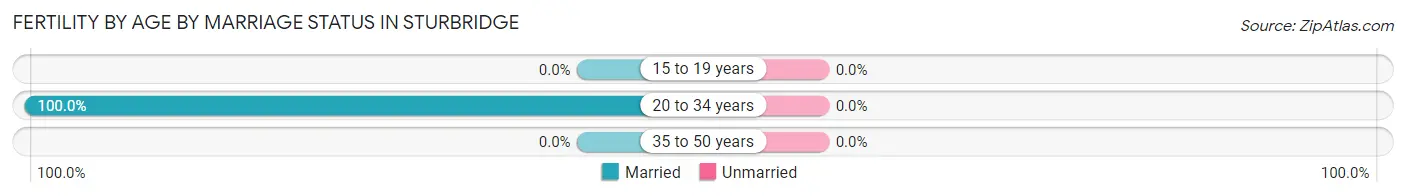
| Age Bracket | Married | Unmarried |
| 15 to 19 years | 0 (0.0%) | 0 (0.0%) |
| 20 to 34 years | 9 (100.0%) | 0 (0.0%) |
| 35 to 50 years | 0 (0.0%) | 0 (0.0%) |
| Total | 9 (100.0%) | 0 (0.0%) |
Fertility by Education in Sturbridge
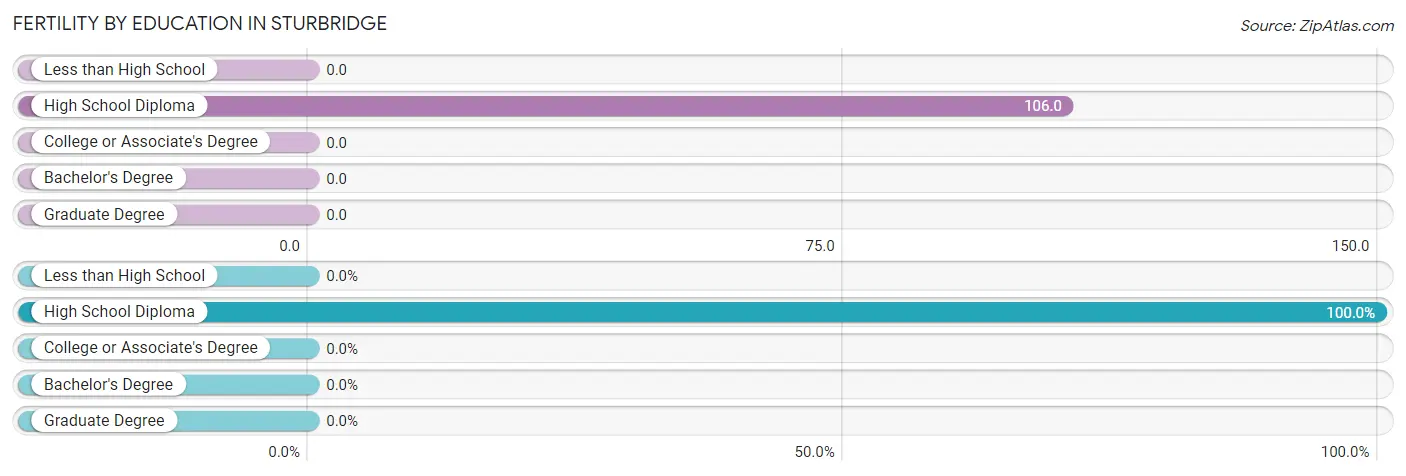
| Educational Attainment | Women with Births | Births / 1,000 Women |
| Less than High School | 0 (0.0%) | 0.0 |
| High School Diploma | 9 (100.0%) | 106.0 |
| College or Associate's Degree | 0 (0.0%) | 0.0 |
| Bachelor's Degree | 0 (0.0%) | 0.0 |
| Graduate Degree | 0 (0.0%) | 0.0 |
| Total | 9 (100.0%) | 18.0 |
Fertility by Education by Marriage Status in Sturbridge
| Educational Attainment | Married | Unmarried |
| Less than High School | 0 (0.0%) | 0 (0.0%) |
| High School Diploma | 9 (100.0%) | 0 (0.0%) |
| College or Associate's Degree | 0 (0.0%) | 0 (0.0%) |
| Bachelor's Degree | 0 (0.0%) | 0 (0.0%) |
| Graduate Degree | 0 (0.0%) | 0 (0.0%) |
| Total | 9 (100.0%) | 0 (0.0%) |
Employment Characteristics in Sturbridge
Employment by Class of Employer in Sturbridge
Among the 1,176 employed individuals in Sturbridge, private company employees (617 | 52.5%), not-for-profit organizations (200 | 17.0%), and state government employees (179 | 15.2%) make up the most common classes of employment.
| Employer Class | # Employees | % Employees |
| Private Company Employees | 617 | 52.5% |
| Self-Employed (Incorporated) | 11 | 0.9% |
| Self-Employed (Not Incorporated) | 31 | 2.6% |
| Not-for-profit Organizations | 200 | 17.0% |
| Local Government Employees | 138 | 11.7% |
| State Government Employees | 179 | 15.2% |
| Federal Government Employees | 0 | 0.0% |
| Unpaid Family Workers | 0 | 0.0% |
| Total | 1,176 | 100.0% |
Employment Status by Age in Sturbridge
| Age Bracket | In Labor Force | Unemployed |
| 16 to 19 Years | 78 (59.1%) | 0 (0.0%) |
| 20 to 24 Years | 0 (0.0%) | 0 (0.0%) |
| 25 to 29 Years | 137 (86.7%) | 0 (0.0%) |
| 30 to 34 Years | 92 (100.0%) | 0 (0.0%) |
| 35 to 44 Years | 182 (80.9%) | 0 (0.0%) |
| 45 to 54 Years | 410 (80.9%) | 0 (0.0%) |
| 55 to 59 Years | 147 (90.7%) | 0 (0.0%) |
| 60 to 64 Years | 50 (26.2%) | 0 (0.0%) |
| 65 to 74 Years | 67 (24.5%) | 0 (0.0%) |
| 75 Years and over | 13 (14.6%) | 0 (0.0%) |
| Total | 1,177 (64.3%) | 0 (0.0%) |
Employment Status by Educational Attainment in Sturbridge
| Educational Attainment | In Labor Force | Unemployed |
| Less than High School | 0 (0.0%) | 0 (0.0%) |
| High School Diploma | 76 (47.8%) | 0 (0.0%) |
| College / Associate Degree | 353 (83.6%) | 0 (0.0%) |
| Bachelor's Degree or higher | 589 (78.3%) | 0 (0.0%) |
| Total | 1,019 (76.3%) | 0 (0.0%) |
Employment Occupations by Sex in Sturbridge
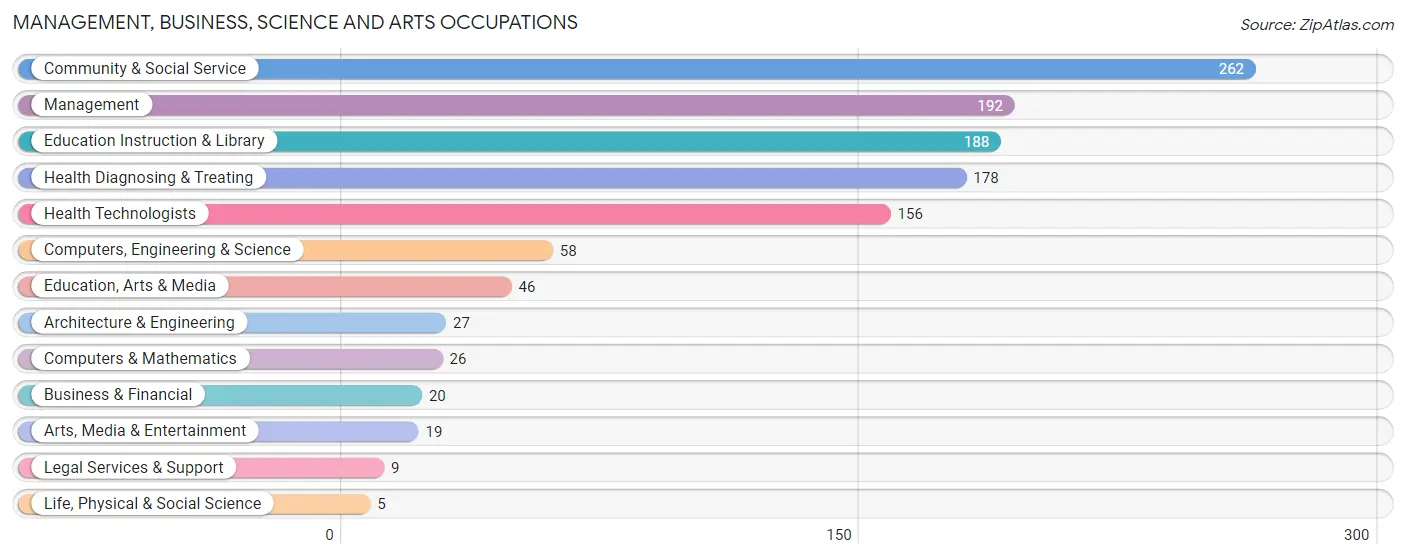
Management, Business, Science and Arts Occupations
The most common Management, Business, Science and Arts occupations in Sturbridge are Community & Social Service (262 | 22.3%), Management (192 | 16.3%), Education Instruction & Library (188 | 16.0%), Health Diagnosing & Treating (178 | 15.1%), and Health Technologists (156 | 13.3%).
Management, Business, Science and Arts Occupations by Sex
Within the Management, Business, Science and Arts occupations in Sturbridge, the most male-oriented occupations are Business & Financial (100.0%), Architecture & Engineering (100.0%), and Legal Services & Support (100.0%), while the most female-oriented occupations are Life, Physical & Social Science (100.0%), Health Technologists (91.7%), and Health Diagnosing & Treating (87.1%).
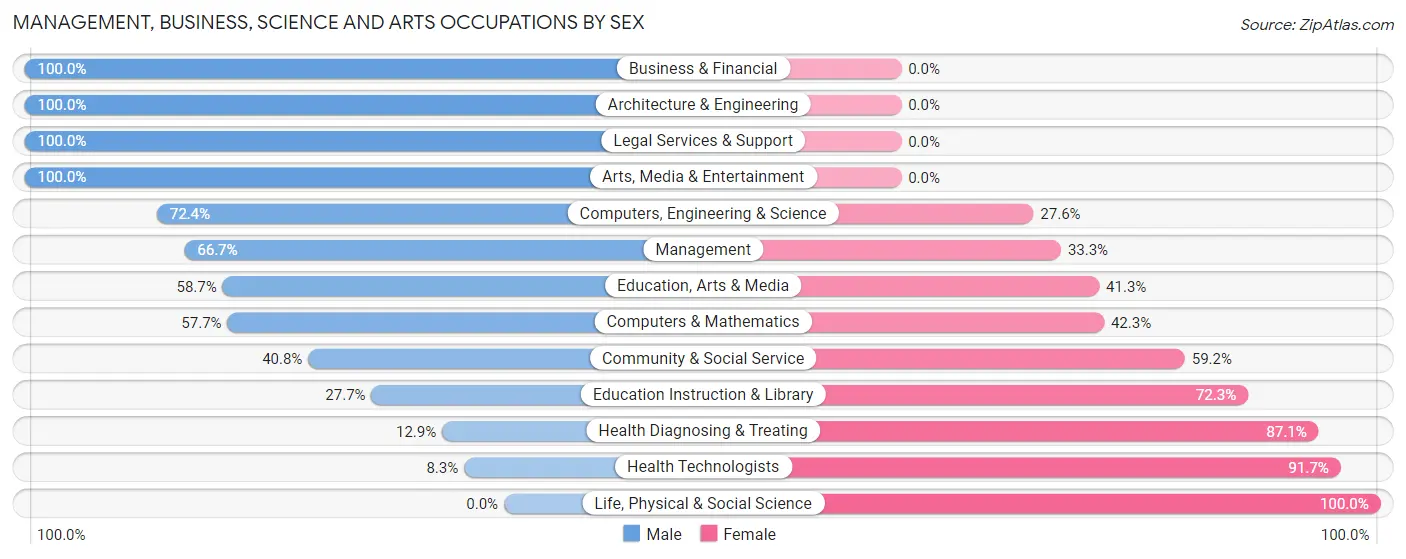
| Occupation | Male | Female |
| Management | 128 (66.7%) | 64 (33.3%) |
| Business & Financial | 20 (100.0%) | 0 (0.0%) |
| Computers, Engineering & Science | 42 (72.4%) | 16 (27.6%) |
| Computers & Mathematics | 15 (57.7%) | 11 (42.3%) |
| Architecture & Engineering | 27 (100.0%) | 0 (0.0%) |
| Life, Physical & Social Science | 0 (0.0%) | 5 (100.0%) |
| Community & Social Service | 107 (40.8%) | 155 (59.2%) |
| Education, Arts & Media | 27 (58.7%) | 19 (41.3%) |
| Legal Services & Support | 9 (100.0%) | 0 (0.0%) |
| Education Instruction & Library | 52 (27.7%) | 136 (72.3%) |
| Arts, Media & Entertainment | 19 (100.0%) | 0 (0.0%) |
| Health Diagnosing & Treating | 23 (12.9%) | 155 (87.1%) |
| Health Technologists | 13 (8.3%) | 143 (91.7%) |
| Total (Category) | 320 (45.1%) | 390 (54.9%) |
| Total (Overall) | 639 (54.3%) | 537 (45.7%) |
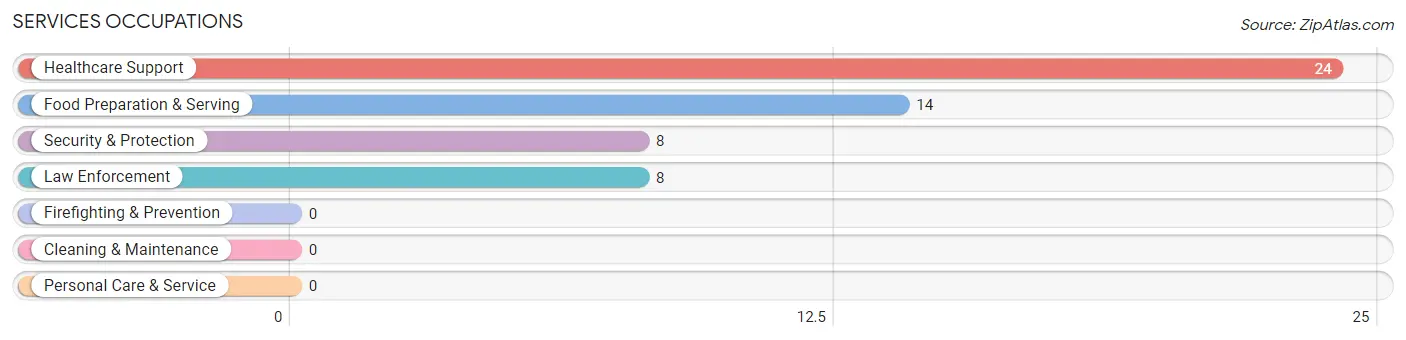
Services Occupations
The most common Services occupations in Sturbridge are Healthcare Support (24 | 2.0%), Food Preparation & Serving (14 | 1.2%), Security & Protection (8 | 0.7%), and Law Enforcement (8 | 0.7%).
Services Occupations by Sex
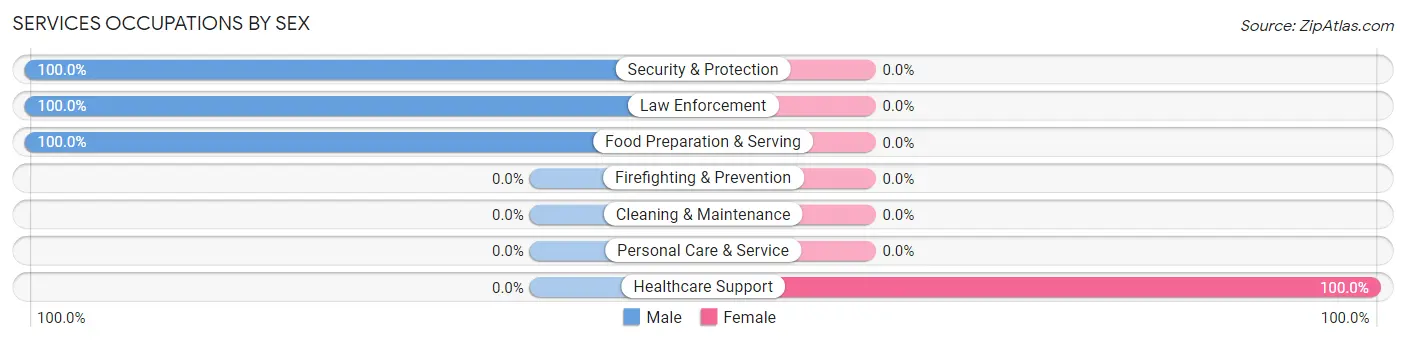
| Occupation | Male | Female |
| Healthcare Support | 0 (0.0%) | 24 (100.0%) |
| Security & Protection | 8 (100.0%) | 0 (0.0%) |
| Firefighting & Prevention | 0 (0.0%) | 0 (0.0%) |
| Law Enforcement | 8 (100.0%) | 0 (0.0%) |
| Food Preparation & Serving | 14 (100.0%) | 0 (0.0%) |
| Cleaning & Maintenance | 0 (0.0%) | 0 (0.0%) |
| Personal Care & Service | 0 (0.0%) | 0 (0.0%) |
| Total (Category) | 22 (47.8%) | 24 (52.2%) |
| Total (Overall) | 639 (54.3%) | 537 (45.7%) |
Sales and Office Occupations
The most common Sales and Office occupations in Sturbridge are Office & Administration (127 | 10.8%), and Sales & Related (96 | 8.2%).
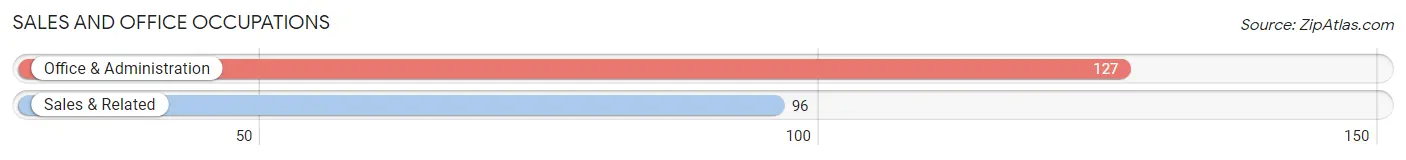
Sales and Office Occupations by Sex

| Occupation | Male | Female |
| Sales & Related | 96 (100.0%) | 0 (0.0%) |
| Office & Administration | 36 (28.3%) | 91 (71.7%) |
| Total (Category) | 132 (59.2%) | 91 (40.8%) |
| Total (Overall) | 639 (54.3%) | 537 (45.7%) |
Natural Resources, Construction and Maintenance Occupations
The most common Natural Resources, Construction and Maintenance occupations in Sturbridge are Construction & Extraction (49 | 4.2%), Installation, Maintenance & Repair (44 | 3.7%), and Farming, Fishing & Forestry (17 | 1.5%).
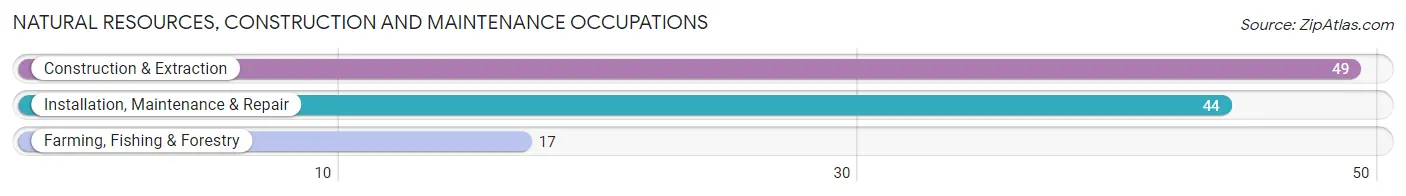
Natural Resources, Construction and Maintenance Occupations by Sex
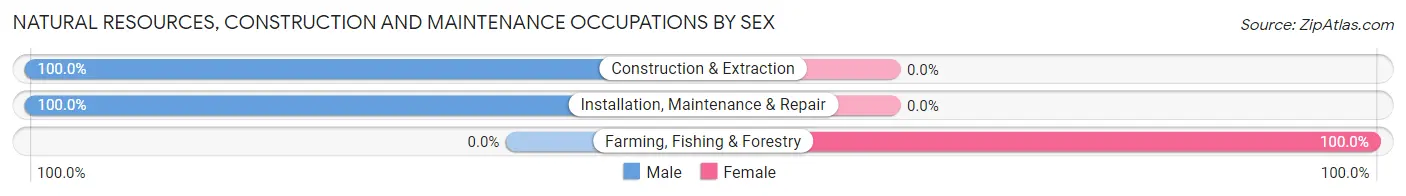
| Occupation | Male | Female |
| Farming, Fishing & Forestry | 0 (0.0%) | 17 (100.0%) |
| Construction & Extraction | 49 (100.0%) | 0 (0.0%) |
| Installation, Maintenance & Repair | 44 (100.0%) | 0 (0.0%) |
| Total (Category) | 93 (84.6%) | 17 (15.4%) |
| Total (Overall) | 639 (54.3%) | 537 (45.7%) |
Production, Transportation and Moving Occupations
The most common Production, Transportation and Moving occupations in Sturbridge are Material Moving (61 | 5.2%), and Production (26 | 2.2%).
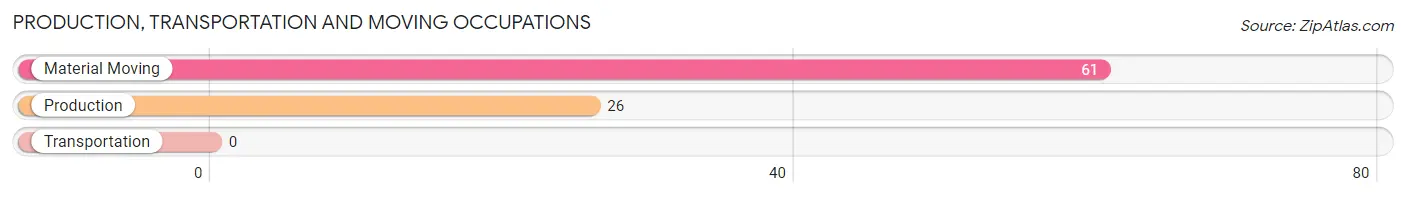
Production, Transportation and Moving Occupations by Sex
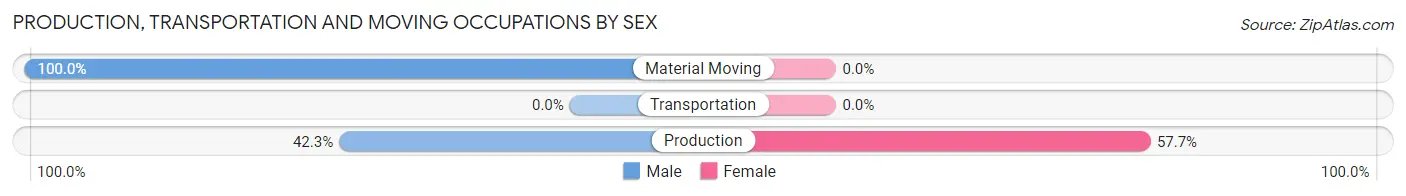
| Occupation | Male | Female |
| Production | 11 (42.3%) | 15 (57.7%) |
| Transportation | 0 (0.0%) | 0 (0.0%) |
| Material Moving | 61 (100.0%) | 0 (0.0%) |
| Total (Category) | 72 (82.8%) | 15 (17.2%) |
| Total (Overall) | 639 (54.3%) | 537 (45.7%) |
Employment Industries by Sex in Sturbridge
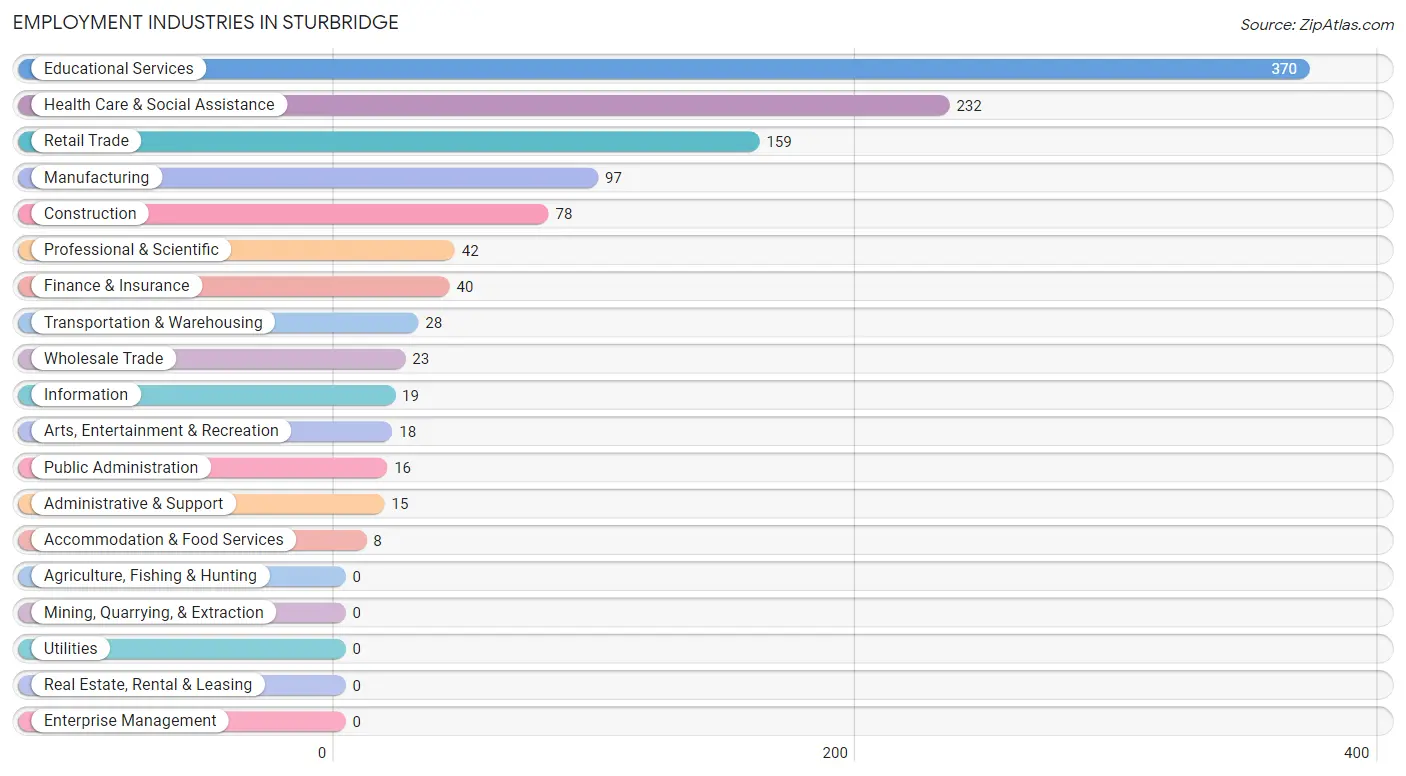
Employment Industries in Sturbridge
The major employment industries in Sturbridge include Educational Services (370 | 31.5%), Health Care & Social Assistance (232 | 19.7%), Retail Trade (159 | 13.5%), Manufacturing (97 | 8.3%), and Construction (78 | 6.6%).
Employment Industries by Sex in Sturbridge
The Sturbridge industries that see more men than women are Construction (100.0%), Transportation & Warehousing (100.0%), and Administrative & Support (100.0%), whereas the industries that tend to have a higher number of women are Information (100.0%), Health Care & Social Assistance (78.4%), and Wholesale Trade (73.9%).
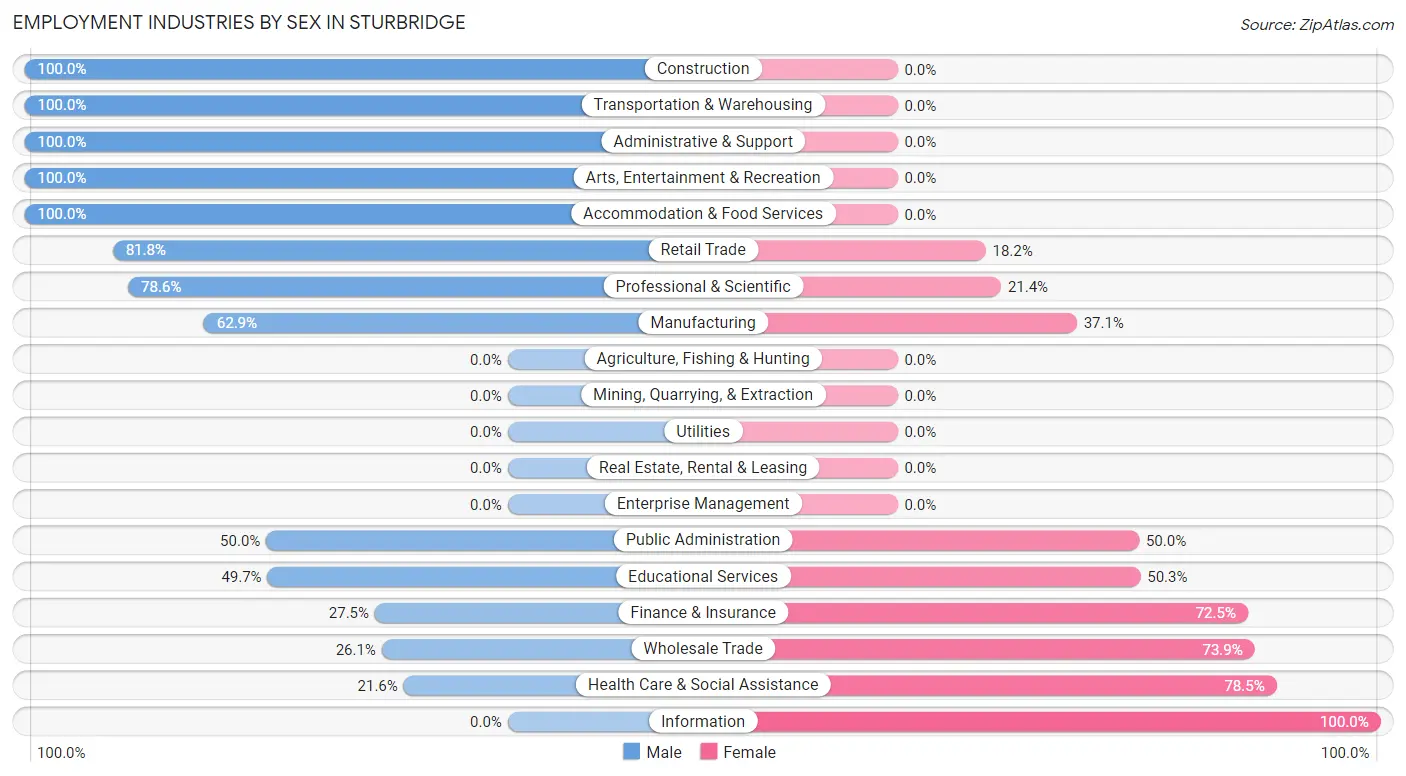
| Industry | Male | Female |
| Agriculture, Fishing & Hunting | 0 (0.0%) | 0 (0.0%) |
| Mining, Quarrying, & Extraction | 0 (0.0%) | 0 (0.0%) |
| Construction | 78 (100.0%) | 0 (0.0%) |
| Manufacturing | 61 (62.9%) | 36 (37.1%) |
| Wholesale Trade | 6 (26.1%) | 17 (73.9%) |
| Retail Trade | 130 (81.8%) | 29 (18.2%) |
| Transportation & Warehousing | 28 (100.0%) | 0 (0.0%) |
| Utilities | 0 (0.0%) | 0 (0.0%) |
| Information | 0 (0.0%) | 19 (100.0%) |
| Finance & Insurance | 11 (27.5%) | 29 (72.5%) |
| Real Estate, Rental & Leasing | 0 (0.0%) | 0 (0.0%) |
| Professional & Scientific | 33 (78.6%) | 9 (21.4%) |
| Enterprise Management | 0 (0.0%) | 0 (0.0%) |
| Administrative & Support | 15 (100.0%) | 0 (0.0%) |
| Educational Services | 184 (49.7%) | 186 (50.3%) |
| Health Care & Social Assistance | 50 (21.5%) | 182 (78.4%) |
| Arts, Entertainment & Recreation | 18 (100.0%) | 0 (0.0%) |
| Accommodation & Food Services | 8 (100.0%) | 0 (0.0%) |
| Public Administration | 8 (50.0%) | 8 (50.0%) |
| Total | 639 (54.3%) | 537 (45.7%) |
Education in Sturbridge
School Enrollment in Sturbridge
The most common levels of schooling among the 489 students in Sturbridge are high school (196 | 40.1%), elementary school (93 | 19.0%), and college / undergraduate (90 | 18.4%).
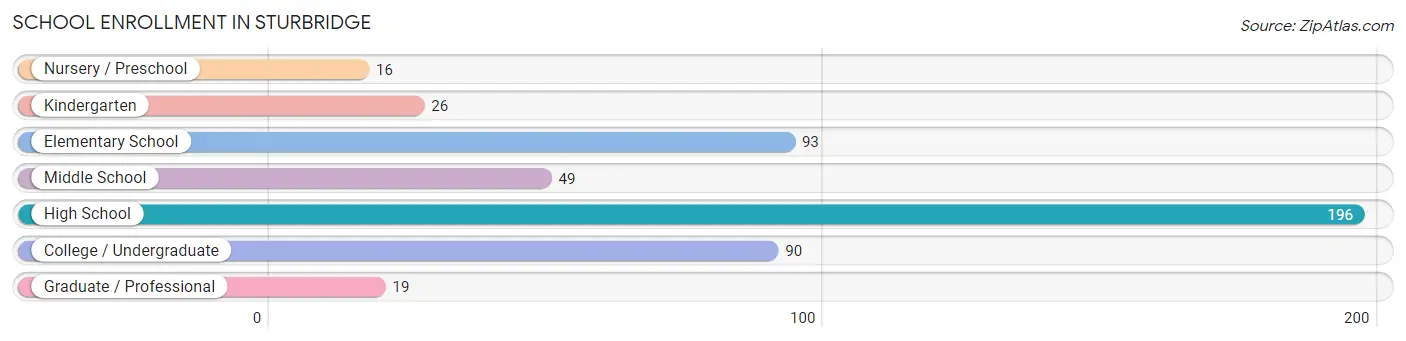
| School Level | # Students | % Students |
| Nursery / Preschool | 16 | 3.3% |
| Kindergarten | 26 | 5.3% |
| Elementary School | 93 | 19.0% |
| Middle School | 49 | 10.0% |
| High School | 196 | 40.1% |
| College / Undergraduate | 90 | 18.4% |
| Graduate / Professional | 19 | 3.9% |
| Total | 489 | 100.0% |
School Enrollment by Age by Funding Source in Sturbridge
Out of a total of 489 students who are enrolled in schools in Sturbridge, 52 (10.6%) attend a private institution, while the remaining 437 (89.4%) are enrolled in public schools. The age group of 18 to 19 year olds has the highest likelihood of being enrolled in private schools, with 23 (46.0% in the age bracket) enrolled. Conversely, the age group of 3 to 4 year olds has the lowest likelihood of being enrolled in a private school, with 16 (100.0% in the age bracket) attending a public institution.
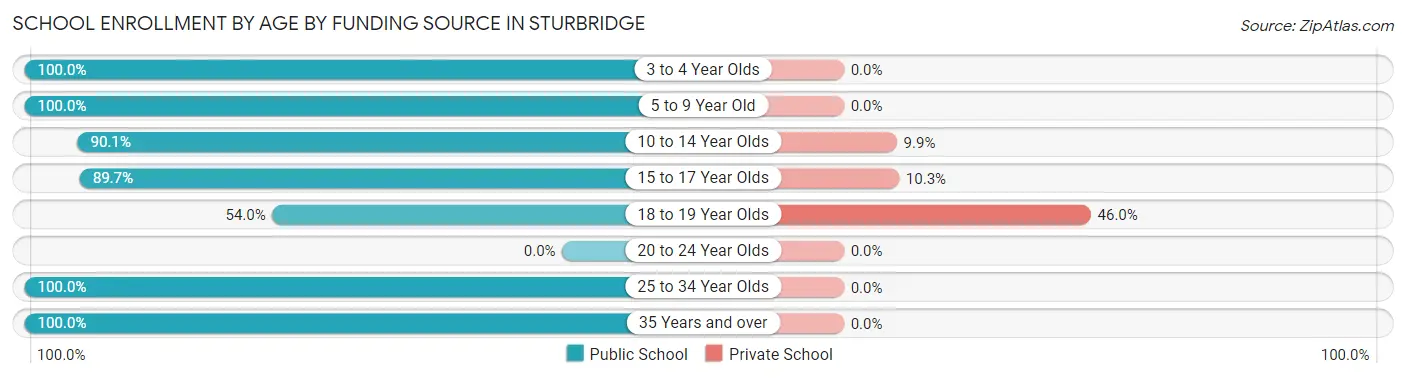
| Age Bracket | Public School | Private School |
| 3 to 4 Year Olds | 16 (100.0%) | 0 (0.0%) |
| 5 to 9 Year Old | 76 (100.0%) | 0 (0.0%) |
| 10 to 14 Year Olds | 137 (90.1%) | 15 (9.9%) |
| 15 to 17 Year Olds | 122 (89.7%) | 14 (10.3%) |
| 18 to 19 Year Olds | 27 (54.0%) | 23 (46.0%) |
| 20 to 24 Year Olds | 0 (0.0%) | 0 (0.0%) |
| 25 to 34 Year Olds | 19 (100.0%) | 0 (0.0%) |
| 35 Years and over | 40 (100.0%) | 0 (0.0%) |
| Total | 437 (89.4%) | 52 (10.6%) |
Educational Attainment by Field of Study in Sturbridge
Psychology (130 | 12.3%), social sciences (129 | 12.2%), education (120 | 11.3%), arts & humanities (118 | 11.1%), and liberal arts & history (97 | 9.1%) are the most common fields of study among 1,060 individuals in Sturbridge who have obtained a bachelor's degree or higher.
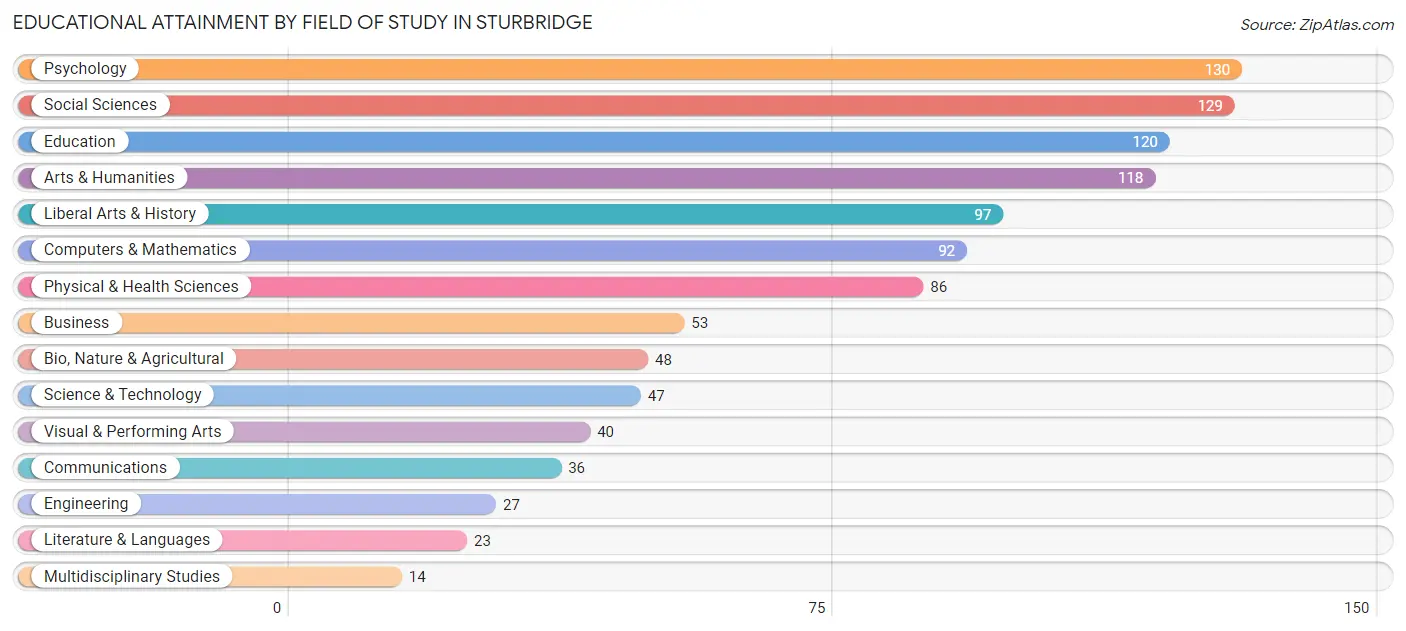
| Field of Study | # Graduates | % Graduates |
| Computers & Mathematics | 92 | 8.7% |
| Bio, Nature & Agricultural | 48 | 4.5% |
| Physical & Health Sciences | 86 | 8.1% |
| Psychology | 130 | 12.3% |
| Social Sciences | 129 | 12.2% |
| Engineering | 27 | 2.5% |
| Multidisciplinary Studies | 14 | 1.3% |
| Science & Technology | 47 | 4.4% |
| Business | 53 | 5.0% |
| Education | 120 | 11.3% |
| Literature & Languages | 23 | 2.2% |
| Liberal Arts & History | 97 | 9.1% |
| Visual & Performing Arts | 40 | 3.8% |
| Communications | 36 | 3.4% |
| Arts & Humanities | 118 | 11.1% |
| Total | 1,060 | 100.0% |
Transportation & Commute in Sturbridge
Vehicle Availability by Sex in Sturbridge
The most prevalent vehicle ownership categories in Sturbridge are males with 2 vehicles (332, accounting for 52.0%) and females with 2 vehicles (264, making up 61.8%).
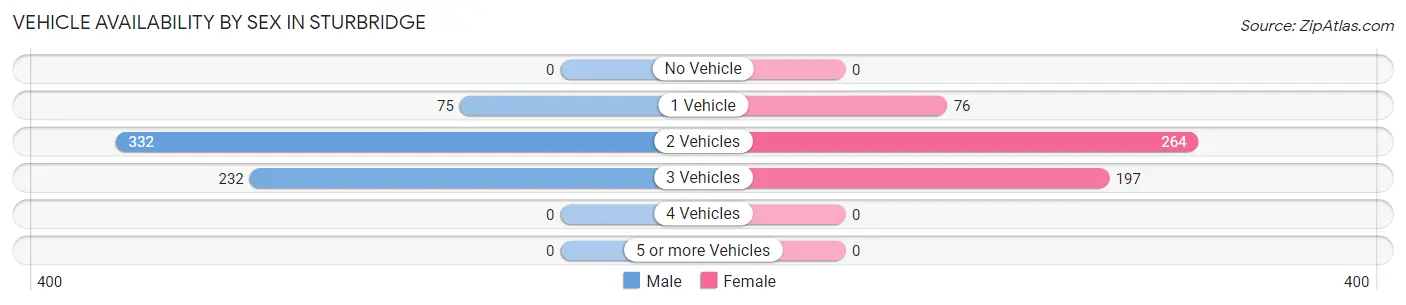
| Vehicles Available | Male | Female |
| No Vehicle | 0 (0.0%) | 0 (0.0%) |
| 1 Vehicle | 75 (11.7%) | 76 (14.1%) |
| 2 Vehicles | 332 (52.0%) | 264 (49.2%) |
| 3 Vehicles | 232 (36.3%) | 197 (36.7%) |
| 4 Vehicles | 0 (0.0%) | 0 (0.0%) |
| 5 or more Vehicles | 0 (0.0%) | 0 (0.0%) |
| Total | 639 (100.0%) | 537 (100.0%) |
Commute Time in Sturbridge
The most frequently occuring commute durations in Sturbridge are 40 to 44 minutes (212 commuters, 18.7%), 35 to 39 minutes (205 commuters, 18.1%), and 60 to 89 minutes (157 commuters, 13.9%).
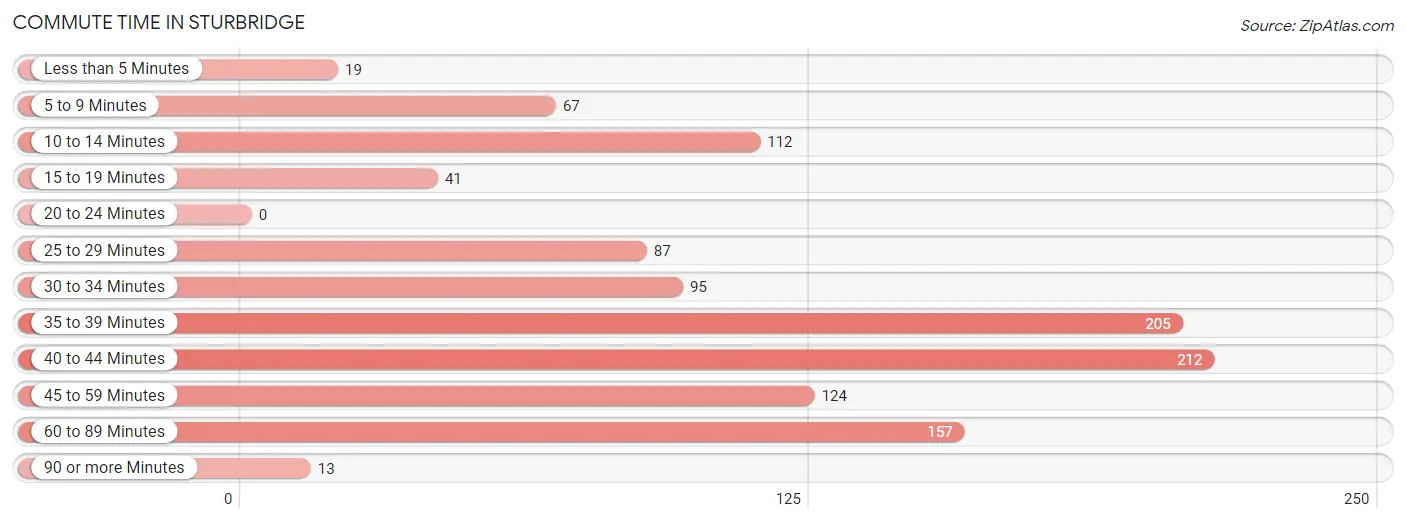
| Commute Time | # Commuters | % Commuters |
| Less than 5 Minutes | 19 | 1.7% |
| 5 to 9 Minutes | 67 | 5.9% |
| 10 to 14 Minutes | 112 | 9.9% |
| 15 to 19 Minutes | 41 | 3.6% |
| 20 to 24 Minutes | 0 | 0.0% |
| 25 to 29 Minutes | 87 | 7.7% |
| 30 to 34 Minutes | 95 | 8.4% |
| 35 to 39 Minutes | 205 | 18.1% |
| 40 to 44 Minutes | 212 | 18.7% |
| 45 to 59 Minutes | 124 | 11.0% |
| 60 to 89 Minutes | 157 | 13.9% |
| 90 or more Minutes | 13 | 1.1% |
Commute Time by Sex in Sturbridge
The most common commute times in Sturbridge are 60 to 89 minutes (140 commuters, 23.0%) for males and 40 to 44 minutes (106 commuters, 20.3%) for females.
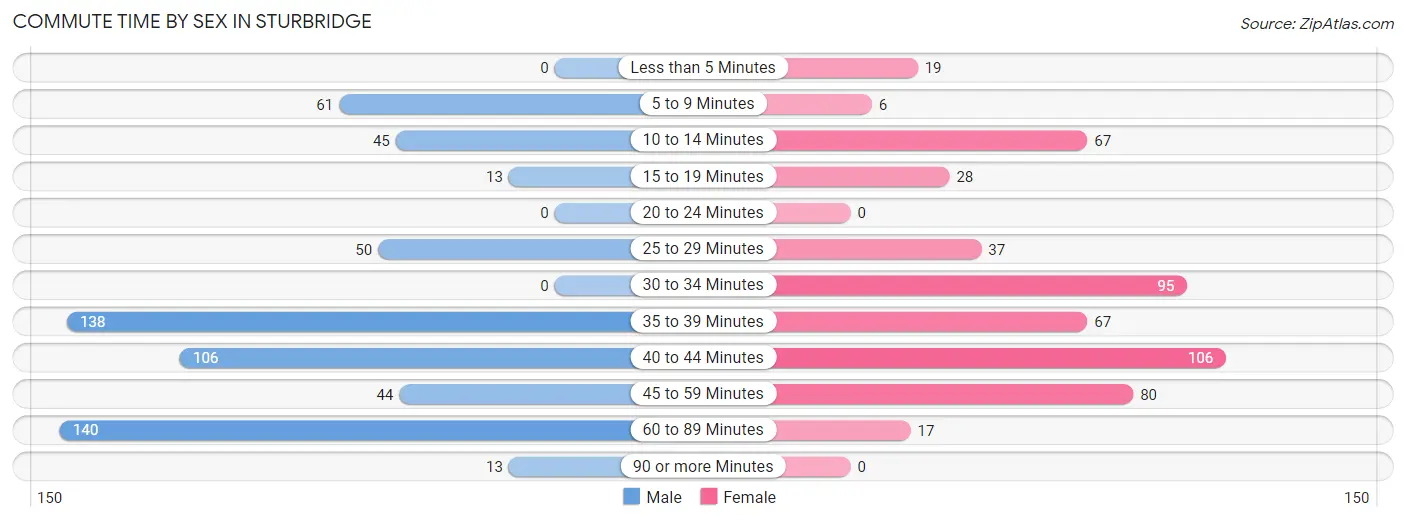
| Commute Time | Male | Female |
| Less than 5 Minutes | 0 (0.0%) | 19 (3.6%) |
| 5 to 9 Minutes | 61 (10.0%) | 6 (1.1%) |
| 10 to 14 Minutes | 45 (7.4%) | 67 (12.8%) |
| 15 to 19 Minutes | 13 (2.1%) | 28 (5.4%) |
| 20 to 24 Minutes | 0 (0.0%) | 0 (0.0%) |
| 25 to 29 Minutes | 50 (8.2%) | 37 (7.1%) |
| 30 to 34 Minutes | 0 (0.0%) | 95 (18.2%) |
| 35 to 39 Minutes | 138 (22.6%) | 67 (12.8%) |
| 40 to 44 Minutes | 106 (17.4%) | 106 (20.3%) |
| 45 to 59 Minutes | 44 (7.2%) | 80 (15.3%) |
| 60 to 89 Minutes | 140 (23.0%) | 17 (3.3%) |
| 90 or more Minutes | 13 (2.1%) | 0 (0.0%) |
Time of Departure to Work by Sex in Sturbridge
The most frequent times of departure to work in Sturbridge are 6:00 AM to 6:29 AM (141, 23.1%) for males and 8:00 AM to 8:29 AM (151, 28.9%) for females.
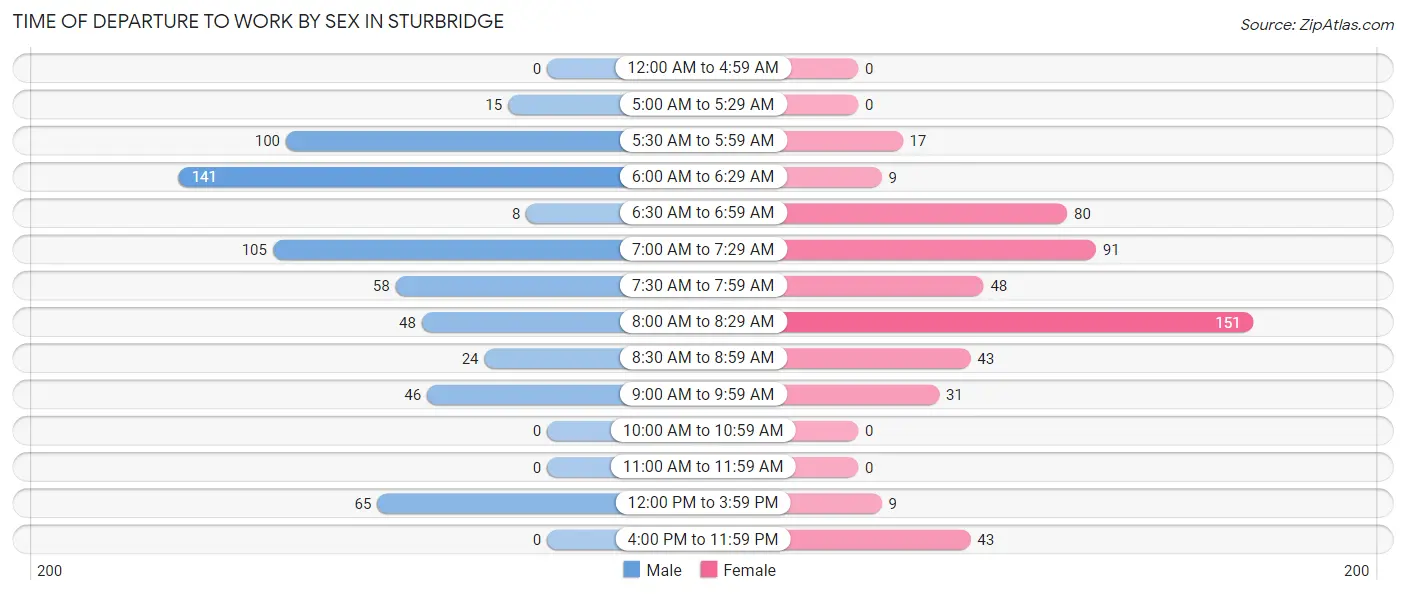
| Time of Departure | Male | Female |
| 12:00 AM to 4:59 AM | 0 (0.0%) | 0 (0.0%) |
| 5:00 AM to 5:29 AM | 15 (2.5%) | 0 (0.0%) |
| 5:30 AM to 5:59 AM | 100 (16.4%) | 17 (3.3%) |
| 6:00 AM to 6:29 AM | 141 (23.1%) | 9 (1.7%) |
| 6:30 AM to 6:59 AM | 8 (1.3%) | 80 (15.3%) |
| 7:00 AM to 7:29 AM | 105 (17.2%) | 91 (17.4%) |
| 7:30 AM to 7:59 AM | 58 (9.5%) | 48 (9.2%) |
| 8:00 AM to 8:29 AM | 48 (7.9%) | 151 (28.9%) |
| 8:30 AM to 8:59 AM | 24 (3.9%) | 43 (8.2%) |
| 9:00 AM to 9:59 AM | 46 (7.5%) | 31 (5.9%) |
| 10:00 AM to 10:59 AM | 0 (0.0%) | 0 (0.0%) |
| 11:00 AM to 11:59 AM | 0 (0.0%) | 0 (0.0%) |
| 12:00 PM to 3:59 PM | 65 (10.7%) | 9 (1.7%) |
| 4:00 PM to 11:59 PM | 0 (0.0%) | 43 (8.2%) |
| Total | 610 (100.0%) | 522 (100.0%) |
Housing Occupancy in Sturbridge
Occupancy by Ownership in Sturbridge
Of the total 910 dwellings in Sturbridge, owner-occupied units account for 730 (80.2%), while renter-occupied units make up 180 (19.8%).
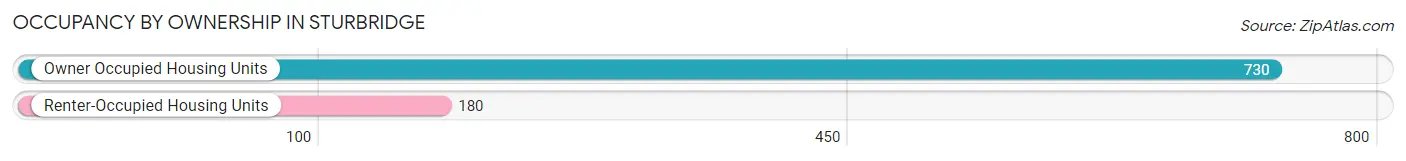
| Occupancy | # Housing Units | % Housing Units |
| Owner Occupied Housing Units | 730 | 80.2% |
| Renter-Occupied Housing Units | 180 | 19.8% |
| Total Occupied Housing Units | 910 | 100.0% |
Occupancy by Household Size in Sturbridge
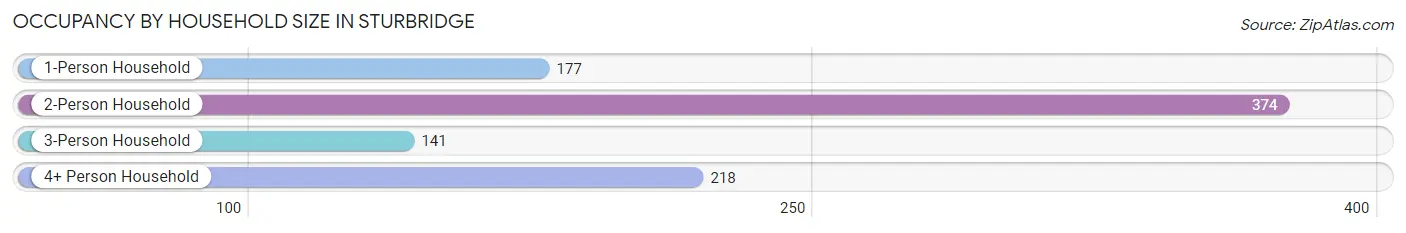
| Household Size | # Housing Units | % Housing Units |
| 1-Person Household | 177 | 19.5% |
| 2-Person Household | 374 | 41.1% |
| 3-Person Household | 141 | 15.5% |
| 4+ Person Household | 218 | 24.0% |
| Total Housing Units | 910 | 100.0% |
Occupancy by Ownership by Household Size in Sturbridge
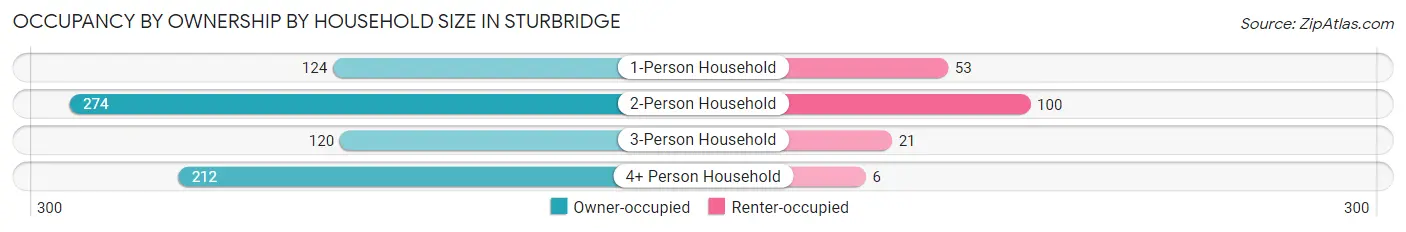
| Household Size | Owner-occupied | Renter-occupied |
| 1-Person Household | 124 (70.1%) | 53 (29.9%) |
| 2-Person Household | 274 (73.3%) | 100 (26.7%) |
| 3-Person Household | 120 (85.1%) | 21 (14.9%) |
| 4+ Person Household | 212 (97.3%) | 6 (2.8%) |
| Total Housing Units | 730 (80.2%) | 180 (19.8%) |
Occupancy by Educational Attainment in Sturbridge
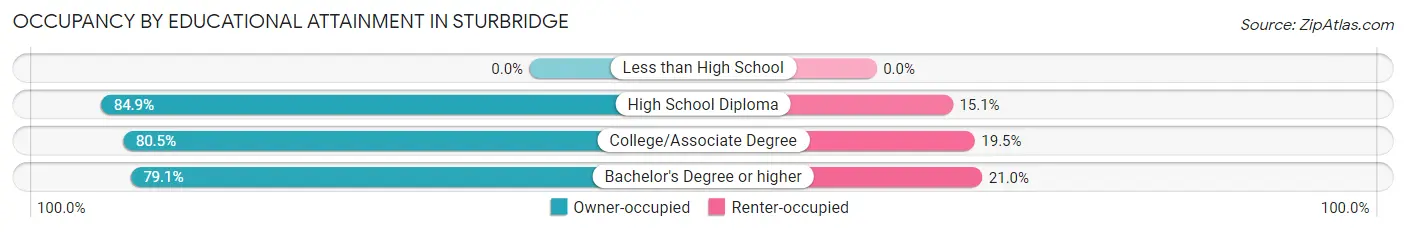
| Household Size | Owner-occupied | Renter-occupied |
| Less than High School | 0 (0.0%) | 0 (0.0%) |
| High School Diploma | 73 (84.9%) | 13 (15.1%) |
| College/Associate Degree | 306 (80.5%) | 74 (19.5%) |
| Bachelor's Degree or higher | 351 (79.0%) | 93 (20.9%) |
Occupancy by Age of Householder in Sturbridge
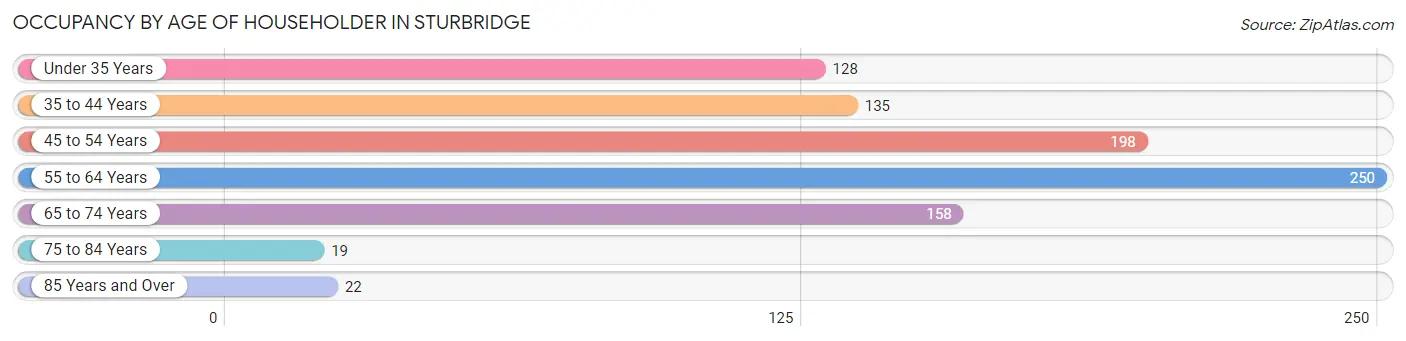
| Age Bracket | # Households | % Households |
| Under 35 Years | 128 | 14.1% |
| 35 to 44 Years | 135 | 14.8% |
| 45 to 54 Years | 198 | 21.8% |
| 55 to 64 Years | 250 | 27.5% |
| 65 to 74 Years | 158 | 17.4% |
| 75 to 84 Years | 19 | 2.1% |
| 85 Years and Over | 22 | 2.4% |
| Total | 910 | 100.0% |
Housing Finances in Sturbridge
Median Income by Occupancy in Sturbridge
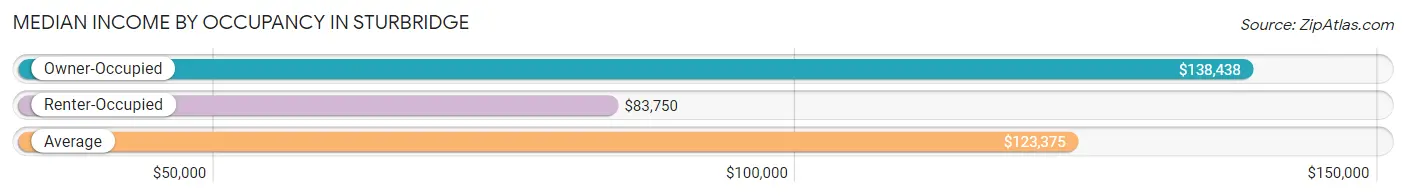
| Occupancy Type | # Households | Median Income |
| Owner-Occupied | 730 (80.2%) | $138,438 |
| Renter-Occupied | 180 (19.8%) | $83,750 |
| Average | 910 (100.0%) | $123,375 |
Occupancy by Householder Income Bracket in Sturbridge
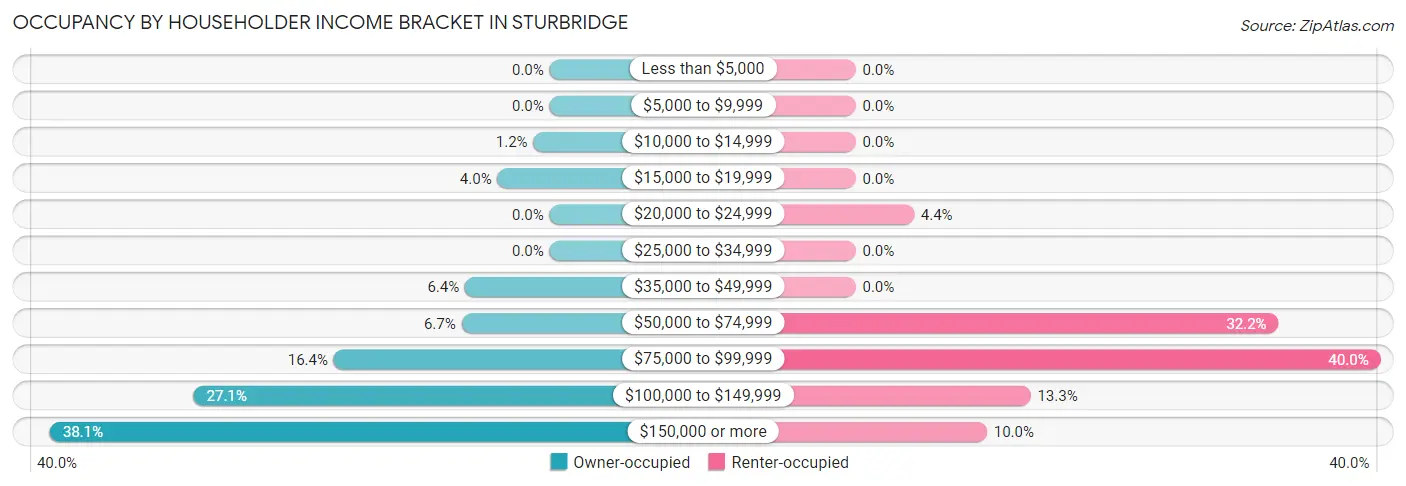
| Income Bracket | Owner-occupied | Renter-occupied |
| Less than $5,000 | 0 (0.0%) | 0 (0.0%) |
| $5,000 to $9,999 | 0 (0.0%) | 0 (0.0%) |
| $10,000 to $14,999 | 9 (1.2%) | 0 (0.0%) |
| $15,000 to $19,999 | 29 (4.0%) | 0 (0.0%) |
| $20,000 to $24,999 | 0 (0.0%) | 8 (4.4%) |
| $25,000 to $34,999 | 0 (0.0%) | 0 (0.0%) |
| $35,000 to $49,999 | 47 (6.4%) | 0 (0.0%) |
| $50,000 to $74,999 | 49 (6.7%) | 58 (32.2%) |
| $75,000 to $99,999 | 120 (16.4%) | 72 (40.0%) |
| $100,000 to $149,999 | 198 (27.1%) | 24 (13.3%) |
| $150,000 or more | 278 (38.1%) | 18 (10.0%) |
| Total | 730 (100.0%) | 180 (100.0%) |
Monthly Housing Cost Tiers in Sturbridge
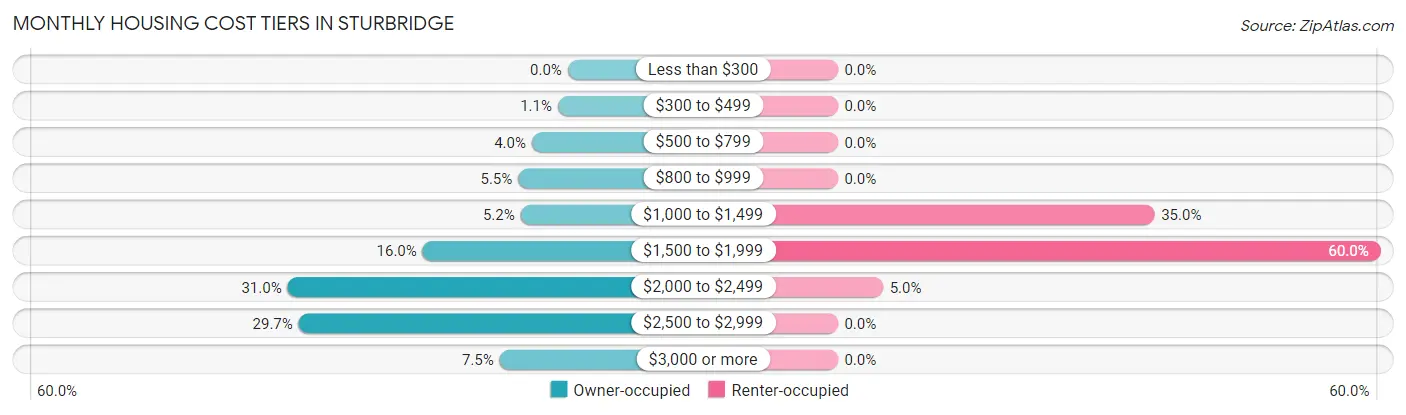
| Monthly Cost | Owner-occupied | Renter-occupied |
| Less than $300 | 0 (0.0%) | 0 (0.0%) |
| $300 to $499 | 8 (1.1%) | 0 (0.0%) |
| $500 to $799 | 29 (4.0%) | 0 (0.0%) |
| $800 to $999 | 40 (5.5%) | 0 (0.0%) |
| $1,000 to $1,499 | 38 (5.2%) | 63 (35.0%) |
| $1,500 to $1,999 | 117 (16.0%) | 108 (60.0%) |
| $2,000 to $2,499 | 226 (31.0%) | 9 (5.0%) |
| $2,500 to $2,999 | 217 (29.7%) | 0 (0.0%) |
| $3,000 or more | 55 (7.5%) | 0 (0.0%) |
| Total | 730 (100.0%) | 180 (100.0%) |
Physical Housing Characteristics in Sturbridge
Housing Structures in Sturbridge
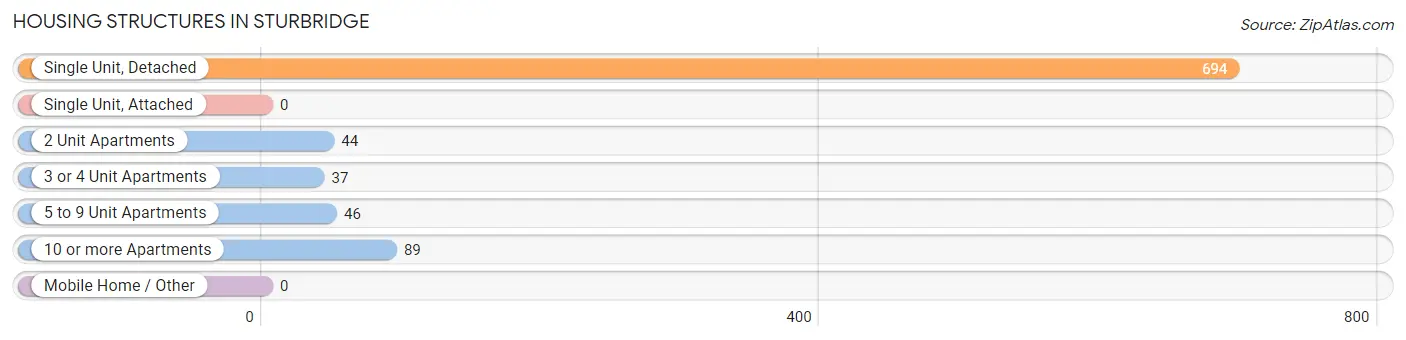
| Structure Type | # Housing Units | % Housing Units |
| Single Unit, Detached | 694 | 76.3% |
| Single Unit, Attached | 0 | 0.0% |
| 2 Unit Apartments | 44 | 4.8% |
| 3 or 4 Unit Apartments | 37 | 4.1% |
| 5 to 9 Unit Apartments | 46 | 5.1% |
| 10 or more Apartments | 89 | 9.8% |
| Mobile Home / Other | 0 | 0.0% |
| Total | 910 | 100.0% |
Housing Structures by Occupancy in Sturbridge
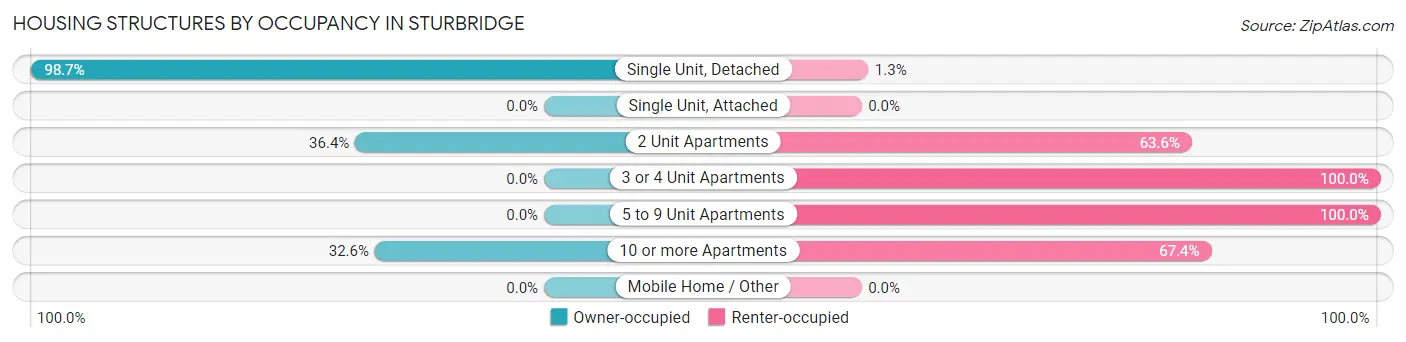
| Structure Type | Owner-occupied | Renter-occupied |
| Single Unit, Detached | 685 (98.7%) | 9 (1.3%) |
| Single Unit, Attached | 0 (0.0%) | 0 (0.0%) |
| 2 Unit Apartments | 16 (36.4%) | 28 (63.6%) |
| 3 or 4 Unit Apartments | 0 (0.0%) | 37 (100.0%) |
| 5 to 9 Unit Apartments | 0 (0.0%) | 46 (100.0%) |
| 10 or more Apartments | 29 (32.6%) | 60 (67.4%) |
| Mobile Home / Other | 0 (0.0%) | 0 (0.0%) |
| Total | 730 (80.2%) | 180 (19.8%) |
Housing Structures by Number of Rooms in Sturbridge
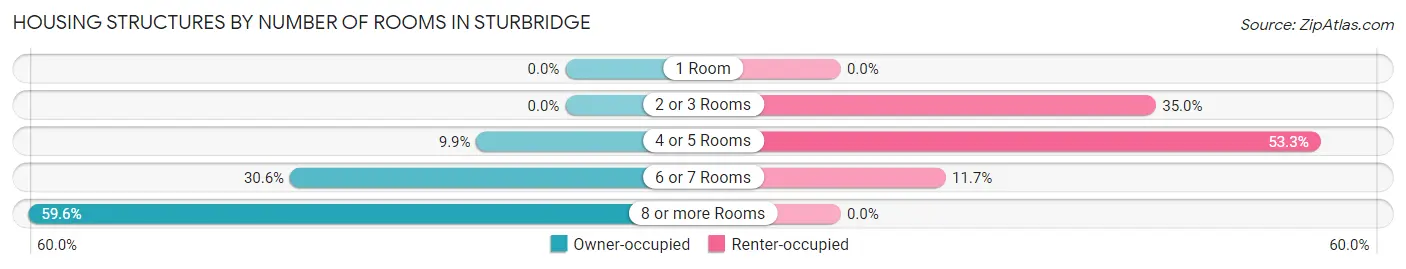
| Number of Rooms | Owner-occupied | Renter-occupied |
| 1 Room | 0 (0.0%) | 0 (0.0%) |
| 2 or 3 Rooms | 0 (0.0%) | 63 (35.0%) |
| 4 or 5 Rooms | 72 (9.9%) | 96 (53.3%) |
| 6 or 7 Rooms | 223 (30.5%) | 21 (11.7%) |
| 8 or more Rooms | 435 (59.6%) | 0 (0.0%) |
| Total | 730 (100.0%) | 180 (100.0%) |
Housing Structure by Heating Type in Sturbridge
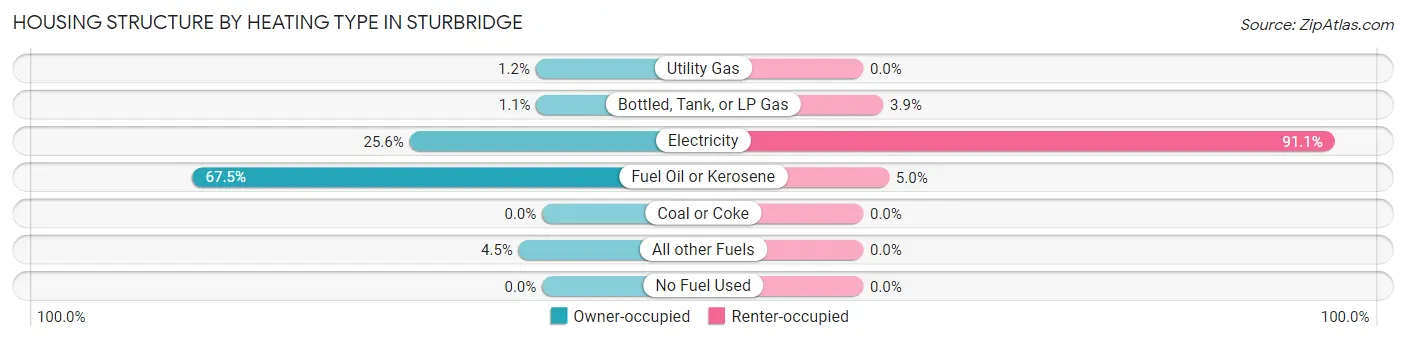
| Heating Type | Owner-occupied | Renter-occupied |
| Utility Gas | 9 (1.2%) | 0 (0.0%) |
| Bottled, Tank, or LP Gas | 8 (1.1%) | 7 (3.9%) |
| Electricity | 187 (25.6%) | 164 (91.1%) |
| Fuel Oil or Kerosene | 493 (67.5%) | 9 (5.0%) |
| Coal or Coke | 0 (0.0%) | 0 (0.0%) |
| All other Fuels | 33 (4.5%) | 0 (0.0%) |
| No Fuel Used | 0 (0.0%) | 0 (0.0%) |
| Total | 730 (100.0%) | 180 (100.0%) |
Household Vehicle Usage in Sturbridge
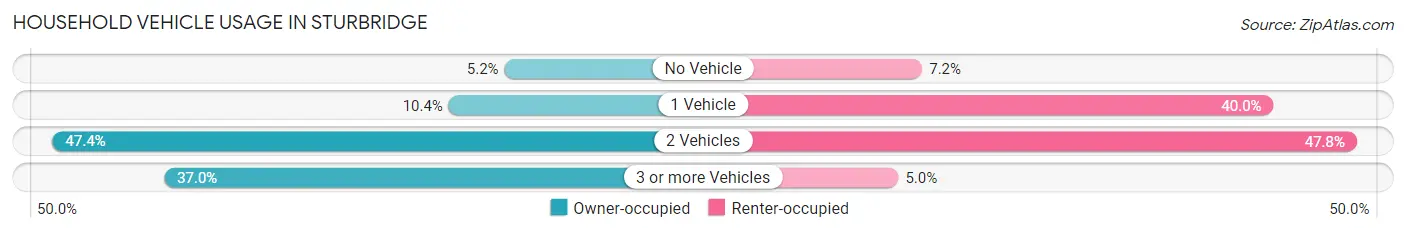
| Vehicles per Household | Owner-occupied | Renter-occupied |
| No Vehicle | 38 (5.2%) | 13 (7.2%) |
| 1 Vehicle | 76 (10.4%) | 72 (40.0%) |
| 2 Vehicles | 346 (47.4%) | 86 (47.8%) |
| 3 or more Vehicles | 270 (37.0%) | 9 (5.0%) |
| Total | 730 (100.0%) | 180 (100.0%) |
Real Estate & Mortgages in Sturbridge
Real Estate and Mortgage Overview in Sturbridge
| Characteristic | Without Mortgage | With Mortgage |
| Housing Units | 166 | 564 |
| Median Property Value | $379,200 | $372,100 |
| Median Household Income | $122,750 | $255 |
| Monthly Housing Costs | $1,021 | $55 |
| Real Estate Taxes | $5,673 | $0 |
Property Value by Mortgage Status in Sturbridge
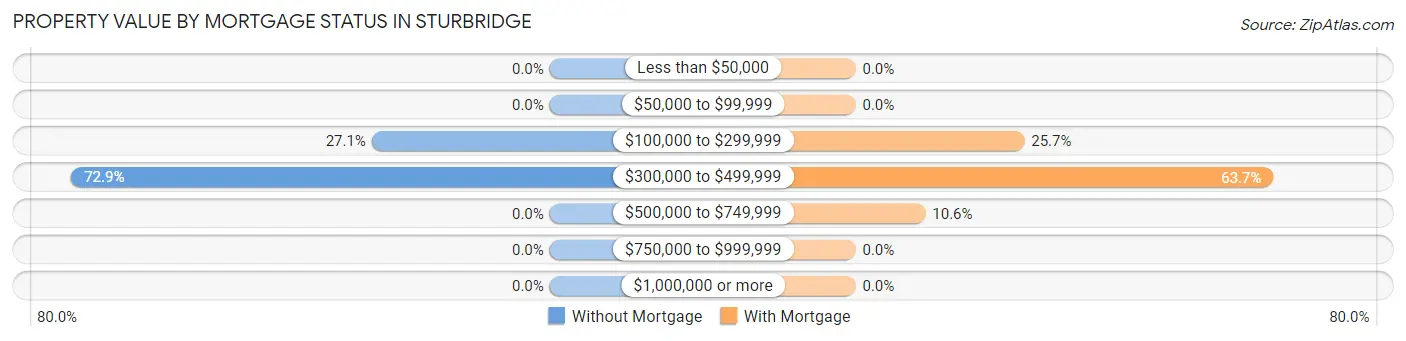
| Property Value | Without Mortgage | With Mortgage |
| Less than $50,000 | 0 (0.0%) | 0 (0.0%) |
| $50,000 to $99,999 | 0 (0.0%) | 0 (0.0%) |
| $100,000 to $299,999 | 45 (27.1%) | 145 (25.7%) |
| $300,000 to $499,999 | 121 (72.9%) | 359 (63.6%) |
| $500,000 to $749,999 | 0 (0.0%) | 60 (10.6%) |
| $750,000 to $999,999 | 0 (0.0%) | 0 (0.0%) |
| $1,000,000 or more | 0 (0.0%) | 0 (0.0%) |
| Total | 166 (100.0%) | 564 (100.0%) |
Household Income by Mortgage Status in Sturbridge
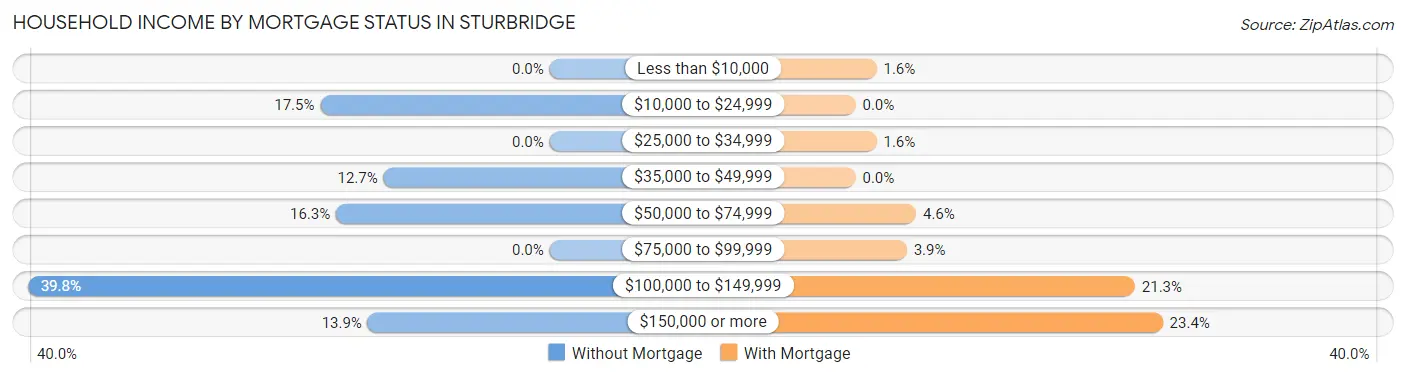
| Household Income | Without Mortgage | With Mortgage |
| Less than $10,000 | 0 (0.0%) | 9 (1.6%) |
| $10,000 to $24,999 | 29 (17.5%) | 0 (0.0%) |
| $25,000 to $34,999 | 0 (0.0%) | 9 (1.6%) |
| $35,000 to $49,999 | 21 (12.7%) | 0 (0.0%) |
| $50,000 to $74,999 | 27 (16.3%) | 26 (4.6%) |
| $75,000 to $99,999 | 0 (0.0%) | 22 (3.9%) |
| $100,000 to $149,999 | 66 (39.8%) | 120 (21.3%) |
| $150,000 or more | 23 (13.9%) | 132 (23.4%) |
| Total | 166 (100.0%) | 564 (100.0%) |
Property Value to Household Income Ratio in Sturbridge
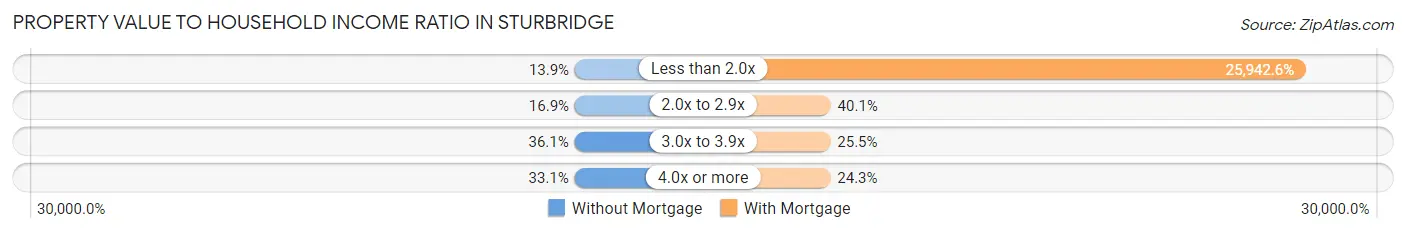
| Value-to-Income Ratio | Without Mortgage | With Mortgage |
| Less than 2.0x | 23 (13.9%) | 146,316 (25,942.5%) |
| 2.0x to 2.9x | 28 (16.9%) | 226 (40.1%) |
| 3.0x to 3.9x | 60 (36.1%) | 144 (25.5%) |
| 4.0x or more | 55 (33.1%) | 137 (24.3%) |
| Total | 166 (100.0%) | 564 (100.0%) |
Real Estate Taxes by Mortgage Status in Sturbridge
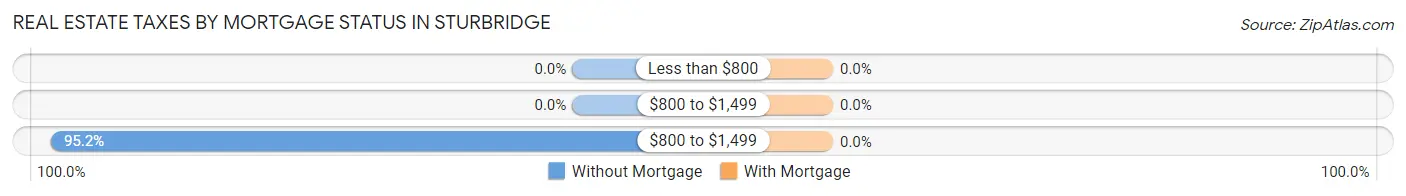
| Property Taxes | Without Mortgage | With Mortgage |
| Less than $800 | 0 (0.0%) | 0 (0.0%) |
| $800 to $1,499 | 0 (0.0%) | 0 (0.0%) |
| $800 to $1,499 | 158 (95.2%) | 0 (0.0%) |
| Total | 166 (100.0%) | 564 (100.0%) |
Health & Disability in Sturbridge
Health Insurance Coverage by Age in Sturbridge
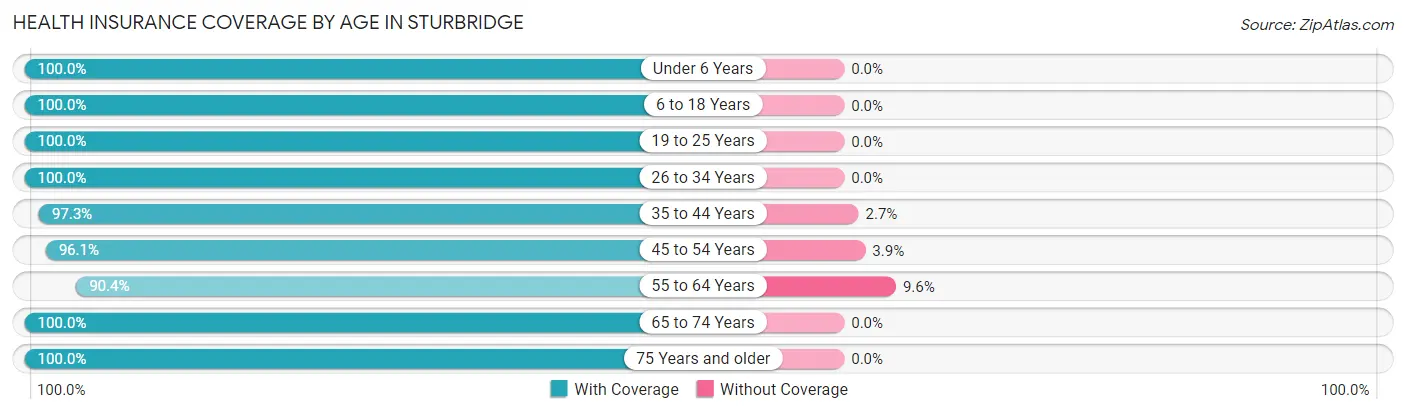
| Age Bracket | With Coverage | Without Coverage |
| Under 6 Years | 116 (100.0%) | 0 (0.0%) |
| 6 to 18 Years | 358 (100.0%) | 0 (0.0%) |
| 19 to 25 Years | 50 (100.0%) | 0 (0.0%) |
| 26 to 34 Years | 250 (100.0%) | 0 (0.0%) |
| 35 to 44 Years | 219 (97.3%) | 6 (2.7%) |
| 45 to 54 Years | 487 (96.1%) | 20 (3.9%) |
| 55 to 64 Years | 319 (90.4%) | 34 (9.6%) |
| 65 to 74 Years | 274 (100.0%) | 0 (0.0%) |
| 75 Years and older | 89 (100.0%) | 0 (0.0%) |
| Total | 2,162 (97.3%) | 60 (2.7%) |
Health Insurance Coverage by Citizenship Status in Sturbridge
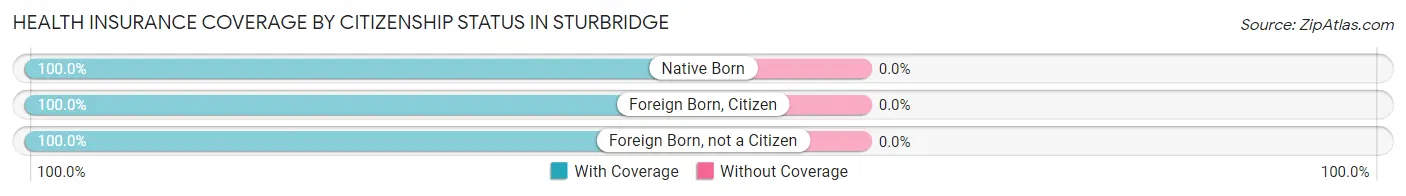
| Citizenship Status | With Coverage | Without Coverage |
| Native Born | 116 (100.0%) | 0 (0.0%) |
| Foreign Born, Citizen | 358 (100.0%) | 0 (0.0%) |
| Foreign Born, not a Citizen | 50 (100.0%) | 0 (0.0%) |
Health Insurance Coverage by Household Income in Sturbridge
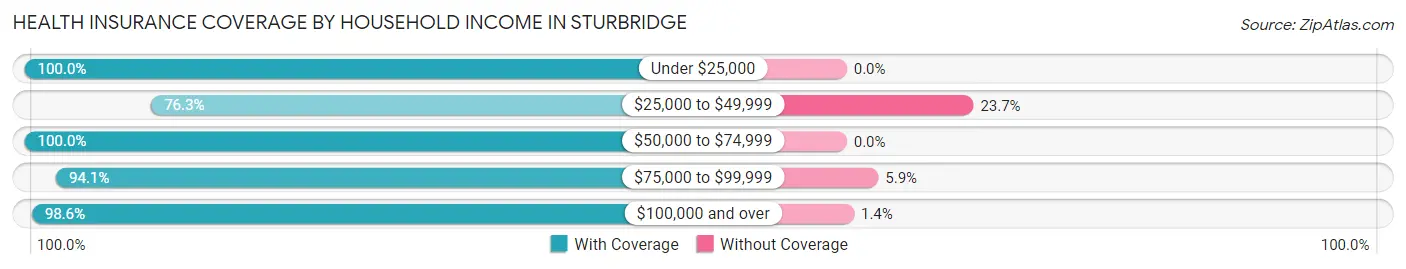
| Household Income | With Coverage | Without Coverage |
| Under $25,000 | 46 (100.0%) | 0 (0.0%) |
| $25,000 to $49,999 | 45 (76.3%) | 14 (23.7%) |
| $50,000 to $74,999 | 199 (100.0%) | 0 (0.0%) |
| $75,000 to $99,999 | 414 (94.1%) | 26 (5.9%) |
| $100,000 and over | 1,451 (98.6%) | 20 (1.4%) |
Public vs Private Health Insurance Coverage by Age in Sturbridge
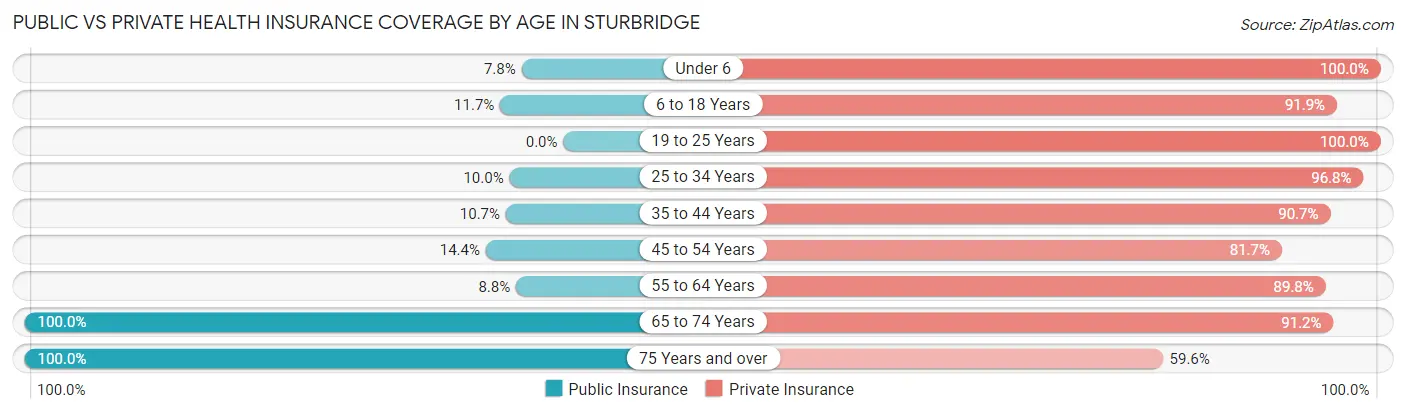
| Age Bracket | Public Insurance | Private Insurance |
| Under 6 | 9 (7.8%) | 116 (100.0%) |
| 6 to 18 Years | 42 (11.7%) | 329 (91.9%) |
| 19 to 25 Years | 0 (0.0%) | 50 (100.0%) |
| 25 to 34 Years | 25 (10.0%) | 242 (96.8%) |
| 35 to 44 Years | 24 (10.7%) | 204 (90.7%) |
| 45 to 54 Years | 73 (14.4%) | 414 (81.7%) |
| 55 to 64 Years | 31 (8.8%) | 317 (89.8%) |
| 65 to 74 Years | 274 (100.0%) | 250 (91.2%) |
| 75 Years and over | 89 (100.0%) | 53 (59.6%) |
| Total | 567 (25.5%) | 1,975 (88.9%) |
Disability Status by Sex by Age in Sturbridge
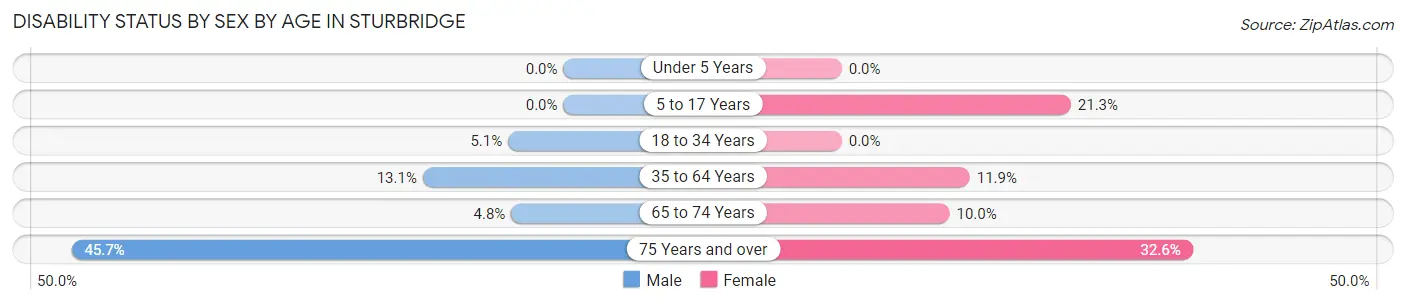
| Age Bracket | Male | Female |
| Under 5 Years | 0 (0.0%) | 0 (0.0%) |
| 5 to 17 Years | 0 (0.0%) | 27 (21.3%) |
| 18 to 34 Years | 8 (5.1%) | 0 (0.0%) |
| 35 to 64 Years | 68 (13.1%) | 67 (11.9%) |
| 65 to 74 Years | 6 (4.8%) | 15 (10.0%) |
| 75 Years and over | 21 (45.7%) | 14 (32.6%) |
Disability Class by Sex by Age in Sturbridge
Disability Class: Hearing Difficulty
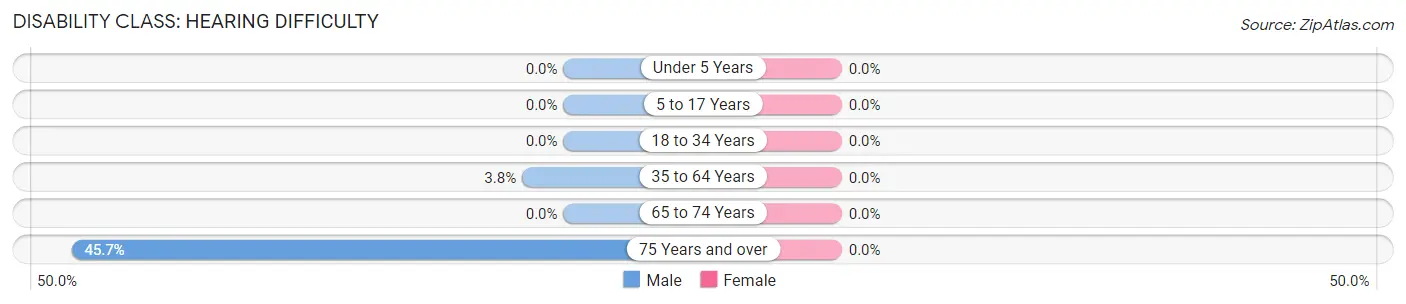
| Age Bracket | Male | Female |
| Under 5 Years | 0 (0.0%) | 0 (0.0%) |
| 5 to 17 Years | 0 (0.0%) | 0 (0.0%) |
| 18 to 34 Years | 0 (0.0%) | 0 (0.0%) |
| 35 to 64 Years | 20 (3.8%) | 0 (0.0%) |
| 65 to 74 Years | 0 (0.0%) | 0 (0.0%) |
| 75 Years and over | 21 (45.7%) | 0 (0.0%) |
Disability Class: Vision Difficulty
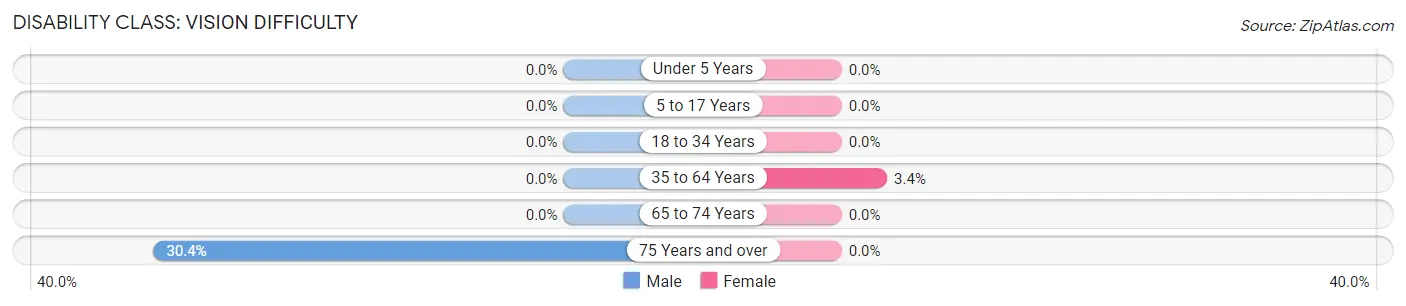
| Age Bracket | Male | Female |
| Under 5 Years | 0 (0.0%) | 0 (0.0%) |
| 5 to 17 Years | 0 (0.0%) | 0 (0.0%) |
| 18 to 34 Years | 0 (0.0%) | 0 (0.0%) |
| 35 to 64 Years | 0 (0.0%) | 19 (3.4%) |
| 65 to 74 Years | 0 (0.0%) | 0 (0.0%) |
| 75 Years and over | 14 (30.4%) | 0 (0.0%) |
Disability Class: Cognitive Difficulty
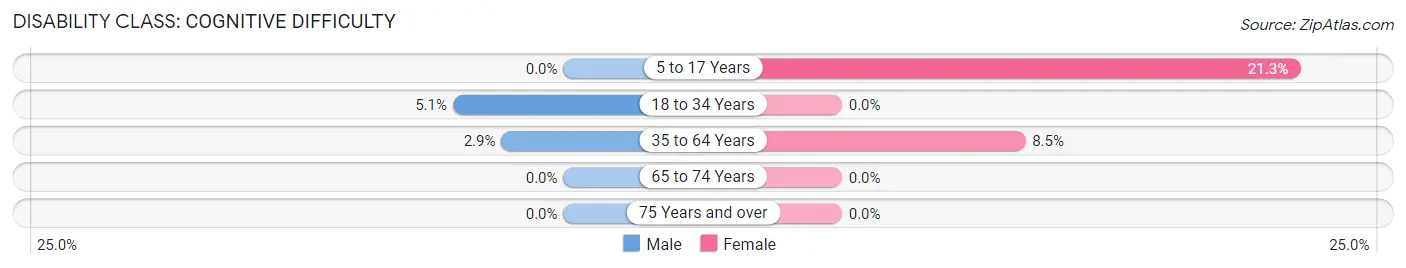
| Age Bracket | Male | Female |
| 5 to 17 Years | 0 (0.0%) | 27 (21.3%) |
| 18 to 34 Years | 8 (5.1%) | 0 (0.0%) |
| 35 to 64 Years | 15 (2.9%) | 48 (8.5%) |
| 65 to 74 Years | 0 (0.0%) | 0 (0.0%) |
| 75 Years and over | 0 (0.0%) | 0 (0.0%) |
Disability Class: Ambulatory Difficulty
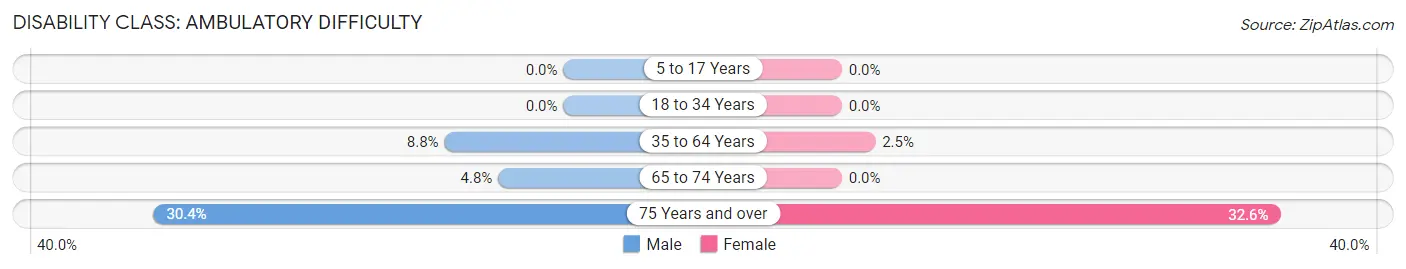
| Age Bracket | Male | Female |
| 5 to 17 Years | 0 (0.0%) | 0 (0.0%) |
| 18 to 34 Years | 0 (0.0%) | 0 (0.0%) |
| 35 to 64 Years | 46 (8.8%) | 14 (2.5%) |
| 65 to 74 Years | 6 (4.8%) | 0 (0.0%) |
| 75 Years and over | 14 (30.4%) | 14 (32.6%) |
Disability Class: Self-Care Difficulty
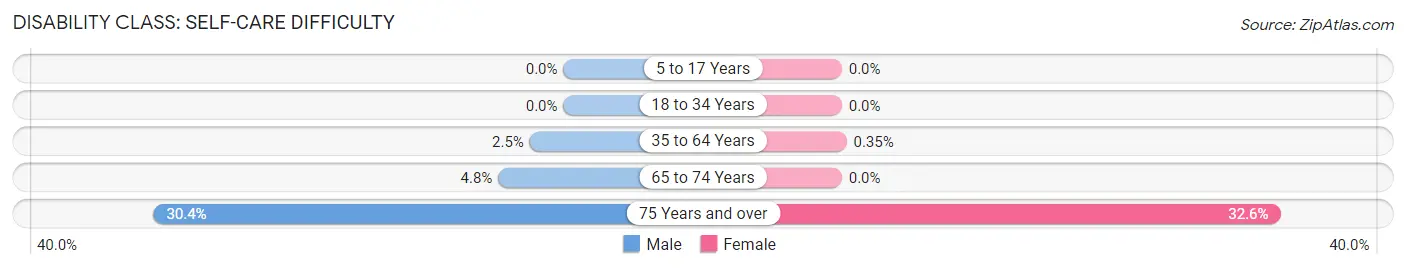
| Age Bracket | Male | Female |
| 5 to 17 Years | 0 (0.0%) | 0 (0.0%) |
| 18 to 34 Years | 0 (0.0%) | 0 (0.0%) |
| 35 to 64 Years | 13 (2.5%) | 2 (0.4%) |
| 65 to 74 Years | 6 (4.8%) | 0 (0.0%) |
| 75 Years and over | 14 (30.4%) | 14 (32.6%) |
Technology Access in Sturbridge
Computing Device Access in Sturbridge
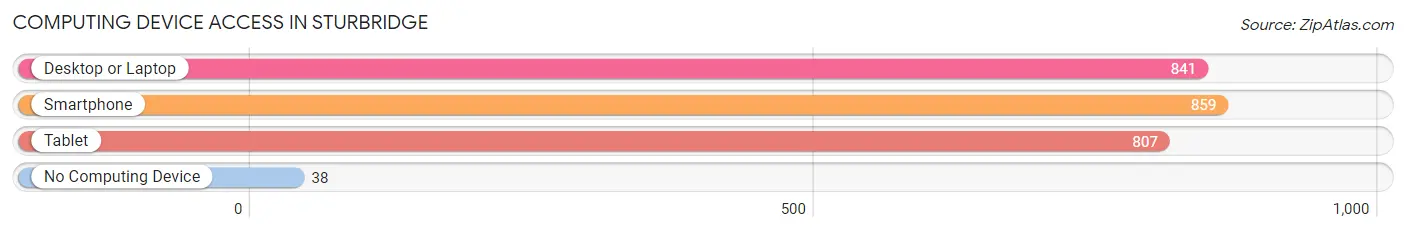
| Device Type | # Households | % Households |
| Desktop or Laptop | 841 | 92.4% |
| Smartphone | 859 | 94.4% |
| Tablet | 807 | 88.7% |
| No Computing Device | 38 | 4.2% |
| Total | 910 | 100.0% |
Internet Access in Sturbridge
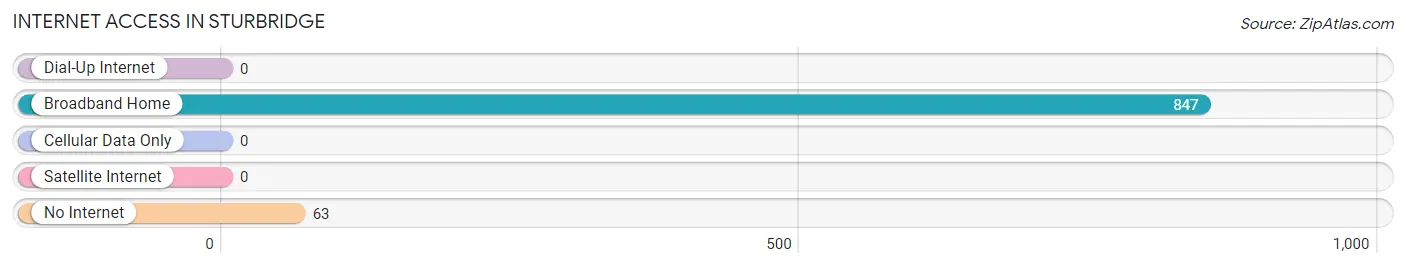
| Internet Type | # Households | % Households |
| Dial-Up Internet | 0 | 0.0% |
| Broadband Home | 847 | 93.1% |
| Cellular Data Only | 0 | 0.0% |
| Satellite Internet | 0 | 0.0% |
| No Internet | 63 | 6.9% |
| Total | 910 | 100.0% |
Sturbridge Summary
Sturbridge is a town located in Worcester County, Massachusetts, United States. It is situated in the southeastern part of the state, about 40 miles southwest of Boston. The town was first settled in 1729 and was officially incorporated in 1738. As of the 2010 census, the town had a population of 9,268.
History
Sturbridge was first settled in 1729 by a group of settlers from Connecticut. The town was originally part of the town of Brookfield, but was incorporated as its own town in 1738. The town was named after Stourbridge, England, which was the hometown of one of the original settlers.
The town was an agricultural community for much of its history, with the main crops being corn, potatoes, and hay. The town also had a number of mills, including a gristmill, sawmill, and a fulling mill.
In the 19th century, the town became a popular tourist destination due to its proximity to Boston and its rural setting. The town was home to a number of inns and hotels, and was a popular destination for day trips.
Geography
Sturbridge is located in southeastern Massachusetts, about 40 miles southwest of Boston. The town is bordered by the towns of Brookfield to the north, Charlton to the east, Southbridge to the south, and Brimfield and Holland to the west.
The town is located in the Quinebaug River Valley, and is drained by the Quinebaug River and its tributaries. The town is mostly flat, with some hills in the northern part of town. The highest point in town is the summit of West Hill, which is about 500 feet above sea level.
Economy
Sturbridge is a primarily residential community, with a small commercial center. The town is home to a number of small businesses, including restaurants, retail stores, and service providers. The town is also home to a number of light industrial and manufacturing businesses.
The town is home to the Old Sturbridge Village, a living history museum that recreates life in a rural New England village in the 1830s. The museum is a popular tourist destination, and is one of the largest living history museums in the United States.
Demographics
As of the 2010 census, there were 9,268 people, 3,541 households, and 2,541 families residing in the town. The population density was 517.3 people per square mile (199.7/km2). There were 3,717 housing units at an average density of 206.3 per square mile (79.6/km2). The racial makeup of the town was 96.2% White, 0.7% African American, 0.2% Native American, 0.9% Asian, 0.1% Pacific Islander, 0.7% from other races, and 1.2% from two or more races. Hispanic or Latino of any race were 2.2% of the population.
There were 3,541 households, out of which 33.2% had children under the age of 18 living with them, 57.2% were married couples living together, 9.7% had a female householder with no husband present, and 29.2% were non-families. 24.2% of all households were made up of individuals, and 10.2% had someone living alone who was 65 years of age or older. The average household size was 2.60 and the average family size was 3.11.
In the town, the population was spread out, with 25.7% under the age of 18, 6.2% from 18 to 24, 28.7% from 25 to 44, 25.3% from 45 to 64, and 14.1% who were 65 years of age or older. The median age was 39 years. For every 100 females, there were 95.2 males. For every 100 females age 18 and over, there were 92.2 males.
The median income for a household in the town was $60,938, and the median income for a family was $71,944. Males had a median income of $50,917 versus $35,938 for females. The per capita income for the town was $27,945. About 3.2% of families and 4.7% of the population were below the poverty line, including 5.2% of those under age 18 and 4.2% of those age 65 or over.
Common Questions
What is Per Capita Income in Sturbridge?
Per Capita income in Sturbridge is $56,770.
What is the Median Family Income in Sturbridge?
Median Family Income in Sturbridge is $139,219.
What is the Median Household income in Sturbridge?
Median Household Income in Sturbridge is $123,375.
What is Income or Wage Gap in Sturbridge?
Income or Wage Gap in Sturbridge is 19.5%.
Women in Sturbridge earn 80.5 cents for every dollar earned by a man.
What is Inequality or Gini Index in Sturbridge?
Inequality or Gini Index in Sturbridge is 0.35.
What is the Total Population of Sturbridge?
Total Population of Sturbridge is 2,222.
What is the Total Male Population of Sturbridge?
Total Male Population of Sturbridge is 1,125.
What is the Total Female Population of Sturbridge?
Total Female Population of Sturbridge is 1,097.
What is the Ratio of Males per 100 Females in Sturbridge?
There are 102.55 Males per 100 Females in Sturbridge.
What is the Ratio of Females per 100 Males in Sturbridge?
There are 97.51 Females per 100 Males in Sturbridge.
What is the Median Population Age in Sturbridge?
Median Population Age in Sturbridge is 49.2 Years.
What is the Average Family Size in Sturbridge
Average Family Size in Sturbridge is 2.8 People.
What is the Average Household Size in Sturbridge
Average Household Size in Sturbridge is 2.4 People.
How Large is the Labor Force in Sturbridge?
There are 1,177 People in the Labor Forcein in Sturbridge.
What is the Percentage of People in the Labor Force in Sturbridge?
64.3% of People are in the Labor Force in Sturbridge.