Harwich Port, MA Map & Demographics
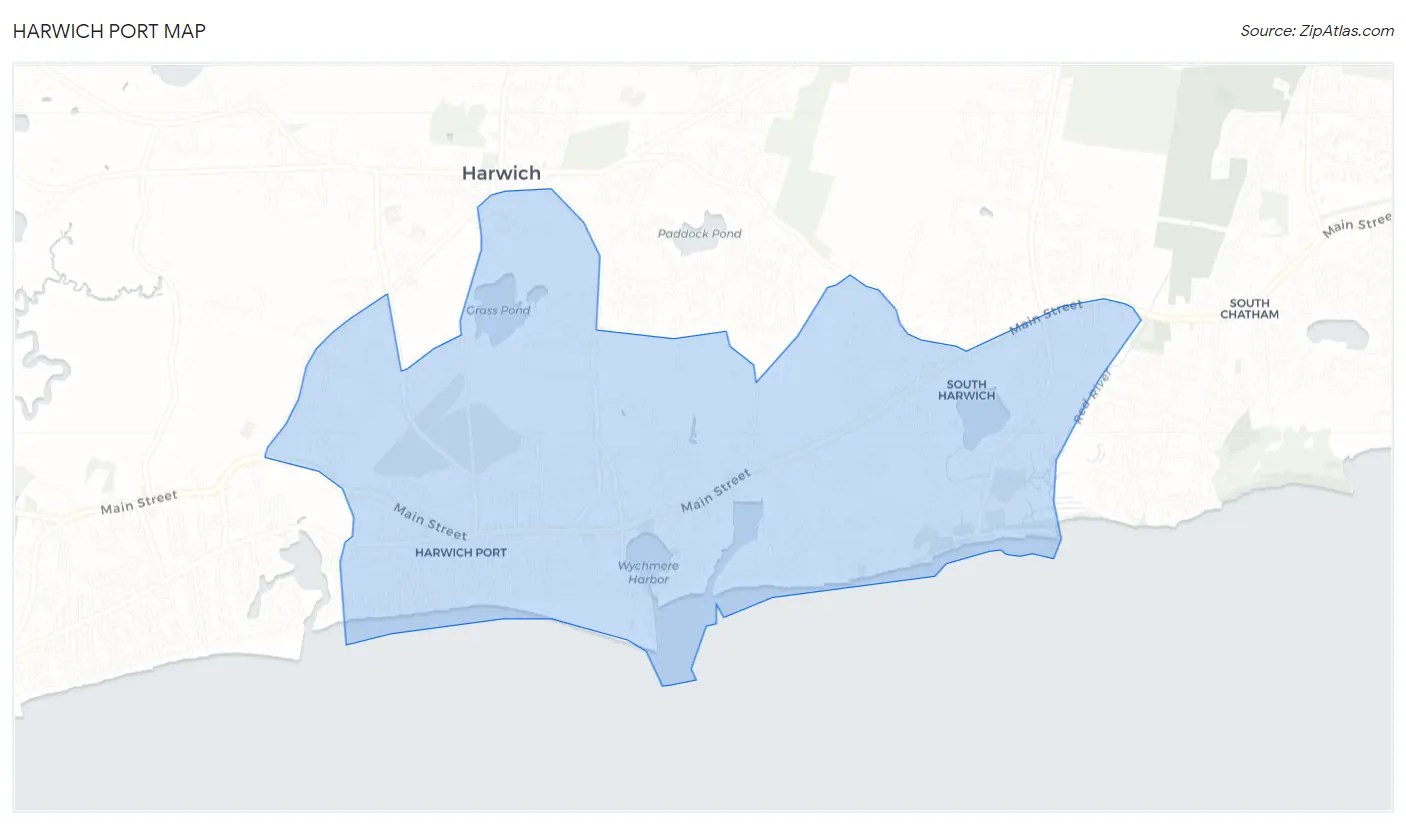
Harwich Port Map
Harwich Port Overview
$57,956
PER CAPITA INCOME
$101,042
AVG FAMILY INCOME
$58,854
AVG HOUSEHOLD INCOME
0.54
INEQUALITY / GINI INDEX
2,252
TOTAL POPULATION
1,107
MALE POPULATION
1,145
FEMALE POPULATION
96.68
MALES / 100 FEMALES
103.43
FEMALES / 100 MALES
63.5
MEDIAN AGE
2.6
AVG FAMILY SIZE
1.8
AVG HOUSEHOLD SIZE
1,094
LABOR FORCE [ PEOPLE ]
52.4%
PERCENT IN LABOR FORCE
4.3%
UNEMPLOYMENT RATE
Harwich Port Zip Codes
Harwich Port Area Codes
Income in Harwich Port
Income Overview in Harwich Port
Per Capita Income in Harwich Port is $57,956, while median incomes of families and households are $101,042 and $58,854 respectively.
| Characteristic | Number | Measure |
| Per Capita Income | 2,252 | $57,956 |
| Median Family Income | 542 | $101,042 |
| Mean Family Income | 542 | $164,709 |
| Median Household Income | 1,199 | $58,854 |
| Mean Household Income | 1,199 | $100,849 |
| Income Deficit | 542 | $0 |
| Wage / Income Gap (%) | 2,252 | 0.00% |
| Wage / Income Gap ($) | 2,252 | 100.00¢ per $1 |
| Gini / Inequality Index | 2,252 | 0.54 |
Earnings by Sex in Harwich Port
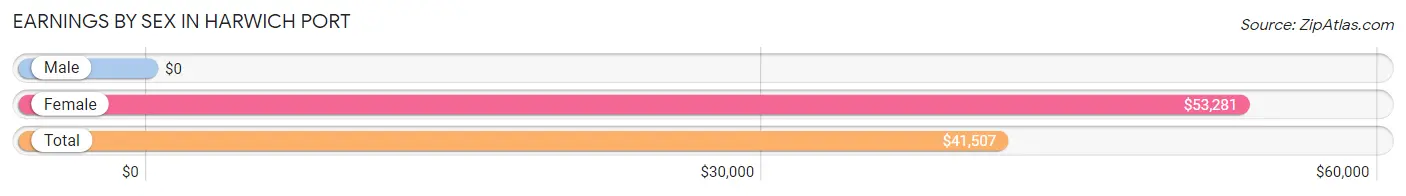
| Sex | Number | Average Earnings |
| Male | 647 (60.0%) | $0 |
| Female | 432 (40.0%) | $53,281 |
| Total | 1,079 (100.0%) | $41,507 |
Earnings by Sex by Income Bracket in Harwich Port
The most common earnings brackets in Harwich Port are $22,500 to $24,999 for men (144 | 22.3%) and $100,000+ for women (114 | 26.4%).
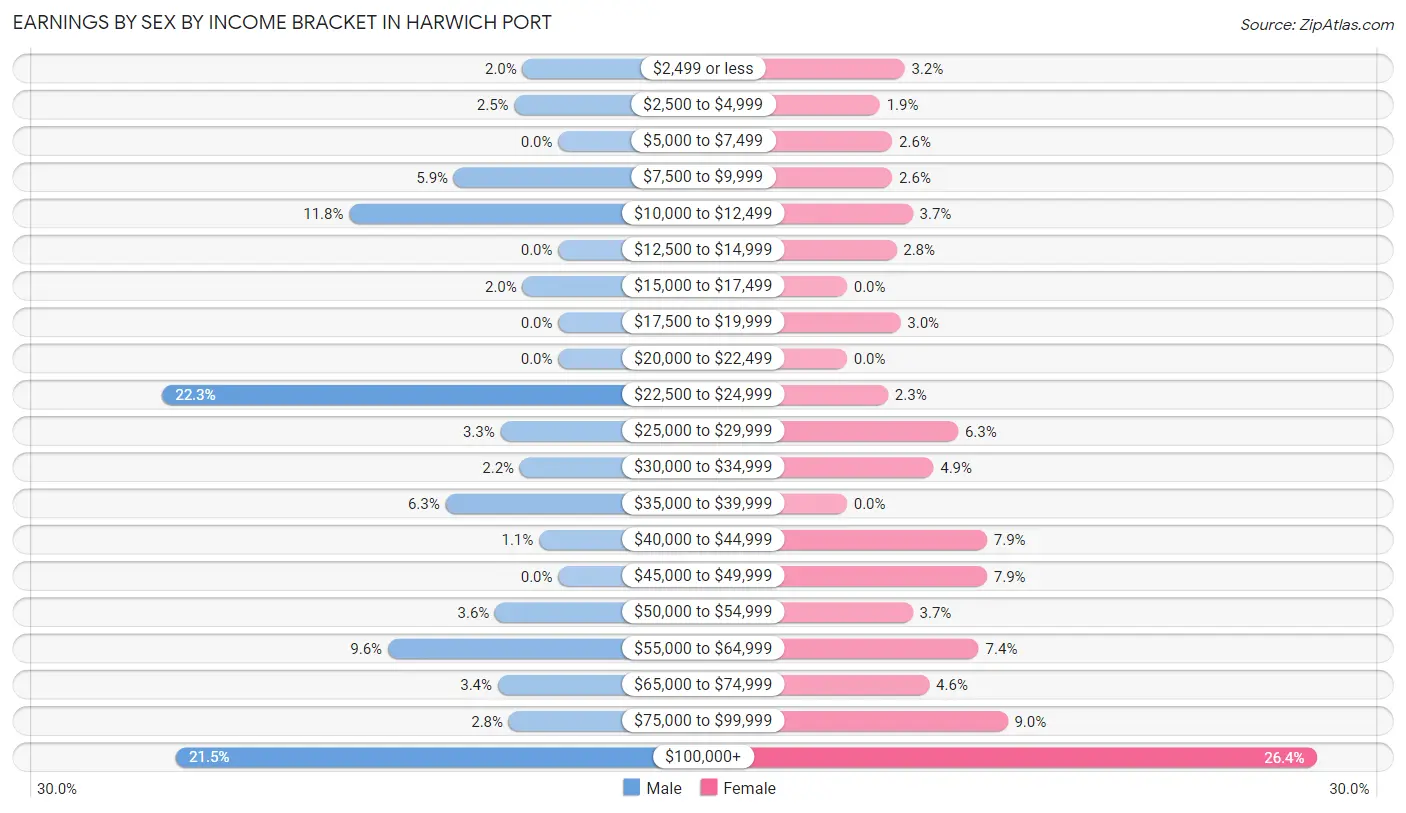
| Income | Male | Female |
| $2,499 or less | 13 (2.0%) | 14 (3.2%) |
| $2,500 to $4,999 | 16 (2.5%) | 8 (1.8%) |
| $5,000 to $7,499 | 0 (0.0%) | 11 (2.5%) |
| $7,500 to $9,999 | 38 (5.9%) | 11 (2.5%) |
| $10,000 to $12,499 | 76 (11.7%) | 16 (3.7%) |
| $12,500 to $14,999 | 0 (0.0%) | 12 (2.8%) |
| $15,000 to $17,499 | 13 (2.0%) | 0 (0.0%) |
| $17,500 to $19,999 | 0 (0.0%) | 13 (3.0%) |
| $20,000 to $22,499 | 0 (0.0%) | 0 (0.0%) |
| $22,500 to $24,999 | 144 (22.3%) | 10 (2.3%) |
| $25,000 to $29,999 | 21 (3.3%) | 27 (6.2%) |
| $30,000 to $34,999 | 14 (2.2%) | 21 (4.9%) |
| $35,000 to $39,999 | 41 (6.3%) | 0 (0.0%) |
| $40,000 to $44,999 | 7 (1.1%) | 34 (7.9%) |
| $45,000 to $49,999 | 0 (0.0%) | 34 (7.9%) |
| $50,000 to $54,999 | 23 (3.5%) | 16 (3.7%) |
| $55,000 to $64,999 | 62 (9.6%) | 32 (7.4%) |
| $65,000 to $74,999 | 22 (3.4%) | 20 (4.6%) |
| $75,000 to $99,999 | 18 (2.8%) | 39 (9.0%) |
| $100,000+ | 139 (21.5%) | 114 (26.4%) |
| Total | 647 (100.0%) | 432 (100.0%) |
Earnings by Sex by Educational Attainment in Harwich Port
Average earnings in Harwich Port are $60,043 for men and $53,281 for women, a difference of 11.3%. Men with an educational attainment of high school diploma enjoy the highest average annual earnings of $61,379, while those with high school diploma education earn the least with $61,379. Women with an educational attainment of college or associate's degree earn the most with the average annual earnings of $55,664, while those with graduate degree education have the smallest earnings of $30,682.
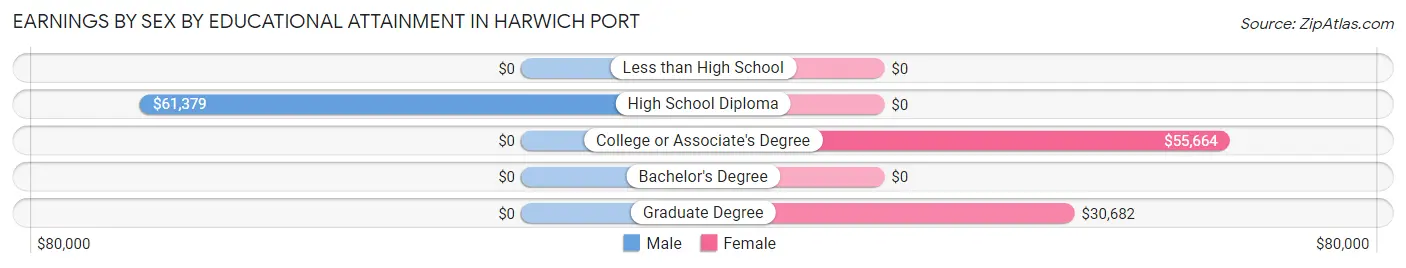
| Educational Attainment | Male Income | Female Income |
| Less than High School | - | - |
| High School Diploma | $61,379 | $0 |
| College or Associate's Degree | - | - |
| Bachelor's Degree | - | - |
| Graduate Degree | - | - |
| Total | $60,043 | $53,281 |
Family Income in Harwich Port
Family Income Brackets in Harwich Port
According to the Harwich Port family income data, there are 137 families falling into the $200,000+ income range, which is the most common income bracket and makes up 25.3% of all families.
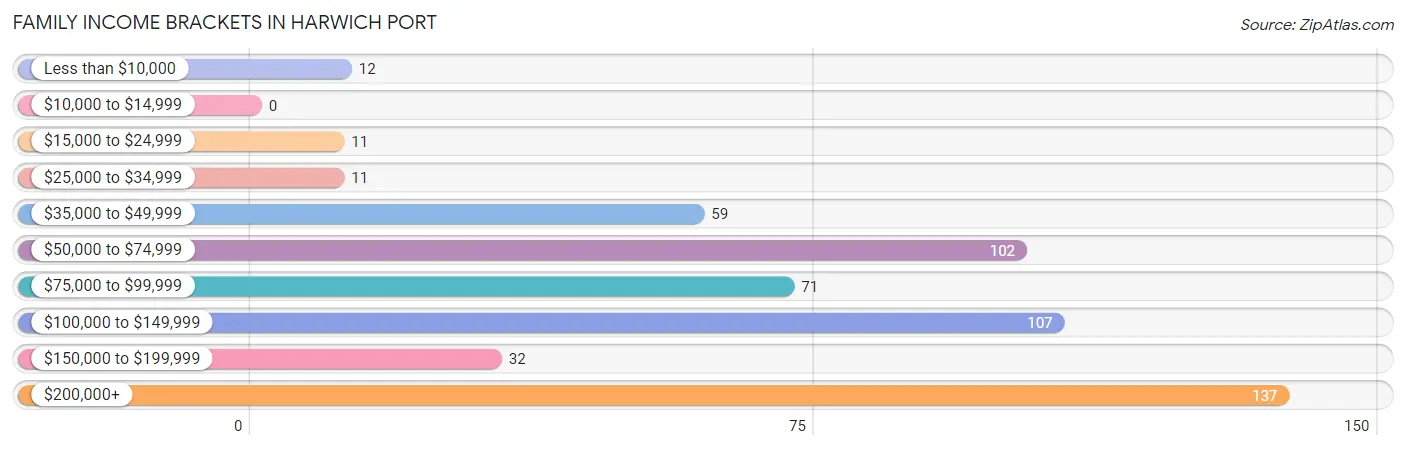
| Income Bracket | # Families | % Families |
| Less than $10,000 | 12 | 2.2% |
| $10,000 to $14,999 | 0 | 0.0% |
| $15,000 to $24,999 | 11 | 2.0% |
| $25,000 to $34,999 | 11 | 2.0% |
| $35,000 to $49,999 | 59 | 10.9% |
| $50,000 to $74,999 | 102 | 18.8% |
| $75,000 to $99,999 | 71 | 13.1% |
| $100,000 to $149,999 | 107 | 19.7% |
| $150,000 to $199,999 | 32 | 5.9% |
| $200,000+ | 137 | 25.3% |
Family Income by Famaliy Size in Harwich Port
2-person families (386 | 71.2%) account for the highest median family income in Harwich Port with $79,107 per family, while 2-person families (386 | 71.2%) have the highest median income of $39,554 per family member.
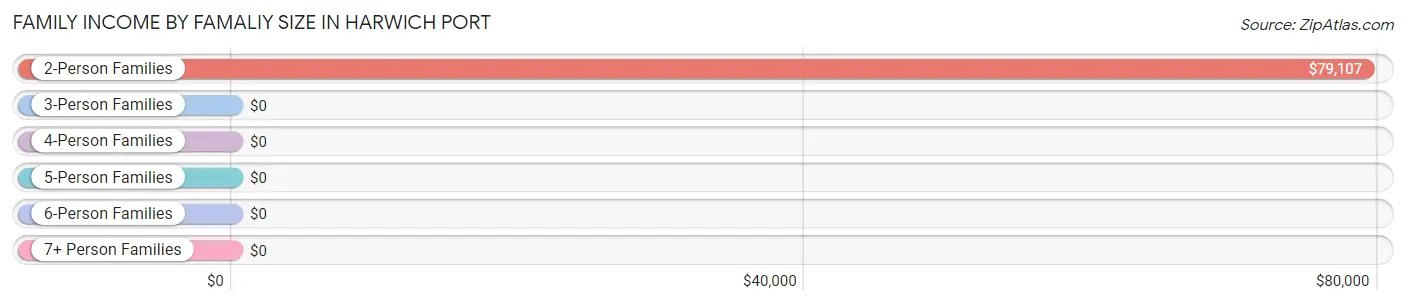
| Income Bracket | # Families | Median Income |
| 2-Person Families | 386 (71.2%) | $79,107 |
| 3-Person Families | 127 (23.4%) | $0 |
| 4-Person Families | 21 (3.9%) | $0 |
| 5-Person Families | 0 (0.0%) | $0 |
| 6-Person Families | 8 (1.5%) | $0 |
| 7+ Person Families | 0 (0.0%) | $0 |
| Total | 542 (100.0%) | $101,042 |
Family Income by Number of Earners in Harwich Port
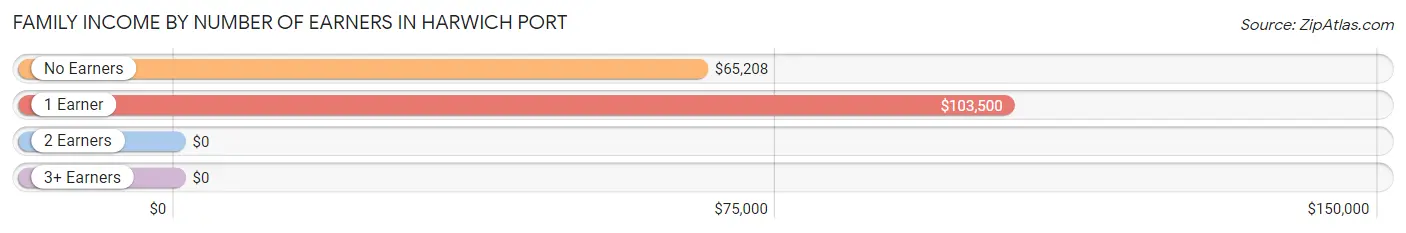
| Number of Earners | # Families | Median Income |
| No Earners | 128 (23.6%) | $65,208 |
| 1 Earner | 242 (44.7%) | $103,500 |
| 2 Earners | 147 (27.1%) | $0 |
| 3+ Earners | 25 (4.6%) | $0 |
| Total | 542 (100.0%) | $101,042 |
Household Income in Harwich Port
Household Income Brackets in Harwich Port
With 246 households falling in the category, the $35,000 to $49,999 income range is the most frequent in Harwich Port, accounting for 20.5% of all households. In contrast, only 30 households (2.5%) fall into the less than $10,000 income bracket, making it the least populous group.
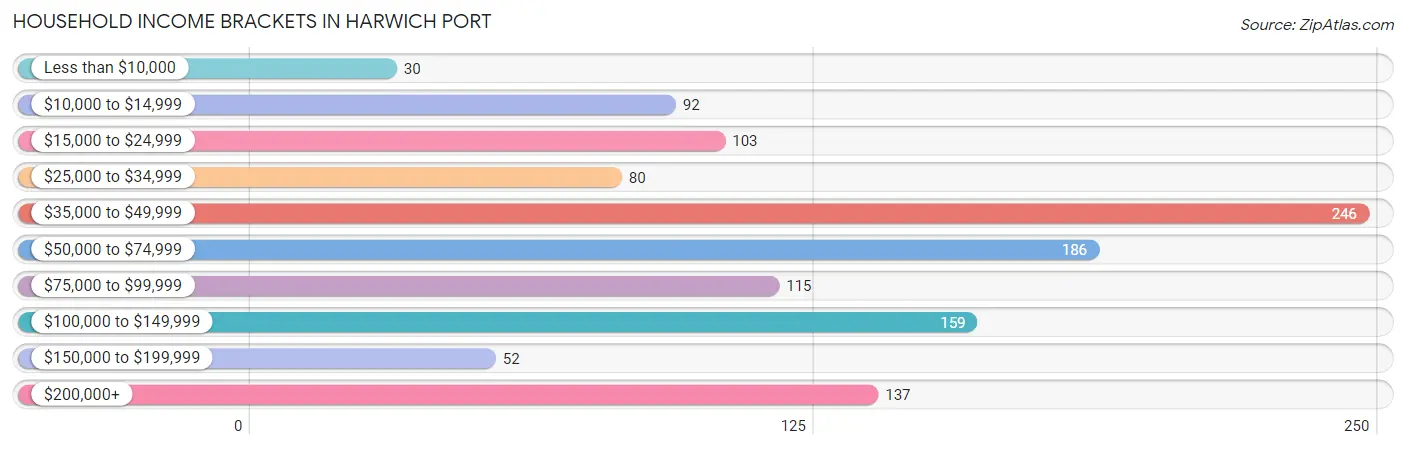
| Income Bracket | # Households | % Households |
| Less than $10,000 | 30 | 2.5% |
| $10,000 to $14,999 | 92 | 7.7% |
| $15,000 to $24,999 | 103 | 8.6% |
| $25,000 to $34,999 | 80 | 6.7% |
| $35,000 to $49,999 | 246 | 20.5% |
| $50,000 to $74,999 | 186 | 15.5% |
| $75,000 to $99,999 | 115 | 9.6% |
| $100,000 to $149,999 | 159 | 13.3% |
| $150,000 to $199,999 | 52 | 4.3% |
| $200,000+ | 137 | 11.4% |
Household Income by Householder Age in Harwich Port
The median household income in Harwich Port is $58,854, with the highest median household income of $91,574 found in the 45 to 64 years age bracket for the primary householder. A total of 330 households (27.5%) fall into this category.
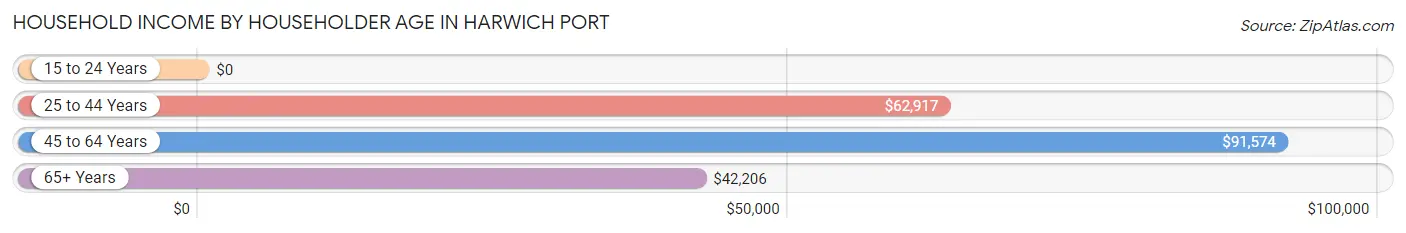
| Income Bracket | # Households | Median Income |
| 15 to 24 Years | 0 (0.0%) | $0 |
| 25 to 44 Years | 143 (11.9%) | $62,917 |
| 45 to 64 Years | 330 (27.5%) | $91,574 |
| 65+ Years | 726 (60.6%) | $42,206 |
| Total | 1,199 (100.0%) | $58,854 |
Poverty in Harwich Port
Income Below Poverty by Sex and Age in Harwich Port
With 11.4% poverty level for males and 6.5% for females among the residents of Harwich Port, 16 and 17 year old males and 55 to 64 year old females are the most vulnerable to poverty, with 7 males (100.0%) and 25 females (16.1%) in their respective age groups living below the poverty level.
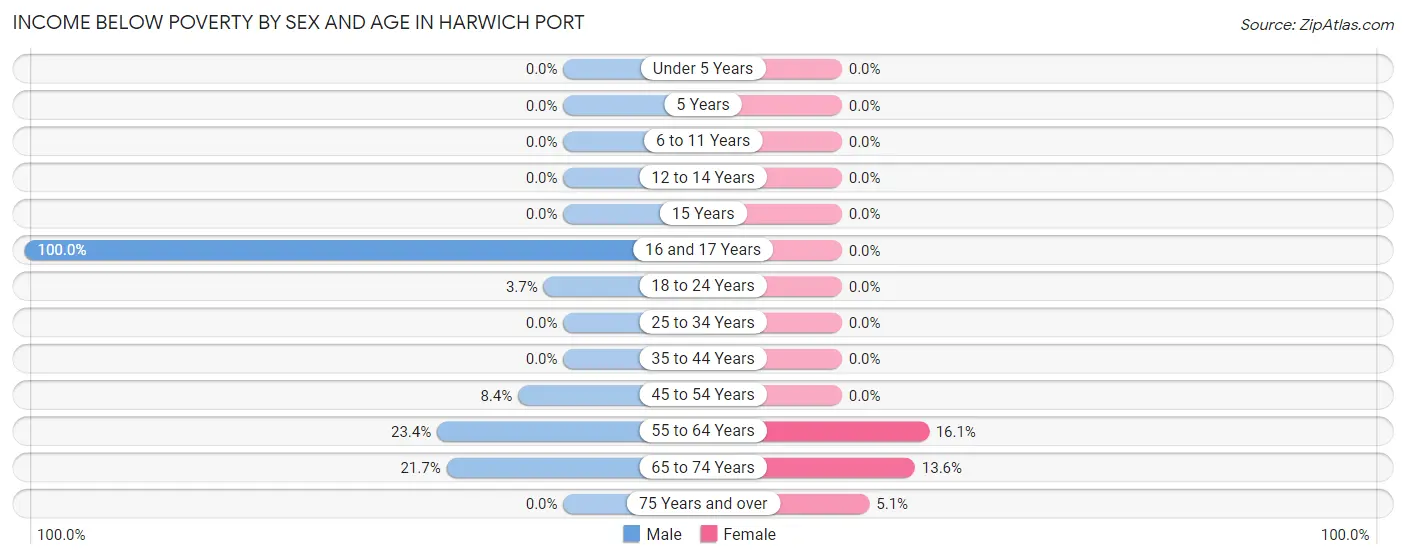
| Age Bracket | Male | Female |
| Under 5 Years | 0 (0.0%) | 0 (0.0%) |
| 5 Years | 0 (0.0%) | 0 (0.0%) |
| 6 to 11 Years | 0 (0.0%) | 0 (0.0%) |
| 12 to 14 Years | 0 (0.0%) | 0 (0.0%) |
| 15 Years | 0 (0.0%) | 0 (0.0%) |
| 16 and 17 Years | 7 (100.0%) | 0 (0.0%) |
| 18 to 24 Years | 7 (3.7%) | 0 (0.0%) |
| 25 to 34 Years | 0 (0.0%) | 0 (0.0%) |
| 35 to 44 Years | 0 (0.0%) | 0 (0.0%) |
| 45 to 54 Years | 9 (8.4%) | 0 (0.0%) |
| 55 to 64 Years | 64 (23.4%) | 25 (16.1%) |
| 65 to 74 Years | 36 (21.7%) | 24 (13.6%) |
| 75 Years and over | 0 (0.0%) | 23 (5.1%) |
| Total | 123 (11.4%) | 72 (6.5%) |
Income Above Poverty by Sex and Age in Harwich Port
According to the poverty statistics in Harwich Port, males aged under 5 years and females aged under 5 years are the age groups that are most secure financially, with 100.0% of males and 100.0% of females in these age groups living above the poverty line.
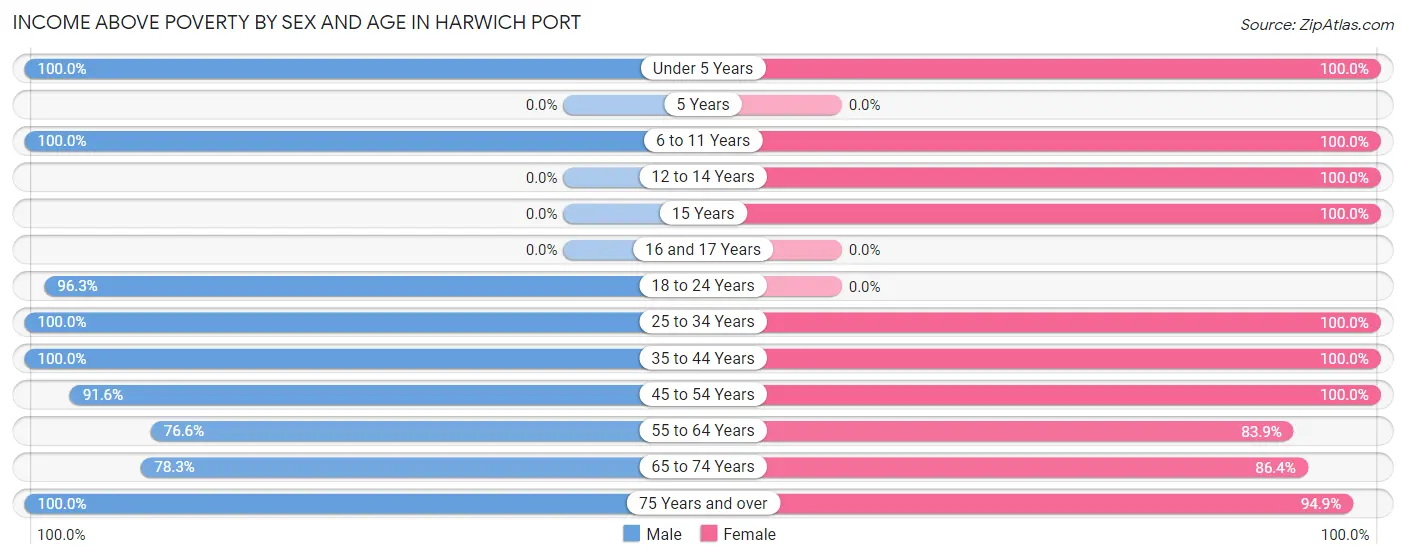
| Age Bracket | Male | Female |
| Under 5 Years | 9 (100.0%) | 10 (100.0%) |
| 5 Years | 0 (0.0%) | 0 (0.0%) |
| 6 to 11 Years | 37 (100.0%) | 30 (100.0%) |
| 12 to 14 Years | 0 (0.0%) | 13 (100.0%) |
| 15 Years | 0 (0.0%) | 38 (100.0%) |
| 16 and 17 Years | 0 (0.0%) | 0 (0.0%) |
| 18 to 24 Years | 183 (96.3%) | 0 (0.0%) |
| 25 to 34 Years | 86 (100.0%) | 61 (100.0%) |
| 35 to 44 Years | 19 (100.0%) | 78 (100.0%) |
| 45 to 54 Years | 98 (91.6%) | 99 (100.0%) |
| 55 to 64 Years | 209 (76.6%) | 130 (83.9%) |
| 65 to 74 Years | 130 (78.3%) | 153 (86.4%) |
| 75 Years and over | 187 (100.0%) | 427 (94.9%) |
| Total | 958 (88.6%) | 1,039 (93.5%) |
Income Below Poverty Among Married-Couple Families in Harwich Port
The poverty statistics for married-couple families in Harwich Port show that 3.4% or 12 of the total 350 families live below the poverty line. Families with no children have the highest poverty rate of 4.1%, comprising of 12 families. On the other hand, families with 1 or 2 children have the lowest poverty rate of 0.0%, which includes 0 families.
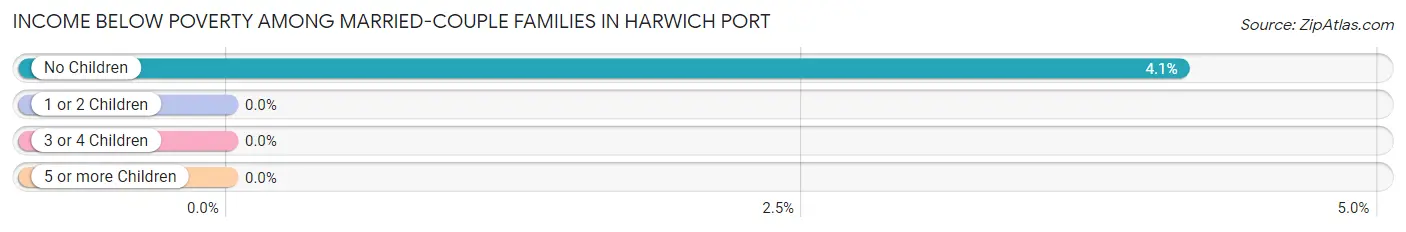
| Children | Above Poverty | Below Poverty |
| No Children | 278 (95.9%) | 12 (4.1%) |
| 1 or 2 Children | 60 (100.0%) | 0 (0.0%) |
| 3 or 4 Children | 0 (0.0%) | 0 (0.0%) |
| 5 or more Children | 0 (0.0%) | 0 (0.0%) |
| Total | 338 (96.6%) | 12 (3.4%) |
Income Below Poverty Among Single-Parent Households in Harwich Port
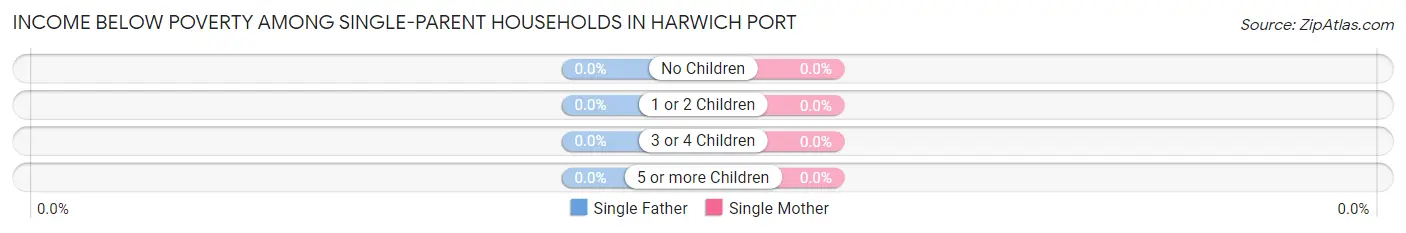
| Children | Single Father | Single Mother |
| No Children | 0 (0.0%) | 0 (0.0%) |
| 1 or 2 Children | 0 (0.0%) | 0 (0.0%) |
| 3 or 4 Children | 0 (0.0%) | 0 (0.0%) |
| 5 or more Children | 0 (0.0%) | 0 (0.0%) |
| Total | 0 (0.0%) | 0 (0.0%) |
Income Below Poverty Among Married-Couple vs Single-Parent Households in Harwich Port
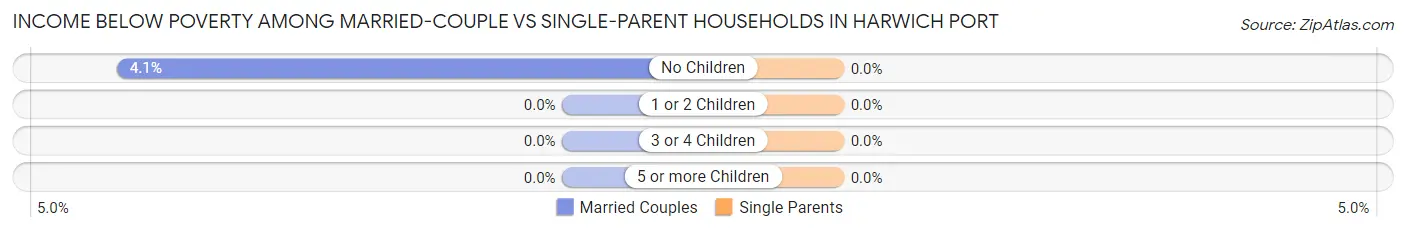
| Children | Married-Couple Families | Single-Parent Households |
| No Children | 12 (4.1%) | 0 (0.0%) |
| 1 or 2 Children | 0 (0.0%) | 0 (0.0%) |
| 3 or 4 Children | 0 (0.0%) | 0 (0.0%) |
| 5 or more Children | 0 (0.0%) | 0 (0.0%) |
| Total | 12 (3.4%) | 0 (0.0%) |
Race in Harwich Port
The most populous races in Harwich Port are White / Caucasian (2,141 | 95.1%), Two or more Races (55 | 2.4%), and Hispanic or Latino (37 | 1.6%).
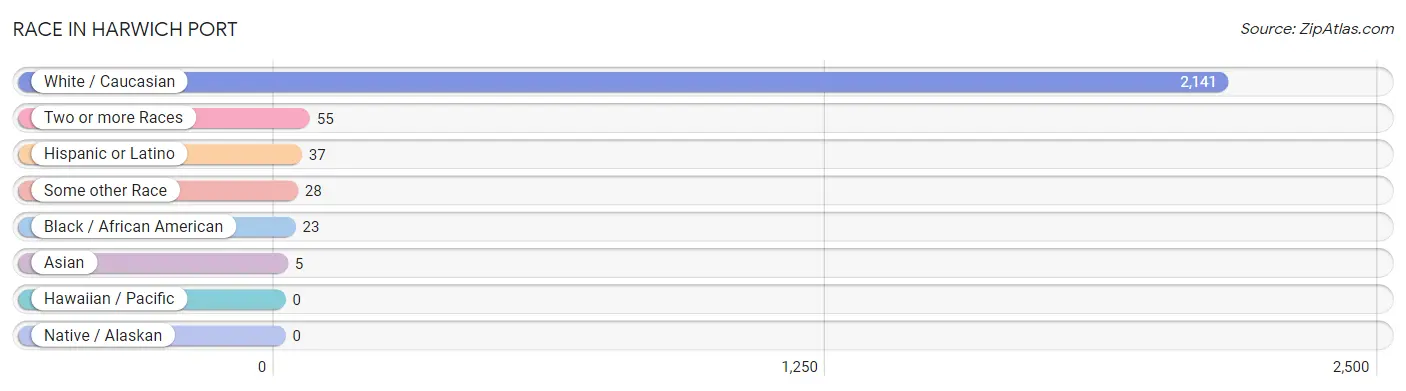
| Race | # Population | % Population |
| Asian | 5 | 0.2% |
| Black / African American | 23 | 1.0% |
| Hawaiian / Pacific | 0 | 0.0% |
| Hispanic or Latino | 37 | 1.6% |
| Native / Alaskan | 0 | 0.0% |
| White / Caucasian | 2,141 | 95.1% |
| Two or more Races | 55 | 2.4% |
| Some other Race | 28 | 1.2% |
| Total | 2,252 | 100.0% |
Ancestry in Harwich Port
The most populous ancestries reported in Harwich Port are Irish (723 | 32.1%), English (379 | 16.8%), Italian (214 | 9.5%), American (207 | 9.2%), and Swedish (161 | 7.1%), together accounting for 74.8% of all Harwich Port residents.
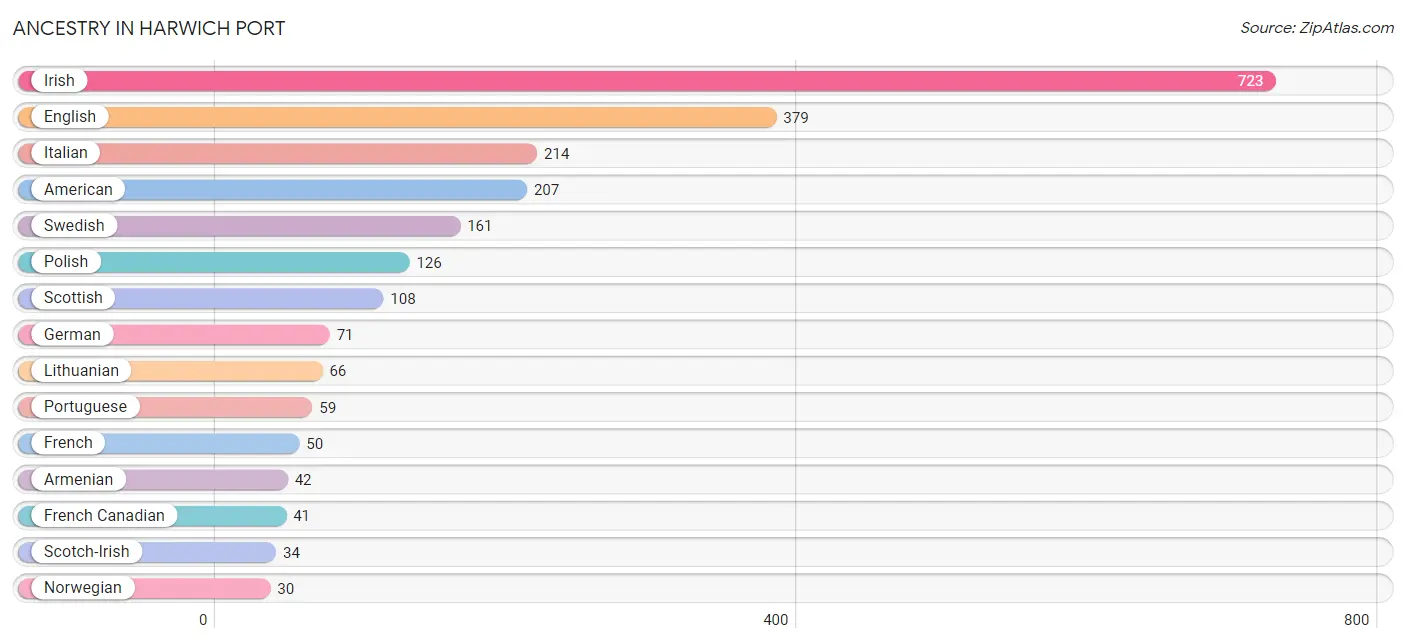
| Ancestry | # Population | % Population |
| American | 207 | 9.2% |
| Arab | 24 | 1.1% |
| Armenian | 42 | 1.9% |
| Austrian | 10 | 0.4% |
| Brazilian | 11 | 0.5% |
| British | 11 | 0.5% |
| Canadian | 16 | 0.7% |
| Cape Verdean | 18 | 0.8% |
| Colombian | 10 | 0.4% |
| Czech | 10 | 0.4% |
| Eastern European | 11 | 0.5% |
| English | 379 | 16.8% |
| European | 21 | 0.9% |
| Finnish | 24 | 1.1% |
| French | 50 | 2.2% |
| French Canadian | 41 | 1.8% |
| German | 71 | 3.2% |
| Irish | 723 | 32.1% |
| Italian | 214 | 9.5% |
| Lebanese | 24 | 1.1% |
| Lithuanian | 66 | 2.9% |
| Mexican | 10 | 0.4% |
| Mongolian | 5 | 0.2% |
| Northern European | 11 | 0.5% |
| Norwegian | 30 | 1.3% |
| Okinawan | 5 | 0.2% |
| Peruvian | 10 | 0.4% |
| Polish | 126 | 5.6% |
| Portuguese | 59 | 2.6% |
| Russian | 20 | 0.9% |
| Scotch-Irish | 34 | 1.5% |
| Scottish | 108 | 4.8% |
| South American | 27 | 1.2% |
| Subsaharan African | 18 | 0.8% |
| Swedish | 161 | 7.1% |
| Venezuelan | 7 | 0.3% |
| Welsh | 11 | 0.5% | View All 37 Rows |
Immigrants in Harwich Port
The most numerous immigrant groups reported in Harwich Port came from Europe (41 | 1.8%), Latin America (32 | 1.4%), South America (32 | 1.4%), Western Europe (21 | 0.9%), and Asia (16 | 0.7%), together accounting for 6.3% of all Harwich Port residents.
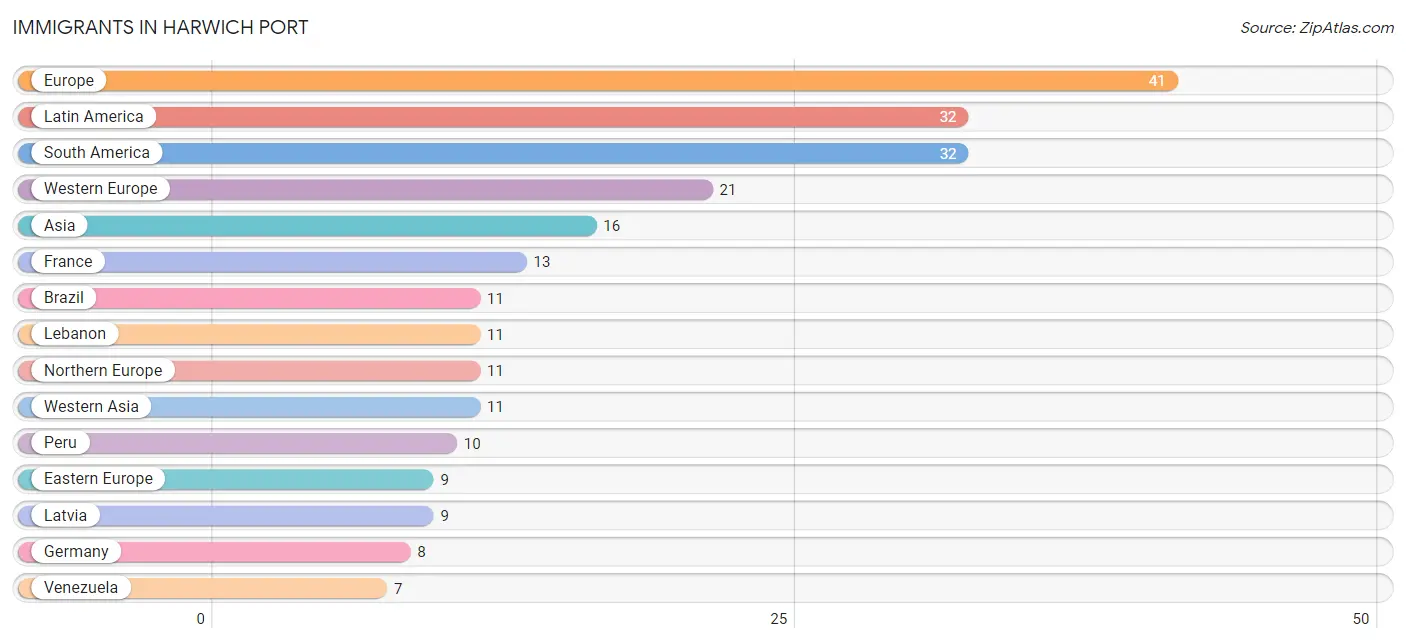
| Immigration Origin | # Population | % Population |
| Asia | 16 | 0.7% |
| Brazil | 11 | 0.5% |
| Colombia | 4 | 0.2% |
| Eastern Europe | 9 | 0.4% |
| Europe | 41 | 1.8% |
| France | 13 | 0.6% |
| Germany | 8 | 0.4% |
| Latin America | 32 | 1.4% |
| Latvia | 9 | 0.4% |
| Lebanon | 11 | 0.5% |
| Malaysia | 5 | 0.2% |
| Northern Europe | 11 | 0.5% |
| Peru | 10 | 0.4% |
| South America | 32 | 1.4% |
| South Eastern Asia | 5 | 0.2% |
| Venezuela | 7 | 0.3% |
| Western Asia | 11 | 0.5% |
| Western Europe | 21 | 0.9% | View All 18 Rows |
Sex and Age in Harwich Port
Sex and Age in Harwich Port
The most populous age groups in Harwich Port are 20 to 24 Years (170 | 15.4%) for men and 75 to 79 Years (200 | 17.5%) for women.
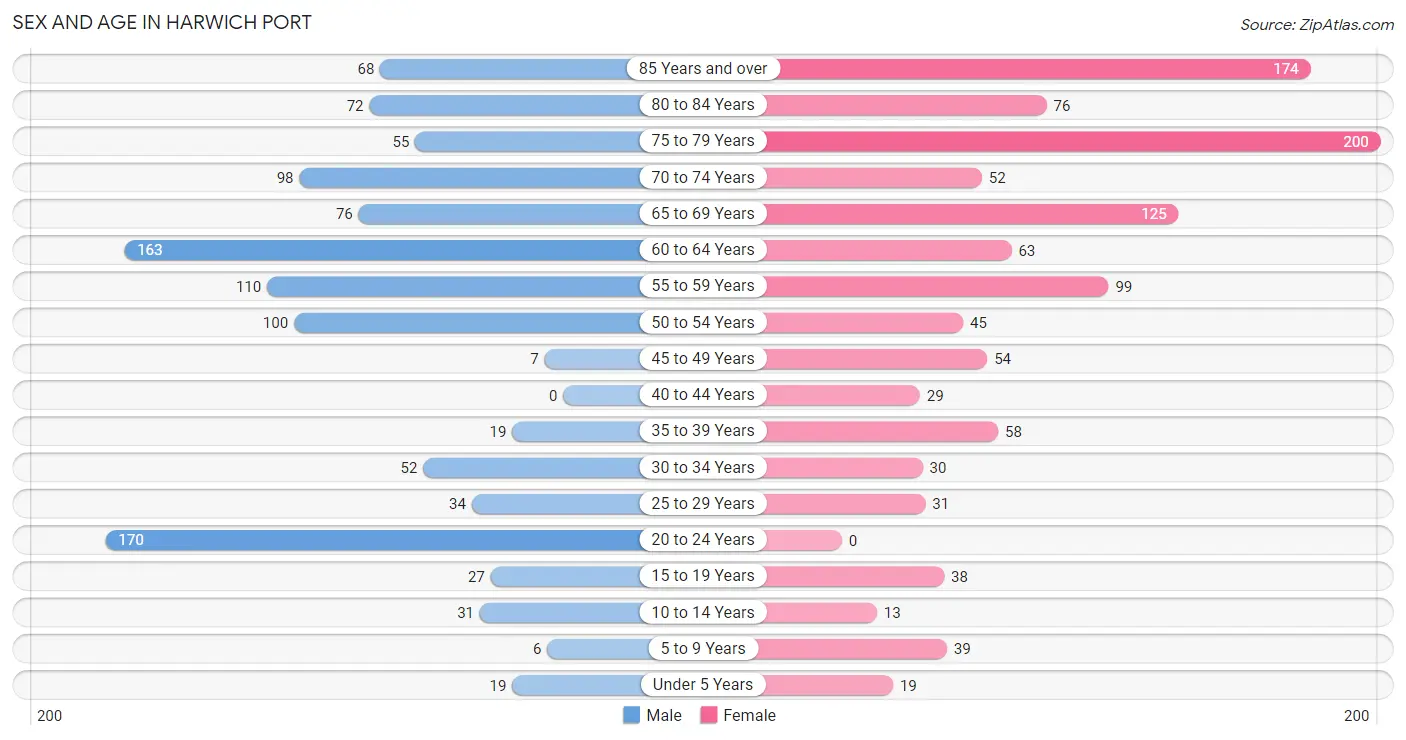
| Age Bracket | Male | Female |
| Under 5 Years | 19 (1.7%) | 19 (1.7%) |
| 5 to 9 Years | 6 (0.5%) | 39 (3.4%) |
| 10 to 14 Years | 31 (2.8%) | 13 (1.1%) |
| 15 to 19 Years | 27 (2.4%) | 38 (3.3%) |
| 20 to 24 Years | 170 (15.4%) | 0 (0.0%) |
| 25 to 29 Years | 34 (3.1%) | 31 (2.7%) |
| 30 to 34 Years | 52 (4.7%) | 30 (2.6%) |
| 35 to 39 Years | 19 (1.7%) | 58 (5.1%) |
| 40 to 44 Years | 0 (0.0%) | 29 (2.5%) |
| 45 to 49 Years | 7 (0.6%) | 54 (4.7%) |
| 50 to 54 Years | 100 (9.0%) | 45 (3.9%) |
| 55 to 59 Years | 110 (9.9%) | 99 (8.6%) |
| 60 to 64 Years | 163 (14.7%) | 63 (5.5%) |
| 65 to 69 Years | 76 (6.9%) | 125 (10.9%) |
| 70 to 74 Years | 98 (8.8%) | 52 (4.5%) |
| 75 to 79 Years | 55 (5.0%) | 200 (17.5%) |
| 80 to 84 Years | 72 (6.5%) | 76 (6.6%) |
| 85 Years and over | 68 (6.1%) | 174 (15.2%) |
| Total | 1,107 (100.0%) | 1,145 (100.0%) |
Families and Households in Harwich Port
Median Family Size in Harwich Port
The median family size in Harwich Port is 2.65 persons per family, with married-couple families (350 | 64.6%) accounting for the largest median family size of 2.82 persons per family. On the other hand, single female/mother families (148 | 27.3%) represent the smallest median family size with 2.26 persons per family.
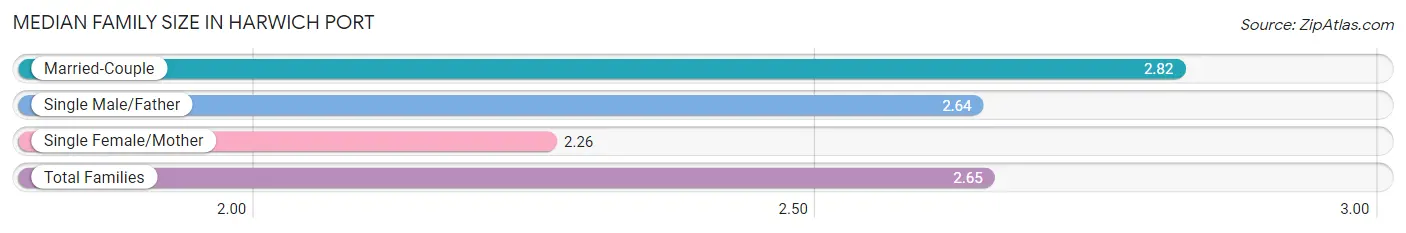
| Family Type | # Families | Family Size |
| Married-Couple | 350 (64.6%) | 2.82 |
| Single Male/Father | 44 (8.1%) | 2.64 |
| Single Female/Mother | 148 (27.3%) | 2.26 |
| Total Families | 542 (100.0%) | 2.65 |
Median Household Size in Harwich Port
The median household size in Harwich Port is 1.82 persons per household, with married-couple households (350 | 29.2%) accounting for the largest median household size of 2.87 persons per household. non-family households (657 | 54.8%) represent the smallest median household size with 1.10 persons per household.
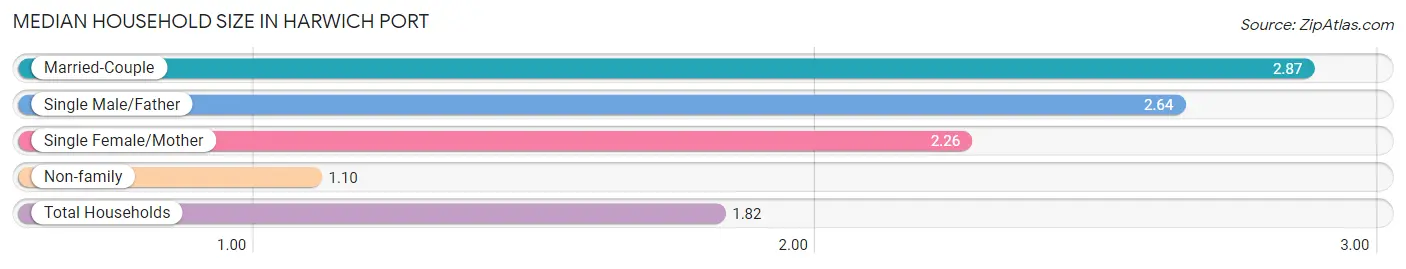
| Household Type | # Households | Household Size |
| Married-Couple | 350 (29.2%) | 2.87 |
| Single Male/Father | 44 (3.7%) | 2.64 |
| Single Female/Mother | 148 (12.3%) | 2.26 |
| Non-family | 657 (54.8%) | 1.10 |
| Total Households | 1,199 (100.0%) | 1.82 |
Household Size by Marriage Status in Harwich Port
Out of a total of 1,199 households in Harwich Port, 542 (45.2%) are family households, while 657 (54.8%) are nonfamily households. The most numerous type of family households are 2-person households, comprising 386, and the most common type of nonfamily households are 1-person households, comprising 591.
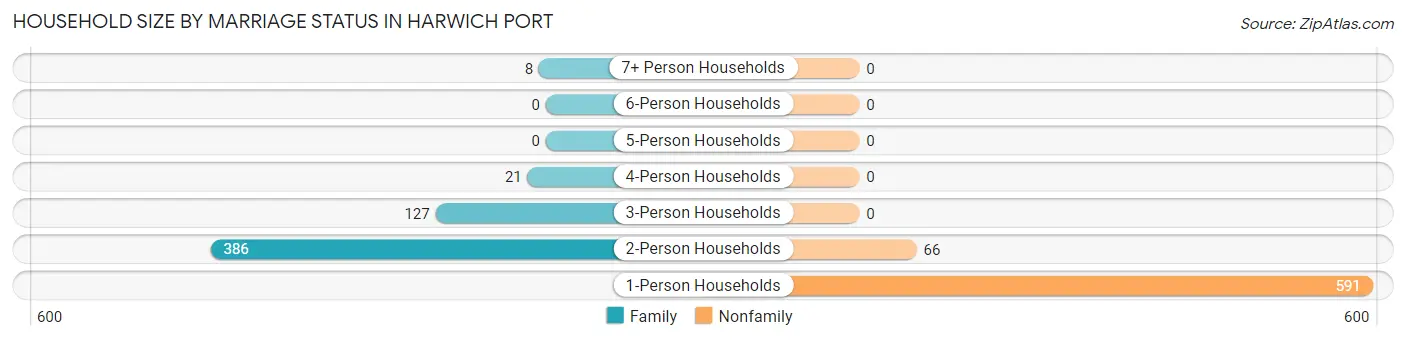
| Household Size | Family Households | Nonfamily Households |
| 1-Person Households | - | 591 (49.3%) |
| 2-Person Households | 386 (32.2%) | 66 (5.5%) |
| 3-Person Households | 127 (10.6%) | 0 (0.0%) |
| 4-Person Households | 21 (1.8%) | 0 (0.0%) |
| 5-Person Households | 0 (0.0%) | 0 (0.0%) |
| 6-Person Households | 0 (0.0%) | 0 (0.0%) |
| 7+ Person Households | 8 (0.7%) | 0 (0.0%) |
| Total | 542 (45.2%) | 657 (54.8%) |
Female Fertility in Harwich Port
Fertility by Age in Harwich Port
Average fertility rate in Harwich Port is 43.0 births per 1,000 women. Women in the age bracket of 20 to 34 years have the highest fertility rate with 180.0 births per 1,000 women. Women in the age bracket of 20 to 34 years acount for 100.0% of all women with births.
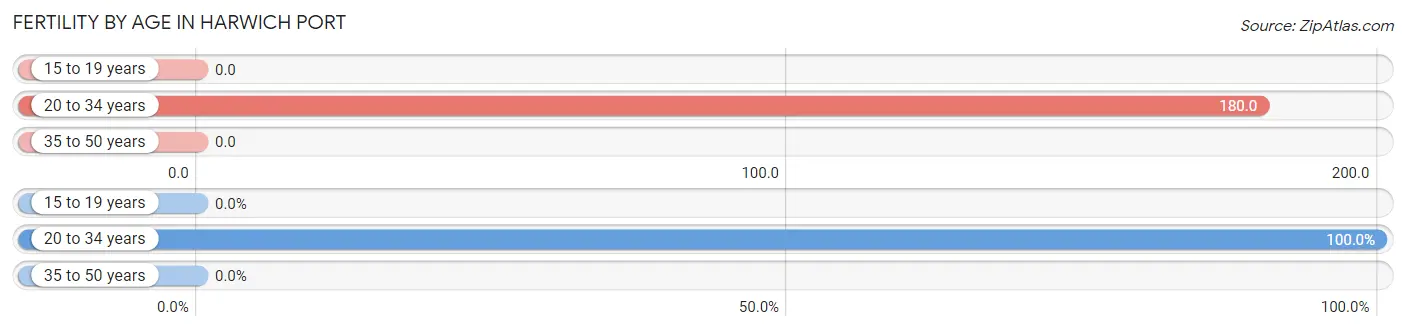
| Age Bracket | Women with Births | Births / 1,000 Women |
| 15 to 19 years | 0 (0.0%) | 0.0 |
| 20 to 34 years | 11 (100.0%) | 180.0 |
| 35 to 50 years | 0 (0.0%) | 0.0 |
| Total | 11 (100.0%) | 43.0 |
Fertility by Age by Marriage Status in Harwich Port
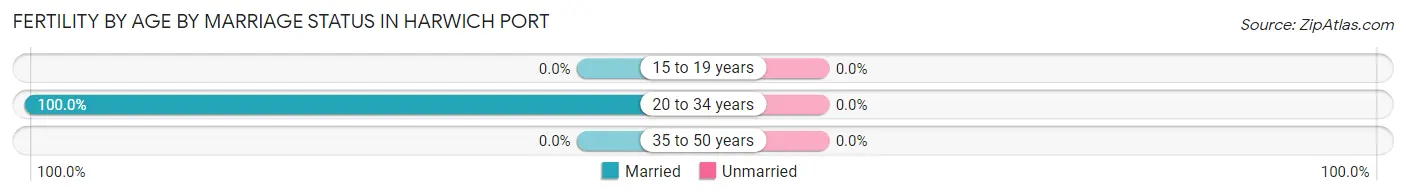
| Age Bracket | Married | Unmarried |
| 15 to 19 years | 0 (0.0%) | 0 (0.0%) |
| 20 to 34 years | 11 (100.0%) | 0 (0.0%) |
| 35 to 50 years | 0 (0.0%) | 0 (0.0%) |
| Total | 11 (100.0%) | 0 (0.0%) |
Fertility by Education in Harwich Port
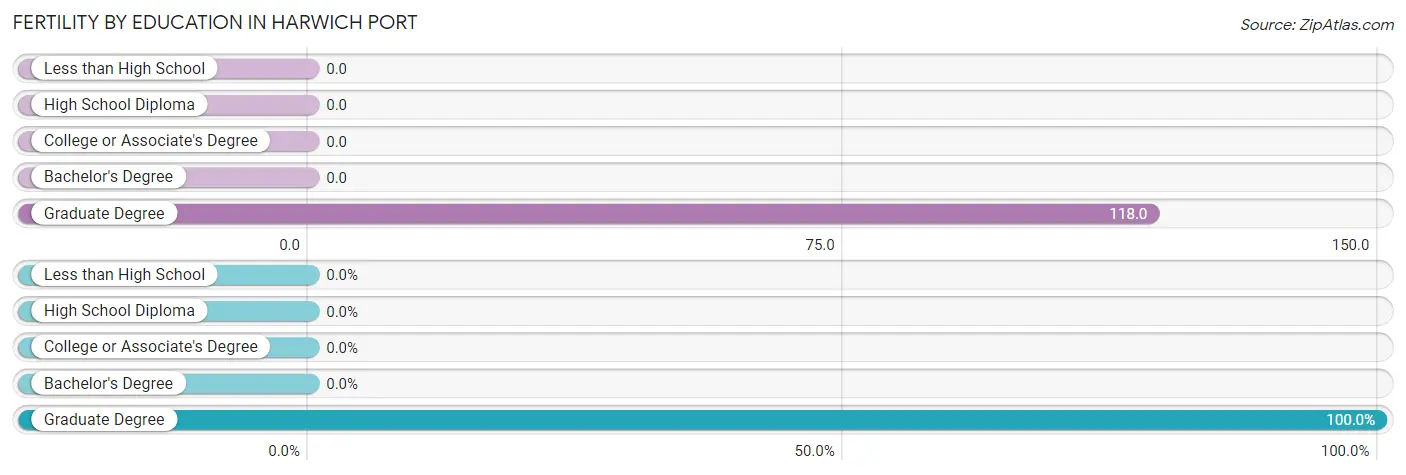
| Educational Attainment | Women with Births | Births / 1,000 Women |
| Less than High School | 0 (0.0%) | 0.0 |
| High School Diploma | 0 (0.0%) | 0.0 |
| College or Associate's Degree | 0 (0.0%) | 0.0 |
| Bachelor's Degree | 0 (0.0%) | 0.0 |
| Graduate Degree | 11 (100.0%) | 118.0 |
| Total | 11 (100.0%) | 43.0 |
Fertility by Education by Marriage Status in Harwich Port
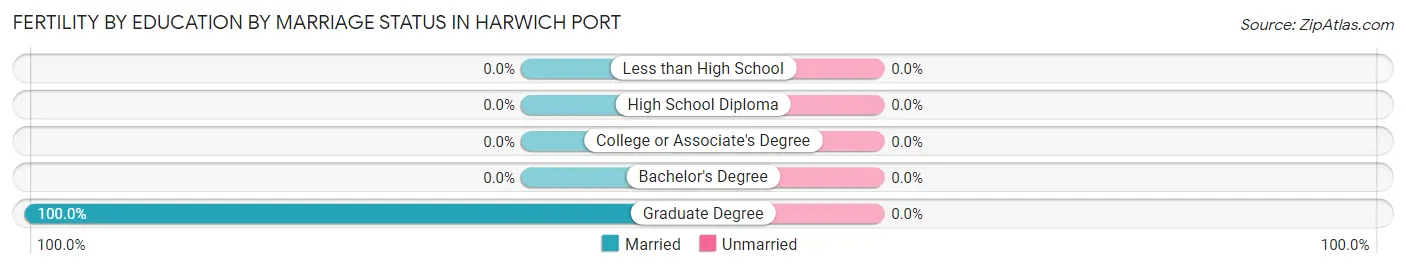
| Educational Attainment | Married | Unmarried |
| Less than High School | 0 (0.0%) | 0 (0.0%) |
| High School Diploma | 0 (0.0%) | 0 (0.0%) |
| College or Associate's Degree | 0 (0.0%) | 0 (0.0%) |
| Bachelor's Degree | 0 (0.0%) | 0 (0.0%) |
| Graduate Degree | 11 (100.0%) | 0 (0.0%) |
| Total | 11 (100.0%) | 0 (0.0%) |
Employment Characteristics in Harwich Port
Employment by Class of Employer in Harwich Port
Among the 1,032 employed individuals in Harwich Port, private company employees (486 | 47.1%), state government employees (144 | 14.0%), and not-for-profit organizations (129 | 12.5%) make up the most common classes of employment.
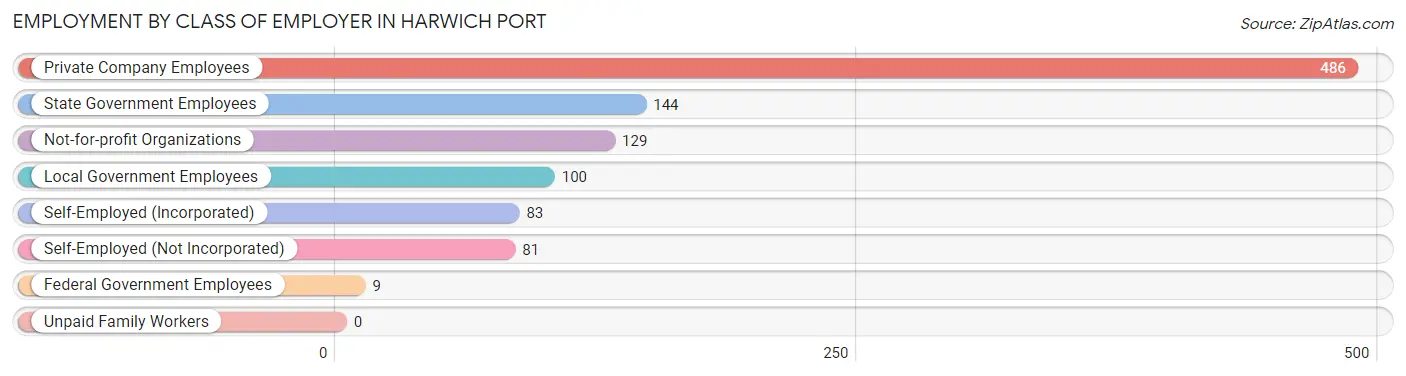
| Employer Class | # Employees | % Employees |
| Private Company Employees | 486 | 47.1% |
| Self-Employed (Incorporated) | 83 | 8.0% |
| Self-Employed (Not Incorporated) | 81 | 7.9% |
| Not-for-profit Organizations | 129 | 12.5% |
| Local Government Employees | 100 | 9.7% |
| State Government Employees | 144 | 14.0% |
| Federal Government Employees | 9 | 0.9% |
| Unpaid Family Workers | 0 | 0.0% |
| Total | 1,032 | 100.0% |
Employment Status by Age in Harwich Port
According to the labor force statistics for Harwich Port, out of the total population over 16 years of age (2,087), 52.4% or 1,094 individuals are in the labor force, with 4.3% or 47 of them unemployed. The age group with the highest labor force participation rate is 20 to 24 years, with 100.0% or 170 individuals in the labor force. Within the labor force, the 75 years and over age range has the highest percentage of unemployed individuals, with 43.9% or 25 of them being unemployed.
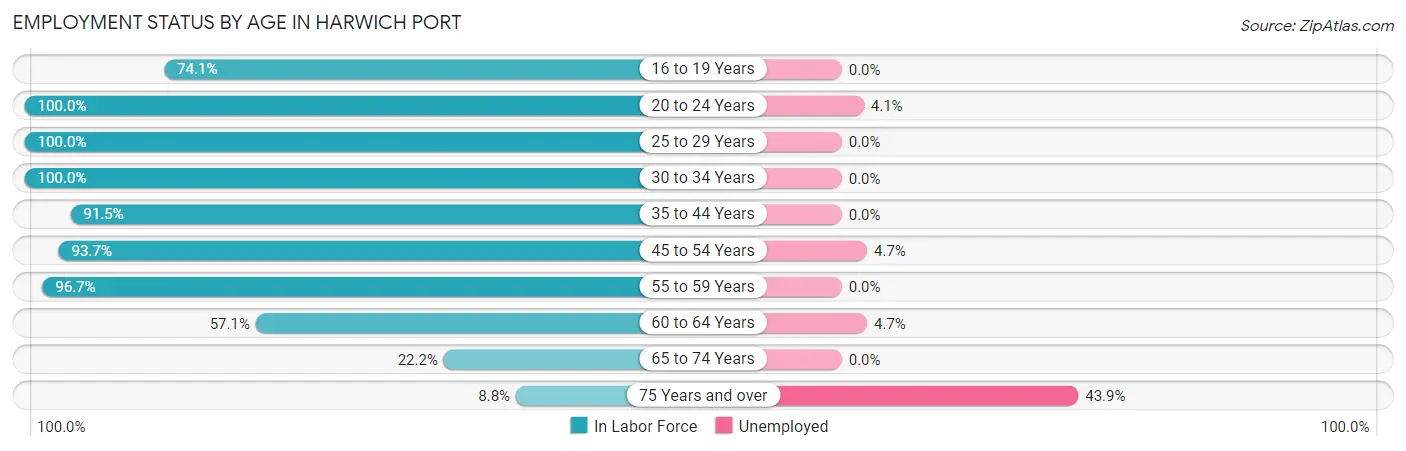
| Age Bracket | In Labor Force | Unemployed |
| 16 to 19 Years | 20 (74.1%) | 0 (0.0%) |
| 20 to 24 Years | 170 (100.0%) | 7 (4.1%) |
| 25 to 29 Years | 65 (100.0%) | 0 (0.0%) |
| 30 to 34 Years | 82 (100.0%) | 0 (0.0%) |
| 35 to 44 Years | 97 (91.5%) | 0 (0.0%) |
| 45 to 54 Years | 193 (93.7%) | 9 (4.7%) |
| 55 to 59 Years | 202 (96.7%) | 0 (0.0%) |
| 60 to 64 Years | 129 (57.1%) | 6 (4.7%) |
| 65 to 74 Years | 78 (22.2%) | 0 (0.0%) |
| 75 Years and over | 57 (8.8%) | 25 (43.9%) |
| Total | 1,094 (52.4%) | 47 (4.3%) |
Employment Status by Educational Attainment in Harwich Port
According to labor force statistics for Harwich Port, 85.9% of individuals (768) out of the total population between 25 and 64 years of age (894) are in the labor force, with 2.0% or 15 of them being unemployed. The group with the highest labor force participation rate are those with the educational attainment of less than high school, with 100.0% or 9 individuals in the labor force. Within the labor force, individuals with less than high school education have the highest percentage of unemployment, with 100.0% or 9 of them being unemployed.
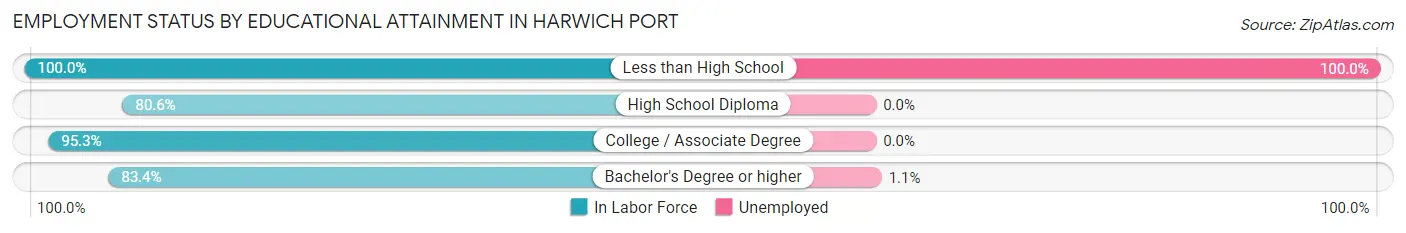
| Educational Attainment | In Labor Force | Unemployed |
| Less than High School | 9 (100.0%) | 9 (100.0%) |
| High School Diploma | 54 (80.6%) | 0 (0.0%) |
| College / Associate Degree | 182 (95.3%) | 0 (0.0%) |
| Bachelor's Degree or higher | 523 (83.4%) | 7 (1.1%) |
| Total | 768 (85.9%) | 18 (2.0%) |
Employment Occupations by Sex in Harwich Port
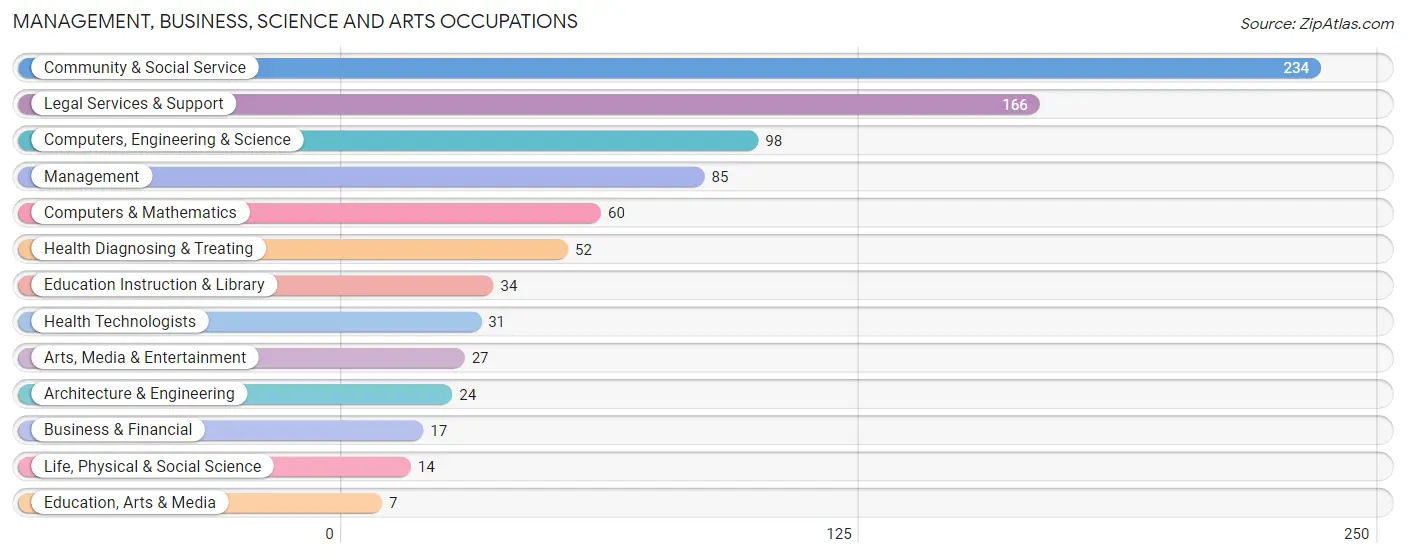
Management, Business, Science and Arts Occupations
The most common Management, Business, Science and Arts occupations in Harwich Port are Community & Social Service (234 | 22.4%), Legal Services & Support (166 | 15.9%), Computers, Engineering & Science (98 | 9.4%), Management (85 | 8.1%), and Computers & Mathematics (60 | 5.7%).
Management, Business, Science and Arts Occupations by Sex
Within the Management, Business, Science and Arts occupations in Harwich Port, the most male-oriented occupations are Architecture & Engineering (100.0%), Life, Physical & Social Science (100.0%), and Education, Arts & Media (100.0%), while the most female-oriented occupations are Health Technologists (100.0%), Education Instruction & Library (76.5%), and Health Diagnosing & Treating (59.6%).
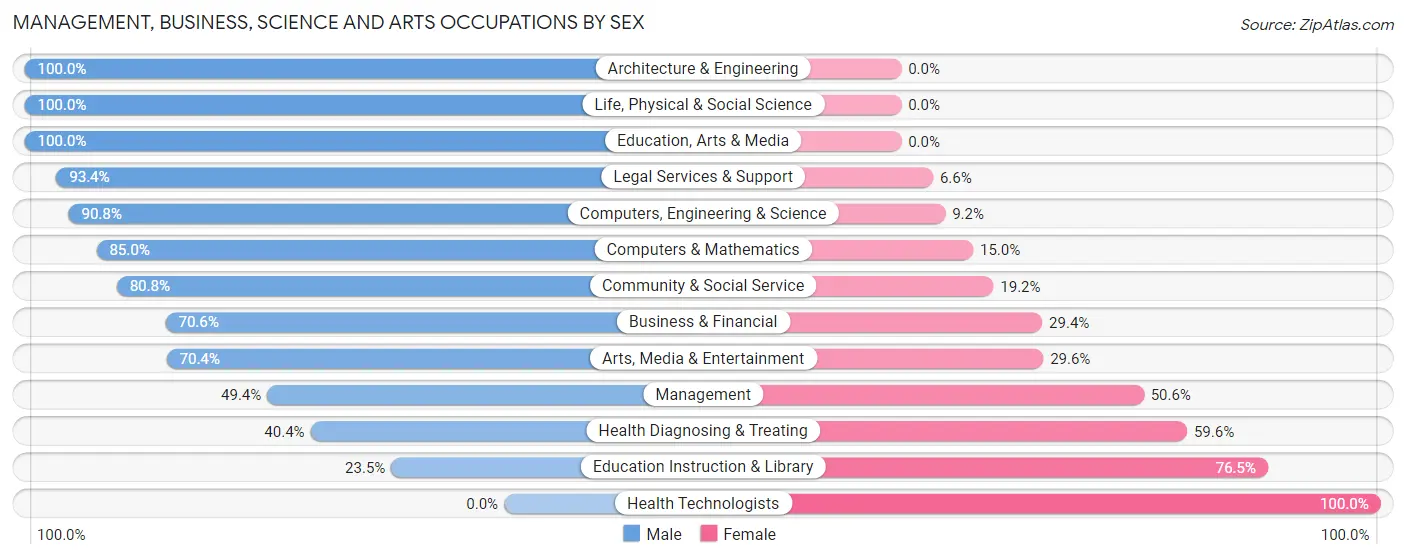
| Occupation | Male | Female |
| Management | 42 (49.4%) | 43 (50.6%) |
| Business & Financial | 12 (70.6%) | 5 (29.4%) |
| Computers, Engineering & Science | 89 (90.8%) | 9 (9.2%) |
| Computers & Mathematics | 51 (85.0%) | 9 (15.0%) |
| Architecture & Engineering | 24 (100.0%) | 0 (0.0%) |
| Life, Physical & Social Science | 14 (100.0%) | 0 (0.0%) |
| Community & Social Service | 189 (80.8%) | 45 (19.2%) |
| Education, Arts & Media | 7 (100.0%) | 0 (0.0%) |
| Legal Services & Support | 155 (93.4%) | 11 (6.6%) |
| Education Instruction & Library | 8 (23.5%) | 26 (76.5%) |
| Arts, Media & Entertainment | 19 (70.4%) | 8 (29.6%) |
| Health Diagnosing & Treating | 21 (40.4%) | 31 (59.6%) |
| Health Technologists | 0 (0.0%) | 31 (100.0%) |
| Total (Category) | 353 (72.6%) | 133 (27.4%) |
| Total (Overall) | 625 (59.8%) | 421 (40.3%) |
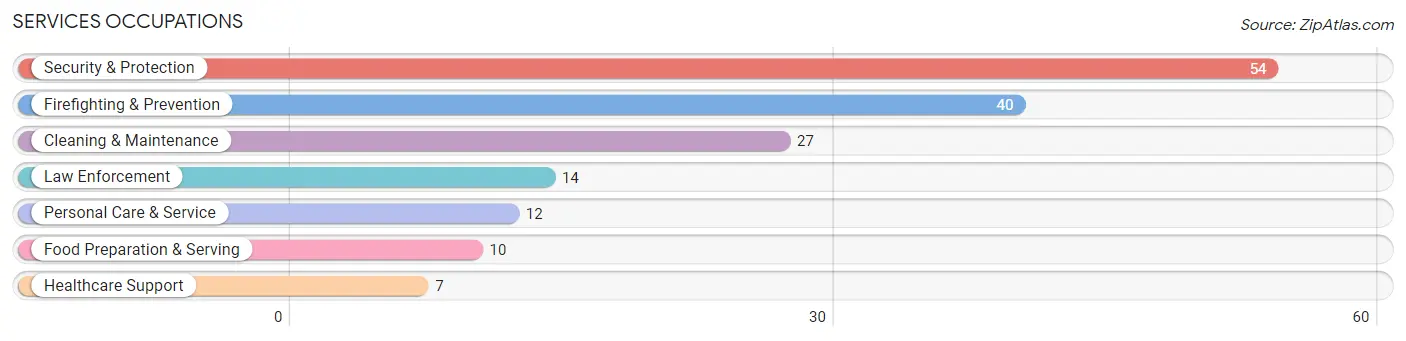
Services Occupations
The most common Services occupations in Harwich Port are Security & Protection (54 | 5.2%), Firefighting & Prevention (40 | 3.8%), Cleaning & Maintenance (27 | 2.6%), Law Enforcement (14 | 1.3%), and Personal Care & Service (12 | 1.1%).
Services Occupations by Sex
Within the Services occupations in Harwich Port, the most male-oriented occupations are Security & Protection (100.0%), Firefighting & Prevention (100.0%), and Law Enforcement (100.0%), while the most female-oriented occupations are Healthcare Support (100.0%), Food Preparation & Serving (100.0%), and Personal Care & Service (100.0%).
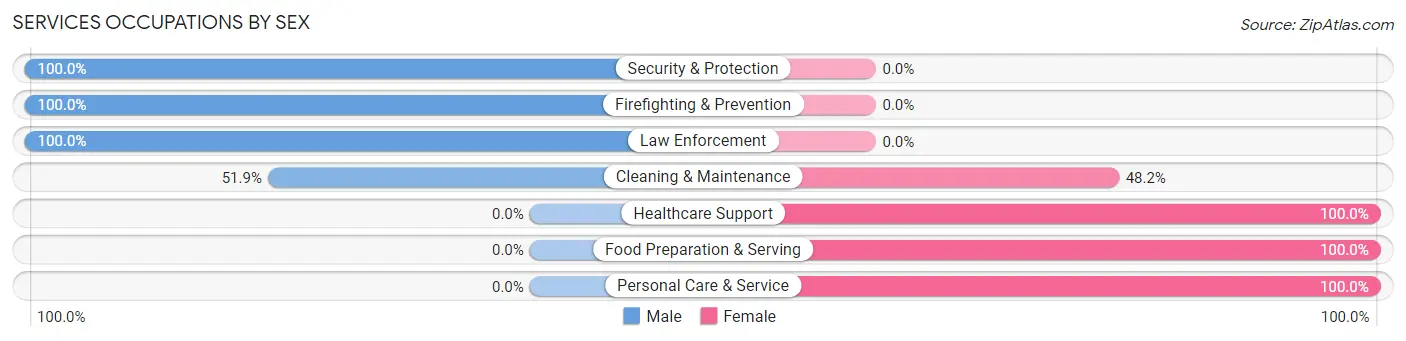
| Occupation | Male | Female |
| Healthcare Support | 0 (0.0%) | 7 (100.0%) |
| Security & Protection | 54 (100.0%) | 0 (0.0%) |
| Firefighting & Prevention | 40 (100.0%) | 0 (0.0%) |
| Law Enforcement | 14 (100.0%) | 0 (0.0%) |
| Food Preparation & Serving | 0 (0.0%) | 10 (100.0%) |
| Cleaning & Maintenance | 14 (51.8%) | 13 (48.1%) |
| Personal Care & Service | 0 (0.0%) | 12 (100.0%) |
| Total (Category) | 68 (61.8%) | 42 (38.2%) |
| Total (Overall) | 625 (59.8%) | 421 (40.3%) |
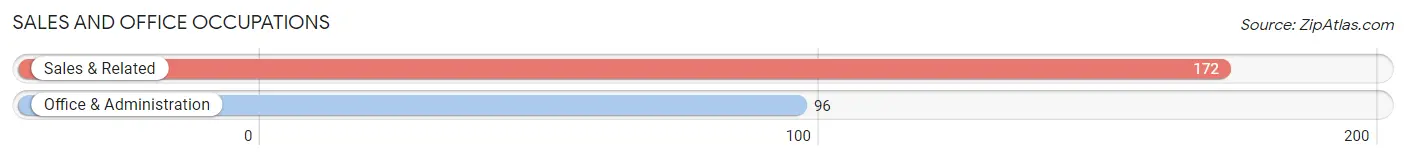
Sales and Office Occupations
The most common Sales and Office occupations in Harwich Port are Sales & Related (172 | 16.4%), and Office & Administration (96 | 9.2%).
Sales and Office Occupations by Sex
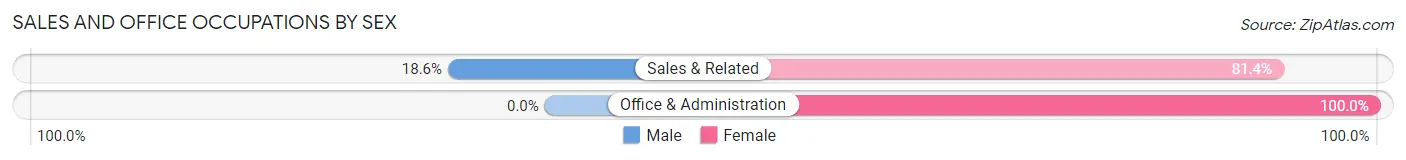
| Occupation | Male | Female |
| Sales & Related | 32 (18.6%) | 140 (81.4%) |
| Office & Administration | 0 (0.0%) | 96 (100.0%) |
| Total (Category) | 32 (11.9%) | 236 (88.1%) |
| Total (Overall) | 625 (59.8%) | 421 (40.3%) |
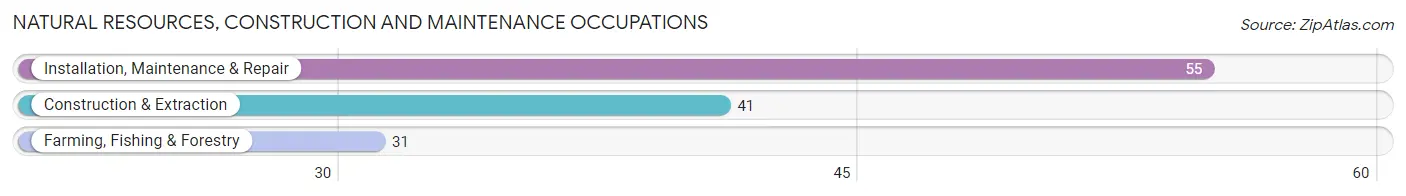
Natural Resources, Construction and Maintenance Occupations
The most common Natural Resources, Construction and Maintenance occupations in Harwich Port are Installation, Maintenance & Repair (55 | 5.3%), Construction & Extraction (41 | 3.9%), and Farming, Fishing & Forestry (31 | 3.0%).
Natural Resources, Construction and Maintenance Occupations by Sex
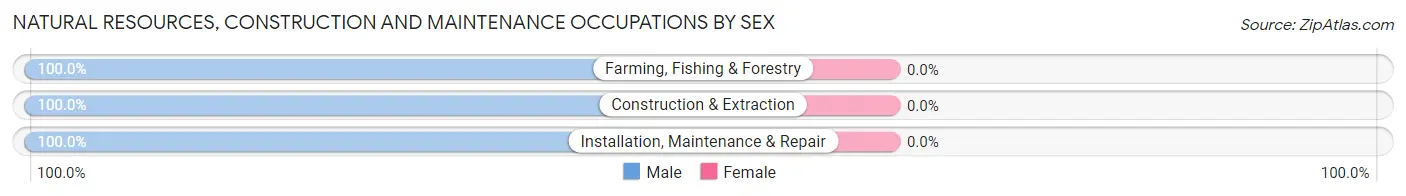
| Occupation | Male | Female |
| Farming, Fishing & Forestry | 31 (100.0%) | 0 (0.0%) |
| Construction & Extraction | 41 (100.0%) | 0 (0.0%) |
| Installation, Maintenance & Repair | 55 (100.0%) | 0 (0.0%) |
| Total (Category) | 127 (100.0%) | 0 (0.0%) |
| Total (Overall) | 625 (59.8%) | 421 (40.3%) |
Production, Transportation and Moving Occupations
The most common Production, Transportation and Moving occupations in Harwich Port are , and Material Moving (55 | 5.3%).
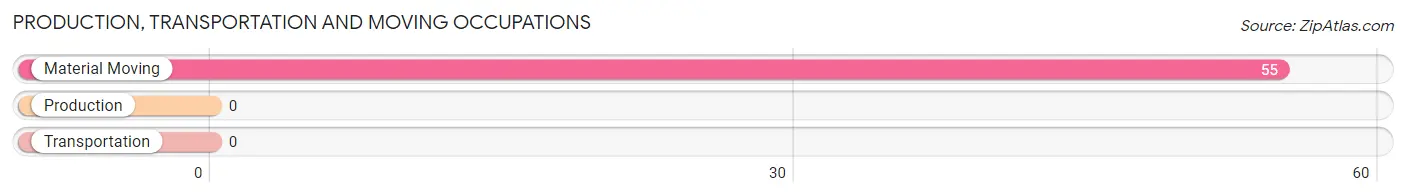
Production, Transportation and Moving Occupations by Sex
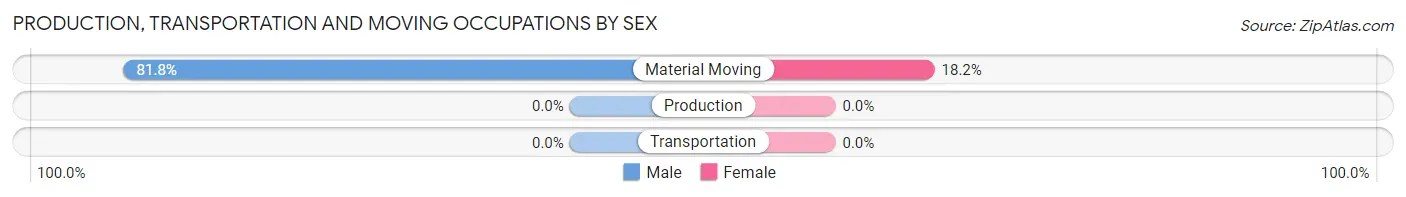
| Occupation | Male | Female |
| Production | 0 (0.0%) | 0 (0.0%) |
| Transportation | 0 (0.0%) | 0 (0.0%) |
| Material Moving | 45 (81.8%) | 10 (18.2%) |
| Total (Category) | 45 (81.8%) | 10 (18.2%) |
| Total (Overall) | 625 (59.8%) | 421 (40.3%) |
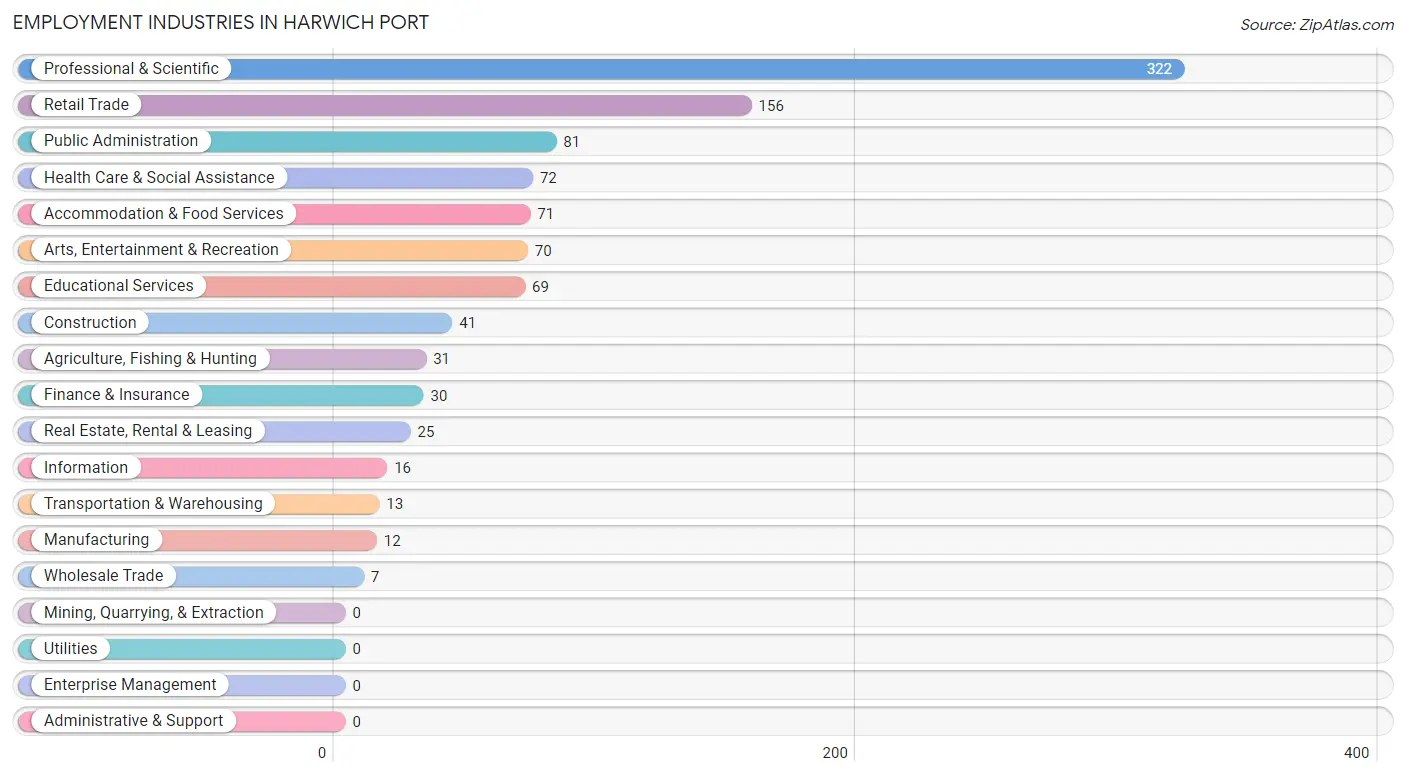
Employment Industries by Sex in Harwich Port
Employment Industries in Harwich Port
The major employment industries in Harwich Port include Professional & Scientific (322 | 30.8%), Retail Trade (156 | 14.9%), Public Administration (81 | 7.7%), Health Care & Social Assistance (72 | 6.9%), and Accommodation & Food Services (71 | 6.8%).
Employment Industries by Sex in Harwich Port
The Harwich Port industries that see more men than women are Agriculture, Fishing & Hunting (100.0%), Construction (100.0%), and Manufacturing (100.0%), whereas the industries that tend to have a higher number of women are Wholesale Trade (100.0%), Information (100.0%), and Accommodation & Food Services (80.3%).
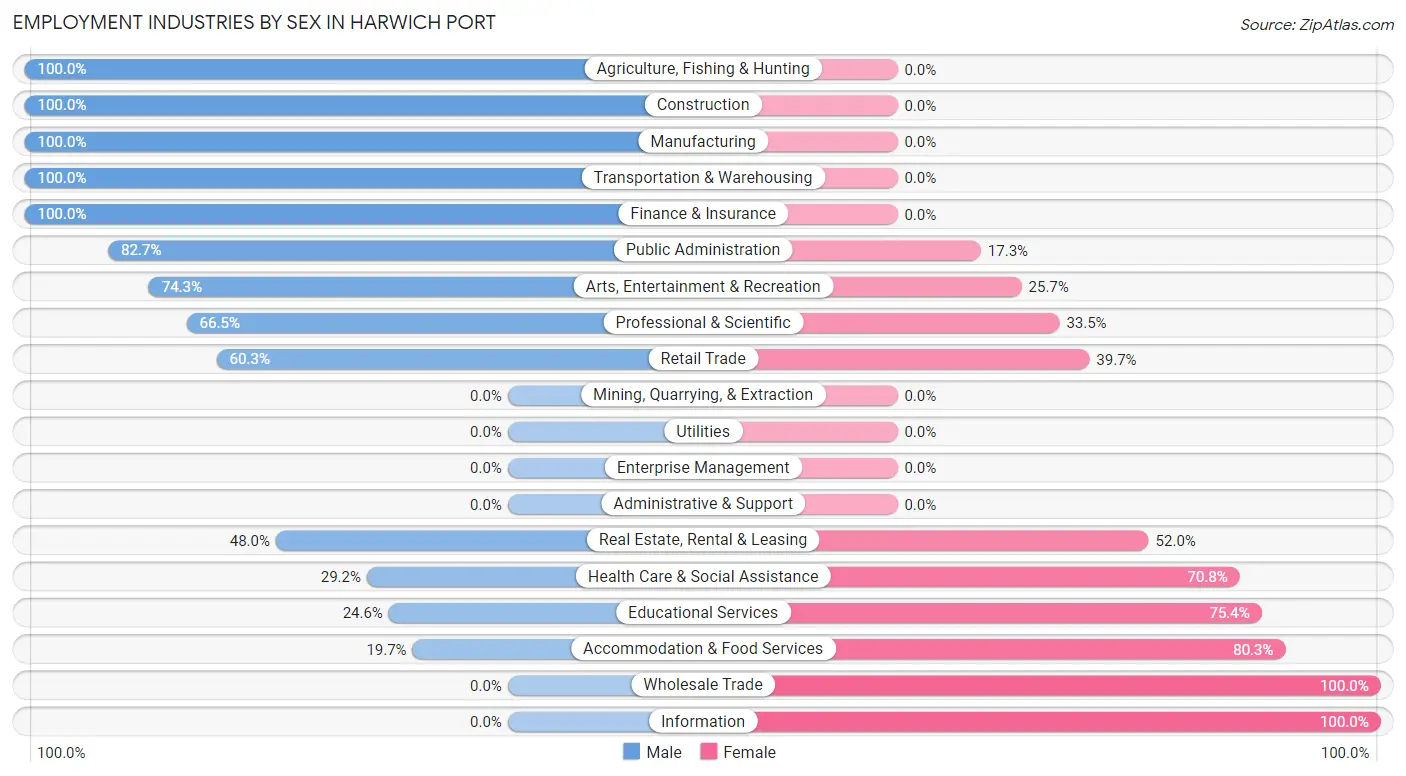
| Industry | Male | Female |
| Agriculture, Fishing & Hunting | 31 (100.0%) | 0 (0.0%) |
| Mining, Quarrying, & Extraction | 0 (0.0%) | 0 (0.0%) |
| Construction | 41 (100.0%) | 0 (0.0%) |
| Manufacturing | 12 (100.0%) | 0 (0.0%) |
| Wholesale Trade | 0 (0.0%) | 7 (100.0%) |
| Retail Trade | 94 (60.3%) | 62 (39.7%) |
| Transportation & Warehousing | 13 (100.0%) | 0 (0.0%) |
| Utilities | 0 (0.0%) | 0 (0.0%) |
| Information | 0 (0.0%) | 16 (100.0%) |
| Finance & Insurance | 30 (100.0%) | 0 (0.0%) |
| Real Estate, Rental & Leasing | 12 (48.0%) | 13 (52.0%) |
| Professional & Scientific | 214 (66.5%) | 108 (33.5%) |
| Enterprise Management | 0 (0.0%) | 0 (0.0%) |
| Administrative & Support | 0 (0.0%) | 0 (0.0%) |
| Educational Services | 17 (24.6%) | 52 (75.4%) |
| Health Care & Social Assistance | 21 (29.2%) | 51 (70.8%) |
| Arts, Entertainment & Recreation | 52 (74.3%) | 18 (25.7%) |
| Accommodation & Food Services | 14 (19.7%) | 57 (80.3%) |
| Public Administration | 67 (82.7%) | 14 (17.3%) |
| Total | 625 (59.8%) | 421 (40.3%) |
Education in Harwich Port
School Enrollment in Harwich Port
The most common levels of schooling among the 241 students in Harwich Port are college / undergraduate (68 | 28.2%), elementary school (67 | 27.8%), and high school (65 | 27.0%).
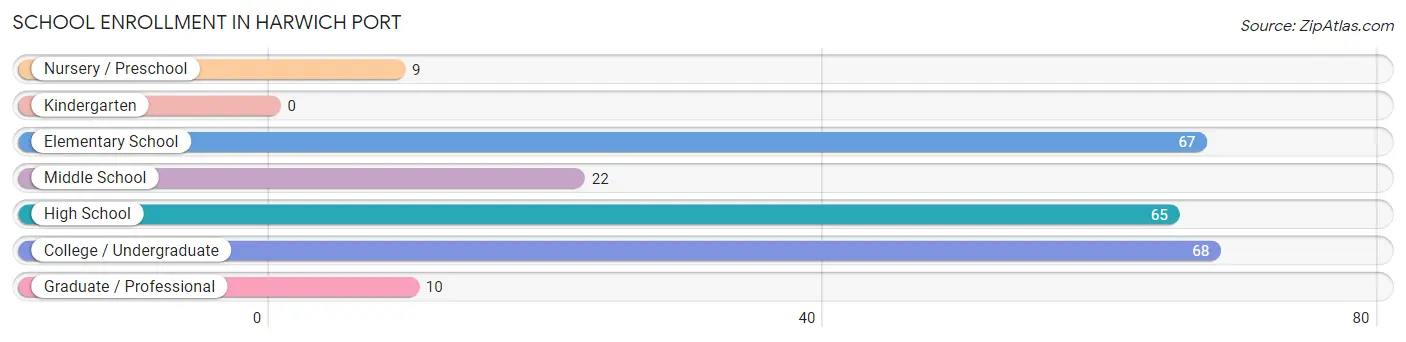
| School Level | # Students | % Students |
| Nursery / Preschool | 9 | 3.7% |
| Kindergarten | 0 | 0.0% |
| Elementary School | 67 | 27.8% |
| Middle School | 22 | 9.1% |
| High School | 65 | 27.0% |
| College / Undergraduate | 68 | 28.2% |
| Graduate / Professional | 10 | 4.2% |
| Total | 241 | 100.0% |
School Enrollment by Age by Funding Source in Harwich Port
Out of a total of 241 students who are enrolled in schools in Harwich Port, 20 (8.3%) attend a private institution, while the remaining 221 (91.7%) are enrolled in public schools. The age group of 20 to 24 year olds has the highest likelihood of being enrolled in private schools, with 7 (26.9% in the age bracket) enrolled. Conversely, the age group of 3 to 4 year olds has the lowest likelihood of being enrolled in a private school, with 9 (100.0% in the age bracket) attending a public institution.
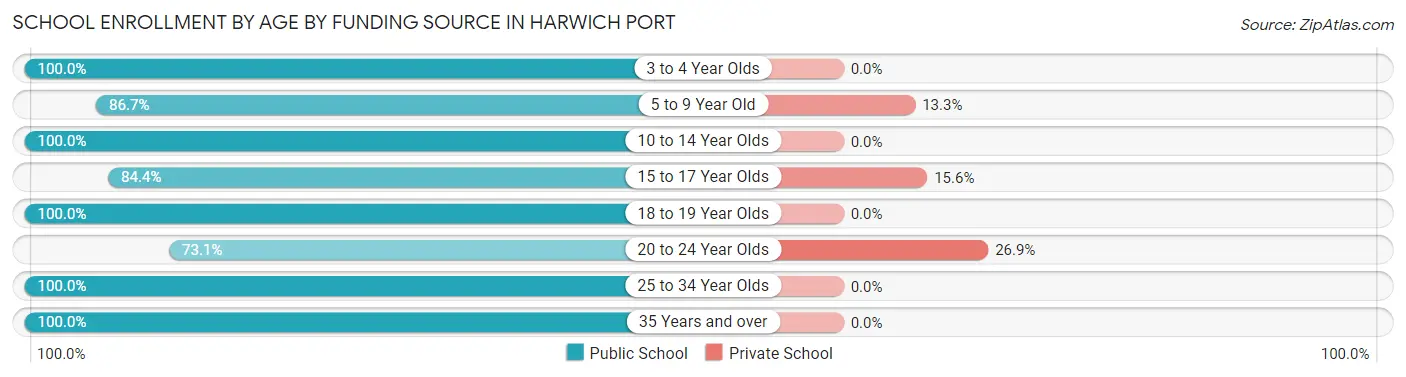
| Age Bracket | Public School | Private School |
| 3 to 4 Year Olds | 9 (100.0%) | 0 (0.0%) |
| 5 to 9 Year Old | 39 (86.7%) | 6 (13.3%) |
| 10 to 14 Year Olds | 44 (100.0%) | 0 (0.0%) |
| 15 to 17 Year Olds | 38 (84.4%) | 7 (15.6%) |
| 18 to 19 Year Olds | 20 (100.0%) | 0 (0.0%) |
| 20 to 24 Year Olds | 19 (73.1%) | 7 (26.9%) |
| 25 to 34 Year Olds | 31 (100.0%) | 0 (0.0%) |
| 35 Years and over | 21 (100.0%) | 0 (0.0%) |
| Total | 221 (91.7%) | 20 (8.3%) |
Educational Attainment by Field of Study in Harwich Port
Business (225 | 18.3%), education (212 | 17.2%), social sciences (184 | 15.0%), literature & languages (121 | 9.8%), and liberal arts & history (98 | 8.0%) are the most common fields of study among 1,230 individuals in Harwich Port who have obtained a bachelor's degree or higher.
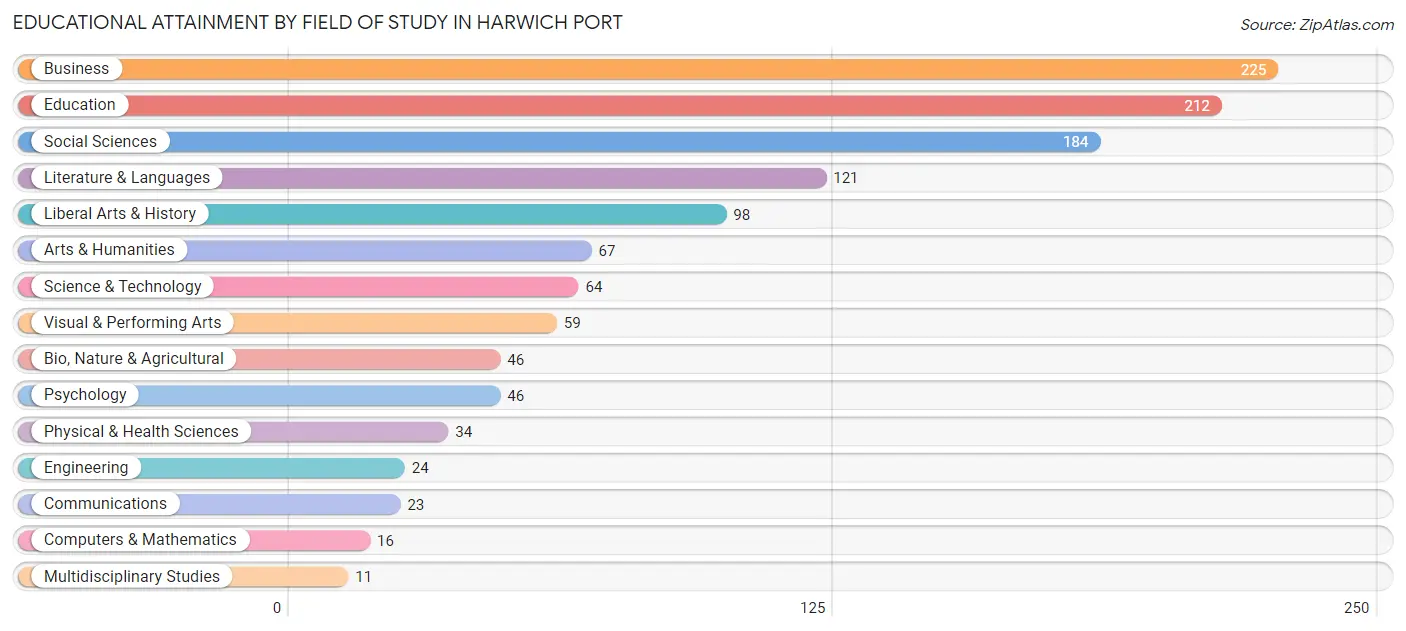
| Field of Study | # Graduates | % Graduates |
| Computers & Mathematics | 16 | 1.3% |
| Bio, Nature & Agricultural | 46 | 3.7% |
| Physical & Health Sciences | 34 | 2.8% |
| Psychology | 46 | 3.7% |
| Social Sciences | 184 | 15.0% |
| Engineering | 24 | 1.9% |
| Multidisciplinary Studies | 11 | 0.9% |
| Science & Technology | 64 | 5.2% |
| Business | 225 | 18.3% |
| Education | 212 | 17.2% |
| Literature & Languages | 121 | 9.8% |
| Liberal Arts & History | 98 | 8.0% |
| Visual & Performing Arts | 59 | 4.8% |
| Communications | 23 | 1.9% |
| Arts & Humanities | 67 | 5.4% |
| Total | 1,230 | 100.0% |
Transportation & Commute in Harwich Port
Vehicle Availability by Sex in Harwich Port
The most prevalent vehicle ownership categories in Harwich Port are males with 3 vehicles (251, accounting for 41.6%) and females with 3 vehicles (100, making up 60.3%).
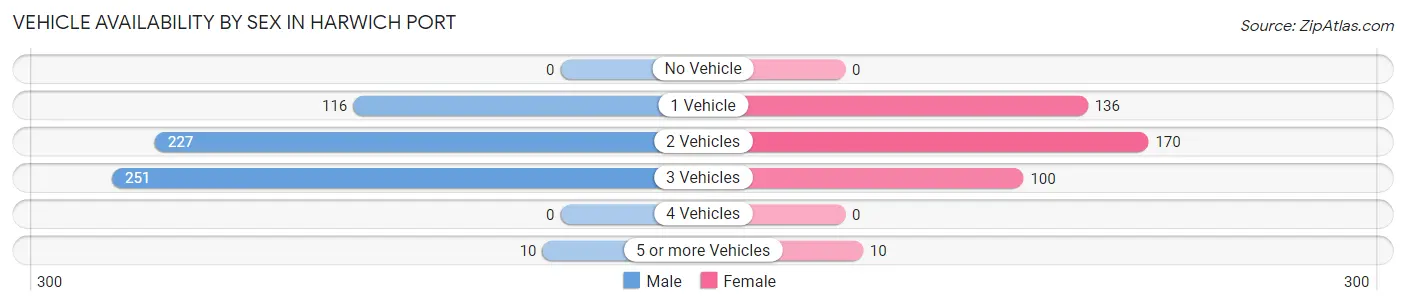
| Vehicles Available | Male | Female |
| No Vehicle | 0 (0.0%) | 0 (0.0%) |
| 1 Vehicle | 116 (19.2%) | 136 (32.7%) |
| 2 Vehicles | 227 (37.6%) | 170 (40.9%) |
| 3 Vehicles | 251 (41.6%) | 100 (24.0%) |
| 4 Vehicles | 0 (0.0%) | 0 (0.0%) |
| 5 or more Vehicles | 10 (1.7%) | 10 (2.4%) |
| Total | 604 (100.0%) | 416 (100.0%) |
Commute Time in Harwich Port
The most frequently occuring commute durations in Harwich Port are 25 to 29 minutes (177 commuters, 20.8%), 20 to 24 minutes (134 commuters, 15.8%), and 15 to 19 minutes (95 commuters, 11.2%).
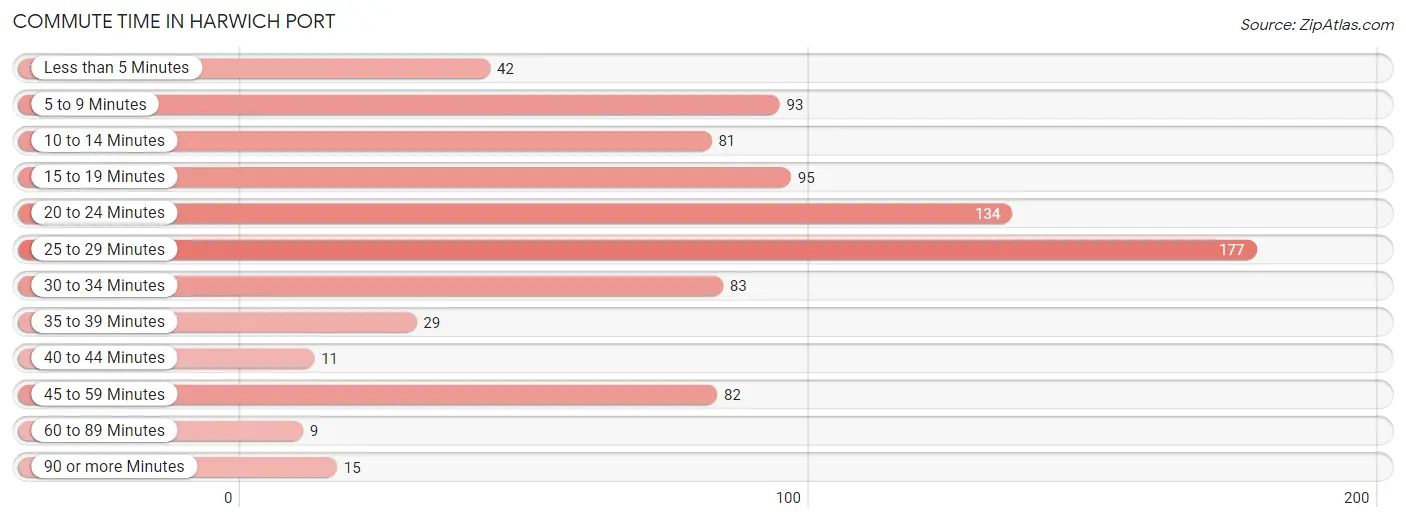
| Commute Time | # Commuters | % Commuters |
| Less than 5 Minutes | 42 | 4.9% |
| 5 to 9 Minutes | 93 | 10.9% |
| 10 to 14 Minutes | 81 | 9.5% |
| 15 to 19 Minutes | 95 | 11.2% |
| 20 to 24 Minutes | 134 | 15.8% |
| 25 to 29 Minutes | 177 | 20.8% |
| 30 to 34 Minutes | 83 | 9.8% |
| 35 to 39 Minutes | 29 | 3.4% |
| 40 to 44 Minutes | 11 | 1.3% |
| 45 to 59 Minutes | 82 | 9.6% |
| 60 to 89 Minutes | 9 | 1.1% |
| 90 or more Minutes | 15 | 1.8% |
Commute Time by Sex in Harwich Port
The most common commute times in Harwich Port are 25 to 29 minutes (177 commuters, 36.2%) for males and 45 to 59 minutes (69 commuters, 19.1%) for females.
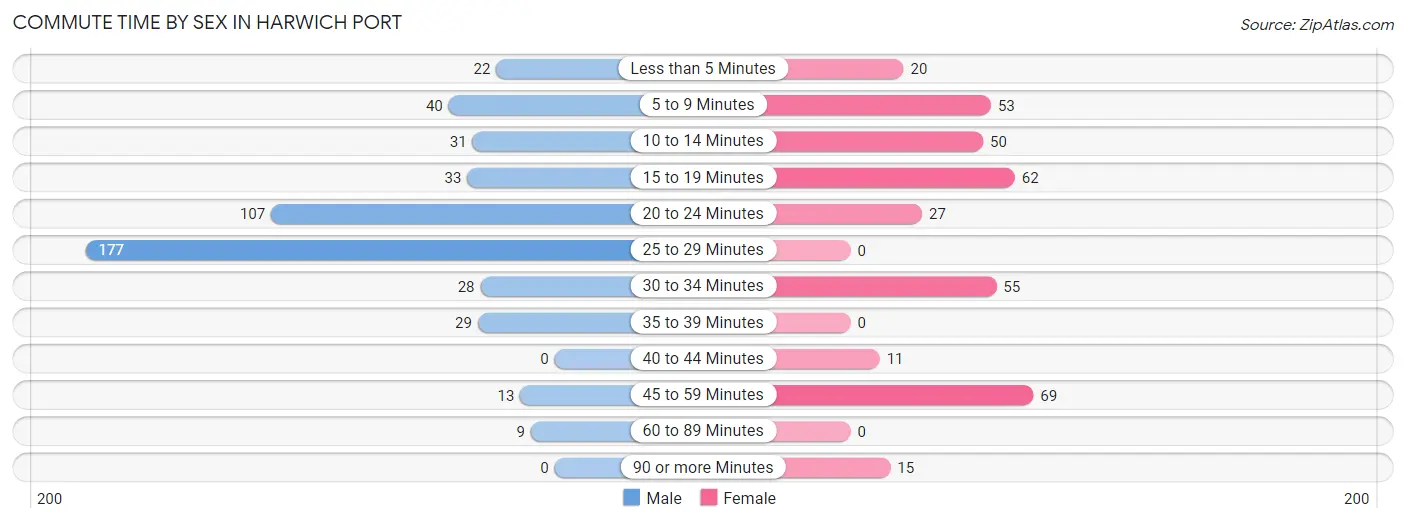
| Commute Time | Male | Female |
| Less than 5 Minutes | 22 (4.5%) | 20 (5.5%) |
| 5 to 9 Minutes | 40 (8.2%) | 53 (14.6%) |
| 10 to 14 Minutes | 31 (6.3%) | 50 (13.8%) |
| 15 to 19 Minutes | 33 (6.8%) | 62 (17.1%) |
| 20 to 24 Minutes | 107 (21.9%) | 27 (7.5%) |
| 25 to 29 Minutes | 177 (36.2%) | 0 (0.0%) |
| 30 to 34 Minutes | 28 (5.7%) | 55 (15.2%) |
| 35 to 39 Minutes | 29 (5.9%) | 0 (0.0%) |
| 40 to 44 Minutes | 0 (0.0%) | 11 (3.0%) |
| 45 to 59 Minutes | 13 (2.7%) | 69 (19.1%) |
| 60 to 89 Minutes | 9 (1.8%) | 0 (0.0%) |
| 90 or more Minutes | 0 (0.0%) | 15 (4.1%) |
Time of Departure to Work by Sex in Harwich Port
The most frequent times of departure to work in Harwich Port are 9:00 AM to 9:59 AM (165, 33.7%) for males and 6:30 AM to 6:59 AM (78, 21.5%) for females.
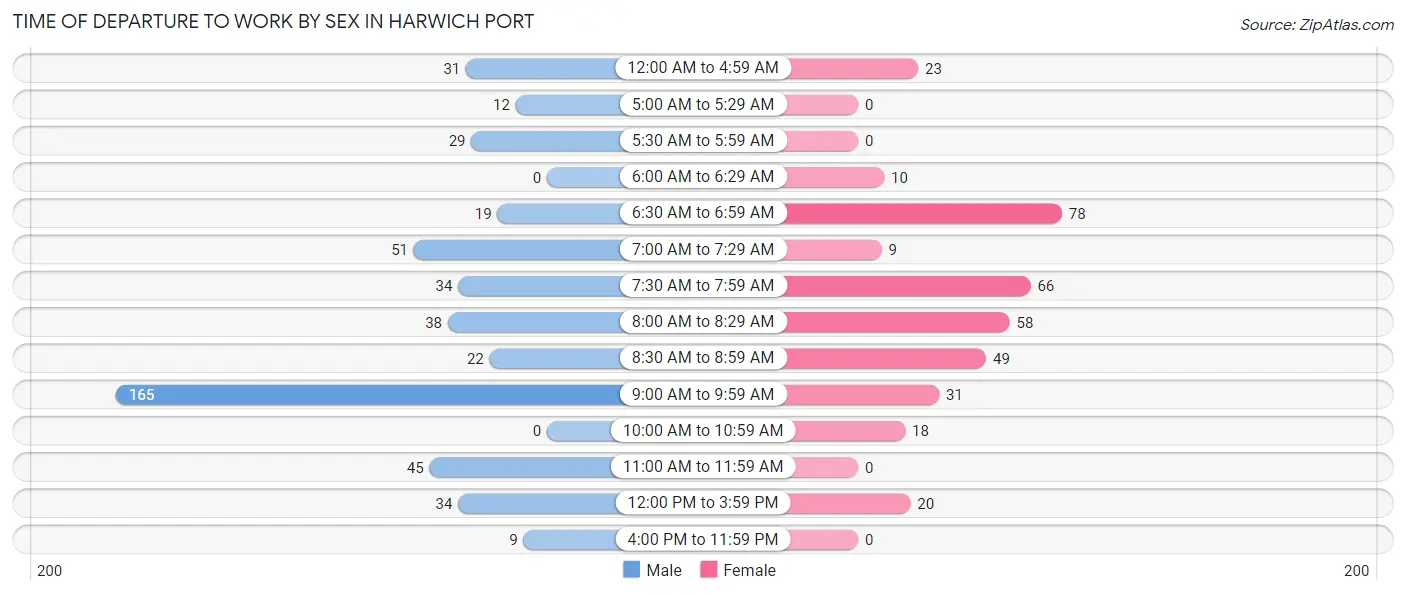
| Time of Departure | Male | Female |
| 12:00 AM to 4:59 AM | 31 (6.3%) | 23 (6.4%) |
| 5:00 AM to 5:29 AM | 12 (2.5%) | 0 (0.0%) |
| 5:30 AM to 5:59 AM | 29 (5.9%) | 0 (0.0%) |
| 6:00 AM to 6:29 AM | 0 (0.0%) | 10 (2.8%) |
| 6:30 AM to 6:59 AM | 19 (3.9%) | 78 (21.5%) |
| 7:00 AM to 7:29 AM | 51 (10.4%) | 9 (2.5%) |
| 7:30 AM to 7:59 AM | 34 (7.0%) | 66 (18.2%) |
| 8:00 AM to 8:29 AM | 38 (7.8%) | 58 (16.0%) |
| 8:30 AM to 8:59 AM | 22 (4.5%) | 49 (13.5%) |
| 9:00 AM to 9:59 AM | 165 (33.7%) | 31 (8.6%) |
| 10:00 AM to 10:59 AM | 0 (0.0%) | 18 (5.0%) |
| 11:00 AM to 11:59 AM | 45 (9.2%) | 0 (0.0%) |
| 12:00 PM to 3:59 PM | 34 (7.0%) | 20 (5.5%) |
| 4:00 PM to 11:59 PM | 9 (1.8%) | 0 (0.0%) |
| Total | 489 (100.0%) | 362 (100.0%) |
Housing Occupancy in Harwich Port
Occupancy by Ownership in Harwich Port
Of the total 1,199 dwellings in Harwich Port, owner-occupied units account for 916 (76.4%), while renter-occupied units make up 283 (23.6%).
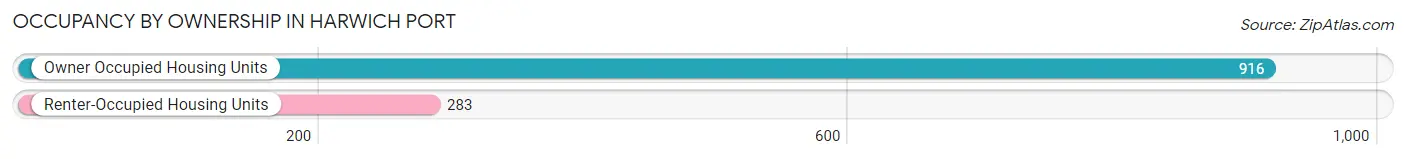
| Occupancy | # Housing Units | % Housing Units |
| Owner Occupied Housing Units | 916 | 76.4% |
| Renter-Occupied Housing Units | 283 | 23.6% |
| Total Occupied Housing Units | 1,199 | 100.0% |
Occupancy by Household Size in Harwich Port
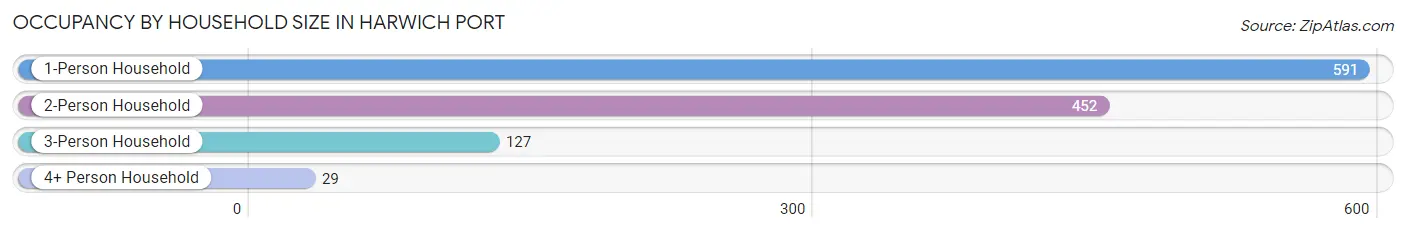
| Household Size | # Housing Units | % Housing Units |
| 1-Person Household | 591 | 49.3% |
| 2-Person Household | 452 | 37.7% |
| 3-Person Household | 127 | 10.6% |
| 4+ Person Household | 29 | 2.4% |
| Total Housing Units | 1,199 | 100.0% |
Occupancy by Ownership by Household Size in Harwich Port
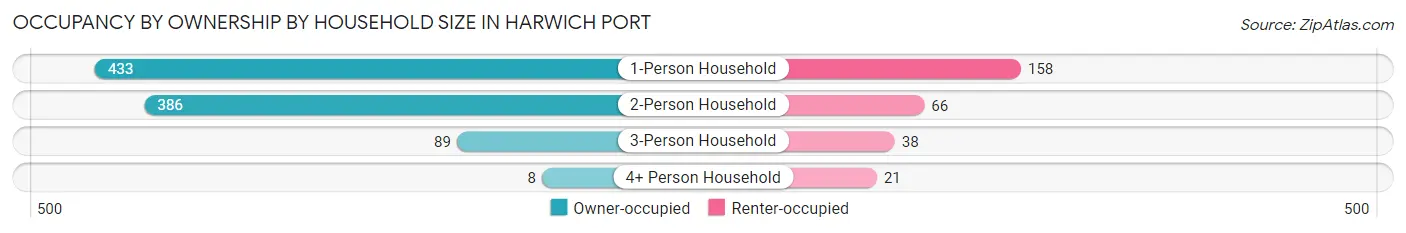
| Household Size | Owner-occupied | Renter-occupied |
| 1-Person Household | 433 (73.3%) | 158 (26.7%) |
| 2-Person Household | 386 (85.4%) | 66 (14.6%) |
| 3-Person Household | 89 (70.1%) | 38 (29.9%) |
| 4+ Person Household | 8 (27.6%) | 21 (72.4%) |
| Total Housing Units | 916 (76.4%) | 283 (23.6%) |
Occupancy by Educational Attainment in Harwich Port
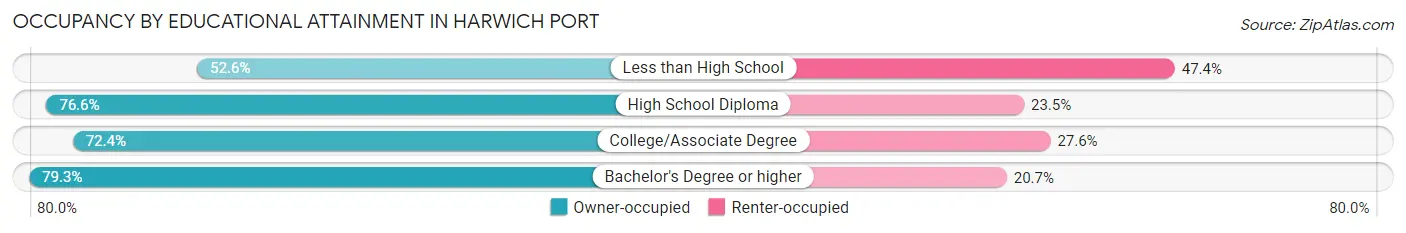
| Household Size | Owner-occupied | Renter-occupied |
| Less than High School | 10 (52.6%) | 9 (47.4%) |
| High School Diploma | 111 (76.5%) | 34 (23.4%) |
| College/Associate Degree | 267 (72.4%) | 102 (27.6%) |
| Bachelor's Degree or higher | 528 (79.3%) | 138 (20.7%) |
Occupancy by Age of Householder in Harwich Port
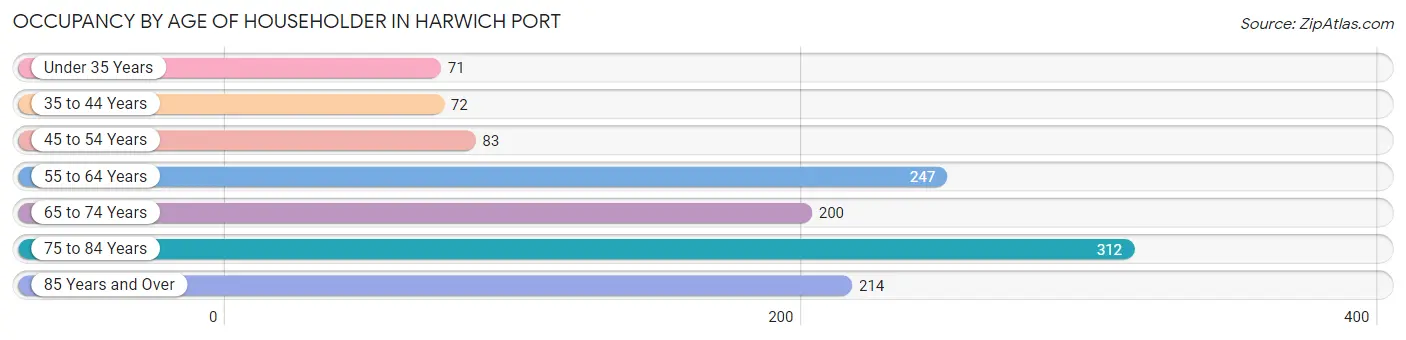
| Age Bracket | # Households | % Households |
| Under 35 Years | 71 | 5.9% |
| 35 to 44 Years | 72 | 6.0% |
| 45 to 54 Years | 83 | 6.9% |
| 55 to 64 Years | 247 | 20.6% |
| 65 to 74 Years | 200 | 16.7% |
| 75 to 84 Years | 312 | 26.0% |
| 85 Years and Over | 214 | 17.8% |
| Total | 1,199 | 100.0% |
Housing Finances in Harwich Port
Median Income by Occupancy in Harwich Port
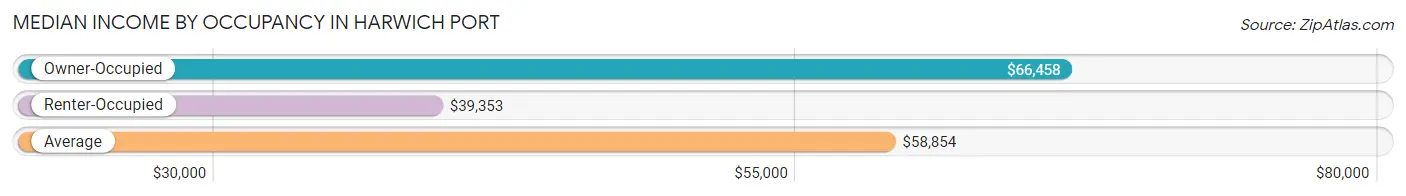
| Occupancy Type | # Households | Median Income |
| Owner-Occupied | 916 (76.4%) | $66,458 |
| Renter-Occupied | 283 (23.6%) | $39,353 |
| Average | 1,199 (100.0%) | $58,854 |
Occupancy by Householder Income Bracket in Harwich Port
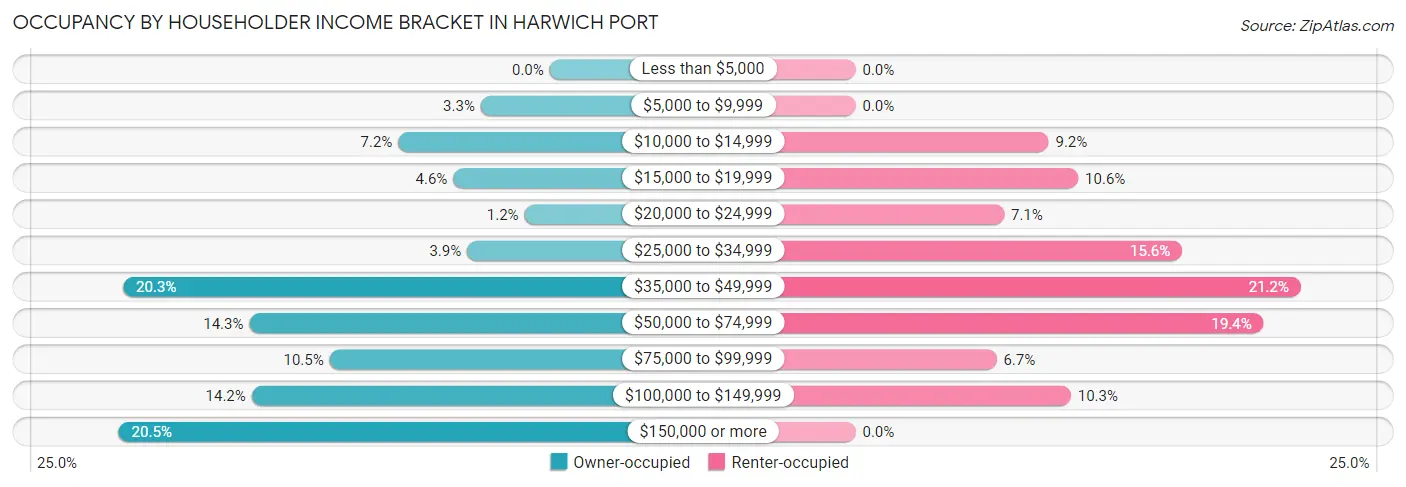
| Income Bracket | Owner-occupied | Renter-occupied |
| Less than $5,000 | 0 (0.0%) | 0 (0.0%) |
| $5,000 to $9,999 | 30 (3.3%) | 0 (0.0%) |
| $10,000 to $14,999 | 66 (7.2%) | 26 (9.2%) |
| $15,000 to $19,999 | 42 (4.6%) | 30 (10.6%) |
| $20,000 to $24,999 | 11 (1.2%) | 20 (7.1%) |
| $25,000 to $34,999 | 36 (3.9%) | 44 (15.5%) |
| $35,000 to $49,999 | 186 (20.3%) | 60 (21.2%) |
| $50,000 to $74,999 | 131 (14.3%) | 55 (19.4%) |
| $75,000 to $99,999 | 96 (10.5%) | 19 (6.7%) |
| $100,000 to $149,999 | 130 (14.2%) | 29 (10.2%) |
| $150,000 or more | 188 (20.5%) | 0 (0.0%) |
| Total | 916 (100.0%) | 283 (100.0%) |
Monthly Housing Cost Tiers in Harwich Port
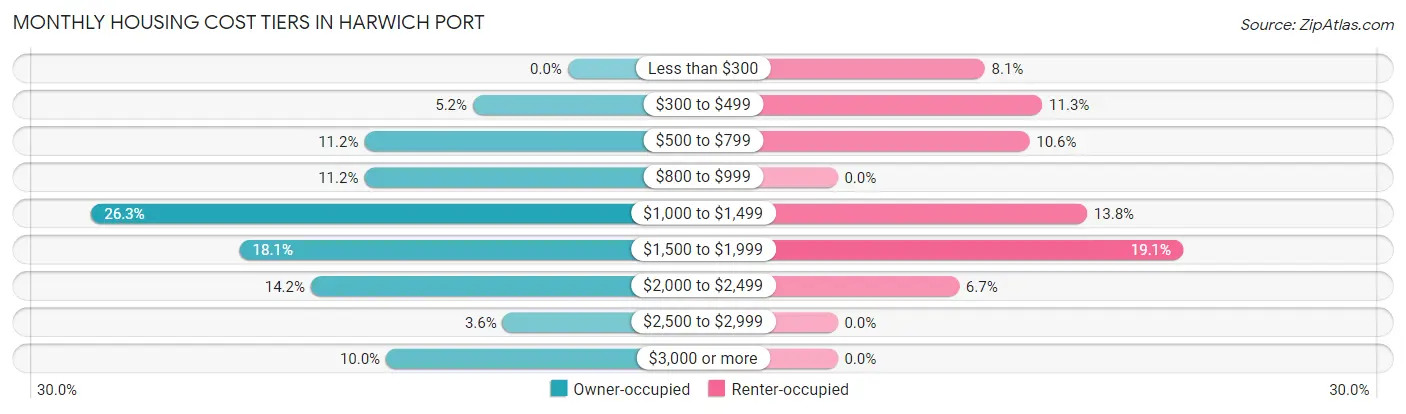
| Monthly Cost | Owner-occupied | Renter-occupied |
| Less than $300 | 0 (0.0%) | 23 (8.1%) |
| $300 to $499 | 48 (5.2%) | 32 (11.3%) |
| $500 to $799 | 103 (11.2%) | 30 (10.6%) |
| $800 to $999 | 103 (11.2%) | 0 (0.0%) |
| $1,000 to $1,499 | 241 (26.3%) | 39 (13.8%) |
| $1,500 to $1,999 | 166 (18.1%) | 54 (19.1%) |
| $2,000 to $2,499 | 130 (14.2%) | 19 (6.7%) |
| $2,500 to $2,999 | 33 (3.6%) | 0 (0.0%) |
| $3,000 or more | 92 (10.0%) | 0 (0.0%) |
| Total | 916 (100.0%) | 283 (100.0%) |
Physical Housing Characteristics in Harwich Port
Housing Structures in Harwich Port
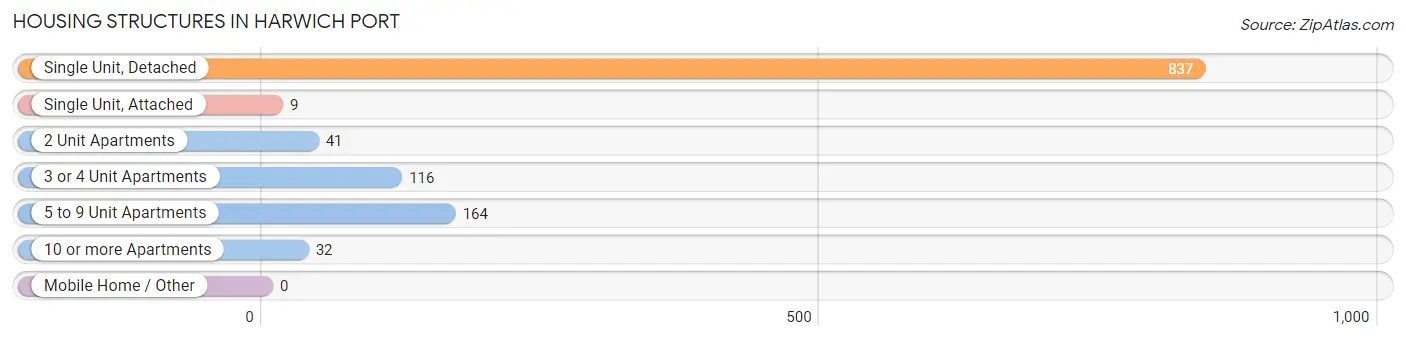
| Structure Type | # Housing Units | % Housing Units |
| Single Unit, Detached | 837 | 69.8% |
| Single Unit, Attached | 9 | 0.7% |
| 2 Unit Apartments | 41 | 3.4% |
| 3 or 4 Unit Apartments | 116 | 9.7% |
| 5 to 9 Unit Apartments | 164 | 13.7% |
| 10 or more Apartments | 32 | 2.7% |
| Mobile Home / Other | 0 | 0.0% |
| Total | 1,199 | 100.0% |
Housing Structures by Occupancy in Harwich Port
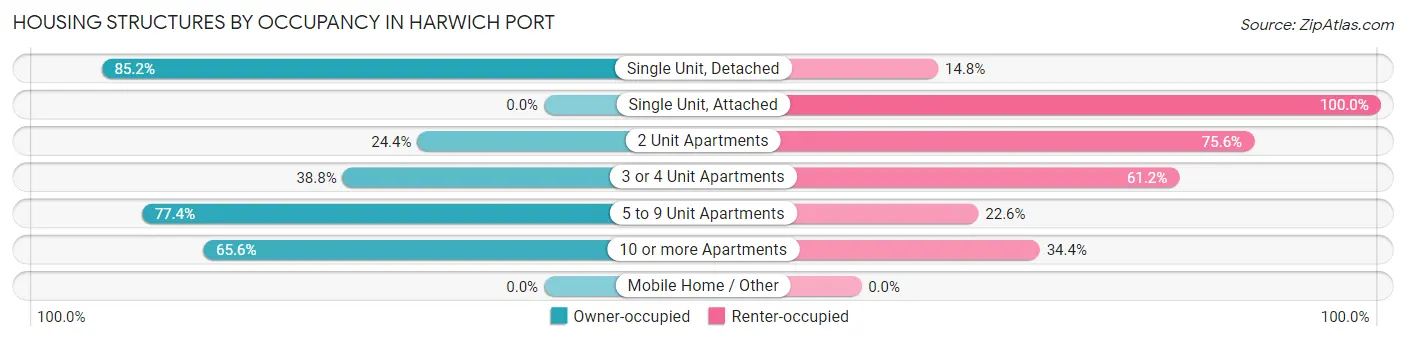
| Structure Type | Owner-occupied | Renter-occupied |
| Single Unit, Detached | 713 (85.2%) | 124 (14.8%) |
| Single Unit, Attached | 0 (0.0%) | 9 (100.0%) |
| 2 Unit Apartments | 10 (24.4%) | 31 (75.6%) |
| 3 or 4 Unit Apartments | 45 (38.8%) | 71 (61.2%) |
| 5 to 9 Unit Apartments | 127 (77.4%) | 37 (22.6%) |
| 10 or more Apartments | 21 (65.6%) | 11 (34.4%) |
| Mobile Home / Other | 0 (0.0%) | 0 (0.0%) |
| Total | 916 (76.4%) | 283 (23.6%) |
Housing Structures by Number of Rooms in Harwich Port
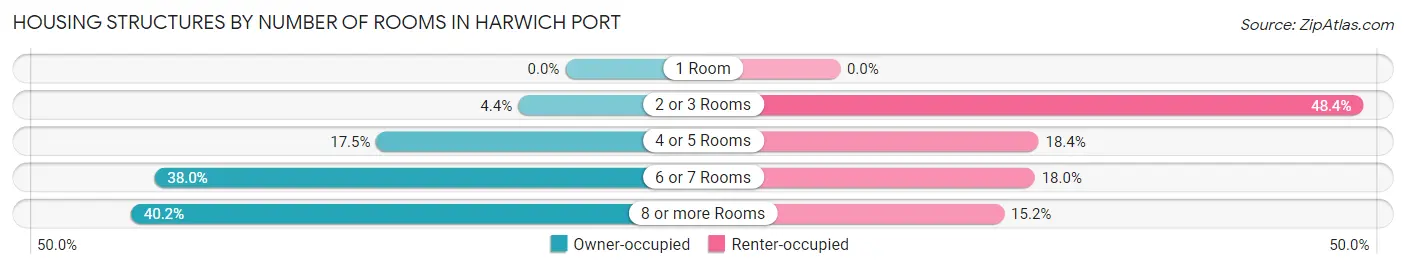
| Number of Rooms | Owner-occupied | Renter-occupied |
| 1 Room | 0 (0.0%) | 0 (0.0%) |
| 2 or 3 Rooms | 40 (4.4%) | 137 (48.4%) |
| 4 or 5 Rooms | 160 (17.5%) | 52 (18.4%) |
| 6 or 7 Rooms | 348 (38.0%) | 51 (18.0%) |
| 8 or more Rooms | 368 (40.2%) | 43 (15.2%) |
| Total | 916 (100.0%) | 283 (100.0%) |
Housing Structure by Heating Type in Harwich Port
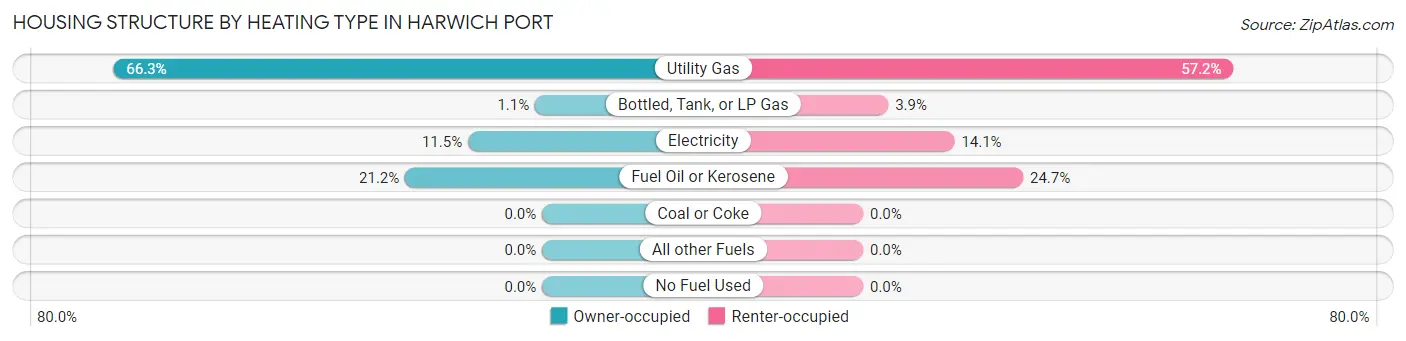
| Heating Type | Owner-occupied | Renter-occupied |
| Utility Gas | 607 (66.3%) | 162 (57.2%) |
| Bottled, Tank, or LP Gas | 10 (1.1%) | 11 (3.9%) |
| Electricity | 105 (11.5%) | 40 (14.1%) |
| Fuel Oil or Kerosene | 194 (21.2%) | 70 (24.7%) |
| Coal or Coke | 0 (0.0%) | 0 (0.0%) |
| All other Fuels | 0 (0.0%) | 0 (0.0%) |
| No Fuel Used | 0 (0.0%) | 0 (0.0%) |
| Total | 916 (100.0%) | 283 (100.0%) |
Household Vehicle Usage in Harwich Port
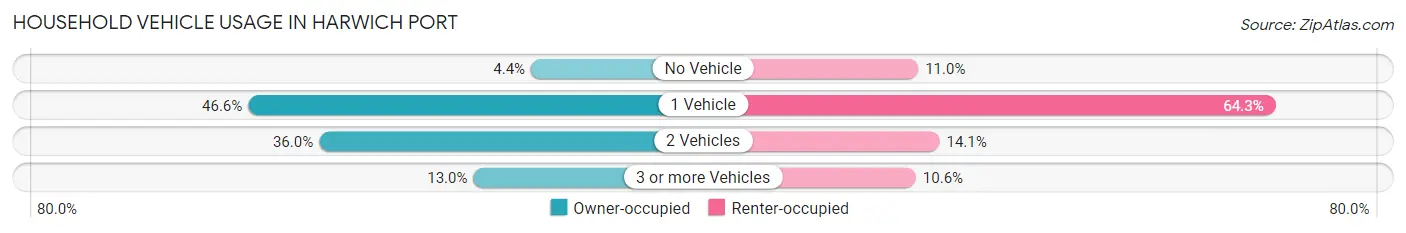
| Vehicles per Household | Owner-occupied | Renter-occupied |
| No Vehicle | 40 (4.4%) | 31 (11.0%) |
| 1 Vehicle | 427 (46.6%) | 182 (64.3%) |
| 2 Vehicles | 330 (36.0%) | 40 (14.1%) |
| 3 or more Vehicles | 119 (13.0%) | 30 (10.6%) |
| Total | 916 (100.0%) | 283 (100.0%) |
Real Estate & Mortgages in Harwich Port
Real Estate and Mortgage Overview in Harwich Port
| Characteristic | Without Mortgage | With Mortgage |
| Housing Units | 453 | 463 |
| Median Property Value | $603,200 | $611,500 |
| Median Household Income | $42,091 | $115 |
| Monthly Housing Costs | $994 | $92 |
| Real Estate Taxes | $4,885 | $0 |
Property Value by Mortgage Status in Harwich Port
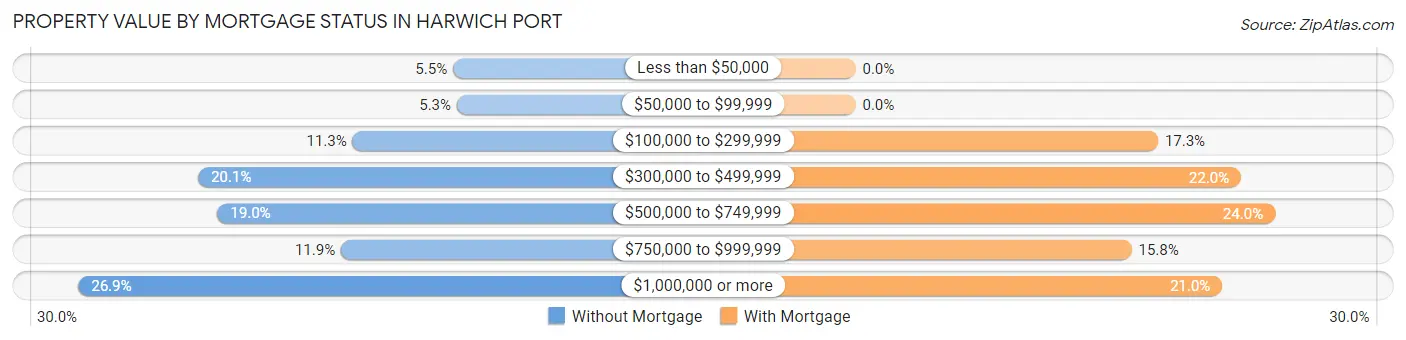
| Property Value | Without Mortgage | With Mortgage |
| Less than $50,000 | 25 (5.5%) | 0 (0.0%) |
| $50,000 to $99,999 | 24 (5.3%) | 0 (0.0%) |
| $100,000 to $299,999 | 51 (11.3%) | 80 (17.3%) |
| $300,000 to $499,999 | 91 (20.1%) | 102 (22.0%) |
| $500,000 to $749,999 | 86 (19.0%) | 111 (24.0%) |
| $750,000 to $999,999 | 54 (11.9%) | 73 (15.8%) |
| $1,000,000 or more | 122 (26.9%) | 97 (20.9%) |
| Total | 453 (100.0%) | 463 (100.0%) |
Household Income by Mortgage Status in Harwich Port
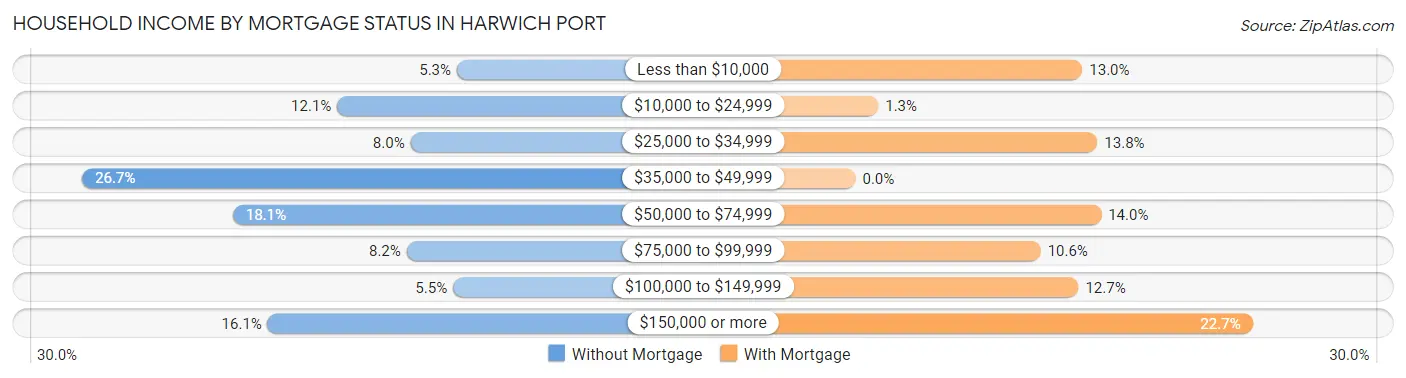
| Household Income | Without Mortgage | With Mortgage |
| Less than $10,000 | 24 (5.3%) | 60 (13.0%) |
| $10,000 to $24,999 | 55 (12.1%) | 6 (1.3%) |
| $25,000 to $34,999 | 36 (8.0%) | 64 (13.8%) |
| $35,000 to $49,999 | 121 (26.7%) | 0 (0.0%) |
| $50,000 to $74,999 | 82 (18.1%) | 65 (14.0%) |
| $75,000 to $99,999 | 37 (8.2%) | 49 (10.6%) |
| $100,000 to $149,999 | 25 (5.5%) | 59 (12.7%) |
| $150,000 or more | 73 (16.1%) | 105 (22.7%) |
| Total | 453 (100.0%) | 463 (100.0%) |
Property Value to Household Income Ratio in Harwich Port
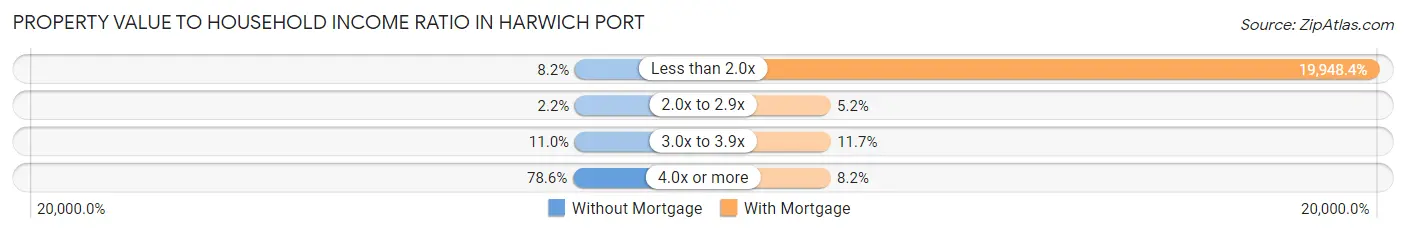
| Value-to-Income Ratio | Without Mortgage | With Mortgage |
| Less than 2.0x | 37 (8.2%) | 92,361 (19,948.4%) |
| 2.0x to 2.9x | 10 (2.2%) | 24 (5.2%) |
| 3.0x to 3.9x | 50 (11.0%) | 54 (11.7%) |
| 4.0x or more | 356 (78.6%) | 38 (8.2%) |
| Total | 453 (100.0%) | 463 (100.0%) |
Real Estate Taxes by Mortgage Status in Harwich Port
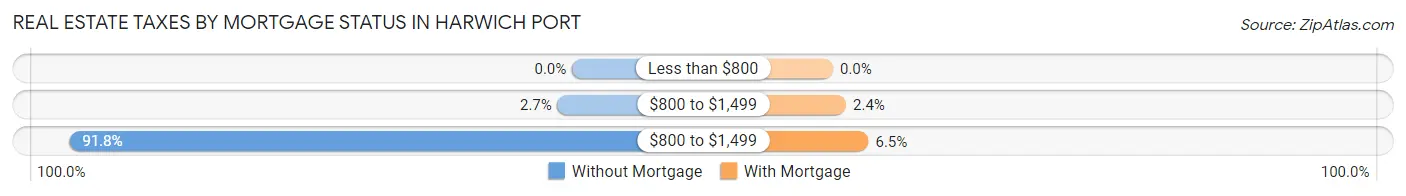
| Property Taxes | Without Mortgage | With Mortgage |
| Less than $800 | 0 (0.0%) | 0 (0.0%) |
| $800 to $1,499 | 12 (2.6%) | 11 (2.4%) |
| $800 to $1,499 | 416 (91.8%) | 30 (6.5%) |
| Total | 453 (100.0%) | 463 (100.0%) |
Health & Disability in Harwich Port
Health Insurance Coverage by Age in Harwich Port
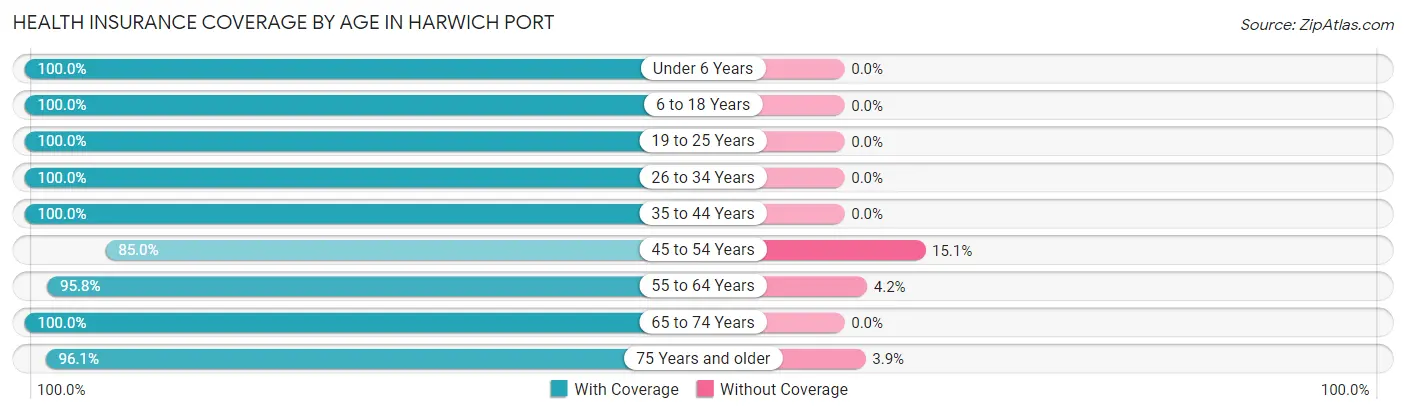
| Age Bracket | With Coverage | Without Coverage |
| Under 6 Years | 38 (100.0%) | 0 (0.0%) |
| 6 to 18 Years | 154 (100.0%) | 0 (0.0%) |
| 19 to 25 Years | 170 (100.0%) | 0 (0.0%) |
| 26 to 34 Years | 147 (100.0%) | 0 (0.0%) |
| 35 to 44 Years | 97 (100.0%) | 0 (0.0%) |
| 45 to 54 Years | 175 (85.0%) | 31 (15.0%) |
| 55 to 64 Years | 410 (95.8%) | 18 (4.2%) |
| 65 to 74 Years | 343 (100.0%) | 0 (0.0%) |
| 75 Years and older | 612 (96.1%) | 25 (3.9%) |
| Total | 2,146 (96.7%) | 74 (3.3%) |
Health Insurance Coverage by Citizenship Status in Harwich Port
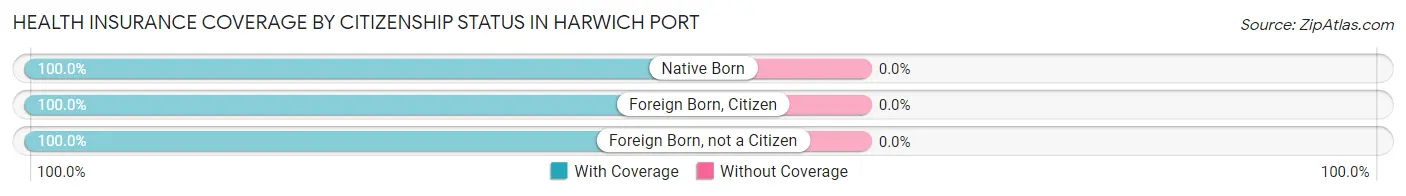
| Citizenship Status | With Coverage | Without Coverage |
| Native Born | 38 (100.0%) | 0 (0.0%) |
| Foreign Born, Citizen | 154 (100.0%) | 0 (0.0%) |
| Foreign Born, not a Citizen | 170 (100.0%) | 0 (0.0%) |
Health Insurance Coverage by Household Income in Harwich Port
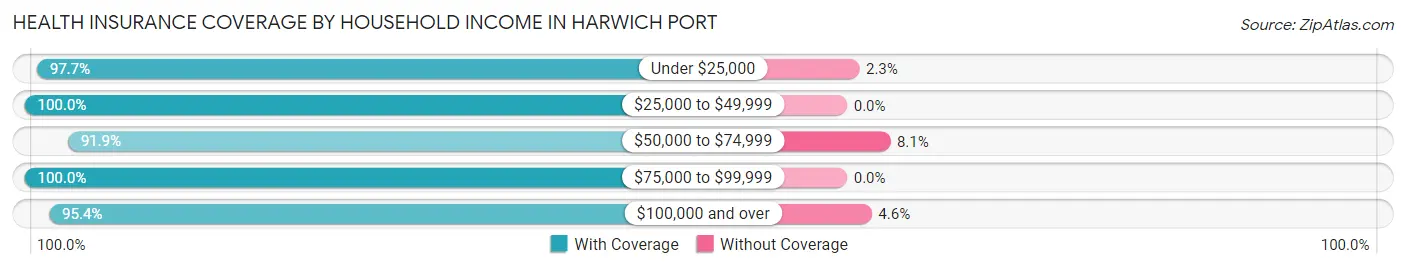
| Household Income | With Coverage | Without Coverage |
| Under $25,000 | 256 (97.7%) | 6 (2.3%) |
| $25,000 to $49,999 | 410 (100.0%) | 0 (0.0%) |
| $50,000 to $74,999 | 284 (91.9%) | 25 (8.1%) |
| $75,000 to $99,999 | 267 (100.0%) | 0 (0.0%) |
| $100,000 and over | 890 (95.4%) | 43 (4.6%) |
Public vs Private Health Insurance Coverage by Age in Harwich Port
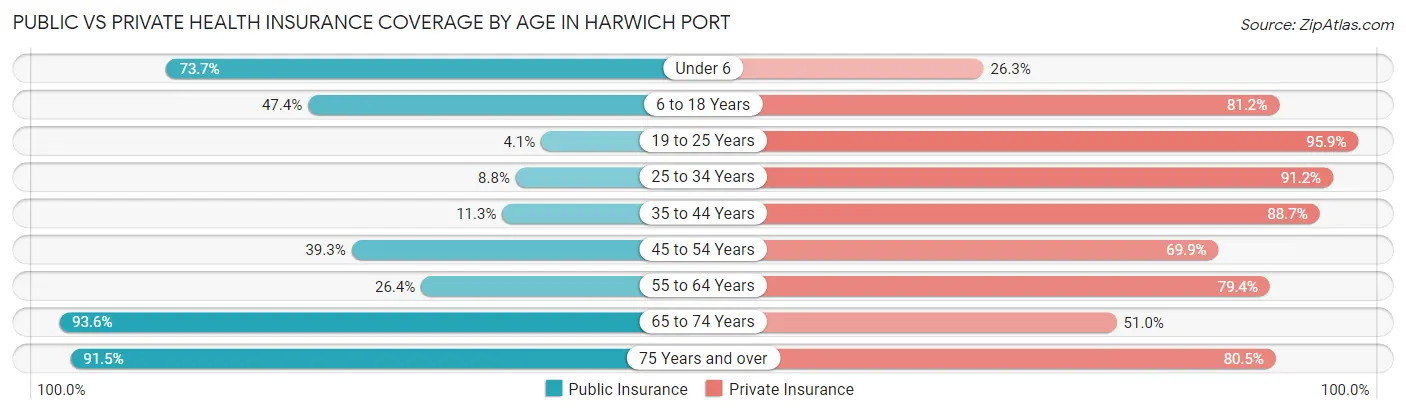
| Age Bracket | Public Insurance | Private Insurance |
| Under 6 | 28 (73.7%) | 10 (26.3%) |
| 6 to 18 Years | 73 (47.4%) | 125 (81.2%) |
| 19 to 25 Years | 7 (4.1%) | 163 (95.9%) |
| 25 to 34 Years | 13 (8.8%) | 134 (91.2%) |
| 35 to 44 Years | 11 (11.3%) | 86 (88.7%) |
| 45 to 54 Years | 81 (39.3%) | 144 (69.9%) |
| 55 to 64 Years | 113 (26.4%) | 340 (79.4%) |
| 65 to 74 Years | 321 (93.6%) | 175 (51.0%) |
| 75 Years and over | 583 (91.5%) | 513 (80.5%) |
| Total | 1,230 (55.4%) | 1,690 (76.1%) |
Disability Status by Sex by Age in Harwich Port
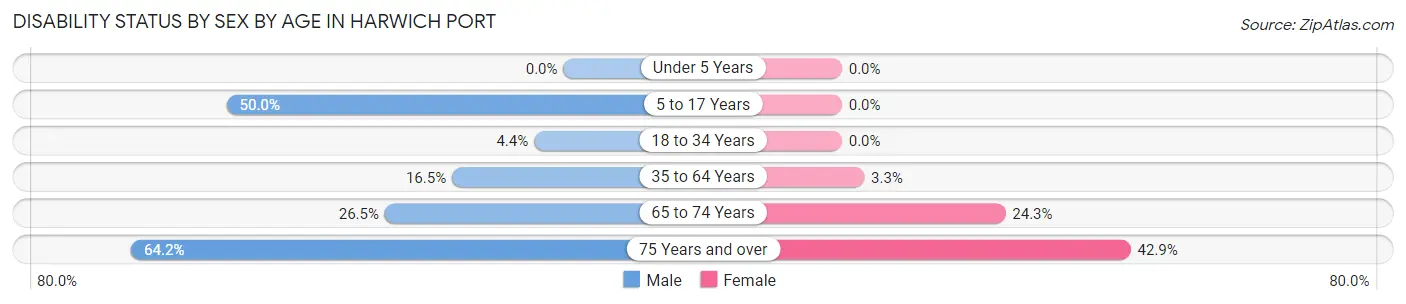
| Age Bracket | Male | Female |
| Under 5 Years | 0 (0.0%) | 0 (0.0%) |
| 5 to 17 Years | 22 (50.0%) | 0 (0.0%) |
| 18 to 34 Years | 12 (4.3%) | 0 (0.0%) |
| 35 to 64 Years | 66 (16.5%) | 11 (3.3%) |
| 65 to 74 Years | 44 (26.5%) | 43 (24.3%) |
| 75 Years and over | 120 (64.2%) | 193 (42.9%) |
Disability Class by Sex by Age in Harwich Port
Disability Class: Hearing Difficulty
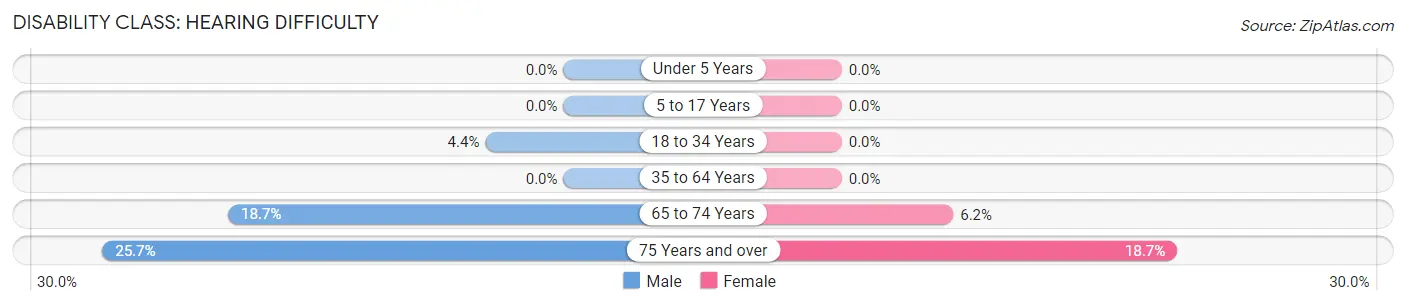
| Age Bracket | Male | Female |
| Under 5 Years | 0 (0.0%) | 0 (0.0%) |
| 5 to 17 Years | 0 (0.0%) | 0 (0.0%) |
| 18 to 34 Years | 12 (4.3%) | 0 (0.0%) |
| 35 to 64 Years | 0 (0.0%) | 0 (0.0%) |
| 65 to 74 Years | 31 (18.7%) | 11 (6.2%) |
| 75 Years and over | 48 (25.7%) | 84 (18.7%) |
Disability Class: Vision Difficulty
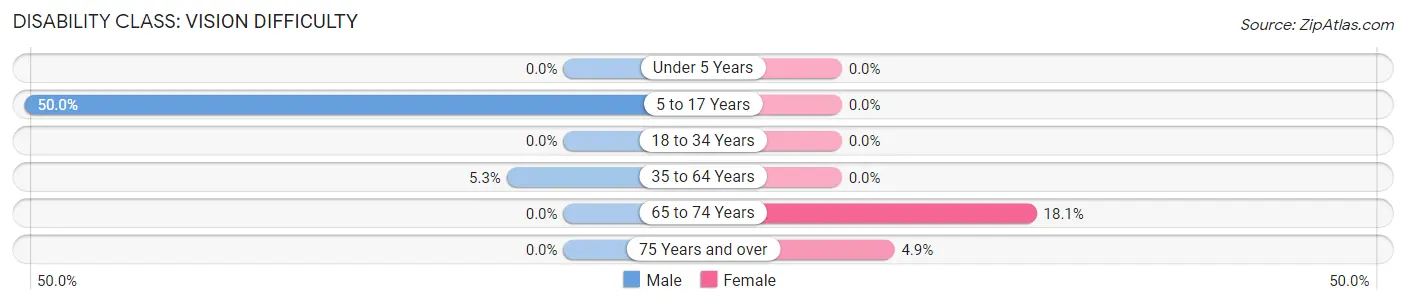
| Age Bracket | Male | Female |
| Under 5 Years | 0 (0.0%) | 0 (0.0%) |
| 5 to 17 Years | 22 (50.0%) | 0 (0.0%) |
| 18 to 34 Years | 0 (0.0%) | 0 (0.0%) |
| 35 to 64 Years | 21 (5.3%) | 0 (0.0%) |
| 65 to 74 Years | 0 (0.0%) | 32 (18.1%) |
| 75 Years and over | 0 (0.0%) | 22 (4.9%) |
Disability Class: Cognitive Difficulty
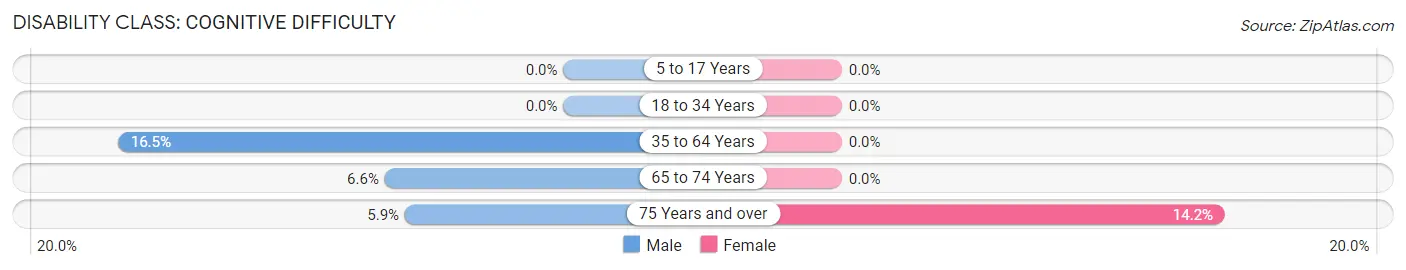
| Age Bracket | Male | Female |
| 5 to 17 Years | 0 (0.0%) | 0 (0.0%) |
| 18 to 34 Years | 0 (0.0%) | 0 (0.0%) |
| 35 to 64 Years | 66 (16.5%) | 0 (0.0%) |
| 65 to 74 Years | 11 (6.6%) | 0 (0.0%) |
| 75 Years and over | 11 (5.9%) | 64 (14.2%) |
Disability Class: Ambulatory Difficulty
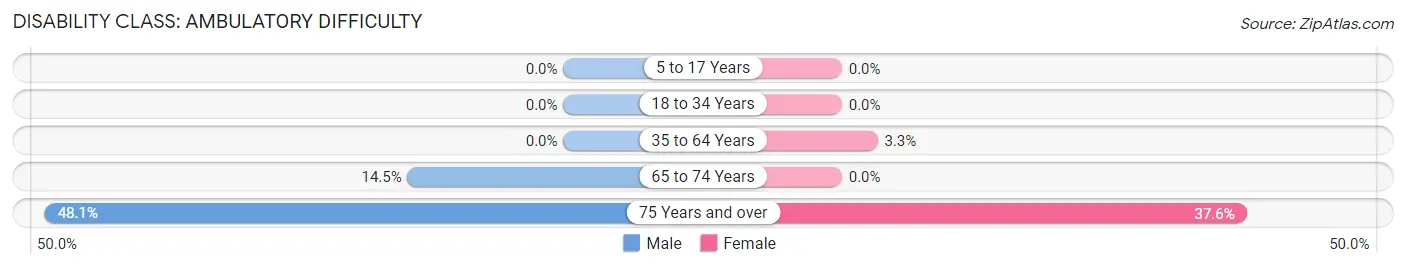
| Age Bracket | Male | Female |
| 5 to 17 Years | 0 (0.0%) | 0 (0.0%) |
| 18 to 34 Years | 0 (0.0%) | 0 (0.0%) |
| 35 to 64 Years | 0 (0.0%) | 11 (3.3%) |
| 65 to 74 Years | 24 (14.5%) | 0 (0.0%) |
| 75 Years and over | 90 (48.1%) | 169 (37.6%) |
Disability Class: Self-Care Difficulty
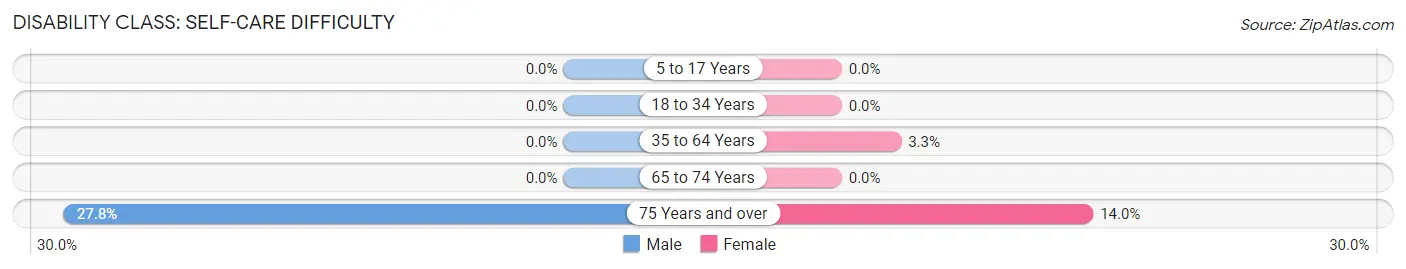
| Age Bracket | Male | Female |
| 5 to 17 Years | 0 (0.0%) | 0 (0.0%) |
| 18 to 34 Years | 0 (0.0%) | 0 (0.0%) |
| 35 to 64 Years | 0 (0.0%) | 11 (3.3%) |
| 65 to 74 Years | 0 (0.0%) | 0 (0.0%) |
| 75 Years and over | 52 (27.8%) | 63 (14.0%) |
Technology Access in Harwich Port
Computing Device Access in Harwich Port
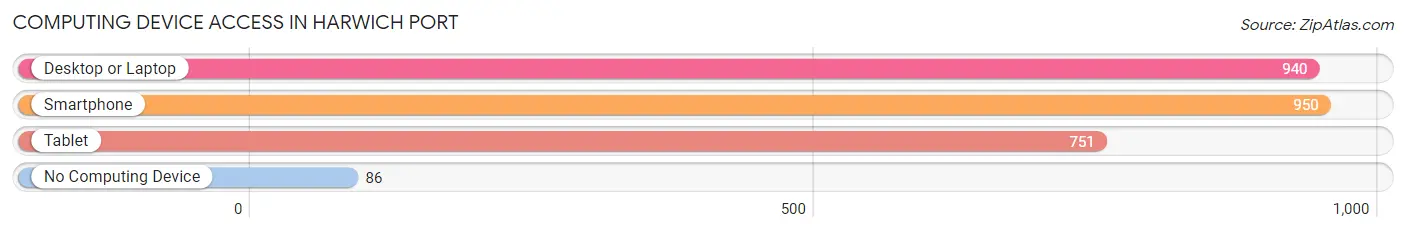
| Device Type | # Households | % Households |
| Desktop or Laptop | 940 | 78.4% |
| Smartphone | 950 | 79.2% |
| Tablet | 751 | 62.6% |
| No Computing Device | 86 | 7.2% |
| Total | 1,199 | 100.0% |
Internet Access in Harwich Port
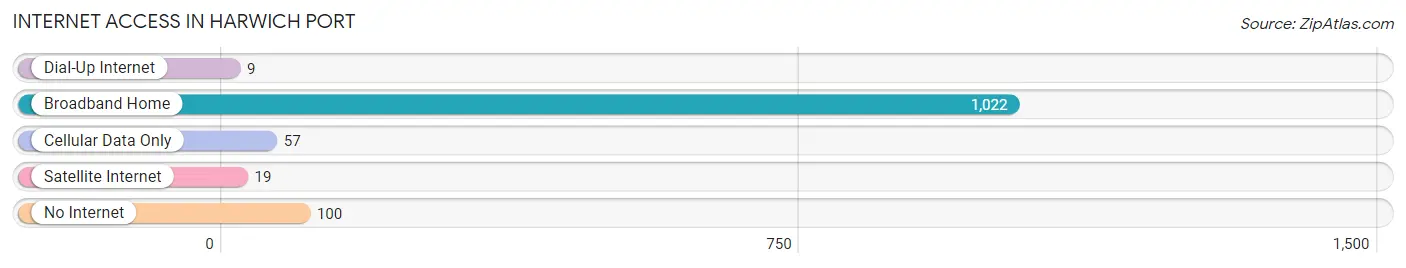
| Internet Type | # Households | % Households |
| Dial-Up Internet | 9 | 0.7% |
| Broadband Home | 1,022 | 85.2% |
| Cellular Data Only | 57 | 4.8% |
| Satellite Internet | 19 | 1.6% |
| No Internet | 100 | 8.3% |
| Total | 1,199 | 100.0% |
Harwich Port Summary
Harwich Port is a small village located on the south side of Cape Cod in Massachusetts. It is part of the town of Harwich and is located in Barnstable County. The village is situated on the Nantucket Sound and is bordered by the towns of Chatham, Brewster, and Dennis. The village has a population of 1,743 as of the 2010 census.
History
Harwich Port was first settled in 1694 by a group of settlers from Plymouth. The settlers were led by Captain John Smith and were looking for a place to settle and start a fishing industry. The area was originally known as Smith's Harbor, but was later changed to Harwich Port in 1834.
The village was a popular summer destination for wealthy families from Boston and New York in the late 19th century. The village was also home to a number of shipbuilding companies, which built vessels for the whaling and fishing industries.
Geography
Harwich Port is located on the south side of Cape Cod in Massachusetts. It is part of the town of Harwich and is located in Barnstable County. The village is situated on the Nantucket Sound and is bordered by the towns of Chatham, Brewster, and Dennis.
The village has a total area of 1.2 square miles, all of which is land. The village is located on a peninsula, with the Nantucket Sound to the east and the Herring River to the west.
Economy
Harwich Port is a popular tourist destination, with many visitors coming to the village to enjoy its beaches, restaurants, and shops. The village is also home to a number of small businesses, including restaurants, retail stores, and art galleries.
The village is also home to a number of marinas, which provide services to boaters and fishermen. The village is also home to a number of boatyards, which provide services to boat owners.
Demographics
As of the 2010 census, the village had a population of 1,743. The population is predominantly white, with a small percentage of African Americans, Hispanics, and Asians. The median household income is $63,750, and the median home value is $521,000.
The village is home to a number of churches, including the First Congregational Church, the United Methodist Church, and the Church of the Transfiguration. The village is also home to a number of schools, including the Harwich Elementary School, the Harwich Middle School, and the Harwich High School.
Conclusion
Harwich Port is a small village located on the south side of Cape Cod in Massachusetts. It is part of the town of Harwich and is located in Barnstable County. The village is situated on the Nantucket Sound and is bordered by the towns of Chatham, Brewster, and Dennis. The village has a population of 1,743 as of the 2010 census. The village is a popular tourist destination, with many visitors coming to the village to enjoy its beaches, restaurants, and shops. The village is also home to a number of small businesses, including restaurants, retail stores, and art galleries. The population is predominantly white, with a small percentage of African Americans, Hispanics, and Asians. The median household income is $63,750, and the median home value is $521,000.
Common Questions
What is Per Capita Income in Harwich Port?
Per Capita income in Harwich Port is $57,956.
What is the Median Family Income in Harwich Port?
Median Family Income in Harwich Port is $101,042.
What is the Median Household income in Harwich Port?
Median Household Income in Harwich Port is $58,854.
What is Inequality or Gini Index in Harwich Port?
Inequality or Gini Index in Harwich Port is 0.54.
What is the Total Population of Harwich Port?
Total Population of Harwich Port is 2,252.
What is the Total Male Population of Harwich Port?
Total Male Population of Harwich Port is 1,107.
What is the Total Female Population of Harwich Port?
Total Female Population of Harwich Port is 1,145.
What is the Ratio of Males per 100 Females in Harwich Port?
There are 96.68 Males per 100 Females in Harwich Port.
What is the Ratio of Females per 100 Males in Harwich Port?
There are 103.43 Females per 100 Males in Harwich Port.
What is the Median Population Age in Harwich Port?
Median Population Age in Harwich Port is 63.5 Years.
What is the Average Family Size in Harwich Port
Average Family Size in Harwich Port is 2.6 People.
What is the Average Household Size in Harwich Port
Average Household Size in Harwich Port is 1.8 People.
How Large is the Labor Force in Harwich Port?
There are 1,094 People in the Labor Forcein in Harwich Port.
What is the Percentage of People in the Labor Force in Harwich Port?
52.4% of People are in the Labor Force in Harwich Port.
What is the Unemployment Rate in Harwich Port?
Unemployment Rate in Harwich Port is 4.3%.