East Falmouth, MA Map & Demographics
East Falmouth Map
East Falmouth Overview
$54,127
PER CAPITA INCOME
$99,457
AVG FAMILY INCOME
$67,964
AVG HOUSEHOLD INCOME
27.6%
WAGE / INCOME GAP [ % ]
72.4¢/ $1
WAGE / INCOME GAP [ $ ]
0.50
INEQUALITY / GINI INDEX
6,558
TOTAL POPULATION
3,072
MALE POPULATION
3,486
FEMALE POPULATION
88.12
MALES / 100 FEMALES
113.48
FEMALES / 100 MALES
58.7
MEDIAN AGE
2.7
AVG FAMILY SIZE
2.2
AVG HOUSEHOLD SIZE
3,364
LABOR FORCE [ PEOPLE ]
57.7%
PERCENT IN LABOR FORCE
4.7%
UNEMPLOYMENT RATE
East Falmouth Zip Codes
East Falmouth Area Codes
Income in East Falmouth
Income Overview in East Falmouth
Per Capita Income in East Falmouth is $54,127, while median incomes of families and households are $99,457 and $67,964 respectively.
| Characteristic | Number | Measure |
| Per Capita Income | 6,558 | $54,127 |
| Median Family Income | 1,776 | $99,457 |
| Mean Family Income | 1,776 | $148,480 |
| Median Household Income | 3,009 | $67,964 |
| Mean Household Income | 3,009 | $117,387 |
| Income Deficit | 1,776 | $0 |
| Wage / Income Gap (%) | 6,558 | 27.57% |
| Wage / Income Gap ($) | 6,558 | 72.43¢ per $1 |
| Gini / Inequality Index | 6,558 | 0.50 |
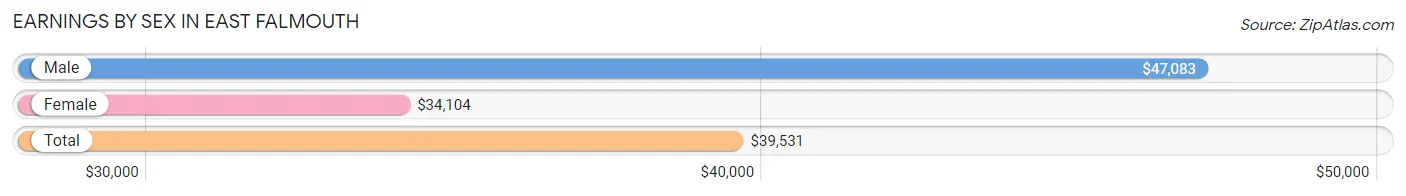
Earnings by Sex in East Falmouth
Average Earnings in East Falmouth are $39,531, $47,083 for men and $34,104 for women, a difference of 27.6%.
| Sex | Number | Average Earnings |
| Male | 1,763 (49.1%) | $47,083 |
| Female | 1,825 (50.9%) | $34,104 |
| Total | 3,588 (100.0%) | $39,531 |
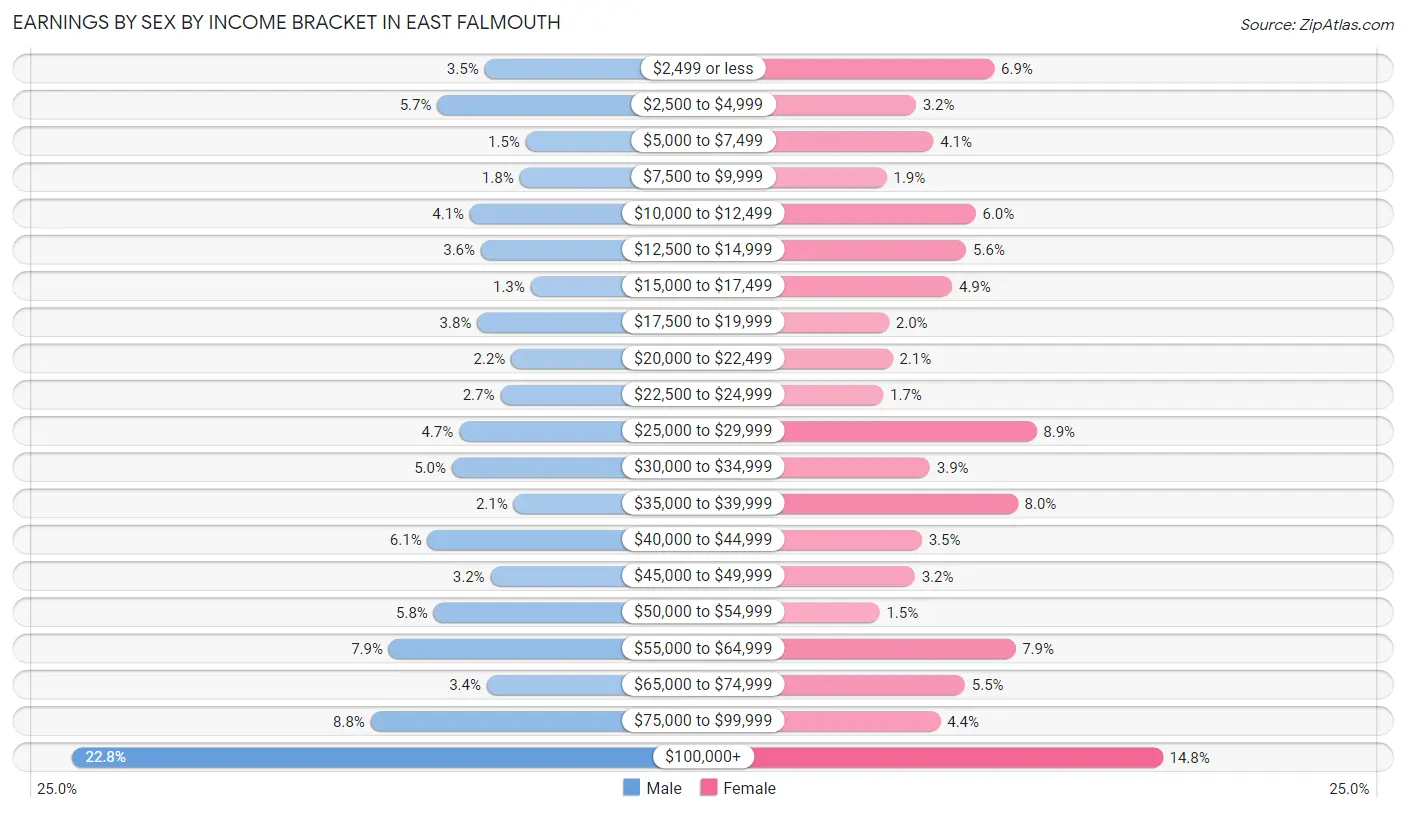
Earnings by Sex by Income Bracket in East Falmouth
The most common earnings brackets in East Falmouth are $100,000+ for men (401 | 22.8%) and $100,000+ for women (270 | 14.8%).
| Income | Male | Female |
| $2,499 or less | 61 (3.5%) | 126 (6.9%) |
| $2,500 to $4,999 | 100 (5.7%) | 59 (3.2%) |
| $5,000 to $7,499 | 27 (1.5%) | 74 (4.1%) |
| $7,500 to $9,999 | 32 (1.8%) | 34 (1.9%) |
| $10,000 to $12,499 | 73 (4.1%) | 110 (6.0%) |
| $12,500 to $14,999 | 64 (3.6%) | 102 (5.6%) |
| $15,000 to $17,499 | 23 (1.3%) | 90 (4.9%) |
| $17,500 to $19,999 | 67 (3.8%) | 36 (2.0%) |
| $20,000 to $22,499 | 39 (2.2%) | 39 (2.1%) |
| $22,500 to $24,999 | 48 (2.7%) | 31 (1.7%) |
| $25,000 to $29,999 | 82 (4.6%) | 162 (8.9%) |
| $30,000 to $34,999 | 88 (5.0%) | 71 (3.9%) |
| $35,000 to $39,999 | 37 (2.1%) | 146 (8.0%) |
| $40,000 to $44,999 | 108 (6.1%) | 64 (3.5%) |
| $45,000 to $49,999 | 56 (3.2%) | 58 (3.2%) |
| $50,000 to $54,999 | 103 (5.8%) | 28 (1.5%) |
| $55,000 to $64,999 | 140 (7.9%) | 144 (7.9%) |
| $65,000 to $74,999 | 59 (3.4%) | 101 (5.5%) |
| $75,000 to $99,999 | 155 (8.8%) | 80 (4.4%) |
| $100,000+ | 401 (22.8%) | 270 (14.8%) |
| Total | 1,763 (100.0%) | 1,825 (100.0%) |
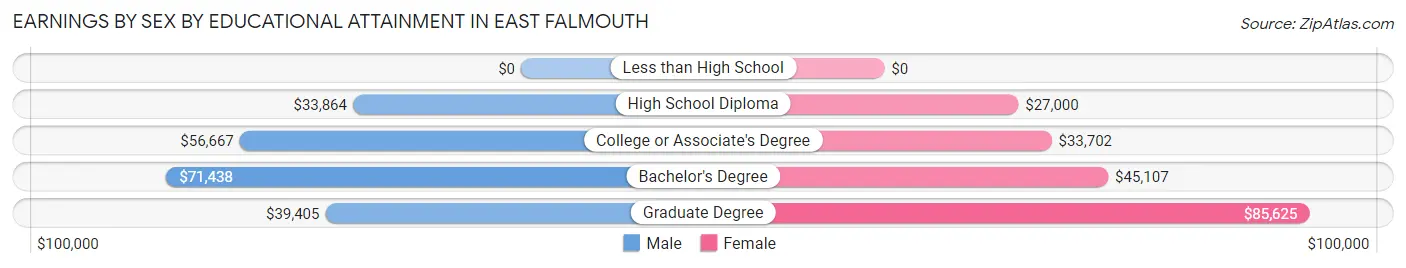
Earnings by Sex by Educational Attainment in East Falmouth
Average earnings in East Falmouth are $53,775 for men and $37,235 for women, a difference of 30.8%. Men with an educational attainment of bachelor's degree enjoy the highest average annual earnings of $71,438, while those with high school diploma education earn the least with $33,864. Women with an educational attainment of graduate degree earn the most with the average annual earnings of $85,625, while those with high school diploma education have the smallest earnings of $27,000.
| Educational Attainment | Male Income | Female Income |
| Less than High School | - | - |
| High School Diploma | $33,864 | $27,000 |
| College or Associate's Degree | $56,667 | $33,702 |
| Bachelor's Degree | $71,438 | $45,107 |
| Graduate Degree | $39,405 | $85,625 |
| Total | $53,775 | $37,235 |
Family Income in East Falmouth
Family Income Brackets in East Falmouth
According to the East Falmouth family income data, there are 318 families falling into the $200,000+ income range, which is the most common income bracket and makes up 17.9% of all families. Conversely, the less than $10,000 income bracket is the least frequent group with only 9 families (0.5%) belonging to this category.
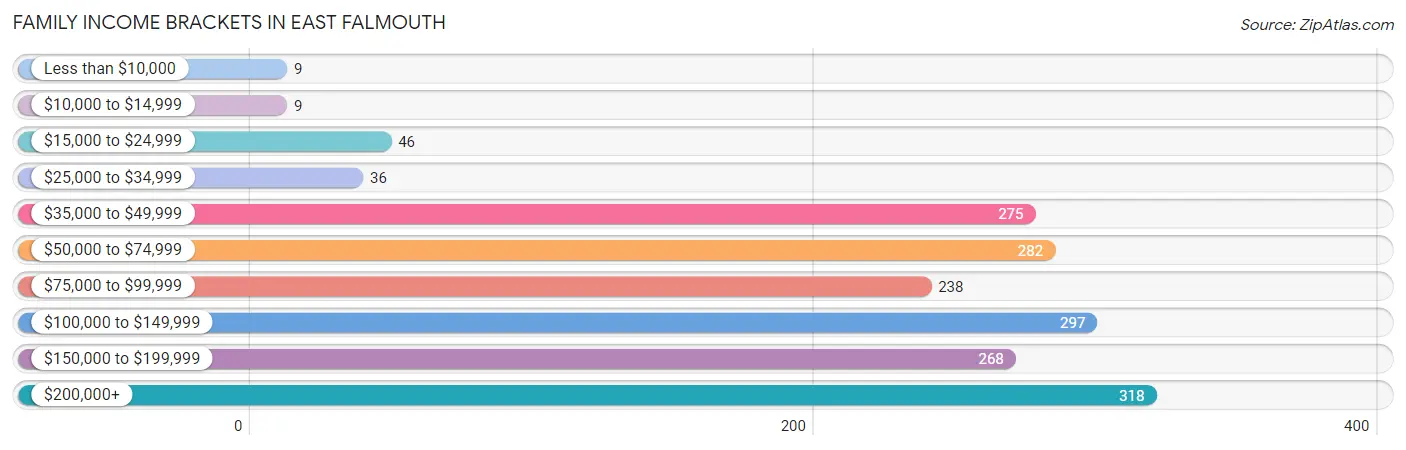
| Income Bracket | # Families | % Families |
| Less than $10,000 | 9 | 0.5% |
| $10,000 to $14,999 | 9 | 0.5% |
| $15,000 to $24,999 | 46 | 2.6% |
| $25,000 to $34,999 | 36 | 2.0% |
| $35,000 to $49,999 | 275 | 15.5% |
| $50,000 to $74,999 | 282 | 15.9% |
| $75,000 to $99,999 | 238 | 13.4% |
| $100,000 to $149,999 | 297 | 16.7% |
| $150,000 to $199,999 | 268 | 15.1% |
| $200,000+ | 318 | 17.9% |
Family Income by Famaliy Size in East Falmouth
4-person families (287 | 16.2%) account for the highest median family income in East Falmouth with $146,563 per family, while 2-person families (1,150 | 64.7%) have the highest median income of $47,440 per family member.
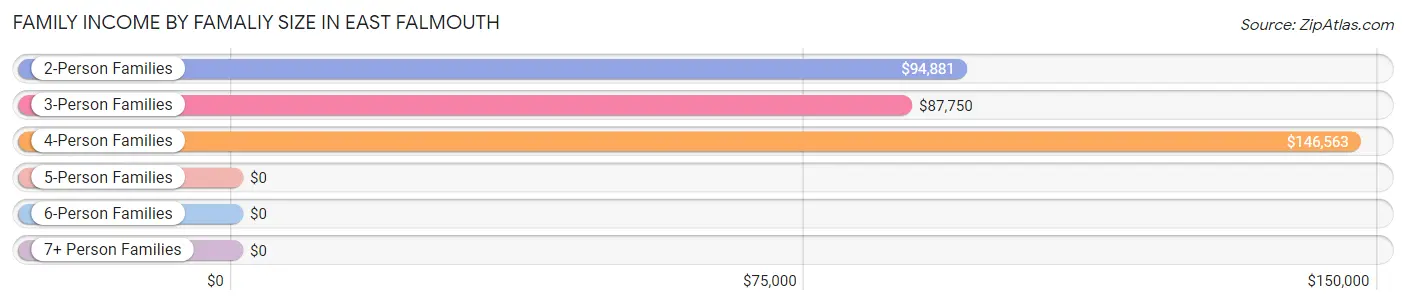
| Income Bracket | # Families | Median Income |
| 2-Person Families | 1,150 (64.7%) | $94,881 |
| 3-Person Families | 226 (12.7%) | $87,750 |
| 4-Person Families | 287 (16.2%) | $146,563 |
| 5-Person Families | 104 (5.9%) | $0 |
| 6-Person Families | 9 (0.5%) | $0 |
| 7+ Person Families | 0 (0.0%) | $0 |
| Total | 1,776 (100.0%) | $99,457 |
Family Income by Number of Earners in East Falmouth
The median family income in East Falmouth is $99,457, with families comprising 2 earners (551) having the highest median family income of $129,432, while families with no earners (437) have the lowest median family income of $67,411, accounting for 31.0% and 24.6% of families, respectively.
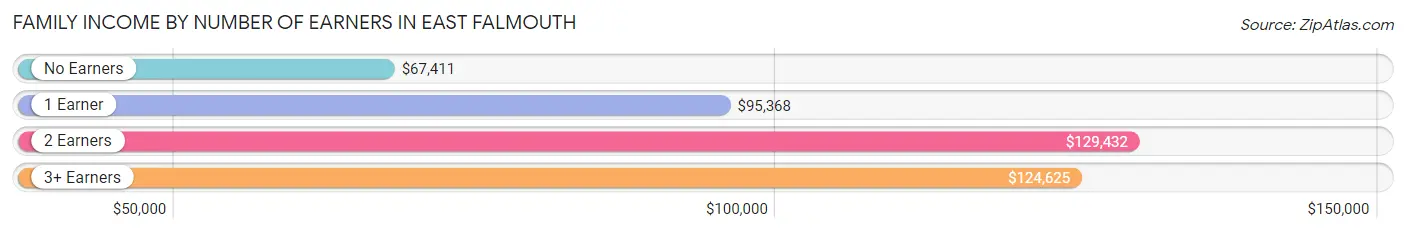
| Number of Earners | # Families | Median Income |
| No Earners | 437 (24.6%) | $67,411 |
| 1 Earner | 593 (33.4%) | $95,368 |
| 2 Earners | 551 (31.0%) | $129,432 |
| 3+ Earners | 195 (11.0%) | $124,625 |
| Total | 1,776 (100.0%) | $99,457 |
Household Income in East Falmouth
Household Income Brackets in East Falmouth
With 487 households falling in the category, the $50,000 to $74,999 income range is the most frequent in East Falmouth, accounting for 16.2% of all households. In contrast, only 63 households (2.1%) fall into the $10,000 to $14,999 income bracket, making it the least populous group.
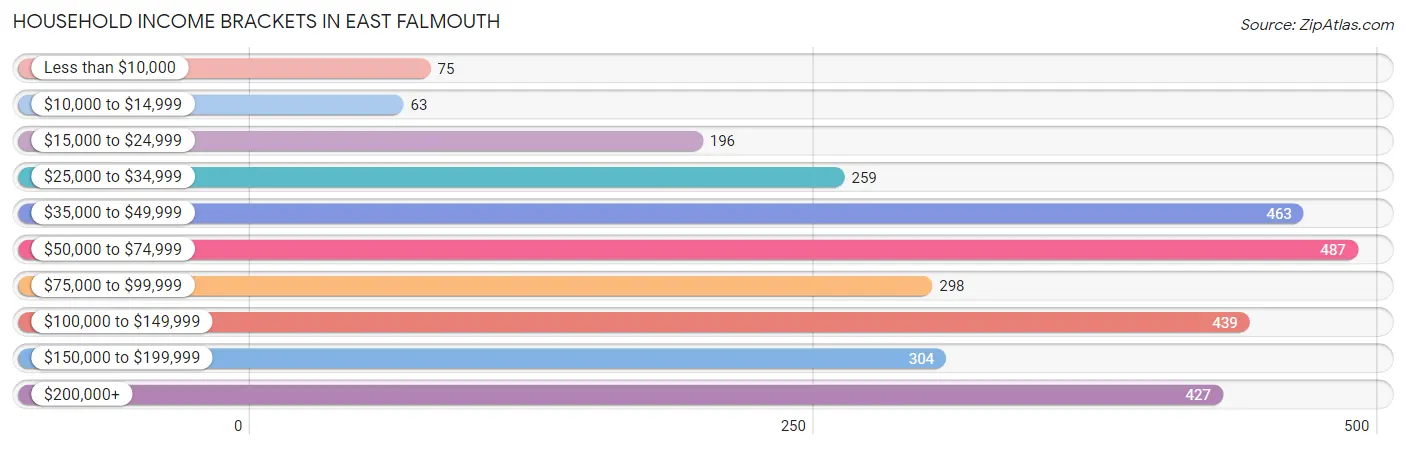
| Income Bracket | # Households | % Households |
| Less than $10,000 | 75 | 2.5% |
| $10,000 to $14,999 | 63 | 2.1% |
| $15,000 to $24,999 | 196 | 6.5% |
| $25,000 to $34,999 | 259 | 8.6% |
| $35,000 to $49,999 | 463 | 15.4% |
| $50,000 to $74,999 | 487 | 16.2% |
| $75,000 to $99,999 | 298 | 9.9% |
| $100,000 to $149,999 | 439 | 14.6% |
| $150,000 to $199,999 | 304 | 10.1% |
| $200,000+ | 427 | 14.2% |
Household Income by Householder Age in East Falmouth
The median household income in East Falmouth is $67,964, with the highest median household income of $90,694 found in the 25 to 44 years age bracket for the primary householder. A total of 327 households (10.9%) fall into this category.
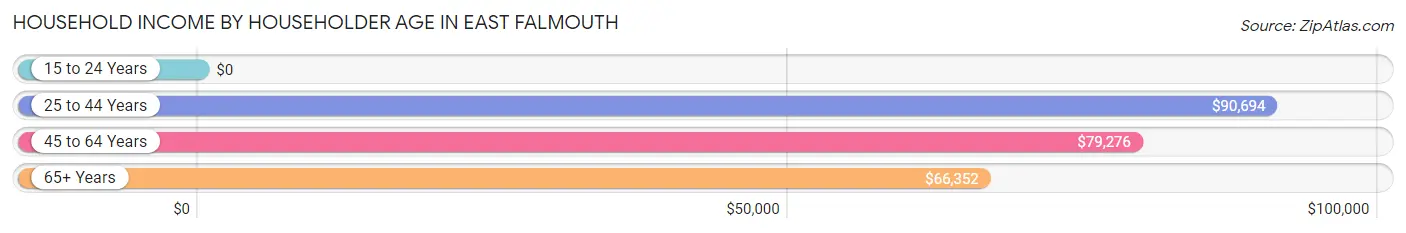
| Income Bracket | # Households | Median Income |
| 15 to 24 Years | 0 (0.0%) | $0 |
| 25 to 44 Years | 327 (10.9%) | $90,694 |
| 45 to 64 Years | 1,195 (39.7%) | $79,276 |
| 65+ Years | 1,487 (49.4%) | $66,352 |
| Total | 3,009 (100.0%) | $67,964 |
Poverty in East Falmouth
Income Below Poverty by Sex and Age in East Falmouth
With 5.7% poverty level for males and 9.9% for females among the residents of East Falmouth, 12 to 14 year old males and under 5 year old females are the most vulnerable to poverty, with 40 males (22.2%) and 19 females (23.2%) in their respective age groups living below the poverty level.
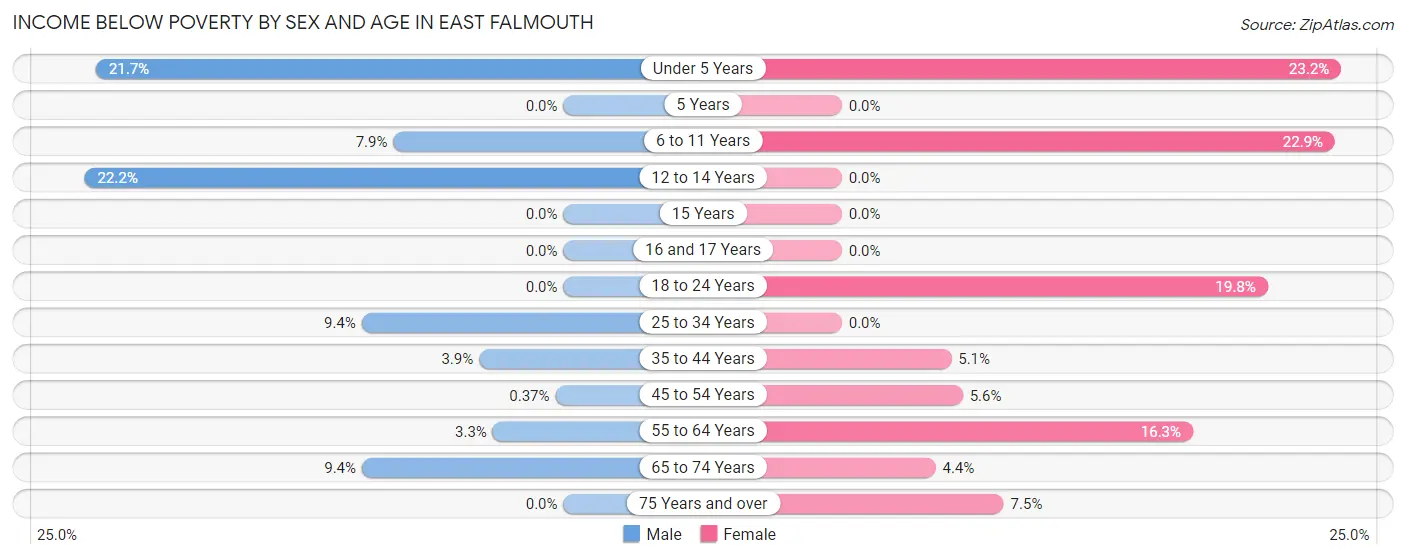
| Age Bracket | Male | Female |
| Under 5 Years | 18 (21.7%) | 19 (23.2%) |
| 5 Years | 0 (0.0%) | 0 (0.0%) |
| 6 to 11 Years | 9 (7.9%) | 35 (22.9%) |
| 12 to 14 Years | 40 (22.2%) | 0 (0.0%) |
| 15 Years | 0 (0.0%) | 0 (0.0%) |
| 16 and 17 Years | 0 (0.0%) | 0 (0.0%) |
| 18 to 24 Years | 0 (0.0%) | 49 (19.8%) |
| 25 to 34 Years | 16 (9.4%) | 0 (0.0%) |
| 35 to 44 Years | 10 (3.9%) | 10 (5.1%) |
| 45 to 54 Years | 1 (0.4%) | 18 (5.6%) |
| 55 to 64 Years | 17 (3.3%) | 146 (16.3%) |
| 65 to 74 Years | 65 (9.3%) | 31 (4.3%) |
| 75 Years and over | 0 (0.0%) | 35 (7.5%) |
| Total | 176 (5.7%) | 343 (9.9%) |
Income Above Poverty by Sex and Age in East Falmouth
According to the poverty statistics in East Falmouth, males aged 15 years and females aged 5 years are the age groups that are most secure financially, with 100.0% of males and 100.0% of females in these age groups living above the poverty line.
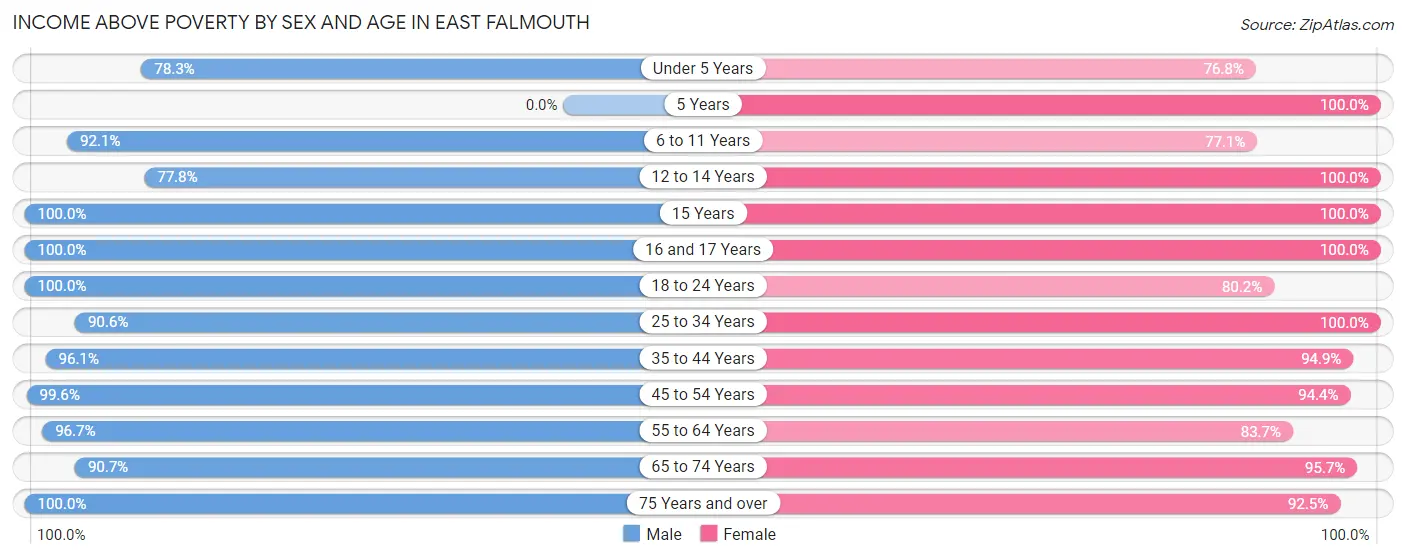
| Age Bracket | Male | Female |
| Under 5 Years | 65 (78.3%) | 63 (76.8%) |
| 5 Years | 0 (0.0%) | 13 (100.0%) |
| 6 to 11 Years | 105 (92.1%) | 118 (77.1%) |
| 12 to 14 Years | 140 (77.8%) | 49 (100.0%) |
| 15 Years | 8 (100.0%) | 22 (100.0%) |
| 16 and 17 Years | 79 (100.0%) | 84 (100.0%) |
| 18 to 24 Years | 168 (100.0%) | 199 (80.2%) |
| 25 to 34 Years | 155 (90.6%) | 219 (100.0%) |
| 35 to 44 Years | 246 (96.1%) | 187 (94.9%) |
| 45 to 54 Years | 269 (99.6%) | 303 (94.4%) |
| 55 to 64 Years | 501 (96.7%) | 750 (83.7%) |
| 65 to 74 Years | 630 (90.6%) | 682 (95.7%) |
| 75 Years and over | 530 (100.0%) | 431 (92.5%) |
| Total | 2,896 (94.3%) | 3,120 (90.1%) |
Income Below Poverty Among Married-Couple Families in East Falmouth
The poverty statistics for married-couple families in East Falmouth show that 3.5% or 53 of the total 1,511 families live below the poverty line. Families with 1 or 2 children have the highest poverty rate of 10.5%, comprising of 37 families. On the other hand, families with 3 or 4 children have the lowest poverty rate of 0.0%, which includes 0 families.
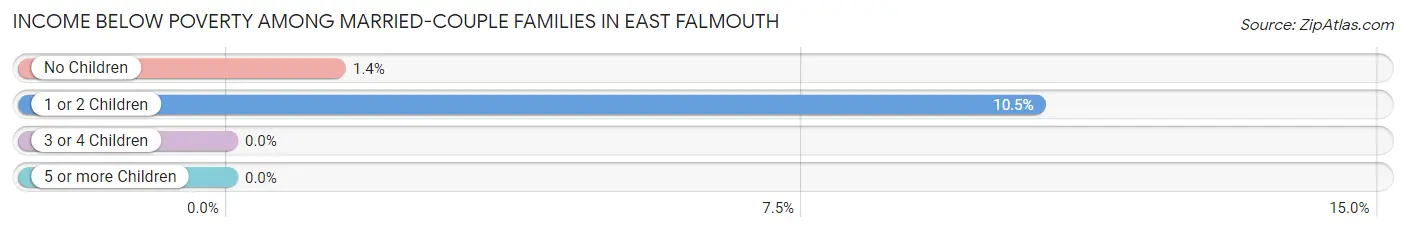
| Children | Above Poverty | Below Poverty |
| No Children | 1,118 (98.6%) | 16 (1.4%) |
| 1 or 2 Children | 314 (89.5%) | 37 (10.5%) |
| 3 or 4 Children | 26 (100.0%) | 0 (0.0%) |
| 5 or more Children | 0 (0.0%) | 0 (0.0%) |
| Total | 1,458 (96.5%) | 53 (3.5%) |
Income Below Poverty Among Single-Parent Households in East Falmouth
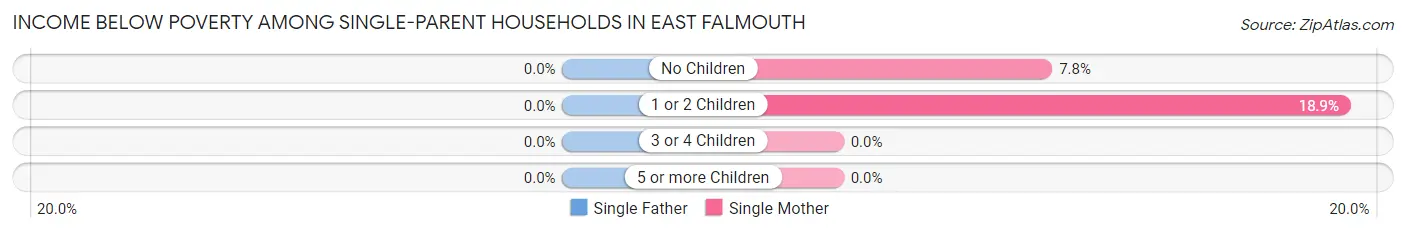
| Children | Single Father | Single Mother |
| No Children | 0 (0.0%) | 8 (7.8%) |
| 1 or 2 Children | 0 (0.0%) | 17 (18.9%) |
| 3 or 4 Children | 0 (0.0%) | 0 (0.0%) |
| 5 or more Children | 0 (0.0%) | 0 (0.0%) |
| Total | 0 (0.0%) | 25 (12.4%) |
Income Below Poverty Among Married-Couple vs Single-Parent Households in East Falmouth
The poverty data for East Falmouth shows that 53 of the married-couple family households (3.5%) and 25 of the single-parent households (9.4%) are living below the poverty level. Within the married-couple family households, those with 1 or 2 children have the highest poverty rate, with 37 households (10.5%) falling below the poverty line. Among the single-parent households, those with 1 or 2 children have the highest poverty rate, with 17 household (13.4%) living below poverty.
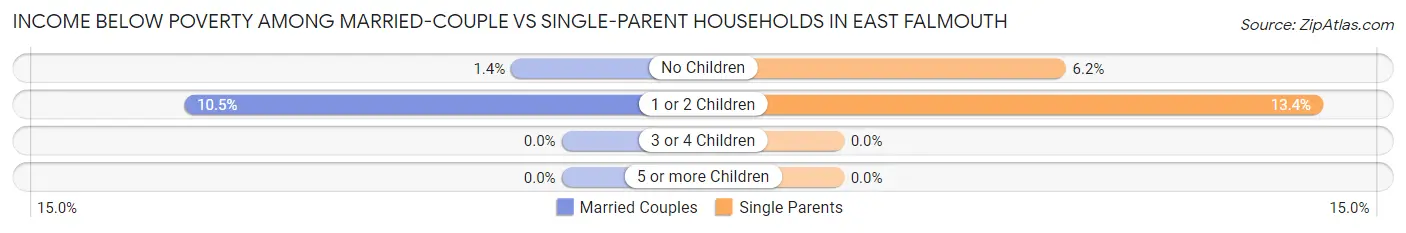
| Children | Married-Couple Families | Single-Parent Households |
| No Children | 16 (1.4%) | 8 (6.2%) |
| 1 or 2 Children | 37 (10.5%) | 17 (13.4%) |
| 3 or 4 Children | 0 (0.0%) | 0 (0.0%) |
| 5 or more Children | 0 (0.0%) | 0 (0.0%) |
| Total | 53 (3.5%) | 25 (9.4%) |
Race in East Falmouth
The most populous races in East Falmouth are White / Caucasian (5,695 | 86.8%), Two or more Races (449 | 6.9%), and Hispanic or Latino (158 | 2.4%).
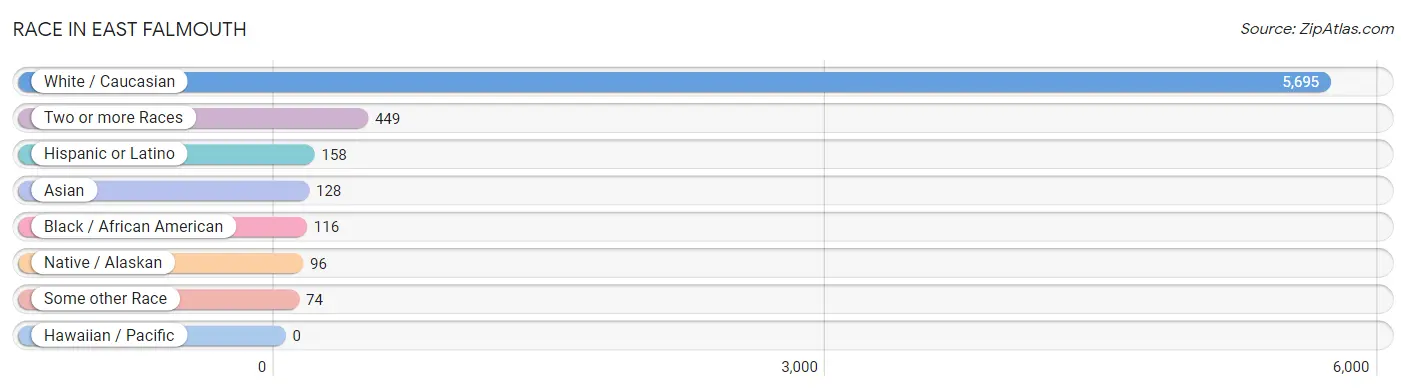
| Race | # Population | % Population |
| Asian | 128 | 1.9% |
| Black / African American | 116 | 1.8% |
| Hawaiian / Pacific | 0 | 0.0% |
| Hispanic or Latino | 158 | 2.4% |
| Native / Alaskan | 96 | 1.5% |
| White / Caucasian | 5,695 | 86.8% |
| Two or more Races | 449 | 6.9% |
| Some other Race | 74 | 1.1% |
| Total | 6,558 | 100.0% |
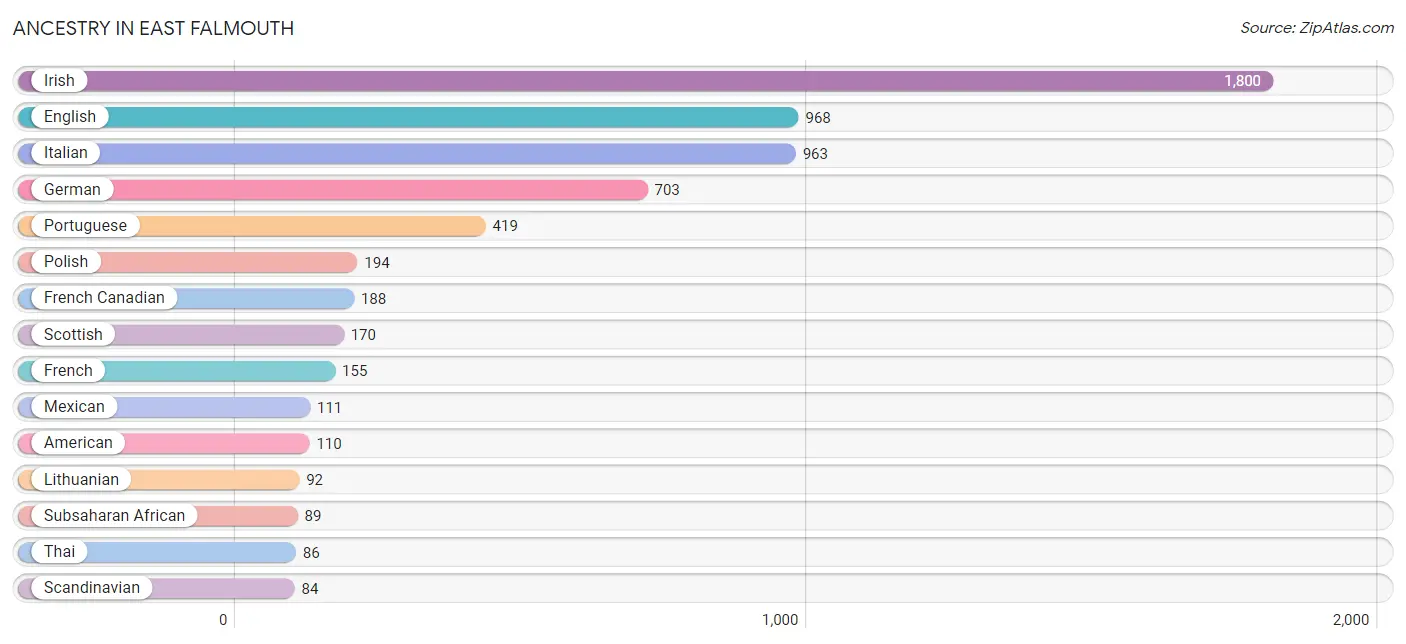
Ancestry in East Falmouth
The most populous ancestries reported in East Falmouth are Irish (1,800 | 27.5%), English (968 | 14.8%), Italian (963 | 14.7%), German (703 | 10.7%), and Portuguese (419 | 6.4%), together accounting for 74.0% of all East Falmouth residents.
| Ancestry | # Population | % Population |
| African | 8 | 0.1% |
| Albanian | 31 | 0.5% |
| Aleut | 57 | 0.9% |
| American | 110 | 1.7% |
| Arab | 13 | 0.2% |
| Armenian | 8 | 0.1% |
| Austrian | 16 | 0.2% |
| Barbadian | 13 | 0.2% |
| Belgian | 4 | 0.1% |
| British | 42 | 0.6% |
| Burmese | 43 | 0.7% |
| Canadian | 15 | 0.2% |
| Cape Verdean | 81 | 1.2% |
| Czech | 13 | 0.2% |
| Dutch | 11 | 0.2% |
| Eastern European | 16 | 0.2% |
| English | 968 | 14.8% |
| European | 30 | 0.5% |
| Finnish | 31 | 0.5% |
| French | 155 | 2.4% |
| French Canadian | 188 | 2.9% |
| German | 703 | 10.7% |
| Greek | 83 | 1.3% |
| Hungarian | 38 | 0.6% |
| Indian (Asian) | 42 | 0.6% |
| Irish | 1,800 | 27.5% |
| Italian | 963 | 14.7% |
| Jamaican | 19 | 0.3% |
| Korean | 78 | 1.2% |
| Latvian | 27 | 0.4% |
| Lebanese | 13 | 0.2% |
| Lithuanian | 92 | 1.4% |
| Maltese | 11 | 0.2% |
| Mexican | 111 | 1.7% |
| Mexican American Indian | 36 | 0.5% |
| Northern European | 52 | 0.8% |
| Norwegian | 8 | 0.1% |
| Pennsylvania German | 9 | 0.1% |
| Polish | 194 | 3.0% |
| Portuguese | 419 | 6.4% |
| Romanian | 59 | 0.9% |
| Russian | 45 | 0.7% |
| Scandinavian | 84 | 1.3% |
| Scotch-Irish | 14 | 0.2% |
| Scottish | 170 | 2.6% |
| Slavic | 21 | 0.3% |
| Slovak | 7 | 0.1% |
| Spaniard | 30 | 0.5% |
| Subsaharan African | 89 | 1.4% |
| Swedish | 74 | 1.1% |
| Thai | 86 | 1.3% |
| Ukrainian | 7 | 0.1% |
| Welsh | 15 | 0.2% | View All 53 Rows |
Immigrants in East Falmouth
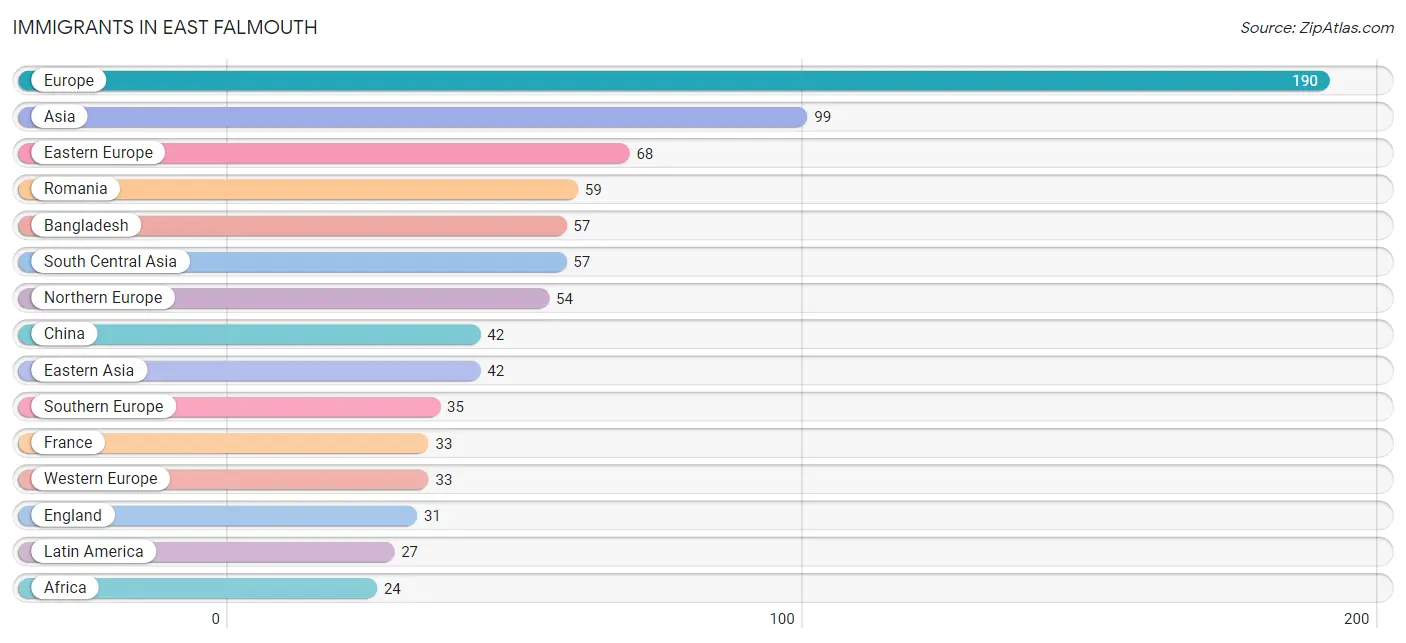
The most numerous immigrant groups reported in East Falmouth came from Europe (190 | 2.9%), Asia (99 | 1.5%), Eastern Europe (68 | 1.0%), Romania (59 | 0.9%), and Bangladesh (57 | 0.9%), together accounting for 7.2% of all East Falmouth residents.
| Immigration Origin | # Population | % Population |
| Africa | 24 | 0.4% |
| Argentina | 8 | 0.1% |
| Asia | 99 | 1.5% |
| Bangladesh | 57 | 0.9% |
| Cabo Verde | 12 | 0.2% |
| Canada | 19 | 0.3% |
| Caribbean | 19 | 0.3% |
| China | 42 | 0.6% |
| Eastern Asia | 42 | 0.6% |
| Eastern Europe | 68 | 1.0% |
| Egypt | 12 | 0.2% |
| England | 31 | 0.5% |
| Europe | 190 | 2.9% |
| France | 33 | 0.5% |
| Greece | 12 | 0.2% |
| Ireland | 10 | 0.2% |
| Italy | 11 | 0.2% |
| Jamaica | 19 | 0.3% |
| Latin America | 27 | 0.4% |
| Northern Africa | 12 | 0.2% |
| Northern Europe | 54 | 0.8% |
| Poland | 9 | 0.1% |
| Portugal | 12 | 0.2% |
| Romania | 59 | 0.9% |
| South America | 8 | 0.1% |
| South Central Asia | 57 | 0.9% |
| Southern Europe | 35 | 0.5% |
| Western Africa | 12 | 0.2% |
| Western Europe | 33 | 0.5% | View All 29 Rows |
Sex and Age in East Falmouth
Sex and Age in East Falmouth
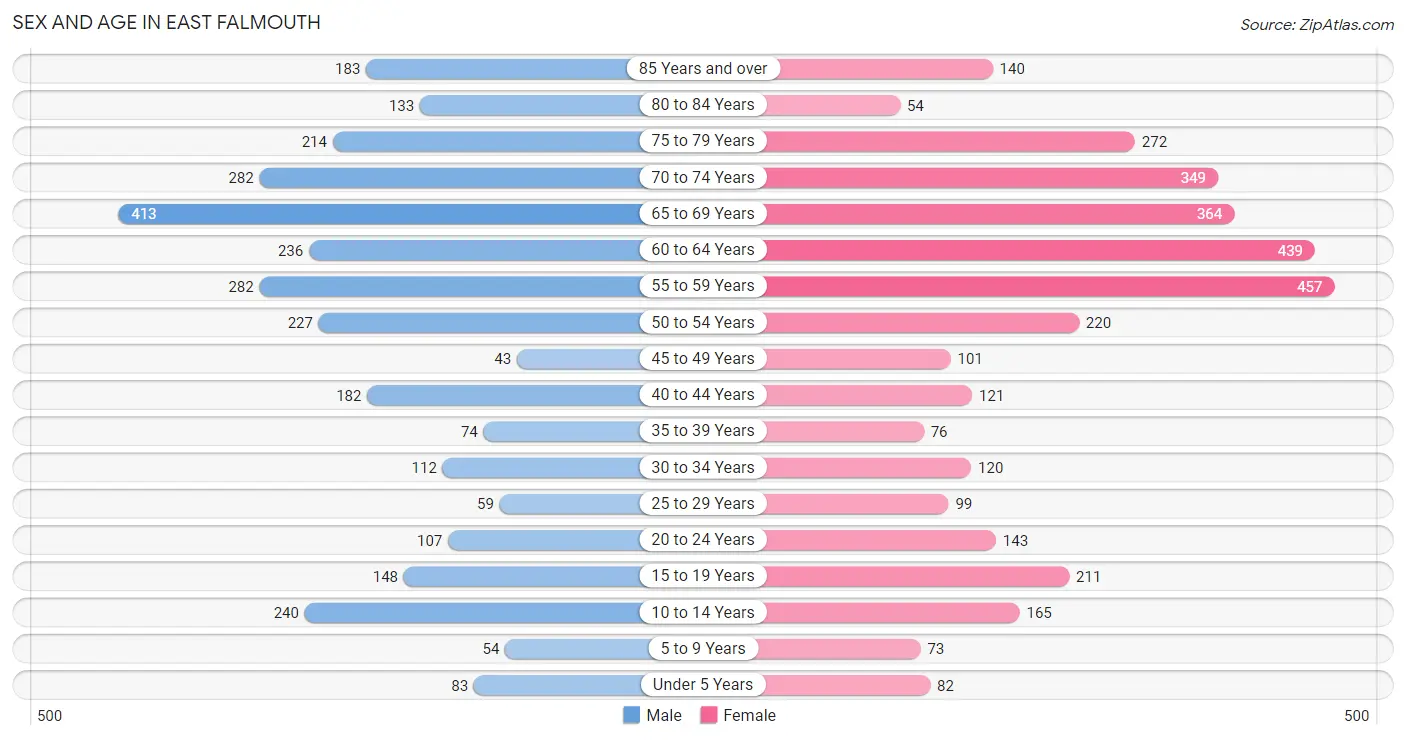
The most populous age groups in East Falmouth are 65 to 69 Years (413 | 13.4%) for men and 55 to 59 Years (457 | 13.1%) for women.
| Age Bracket | Male | Female |
| Under 5 Years | 83 (2.7%) | 82 (2.4%) |
| 5 to 9 Years | 54 (1.8%) | 73 (2.1%) |
| 10 to 14 Years | 240 (7.8%) | 165 (4.7%) |
| 15 to 19 Years | 148 (4.8%) | 211 (6.0%) |
| 20 to 24 Years | 107 (3.5%) | 143 (4.1%) |
| 25 to 29 Years | 59 (1.9%) | 99 (2.8%) |
| 30 to 34 Years | 112 (3.6%) | 120 (3.4%) |
| 35 to 39 Years | 74 (2.4%) | 76 (2.2%) |
| 40 to 44 Years | 182 (5.9%) | 121 (3.5%) |
| 45 to 49 Years | 43 (1.4%) | 101 (2.9%) |
| 50 to 54 Years | 227 (7.4%) | 220 (6.3%) |
| 55 to 59 Years | 282 (9.2%) | 457 (13.1%) |
| 60 to 64 Years | 236 (7.7%) | 439 (12.6%) |
| 65 to 69 Years | 413 (13.4%) | 364 (10.4%) |
| 70 to 74 Years | 282 (9.2%) | 349 (10.0%) |
| 75 to 79 Years | 214 (7.0%) | 272 (7.8%) |
| 80 to 84 Years | 133 (4.3%) | 54 (1.5%) |
| 85 Years and over | 183 (6.0%) | 140 (4.0%) |
| Total | 3,072 (100.0%) | 3,486 (100.0%) |
Families and Households in East Falmouth
Median Family Size in East Falmouth
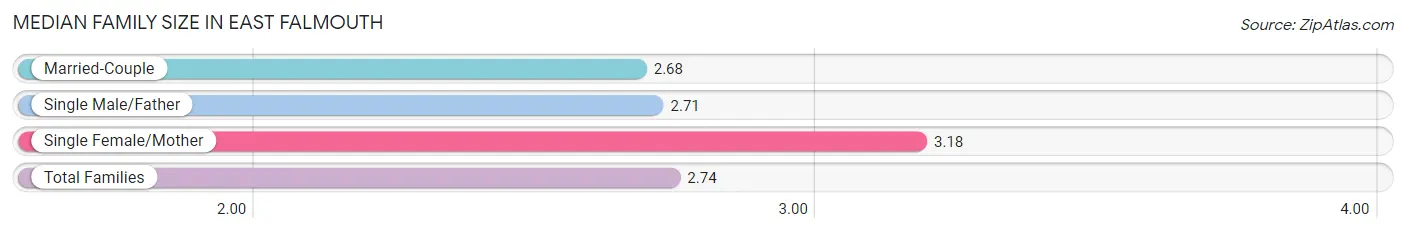
The median family size in East Falmouth is 2.74 persons per family, with single female/mother families (202 | 11.4%) accounting for the largest median family size of 3.18 persons per family. On the other hand, married-couple families (1,511 | 85.1%) represent the smallest median family size with 2.68 persons per family.
| Family Type | # Families | Family Size |
| Married-Couple | 1,511 (85.1%) | 2.68 |
| Single Male/Father | 63 (3.5%) | 2.71 |
| Single Female/Mother | 202 (11.4%) | 3.18 |
| Total Families | 1,776 (100.0%) | 2.74 |
Median Household Size in East Falmouth
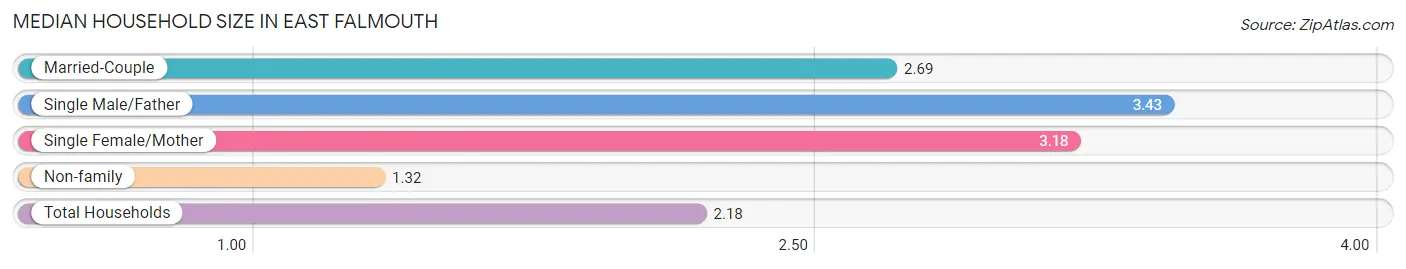
The median household size in East Falmouth is 2.18 persons per household, with single male/father households (63 | 2.1%) accounting for the largest median household size of 3.43 persons per household. non-family households (1,233 | 41.0%) represent the smallest median household size with 1.32 persons per household.
| Household Type | # Households | Household Size |
| Married-Couple | 1,511 (50.2%) | 2.69 |
| Single Male/Father | 63 (2.1%) | 3.43 |
| Single Female/Mother | 202 (6.7%) | 3.18 |
| Non-family | 1,233 (41.0%) | 1.32 |
| Total Households | 3,009 (100.0%) | 2.18 |
Household Size by Marriage Status in East Falmouth
Out of a total of 3,009 households in East Falmouth, 1,776 (59.0%) are family households, while 1,233 (41.0%) are nonfamily households. The most numerous type of family households are 2-person households, comprising 1,116, and the most common type of nonfamily households are 1-person households, comprising 972.
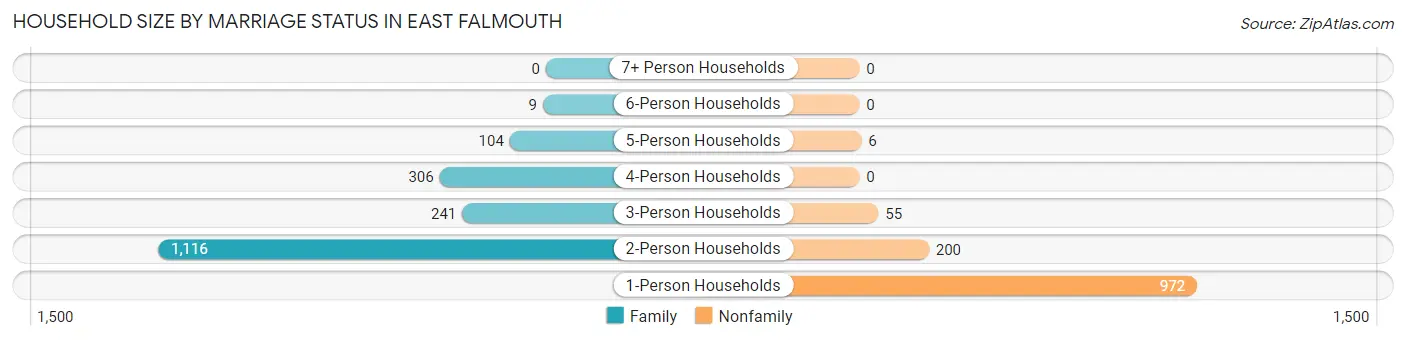
| Household Size | Family Households | Nonfamily Households |
| 1-Person Households | - | 972 (32.3%) |
| 2-Person Households | 1,116 (37.1%) | 200 (6.7%) |
| 3-Person Households | 241 (8.0%) | 55 (1.8%) |
| 4-Person Households | 306 (10.2%) | 0 (0.0%) |
| 5-Person Households | 104 (3.5%) | 6 (0.2%) |
| 6-Person Households | 9 (0.3%) | 0 (0.0%) |
| 7+ Person Households | 0 (0.0%) | 0 (0.0%) |
| Total | 1,776 (59.0%) | 1,233 (41.0%) |
Female Fertility in East Falmouth
Fertility by Age in East Falmouth
| Age Bracket | Women with Births | Births / 1,000 Women |
| 15 to 19 years | 0 (0.0%) | 0.0 |
| 20 to 34 years | 0 (0.0%) | 0.0 |
| 35 to 50 years | 0 (0.0%) | 0.0 |
| Total | 0 (0.0%) | 0.0 |
Fertility by Age by Marriage Status in East Falmouth
| Age Bracket | Married | Unmarried |
| 15 to 19 years | 0 (0.0%) | 0 (0.0%) |
| 20 to 34 years | 0 (0.0%) | 0 (0.0%) |
| 35 to 50 years | 0 (0.0%) | 0 (0.0%) |
| Total | 0 (0.0%) | 0 (0.0%) |
Fertility by Education in East Falmouth
| Educational Attainment | Women with Births | Births / 1,000 Women |
| Less than High School | 0 (0.0%) | 0.0 |
| High School Diploma | 0 (0.0%) | 0.0 |
| College or Associate's Degree | 0 (0.0%) | 0.0 |
| Bachelor's Degree | 0 (0.0%) | 0.0 |
| Graduate Degree | 0 (0.0%) | 0.0 |
| Total | 0 (0.0%) | 0.0 |
Fertility by Education by Marriage Status in East Falmouth
| Educational Attainment | Married | Unmarried |
| Less than High School | 0 (0.0%) | 0 (0.0%) |
| High School Diploma | 0 (0.0%) | 0 (0.0%) |
| College or Associate's Degree | 0 (0.0%) | 0 (0.0%) |
| Bachelor's Degree | 0 (0.0%) | 0 (0.0%) |
| Graduate Degree | 0 (0.0%) | 0 (0.0%) |
| Total | 0 (0.0%) | 0 (0.0%) |
Employment Characteristics in East Falmouth
Employment by Class of Employer in East Falmouth
Among the 3,097 employed individuals in East Falmouth, private company employees (1,686 | 54.4%), not-for-profit organizations (554 | 17.9%), and self-employed (not incorporated) (287 | 9.3%) make up the most common classes of employment.
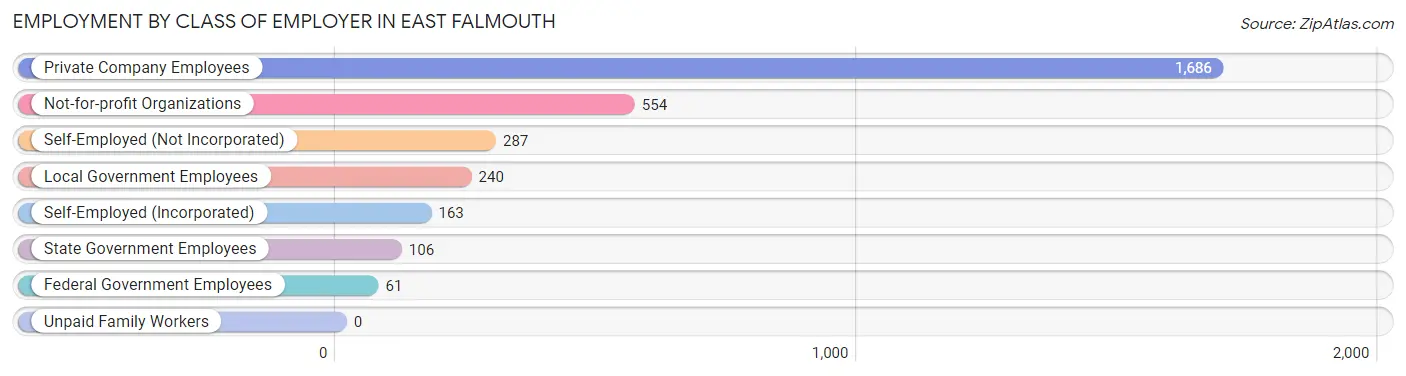
| Employer Class | # Employees | % Employees |
| Private Company Employees | 1,686 | 54.4% |
| Self-Employed (Incorporated) | 163 | 5.3% |
| Self-Employed (Not Incorporated) | 287 | 9.3% |
| Not-for-profit Organizations | 554 | 17.9% |
| Local Government Employees | 240 | 7.7% |
| State Government Employees | 106 | 3.4% |
| Federal Government Employees | 61 | 2.0% |
| Unpaid Family Workers | 0 | 0.0% |
| Total | 3,097 | 100.0% |
Employment Status by Age in East Falmouth
According to the labor force statistics for East Falmouth, out of the total population over 16 years of age (5,831), 57.7% or 3,364 individuals are in the labor force, with 4.7% or 158 of them unemployed. The age group with the highest labor force participation rate is 25 to 29 years, with 88.6% or 140 individuals in the labor force. Within the labor force, the 20 to 24 years age range has the highest percentage of unemployed individuals, with 11.8% or 25 of them being unemployed.
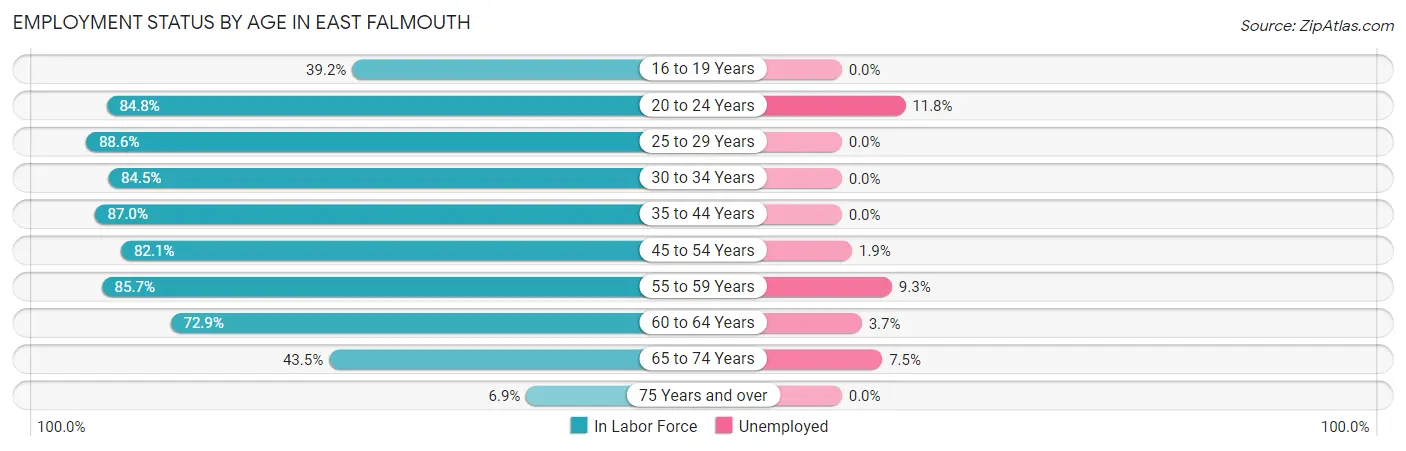
| Age Bracket | In Labor Force | Unemployed |
| 16 to 19 Years | 129 (39.2%) | 0 (0.0%) |
| 20 to 24 Years | 212 (84.8%) | 25 (11.8%) |
| 25 to 29 Years | 140 (88.6%) | 0 (0.0%) |
| 30 to 34 Years | 196 (84.5%) | 0 (0.0%) |
| 35 to 44 Years | 394 (87.0%) | 0 (0.0%) |
| 45 to 54 Years | 485 (82.1%) | 9 (1.9%) |
| 55 to 59 Years | 633 (85.7%) | 59 (9.3%) |
| 60 to 64 Years | 492 (72.9%) | 18 (3.7%) |
| 65 to 74 Years | 612 (43.5%) | 46 (7.5%) |
| 75 Years and over | 69 (6.9%) | 0 (0.0%) |
| Total | 3,364 (57.7%) | 158 (4.7%) |
Employment Status by Educational Attainment in East Falmouth
According to labor force statistics for East Falmouth, 82.2% of individuals (2,341) out of the total population between 25 and 64 years of age (2,848) are in the labor force, with 3.7% or 87 of them being unemployed. The group with the highest labor force participation rate are those with the educational attainment of high school diploma, with 90.3% or 556 individuals in the labor force. Within the labor force, individuals with bachelor's degree or higher education have the highest percentage of unemployment, with 6.6% or 62 of them being unemployed.
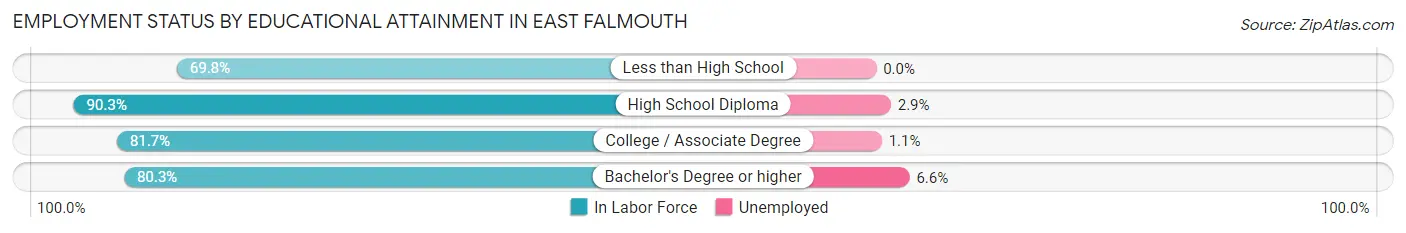
| Educational Attainment | In Labor Force | Unemployed |
| Less than High School | 134 (69.8%) | 0 (0.0%) |
| High School Diploma | 556 (90.3%) | 18 (2.9%) |
| College / Associate Degree | 711 (81.7%) | 10 (1.1%) |
| Bachelor's Degree or higher | 940 (80.3%) | 77 (6.6%) |
| Total | 2,341 (82.2%) | 105 (3.7%) |
Employment Occupations by Sex in East Falmouth
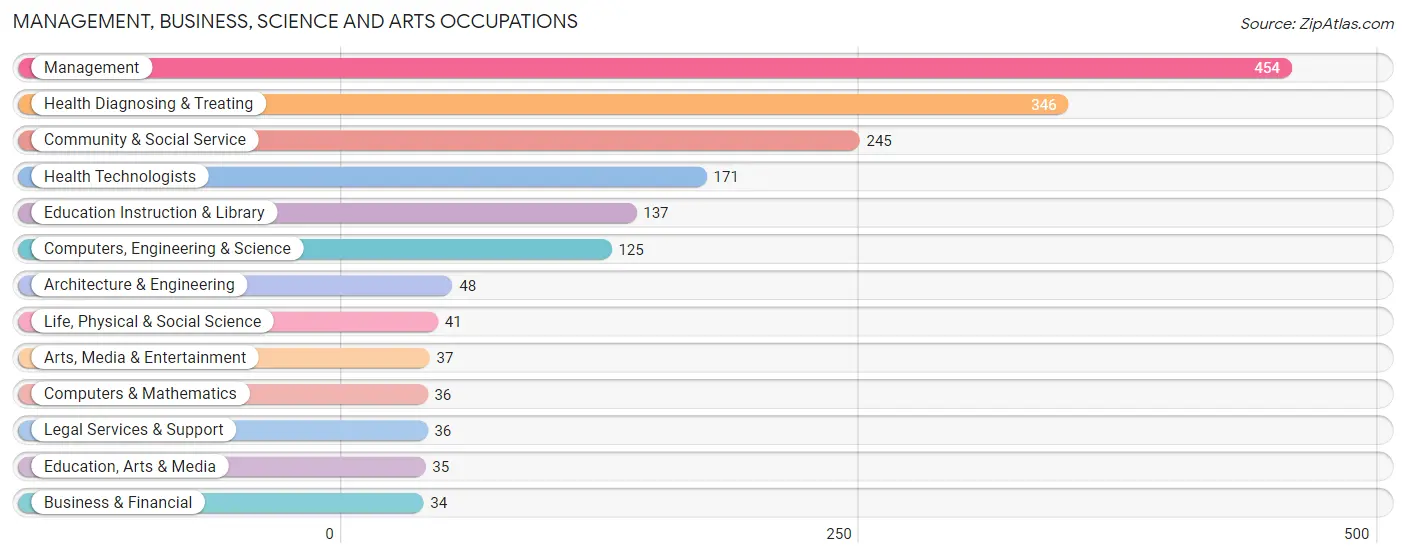
Management, Business, Science and Arts Occupations
The most common Management, Business, Science and Arts occupations in East Falmouth are Management (454 | 14.2%), Health Diagnosing & Treating (346 | 10.8%), Community & Social Service (245 | 7.6%), Health Technologists (171 | 5.3%), and Education Instruction & Library (137 | 4.3%).
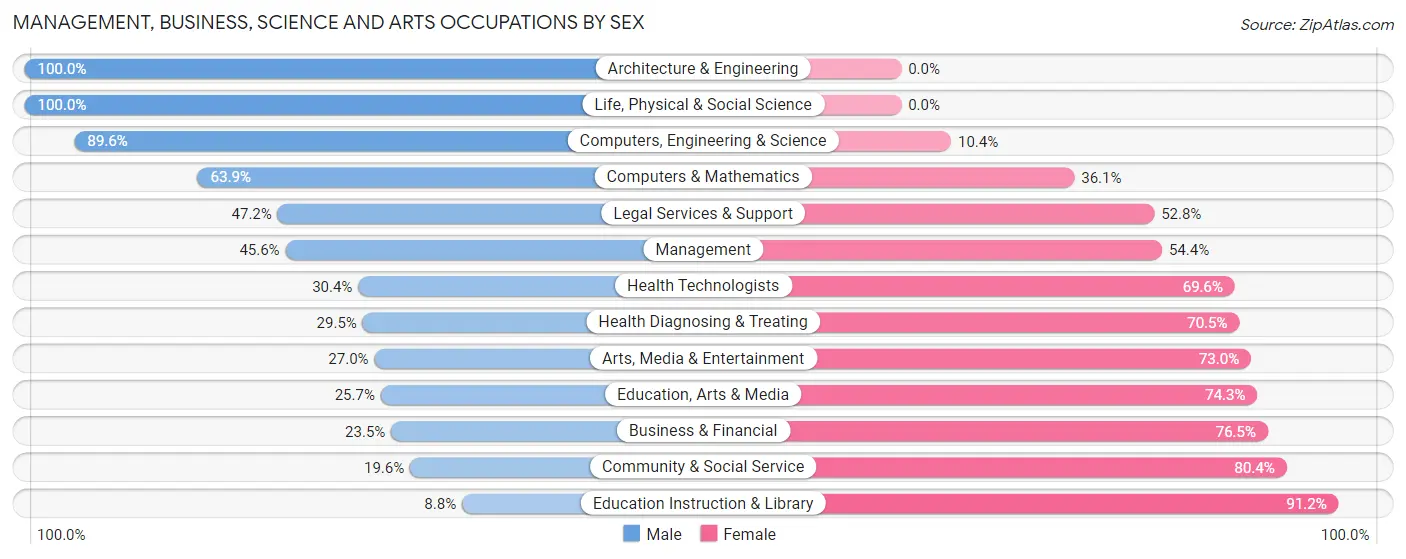
Management, Business, Science and Arts Occupations by Sex
Within the Management, Business, Science and Arts occupations in East Falmouth, the most male-oriented occupations are Architecture & Engineering (100.0%), Life, Physical & Social Science (100.0%), and Computers, Engineering & Science (89.6%), while the most female-oriented occupations are Education Instruction & Library (91.2%), Community & Social Service (80.4%), and Business & Financial (76.5%).
| Occupation | Male | Female |
| Management | 207 (45.6%) | 247 (54.4%) |
| Business & Financial | 8 (23.5%) | 26 (76.5%) |
| Computers, Engineering & Science | 112 (89.6%) | 13 (10.4%) |
| Computers & Mathematics | 23 (63.9%) | 13 (36.1%) |
| Architecture & Engineering | 48 (100.0%) | 0 (0.0%) |
| Life, Physical & Social Science | 41 (100.0%) | 0 (0.0%) |
| Community & Social Service | 48 (19.6%) | 197 (80.4%) |
| Education, Arts & Media | 9 (25.7%) | 26 (74.3%) |
| Legal Services & Support | 17 (47.2%) | 19 (52.8%) |
| Education Instruction & Library | 12 (8.8%) | 125 (91.2%) |
| Arts, Media & Entertainment | 10 (27.0%) | 27 (73.0%) |
| Health Diagnosing & Treating | 102 (29.5%) | 244 (70.5%) |
| Health Technologists | 52 (30.4%) | 119 (69.6%) |
| Total (Category) | 477 (39.6%) | 727 (60.4%) |
| Total (Overall) | 1,579 (49.2%) | 1,627 (50.7%) |
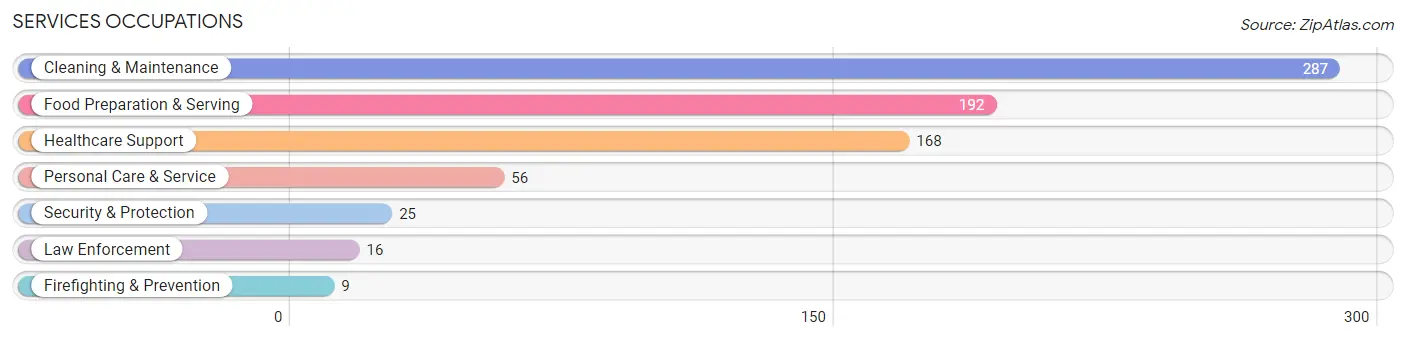
Services Occupations
The most common Services occupations in East Falmouth are Cleaning & Maintenance (287 | 8.9%), Food Preparation & Serving (192 | 6.0%), Healthcare Support (168 | 5.2%), Personal Care & Service (56 | 1.8%), and Security & Protection (25 | 0.8%).
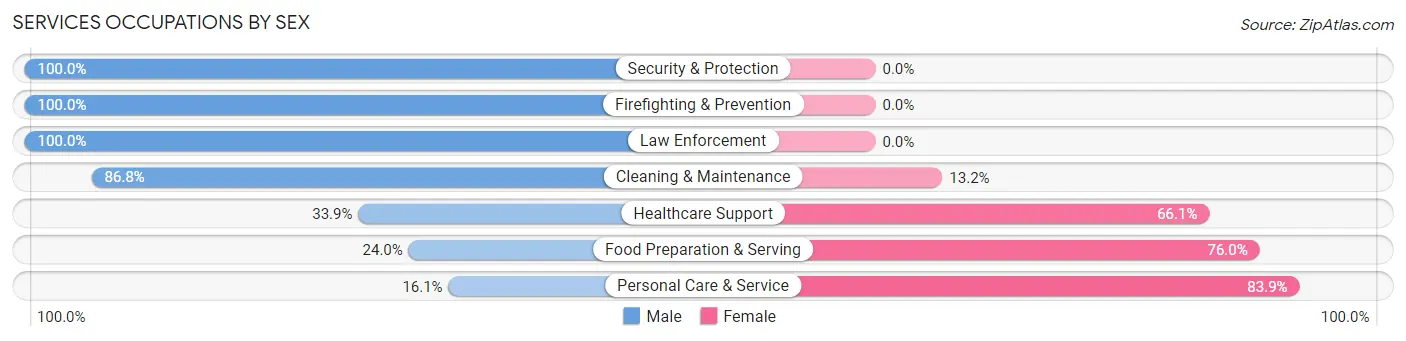
Services Occupations by Sex
Within the Services occupations in East Falmouth, the most male-oriented occupations are Security & Protection (100.0%), Firefighting & Prevention (100.0%), and Law Enforcement (100.0%), while the most female-oriented occupations are Personal Care & Service (83.9%), Food Preparation & Serving (76.0%), and Healthcare Support (66.1%).
| Occupation | Male | Female |
| Healthcare Support | 57 (33.9%) | 111 (66.1%) |
| Security & Protection | 25 (100.0%) | 0 (0.0%) |
| Firefighting & Prevention | 9 (100.0%) | 0 (0.0%) |
| Law Enforcement | 16 (100.0%) | 0 (0.0%) |
| Food Preparation & Serving | 46 (24.0%) | 146 (76.0%) |
| Cleaning & Maintenance | 249 (86.8%) | 38 (13.2%) |
| Personal Care & Service | 9 (16.1%) | 47 (83.9%) |
| Total (Category) | 386 (53.0%) | 342 (47.0%) |
| Total (Overall) | 1,579 (49.2%) | 1,627 (50.7%) |
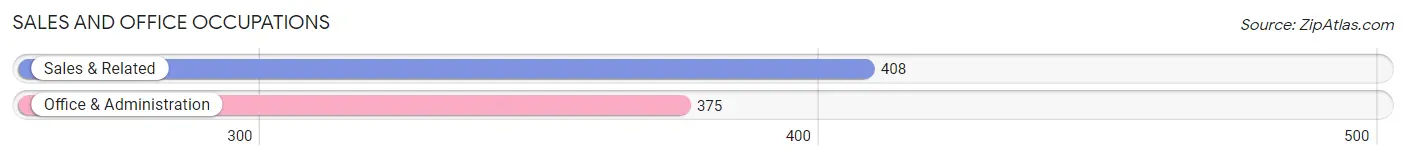
Sales and Office Occupations
The most common Sales and Office occupations in East Falmouth are Sales & Related (408 | 12.7%), and Office & Administration (375 | 11.7%).
Sales and Office Occupations by Sex
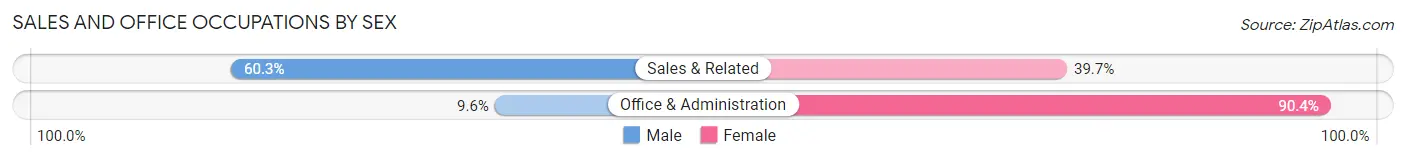
| Occupation | Male | Female |
| Sales & Related | 246 (60.3%) | 162 (39.7%) |
| Office & Administration | 36 (9.6%) | 339 (90.4%) |
| Total (Category) | 282 (36.0%) | 501 (64.0%) |
| Total (Overall) | 1,579 (49.2%) | 1,627 (50.7%) |
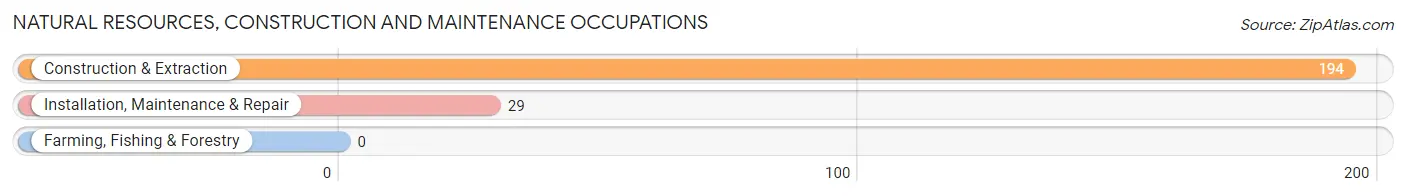
Natural Resources, Construction and Maintenance Occupations
The most common Natural Resources, Construction and Maintenance occupations in East Falmouth are Construction & Extraction (194 | 6.0%), and Installation, Maintenance & Repair (29 | 0.9%).
Natural Resources, Construction and Maintenance Occupations by Sex
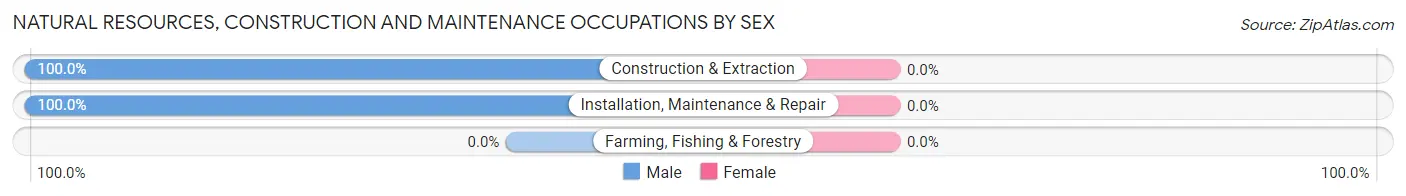
| Occupation | Male | Female |
| Farming, Fishing & Forestry | 0 (0.0%) | 0 (0.0%) |
| Construction & Extraction | 194 (100.0%) | 0 (0.0%) |
| Installation, Maintenance & Repair | 29 (100.0%) | 0 (0.0%) |
| Total (Category) | 223 (100.0%) | 0 (0.0%) |
| Total (Overall) | 1,579 (49.2%) | 1,627 (50.7%) |
Production, Transportation and Moving Occupations
The most common Production, Transportation and Moving occupations in East Falmouth are Production (120 | 3.7%), Material Moving (80 | 2.5%), and Transportation (68 | 2.1%).
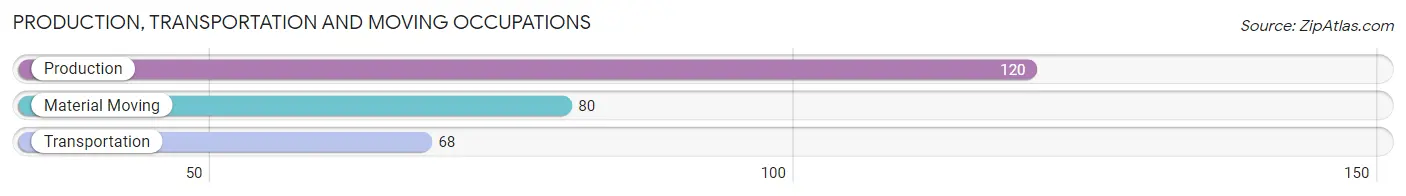
Production, Transportation and Moving Occupations by Sex
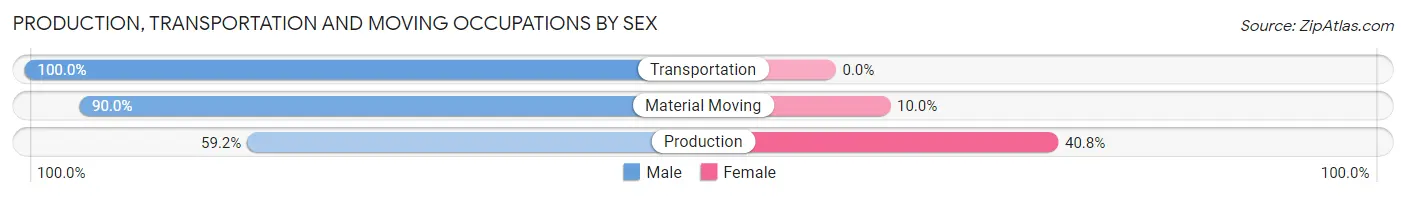
| Occupation | Male | Female |
| Production | 71 (59.2%) | 49 (40.8%) |
| Transportation | 68 (100.0%) | 0 (0.0%) |
| Material Moving | 72 (90.0%) | 8 (10.0%) |
| Total (Category) | 211 (78.7%) | 57 (21.3%) |
| Total (Overall) | 1,579 (49.2%) | 1,627 (50.7%) |
Employment Industries by Sex in East Falmouth
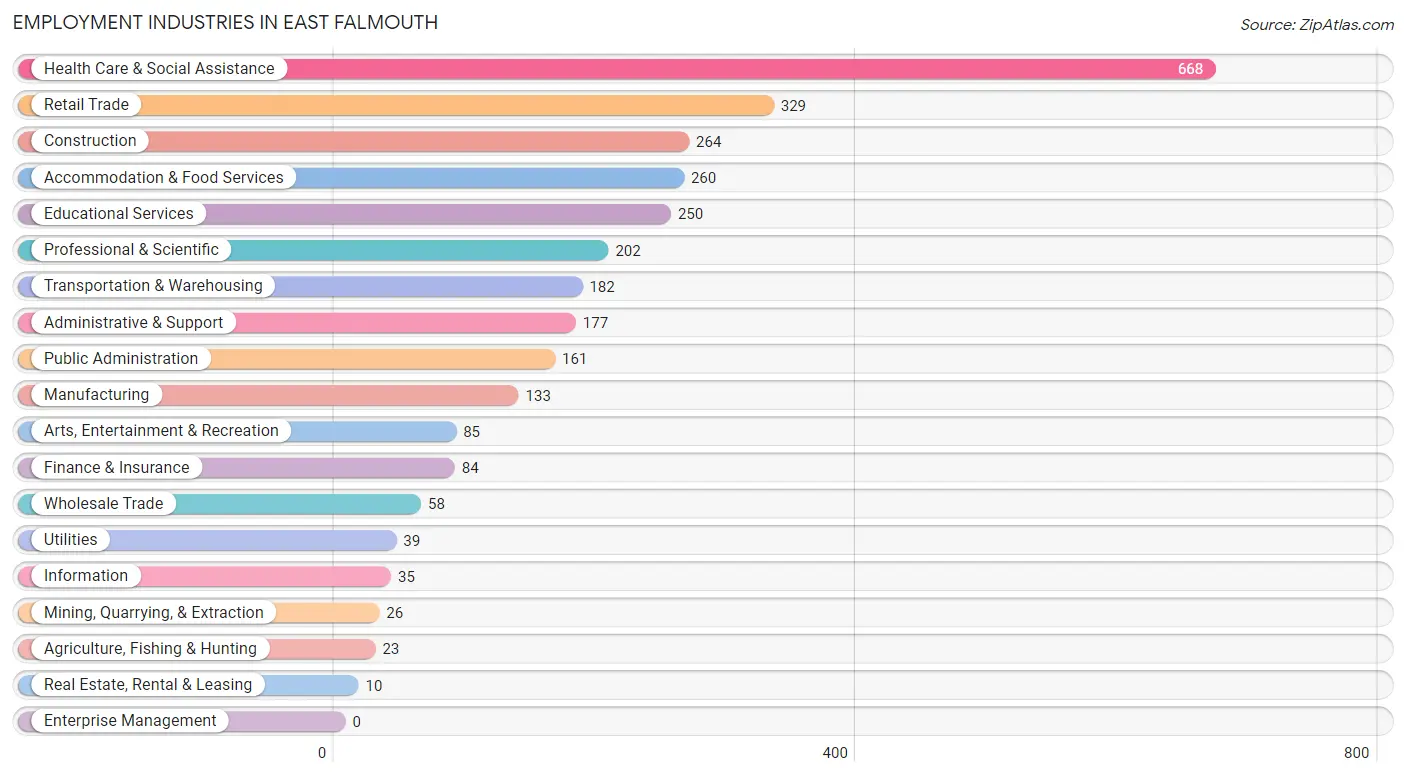
Employment Industries in East Falmouth
The major employment industries in East Falmouth include Health Care & Social Assistance (668 | 20.8%), Retail Trade (329 | 10.3%), Construction (264 | 8.2%), Accommodation & Food Services (260 | 8.1%), and Educational Services (250 | 7.8%).
Employment Industries by Sex in East Falmouth
The East Falmouth industries that see more men than women are Mining, Quarrying, & Extraction (100.0%), Construction (100.0%), and Wholesale Trade (100.0%), whereas the industries that tend to have a higher number of women are Agriculture, Fishing & Hunting (100.0%), Educational Services (82.0%), and Public Administration (75.8%).
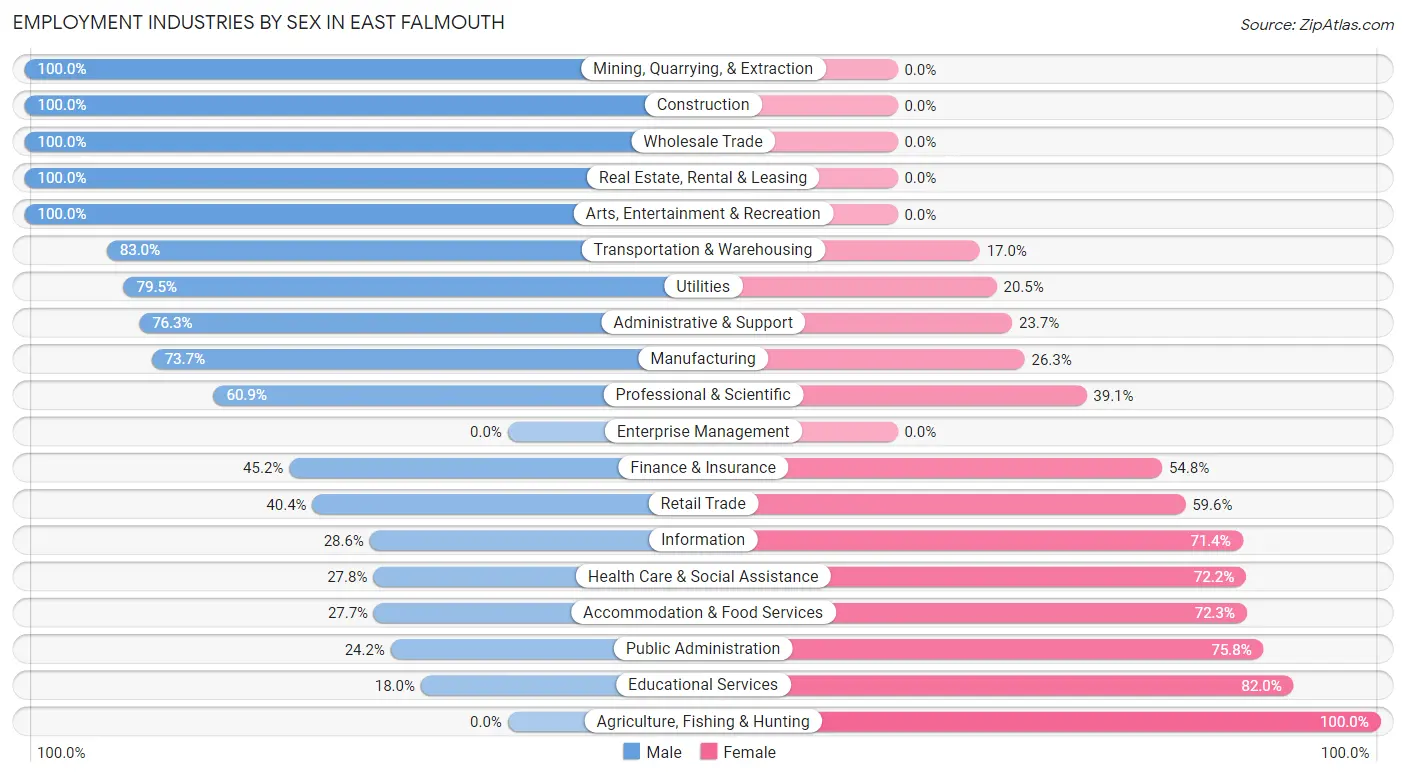
| Industry | Male | Female |
| Agriculture, Fishing & Hunting | 0 (0.0%) | 23 (100.0%) |
| Mining, Quarrying, & Extraction | 26 (100.0%) | 0 (0.0%) |
| Construction | 264 (100.0%) | 0 (0.0%) |
| Manufacturing | 98 (73.7%) | 35 (26.3%) |
| Wholesale Trade | 58 (100.0%) | 0 (0.0%) |
| Retail Trade | 133 (40.4%) | 196 (59.6%) |
| Transportation & Warehousing | 151 (83.0%) | 31 (17.0%) |
| Utilities | 31 (79.5%) | 8 (20.5%) |
| Information | 10 (28.6%) | 25 (71.4%) |
| Finance & Insurance | 38 (45.2%) | 46 (54.8%) |
| Real Estate, Rental & Leasing | 10 (100.0%) | 0 (0.0%) |
| Professional & Scientific | 123 (60.9%) | 79 (39.1%) |
| Enterprise Management | 0 (0.0%) | 0 (0.0%) |
| Administrative & Support | 135 (76.3%) | 42 (23.7%) |
| Educational Services | 45 (18.0%) | 205 (82.0%) |
| Health Care & Social Assistance | 186 (27.8%) | 482 (72.2%) |
| Arts, Entertainment & Recreation | 85 (100.0%) | 0 (0.0%) |
| Accommodation & Food Services | 72 (27.7%) | 188 (72.3%) |
| Public Administration | 39 (24.2%) | 122 (75.8%) |
| Total | 1,579 (49.2%) | 1,627 (50.7%) |
Education in East Falmouth
School Enrollment in East Falmouth
The most common levels of schooling among the 1,182 students in East Falmouth are middle school (369 | 31.2%), high school (259 | 21.9%), and college / undergraduate (232 | 19.6%).
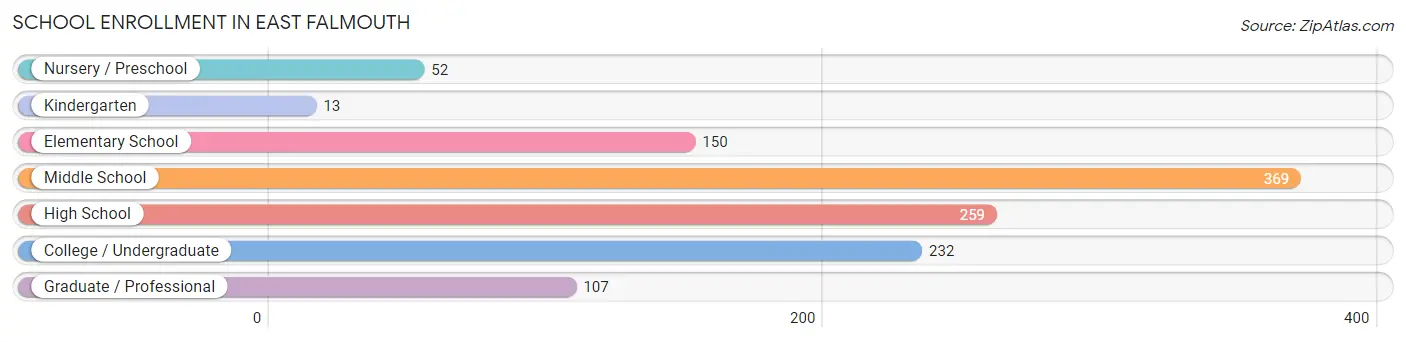
| School Level | # Students | % Students |
| Nursery / Preschool | 52 | 4.4% |
| Kindergarten | 13 | 1.1% |
| Elementary School | 150 | 12.7% |
| Middle School | 369 | 31.2% |
| High School | 259 | 21.9% |
| College / Undergraduate | 232 | 19.6% |
| Graduate / Professional | 107 | 9.0% |
| Total | 1,182 | 100.0% |
School Enrollment by Age by Funding Source in East Falmouth
Out of a total of 1,182 students who are enrolled in schools in East Falmouth, 280 (23.7%) attend a private institution, while the remaining 902 (76.3%) are enrolled in public schools. The age group of 35 years and over has the highest likelihood of being enrolled in private schools, with 43 (100.0% in the age bracket) enrolled. Conversely, the age group of 5 to 9 year old has the lowest likelihood of being enrolled in a private school, with 127 (100.0% in the age bracket) attending a public institution.
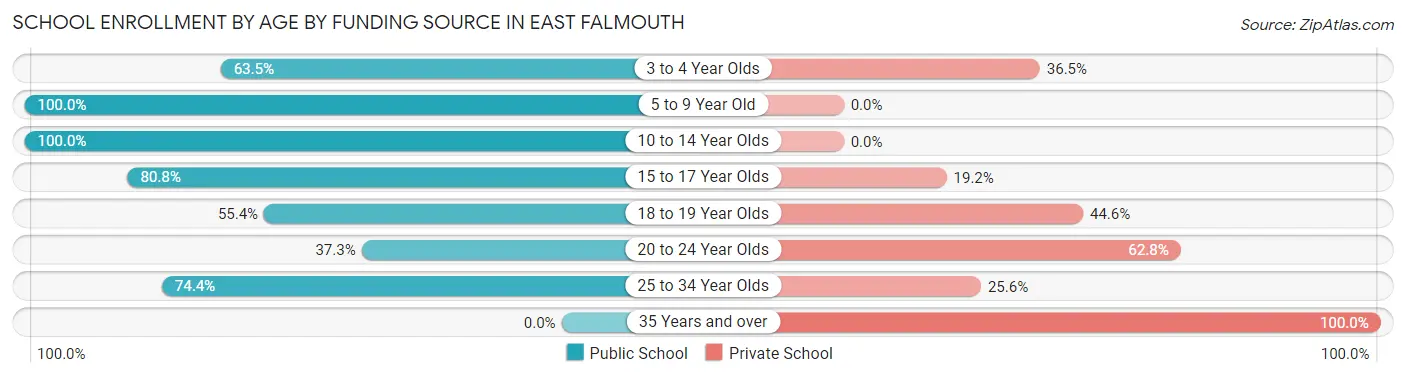
| Age Bracket | Public School | Private School |
| 3 to 4 Year Olds | 33 (63.5%) | 19 (36.5%) |
| 5 to 9 Year Old | 127 (100.0%) | 0 (0.0%) |
| 10 to 14 Year Olds | 405 (100.0%) | 0 (0.0%) |
| 15 to 17 Year Olds | 156 (80.8%) | 37 (19.2%) |
| 18 to 19 Year Olds | 92 (55.4%) | 74 (44.6%) |
| 20 to 24 Year Olds | 57 (37.2%) | 96 (62.7%) |
| 25 to 34 Year Olds | 32 (74.4%) | 11 (25.6%) |
| 35 Years and over | 0 (0.0%) | 43 (100.0%) |
| Total | 902 (76.3%) | 280 (23.7%) |
Educational Attainment by Field of Study in East Falmouth
Business (452 | 18.5%), education (369 | 15.1%), bio, nature & agricultural (272 | 11.2%), arts & humanities (229 | 9.4%), and engineering (200 | 8.2%) are the most common fields of study among 2,440 individuals in East Falmouth who have obtained a bachelor's degree or higher.
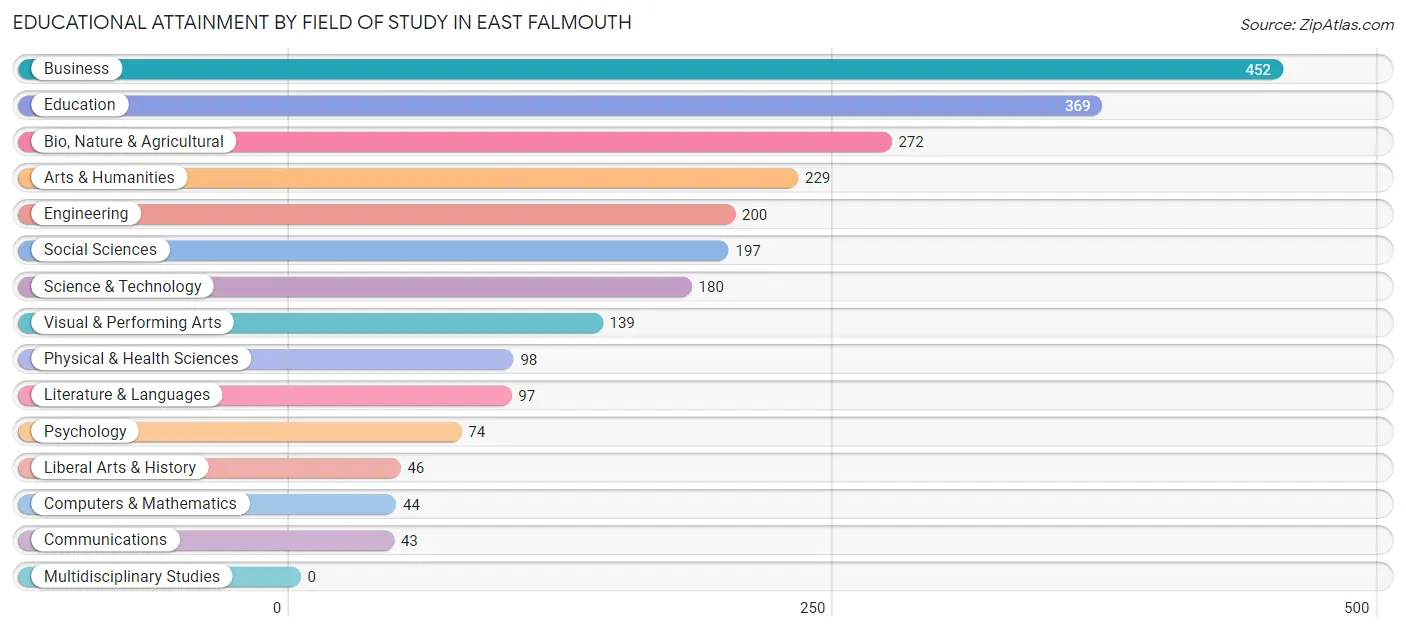
| Field of Study | # Graduates | % Graduates |
| Computers & Mathematics | 44 | 1.8% |
| Bio, Nature & Agricultural | 272 | 11.2% |
| Physical & Health Sciences | 98 | 4.0% |
| Psychology | 74 | 3.0% |
| Social Sciences | 197 | 8.1% |
| Engineering | 200 | 8.2% |
| Multidisciplinary Studies | 0 | 0.0% |
| Science & Technology | 180 | 7.4% |
| Business | 452 | 18.5% |
| Education | 369 | 15.1% |
| Literature & Languages | 97 | 4.0% |
| Liberal Arts & History | 46 | 1.9% |
| Visual & Performing Arts | 139 | 5.7% |
| Communications | 43 | 1.8% |
| Arts & Humanities | 229 | 9.4% |
| Total | 2,440 | 100.0% |
Transportation & Commute in East Falmouth
Vehicle Availability by Sex in East Falmouth
The most prevalent vehicle ownership categories in East Falmouth are males with 2 vehicles (649, accounting for 43.4%) and females with 2 vehicles (588, making up 40.6%).
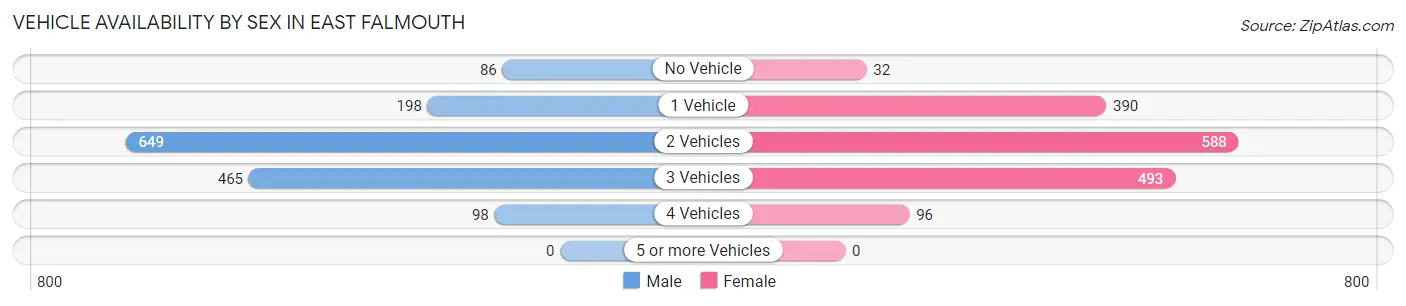
| Vehicles Available | Male | Female |
| No Vehicle | 86 (5.8%) | 32 (2.0%) |
| 1 Vehicle | 198 (13.2%) | 390 (24.4%) |
| 2 Vehicles | 649 (43.4%) | 588 (36.8%) |
| 3 Vehicles | 465 (31.1%) | 493 (30.8%) |
| 4 Vehicles | 98 (6.6%) | 96 (6.0%) |
| 5 or more Vehicles | 0 (0.0%) | 0 (0.0%) |
| Total | 1,496 (100.0%) | 1,599 (100.0%) |
Commute Time in East Falmouth
The most frequently occuring commute durations in East Falmouth are 10 to 14 minutes (562 commuters, 20.8%), 15 to 19 minutes (479 commuters, 17.8%), and 20 to 24 minutes (369 commuters, 13.7%).
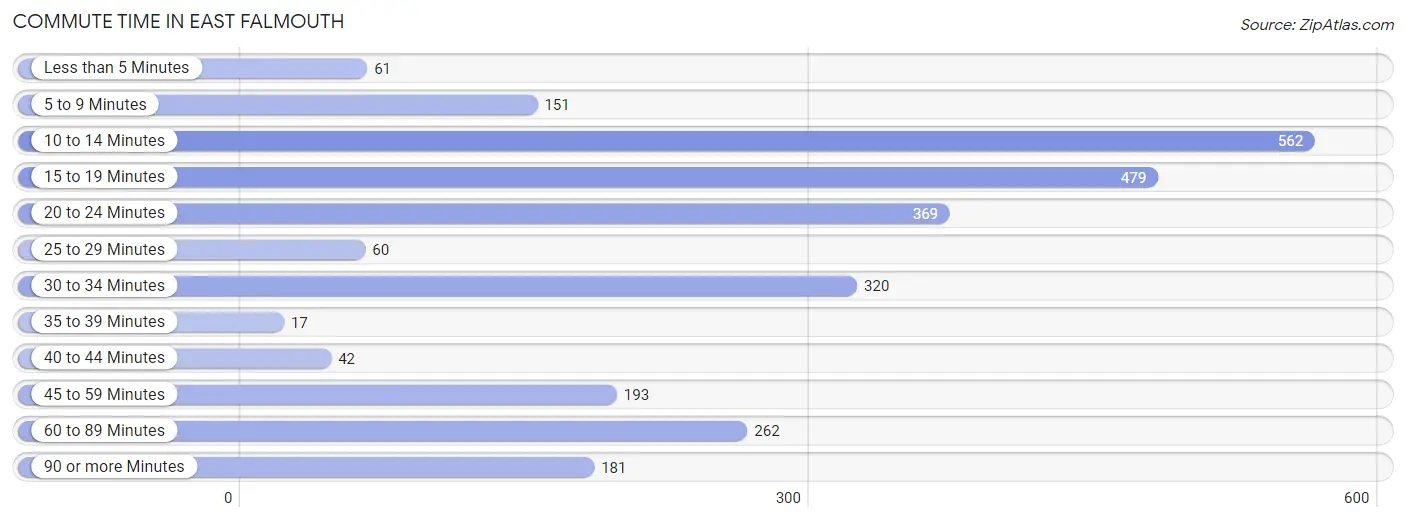
| Commute Time | # Commuters | % Commuters |
| Less than 5 Minutes | 61 | 2.3% |
| 5 to 9 Minutes | 151 | 5.6% |
| 10 to 14 Minutes | 562 | 20.8% |
| 15 to 19 Minutes | 479 | 17.8% |
| 20 to 24 Minutes | 369 | 13.7% |
| 25 to 29 Minutes | 60 | 2.2% |
| 30 to 34 Minutes | 320 | 11.9% |
| 35 to 39 Minutes | 17 | 0.6% |
| 40 to 44 Minutes | 42 | 1.6% |
| 45 to 59 Minutes | 193 | 7.2% |
| 60 to 89 Minutes | 262 | 9.7% |
| 90 or more Minutes | 181 | 6.7% |
Commute Time by Sex in East Falmouth
The most common commute times in East Falmouth are 10 to 14 minutes (297 commuters, 22.7%) for males and 20 to 24 minutes (268 commuters, 19.3%) for females.
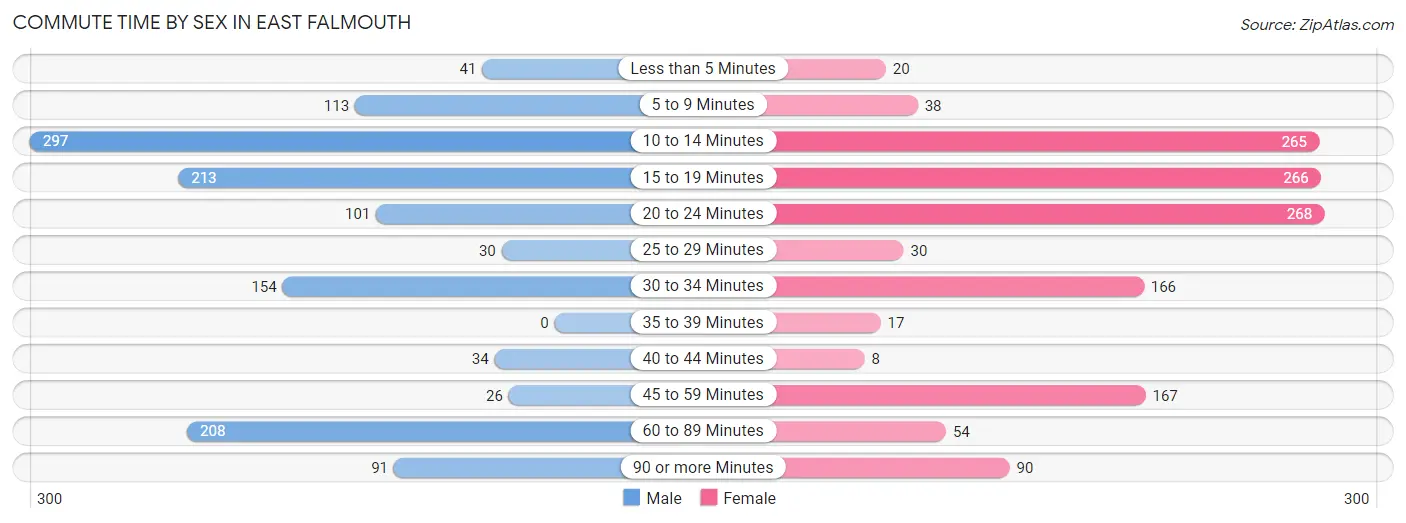
| Commute Time | Male | Female |
| Less than 5 Minutes | 41 (3.1%) | 20 (1.4%) |
| 5 to 9 Minutes | 113 (8.6%) | 38 (2.7%) |
| 10 to 14 Minutes | 297 (22.7%) | 265 (19.1%) |
| 15 to 19 Minutes | 213 (16.3%) | 266 (19.2%) |
| 20 to 24 Minutes | 101 (7.7%) | 268 (19.3%) |
| 25 to 29 Minutes | 30 (2.3%) | 30 (2.2%) |
| 30 to 34 Minutes | 154 (11.8%) | 166 (11.9%) |
| 35 to 39 Minutes | 0 (0.0%) | 17 (1.2%) |
| 40 to 44 Minutes | 34 (2.6%) | 8 (0.6%) |
| 45 to 59 Minutes | 26 (2.0%) | 167 (12.0%) |
| 60 to 89 Minutes | 208 (15.9%) | 54 (3.9%) |
| 90 or more Minutes | 91 (7.0%) | 90 (6.5%) |
Time of Departure to Work by Sex in East Falmouth
The most frequent times of departure to work in East Falmouth are 6:00 AM to 6:29 AM (187, 14.3%) for males and 7:00 AM to 7:29 AM (277, 19.9%) for females.
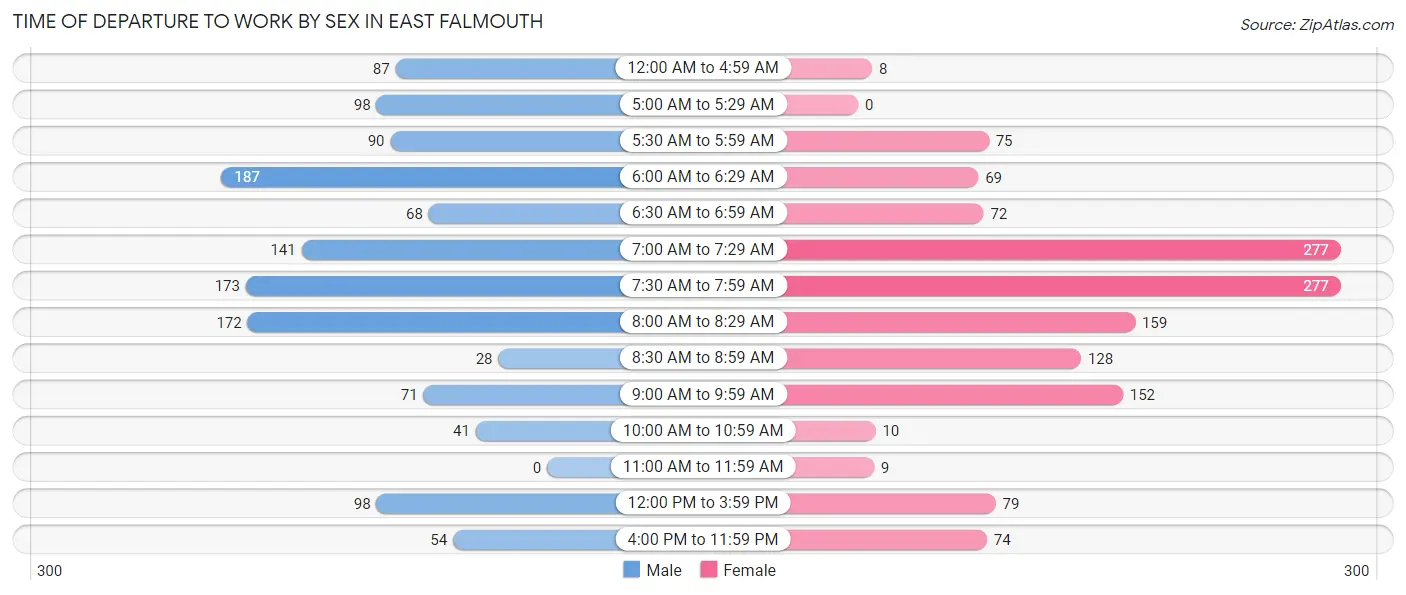
| Time of Departure | Male | Female |
| 12:00 AM to 4:59 AM | 87 (6.7%) | 8 (0.6%) |
| 5:00 AM to 5:29 AM | 98 (7.5%) | 0 (0.0%) |
| 5:30 AM to 5:59 AM | 90 (6.9%) | 75 (5.4%) |
| 6:00 AM to 6:29 AM | 187 (14.3%) | 69 (5.0%) |
| 6:30 AM to 6:59 AM | 68 (5.2%) | 72 (5.2%) |
| 7:00 AM to 7:29 AM | 141 (10.8%) | 277 (19.9%) |
| 7:30 AM to 7:59 AM | 173 (13.2%) | 277 (19.9%) |
| 8:00 AM to 8:29 AM | 172 (13.2%) | 159 (11.5%) |
| 8:30 AM to 8:59 AM | 28 (2.1%) | 128 (9.2%) |
| 9:00 AM to 9:59 AM | 71 (5.4%) | 152 (10.9%) |
| 10:00 AM to 10:59 AM | 41 (3.1%) | 10 (0.7%) |
| 11:00 AM to 11:59 AM | 0 (0.0%) | 9 (0.6%) |
| 12:00 PM to 3:59 PM | 98 (7.5%) | 79 (5.7%) |
| 4:00 PM to 11:59 PM | 54 (4.1%) | 74 (5.3%) |
| Total | 1,308 (100.0%) | 1,389 (100.0%) |
Housing Occupancy in East Falmouth
Occupancy by Ownership in East Falmouth
Of the total 3,009 dwellings in East Falmouth, owner-occupied units account for 2,659 (88.4%), while renter-occupied units make up 350 (11.6%).
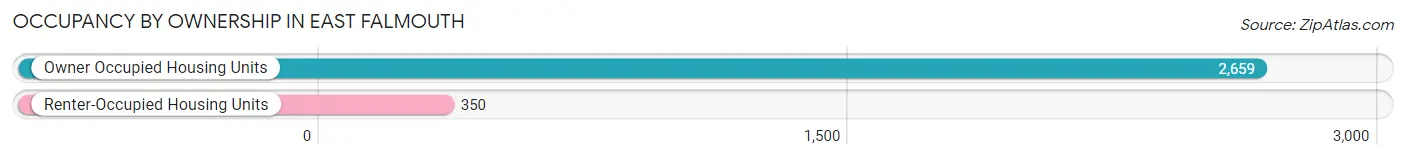
| Occupancy | # Housing Units | % Housing Units |
| Owner Occupied Housing Units | 2,659 | 88.4% |
| Renter-Occupied Housing Units | 350 | 11.6% |
| Total Occupied Housing Units | 3,009 | 100.0% |
Occupancy by Household Size in East Falmouth
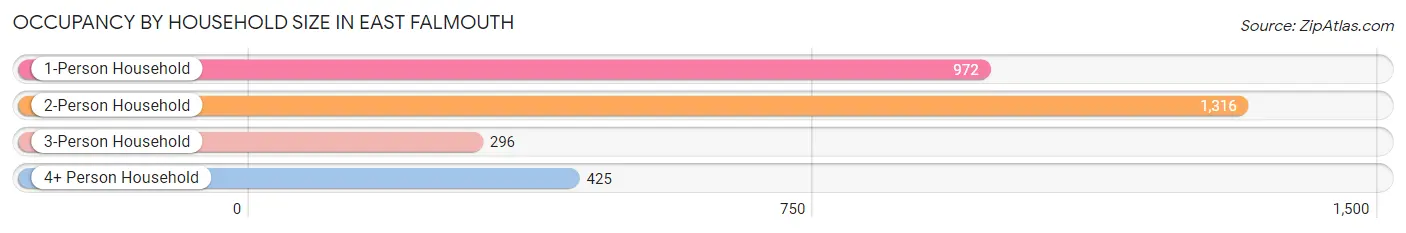
| Household Size | # Housing Units | % Housing Units |
| 1-Person Household | 972 | 32.3% |
| 2-Person Household | 1,316 | 43.7% |
| 3-Person Household | 296 | 9.8% |
| 4+ Person Household | 425 | 14.1% |
| Total Housing Units | 3,009 | 100.0% |
Occupancy by Ownership by Household Size in East Falmouth
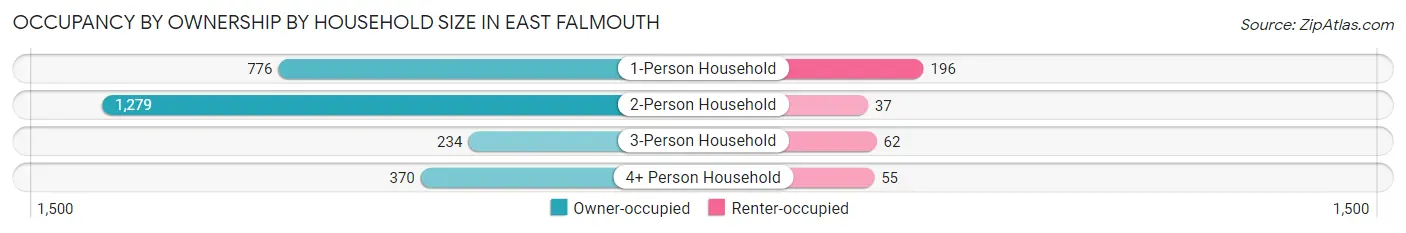
| Household Size | Owner-occupied | Renter-occupied |
| 1-Person Household | 776 (79.8%) | 196 (20.2%) |
| 2-Person Household | 1,279 (97.2%) | 37 (2.8%) |
| 3-Person Household | 234 (79.0%) | 62 (20.9%) |
| 4+ Person Household | 370 (87.1%) | 55 (12.9%) |
| Total Housing Units | 2,659 (88.4%) | 350 (11.6%) |
Occupancy by Educational Attainment in East Falmouth
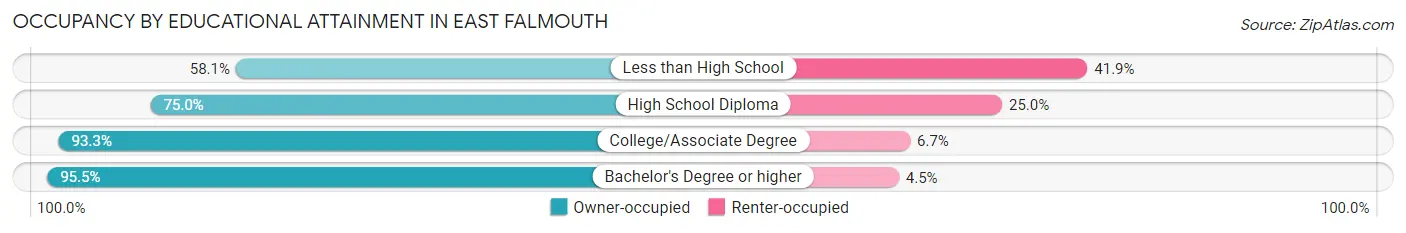
| Household Size | Owner-occupied | Renter-occupied |
| Less than High School | 118 (58.1%) | 85 (41.9%) |
| High School Diploma | 445 (75.0%) | 148 (25.0%) |
| College/Associate Degree | 734 (93.3%) | 53 (6.7%) |
| Bachelor's Degree or higher | 1,362 (95.5%) | 64 (4.5%) |
Occupancy by Age of Householder in East Falmouth
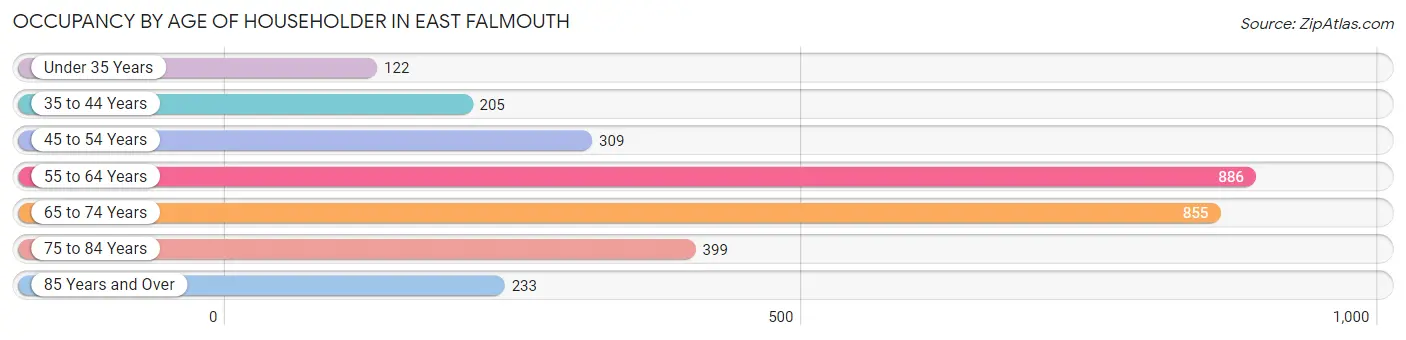
| Age Bracket | # Households | % Households |
| Under 35 Years | 122 | 4.1% |
| 35 to 44 Years | 205 | 6.8% |
| 45 to 54 Years | 309 | 10.3% |
| 55 to 64 Years | 886 | 29.4% |
| 65 to 74 Years | 855 | 28.4% |
| 75 to 84 Years | 399 | 13.3% |
| 85 Years and Over | 233 | 7.7% |
| Total | 3,009 | 100.0% |
Housing Finances in East Falmouth
Median Income by Occupancy in East Falmouth
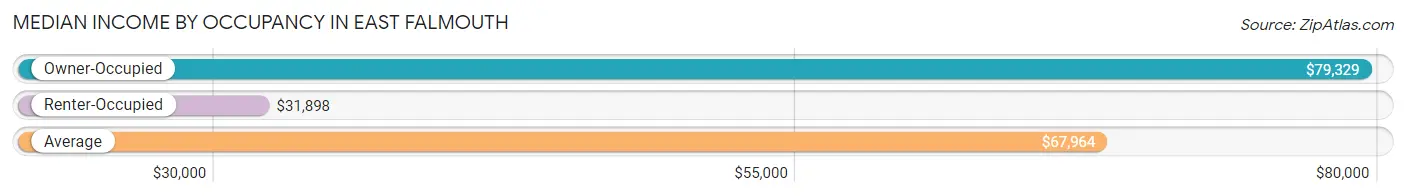
| Occupancy Type | # Households | Median Income |
| Owner-Occupied | 2,659 (88.4%) | $79,329 |
| Renter-Occupied | 350 (11.6%) | $31,898 |
| Average | 3,009 (100.0%) | $67,964 |
Occupancy by Householder Income Bracket in East Falmouth
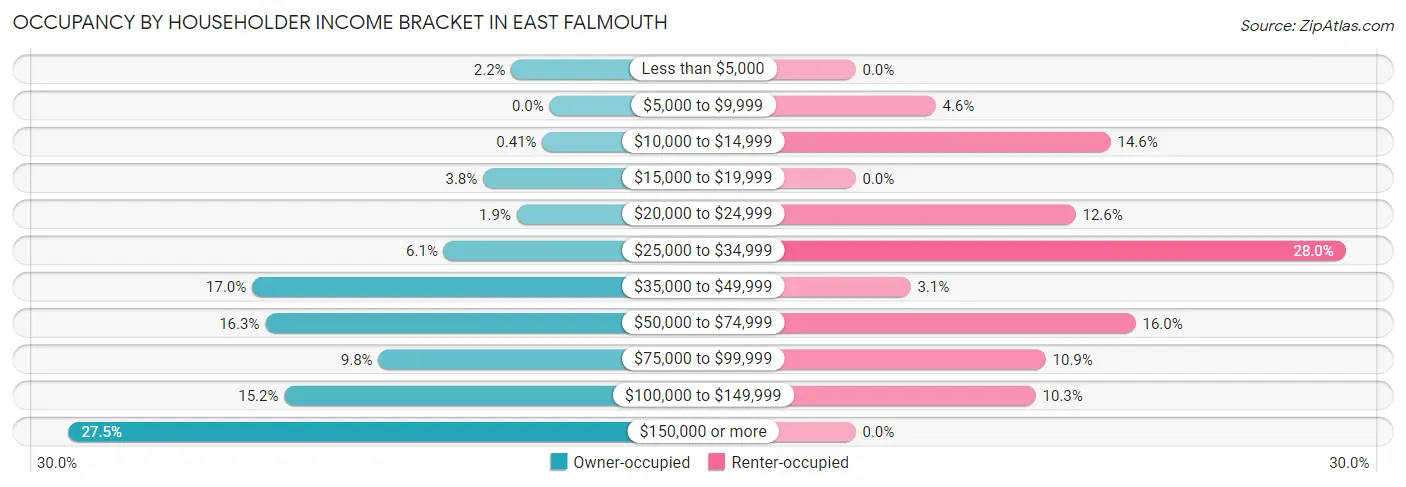
| Income Bracket | Owner-occupied | Renter-occupied |
| Less than $5,000 | 58 (2.2%) | 0 (0.0%) |
| $5,000 to $9,999 | 0 (0.0%) | 16 (4.6%) |
| $10,000 to $14,999 | 11 (0.4%) | 51 (14.6%) |
| $15,000 to $19,999 | 101 (3.8%) | 0 (0.0%) |
| $20,000 to $24,999 | 50 (1.9%) | 44 (12.6%) |
| $25,000 to $34,999 | 161 (6.0%) | 98 (28.0%) |
| $35,000 to $49,999 | 452 (17.0%) | 11 (3.1%) |
| $50,000 to $74,999 | 432 (16.3%) | 56 (16.0%) |
| $75,000 to $99,999 | 260 (9.8%) | 38 (10.9%) |
| $100,000 to $149,999 | 403 (15.2%) | 36 (10.3%) |
| $150,000 or more | 731 (27.5%) | 0 (0.0%) |
| Total | 2,659 (100.0%) | 350 (100.0%) |
Monthly Housing Cost Tiers in East Falmouth
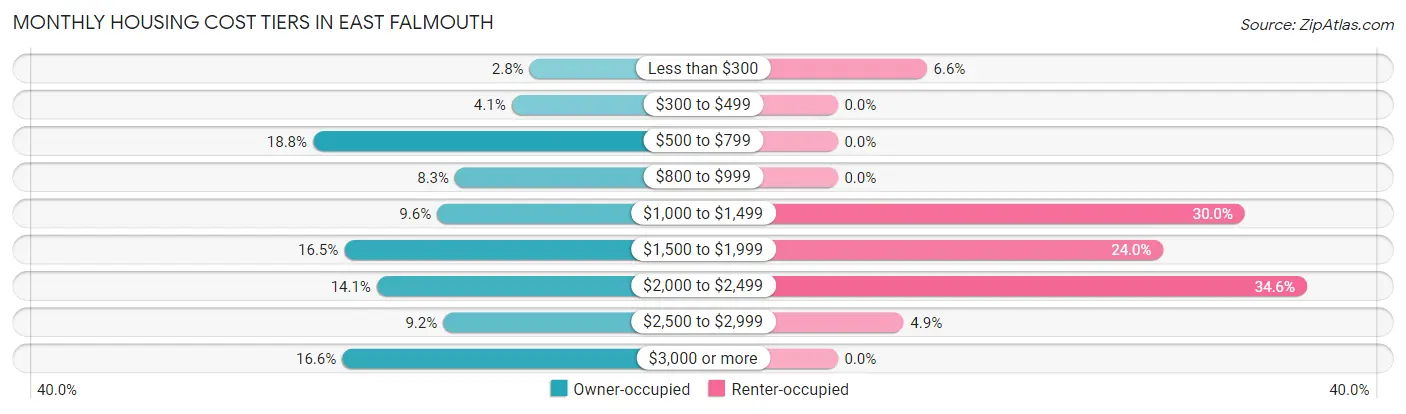
| Monthly Cost | Owner-occupied | Renter-occupied |
| Less than $300 | 75 (2.8%) | 23 (6.6%) |
| $300 to $499 | 110 (4.1%) | 0 (0.0%) |
| $500 to $799 | 499 (18.8%) | 0 (0.0%) |
| $800 to $999 | 221 (8.3%) | 0 (0.0%) |
| $1,000 to $1,499 | 256 (9.6%) | 105 (30.0%) |
| $1,500 to $1,999 | 438 (16.5%) | 84 (24.0%) |
| $2,000 to $2,499 | 374 (14.1%) | 121 (34.6%) |
| $2,500 to $2,999 | 244 (9.2%) | 17 (4.9%) |
| $3,000 or more | 442 (16.6%) | 0 (0.0%) |
| Total | 2,659 (100.0%) | 350 (100.0%) |
Physical Housing Characteristics in East Falmouth
Housing Structures in East Falmouth
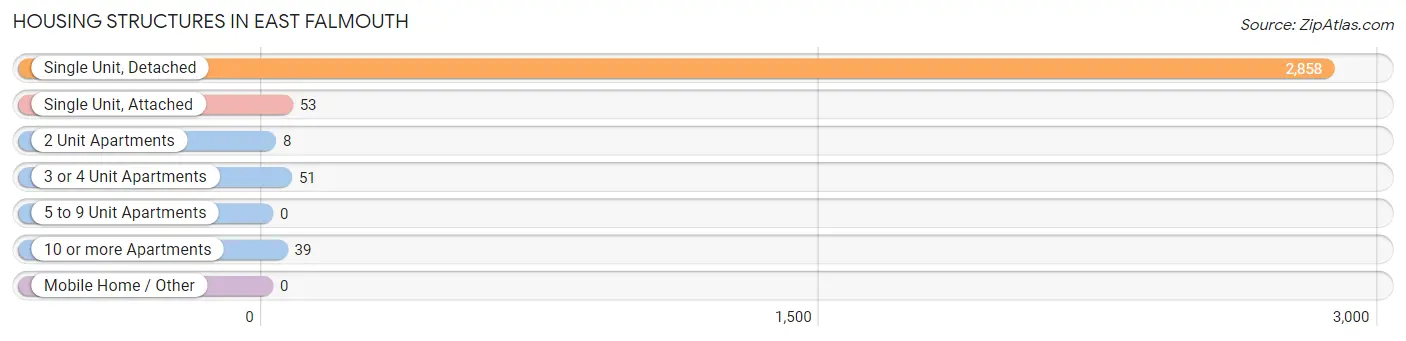
| Structure Type | # Housing Units | % Housing Units |
| Single Unit, Detached | 2,858 | 95.0% |
| Single Unit, Attached | 53 | 1.8% |
| 2 Unit Apartments | 8 | 0.3% |
| 3 or 4 Unit Apartments | 51 | 1.7% |
| 5 to 9 Unit Apartments | 0 | 0.0% |
| 10 or more Apartments | 39 | 1.3% |
| Mobile Home / Other | 0 | 0.0% |
| Total | 3,009 | 100.0% |
Housing Structures by Occupancy in East Falmouth
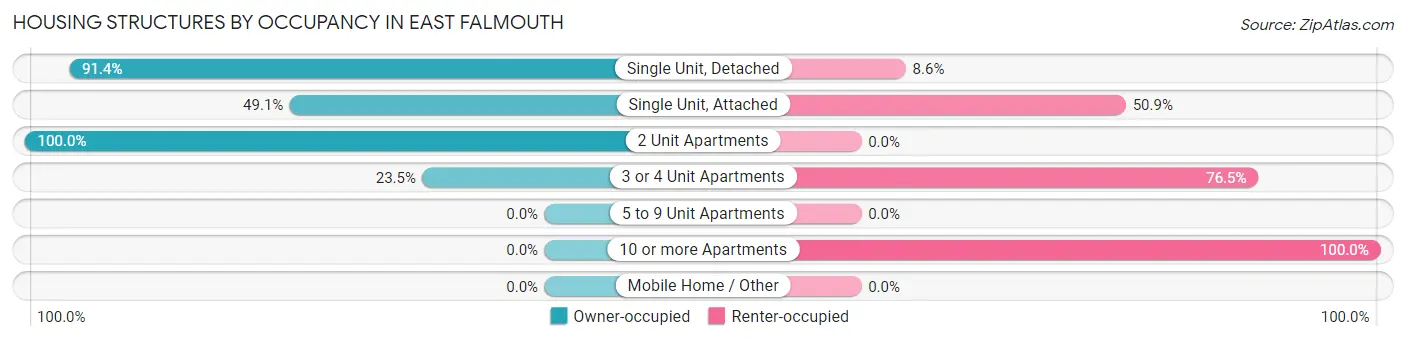
| Structure Type | Owner-occupied | Renter-occupied |
| Single Unit, Detached | 2,613 (91.4%) | 245 (8.6%) |
| Single Unit, Attached | 26 (49.1%) | 27 (50.9%) |
| 2 Unit Apartments | 8 (100.0%) | 0 (0.0%) |
| 3 or 4 Unit Apartments | 12 (23.5%) | 39 (76.5%) |
| 5 to 9 Unit Apartments | 0 (0.0%) | 0 (0.0%) |
| 10 or more Apartments | 0 (0.0%) | 39 (100.0%) |
| Mobile Home / Other | 0 (0.0%) | 0 (0.0%) |
| Total | 2,659 (88.4%) | 350 (11.6%) |
Housing Structures by Number of Rooms in East Falmouth
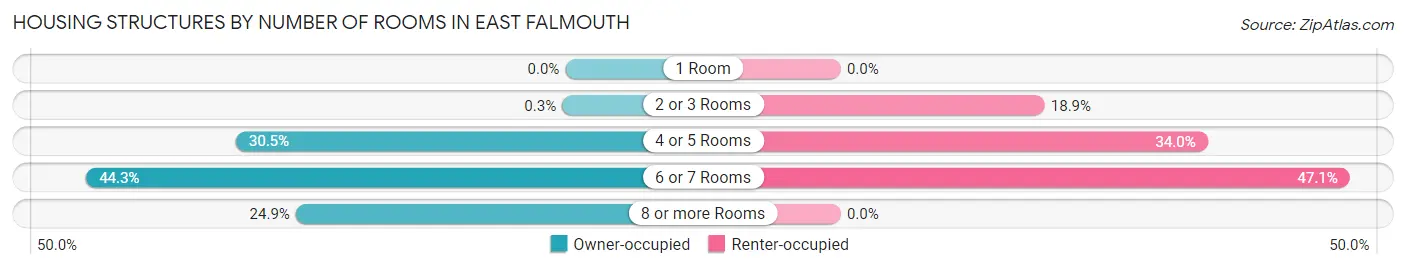
| Number of Rooms | Owner-occupied | Renter-occupied |
| 1 Room | 0 (0.0%) | 0 (0.0%) |
| 2 or 3 Rooms | 8 (0.3%) | 66 (18.9%) |
| 4 or 5 Rooms | 810 (30.5%) | 119 (34.0%) |
| 6 or 7 Rooms | 1,178 (44.3%) | 165 (47.1%) |
| 8 or more Rooms | 663 (24.9%) | 0 (0.0%) |
| Total | 2,659 (100.0%) | 350 (100.0%) |
Housing Structure by Heating Type in East Falmouth
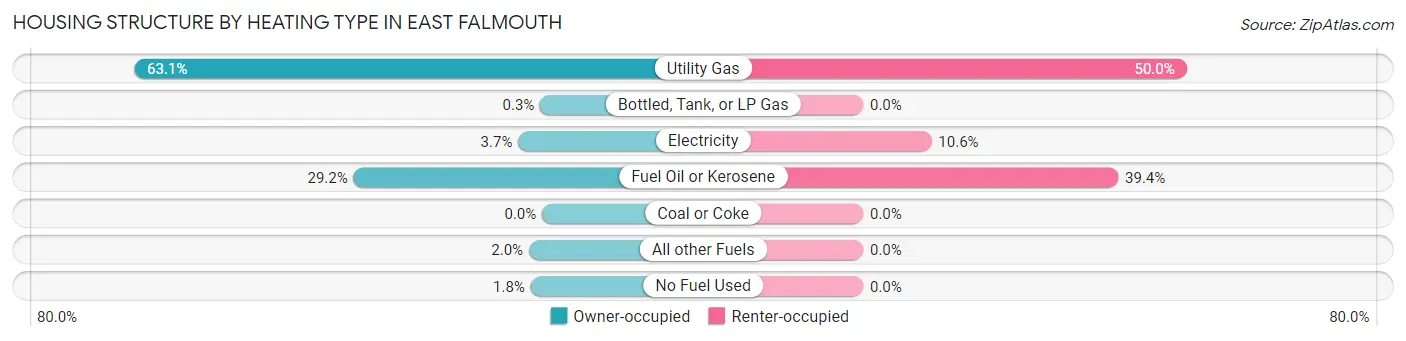
| Heating Type | Owner-occupied | Renter-occupied |
| Utility Gas | 1,677 (63.1%) | 175 (50.0%) |
| Bottled, Tank, or LP Gas | 8 (0.3%) | 0 (0.0%) |
| Electricity | 98 (3.7%) | 37 (10.6%) |
| Fuel Oil or Kerosene | 775 (29.1%) | 138 (39.4%) |
| Coal or Coke | 0 (0.0%) | 0 (0.0%) |
| All other Fuels | 54 (2.0%) | 0 (0.0%) |
| No Fuel Used | 47 (1.8%) | 0 (0.0%) |
| Total | 2,659 (100.0%) | 350 (100.0%) |
Household Vehicle Usage in East Falmouth
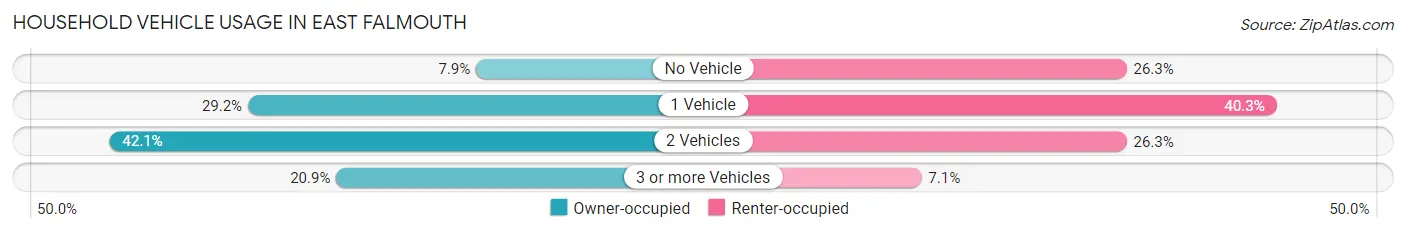
| Vehicles per Household | Owner-occupied | Renter-occupied |
| No Vehicle | 209 (7.9%) | 92 (26.3%) |
| 1 Vehicle | 775 (29.1%) | 141 (40.3%) |
| 2 Vehicles | 1,119 (42.1%) | 92 (26.3%) |
| 3 or more Vehicles | 556 (20.9%) | 25 (7.1%) |
| Total | 2,659 (100.0%) | 350 (100.0%) |
Real Estate & Mortgages in East Falmouth
Real Estate and Mortgage Overview in East Falmouth
| Characteristic | Without Mortgage | With Mortgage |
| Housing Units | 1,063 | 1,596 |
| Median Property Value | $511,900 | $477,800 |
| Median Household Income | $62,734 | $483 |
| Monthly Housing Costs | $764 | $442 |
| Real Estate Taxes | $3,631 | $45 |
Property Value by Mortgage Status in East Falmouth
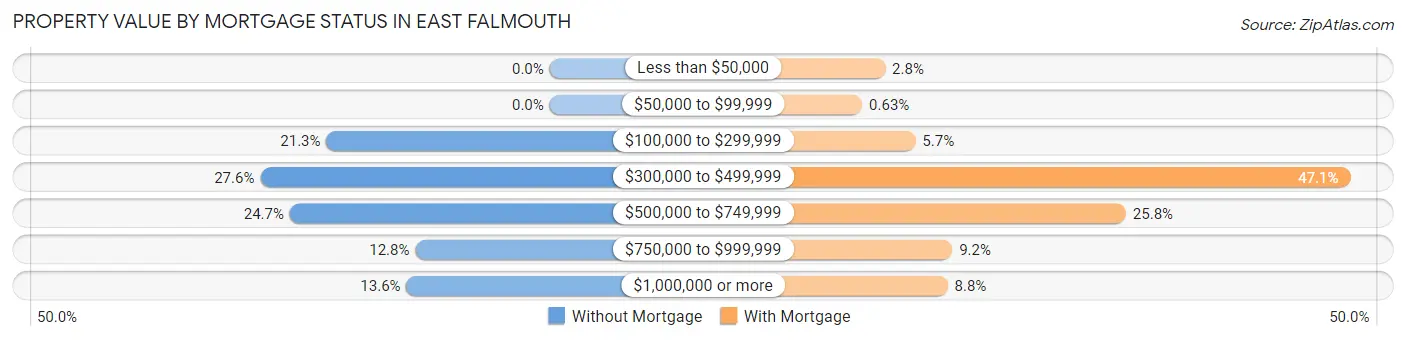
| Property Value | Without Mortgage | With Mortgage |
| Less than $50,000 | 0 (0.0%) | 45 (2.8%) |
| $50,000 to $99,999 | 0 (0.0%) | 10 (0.6%) |
| $100,000 to $299,999 | 226 (21.3%) | 91 (5.7%) |
| $300,000 to $499,999 | 293 (27.6%) | 752 (47.1%) |
| $500,000 to $749,999 | 263 (24.7%) | 411 (25.8%) |
| $750,000 to $999,999 | 136 (12.8%) | 147 (9.2%) |
| $1,000,000 or more | 145 (13.6%) | 140 (8.8%) |
| Total | 1,063 (100.0%) | 1,596 (100.0%) |
Household Income by Mortgage Status in East Falmouth
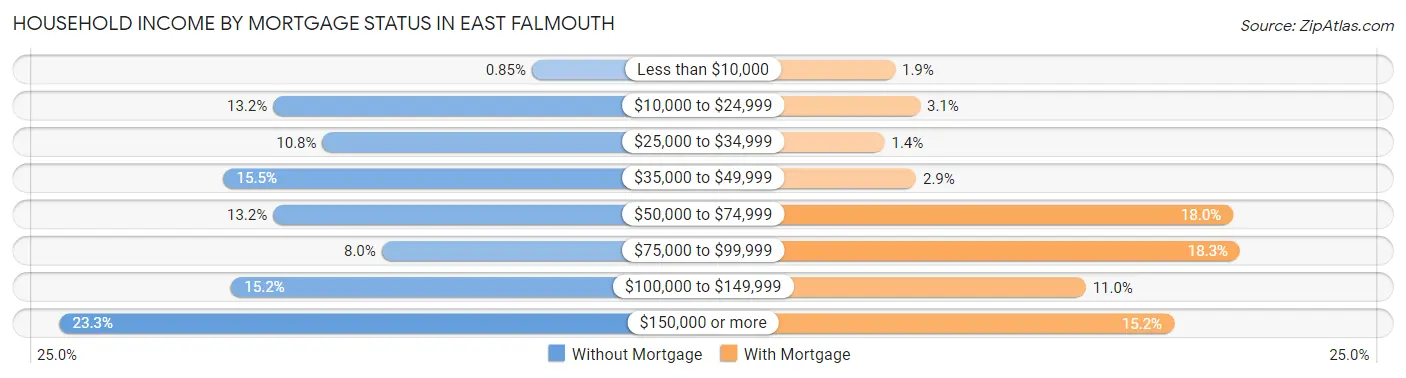
| Household Income | Without Mortgage | With Mortgage |
| Less than $10,000 | 9 (0.9%) | 30 (1.9%) |
| $10,000 to $24,999 | 140 (13.2%) | 49 (3.1%) |
| $25,000 to $34,999 | 115 (10.8%) | 22 (1.4%) |
| $35,000 to $49,999 | 165 (15.5%) | 46 (2.9%) |
| $50,000 to $74,999 | 140 (13.2%) | 287 (18.0%) |
| $75,000 to $99,999 | 85 (8.0%) | 292 (18.3%) |
| $100,000 to $149,999 | 161 (15.1%) | 175 (11.0%) |
| $150,000 or more | 248 (23.3%) | 242 (15.2%) |
| Total | 1,063 (100.0%) | 1,596 (100.0%) |
Property Value to Household Income Ratio in East Falmouth
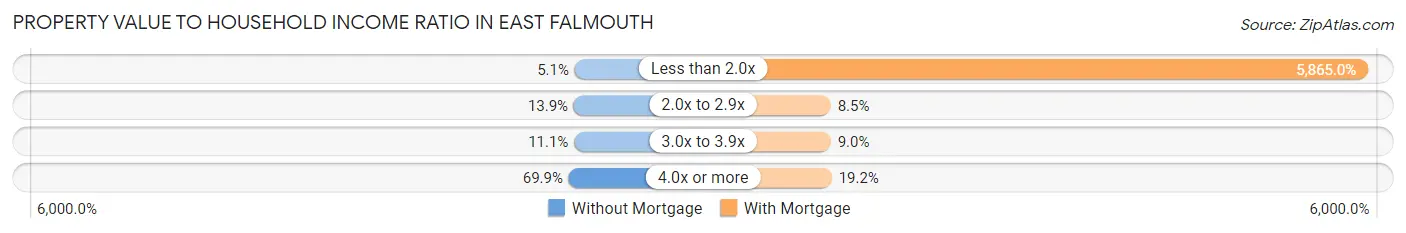
| Value-to-Income Ratio | Without Mortgage | With Mortgage |
| Less than 2.0x | 54 (5.1%) | 93,606 (5,865.0%) |
| 2.0x to 2.9x | 148 (13.9%) | 135 (8.5%) |
| 3.0x to 3.9x | 118 (11.1%) | 143 (9.0%) |
| 4.0x or more | 743 (69.9%) | 307 (19.2%) |
| Total | 1,063 (100.0%) | 1,596 (100.0%) |
Real Estate Taxes by Mortgage Status in East Falmouth
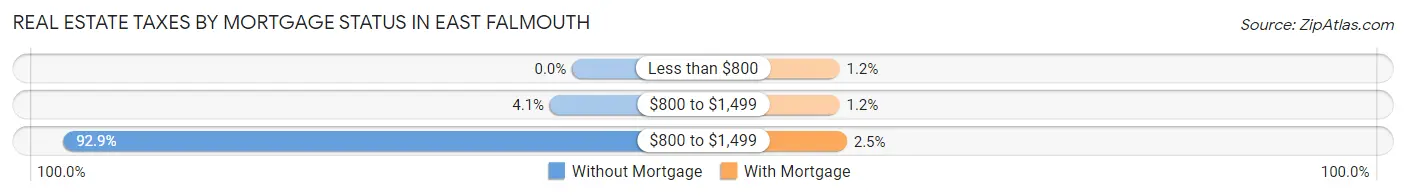
| Property Taxes | Without Mortgage | With Mortgage |
| Less than $800 | 0 (0.0%) | 19 (1.2%) |
| $800 to $1,499 | 43 (4.1%) | 19 (1.2%) |
| $800 to $1,499 | 988 (92.9%) | 40 (2.5%) |
| Total | 1,063 (100.0%) | 1,596 (100.0%) |
Health & Disability in East Falmouth
Health Insurance Coverage by Age in East Falmouth
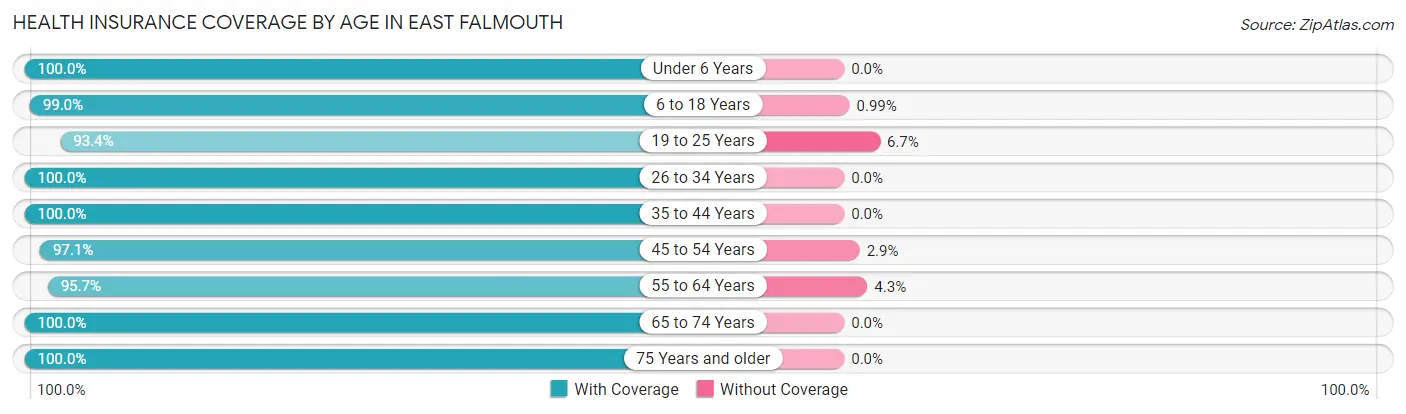
| Age Bracket | With Coverage | Without Coverage |
| Under 6 Years | 178 (100.0%) | 0 (0.0%) |
| 6 to 18 Years | 797 (99.0%) | 8 (1.0%) |
| 19 to 25 Years | 351 (93.3%) | 25 (6.7%) |
| 26 to 34 Years | 337 (100.0%) | 0 (0.0%) |
| 35 to 44 Years | 453 (100.0%) | 0 (0.0%) |
| 45 to 54 Years | 574 (97.1%) | 17 (2.9%) |
| 55 to 64 Years | 1,353 (95.7%) | 61 (4.3%) |
| 65 to 74 Years | 1,408 (100.0%) | 0 (0.0%) |
| 75 Years and older | 996 (100.0%) | 0 (0.0%) |
| Total | 6,447 (98.3%) | 111 (1.7%) |
Health Insurance Coverage by Citizenship Status in East Falmouth
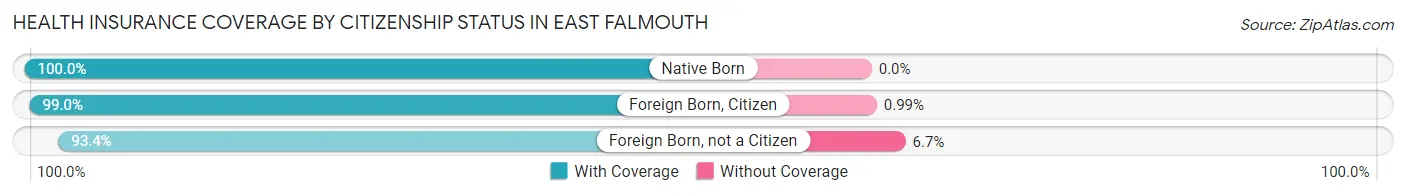
| Citizenship Status | With Coverage | Without Coverage |
| Native Born | 178 (100.0%) | 0 (0.0%) |
| Foreign Born, Citizen | 797 (99.0%) | 8 (1.0%) |
| Foreign Born, not a Citizen | 351 (93.3%) | 25 (6.7%) |
Health Insurance Coverage by Household Income in East Falmouth
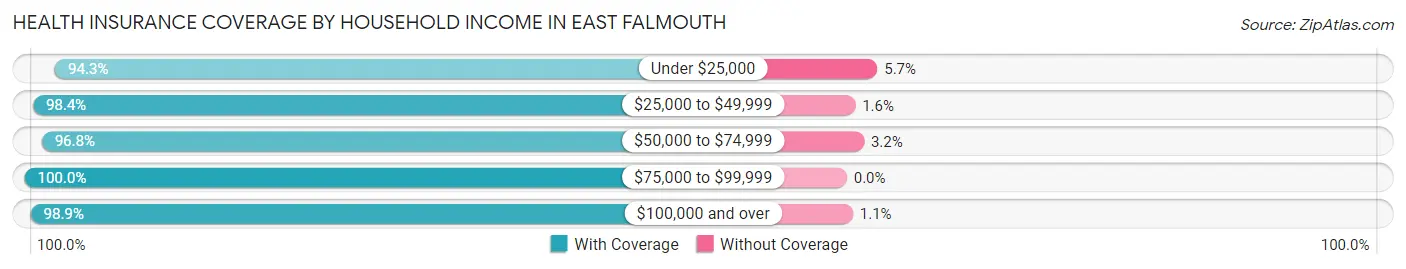
| Household Income | With Coverage | Without Coverage |
| Under $25,000 | 446 (94.3%) | 27 (5.7%) |
| $25,000 to $49,999 | 1,320 (98.4%) | 21 (1.6%) |
| $50,000 to $74,999 | 844 (96.8%) | 28 (3.2%) |
| $75,000 to $99,999 | 754 (100.0%) | 0 (0.0%) |
| $100,000 and over | 3,074 (98.9%) | 35 (1.1%) |
Public vs Private Health Insurance Coverage by Age in East Falmouth
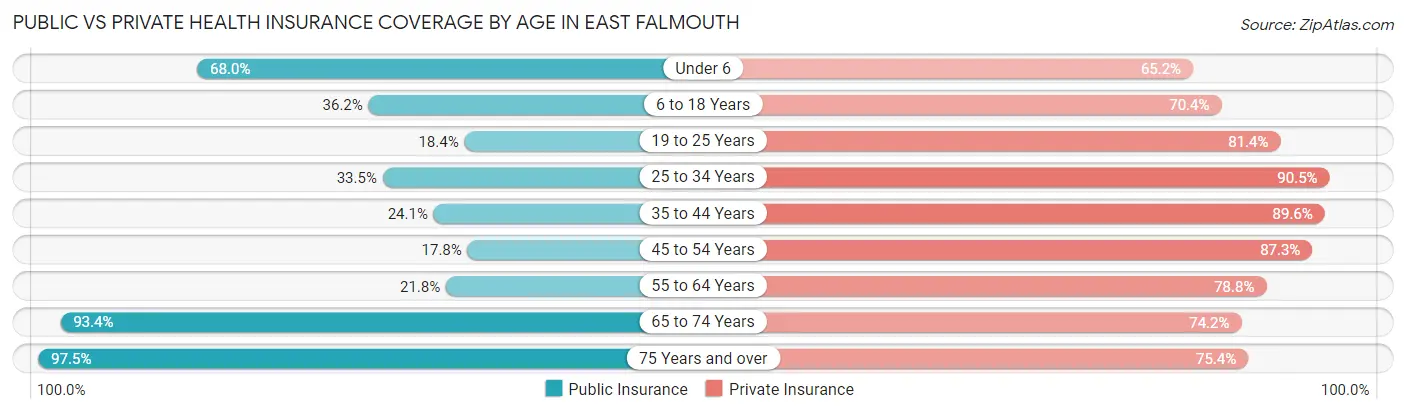
| Age Bracket | Public Insurance | Private Insurance |
| Under 6 | 121 (68.0%) | 116 (65.2%) |
| 6 to 18 Years | 291 (36.1%) | 567 (70.4%) |
| 19 to 25 Years | 69 (18.3%) | 306 (81.4%) |
| 25 to 34 Years | 113 (33.5%) | 305 (90.5%) |
| 35 to 44 Years | 109 (24.1%) | 406 (89.6%) |
| 45 to 54 Years | 105 (17.8%) | 516 (87.3%) |
| 55 to 64 Years | 308 (21.8%) | 1,114 (78.8%) |
| 65 to 74 Years | 1,315 (93.4%) | 1,044 (74.2%) |
| 75 Years and over | 971 (97.5%) | 751 (75.4%) |
| Total | 3,402 (51.9%) | 5,125 (78.1%) |
Disability Status by Sex by Age in East Falmouth
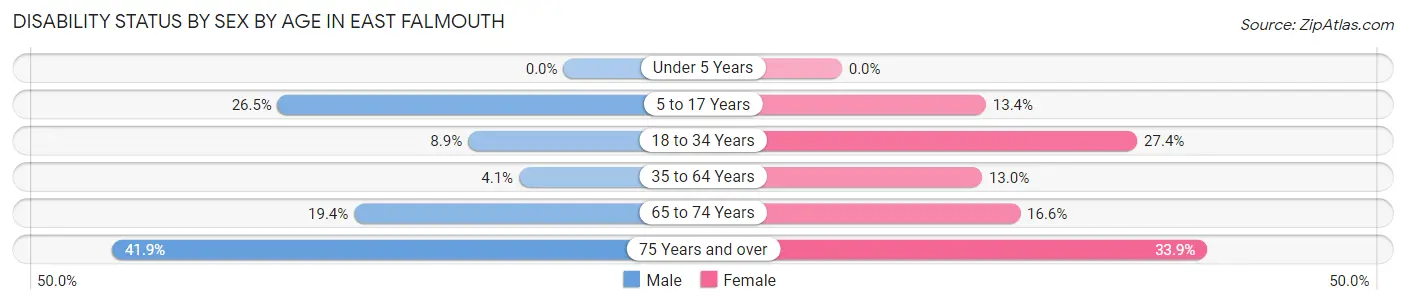
| Age Bracket | Male | Female |
| Under 5 Years | 0 (0.0%) | 0 (0.0%) |
| 5 to 17 Years | 101 (26.5%) | 46 (13.4%) |
| 18 to 34 Years | 30 (8.8%) | 128 (27.4%) |
| 35 to 64 Years | 43 (4.1%) | 184 (13.0%) |
| 65 to 74 Years | 135 (19.4%) | 118 (16.6%) |
| 75 Years and over | 222 (41.9%) | 158 (33.9%) |
Disability Class by Sex by Age in East Falmouth
Disability Class: Hearing Difficulty
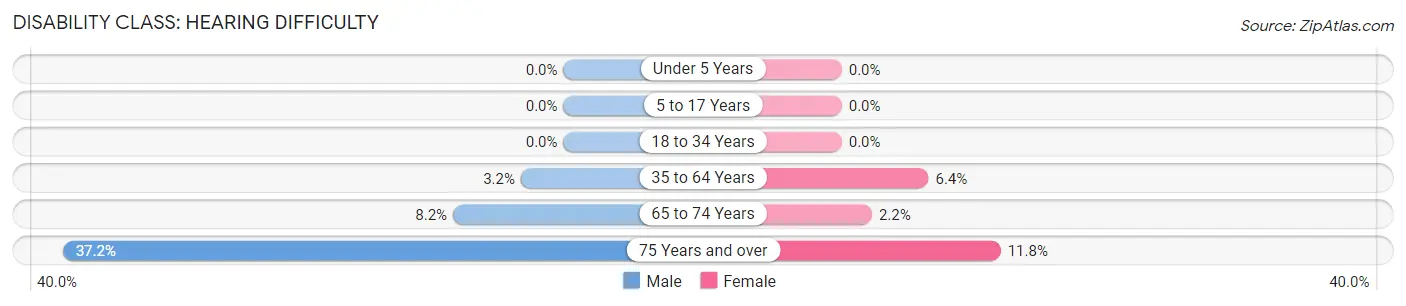
| Age Bracket | Male | Female |
| Under 5 Years | 0 (0.0%) | 0 (0.0%) |
| 5 to 17 Years | 0 (0.0%) | 0 (0.0%) |
| 18 to 34 Years | 0 (0.0%) | 0 (0.0%) |
| 35 to 64 Years | 33 (3.2%) | 91 (6.4%) |
| 65 to 74 Years | 57 (8.2%) | 16 (2.2%) |
| 75 Years and over | 197 (37.2%) | 55 (11.8%) |
Disability Class: Vision Difficulty
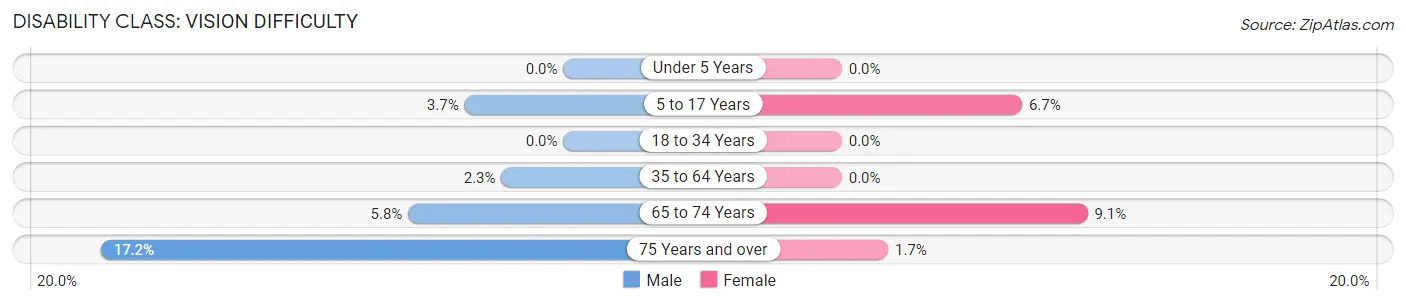
| Age Bracket | Male | Female |
| Under 5 Years | 0 (0.0%) | 0 (0.0%) |
| 5 to 17 Years | 14 (3.7%) | 23 (6.7%) |
| 18 to 34 Years | 0 (0.0%) | 0 (0.0%) |
| 35 to 64 Years | 24 (2.3%) | 0 (0.0%) |
| 65 to 74 Years | 40 (5.8%) | 65 (9.1%) |
| 75 Years and over | 91 (17.2%) | 8 (1.7%) |
Disability Class: Cognitive Difficulty
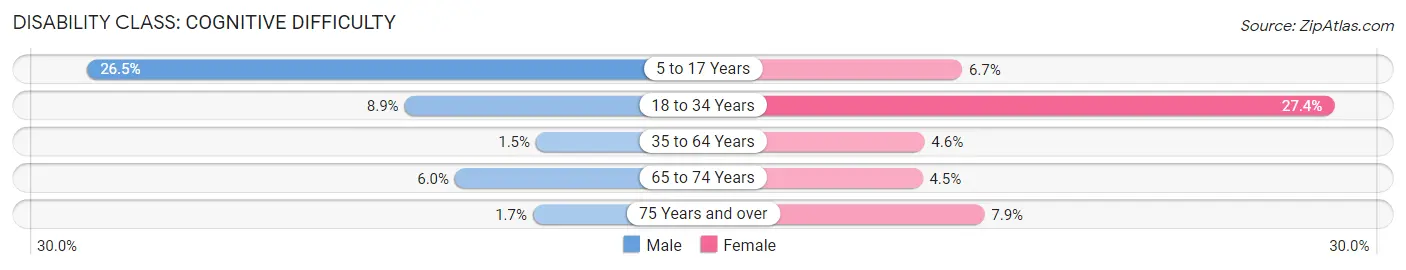
| Age Bracket | Male | Female |
| 5 to 17 Years | 101 (26.5%) | 23 (6.7%) |
| 18 to 34 Years | 30 (8.8%) | 128 (27.4%) |
| 35 to 64 Years | 16 (1.5%) | 65 (4.6%) |
| 65 to 74 Years | 42 (6.0%) | 32 (4.5%) |
| 75 Years and over | 9 (1.7%) | 37 (7.9%) |
Disability Class: Ambulatory Difficulty
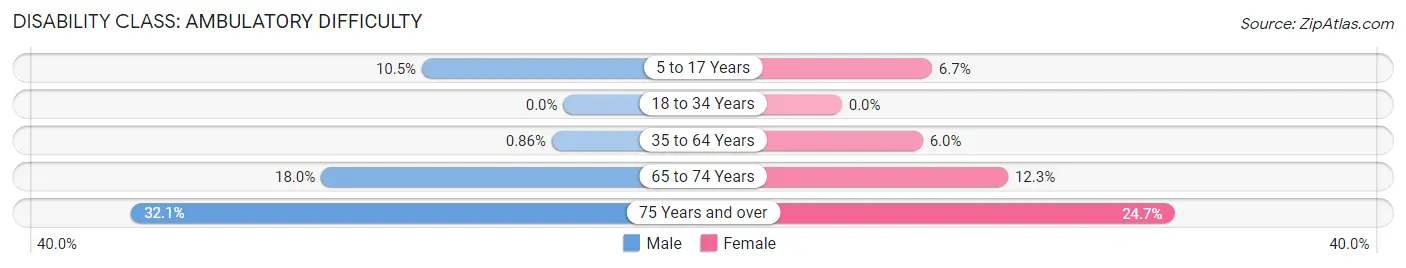
| Age Bracket | Male | Female |
| 5 to 17 Years | 40 (10.5%) | 23 (6.7%) |
| 18 to 34 Years | 0 (0.0%) | 0 (0.0%) |
| 35 to 64 Years | 9 (0.9%) | 85 (6.0%) |
| 65 to 74 Years | 125 (18.0%) | 88 (12.3%) |
| 75 Years and over | 170 (32.1%) | 115 (24.7%) |
Disability Class: Self-Care Difficulty
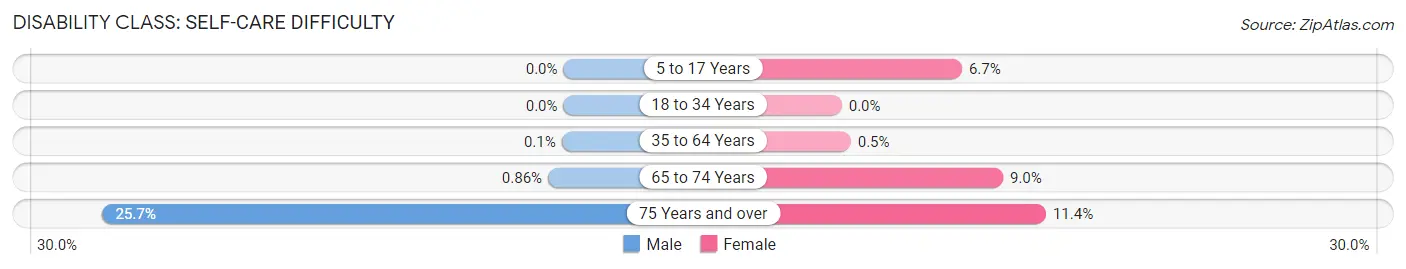
| Age Bracket | Male | Female |
| 5 to 17 Years | 0 (0.0%) | 23 (6.7%) |
| 18 to 34 Years | 0 (0.0%) | 0 (0.0%) |
| 35 to 64 Years | 1 (0.1%) | 7 (0.5%) |
| 65 to 74 Years | 6 (0.9%) | 64 (9.0%) |
| 75 Years and over | 136 (25.7%) | 53 (11.4%) |
Technology Access in East Falmouth
Computing Device Access in East Falmouth
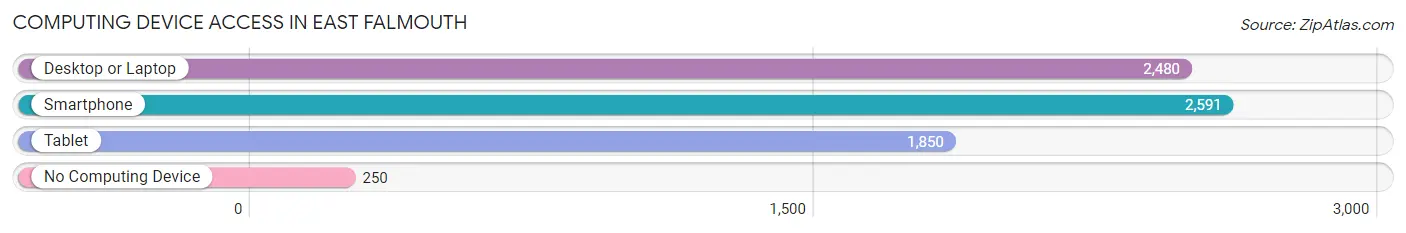
| Device Type | # Households | % Households |
| Desktop or Laptop | 2,480 | 82.4% |
| Smartphone | 2,591 | 86.1% |
| Tablet | 1,850 | 61.5% |
| No Computing Device | 250 | 8.3% |
| Total | 3,009 | 100.0% |
Internet Access in East Falmouth

| Internet Type | # Households | % Households |
| Dial-Up Internet | 0 | 0.0% |
| Broadband Home | 2,247 | 74.7% |
| Cellular Data Only | 246 | 8.2% |
| Satellite Internet | 214 | 7.1% |
| No Internet | 419 | 13.9% |
| Total | 3,009 | 100.0% |
East Falmouth Summary
History
Falmouth, Massachusetts is a town located in Barnstable County on Cape Cod. It was first settled in 1660 by English colonists and was officially incorporated in 1686. The town was named after Falmouth, Cornwall in England. The town was initially a fishing and farming community, but it eventually became a popular summer resort destination.
In the late 19th century, the town of Falmouth began to expand and develop. The town was connected to the mainland by a bridge in 1872, and the railroad arrived in 1873. This allowed for increased tourism and development in the area.
In the early 20th century, Falmouth began to experience a period of growth and prosperity. The town was home to several large resorts, including the Falmouth Hotel, the Falmouth Inn, and the Falmouth Beach Hotel. These resorts attracted wealthy visitors from all over the world.
In the mid-20th century, Falmouth began to experience a decline in tourism. The town was hit hard by the Great Depression and World War II. Many of the resorts closed, and the town’s economy suffered.
In the late 20th century, Falmouth began to experience a resurgence. The town was revitalized by the construction of the Cape Cod Canal in the 1950s. The canal brought increased tourism and development to the area.
East Falmouth is a village located in the town of Falmouth. It was first settled in the late 17th century and was officially incorporated in 1711. The village was named after Falmouth, Cornwall in England.
East Falmouth was initially a farming and fishing community. In the late 19th century, the village began to experience a period of growth and development. The railroad arrived in 1873, and the village was connected to the mainland by a bridge in 1875. This allowed for increased tourism and development in the area.
In the early 20th century, East Falmouth began to experience a period of growth and prosperity. The village was home to several large resorts, including the East Falmouth Hotel, the East Falmouth Inn, and the East Falmouth Beach Hotel. These resorts attracted wealthy visitors from all over the world.
In the mid-20th century, East Falmouth began to experience a decline in tourism. The village was hit hard by the Great Depression and World War II. Many of the resorts closed, and the village’s economy suffered.
In the late 20th century, East Falmouth began to experience a resurgence. The village was revitalized by the construction of the Cape Cod Canal in the 1950s. The canal brought increased tourism and development to the area.
Geography
East Falmouth is located in the town of Falmouth in Barnstable County on Cape Cod. The village is situated on the eastern shore of Buzzards Bay, and it is bordered by the towns of Bourne and Mashpee.
The village of East Falmouth is located on a peninsula that juts out into Buzzards Bay. The peninsula is surrounded by several small islands, including Naushon Island, Cuttyhunk Island, and Penikese Island.
The village of East Falmouth is located in a temperate climate zone. The average temperature in the summer is around 70 degrees Fahrenheit, and the average temperature in the winter is around 40 degrees Fahrenheit.
Economy
The economy of East Falmouth is largely based on tourism. The village is home to several large resorts, including the East Falmouth Hotel, the East Falmouth Inn, and the East Falmouth Beach Hotel. These resorts attract visitors from all over the world.
The village is also home to several marinas, which attract boaters from all over the world. The marinas offer boat rentals, fishing charters, and other services.
The village is also home to several restaurants, bars, and shops. These businesses cater to both locals and tourists.
Demographics
As of the 2010 census, the population of East Falmouth was 5,836. The population is predominantly white (93.3%), with small percentages of African American (2.2%), Asian (1.2%), and Hispanic (1.1%) residents.
The median household income in East Falmouth is $68,944, and the median home value is $521,400. The village has a high rate of homeownership (83.3%).
The village is served by the Falmouth Public Schools system. The village is home to two elementary schools, one middle school, and one high school.
Common Questions
What is Per Capita Income in East Falmouth?
Per Capita income in East Falmouth is $54,127.
What is the Median Family Income in East Falmouth?
Median Family Income in East Falmouth is $99,457.
What is the Median Household income in East Falmouth?
Median Household Income in East Falmouth is $67,964.
What is Income or Wage Gap in East Falmouth?
Income or Wage Gap in East Falmouth is 27.6%.
Women in East Falmouth earn 72.4 cents for every dollar earned by a man.
What is Inequality or Gini Index in East Falmouth?
Inequality or Gini Index in East Falmouth is 0.50.
What is the Total Population of East Falmouth?
Total Population of East Falmouth is 6,558.
What is the Total Male Population of East Falmouth?
Total Male Population of East Falmouth is 3,072.
What is the Total Female Population of East Falmouth?
Total Female Population of East Falmouth is 3,486.
What is the Ratio of Males per 100 Females in East Falmouth?
There are 88.12 Males per 100 Females in East Falmouth.
What is the Ratio of Females per 100 Males in East Falmouth?
There are 113.48 Females per 100 Males in East Falmouth.
What is the Median Population Age in East Falmouth?
Median Population Age in East Falmouth is 58.7 Years.
What is the Average Family Size in East Falmouth
Average Family Size in East Falmouth is 2.7 People.
What is the Average Household Size in East Falmouth
Average Household Size in East Falmouth is 2.2 People.
How Large is the Labor Force in East Falmouth?
There are 3,364 People in the Labor Forcein in East Falmouth.
What is the Percentage of People in the Labor Force in East Falmouth?
57.7% of People are in the Labor Force in East Falmouth.
What is the Unemployment Rate in East Falmouth?
Unemployment Rate in East Falmouth is 4.7%.