Cities with the Most Immigrants from Kenya in Massachusetts
RELATED REPORTS & OPTIONS
Kenya
Massachusetts
Compare Cities
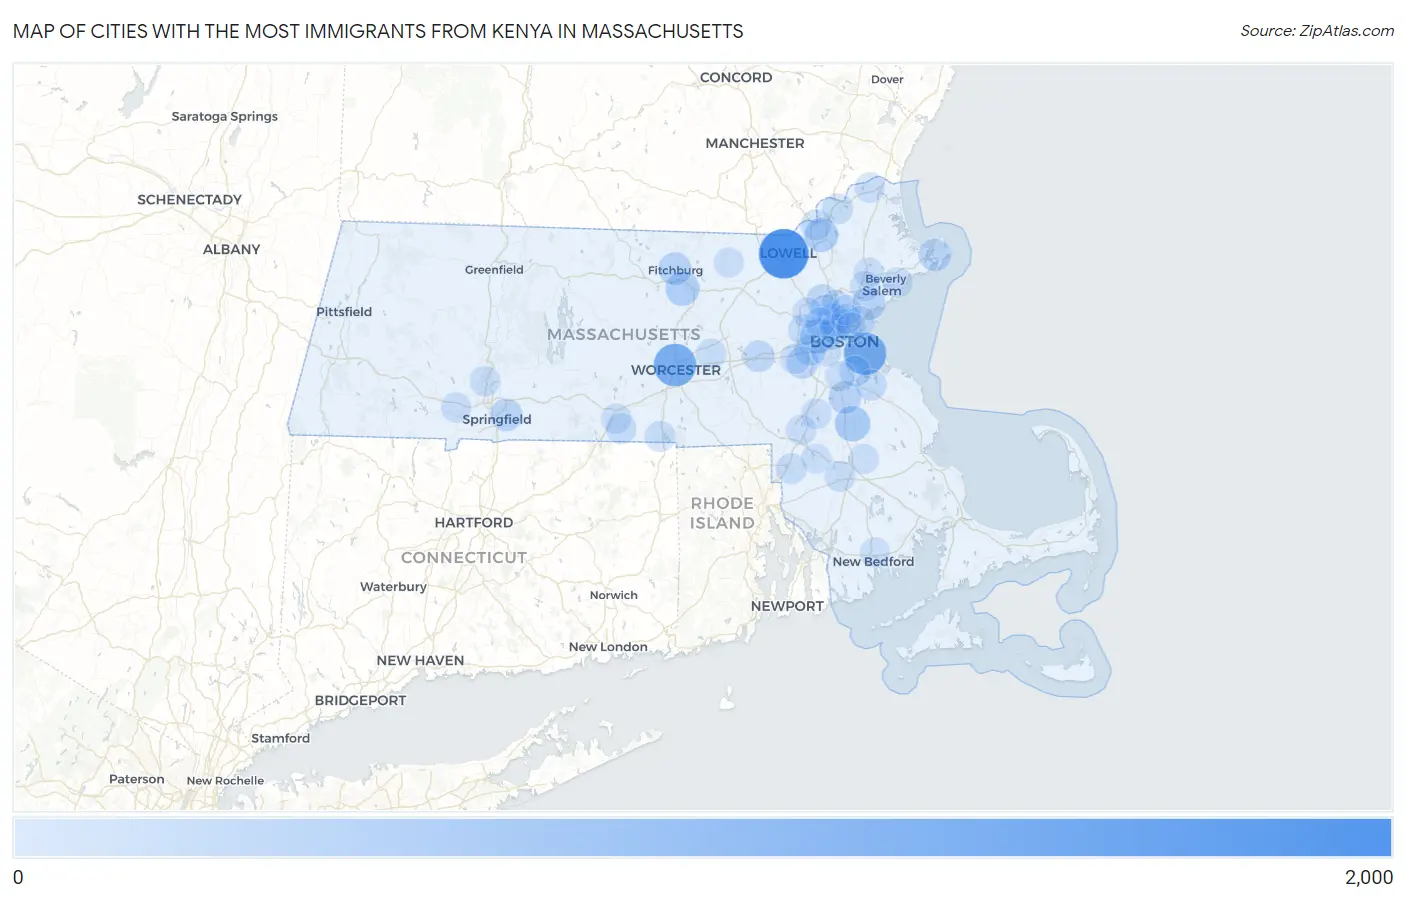
Map of Cities with the Most Immigrants from Kenya in Massachusetts
0
2,000
Cities with the Most Immigrants from Kenya in Massachusetts
| City | Kenya | vs State | vs National | |
| 1. | Lowell | 1,512 | 8,746(17.29%)#1 | 158,590(0.95%)#7 |
| 2. | Worcester | 953 | 8,746(10.90%)#2 | 158,590(0.60%)#22 |
| 3. | Boston | 947 | 8,746(10.83%)#3 | 158,590(0.60%)#23 |
| 4. | Brockton | 387 | 8,746(4.42%)#4 | 158,590(0.24%)#65 |
| 5. | Watertown Town | 342 | 8,746(3.91%)#5 | 158,590(0.22%)#74 |
| 6. | Leominster | 294 | 8,746(3.36%)#6 | 158,590(0.19%)#89 |
| 7. | Lawrence | 293 | 8,746(3.35%)#7 | 158,590(0.18%)#90 |
| 8. | Fitchburg | 213 | 8,746(2.44%)#8 | 158,590(0.13%)#135 |
| 9. | Lynn | 208 | 8,746(2.38%)#9 | 158,590(0.13%)#142 |
| 10. | Medford | 202 | 8,746(2.31%)#10 | 158,590(0.13%)#146 |
| 11. | Randolph Town | 197 | 8,746(2.25%)#11 | 158,590(0.12%)#157 |
| 12. | Gloucester | 177 | 8,746(2.02%)#12 | 158,590(0.11%)#182 |
| 13. | Springfield | 167 | 8,746(1.91%)#13 | 158,590(0.11%)#189 |
| 14. | Needham | 158 | 8,746(1.81%)#14 | 158,590(0.10%)#205 |
| 15. | Woburn | 130 | 8,746(1.49%)#15 | 158,590(0.08%)#243 |
| 16. | Framingham | 116 | 8,746(1.33%)#16 | 158,590(0.07%)#280 |
| 17. | Newton | 90 | 8,746(1.03%)#17 | 158,590(0.06%)#338 |
| 18. | Waltham | 82 | 8,746(0.94%)#18 | 158,590(0.05%)#362 |
| 19. | Cambridge | 74 | 8,746(0.85%)#19 | 158,590(0.05%)#389 |
| 20. | Methuen Town | 71 | 8,746(0.81%)#20 | 158,590(0.04%)#399 |
| 21. | Weymouth Town | 67 | 8,746(0.77%)#21 | 158,590(0.04%)#421 |
| 22. | Quincy | 65 | 8,746(0.74%)#22 | 158,590(0.04%)#430 |
| 23. | Haverhill | 62 | 8,746(0.71%)#23 | 158,590(0.04%)#451 |
| 24. | Webster | 59 | 8,746(0.67%)#24 | 158,590(0.04%)#476 |
| 25. | Everett | 50 | 8,746(0.57%)#25 | 158,590(0.03%)#537 |
| 26. | Amherst | 49 | 8,746(0.56%)#26 | 158,590(0.03%)#542 |
| 27. | Attleboro | 46 | 8,746(0.53%)#27 | 158,590(0.03%)#567 |
| 28. | Taunton | 39 | 8,746(0.45%)#28 | 158,590(0.02%)#643 |
| 29. | Southbridge Town | 39 | 8,746(0.45%)#29 | 158,590(0.02%)#649 |
| 30. | Brookline | 38 | 8,746(0.43%)#30 | 158,590(0.02%)#661 |
| 31. | Sharon | 37 | 8,746(0.42%)#31 | 158,590(0.02%)#681 |
| 32. | Foxborough | 36 | 8,746(0.41%)#32 | 158,590(0.02%)#695 |
| 33. | Winchester | 32 | 8,746(0.37%)#33 | 158,590(0.02%)#733 |
| 34. | Somerville | 30 | 8,746(0.34%)#34 | 158,590(0.02%)#753 |
| 35. | Holyoke | 29 | 8,746(0.33%)#35 | 158,590(0.02%)#767 |
| 36. | Peabody | 28 | 8,746(0.32%)#36 | 158,590(0.02%)#791 |
| 37. | Stoneham | 28 | 8,746(0.32%)#37 | 158,590(0.02%)#794 |
| 38. | Beverly | 24 | 8,746(0.27%)#38 | 158,590(0.02%)#864 |
| 39. | Lexington | 22 | 8,746(0.25%)#39 | 158,590(0.01%)#897 |
| 40. | Wellesley | 20 | 8,746(0.23%)#40 | 158,590(0.01%)#934 |
| 41. | Sturbridge | 19 | 8,746(0.22%)#41 | 158,590(0.01%)#975 |
| 42. | Westfield | 18 | 8,746(0.21%)#42 | 158,590(0.01%)#981 |
| 43. | Melrose | 18 | 8,746(0.21%)#43 | 158,590(0.01%)#983 |
| 44. | Northborough | 18 | 8,746(0.21%)#44 | 158,590(0.01%)#994 |
| 45. | Arlington | 15 | 8,746(0.17%)#45 | 158,590(0.01%)#1,071 |
| 46. | Amesbury Town | 15 | 8,746(0.17%)#46 | 158,590(0.01%)#1,078 |
| 47. | Malden | 13 | 8,746(0.15%)#47 | 158,590(0.01%)#1,121 |
| 48. | Revere | 10 | 8,746(0.11%)#48 | 158,590(0.01%)#1,214 |
| 49. | Danvers | 10 | 8,746(0.11%)#49 | 158,590(0.01%)#1,222 |
| 50. | Milton | 8 | 8,746(0.09%)#50 | 158,590(0.01%)#1,281 |
| 51. | Norton Center | 8 | 8,746(0.09%)#51 | 158,590(0.01%)#1,301 |
| 52. | New Bedford | 6 | 8,746(0.07%)#52 | 158,590(0.00%)#1,359 |
| 53. | Bridgewater Town | 6 | 8,746(0.07%)#53 | 158,590(0.00%)#1,374 |
| 54. | Groton | 4 | 8,746(0.05%)#54 | 158,590(0.00%)#1,446 |
| 55. | Chelsea | 2 | 8,746(0.02%)#55 | 158,590(0.00%)#1,487 |
Common Questions
What are the Top 10 Cities with the Most Immigrants from Kenya in Massachusetts?
Top 10 Cities with the Most Immigrants from Kenya in Massachusetts are:
#1
1,512
#2
953
#3
947
#4
387
#5
342
#6
294
#7
293
#8
213
#9
208
#10
202
What city has the Most Immigrants from Kenya in Massachusetts?
Lowell has the Most Immigrants from Kenya in Massachusetts with 1,512.
What is the Total Immigrants from Kenya in the State of Massachusetts?
Total Immigrants from Kenya in Massachusetts is 8,746.
What is the Total Immigrants from Kenya in the United States?
Total Immigrants from Kenya in the United States is 158,590.