North Falmouth, MA Map & Demographics
North Falmouth Map
North Falmouth Overview
$65,831
PER CAPITA INCOME
$174,375
AVG FAMILY INCOME
$129,421
AVG HOUSEHOLD INCOME
51.8%
WAGE / INCOME GAP [ % ]
48.2¢/ $1
WAGE / INCOME GAP [ $ ]
0.42
INEQUALITY / GINI INDEX
2,318
TOTAL POPULATION
1,072
MALE POPULATION
1,246
FEMALE POPULATION
86.04
MALES / 100 FEMALES
116.23
FEMALES / 100 MALES
49.6
MEDIAN AGE
3.0
AVG FAMILY SIZE
2.4
AVG HOUSEHOLD SIZE
1,165
LABOR FORCE [ PEOPLE ]
62.5%
PERCENT IN LABOR FORCE
5.6%
UNEMPLOYMENT RATE
North Falmouth Zip Codes
Income in North Falmouth
Income Overview in North Falmouth
Per Capita Income in North Falmouth is $65,831, while median incomes of families and households are $174,375 and $129,421 respectively.
| Characteristic | Number | Measure |
| Per Capita Income | 2,318 | $65,831 |
| Median Family Income | 644 | $174,375 |
| Mean Family Income | 644 | $200,572 |
| Median Household Income | 917 | $129,421 |
| Mean Household Income | 917 | $165,960 |
| Income Deficit | 644 | $0 |
| Wage / Income Gap (%) | 2,318 | 51.82% |
| Wage / Income Gap ($) | 2,318 | 48.18¢ per $1 |
| Gini / Inequality Index | 2,318 | 0.42 |
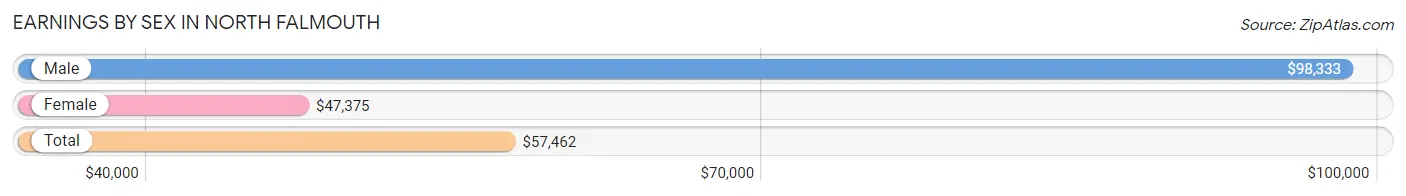
Earnings by Sex in North Falmouth
Average Earnings in North Falmouth are $57,462, $98,333 for men and $47,375 for women, a difference of 51.8%.
| Sex | Number | Average Earnings |
| Male | 660 (51.3%) | $98,333 |
| Female | 627 (48.7%) | $47,375 |
| Total | 1,287 (100.0%) | $57,462 |
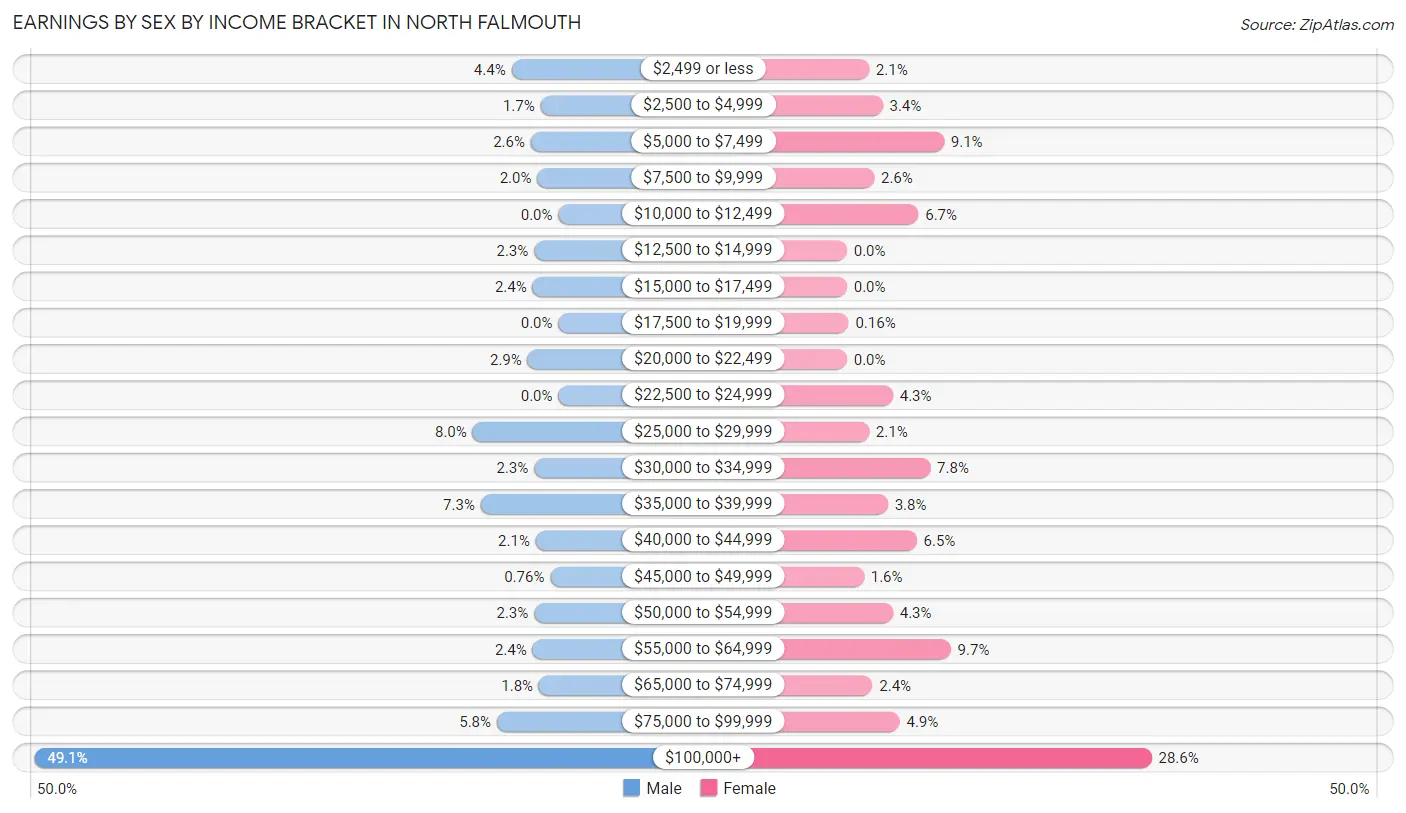
Earnings by Sex by Income Bracket in North Falmouth
The most common earnings brackets in North Falmouth are $100,000+ for men (324 | 49.1%) and $100,000+ for women (179 | 28.5%).
| Income | Male | Female |
| $2,499 or less | 29 (4.4%) | 13 (2.1%) |
| $2,500 to $4,999 | 11 (1.7%) | 21 (3.4%) |
| $5,000 to $7,499 | 17 (2.6%) | 57 (9.1%) |
| $7,500 to $9,999 | 13 (2.0%) | 16 (2.5%) |
| $10,000 to $12,499 | 0 (0.0%) | 42 (6.7%) |
| $12,500 to $14,999 | 15 (2.3%) | 0 (0.0%) |
| $15,000 to $17,499 | 16 (2.4%) | 0 (0.0%) |
| $17,500 to $19,999 | 0 (0.0%) | 1 (0.2%) |
| $20,000 to $22,499 | 19 (2.9%) | 0 (0.0%) |
| $22,500 to $24,999 | 0 (0.0%) | 27 (4.3%) |
| $25,000 to $29,999 | 53 (8.0%) | 13 (2.1%) |
| $30,000 to $34,999 | 15 (2.3%) | 49 (7.8%) |
| $35,000 to $39,999 | 48 (7.3%) | 24 (3.8%) |
| $40,000 to $44,999 | 14 (2.1%) | 41 (6.5%) |
| $45,000 to $49,999 | 5 (0.8%) | 10 (1.6%) |
| $50,000 to $54,999 | 15 (2.3%) | 27 (4.3%) |
| $55,000 to $64,999 | 16 (2.4%) | 61 (9.7%) |
| $65,000 to $74,999 | 12 (1.8%) | 15 (2.4%) |
| $75,000 to $99,999 | 38 (5.8%) | 31 (4.9%) |
| $100,000+ | 324 (49.1%) | 179 (28.5%) |
| Total | 660 (100.0%) | 627 (100.0%) |
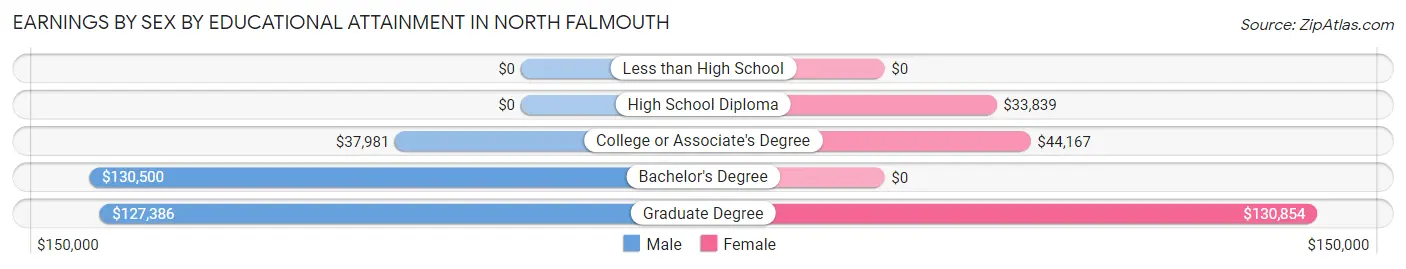
Earnings by Sex by Educational Attainment in North Falmouth
Average earnings in North Falmouth are $108,036 for men and $56,544 for women, a difference of 47.7%. Men with an educational attainment of bachelor's degree enjoy the highest average annual earnings of $130,500, while those with college or associate's degree education earn the least with $37,981. Women with an educational attainment of graduate degree earn the most with the average annual earnings of $130,854, while those with high school diploma education have the smallest earnings of $33,839.
| Educational Attainment | Male Income | Female Income |
| Less than High School | - | - |
| High School Diploma | - | - |
| College or Associate's Degree | $37,981 | $44,167 |
| Bachelor's Degree | $130,500 | $0 |
| Graduate Degree | $127,386 | $130,854 |
| Total | $108,036 | $56,544 |
Family Income in North Falmouth
Family Income Brackets in North Falmouth
According to the North Falmouth family income data, there are 298 families falling into the $200,000+ income range, which is the most common income bracket and makes up 46.3% of all families.
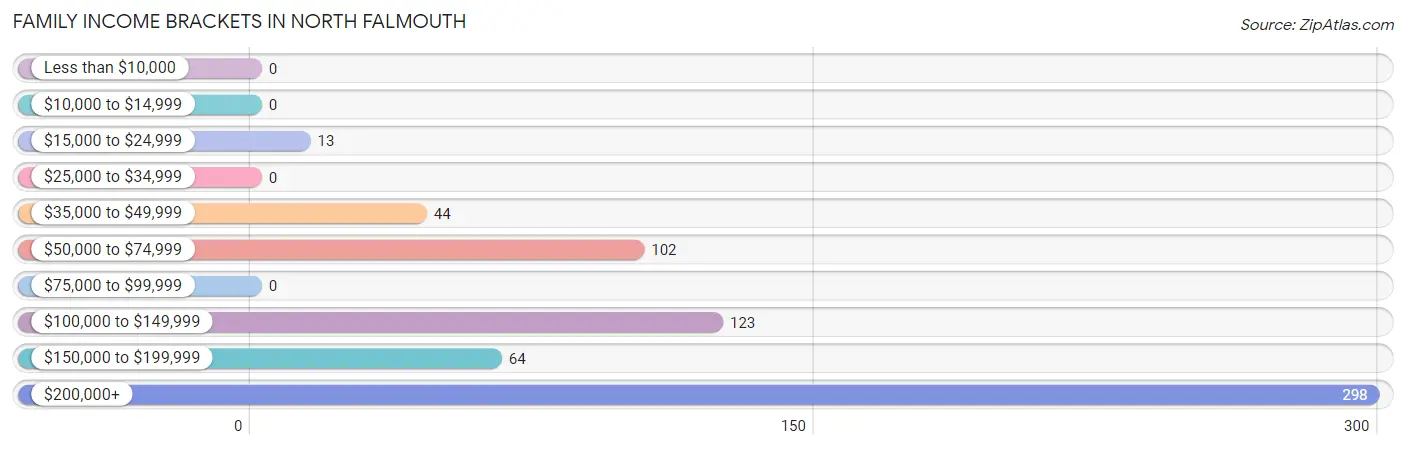
| Income Bracket | # Families | % Families |
| Less than $10,000 | 0 | 0.0% |
| $10,000 to $14,999 | 0 | 0.0% |
| $15,000 to $24,999 | 13 | 2.0% |
| $25,000 to $34,999 | 0 | 0.0% |
| $35,000 to $49,999 | 44 | 6.8% |
| $50,000 to $74,999 | 102 | 15.8% |
| $75,000 to $99,999 | 0 | 0.0% |
| $100,000 to $149,999 | 123 | 19.1% |
| $150,000 to $199,999 | 64 | 9.9% |
| $200,000+ | 298 | 46.3% |
Family Income by Famaliy Size in North Falmouth
4-person families (138 | 21.4%) account for the highest median family income in North Falmouth with $249,875 per family, while 2-person families (359 | 55.7%) have the highest median income of $64,100 per family member.
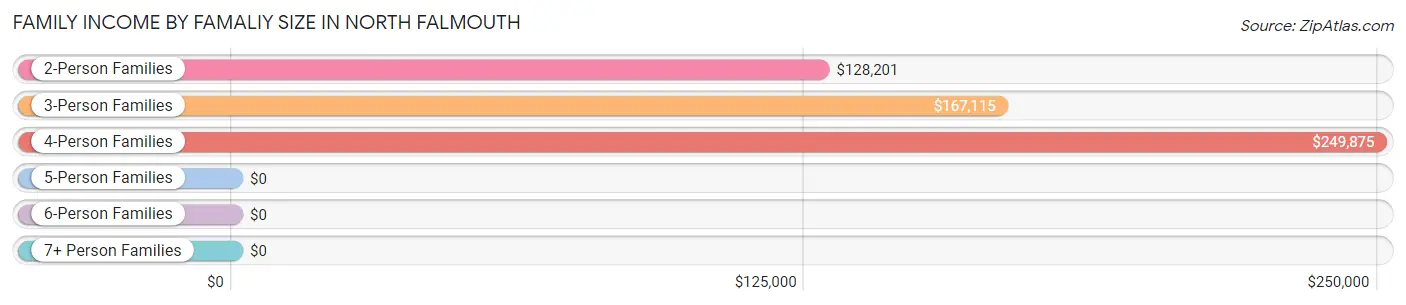
| Income Bracket | # Families | Median Income |
| 2-Person Families | 359 (55.7%) | $128,201 |
| 3-Person Families | 40 (6.2%) | $167,115 |
| 4-Person Families | 138 (21.4%) | $249,875 |
| 5-Person Families | 98 (15.2%) | $0 |
| 6-Person Families | 9 (1.4%) | $0 |
| 7+ Person Families | 0 (0.0%) | $0 |
| Total | 644 (100.0%) | $174,375 |
Family Income by Number of Earners in North Falmouth
The median family income in North Falmouth is $174,375, with families comprising 2 earners (281) having the highest median family income of $250,001, while families with no earners (144) have the lowest median family income of $57,778, accounting for 43.6% and 22.4% of families, respectively.
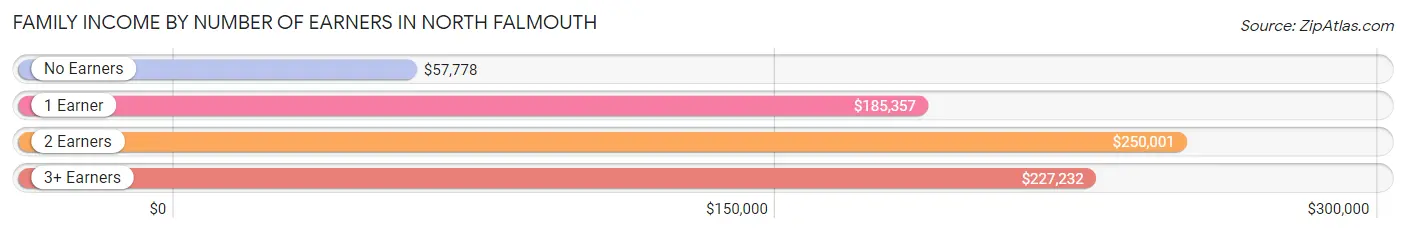
| Number of Earners | # Families | Median Income |
| No Earners | 144 (22.4%) | $57,778 |
| 1 Earner | 112 (17.4%) | $185,357 |
| 2 Earners | 281 (43.6%) | $250,001 |
| 3+ Earners | 107 (16.6%) | $227,232 |
| Total | 644 (100.0%) | $174,375 |
Household Income in North Falmouth
Household Income Brackets in North Falmouth
With 316 households falling in the category, the $200,000+ income range is the most frequent in North Falmouth, accounting for 34.5% of all households.
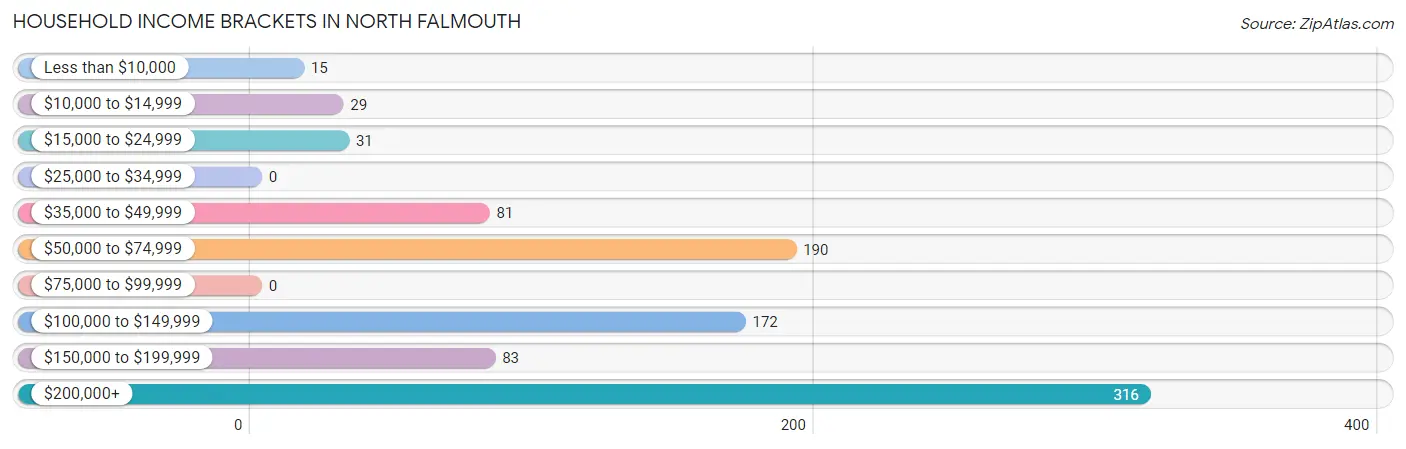
| Income Bracket | # Households | % Households |
| Less than $10,000 | 15 | 1.6% |
| $10,000 to $14,999 | 29 | 3.2% |
| $15,000 to $24,999 | 31 | 3.4% |
| $25,000 to $34,999 | 0 | 0.0% |
| $35,000 to $49,999 | 81 | 8.8% |
| $50,000 to $74,999 | 190 | 20.7% |
| $75,000 to $99,999 | 0 | 0.0% |
| $100,000 to $149,999 | 172 | 18.8% |
| $150,000 to $199,999 | 83 | 9.1% |
| $200,000+ | 316 | 34.5% |
Household Income by Householder Age in North Falmouth
The median household income in North Falmouth is $129,421, with the highest median household income of $250,001 found in the 25 to 44 years age bracket for the primary householder. A total of 190 households (20.7%) fall into this category.
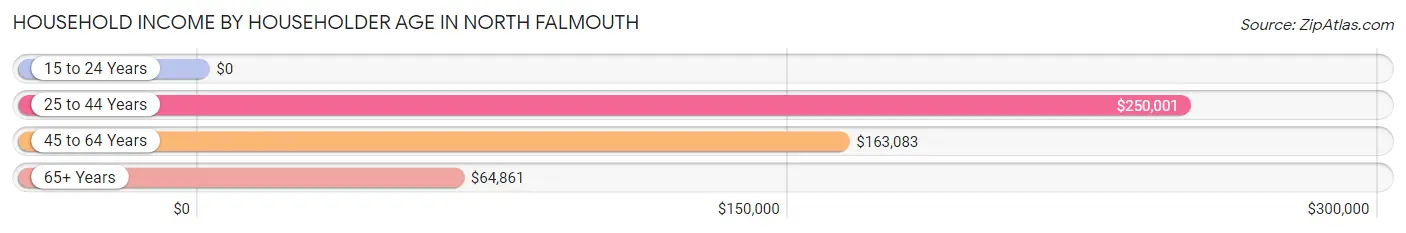
| Income Bracket | # Households | Median Income |
| 15 to 24 Years | 0 (0.0%) | $0 |
| 25 to 44 Years | 190 (20.7%) | $250,001 |
| 45 to 64 Years | 345 (37.6%) | $163,083 |
| 65+ Years | 382 (41.7%) | $64,861 |
| Total | 917 (100.0%) | $129,421 |
Poverty in North Falmouth
Income Below Poverty by Sex and Age in North Falmouth
With 2.5% poverty level for males and 3.8% for females among the residents of North Falmouth, 45 to 54 year old males and 75 year old and over females are the most vulnerable to poverty, with 13 males (17.8%) and 28 females (20.9%) in their respective age groups living below the poverty level.
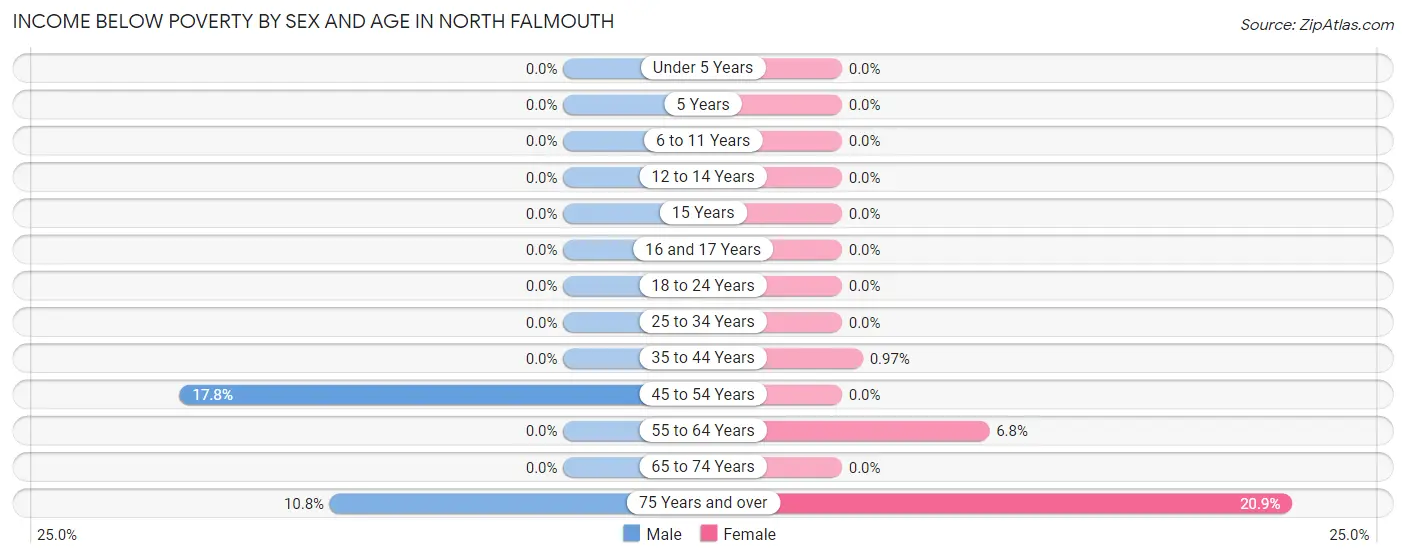
| Age Bracket | Male | Female |
| Under 5 Years | 0 (0.0%) | 0 (0.0%) |
| 5 Years | 0 (0.0%) | 0 (0.0%) |
| 6 to 11 Years | 0 (0.0%) | 0 (0.0%) |
| 12 to 14 Years | 0 (0.0%) | 0 (0.0%) |
| 15 Years | 0 (0.0%) | 0 (0.0%) |
| 16 and 17 Years | 0 (0.0%) | 0 (0.0%) |
| 18 to 24 Years | 0 (0.0%) | 0 (0.0%) |
| 25 to 34 Years | 0 (0.0%) | 0 (0.0%) |
| 35 to 44 Years | 0 (0.0%) | 1 (1.0%) |
| 45 to 54 Years | 13 (17.8%) | 0 (0.0%) |
| 55 to 64 Years | 0 (0.0%) | 16 (6.8%) |
| 65 to 74 Years | 0 (0.0%) | 0 (0.0%) |
| 75 Years and over | 13 (10.8%) | 28 (20.9%) |
| Total | 26 (2.5%) | 45 (3.8%) |
Income Above Poverty by Sex and Age in North Falmouth
According to the poverty statistics in North Falmouth, males aged under 5 years and females aged under 5 years are the age groups that are most secure financially, with 100.0% of males and 100.0% of females in these age groups living above the poverty line.
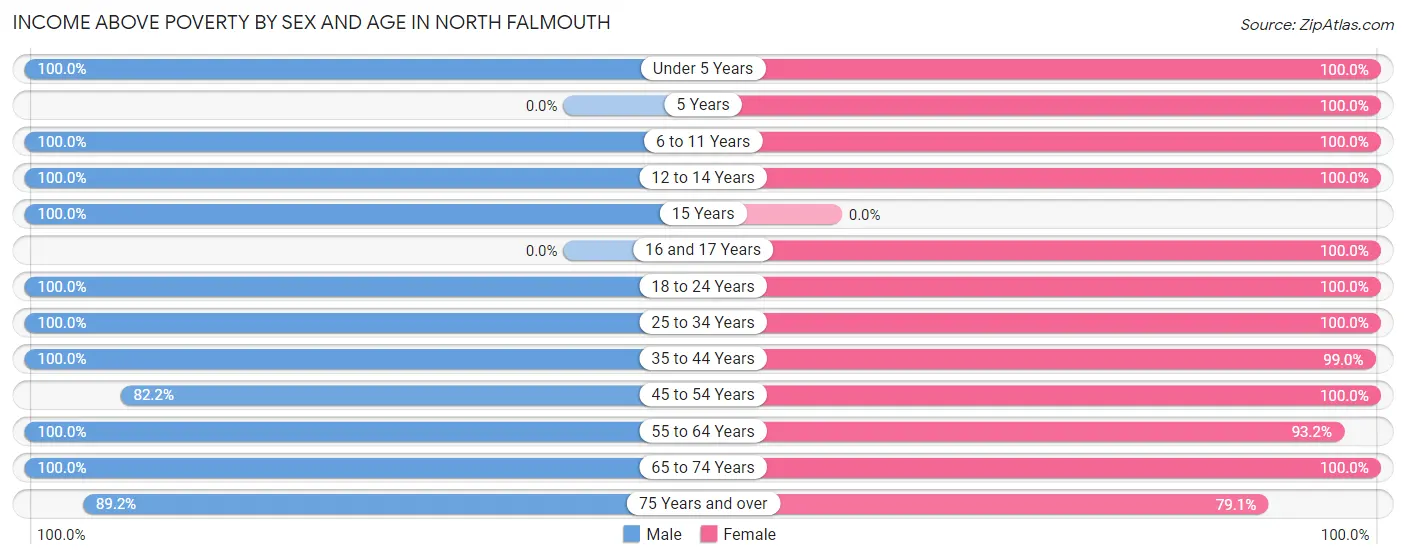
| Age Bracket | Male | Female |
| Under 5 Years | 126 (100.0%) | 81 (100.0%) |
| 5 Years | 0 (0.0%) | 113 (100.0%) |
| 6 to 11 Years | 36 (100.0%) | 49 (100.0%) |
| 12 to 14 Years | 12 (100.0%) | 8 (100.0%) |
| 15 Years | 29 (100.0%) | 0 (0.0%) |
| 16 and 17 Years | 0 (0.0%) | 16 (100.0%) |
| 18 to 24 Years | 88 (100.0%) | 68 (100.0%) |
| 25 to 34 Years | 148 (100.0%) | 95 (100.0%) |
| 35 to 44 Years | 78 (100.0%) | 102 (99.0%) |
| 45 to 54 Years | 60 (82.2%) | 101 (100.0%) |
| 55 to 64 Years | 175 (100.0%) | 218 (93.2%) |
| 65 to 74 Years | 164 (100.0%) | 195 (100.0%) |
| 75 Years and over | 107 (89.2%) | 106 (79.1%) |
| Total | 1,023 (97.5%) | 1,152 (96.2%) |
Income Below Poverty Among Married-Couple Families in North Falmouth
The poverty statistics for married-couple families in North Falmouth show that 2.2% or 13 of the total 602 families live below the poverty line. Families with no children have the highest poverty rate of 3.2%, comprising of 13 families. On the other hand, families with 1 or 2 children have the lowest poverty rate of 0.0%, which includes 0 families.
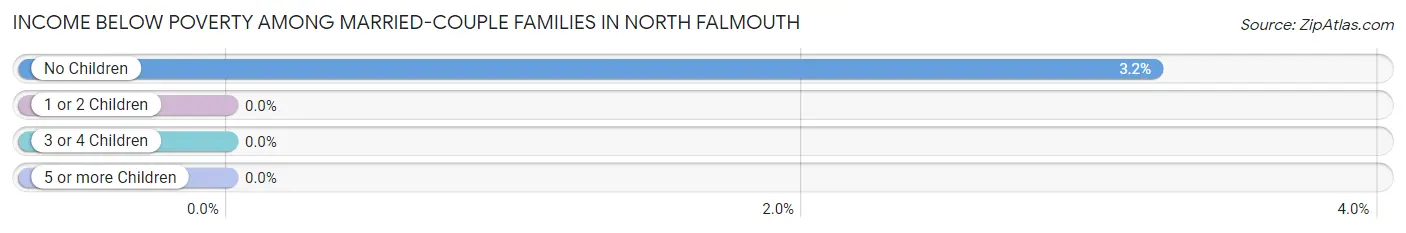
| Children | Above Poverty | Below Poverty |
| No Children | 391 (96.8%) | 13 (3.2%) |
| 1 or 2 Children | 104 (100.0%) | 0 (0.0%) |
| 3 or 4 Children | 94 (100.0%) | 0 (0.0%) |
| 5 or more Children | 0 (0.0%) | 0 (0.0%) |
| Total | 589 (97.8%) | 13 (2.2%) |
Income Below Poverty Among Single-Parent Households in North Falmouth
| Children | Single Father | Single Mother |
| No Children | 0 (0.0%) | 0 (0.0%) |
| 1 or 2 Children | 0 (0.0%) | 0 (0.0%) |
| 3 or 4 Children | 0 (0.0%) | 0 (0.0%) |
| 5 or more Children | 0 (0.0%) | 0 (0.0%) |
| Total | 0 (0.0%) | 0 (0.0%) |
Income Below Poverty Among Married-Couple vs Single-Parent Households in North Falmouth
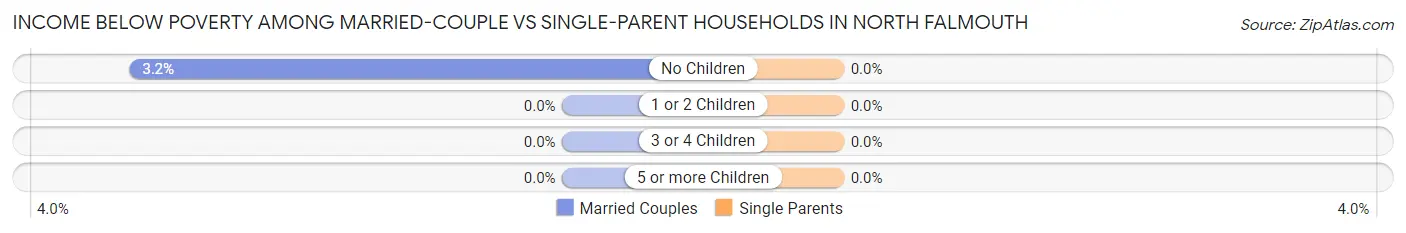
| Children | Married-Couple Families | Single-Parent Households |
| No Children | 13 (3.2%) | 0 (0.0%) |
| 1 or 2 Children | 0 (0.0%) | 0 (0.0%) |
| 3 or 4 Children | 0 (0.0%) | 0 (0.0%) |
| 5 or more Children | 0 (0.0%) | 0 (0.0%) |
| Total | 13 (2.2%) | 0 (0.0%) |
Race in North Falmouth
The most populous races in North Falmouth are White / Caucasian (2,220 | 95.8%), Asian (43 | 1.9%), and Black / African American (36 | 1.5%).
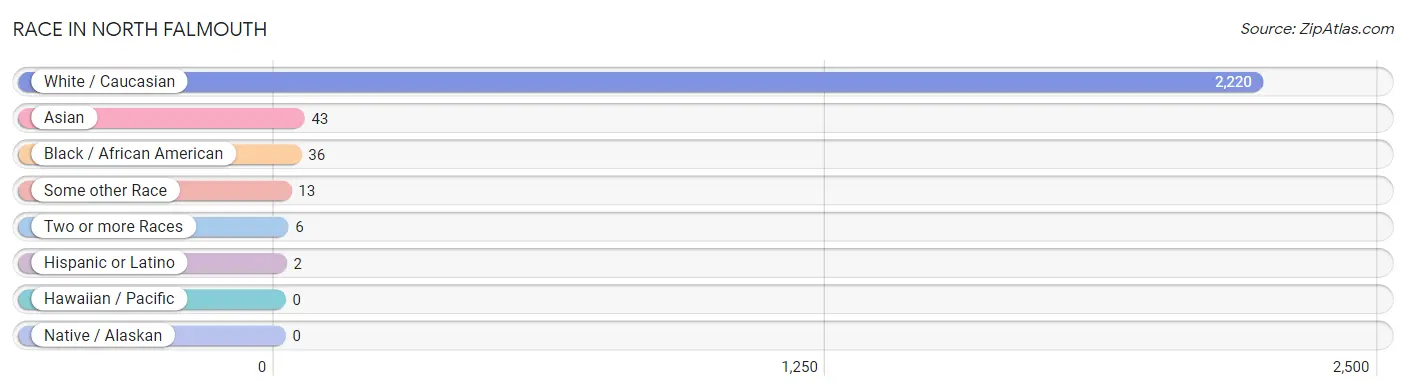
| Race | # Population | % Population |
| Asian | 43 | 1.9% |
| Black / African American | 36 | 1.5% |
| Hawaiian / Pacific | 0 | 0.0% |
| Hispanic or Latino | 2 | 0.1% |
| Native / Alaskan | 0 | 0.0% |
| White / Caucasian | 2,220 | 95.8% |
| Two or more Races | 6 | 0.3% |
| Some other Race | 13 | 0.6% |
| Total | 2,318 | 100.0% |
Ancestry in North Falmouth
The most populous ancestries reported in North Falmouth are Irish (475 | 20.5%), English (408 | 17.6%), Italian (224 | 9.7%), German (158 | 6.8%), and American (136 | 5.9%), together accounting for 60.4% of all North Falmouth residents.
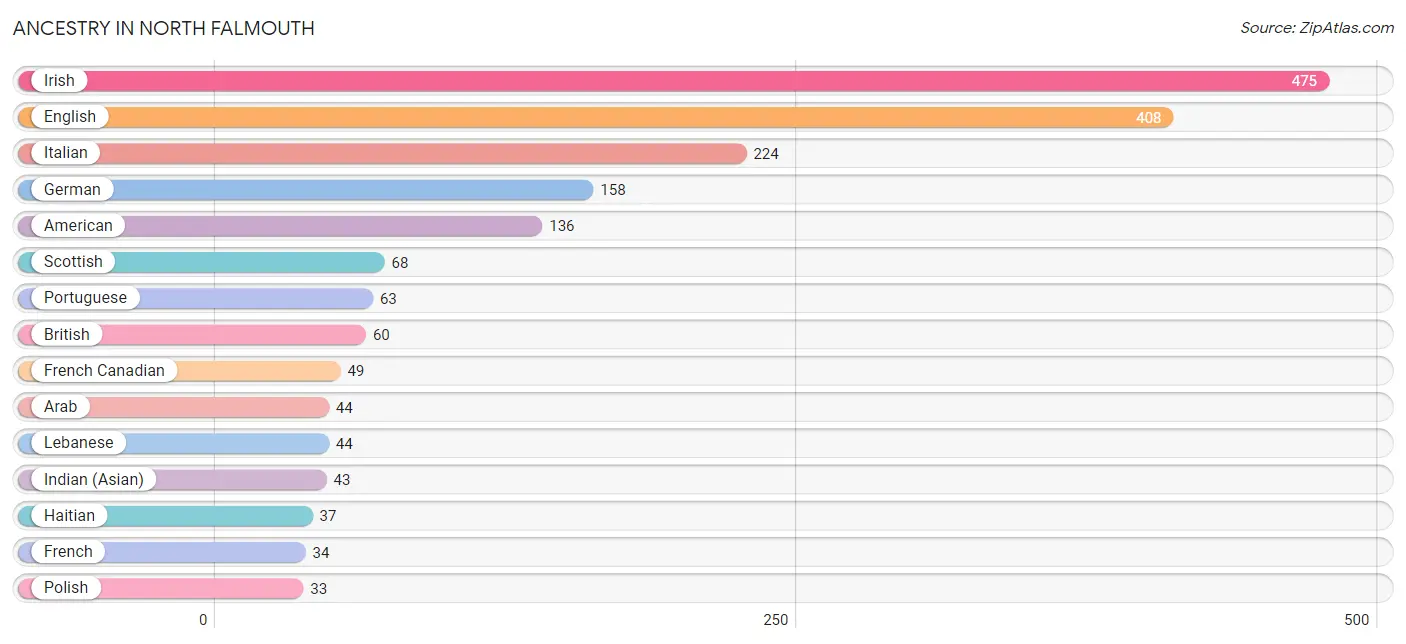
| Ancestry | # Population | % Population |
| American | 136 | 5.9% |
| Arab | 44 | 1.9% |
| British | 60 | 2.6% |
| Canadian | 13 | 0.6% |
| Cape Verdean | 13 | 0.6% |
| Eastern European | 16 | 0.7% |
| English | 408 | 17.6% |
| French | 34 | 1.5% |
| French Canadian | 49 | 2.1% |
| German | 158 | 6.8% |
| Haitian | 37 | 1.6% |
| Indian (Asian) | 43 | 1.9% |
| Irish | 475 | 20.5% |
| Italian | 224 | 9.7% |
| Lebanese | 44 | 1.9% |
| Mexican | 1 | 0.0% |
| Northern European | 16 | 0.7% |
| Polish | 33 | 1.4% |
| Portuguese | 63 | 2.7% |
| Puerto Rican | 1 | 0.0% |
| Scotch-Irish | 32 | 1.4% |
| Scottish | 68 | 2.9% |
| Subsaharan African | 13 | 0.6% |
| Swedish | 14 | 0.6% | View All 24 Rows |
Immigrants in North Falmouth
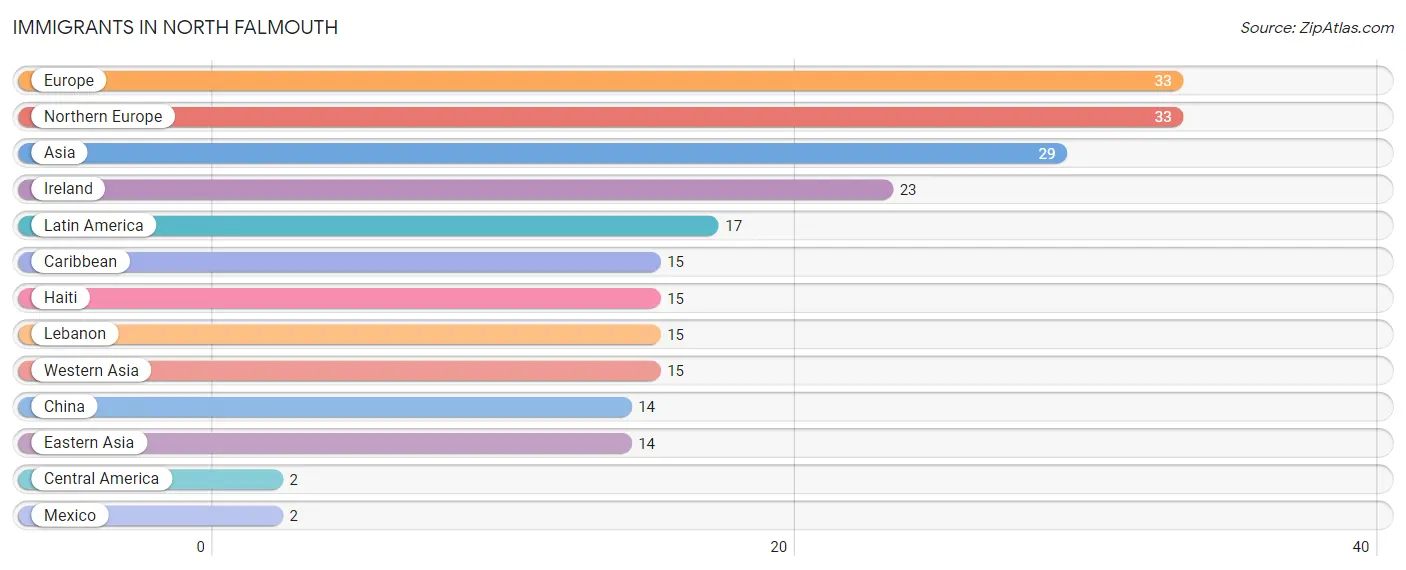
The most numerous immigrant groups reported in North Falmouth came from Europe (33 | 1.4%), Northern Europe (33 | 1.4%), Asia (29 | 1.3%), Ireland (23 | 1.0%), and Latin America (17 | 0.7%), together accounting for 5.8% of all North Falmouth residents.
| Immigration Origin | # Population | % Population |
| Asia | 29 | 1.3% |
| Caribbean | 15 | 0.6% |
| Central America | 2 | 0.1% |
| China | 14 | 0.6% |
| Eastern Asia | 14 | 0.6% |
| Europe | 33 | 1.4% |
| Haiti | 15 | 0.6% |
| Ireland | 23 | 1.0% |
| Latin America | 17 | 0.7% |
| Lebanon | 15 | 0.6% |
| Mexico | 2 | 0.1% |
| Northern Europe | 33 | 1.4% |
| Western Asia | 15 | 0.6% | View All 13 Rows |
Sex and Age in North Falmouth
Sex and Age in North Falmouth
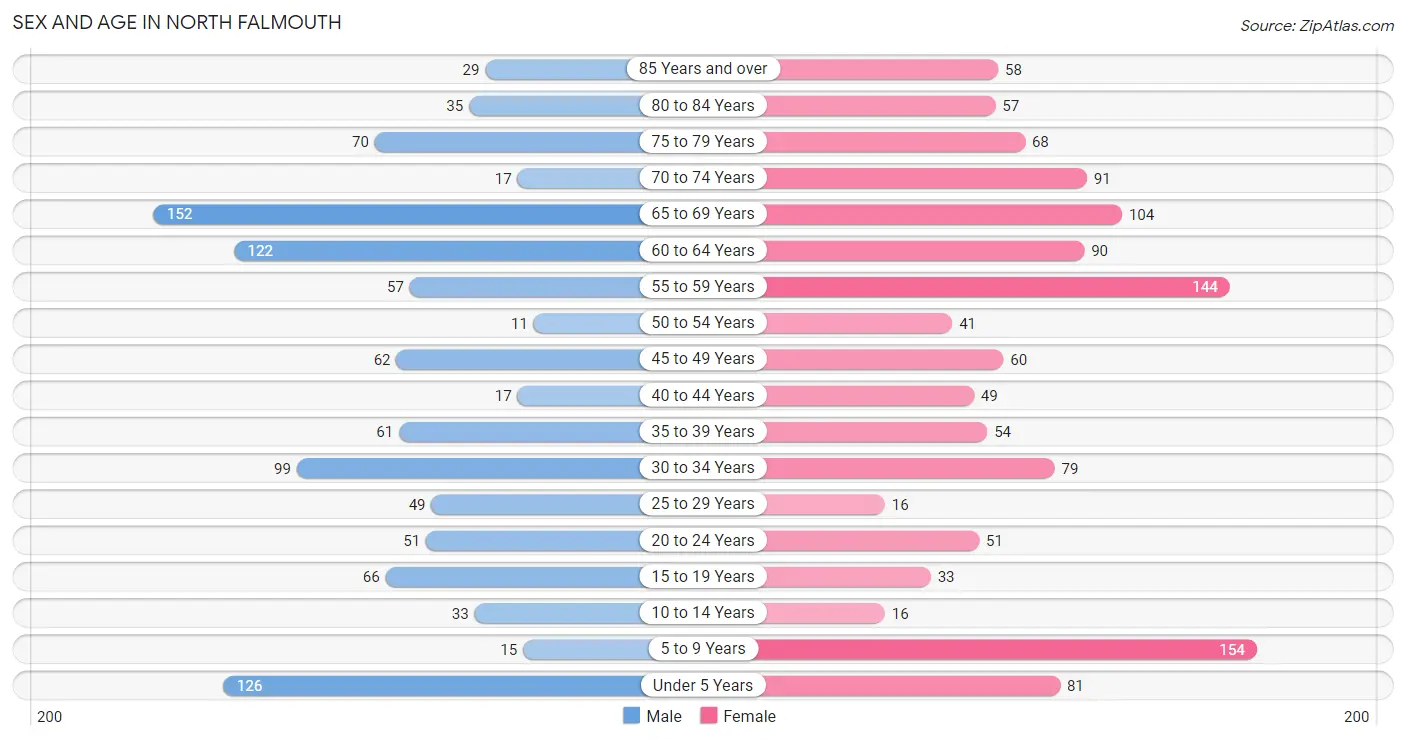
The most populous age groups in North Falmouth are 65 to 69 Years (152 | 14.2%) for men and 5 to 9 Years (154 | 12.4%) for women.
| Age Bracket | Male | Female |
| Under 5 Years | 126 (11.7%) | 81 (6.5%) |
| 5 to 9 Years | 15 (1.4%) | 154 (12.4%) |
| 10 to 14 Years | 33 (3.1%) | 16 (1.3%) |
| 15 to 19 Years | 66 (6.2%) | 33 (2.6%) |
| 20 to 24 Years | 51 (4.8%) | 51 (4.1%) |
| 25 to 29 Years | 49 (4.6%) | 16 (1.3%) |
| 30 to 34 Years | 99 (9.2%) | 79 (6.3%) |
| 35 to 39 Years | 61 (5.7%) | 54 (4.3%) |
| 40 to 44 Years | 17 (1.6%) | 49 (3.9%) |
| 45 to 49 Years | 62 (5.8%) | 60 (4.8%) |
| 50 to 54 Years | 11 (1.0%) | 41 (3.3%) |
| 55 to 59 Years | 57 (5.3%) | 144 (11.6%) |
| 60 to 64 Years | 122 (11.4%) | 90 (7.2%) |
| 65 to 69 Years | 152 (14.2%) | 104 (8.4%) |
| 70 to 74 Years | 17 (1.6%) | 91 (7.3%) |
| 75 to 79 Years | 70 (6.5%) | 68 (5.5%) |
| 80 to 84 Years | 35 (3.3%) | 57 (4.6%) |
| 85 Years and over | 29 (2.7%) | 58 (4.6%) |
| Total | 1,072 (100.0%) | 1,246 (100.0%) |
Families and Households in North Falmouth
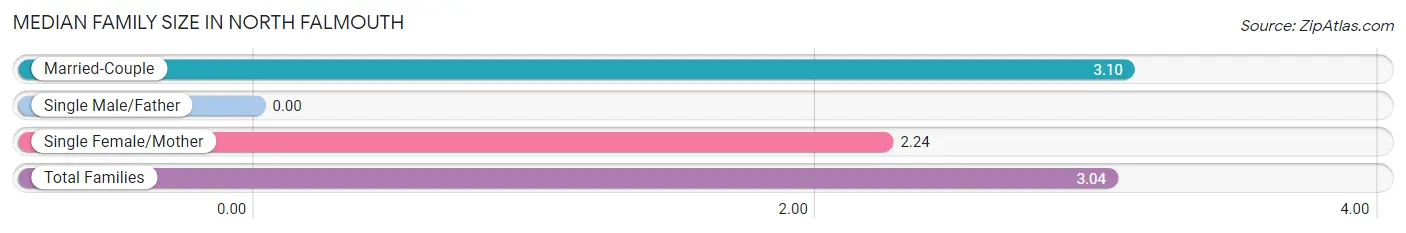
Median Family Size in North Falmouth
| Family Type | # Families | Family Size |
| Married-Couple | 602 (93.5%) | 3.10 |
| Single Male/Father | 0 (0.0%) | - |
| Single Female/Mother | 42 (6.5%) | 2.24 |
| Total Families | 644 (100.0%) | 3.04 |
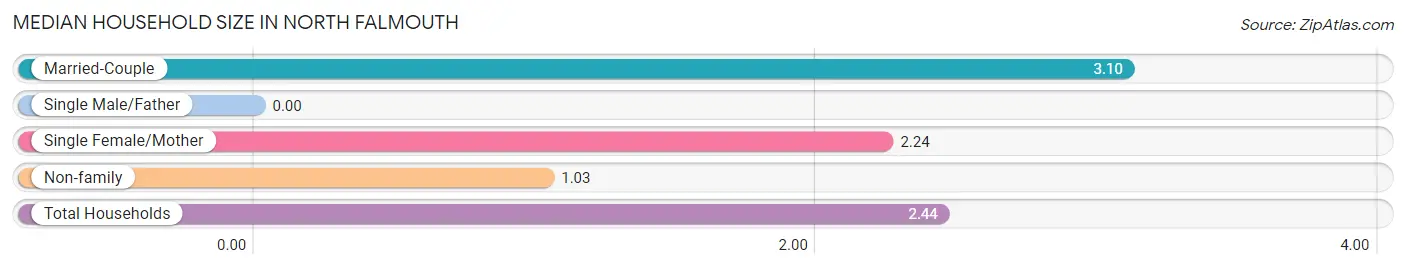
Median Household Size in North Falmouth
| Household Type | # Households | Household Size |
| Married-Couple | 602 (65.6%) | 3.10 |
| Single Male/Father | 0 (0.0%) | - |
| Single Female/Mother | 42 (4.6%) | 2.24 |
| Non-family | 273 (29.8%) | 1.03 |
| Total Households | 917 (100.0%) | 2.44 |
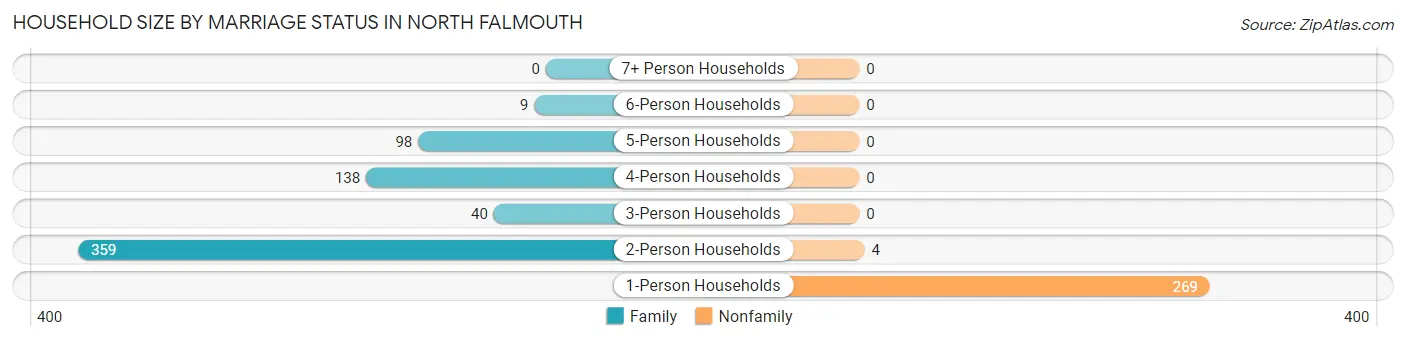
Household Size by Marriage Status in North Falmouth
Out of a total of 917 households in North Falmouth, 644 (70.2%) are family households, while 273 (29.8%) are nonfamily households. The most numerous type of family households are 2-person households, comprising 359, and the most common type of nonfamily households are 1-person households, comprising 269.
| Household Size | Family Households | Nonfamily Households |
| 1-Person Households | - | 269 (29.3%) |
| 2-Person Households | 359 (39.2%) | 4 (0.4%) |
| 3-Person Households | 40 (4.4%) | 0 (0.0%) |
| 4-Person Households | 138 (15.0%) | 0 (0.0%) |
| 5-Person Households | 98 (10.7%) | 0 (0.0%) |
| 6-Person Households | 9 (1.0%) | 0 (0.0%) |
| 7+ Person Households | 0 (0.0%) | 0 (0.0%) |
| Total | 644 (70.2%) | 273 (29.8%) |
Female Fertility in North Falmouth
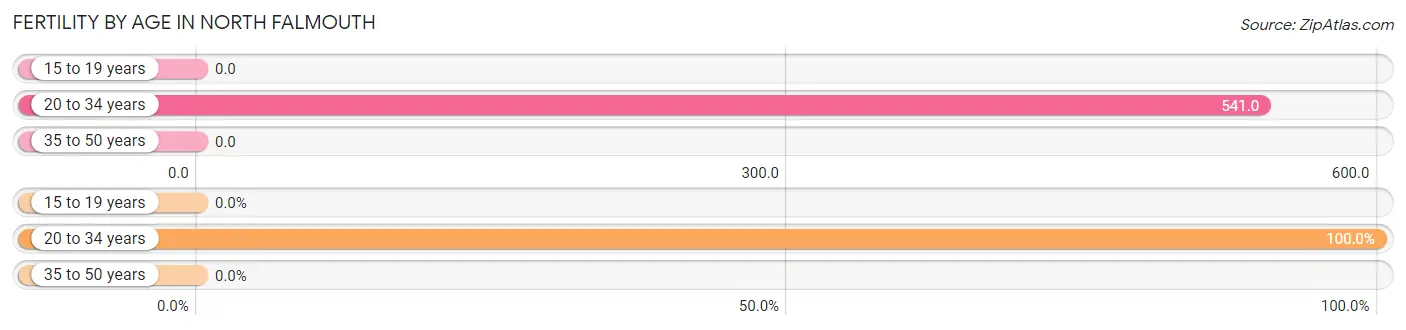
Fertility by Age in North Falmouth
Average fertility rate in North Falmouth is 231.0 births per 1,000 women. Women in the age bracket of 20 to 34 years have the highest fertility rate with 541.0 births per 1,000 women. Women in the age bracket of 20 to 34 years acount for 100.0% of all women with births.
| Age Bracket | Women with Births | Births / 1,000 Women |
| 15 to 19 years | 0 (0.0%) | 0.0 |
| 20 to 34 years | 79 (100.0%) | 541.0 |
| 35 to 50 years | 0 (0.0%) | 0.0 |
| Total | 79 (100.0%) | 231.0 |
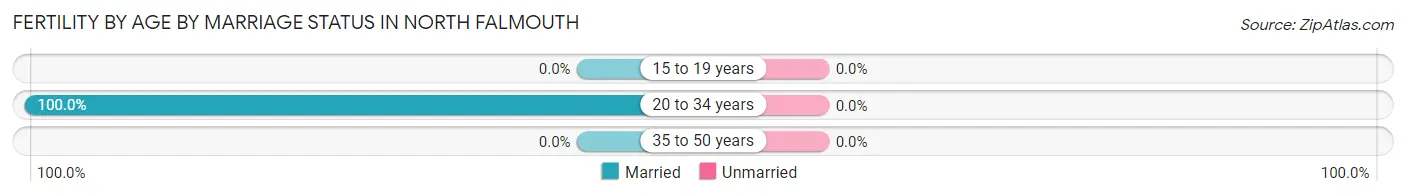
Fertility by Age by Marriage Status in North Falmouth
| Age Bracket | Married | Unmarried |
| 15 to 19 years | 0 (0.0%) | 0 (0.0%) |
| 20 to 34 years | 79 (100.0%) | 0 (0.0%) |
| 35 to 50 years | 0 (0.0%) | 0 (0.0%) |
| Total | 79 (100.0%) | 0 (0.0%) |
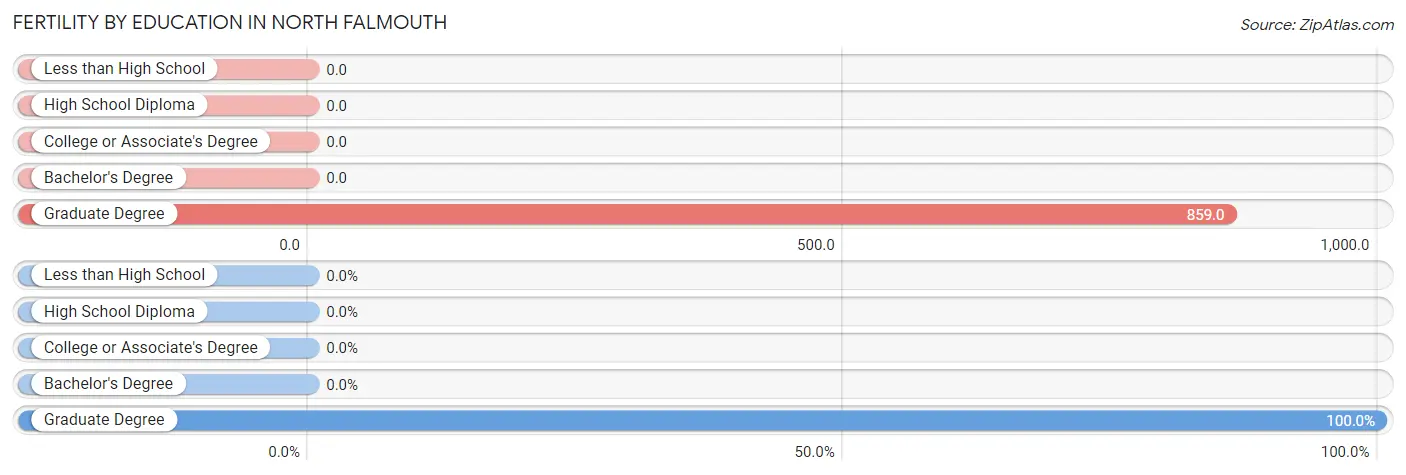
Fertility by Education in North Falmouth
| Educational Attainment | Women with Births | Births / 1,000 Women |
| Less than High School | 0 (0.0%) | 0.0 |
| High School Diploma | 0 (0.0%) | 0.0 |
| College or Associate's Degree | 0 (0.0%) | 0.0 |
| Bachelor's Degree | 0 (0.0%) | 0.0 |
| Graduate Degree | 79 (100.0%) | 859.0 |
| Total | 79 (100.0%) | 231.0 |
Fertility by Education by Marriage Status in North Falmouth
| Educational Attainment | Married | Unmarried |
| Less than High School | 0 (0.0%) | 0 (0.0%) |
| High School Diploma | 0 (0.0%) | 0 (0.0%) |
| College or Associate's Degree | 0 (0.0%) | 0 (0.0%) |
| Bachelor's Degree | 0 (0.0%) | 0 (0.0%) |
| Graduate Degree | 79 (100.0%) | 0 (0.0%) |
| Total | 79 (100.0%) | 0 (0.0%) |
Employment Characteristics in North Falmouth
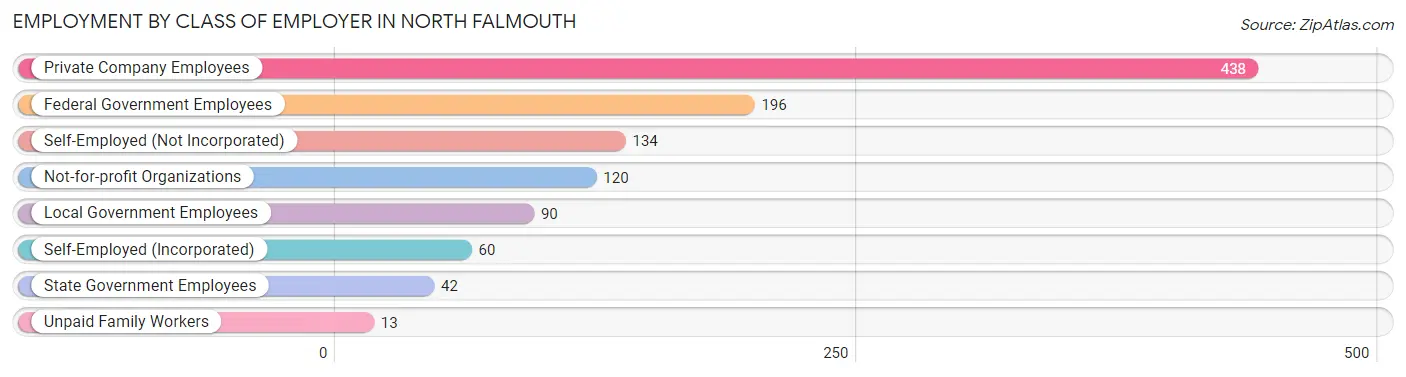
Employment by Class of Employer in North Falmouth
Among the 1,093 employed individuals in North Falmouth, private company employees (438 | 40.1%), federal government employees (196 | 17.9%), and self-employed (not incorporated) (134 | 12.3%) make up the most common classes of employment.
| Employer Class | # Employees | % Employees |
| Private Company Employees | 438 | 40.1% |
| Self-Employed (Incorporated) | 60 | 5.5% |
| Self-Employed (Not Incorporated) | 134 | 12.3% |
| Not-for-profit Organizations | 120 | 11.0% |
| Local Government Employees | 90 | 8.2% |
| State Government Employees | 42 | 3.8% |
| Federal Government Employees | 196 | 17.9% |
| Unpaid Family Workers | 13 | 1.2% |
| Total | 1,093 | 100.0% |
Employment Status by Age in North Falmouth
According to the labor force statistics for North Falmouth, out of the total population over 16 years of age (1,864), 62.5% or 1,165 individuals are in the labor force, with 5.6% or 65 of them unemployed. The age group with the highest labor force participation rate is 30 to 34 years, with 100.0% or 178 individuals in the labor force. Within the labor force, the 20 to 24 years age range has the highest percentage of unemployed individuals, with 27.9% or 24 of them being unemployed.
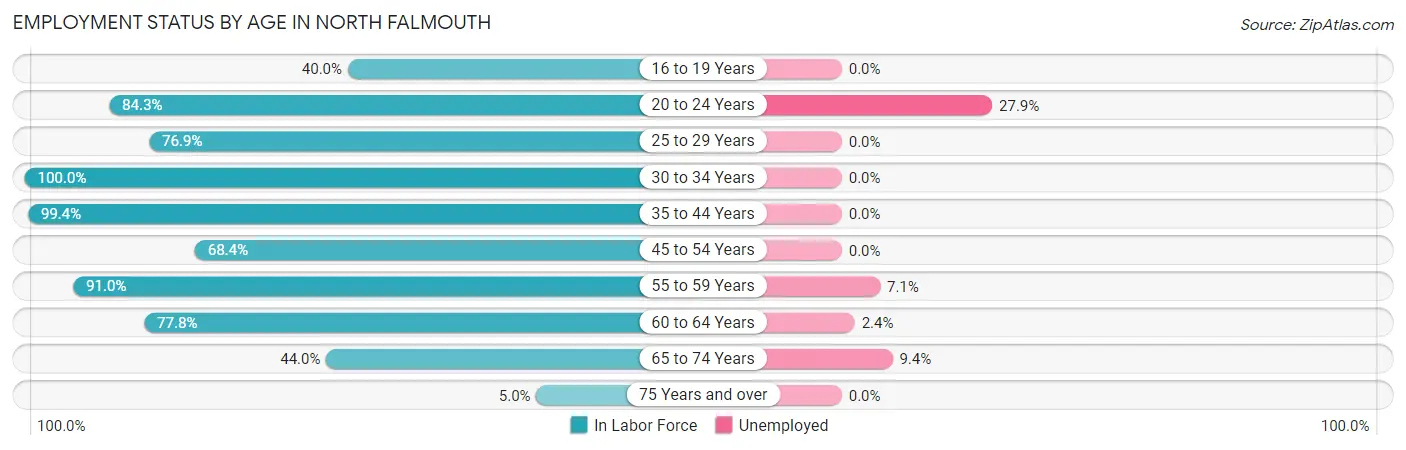
| Age Bracket | In Labor Force | Unemployed |
| 16 to 19 Years | 28 (40.0%) | 0 (0.0%) |
| 20 to 24 Years | 86 (84.3%) | 24 (27.9%) |
| 25 to 29 Years | 50 (76.9%) | 0 (0.0%) |
| 30 to 34 Years | 178 (100.0%) | 0 (0.0%) |
| 35 to 44 Years | 180 (99.4%) | 0 (0.0%) |
| 45 to 54 Years | 119 (68.4%) | 0 (0.0%) |
| 55 to 59 Years | 183 (91.0%) | 13 (7.1%) |
| 60 to 64 Years | 165 (77.8%) | 4 (2.4%) |
| 65 to 74 Years | 160 (44.0%) | 15 (9.4%) |
| 75 Years and over | 16 (5.0%) | 0 (0.0%) |
| Total | 1,165 (62.5%) | 65 (5.6%) |
Employment Status by Educational Attainment in North Falmouth
According to labor force statistics for North Falmouth, 86.5% of individuals (875) out of the total population between 25 and 64 years of age (1,011) are in the labor force, with 2.3% or 20 of them being unemployed. The group with the highest labor force participation rate are those with the educational attainment of bachelor's degree or higher, with 95.9% or 648 individuals in the labor force. Within the labor force, individuals with college / associate degree education have the highest percentage of unemployment, with 6.7% or 12 of them being unemployed.
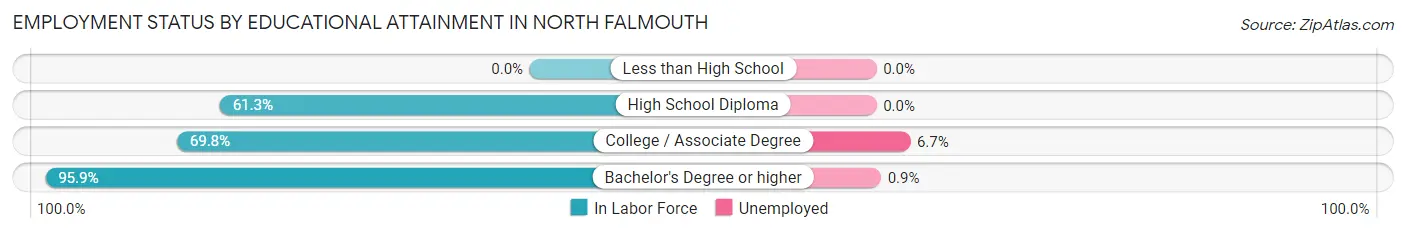
| Educational Attainment | In Labor Force | Unemployed |
| Less than High School | 0 (0.0%) | 0 (0.0%) |
| High School Diploma | 49 (61.3%) | 0 (0.0%) |
| College / Associate Degree | 178 (69.8%) | 17 (6.7%) |
| Bachelor's Degree or higher | 648 (95.9%) | 6 (0.9%) |
| Total | 875 (86.5%) | 23 (2.3%) |
Employment Occupations by Sex in North Falmouth
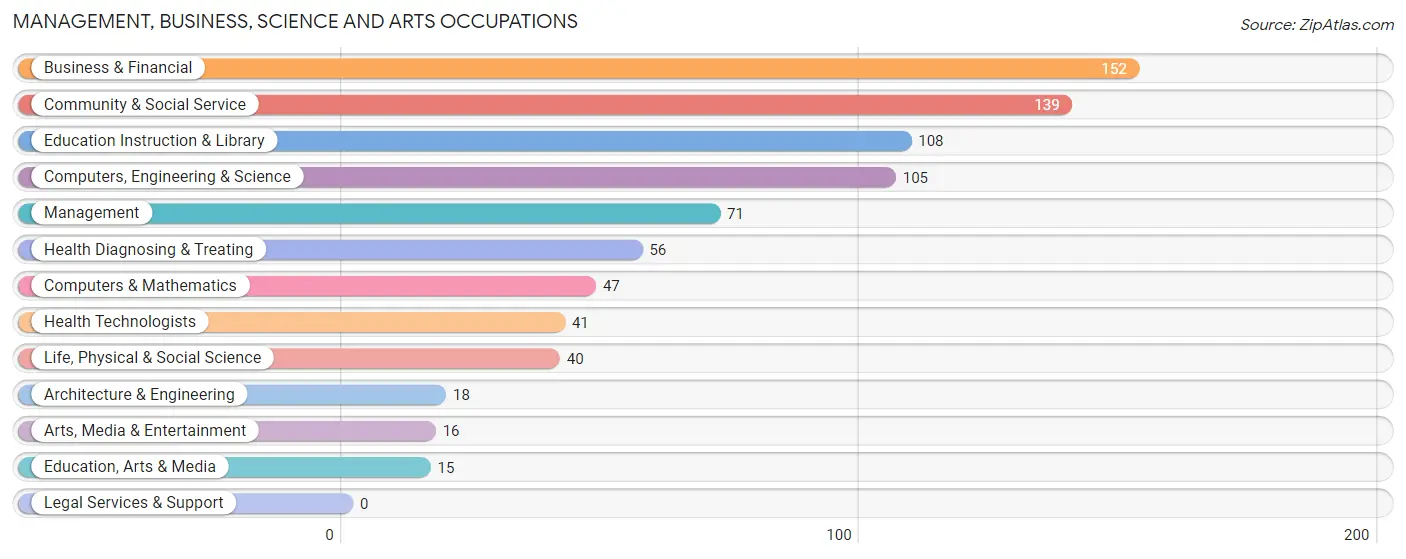
Management, Business, Science and Arts Occupations
The most common Management, Business, Science and Arts occupations in North Falmouth are Business & Financial (152 | 16.3%), Community & Social Service (139 | 14.9%), Education Instruction & Library (108 | 11.6%), Computers, Engineering & Science (105 | 11.3%), and Management (71 | 7.6%).
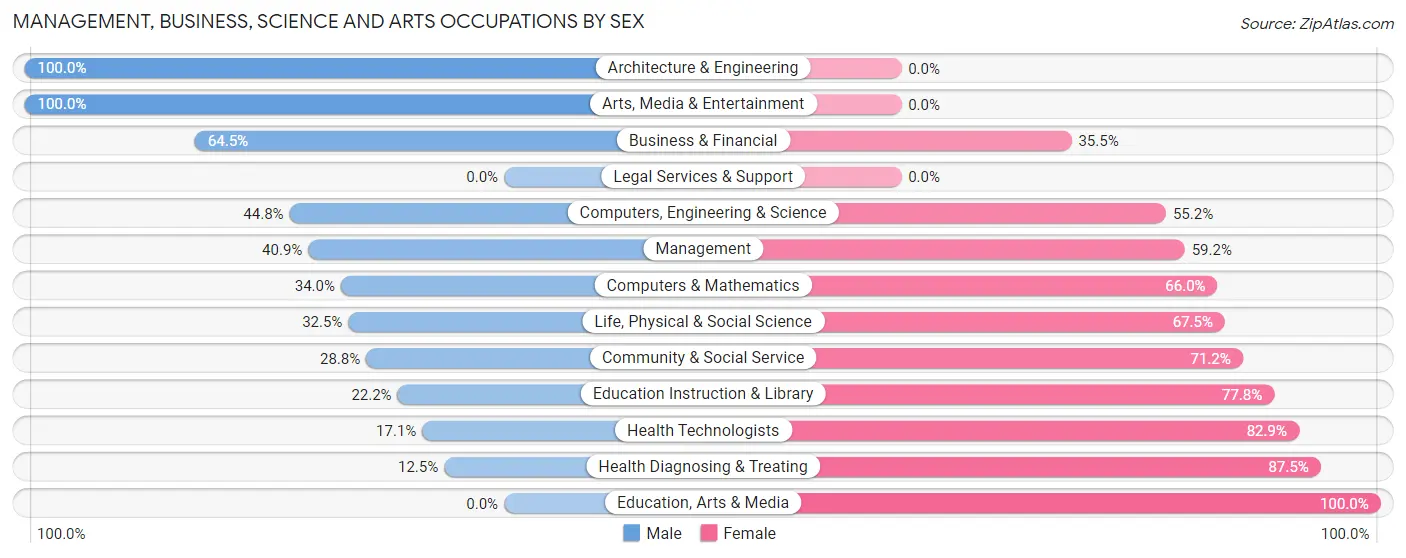
Management, Business, Science and Arts Occupations by Sex
Within the Management, Business, Science and Arts occupations in North Falmouth, the most male-oriented occupations are Architecture & Engineering (100.0%), Arts, Media & Entertainment (100.0%), and Business & Financial (64.5%), while the most female-oriented occupations are Education, Arts & Media (100.0%), Health Diagnosing & Treating (87.5%), and Health Technologists (82.9%).
| Occupation | Male | Female |
| Management | 29 (40.8%) | 42 (59.2%) |
| Business & Financial | 98 (64.5%) | 54 (35.5%) |
| Computers, Engineering & Science | 47 (44.8%) | 58 (55.2%) |
| Computers & Mathematics | 16 (34.0%) | 31 (66.0%) |
| Architecture & Engineering | 18 (100.0%) | 0 (0.0%) |
| Life, Physical & Social Science | 13 (32.5%) | 27 (67.5%) |
| Community & Social Service | 40 (28.8%) | 99 (71.2%) |
| Education, Arts & Media | 0 (0.0%) | 15 (100.0%) |
| Legal Services & Support | 0 (0.0%) | 0 (0.0%) |
| Education Instruction & Library | 24 (22.2%) | 84 (77.8%) |
| Arts, Media & Entertainment | 16 (100.0%) | 0 (0.0%) |
| Health Diagnosing & Treating | 7 (12.5%) | 49 (87.5%) |
| Health Technologists | 7 (17.1%) | 34 (82.9%) |
| Total (Category) | 221 (42.3%) | 302 (57.7%) |
| Total (Overall) | 473 (50.7%) | 459 (49.2%) |
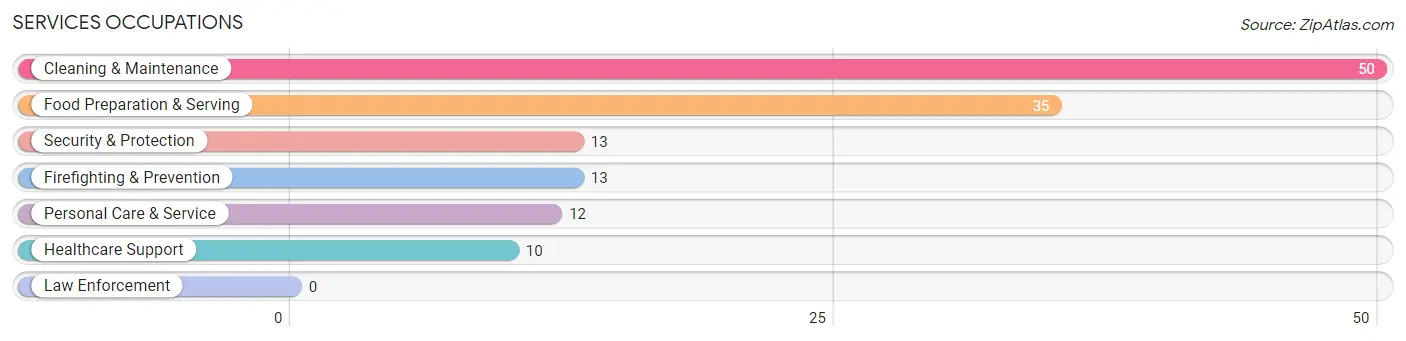
Services Occupations
The most common Services occupations in North Falmouth are Cleaning & Maintenance (50 | 5.4%), Food Preparation & Serving (35 | 3.8%), Security & Protection (13 | 1.4%), Firefighting & Prevention (13 | 1.4%), and Personal Care & Service (12 | 1.3%).
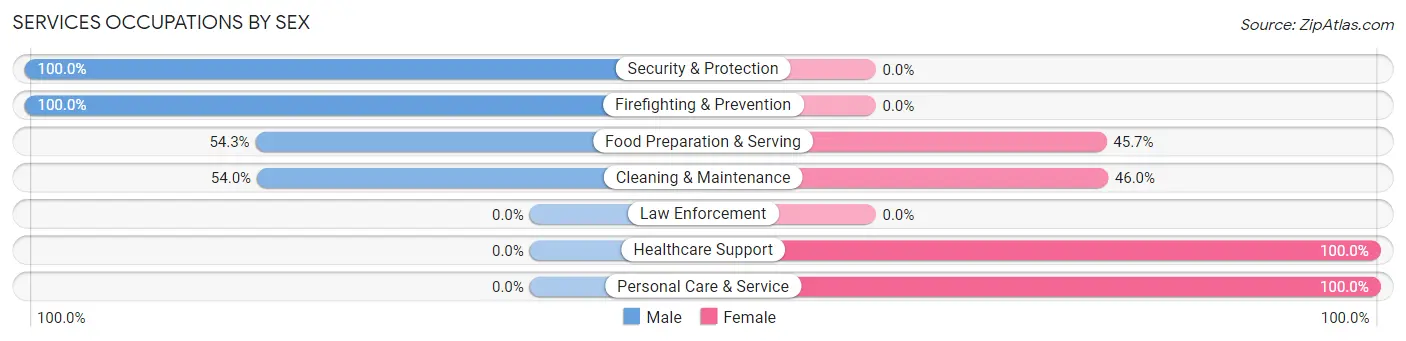
Services Occupations by Sex
Within the Services occupations in North Falmouth, the most male-oriented occupations are Security & Protection (100.0%), Firefighting & Prevention (100.0%), and Food Preparation & Serving (54.3%), while the most female-oriented occupations are Healthcare Support (100.0%), Personal Care & Service (100.0%), and Cleaning & Maintenance (46.0%).
| Occupation | Male | Female |
| Healthcare Support | 0 (0.0%) | 10 (100.0%) |
| Security & Protection | 13 (100.0%) | 0 (0.0%) |
| Firefighting & Prevention | 13 (100.0%) | 0 (0.0%) |
| Law Enforcement | 0 (0.0%) | 0 (0.0%) |
| Food Preparation & Serving | 19 (54.3%) | 16 (45.7%) |
| Cleaning & Maintenance | 27 (54.0%) | 23 (46.0%) |
| Personal Care & Service | 0 (0.0%) | 12 (100.0%) |
| Total (Category) | 59 (49.2%) | 61 (50.8%) |
| Total (Overall) | 473 (50.7%) | 459 (49.2%) |
Sales and Office Occupations
The most common Sales and Office occupations in North Falmouth are Sales & Related (146 | 15.7%), and Office & Administration (42 | 4.5%).
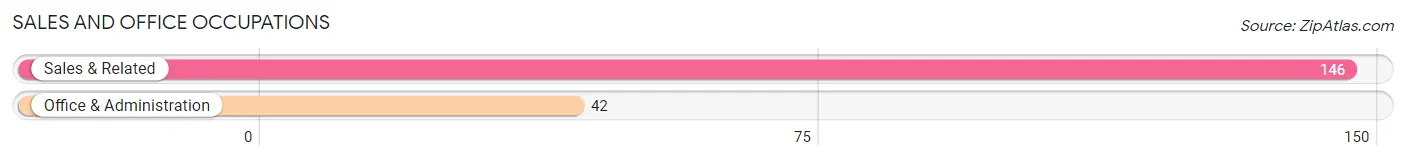
Sales and Office Occupations by Sex

| Occupation | Male | Female |
| Sales & Related | 89 (61.0%) | 57 (39.0%) |
| Office & Administration | 9 (21.4%) | 33 (78.6%) |
| Total (Category) | 98 (52.1%) | 90 (47.9%) |
| Total (Overall) | 473 (50.7%) | 459 (49.2%) |
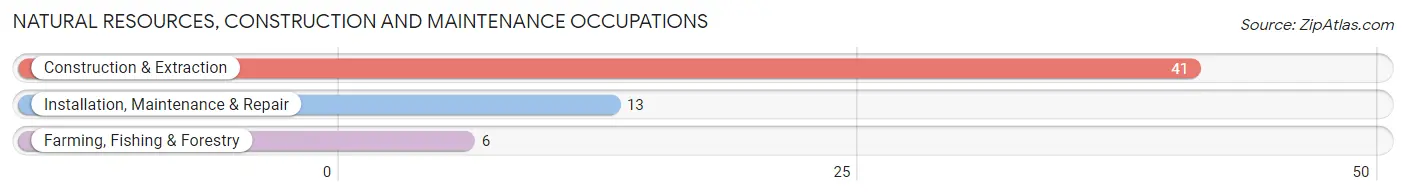
Natural Resources, Construction and Maintenance Occupations
The most common Natural Resources, Construction and Maintenance occupations in North Falmouth are Construction & Extraction (41 | 4.4%), Installation, Maintenance & Repair (13 | 1.4%), and Farming, Fishing & Forestry (6 | 0.6%).
Natural Resources, Construction and Maintenance Occupations by Sex
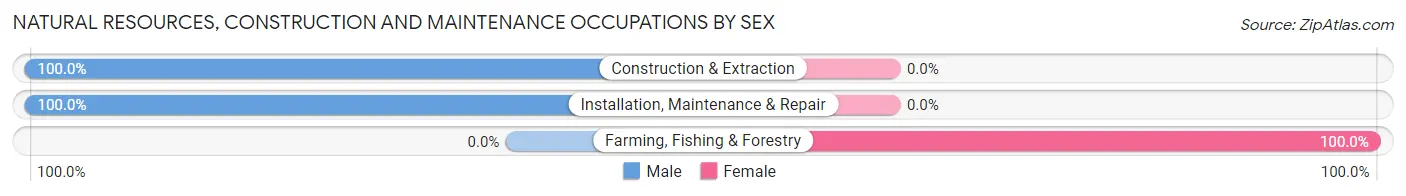
| Occupation | Male | Female |
| Farming, Fishing & Forestry | 0 (0.0%) | 6 (100.0%) |
| Construction & Extraction | 41 (100.0%) | 0 (0.0%) |
| Installation, Maintenance & Repair | 13 (100.0%) | 0 (0.0%) |
| Total (Category) | 54 (90.0%) | 6 (10.0%) |
| Total (Overall) | 473 (50.7%) | 459 (49.2%) |
Production, Transportation and Moving Occupations
The most common Production, Transportation and Moving occupations in North Falmouth are Production (22 | 2.4%), and Transportation (19 | 2.0%).
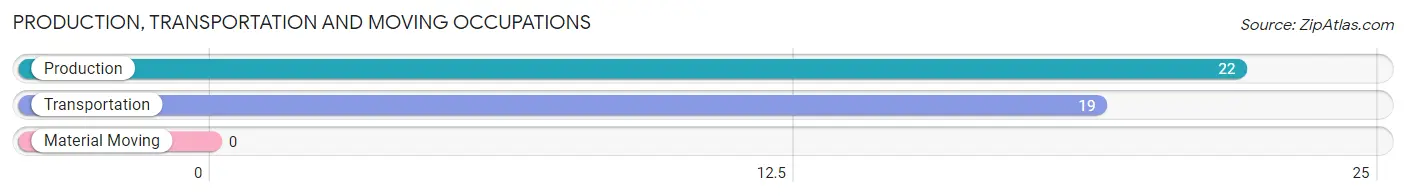
Production, Transportation and Moving Occupations by Sex
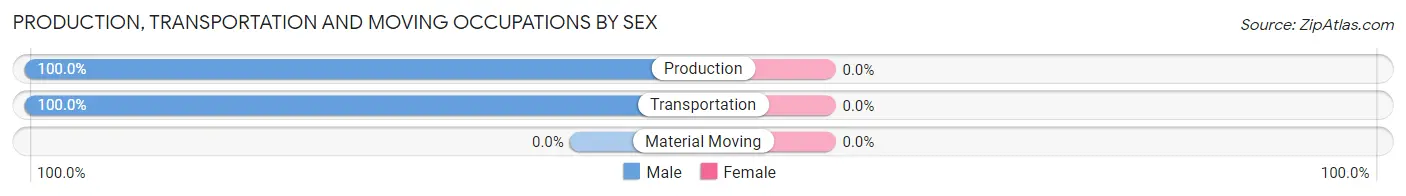
| Occupation | Male | Female |
| Production | 22 (100.0%) | 0 (0.0%) |
| Transportation | 19 (100.0%) | 0 (0.0%) |
| Material Moving | 0 (0.0%) | 0 (0.0%) |
| Total (Category) | 41 (100.0%) | 0 (0.0%) |
| Total (Overall) | 473 (50.7%) | 459 (49.2%) |
Employment Industries by Sex in North Falmouth
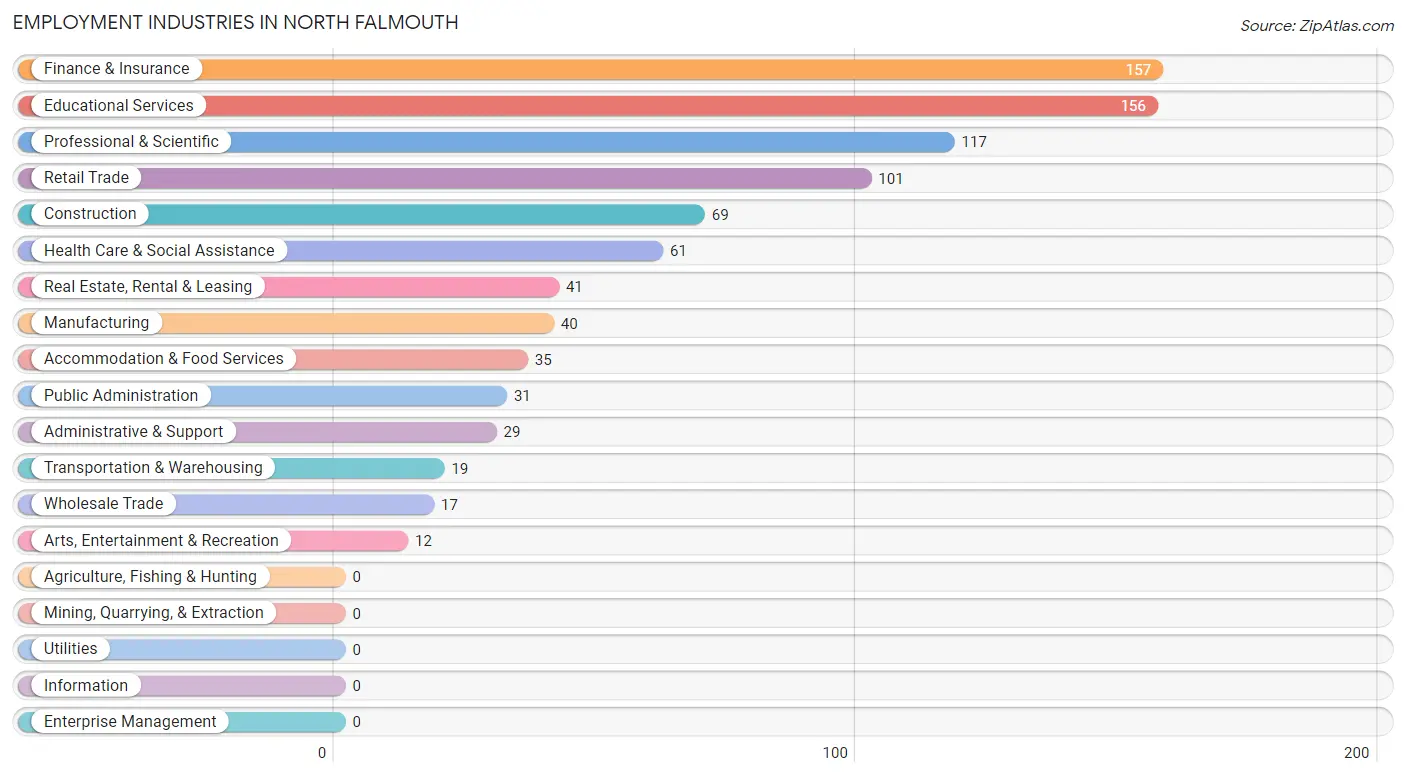
Employment Industries in North Falmouth
The major employment industries in North Falmouth include Finance & Insurance (157 | 16.9%), Educational Services (156 | 16.7%), Professional & Scientific (117 | 12.6%), Retail Trade (101 | 10.8%), and Construction (69 | 7.4%).
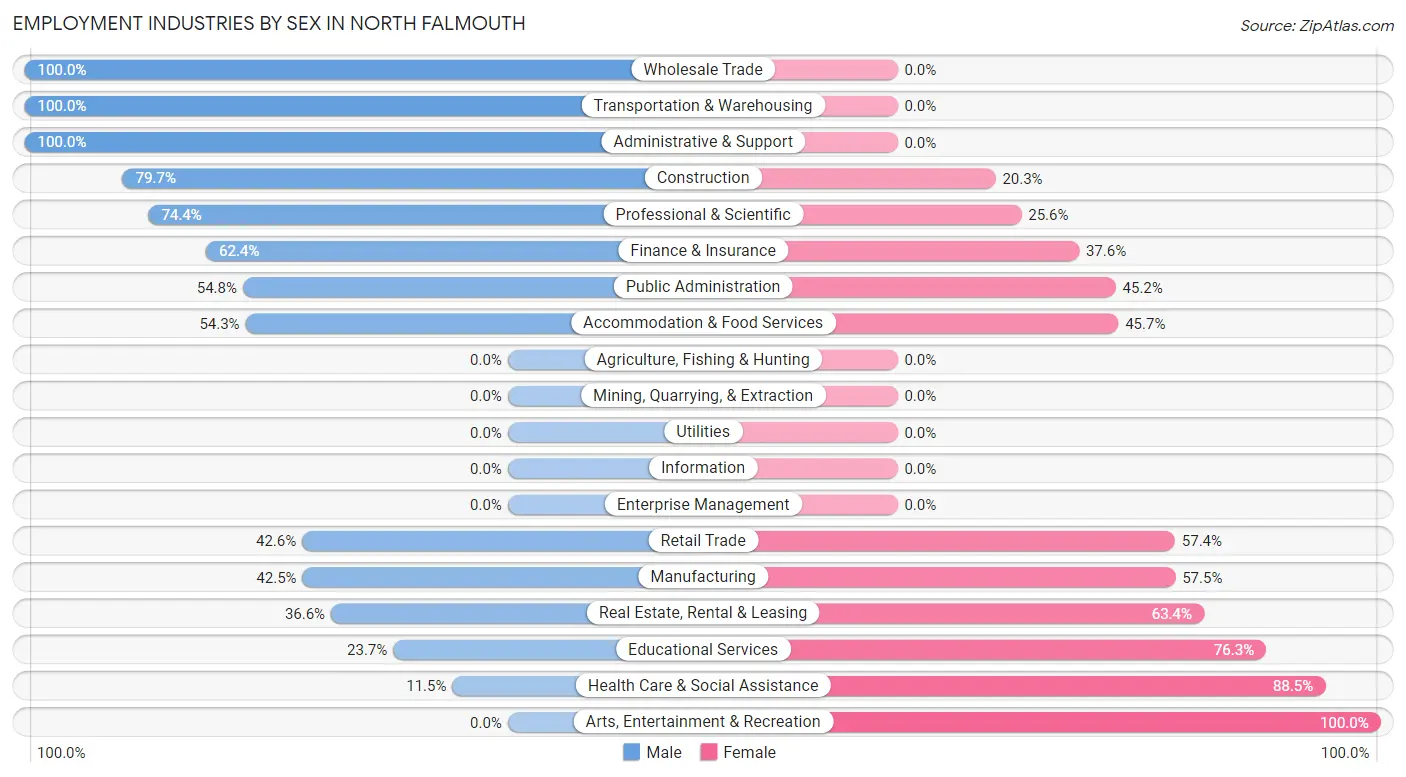
Employment Industries by Sex in North Falmouth
The North Falmouth industries that see more men than women are Wholesale Trade (100.0%), Transportation & Warehousing (100.0%), and Administrative & Support (100.0%), whereas the industries that tend to have a higher number of women are Arts, Entertainment & Recreation (100.0%), Health Care & Social Assistance (88.5%), and Educational Services (76.3%).
| Industry | Male | Female |
| Agriculture, Fishing & Hunting | 0 (0.0%) | 0 (0.0%) |
| Mining, Quarrying, & Extraction | 0 (0.0%) | 0 (0.0%) |
| Construction | 55 (79.7%) | 14 (20.3%) |
| Manufacturing | 17 (42.5%) | 23 (57.5%) |
| Wholesale Trade | 17 (100.0%) | 0 (0.0%) |
| Retail Trade | 43 (42.6%) | 58 (57.4%) |
| Transportation & Warehousing | 19 (100.0%) | 0 (0.0%) |
| Utilities | 0 (0.0%) | 0 (0.0%) |
| Information | 0 (0.0%) | 0 (0.0%) |
| Finance & Insurance | 98 (62.4%) | 59 (37.6%) |
| Real Estate, Rental & Leasing | 15 (36.6%) | 26 (63.4%) |
| Professional & Scientific | 87 (74.4%) | 30 (25.6%) |
| Enterprise Management | 0 (0.0%) | 0 (0.0%) |
| Administrative & Support | 29 (100.0%) | 0 (0.0%) |
| Educational Services | 37 (23.7%) | 119 (76.3%) |
| Health Care & Social Assistance | 7 (11.5%) | 54 (88.5%) |
| Arts, Entertainment & Recreation | 0 (0.0%) | 12 (100.0%) |
| Accommodation & Food Services | 19 (54.3%) | 16 (45.7%) |
| Public Administration | 17 (54.8%) | 14 (45.2%) |
| Total | 473 (50.7%) | 459 (49.2%) |
Education in North Falmouth
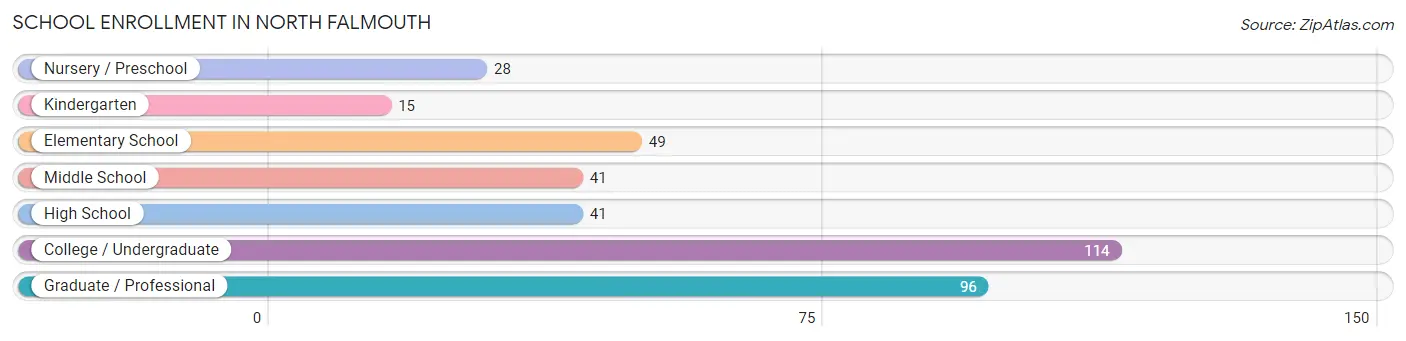
School Enrollment in North Falmouth
The most common levels of schooling among the 384 students in North Falmouth are college / undergraduate (114 | 29.7%), graduate / professional (96 | 25.0%), and elementary school (49 | 12.8%).
| School Level | # Students | % Students |
| Nursery / Preschool | 28 | 7.3% |
| Kindergarten | 15 | 3.9% |
| Elementary School | 49 | 12.8% |
| Middle School | 41 | 10.7% |
| High School | 41 | 10.7% |
| College / Undergraduate | 114 | 29.7% |
| Graduate / Professional | 96 | 25.0% |
| Total | 384 | 100.0% |
School Enrollment by Age by Funding Source in North Falmouth
Out of a total of 384 students who are enrolled in schools in North Falmouth, 17 (4.4%) attend a private institution, while the remaining 367 (95.6%) are enrolled in public schools. The age group of 3 to 4 year olds has the highest likelihood of being enrolled in private schools, with 17 (100.0% in the age bracket) enrolled. Conversely, the age group of 5 to 9 year old has the lowest likelihood of being enrolled in a private school, with 67 (100.0% in the age bracket) attending a public institution.
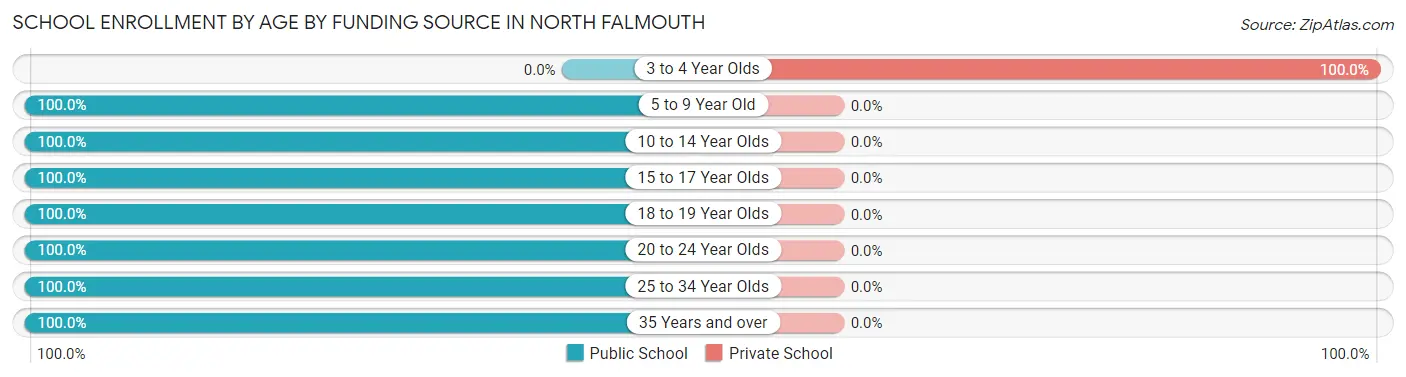
| Age Bracket | Public School | Private School |
| 3 to 4 Year Olds | 0 (0.0%) | 17 (100.0%) |
| 5 to 9 Year Old | 67 (100.0%) | 0 (0.0%) |
| 10 to 14 Year Olds | 49 (100.0%) | 0 (0.0%) |
| 15 to 17 Year Olds | 45 (100.0%) | 0 (0.0%) |
| 18 to 19 Year Olds | 54 (100.0%) | 0 (0.0%) |
| 20 to 24 Year Olds | 33 (100.0%) | 0 (0.0%) |
| 25 to 34 Year Olds | 85 (100.0%) | 0 (0.0%) |
| 35 Years and over | 34 (100.0%) | 0 (0.0%) |
| Total | 367 (95.6%) | 17 (4.4%) |
Educational Attainment by Field of Study in North Falmouth
Business (263 | 21.6%), engineering (154 | 12.6%), social sciences (148 | 12.1%), liberal arts & history (131 | 10.8%), and education (98 | 8.1%) are the most common fields of study among 1,218 individuals in North Falmouth who have obtained a bachelor's degree or higher.
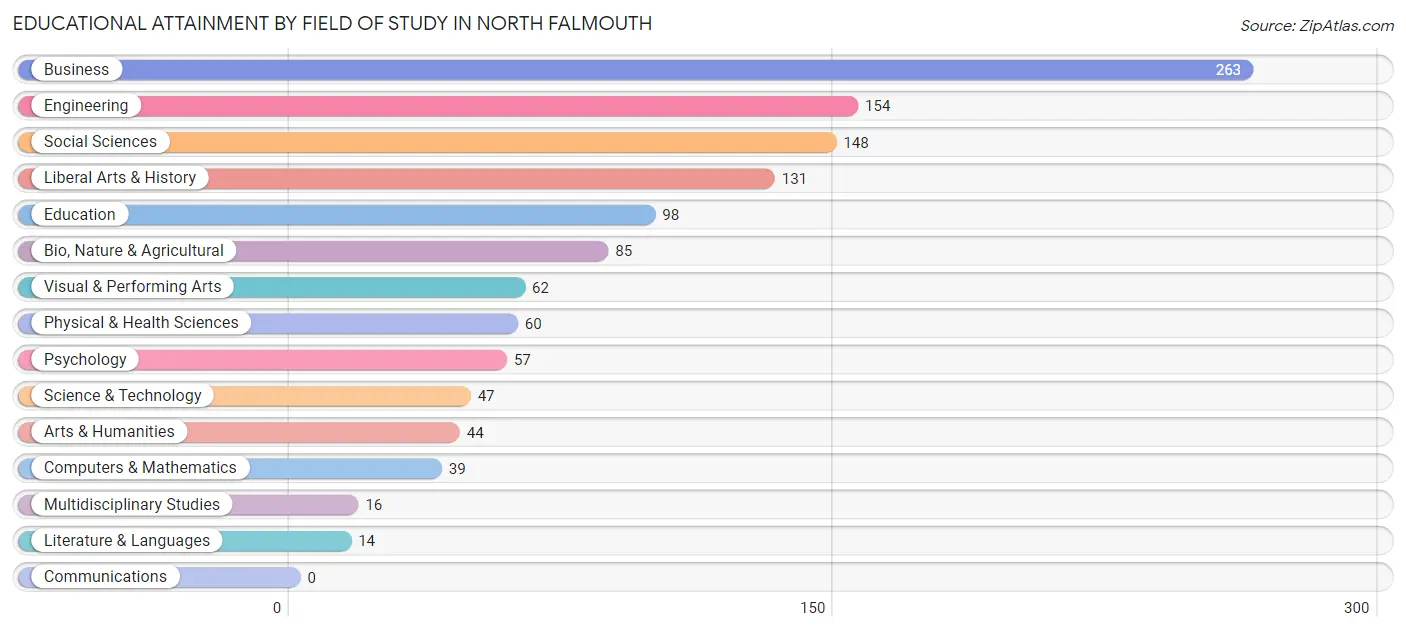
| Field of Study | # Graduates | % Graduates |
| Computers & Mathematics | 39 | 3.2% |
| Bio, Nature & Agricultural | 85 | 7.0% |
| Physical & Health Sciences | 60 | 4.9% |
| Psychology | 57 | 4.7% |
| Social Sciences | 148 | 12.1% |
| Engineering | 154 | 12.6% |
| Multidisciplinary Studies | 16 | 1.3% |
| Science & Technology | 47 | 3.9% |
| Business | 263 | 21.6% |
| Education | 98 | 8.1% |
| Literature & Languages | 14 | 1.1% |
| Liberal Arts & History | 131 | 10.8% |
| Visual & Performing Arts | 62 | 5.1% |
| Communications | 0 | 0.0% |
| Arts & Humanities | 44 | 3.6% |
| Total | 1,218 | 100.0% |
Transportation & Commute in North Falmouth
Vehicle Availability by Sex in North Falmouth
The most prevalent vehicle ownership categories in North Falmouth are males with 2 vehicles (297, accounting for 53.5%) and females with 2 vehicles (359, making up 55.3%).
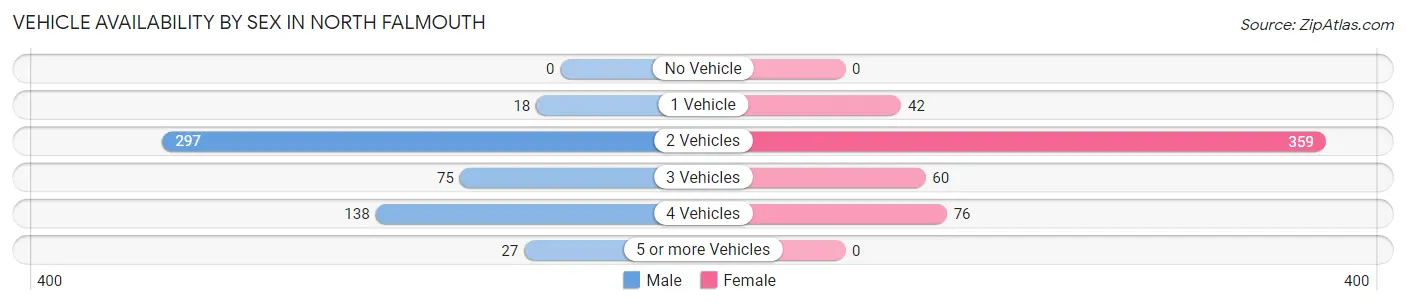
| Vehicles Available | Male | Female |
| No Vehicle | 0 (0.0%) | 0 (0.0%) |
| 1 Vehicle | 18 (3.2%) | 42 (7.8%) |
| 2 Vehicles | 297 (53.5%) | 359 (66.8%) |
| 3 Vehicles | 75 (13.5%) | 60 (11.2%) |
| 4 Vehicles | 138 (24.9%) | 76 (14.1%) |
| 5 or more Vehicles | 27 (4.9%) | 0 (0.0%) |
| Total | 555 (100.0%) | 537 (100.0%) |
Commute Time in North Falmouth
The most frequently occuring commute durations in North Falmouth are 15 to 19 minutes (195 commuters, 25.1%), 10 to 14 minutes (185 commuters, 23.8%), and 5 to 9 minutes (92 commuters, 11.8%).
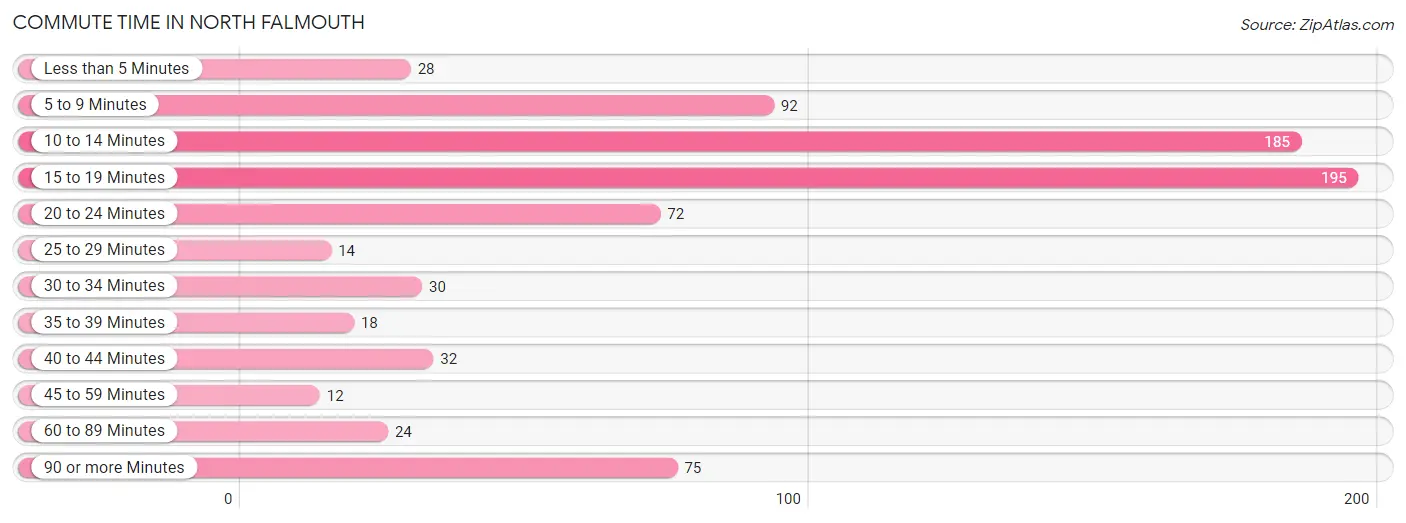
| Commute Time | # Commuters | % Commuters |
| Less than 5 Minutes | 28 | 3.6% |
| 5 to 9 Minutes | 92 | 11.8% |
| 10 to 14 Minutes | 185 | 23.8% |
| 15 to 19 Minutes | 195 | 25.1% |
| 20 to 24 Minutes | 72 | 9.3% |
| 25 to 29 Minutes | 14 | 1.8% |
| 30 to 34 Minutes | 30 | 3.9% |
| 35 to 39 Minutes | 18 | 2.3% |
| 40 to 44 Minutes | 32 | 4.1% |
| 45 to 59 Minutes | 12 | 1.5% |
| 60 to 89 Minutes | 24 | 3.1% |
| 90 or more Minutes | 75 | 9.7% |
Commute Time by Sex in North Falmouth
The most common commute times in North Falmouth are 5 to 9 minutes (70 commuters, 20.6%) for males and 15 to 19 minutes (142 commuters, 32.4%) for females.
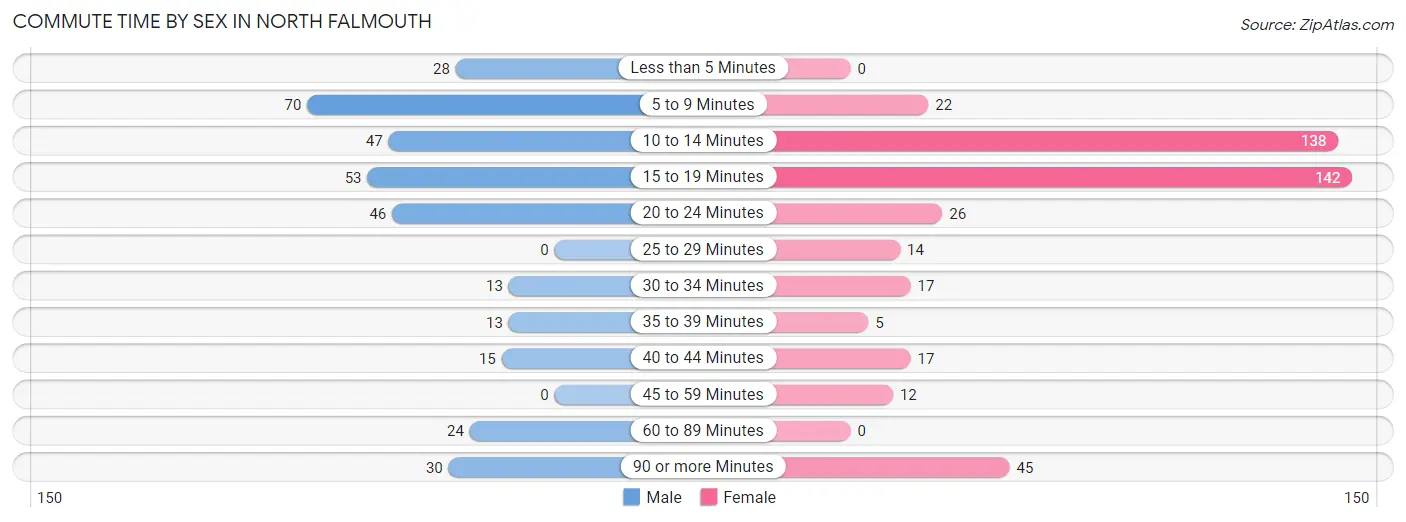
| Commute Time | Male | Female |
| Less than 5 Minutes | 28 (8.3%) | 0 (0.0%) |
| 5 to 9 Minutes | 70 (20.6%) | 22 (5.0%) |
| 10 to 14 Minutes | 47 (13.9%) | 138 (31.5%) |
| 15 to 19 Minutes | 53 (15.6%) | 142 (32.4%) |
| 20 to 24 Minutes | 46 (13.6%) | 26 (5.9%) |
| 25 to 29 Minutes | 0 (0.0%) | 14 (3.2%) |
| 30 to 34 Minutes | 13 (3.8%) | 17 (3.9%) |
| 35 to 39 Minutes | 13 (3.8%) | 5 (1.1%) |
| 40 to 44 Minutes | 15 (4.4%) | 17 (3.9%) |
| 45 to 59 Minutes | 0 (0.0%) | 12 (2.7%) |
| 60 to 89 Minutes | 24 (7.1%) | 0 (0.0%) |
| 90 or more Minutes | 30 (8.8%) | 45 (10.3%) |
Time of Departure to Work by Sex in North Falmouth
The most frequent times of departure to work in North Falmouth are 7:30 AM to 7:59 AM (109, 32.2%) for males and 9:00 AM to 9:59 AM (108, 24.7%) for females.
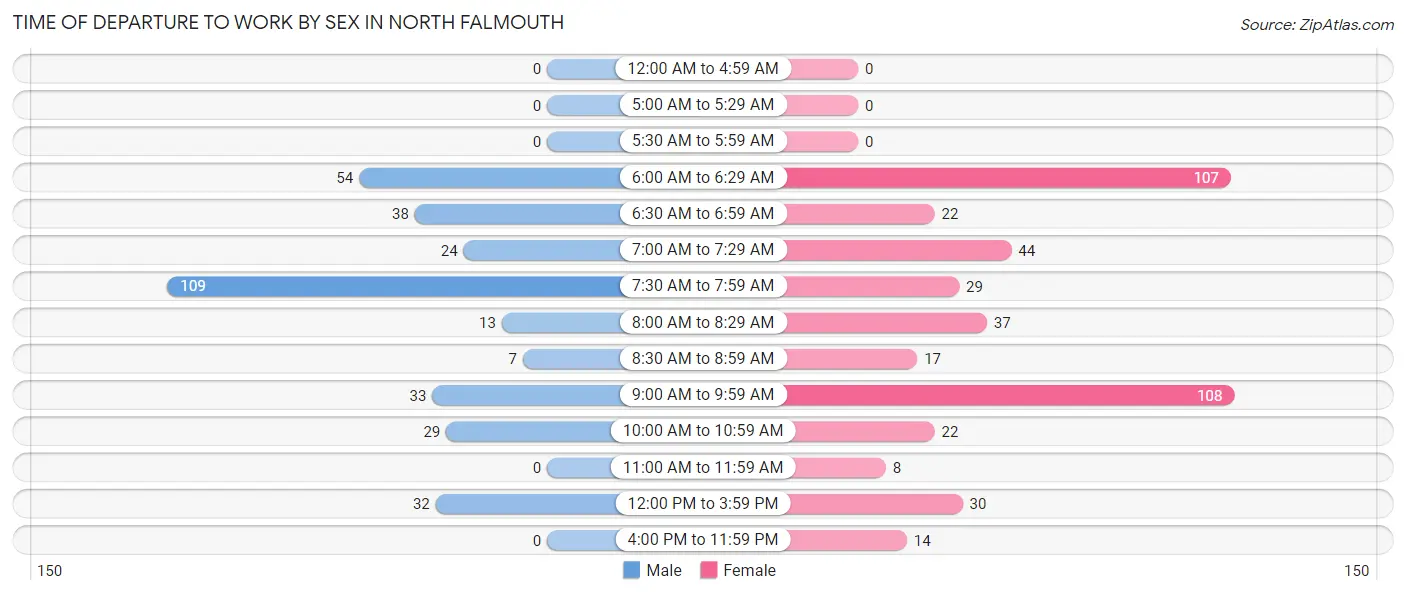
| Time of Departure | Male | Female |
| 12:00 AM to 4:59 AM | 0 (0.0%) | 0 (0.0%) |
| 5:00 AM to 5:29 AM | 0 (0.0%) | 0 (0.0%) |
| 5:30 AM to 5:59 AM | 0 (0.0%) | 0 (0.0%) |
| 6:00 AM to 6:29 AM | 54 (15.9%) | 107 (24.4%) |
| 6:30 AM to 6:59 AM | 38 (11.2%) | 22 (5.0%) |
| 7:00 AM to 7:29 AM | 24 (7.1%) | 44 (10.1%) |
| 7:30 AM to 7:59 AM | 109 (32.2%) | 29 (6.6%) |
| 8:00 AM to 8:29 AM | 13 (3.8%) | 37 (8.5%) |
| 8:30 AM to 8:59 AM | 7 (2.1%) | 17 (3.9%) |
| 9:00 AM to 9:59 AM | 33 (9.7%) | 108 (24.7%) |
| 10:00 AM to 10:59 AM | 29 (8.6%) | 22 (5.0%) |
| 11:00 AM to 11:59 AM | 0 (0.0%) | 8 (1.8%) |
| 12:00 PM to 3:59 PM | 32 (9.4%) | 30 (6.9%) |
| 4:00 PM to 11:59 PM | 0 (0.0%) | 14 (3.2%) |
| Total | 339 (100.0%) | 438 (100.0%) |
Housing Occupancy in North Falmouth
Occupancy by Ownership in North Falmouth
Of the total 917 dwellings in North Falmouth, owner-occupied units account for 867 (94.6%), while renter-occupied units make up 50 (5.4%).
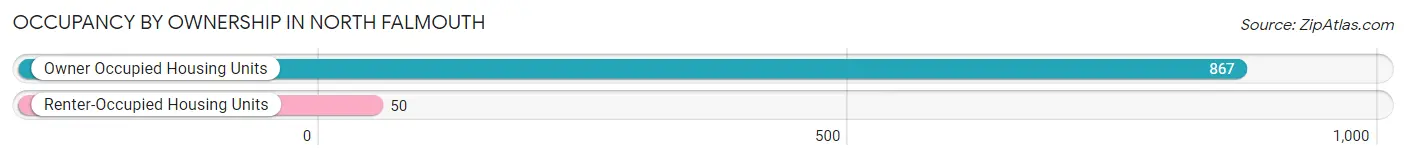
| Occupancy | # Housing Units | % Housing Units |
| Owner Occupied Housing Units | 867 | 94.6% |
| Renter-Occupied Housing Units | 50 | 5.4% |
| Total Occupied Housing Units | 917 | 100.0% |
Occupancy by Household Size in North Falmouth
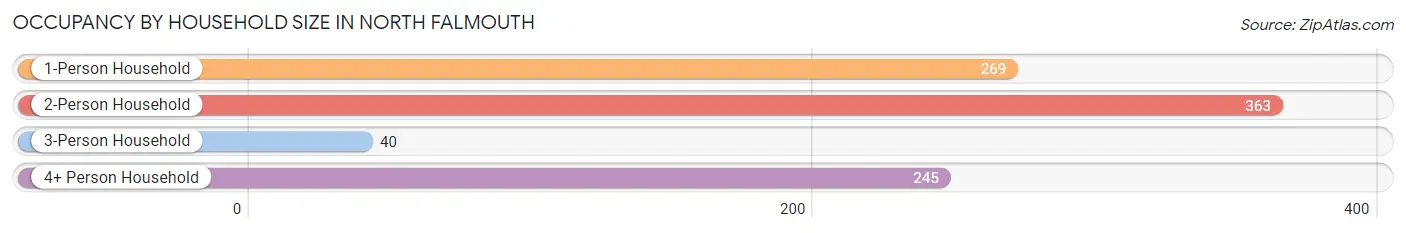
| Household Size | # Housing Units | % Housing Units |
| 1-Person Household | 269 | 29.3% |
| 2-Person Household | 363 | 39.6% |
| 3-Person Household | 40 | 4.4% |
| 4+ Person Household | 245 | 26.7% |
| Total Housing Units | 917 | 100.0% |
Occupancy by Ownership by Household Size in North Falmouth
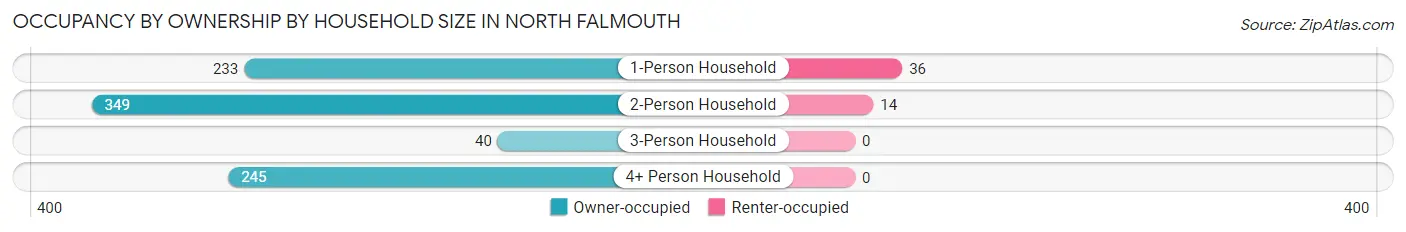
| Household Size | Owner-occupied | Renter-occupied |
| 1-Person Household | 233 (86.6%) | 36 (13.4%) |
| 2-Person Household | 349 (96.1%) | 14 (3.9%) |
| 3-Person Household | 40 (100.0%) | 0 (0.0%) |
| 4+ Person Household | 245 (100.0%) | 0 (0.0%) |
| Total Housing Units | 867 (94.6%) | 50 (5.4%) |
Occupancy by Educational Attainment in North Falmouth
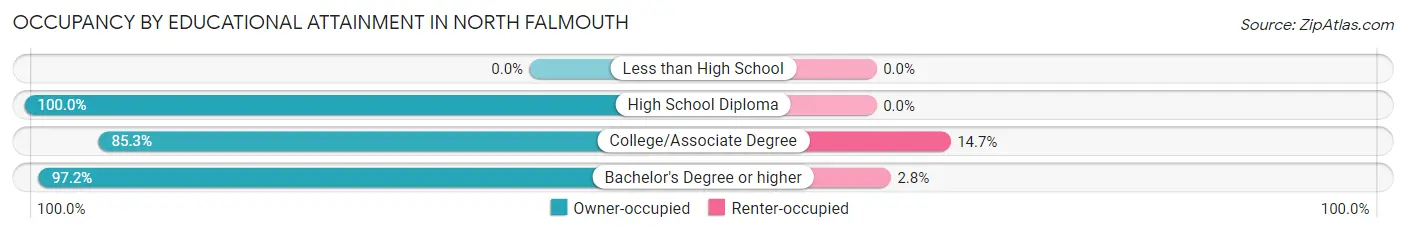
| Household Size | Owner-occupied | Renter-occupied |
| Less than High School | 0 (0.0%) | 0 (0.0%) |
| High School Diploma | 66 (100.0%) | 0 (0.0%) |
| College/Associate Degree | 186 (85.3%) | 32 (14.7%) |
| Bachelor's Degree or higher | 615 (97.2%) | 18 (2.8%) |
Occupancy by Age of Householder in North Falmouth
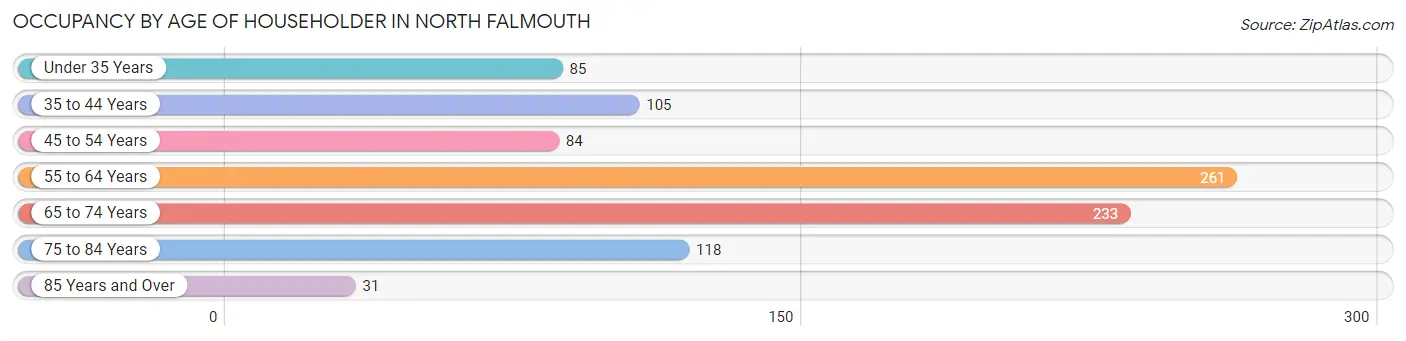
| Age Bracket | # Households | % Households |
| Under 35 Years | 85 | 9.3% |
| 35 to 44 Years | 105 | 11.5% |
| 45 to 54 Years | 84 | 9.2% |
| 55 to 64 Years | 261 | 28.5% |
| 65 to 74 Years | 233 | 25.4% |
| 75 to 84 Years | 118 | 12.9% |
| 85 Years and Over | 31 | 3.4% |
| Total | 917 | 100.0% |
Housing Finances in North Falmouth
Median Income by Occupancy in North Falmouth
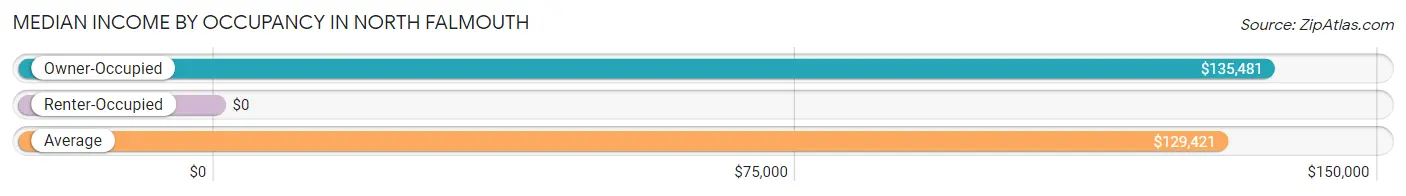
| Occupancy Type | # Households | Median Income |
| Owner-Occupied | 867 (94.6%) | $135,481 |
| Renter-Occupied | 50 (5.4%) | $0 |
| Average | 917 (100.0%) | $129,421 |
Occupancy by Householder Income Bracket in North Falmouth
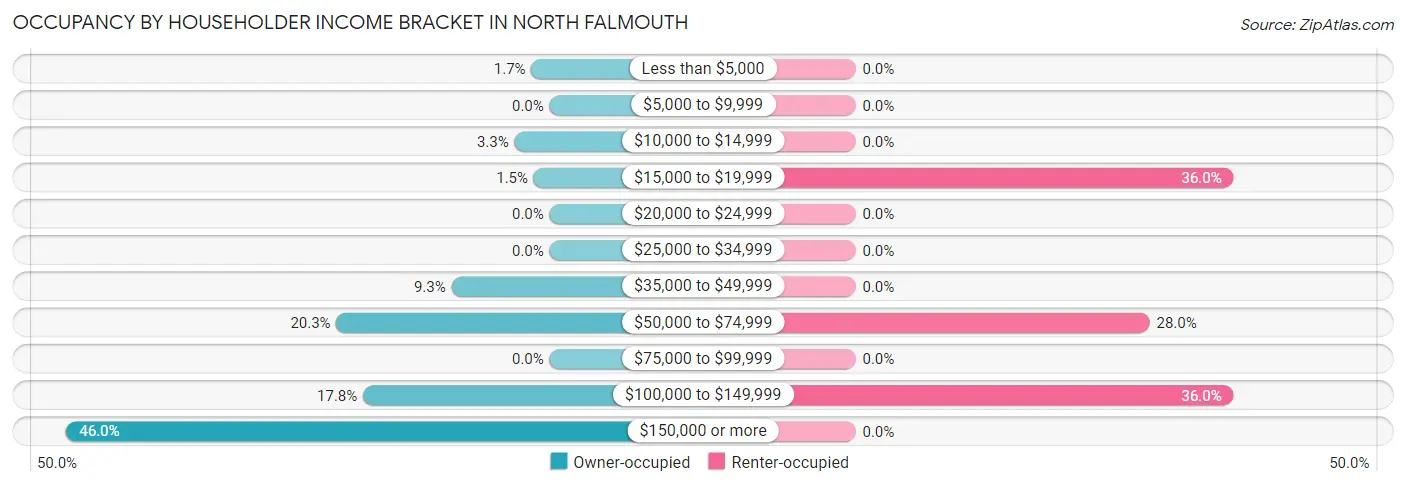
| Income Bracket | Owner-occupied | Renter-occupied |
| Less than $5,000 | 15 (1.7%) | 0 (0.0%) |
| $5,000 to $9,999 | 0 (0.0%) | 0 (0.0%) |
| $10,000 to $14,999 | 29 (3.3%) | 0 (0.0%) |
| $15,000 to $19,999 | 13 (1.5%) | 18 (36.0%) |
| $20,000 to $24,999 | 0 (0.0%) | 0 (0.0%) |
| $25,000 to $34,999 | 0 (0.0%) | 0 (0.0%) |
| $35,000 to $49,999 | 81 (9.3%) | 0 (0.0%) |
| $50,000 to $74,999 | 176 (20.3%) | 14 (28.0%) |
| $75,000 to $99,999 | 0 (0.0%) | 0 (0.0%) |
| $100,000 to $149,999 | 154 (17.8%) | 18 (36.0%) |
| $150,000 or more | 399 (46.0%) | 0 (0.0%) |
| Total | 867 (100.0%) | 50 (100.0%) |
Monthly Housing Cost Tiers in North Falmouth
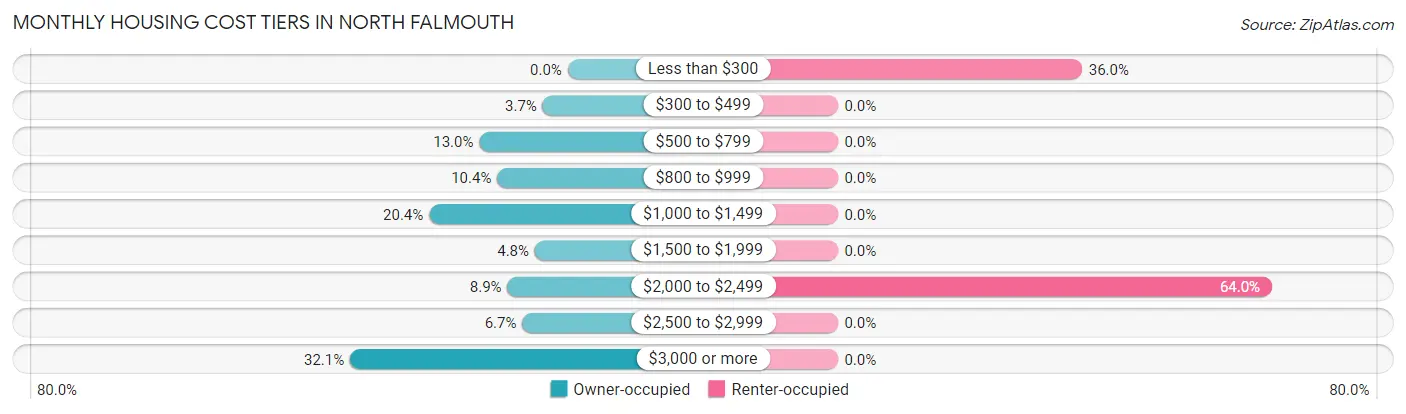
| Monthly Cost | Owner-occupied | Renter-occupied |
| Less than $300 | 0 (0.0%) | 18 (36.0%) |
| $300 to $499 | 32 (3.7%) | 0 (0.0%) |
| $500 to $799 | 113 (13.0%) | 0 (0.0%) |
| $800 to $999 | 90 (10.4%) | 0 (0.0%) |
| $1,000 to $1,499 | 177 (20.4%) | 0 (0.0%) |
| $1,500 to $1,999 | 42 (4.8%) | 0 (0.0%) |
| $2,000 to $2,499 | 77 (8.9%) | 32 (64.0%) |
| $2,500 to $2,999 | 58 (6.7%) | 0 (0.0%) |
| $3,000 or more | 278 (32.1%) | 0 (0.0%) |
| Total | 867 (100.0%) | 50 (100.0%) |
Physical Housing Characteristics in North Falmouth
Housing Structures in North Falmouth
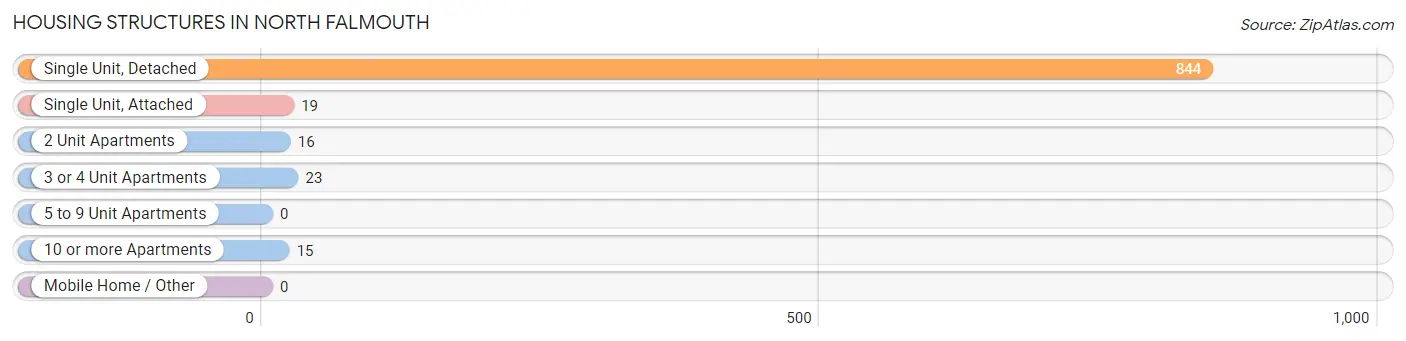
| Structure Type | # Housing Units | % Housing Units |
| Single Unit, Detached | 844 | 92.0% |
| Single Unit, Attached | 19 | 2.1% |
| 2 Unit Apartments | 16 | 1.7% |
| 3 or 4 Unit Apartments | 23 | 2.5% |
| 5 to 9 Unit Apartments | 0 | 0.0% |
| 10 or more Apartments | 15 | 1.6% |
| Mobile Home / Other | 0 | 0.0% |
| Total | 917 | 100.0% |
Housing Structures by Occupancy in North Falmouth
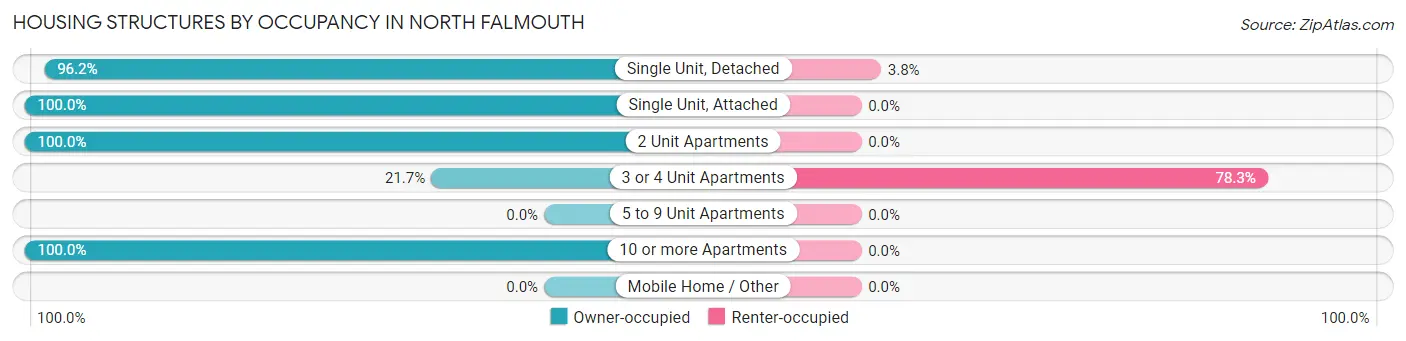
| Structure Type | Owner-occupied | Renter-occupied |
| Single Unit, Detached | 812 (96.2%) | 32 (3.8%) |
| Single Unit, Attached | 19 (100.0%) | 0 (0.0%) |
| 2 Unit Apartments | 16 (100.0%) | 0 (0.0%) |
| 3 or 4 Unit Apartments | 5 (21.7%) | 18 (78.3%) |
| 5 to 9 Unit Apartments | 0 (0.0%) | 0 (0.0%) |
| 10 or more Apartments | 15 (100.0%) | 0 (0.0%) |
| Mobile Home / Other | 0 (0.0%) | 0 (0.0%) |
| Total | 867 (94.6%) | 50 (5.4%) |
Housing Structures by Number of Rooms in North Falmouth
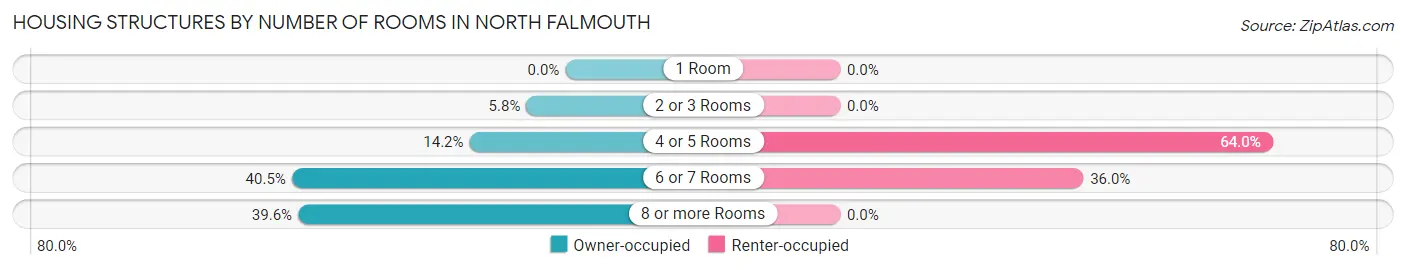
| Number of Rooms | Owner-occupied | Renter-occupied |
| 1 Room | 0 (0.0%) | 0 (0.0%) |
| 2 or 3 Rooms | 50 (5.8%) | 0 (0.0%) |
| 4 or 5 Rooms | 123 (14.2%) | 32 (64.0%) |
| 6 or 7 Rooms | 351 (40.5%) | 18 (36.0%) |
| 8 or more Rooms | 343 (39.6%) | 0 (0.0%) |
| Total | 867 (100.0%) | 50 (100.0%) |
Housing Structure by Heating Type in North Falmouth
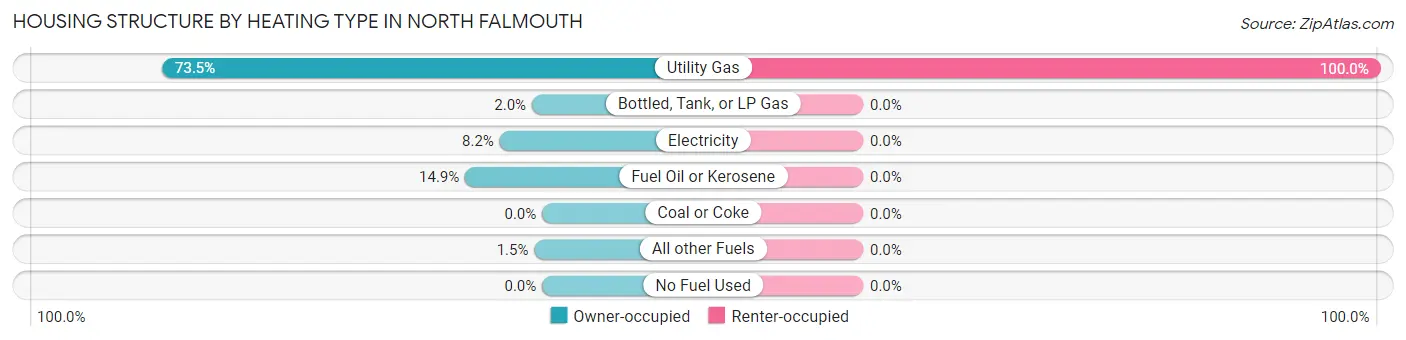
| Heating Type | Owner-occupied | Renter-occupied |
| Utility Gas | 637 (73.5%) | 50 (100.0%) |
| Bottled, Tank, or LP Gas | 17 (2.0%) | 0 (0.0%) |
| Electricity | 71 (8.2%) | 0 (0.0%) |
| Fuel Oil or Kerosene | 129 (14.9%) | 0 (0.0%) |
| Coal or Coke | 0 (0.0%) | 0 (0.0%) |
| All other Fuels | 13 (1.5%) | 0 (0.0%) |
| No Fuel Used | 0 (0.0%) | 0 (0.0%) |
| Total | 867 (100.0%) | 50 (100.0%) |
Household Vehicle Usage in North Falmouth
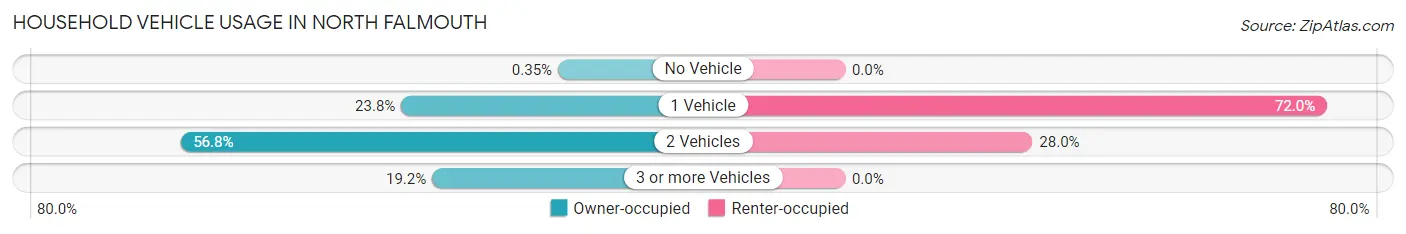
| Vehicles per Household | Owner-occupied | Renter-occupied |
| No Vehicle | 3 (0.4%) | 0 (0.0%) |
| 1 Vehicle | 206 (23.8%) | 36 (72.0%) |
| 2 Vehicles | 492 (56.8%) | 14 (28.0%) |
| 3 or more Vehicles | 166 (19.2%) | 0 (0.0%) |
| Total | 867 (100.0%) | 50 (100.0%) |
Real Estate & Mortgages in North Falmouth
Real Estate and Mortgage Overview in North Falmouth
| Characteristic | Without Mortgage | With Mortgage |
| Housing Units | 390 | 477 |
| Median Property Value | $662,800 | $653,900 |
| Median Household Income | $69,625 | $323 |
| Monthly Housing Costs | $976 | $278 |
| Real Estate Taxes | $4,792 | $0 |
Property Value by Mortgage Status in North Falmouth
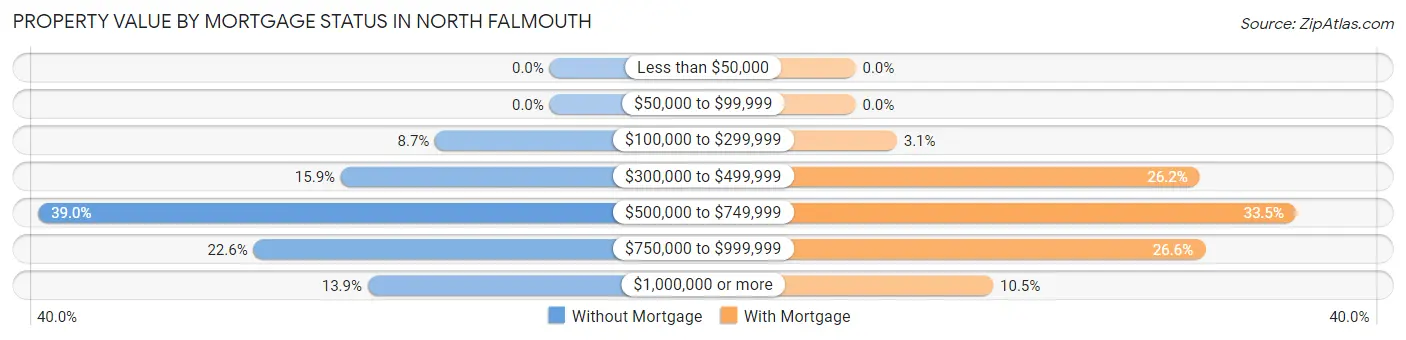
| Property Value | Without Mortgage | With Mortgage |
| Less than $50,000 | 0 (0.0%) | 0 (0.0%) |
| $50,000 to $99,999 | 0 (0.0%) | 0 (0.0%) |
| $100,000 to $299,999 | 34 (8.7%) | 15 (3.1%) |
| $300,000 to $499,999 | 62 (15.9%) | 125 (26.2%) |
| $500,000 to $749,999 | 152 (39.0%) | 160 (33.5%) |
| $750,000 to $999,999 | 88 (22.6%) | 127 (26.6%) |
| $1,000,000 or more | 54 (13.9%) | 50 (10.5%) |
| Total | 390 (100.0%) | 477 (100.0%) |
Household Income by Mortgage Status in North Falmouth
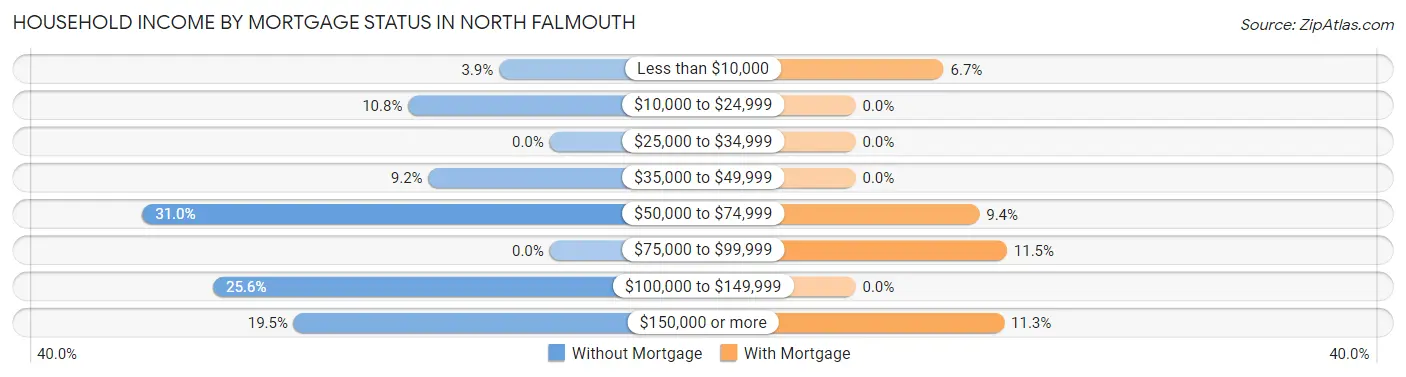
| Household Income | Without Mortgage | With Mortgage |
| Less than $10,000 | 15 (3.8%) | 32 (6.7%) |
| $10,000 to $24,999 | 42 (10.8%) | 0 (0.0%) |
| $25,000 to $34,999 | 0 (0.0%) | 0 (0.0%) |
| $35,000 to $49,999 | 36 (9.2%) | 0 (0.0%) |
| $50,000 to $74,999 | 121 (31.0%) | 45 (9.4%) |
| $75,000 to $99,999 | 0 (0.0%) | 55 (11.5%) |
| $100,000 to $149,999 | 100 (25.6%) | 0 (0.0%) |
| $150,000 or more | 76 (19.5%) | 54 (11.3%) |
| Total | 390 (100.0%) | 477 (100.0%) |
Property Value to Household Income Ratio in North Falmouth
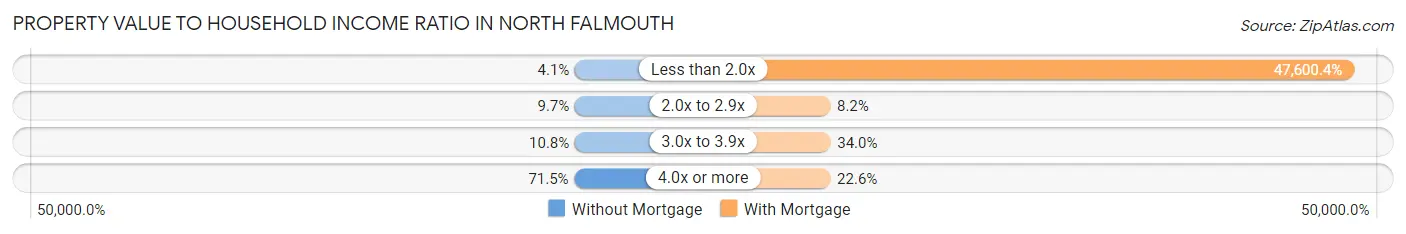
| Value-to-Income Ratio | Without Mortgage | With Mortgage |
| Less than 2.0x | 16 (4.1%) | 227,054 (47,600.4%) |
| 2.0x to 2.9x | 38 (9.7%) | 39 (8.2%) |
| 3.0x to 3.9x | 42 (10.8%) | 162 (34.0%) |
| 4.0x or more | 279 (71.5%) | 108 (22.6%) |
| Total | 390 (100.0%) | 477 (100.0%) |
Real Estate Taxes by Mortgage Status in North Falmouth
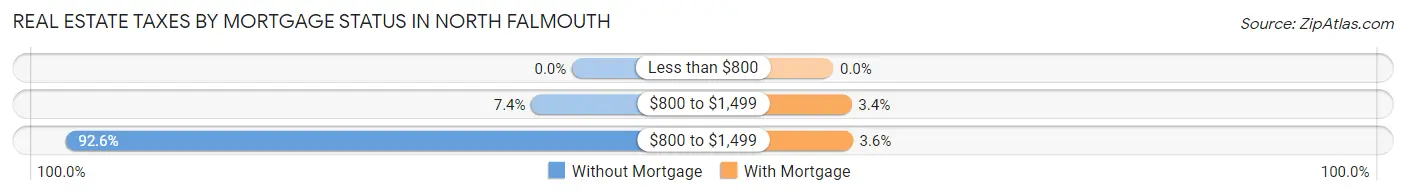
| Property Taxes | Without Mortgage | With Mortgage |
| Less than $800 | 0 (0.0%) | 0 (0.0%) |
| $800 to $1,499 | 29 (7.4%) | 16 (3.4%) |
| $800 to $1,499 | 361 (92.6%) | 17 (3.6%) |
| Total | 390 (100.0%) | 477 (100.0%) |
Health & Disability in North Falmouth
Health Insurance Coverage by Age in North Falmouth
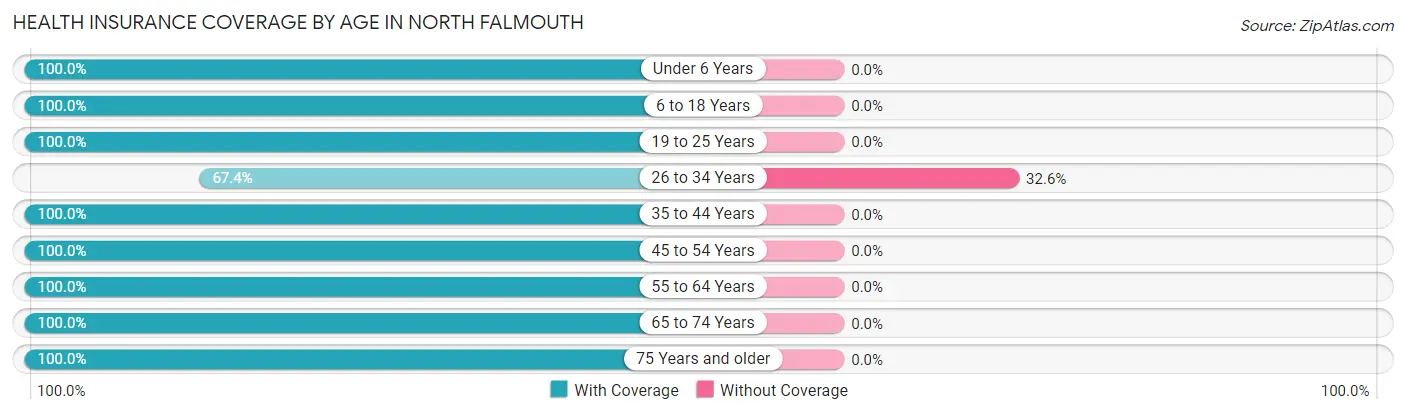
| Age Bracket | With Coverage | Without Coverage |
| Under 6 Years | 320 (100.0%) | 0 (0.0%) |
| 6 to 18 Years | 187 (100.0%) | 0 (0.0%) |
| 19 to 25 Years | 152 (100.0%) | 0 (0.0%) |
| 26 to 34 Years | 31 (67.4%) | 15 (32.6%) |
| 35 to 44 Years | 181 (100.0%) | 0 (0.0%) |
| 45 to 54 Years | 174 (100.0%) | 0 (0.0%) |
| 55 to 64 Years | 395 (100.0%) | 0 (0.0%) |
| 65 to 74 Years | 359 (100.0%) | 0 (0.0%) |
| 75 Years and older | 254 (100.0%) | 0 (0.0%) |
| Total | 2,053 (99.3%) | 15 (0.7%) |
Health Insurance Coverage by Citizenship Status in North Falmouth
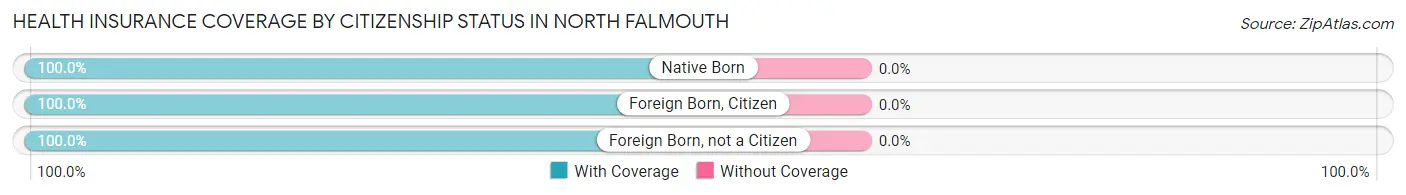
| Citizenship Status | With Coverage | Without Coverage |
| Native Born | 320 (100.0%) | 0 (0.0%) |
| Foreign Born, Citizen | 187 (100.0%) | 0 (0.0%) |
| Foreign Born, not a Citizen | 152 (100.0%) | 0 (0.0%) |
Health Insurance Coverage by Household Income in North Falmouth
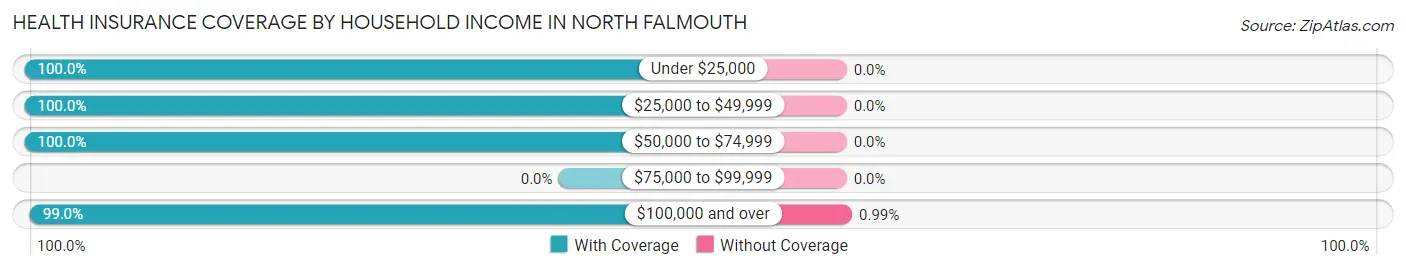
| Household Income | With Coverage | Without Coverage |
| Under $25,000 | 88 (100.0%) | 0 (0.0%) |
| $25,000 to $49,999 | 133 (100.0%) | 0 (0.0%) |
| $50,000 to $74,999 | 330 (100.0%) | 0 (0.0%) |
| $75,000 to $99,999 | 0 (0.0%) | 0 (0.0%) |
| $100,000 and over | 1,495 (99.0%) | 15 (1.0%) |
Public vs Private Health Insurance Coverage by Age in North Falmouth
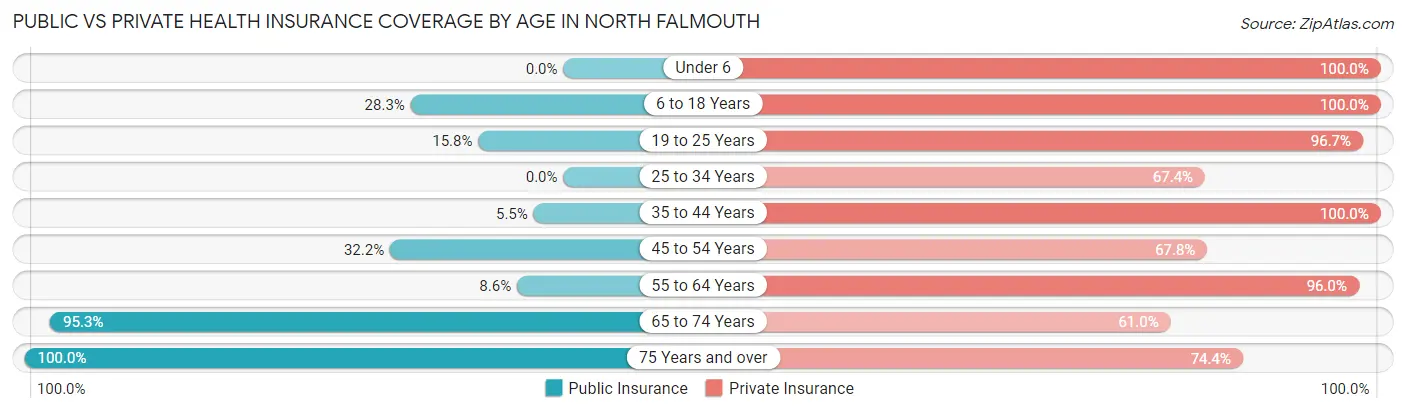
| Age Bracket | Public Insurance | Private Insurance |
| Under 6 | 0 (0.0%) | 320 (100.0%) |
| 6 to 18 Years | 53 (28.3%) | 187 (100.0%) |
| 19 to 25 Years | 24 (15.8%) | 147 (96.7%) |
| 25 to 34 Years | 0 (0.0%) | 31 (67.4%) |
| 35 to 44 Years | 10 (5.5%) | 181 (100.0%) |
| 45 to 54 Years | 56 (32.2%) | 118 (67.8%) |
| 55 to 64 Years | 34 (8.6%) | 379 (96.0%) |
| 65 to 74 Years | 342 (95.3%) | 219 (61.0%) |
| 75 Years and over | 254 (100.0%) | 189 (74.4%) |
| Total | 773 (37.4%) | 1,771 (85.6%) |
Disability Status by Sex by Age in North Falmouth
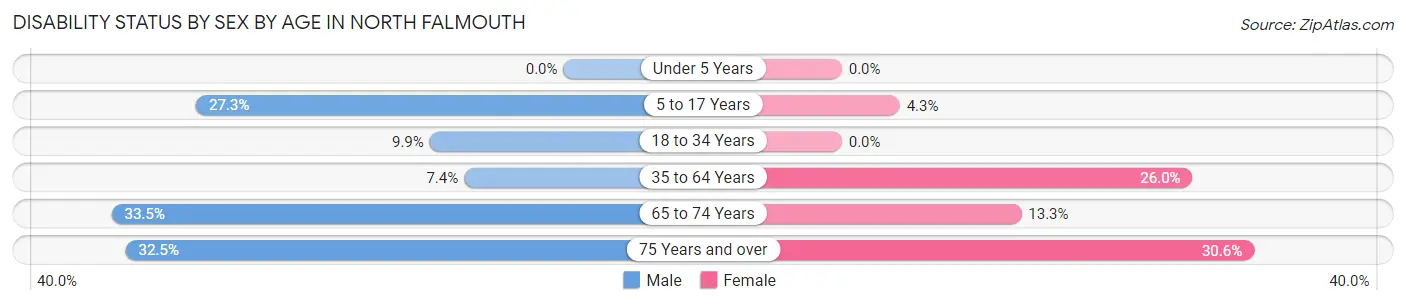
| Age Bracket | Male | Female |
| Under 5 Years | 0 (0.0%) | 0 (0.0%) |
| 5 to 17 Years | 21 (27.3%) | 8 (4.3%) |
| 18 to 34 Years | 15 (9.9%) | 0 (0.0%) |
| 35 to 64 Years | 23 (7.4%) | 114 (26.0%) |
| 65 to 74 Years | 55 (33.5%) | 26 (13.3%) |
| 75 Years and over | 39 (32.5%) | 41 (30.6%) |
Disability Class by Sex by Age in North Falmouth
Disability Class: Hearing Difficulty
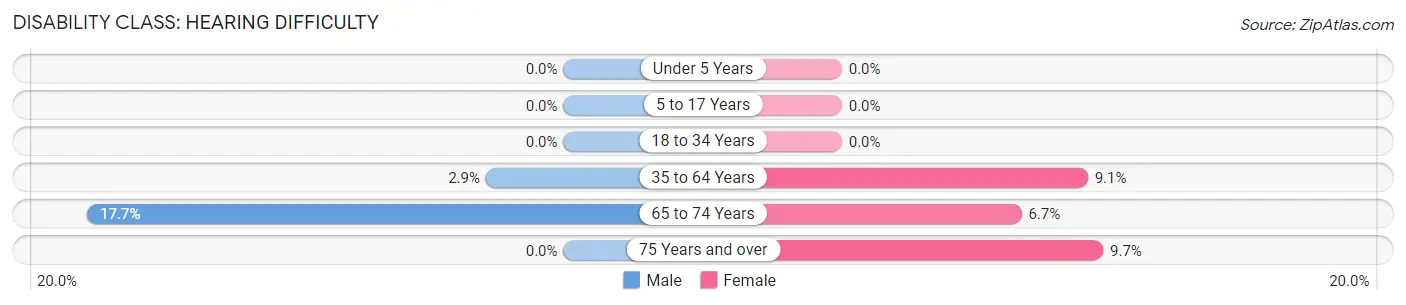
| Age Bracket | Male | Female |
| Under 5 Years | 0 (0.0%) | 0 (0.0%) |
| 5 to 17 Years | 0 (0.0%) | 0 (0.0%) |
| 18 to 34 Years | 0 (0.0%) | 0 (0.0%) |
| 35 to 64 Years | 9 (2.9%) | 40 (9.1%) |
| 65 to 74 Years | 29 (17.7%) | 13 (6.7%) |
| 75 Years and over | 0 (0.0%) | 13 (9.7%) |
Disability Class: Vision Difficulty
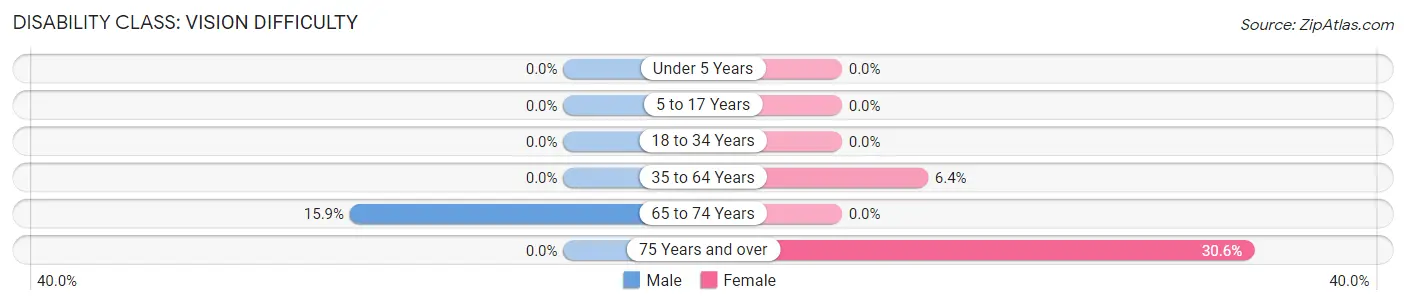
| Age Bracket | Male | Female |
| Under 5 Years | 0 (0.0%) | 0 (0.0%) |
| 5 to 17 Years | 0 (0.0%) | 0 (0.0%) |
| 18 to 34 Years | 0 (0.0%) | 0 (0.0%) |
| 35 to 64 Years | 0 (0.0%) | 28 (6.4%) |
| 65 to 74 Years | 26 (15.9%) | 0 (0.0%) |
| 75 Years and over | 0 (0.0%) | 41 (30.6%) |
Disability Class: Cognitive Difficulty
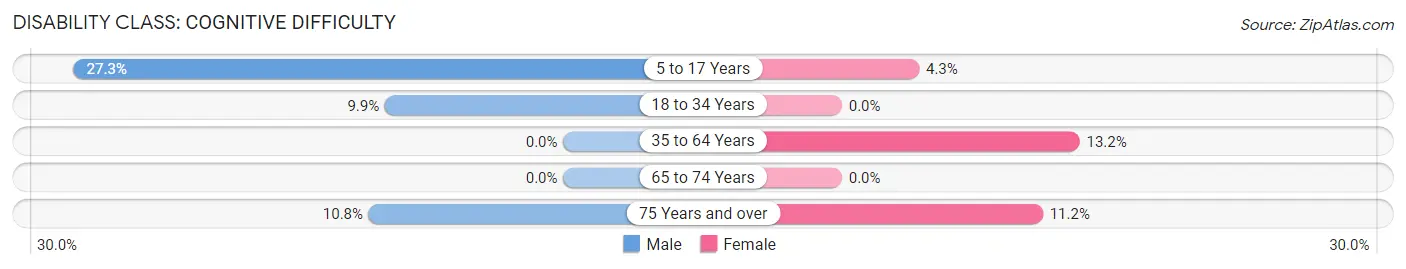
| Age Bracket | Male | Female |
| 5 to 17 Years | 21 (27.3%) | 8 (4.3%) |
| 18 to 34 Years | 15 (9.9%) | 0 (0.0%) |
| 35 to 64 Years | 0 (0.0%) | 58 (13.2%) |
| 65 to 74 Years | 0 (0.0%) | 0 (0.0%) |
| 75 Years and over | 13 (10.8%) | 15 (11.2%) |
Disability Class: Ambulatory Difficulty
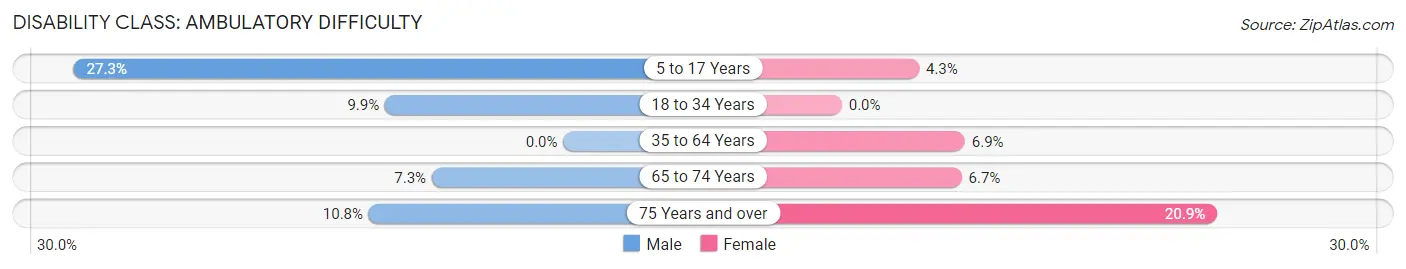
| Age Bracket | Male | Female |
| 5 to 17 Years | 21 (27.3%) | 8 (4.3%) |
| 18 to 34 Years | 15 (9.9%) | 0 (0.0%) |
| 35 to 64 Years | 0 (0.0%) | 30 (6.9%) |
| 65 to 74 Years | 12 (7.3%) | 13 (6.7%) |
| 75 Years and over | 13 (10.8%) | 28 (20.9%) |
Disability Class: Self-Care Difficulty
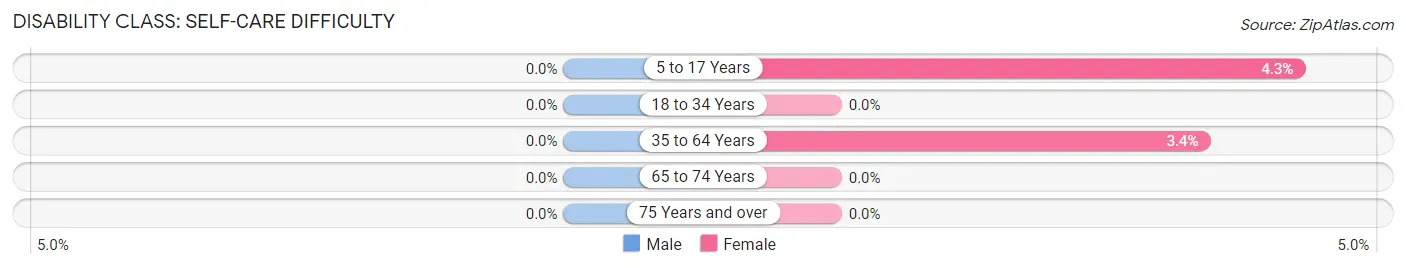
| Age Bracket | Male | Female |
| 5 to 17 Years | 0 (0.0%) | 8 (4.3%) |
| 18 to 34 Years | 0 (0.0%) | 0 (0.0%) |
| 35 to 64 Years | 0 (0.0%) | 15 (3.4%) |
| 65 to 74 Years | 0 (0.0%) | 0 (0.0%) |
| 75 Years and over | 0 (0.0%) | 0 (0.0%) |
Technology Access in North Falmouth
Computing Device Access in North Falmouth
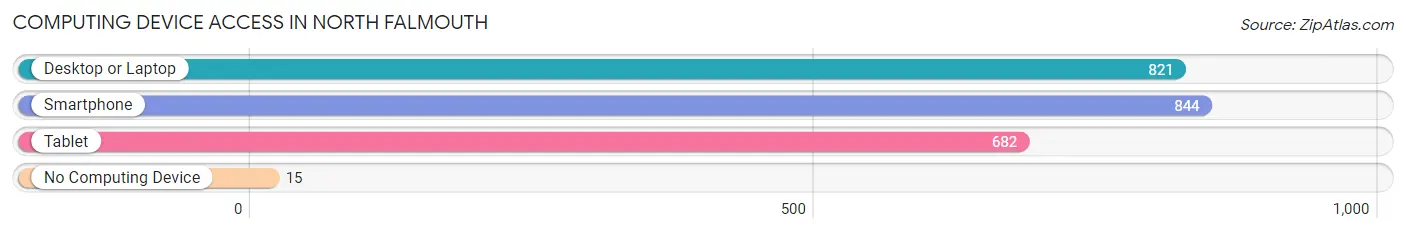
| Device Type | # Households | % Households |
| Desktop or Laptop | 821 | 89.5% |
| Smartphone | 844 | 92.0% |
| Tablet | 682 | 74.4% |
| No Computing Device | 15 | 1.6% |
| Total | 917 | 100.0% |
Internet Access in North Falmouth
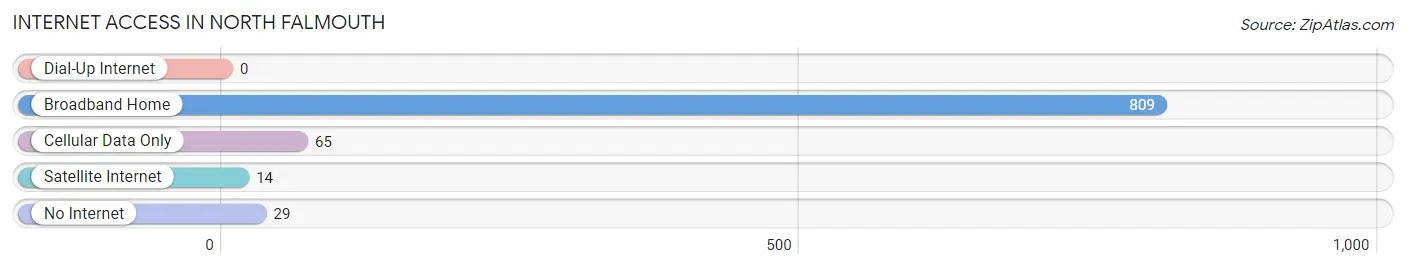
| Internet Type | # Households | % Households |
| Dial-Up Internet | 0 | 0.0% |
| Broadband Home | 809 | 88.2% |
| Cellular Data Only | 65 | 7.1% |
| Satellite Internet | 14 | 1.5% |
| No Internet | 29 | 3.2% |
| Total | 917 | 100.0% |
North Falmouth Summary
History
The area now known as North Falmouth, Massachusetts was first settled in 1660 by a group of English colonists. The area was originally part of the town of Falmouth, which was incorporated in 1686. In 1837, the town of North Falmouth was officially incorporated as a separate town.
The town of North Falmouth was originally a farming community, with many of the early settlers growing corn, wheat, and other crops. The town also had a thriving fishing industry, with many of the local fishermen catching cod, haddock, and other fish. In the late 19th century, the town began to develop as a summer resort destination, with many wealthy families from Boston and New York building large summer homes in the area.
In the early 20th century, the town of North Falmouth began to develop as a year-round community. The town was home to a number of small businesses, including a general store, a post office, a blacksmith shop, and a grist mill. The town also had a number of churches, including the North Falmouth Congregational Church, which was founded in 1837.
In the late 20th century, the town of North Falmouth began to experience a period of growth and development. The town was home to a number of new businesses, including a grocery store, a hardware store, and a number of restaurants. The town also had a number of new housing developments, which attracted many new residents to the area.
Geography
North Falmouth is located in Barnstable County, Massachusetts, on the northern tip of Cape Cod. The town is bordered by the towns of Falmouth to the south, Mashpee to the west, and Sandwich to the east. The town is located approximately 40 miles south of Boston and 25 miles east of Providence, Rhode Island.
The town of North Falmouth covers an area of approximately 10.5 square miles, with a population of approximately 8,000 people. The town is located on the shores of Buzzards Bay, with a number of small islands located off the coast. The town is also home to a number of small ponds and lakes, including Long Pond, Little Pond, and Great Pond.
Economy
The economy of North Falmouth is largely based on tourism and retail. The town is home to a number of small businesses, including restaurants, shops, and galleries. The town is also home to a number of marinas, which attract many visitors to the area.
The town is also home to a number of large employers, including the Falmouth Hospital, the Falmouth Public Schools, and the Falmouth Yacht Club. The town is also home to a number of small businesses, including a number of restaurants, shops, and galleries.
Demographics
As of the 2010 census, the population of North Falmouth was 8,000 people. The racial makeup of the town was 94.3% White, 1.7% African American, 0.3% Native American, 1.2% Asian, 0.1% Pacific Islander, 0.7% from other races, and 1.9% from two or more races. Hispanic or Latino of any race were 2.2% of the population.
The median household income in North Falmouth was $68,750, and the median family income was $77,500. The per capita income for the town was $35,000. About 5.2% of families and 7.2% of the population were below the poverty line, including 8.3% of those under age 18 and 4.2% of those age 65 or over.
Common Questions
What is Per Capita Income in North Falmouth?
Per Capita income in North Falmouth is $65,831.
What is the Median Family Income in North Falmouth?
Median Family Income in North Falmouth is $174,375.
What is the Median Household income in North Falmouth?
Median Household Income in North Falmouth is $129,421.
What is Income or Wage Gap in North Falmouth?
Income or Wage Gap in North Falmouth is 51.8%.
Women in North Falmouth earn 48.2 cents for every dollar earned by a man.
What is Inequality or Gini Index in North Falmouth?
Inequality or Gini Index in North Falmouth is 0.42.
What is the Total Population of North Falmouth?
Total Population of North Falmouth is 2,318.
What is the Total Male Population of North Falmouth?
Total Male Population of North Falmouth is 1,072.
What is the Total Female Population of North Falmouth?
Total Female Population of North Falmouth is 1,246.
What is the Ratio of Males per 100 Females in North Falmouth?
There are 86.04 Males per 100 Females in North Falmouth.
What is the Ratio of Females per 100 Males in North Falmouth?
There are 116.23 Females per 100 Males in North Falmouth.
What is the Median Population Age in North Falmouth?
Median Population Age in North Falmouth is 49.6 Years.
What is the Average Family Size in North Falmouth
Average Family Size in North Falmouth is 3.0 People.
What is the Average Household Size in North Falmouth
Average Household Size in North Falmouth is 2.4 People.
How Large is the Labor Force in North Falmouth?
There are 1,165 People in the Labor Forcein in North Falmouth.
What is the Percentage of People in the Labor Force in North Falmouth?
62.5% of People are in the Labor Force in North Falmouth.
What is the Unemployment Rate in North Falmouth?
Unemployment Rate in North Falmouth is 5.6%.