East Sandwich, MA Map & Demographics
East Sandwich Map
East Sandwich Overview
$53,024
PER CAPITA INCOME
$145,417
AVG FAMILY INCOME
$123,571
AVG HOUSEHOLD INCOME
1.6%
WAGE / INCOME GAP [ % ]
98.4¢/ $1
WAGE / INCOME GAP [ $ ]
$823
FAMILY INCOME DEFICIT
0.43
INEQUALITY / GINI INDEX
3,787
TOTAL POPULATION
1,853
MALE POPULATION
1,934
FEMALE POPULATION
95.81
MALES / 100 FEMALES
104.37
FEMALES / 100 MALES
55.6
MEDIAN AGE
3.0
AVG FAMILY SIZE
2.5
AVG HOUSEHOLD SIZE
1,682
LABOR FORCE [ PEOPLE ]
50.6%
PERCENT IN LABOR FORCE
3.4%
UNEMPLOYMENT RATE
East Sandwich Zip Codes
East Sandwich Area Codes
Income in East Sandwich
Income Overview in East Sandwich
Per Capita Income in East Sandwich is $53,024, while median incomes of families and households are $145,417 and $123,571 respectively.
| Characteristic | Number | Measure |
| Per Capita Income | 3,787 | $53,024 |
| Median Family Income | 1,123 | $145,417 |
| Mean Family Income | 1,123 | $151,079 |
| Median Household Income | 1,528 | $123,571 |
| Mean Household Income | 1,528 | $127,574 |
| Income Deficit | 1,123 | $823 |
| Wage / Income Gap (%) | 3,787 | 1.55% |
| Wage / Income Gap ($) | 3,787 | 98.45¢ per $1 |
| Gini / Inequality Index | 3,787 | 0.43 |
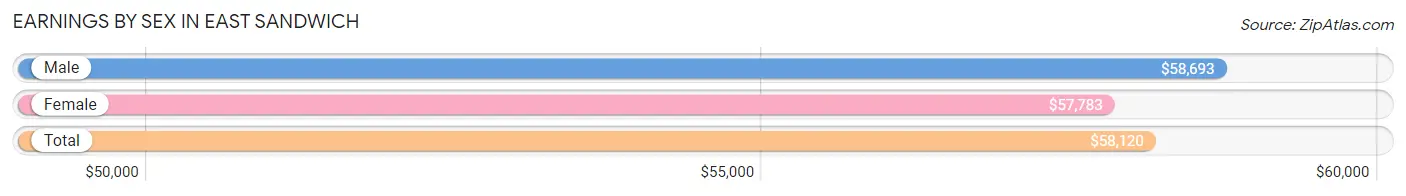
Earnings by Sex in East Sandwich
Average Earnings in East Sandwich are $58,120, $58,693 for men and $57,783 for women, a difference of 1.5%.
| Sex | Number | Average Earnings |
| Male | 1,024 (54.4%) | $58,693 |
| Female | 859 (45.6%) | $57,783 |
| Total | 1,883 (100.0%) | $58,120 |
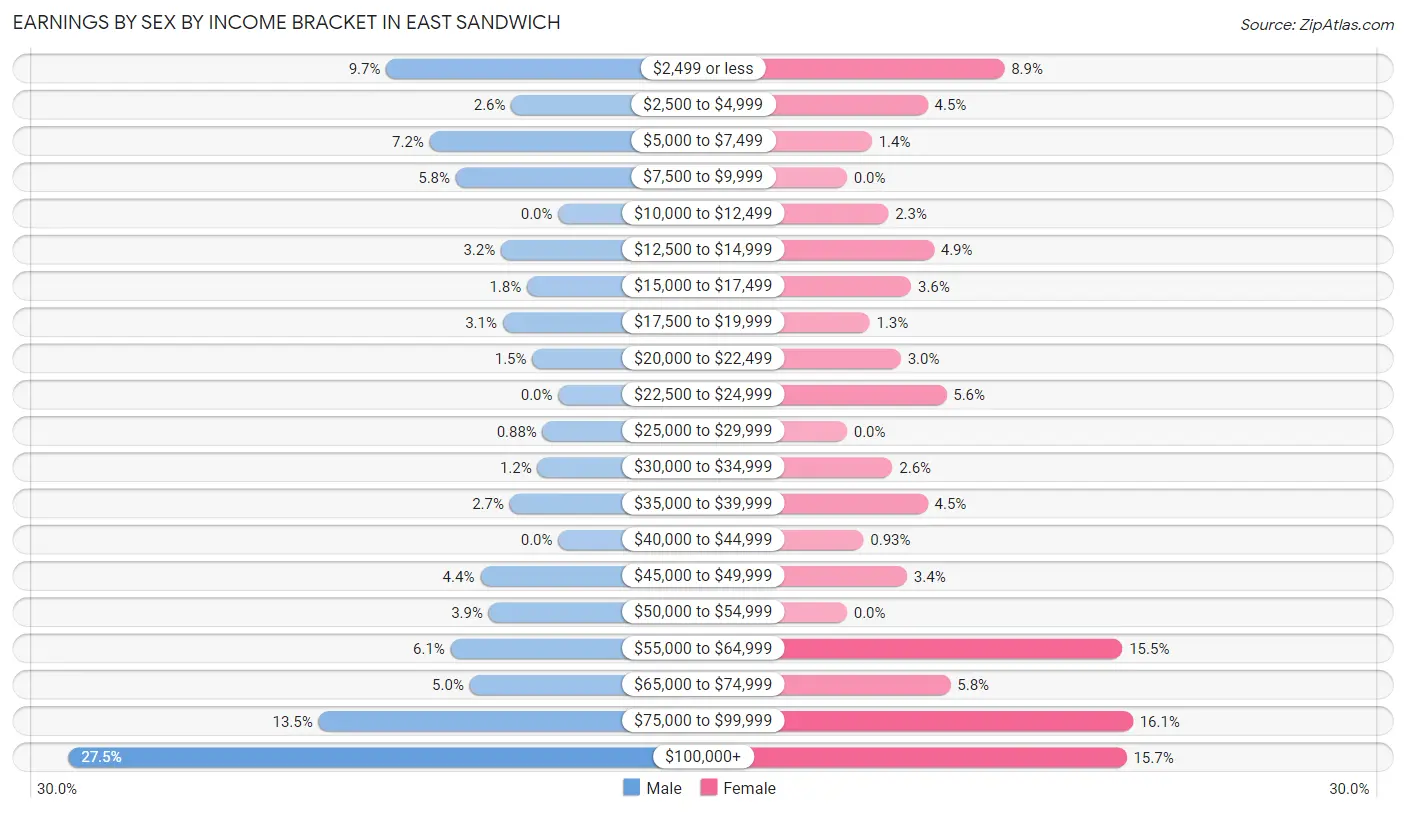
Earnings by Sex by Income Bracket in East Sandwich
The most common earnings brackets in East Sandwich are $100,000+ for men (282 | 27.5%) and $75,000 to $99,999 for women (138 | 16.1%).
| Income | Male | Female |
| $2,499 or less | 99 (9.7%) | 76 (8.8%) |
| $2,500 to $4,999 | 27 (2.6%) | 39 (4.5%) |
| $5,000 to $7,499 | 74 (7.2%) | 12 (1.4%) |
| $7,500 to $9,999 | 59 (5.8%) | 0 (0.0%) |
| $10,000 to $12,499 | 0 (0.0%) | 20 (2.3%) |
| $12,500 to $14,999 | 33 (3.2%) | 42 (4.9%) |
| $15,000 to $17,499 | 18 (1.8%) | 31 (3.6%) |
| $17,500 to $19,999 | 32 (3.1%) | 11 (1.3%) |
| $20,000 to $22,499 | 15 (1.5%) | 26 (3.0%) |
| $22,500 to $24,999 | 0 (0.0%) | 48 (5.6%) |
| $25,000 to $29,999 | 9 (0.9%) | 0 (0.0%) |
| $30,000 to $34,999 | 12 (1.2%) | 22 (2.6%) |
| $35,000 to $39,999 | 28 (2.7%) | 39 (4.5%) |
| $40,000 to $44,999 | 0 (0.0%) | 8 (0.9%) |
| $45,000 to $49,999 | 45 (4.4%) | 29 (3.4%) |
| $50,000 to $54,999 | 40 (3.9%) | 0 (0.0%) |
| $55,000 to $64,999 | 62 (6.0%) | 133 (15.5%) |
| $65,000 to $74,999 | 51 (5.0%) | 50 (5.8%) |
| $75,000 to $99,999 | 138 (13.5%) | 138 (16.1%) |
| $100,000+ | 282 (27.5%) | 135 (15.7%) |
| Total | 1,024 (100.0%) | 859 (100.0%) |
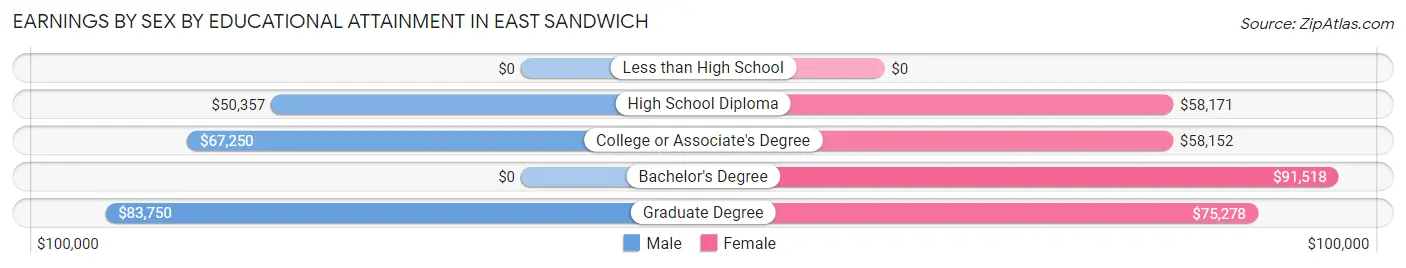
Earnings by Sex by Educational Attainment in East Sandwich
Average earnings in East Sandwich are $75,913 for men and $64,583 for women, a difference of 14.9%. Men with an educational attainment of graduate degree enjoy the highest average annual earnings of $83,750, while those with high school diploma education earn the least with $50,357. Women with an educational attainment of bachelor's degree earn the most with the average annual earnings of $91,518, while those with college or associate's degree education have the smallest earnings of $58,152.
| Educational Attainment | Male Income | Female Income |
| Less than High School | - | - |
| High School Diploma | $50,357 | $58,171 |
| College or Associate's Degree | $67,250 | $58,152 |
| Bachelor's Degree | - | - |
| Graduate Degree | $83,750 | $75,278 |
| Total | $75,913 | $64,583 |
Family Income in East Sandwich
Family Income Brackets in East Sandwich
According to the East Sandwich family income data, there are 326 families falling into the $200,000+ income range, which is the most common income bracket and makes up 29.0% of all families.
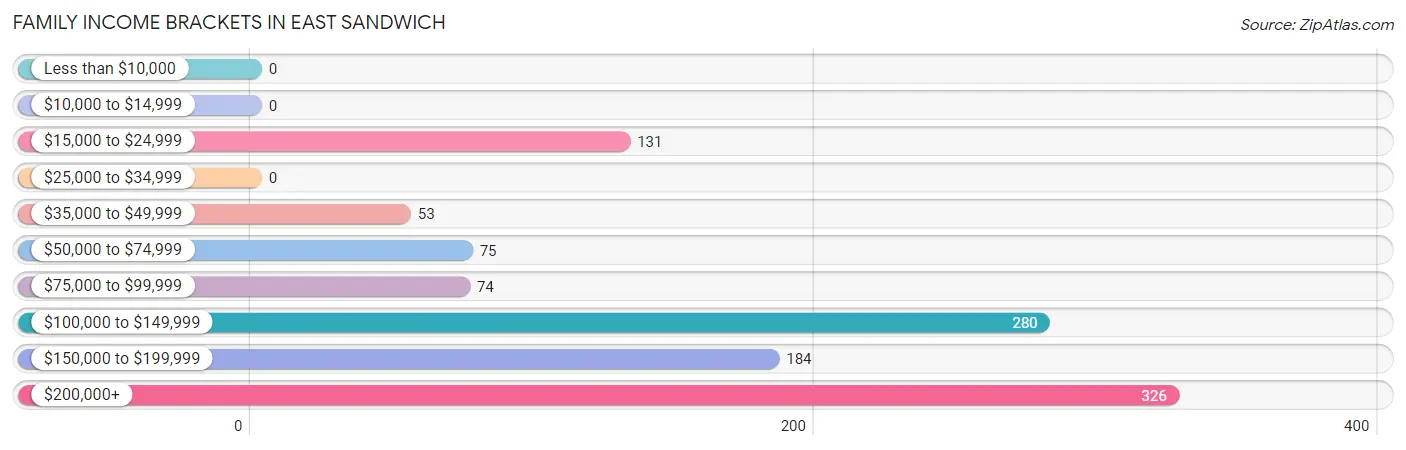
| Income Bracket | # Families | % Families |
| Less than $10,000 | 0 | 0.0% |
| $10,000 to $14,999 | 0 | 0.0% |
| $15,000 to $24,999 | 131 | 11.7% |
| $25,000 to $34,999 | 0 | 0.0% |
| $35,000 to $49,999 | 53 | 4.7% |
| $50,000 to $74,999 | 75 | 6.7% |
| $75,000 to $99,999 | 74 | 6.6% |
| $100,000 to $149,999 | 280 | 24.9% |
| $150,000 to $199,999 | 184 | 16.4% |
| $200,000+ | 326 | 29.0% |
Family Income by Famaliy Size in East Sandwich
4-person families (247 | 22.0%) account for the highest median family income in East Sandwich with $203,162 per family, while 3-person families (206 | 18.3%) have the highest median income of $54,167 per family member.
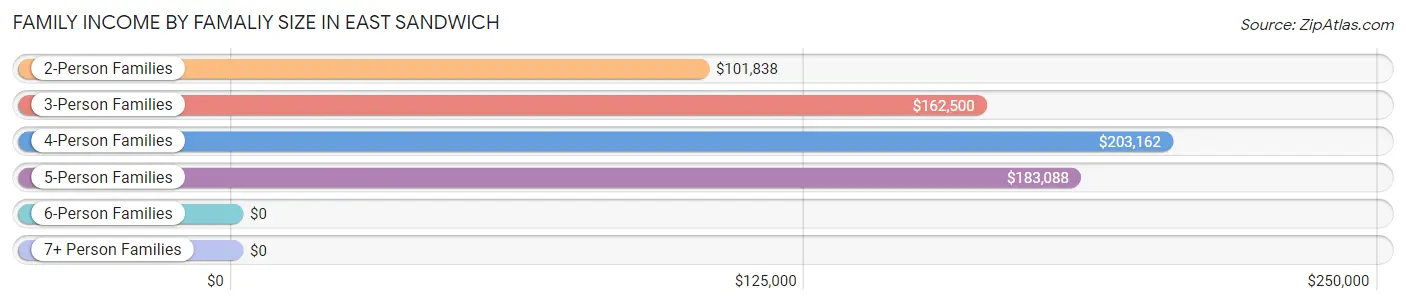
| Income Bracket | # Families | Median Income |
| 2-Person Families | 618 (55.0%) | $101,838 |
| 3-Person Families | 206 (18.3%) | $162,500 |
| 4-Person Families | 247 (22.0%) | $203,162 |
| 5-Person Families | 52 (4.6%) | $183,088 |
| 6-Person Families | 0 (0.0%) | $0 |
| 7+ Person Families | 0 (0.0%) | $0 |
| Total | 1,123 (100.0%) | $145,417 |
Family Income by Number of Earners in East Sandwich
The median family income in East Sandwich is $145,417, with families comprising 3+ earners (143) having the highest median family income of $210,139, while families with no earners (328) have the lowest median family income of $49,911, accounting for 12.7% and 29.2% of families, respectively.
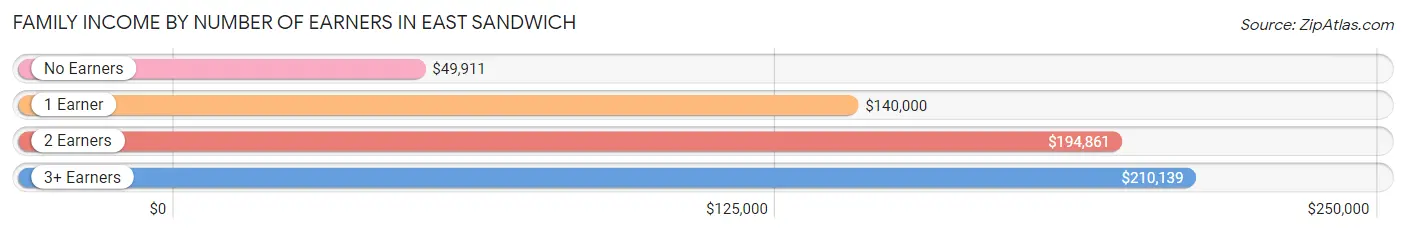
| Number of Earners | # Families | Median Income |
| No Earners | 328 (29.2%) | $49,911 |
| 1 Earner | 276 (24.6%) | $140,000 |
| 2 Earners | 376 (33.5%) | $194,861 |
| 3+ Earners | 143 (12.7%) | $210,139 |
| Total | 1,123 (100.0%) | $145,417 |
Household Income in East Sandwich
Household Income Brackets in East Sandwich
With 348 households falling in the category, the $200,000+ income range is the most frequent in East Sandwich, accounting for 22.8% of all households.
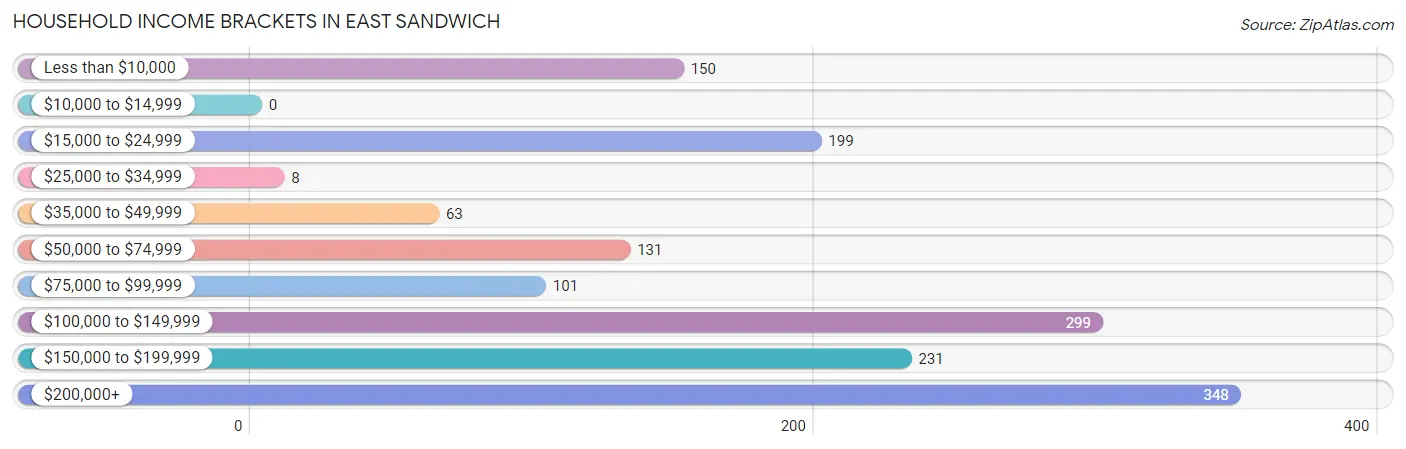
| Income Bracket | # Households | % Households |
| Less than $10,000 | 150 | 9.8% |
| $10,000 to $14,999 | 0 | 0.0% |
| $15,000 to $24,999 | 199 | 13.0% |
| $25,000 to $34,999 | 8 | 0.5% |
| $35,000 to $49,999 | 63 | 4.1% |
| $50,000 to $74,999 | 131 | 8.6% |
| $75,000 to $99,999 | 101 | 6.6% |
| $100,000 to $149,999 | 299 | 19.6% |
| $150,000 to $199,999 | 231 | 15.1% |
| $200,000+ | 348 | 22.8% |
Household Income by Householder Age in East Sandwich
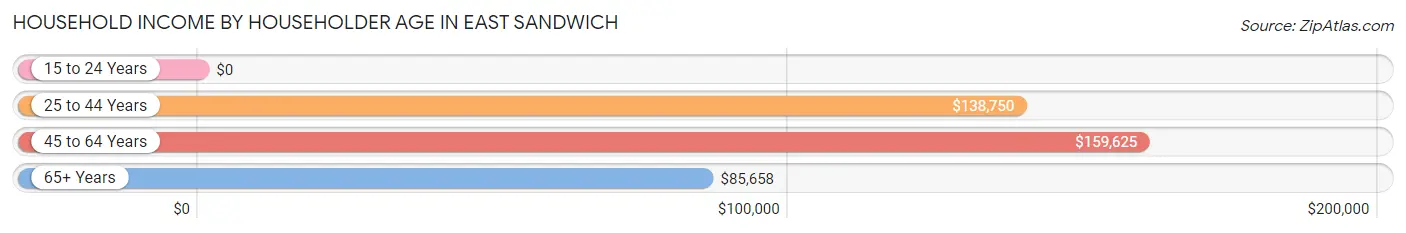
The median household income in East Sandwich is $123,571, with the highest median household income of $159,625 found in the 45 to 64 years age bracket for the primary householder. A total of 579 households (37.9%) fall into this category. Meanwhile, the 15 to 24 years age bracket for the primary householder has the lowest median household income of $0, with 13 households (0.9%) in this group.
| Income Bracket | # Households | Median Income |
| 15 to 24 Years | 13 (0.9%) | $0 |
| 25 to 44 Years | 130 (8.5%) | $138,750 |
| 45 to 64 Years | 579 (37.9%) | $159,625 |
| 65+ Years | 806 (52.7%) | $85,658 |
| Total | 1,528 (100.0%) | $123,571 |
Poverty in East Sandwich
Income Below Poverty by Sex and Age in East Sandwich
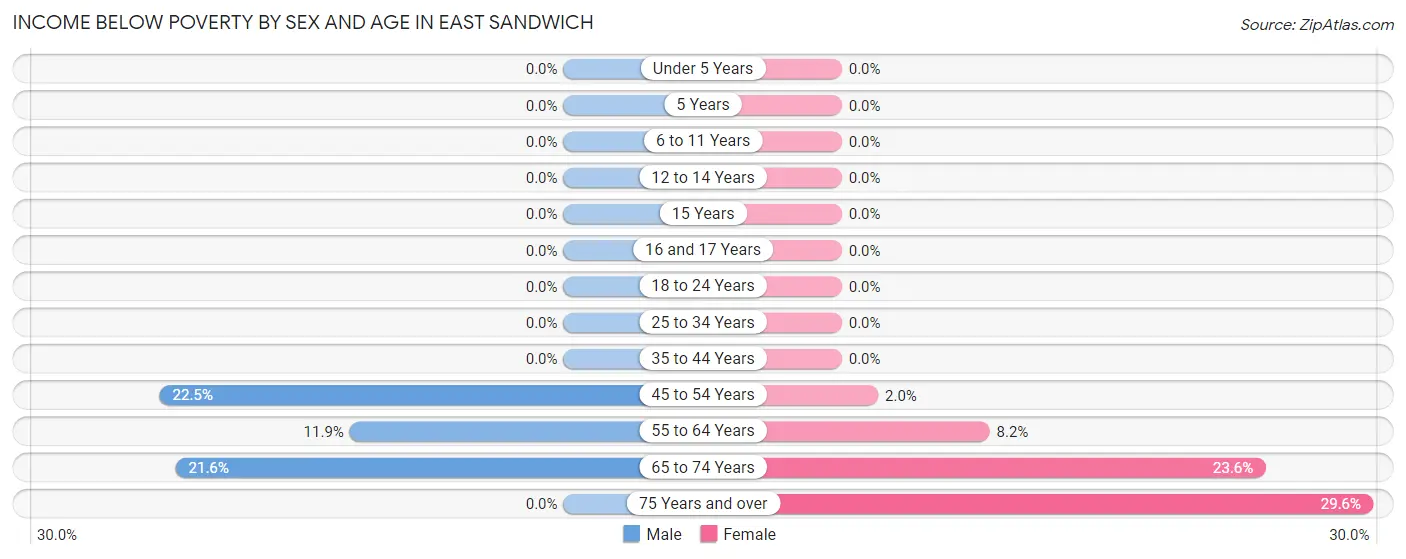
With 10.7% poverty level for males and 11.3% for females among the residents of East Sandwich, 45 to 54 year old males and 75 year old and over females are the most vulnerable to poverty, with 67 males (22.5%) and 68 females (29.6%) in their respective age groups living below the poverty level.
| Age Bracket | Male | Female |
| Under 5 Years | 0 (0.0%) | 0 (0.0%) |
| 5 Years | 0 (0.0%) | 0 (0.0%) |
| 6 to 11 Years | 0 (0.0%) | 0 (0.0%) |
| 12 to 14 Years | 0 (0.0%) | 0 (0.0%) |
| 15 Years | 0 (0.0%) | 0 (0.0%) |
| 16 and 17 Years | 0 (0.0%) | 0 (0.0%) |
| 18 to 24 Years | 0 (0.0%) | 0 (0.0%) |
| 25 to 34 Years | 0 (0.0%) | 0 (0.0%) |
| 35 to 44 Years | 0 (0.0%) | 0 (0.0%) |
| 45 to 54 Years | 67 (22.5%) | 6 (2.0%) |
| 55 to 64 Years | 32 (11.9%) | 20 (8.2%) |
| 65 to 74 Years | 98 (21.6%) | 124 (23.6%) |
| 75 Years and over | 0 (0.0%) | 68 (29.6%) |
| Total | 197 (10.7%) | 218 (11.3%) |
Income Above Poverty by Sex and Age in East Sandwich
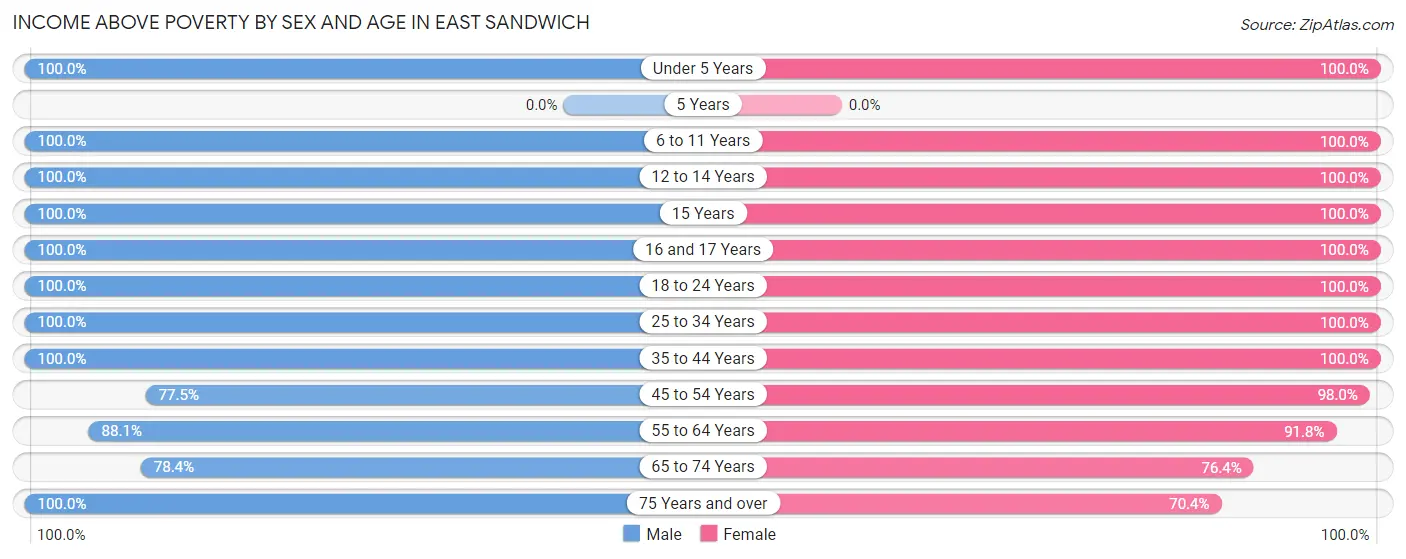
According to the poverty statistics in East Sandwich, males aged under 5 years and females aged under 5 years are the age groups that are most secure financially, with 100.0% of males and 100.0% of females in these age groups living above the poverty line.
| Age Bracket | Male | Female |
| Under 5 Years | 46 (100.0%) | 56 (100.0%) |
| 5 Years | 0 (0.0%) | 0 (0.0%) |
| 6 to 11 Years | 56 (100.0%) | 84 (100.0%) |
| 12 to 14 Years | 43 (100.0%) | 52 (100.0%) |
| 15 Years | 56 (100.0%) | 70 (100.0%) |
| 16 and 17 Years | 27 (100.0%) | 36 (100.0%) |
| 18 to 24 Years | 183 (100.0%) | 168 (100.0%) |
| 25 to 34 Years | 110 (100.0%) | 26 (100.0%) |
| 35 to 44 Years | 117 (100.0%) | 137 (100.0%) |
| 45 to 54 Years | 231 (77.5%) | 291 (98.0%) |
| 55 to 64 Years | 237 (88.1%) | 223 (91.8%) |
| 65 to 74 Years | 356 (78.4%) | 402 (76.4%) |
| 75 Years and over | 185 (100.0%) | 162 (70.4%) |
| Total | 1,647 (89.3%) | 1,707 (88.7%) |
Income Below Poverty Among Married-Couple Families in East Sandwich
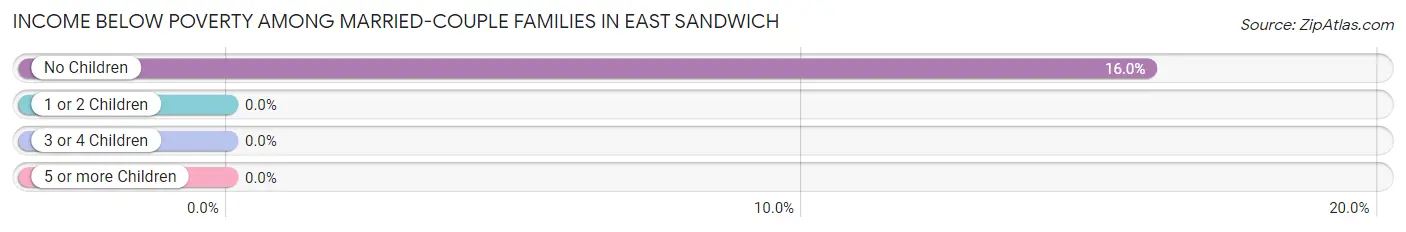
The poverty statistics for married-couple families in East Sandwich show that 12.2% or 120 of the total 987 families live below the poverty line. Families with no children have the highest poverty rate of 16.0%, comprising of 120 families. On the other hand, families with 1 or 2 children have the lowest poverty rate of 0.0%, which includes 0 families.
| Children | Above Poverty | Below Poverty |
| No Children | 630 (84.0%) | 120 (16.0%) |
| 1 or 2 Children | 219 (100.0%) | 0 (0.0%) |
| 3 or 4 Children | 18 (100.0%) | 0 (0.0%) |
| 5 or more Children | 0 (0.0%) | 0 (0.0%) |
| Total | 867 (87.8%) | 120 (12.2%) |
Income Below Poverty Among Single-Parent Households in East Sandwich
| Children | Single Father | Single Mother |
| No Children | 0 (0.0%) | 0 (0.0%) |
| 1 or 2 Children | 0 (0.0%) | 0 (0.0%) |
| 3 or 4 Children | 0 (0.0%) | 0 (0.0%) |
| 5 or more Children | 0 (0.0%) | 0 (0.0%) |
| Total | 0 (0.0%) | 0 (0.0%) |
Income Below Poverty Among Married-Couple vs Single-Parent Households in East Sandwich
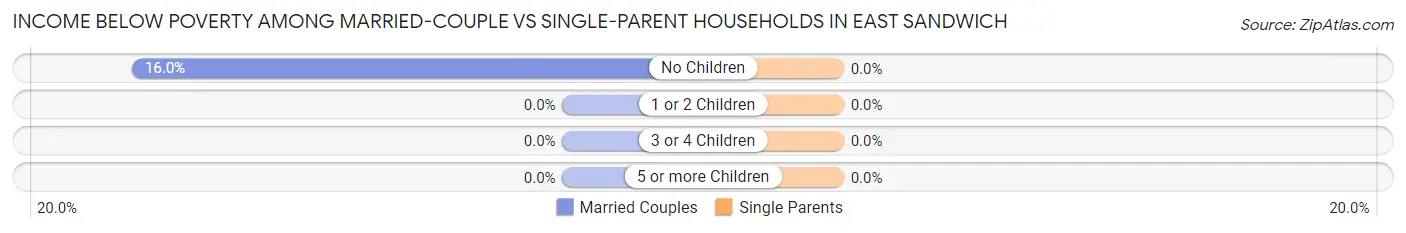
| Children | Married-Couple Families | Single-Parent Households |
| No Children | 120 (16.0%) | 0 (0.0%) |
| 1 or 2 Children | 0 (0.0%) | 0 (0.0%) |
| 3 or 4 Children | 0 (0.0%) | 0 (0.0%) |
| 5 or more Children | 0 (0.0%) | 0 (0.0%) |
| Total | 120 (12.2%) | 0 (0.0%) |
Race in East Sandwich
The most populous races in East Sandwich are White / Caucasian (3,643 | 96.2%), Asian (61 | 1.6%), and Two or more Races (59 | 1.6%).
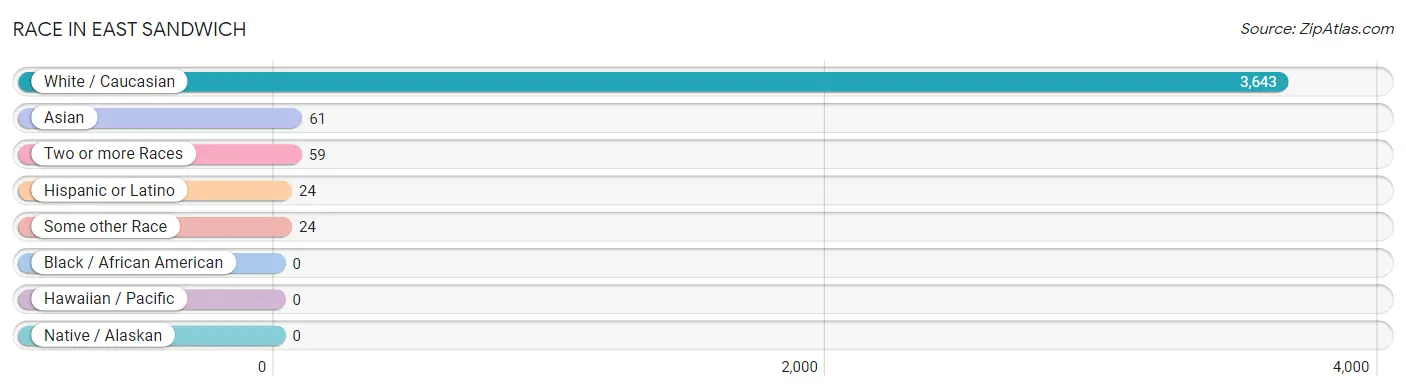
| Race | # Population | % Population |
| Asian | 61 | 1.6% |
| Black / African American | 0 | 0.0% |
| Hawaiian / Pacific | 0 | 0.0% |
| Hispanic or Latino | 24 | 0.6% |
| Native / Alaskan | 0 | 0.0% |
| White / Caucasian | 3,643 | 96.2% |
| Two or more Races | 59 | 1.6% |
| Some other Race | 24 | 0.6% |
| Total | 3,787 | 100.0% |
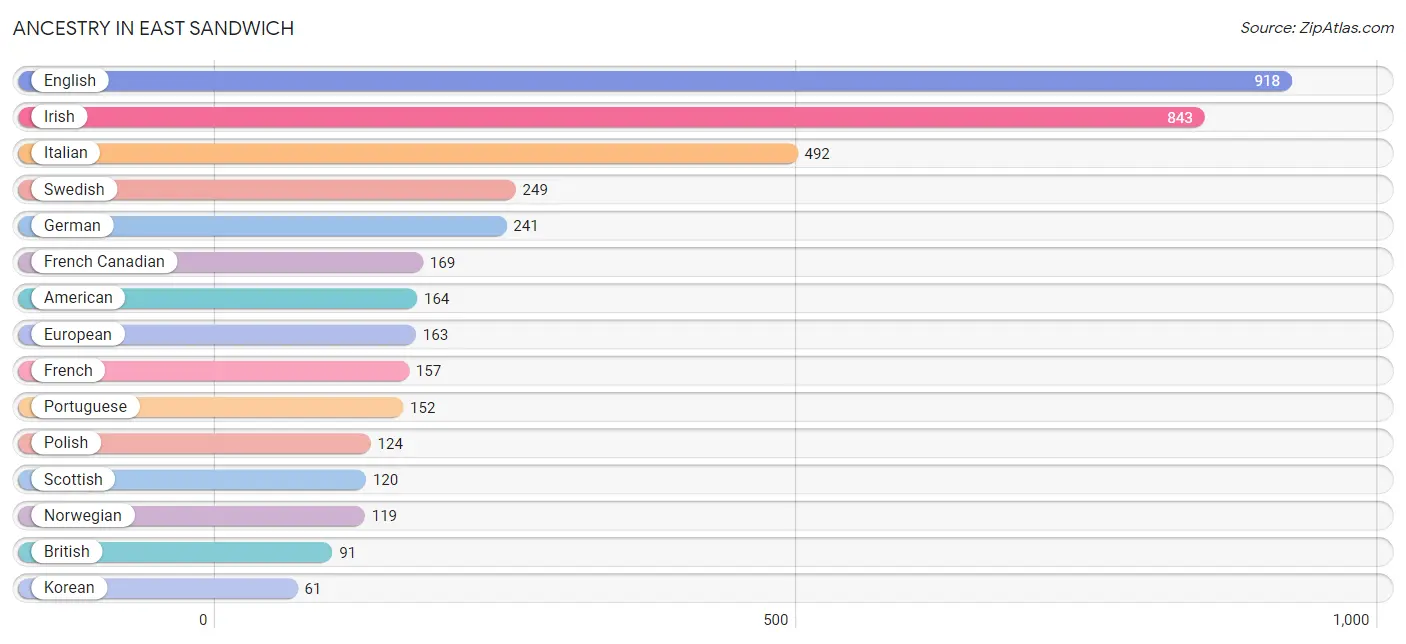
Ancestry in East Sandwich
The most populous ancestries reported in East Sandwich are English (918 | 24.2%), Irish (843 | 22.3%), Italian (492 | 13.0%), Swedish (249 | 6.6%), and German (241 | 6.4%), together accounting for 72.4% of all East Sandwich residents.
| Ancestry | # Population | % Population |
| American | 164 | 4.3% |
| Arab | 18 | 0.5% |
| Armenian | 9 | 0.2% |
| Austrian | 37 | 1.0% |
| Belgian | 18 | 0.5% |
| Brazilian | 59 | 1.6% |
| British | 91 | 2.4% |
| Celtic | 8 | 0.2% |
| Cuban | 10 | 0.3% |
| Czech | 9 | 0.2% |
| Czechoslovakian | 6 | 0.2% |
| Danish | 8 | 0.2% |
| Dominican | 5 | 0.1% |
| Dutch | 26 | 0.7% |
| English | 918 | 24.2% |
| European | 163 | 4.3% |
| Finnish | 7 | 0.2% |
| French | 157 | 4.2% |
| French Canadian | 169 | 4.5% |
| German | 241 | 6.4% |
| Greek | 10 | 0.3% |
| Irish | 843 | 22.3% |
| Italian | 492 | 13.0% |
| Korean | 61 | 1.6% |
| Lebanese | 18 | 0.5% |
| Lithuanian | 6 | 0.2% |
| Mexican | 9 | 0.2% |
| Norwegian | 119 | 3.1% |
| Polish | 124 | 3.3% |
| Portuguese | 152 | 4.0% |
| Russian | 51 | 1.3% |
| Scotch-Irish | 28 | 0.7% |
| Scottish | 120 | 3.2% |
| Swedish | 249 | 6.6% |
| Swiss | 9 | 0.2% |
| Ukrainian | 61 | 1.6% |
| Welsh | 11 | 0.3% | View All 37 Rows |
Immigrants in East Sandwich
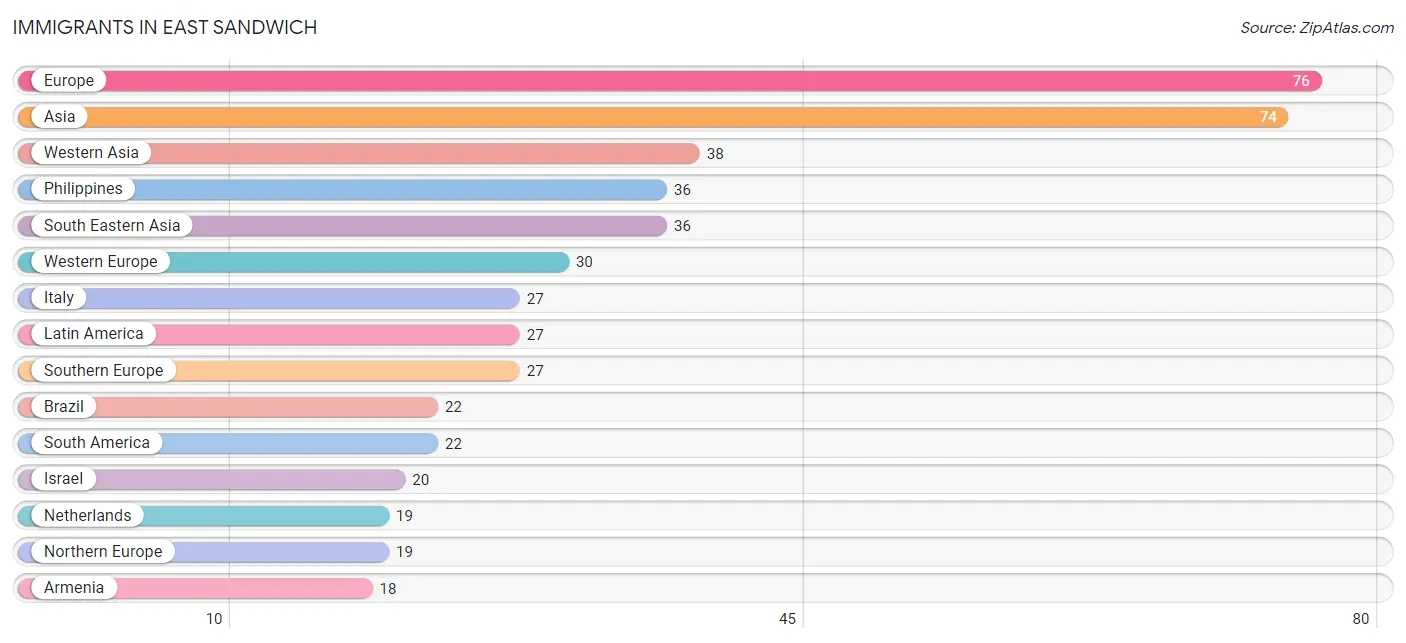
The most numerous immigrant groups reported in East Sandwich came from Europe (76 | 2.0%), Asia (74 | 1.9%), Western Asia (38 | 1.0%), Philippines (36 | 0.9%), and South Eastern Asia (36 | 0.9%), together accounting for 6.9% of all East Sandwich residents.
| Immigration Origin | # Population | % Population |
| Armenia | 18 | 0.5% |
| Asia | 74 | 1.9% |
| Belgium | 11 | 0.3% |
| Brazil | 22 | 0.6% |
| Caribbean | 5 | 0.1% |
| Dominican Republic | 5 | 0.1% |
| England | 6 | 0.2% |
| Europe | 76 | 2.0% |
| Ireland | 5 | 0.1% |
| Israel | 20 | 0.5% |
| Italy | 27 | 0.7% |
| Latin America | 27 | 0.7% |
| Netherlands | 19 | 0.5% |
| Northern Europe | 19 | 0.5% |
| Philippines | 36 | 0.9% |
| South America | 22 | 0.6% |
| South Eastern Asia | 36 | 0.9% |
| Southern Europe | 27 | 0.7% |
| Western Asia | 38 | 1.0% |
| Western Europe | 30 | 0.8% | View All 20 Rows |
Sex and Age in East Sandwich
Sex and Age in East Sandwich
The most populous age groups in East Sandwich are 70 to 74 Years (289 | 15.6%) for men and 70 to 74 Years (273 | 14.1%) for women.
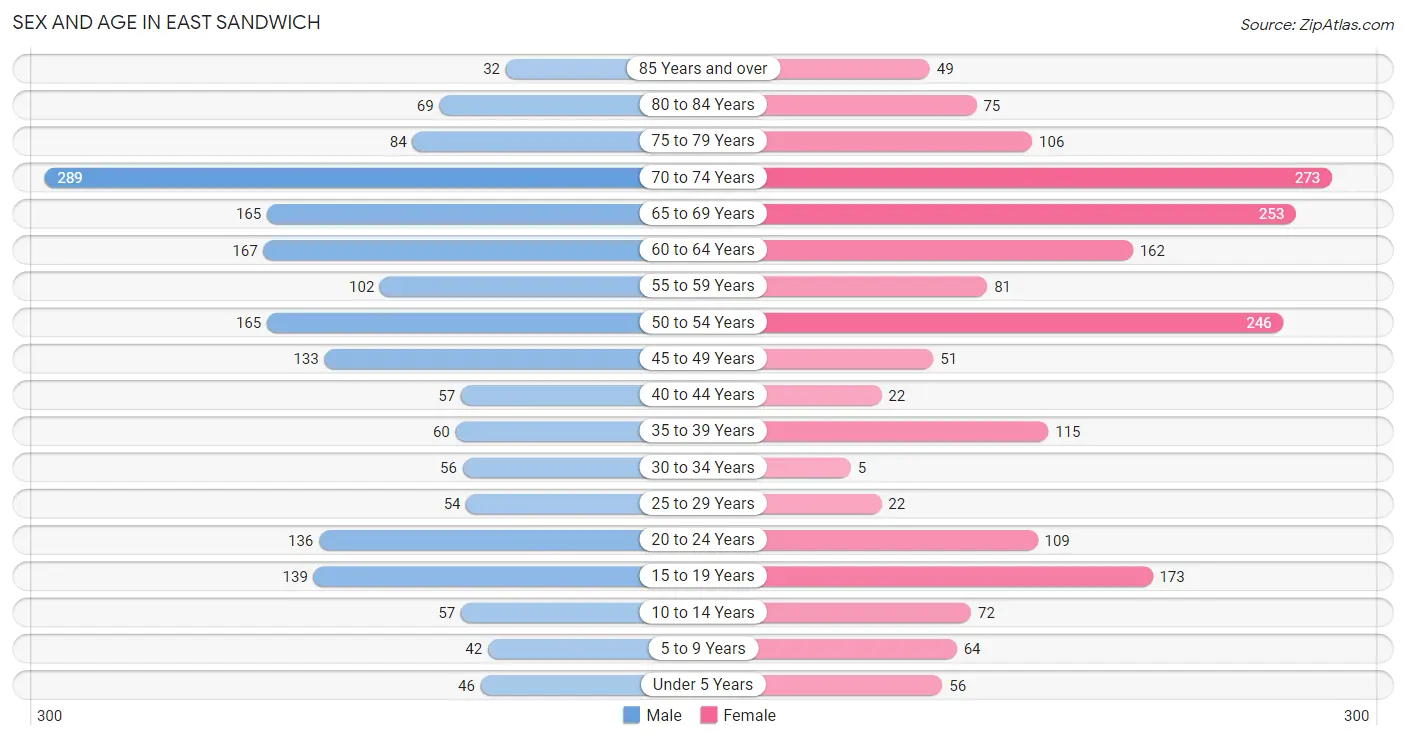
| Age Bracket | Male | Female |
| Under 5 Years | 46 (2.5%) | 56 (2.9%) |
| 5 to 9 Years | 42 (2.3%) | 64 (3.3%) |
| 10 to 14 Years | 57 (3.1%) | 72 (3.7%) |
| 15 to 19 Years | 139 (7.5%) | 173 (8.9%) |
| 20 to 24 Years | 136 (7.3%) | 109 (5.6%) |
| 25 to 29 Years | 54 (2.9%) | 22 (1.1%) |
| 30 to 34 Years | 56 (3.0%) | 5 (0.3%) |
| 35 to 39 Years | 60 (3.2%) | 115 (5.9%) |
| 40 to 44 Years | 57 (3.1%) | 22 (1.1%) |
| 45 to 49 Years | 133 (7.2%) | 51 (2.6%) |
| 50 to 54 Years | 165 (8.9%) | 246 (12.7%) |
| 55 to 59 Years | 102 (5.5%) | 81 (4.2%) |
| 60 to 64 Years | 167 (9.0%) | 162 (8.4%) |
| 65 to 69 Years | 165 (8.9%) | 253 (13.1%) |
| 70 to 74 Years | 289 (15.6%) | 273 (14.1%) |
| 75 to 79 Years | 84 (4.5%) | 106 (5.5%) |
| 80 to 84 Years | 69 (3.7%) | 75 (3.9%) |
| 85 Years and over | 32 (1.7%) | 49 (2.5%) |
| Total | 1,853 (100.0%) | 1,934 (100.0%) |
Families and Households in East Sandwich
Median Family Size in East Sandwich
The median family size in East Sandwich is 2.95 persons per family, with single female/mother families (95 | 8.5%) accounting for the largest median family size of 3.11 persons per family. On the other hand, single male/father families (41 | 3.6%) represent the smallest median family size with 2.88 persons per family.
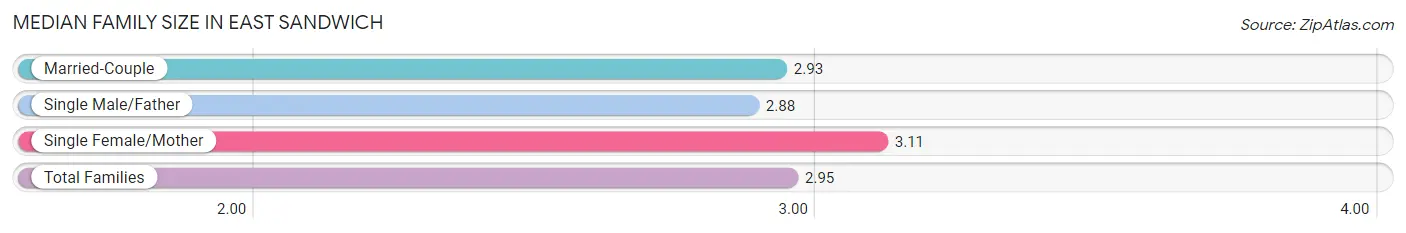
| Family Type | # Families | Family Size |
| Married-Couple | 987 (87.9%) | 2.93 |
| Single Male/Father | 41 (3.6%) | 2.88 |
| Single Female/Mother | 95 (8.5%) | 3.11 |
| Total Families | 1,123 (100.0%) | 2.95 |
Median Household Size in East Sandwich
The median household size in East Sandwich is 2.47 persons per household, with single male/father households (41 | 2.7%) accounting for the largest median household size of 3.15 persons per household. non-family households (405 | 26.5%) represent the smallest median household size with 1.05 persons per household.
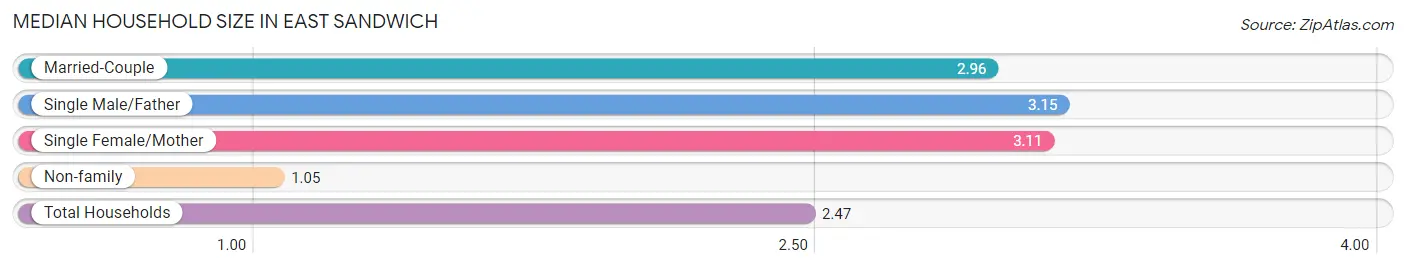
| Household Type | # Households | Household Size |
| Married-Couple | 987 (64.6%) | 2.96 |
| Single Male/Father | 41 (2.7%) | 3.15 |
| Single Female/Mother | 95 (6.2%) | 3.11 |
| Non-family | 405 (26.5%) | 1.05 |
| Total Households | 1,528 (100.0%) | 2.47 |
Household Size by Marriage Status in East Sandwich
Out of a total of 1,528 households in East Sandwich, 1,123 (73.5%) are family households, while 405 (26.5%) are nonfamily households. The most numerous type of family households are 2-person households, comprising 618, and the most common type of nonfamily households are 1-person households, comprising 384.
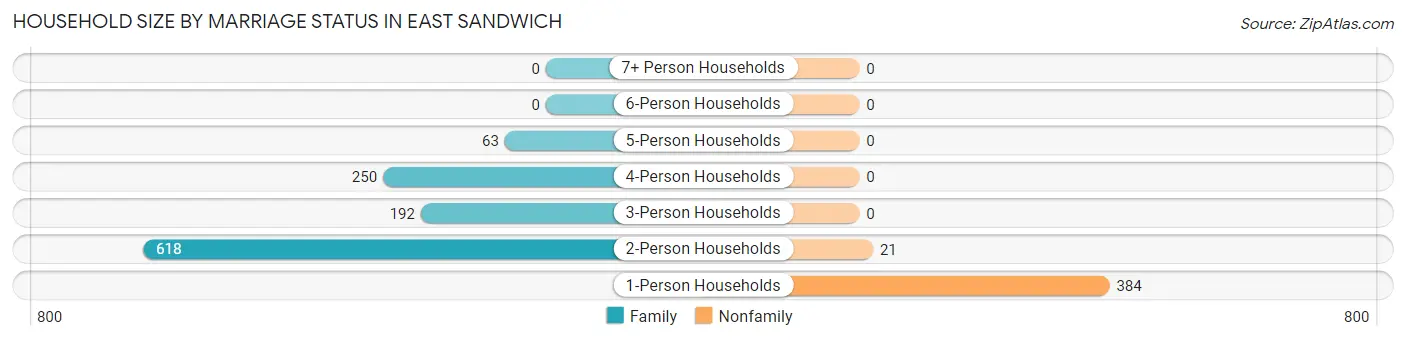
| Household Size | Family Households | Nonfamily Households |
| 1-Person Households | - | 384 (25.1%) |
| 2-Person Households | 618 (40.5%) | 21 (1.4%) |
| 3-Person Households | 192 (12.6%) | 0 (0.0%) |
| 4-Person Households | 250 (16.4%) | 0 (0.0%) |
| 5-Person Households | 63 (4.1%) | 0 (0.0%) |
| 6-Person Households | 0 (0.0%) | 0 (0.0%) |
| 7+ Person Households | 0 (0.0%) | 0 (0.0%) |
| Total | 1,123 (73.5%) | 405 (26.5%) |
Female Fertility in East Sandwich
Fertility by Age in East Sandwich
Average fertility rate in East Sandwich is 61.0 births per 1,000 women. Women in the age bracket of 20 to 34 years have the highest fertility rate with 132.0 births per 1,000 women. Women in the age bracket of 20 to 34 years acount for 51.4% of all women with births.
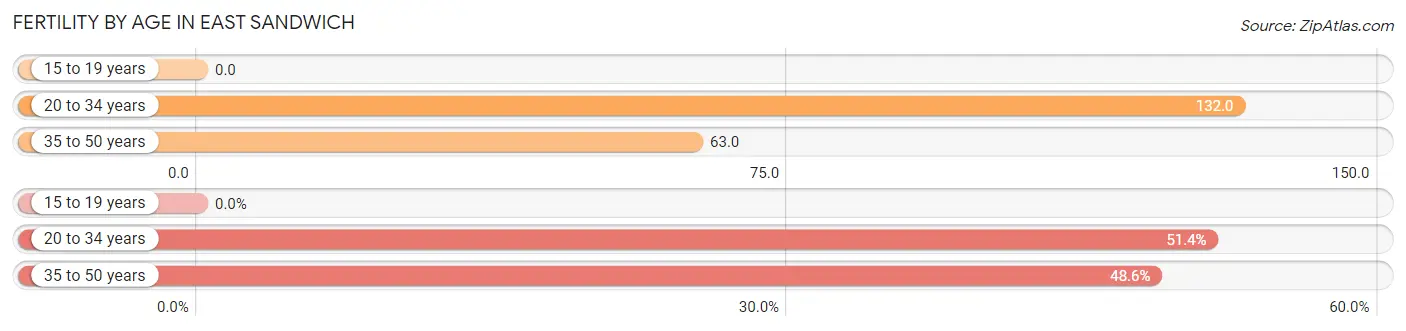
| Age Bracket | Women with Births | Births / 1,000 Women |
| 15 to 19 years | 0 (0.0%) | 0.0 |
| 20 to 34 years | 18 (51.4%) | 132.0 |
| 35 to 50 years | 17 (48.6%) | 63.0 |
| Total | 35 (100.0%) | 61.0 |
Fertility by Age by Marriage Status in East Sandwich
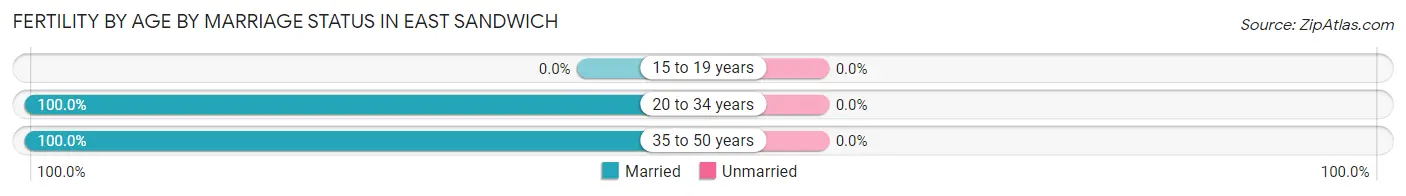
| Age Bracket | Married | Unmarried |
| 15 to 19 years | 0 (0.0%) | 0 (0.0%) |
| 20 to 34 years | 18 (100.0%) | 0 (0.0%) |
| 35 to 50 years | 17 (100.0%) | 0 (0.0%) |
| Total | 35 (100.0%) | 0 (0.0%) |
Fertility by Education in East Sandwich
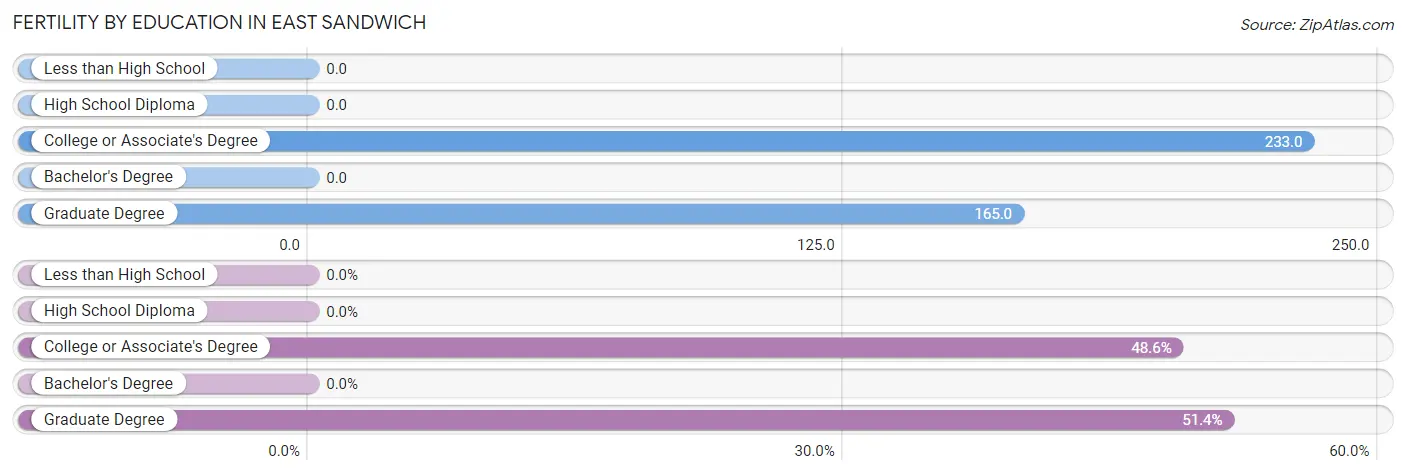
| Educational Attainment | Women with Births | Births / 1,000 Women |
| Less than High School | 0 (0.0%) | 0.0 |
| High School Diploma | 0 (0.0%) | 0.0 |
| College or Associate's Degree | 17 (48.6%) | 233.0 |
| Bachelor's Degree | 0 (0.0%) | 0.0 |
| Graduate Degree | 18 (51.4%) | 165.0 |
| Total | 35 (100.0%) | 61.0 |
Fertility by Education by Marriage Status in East Sandwich
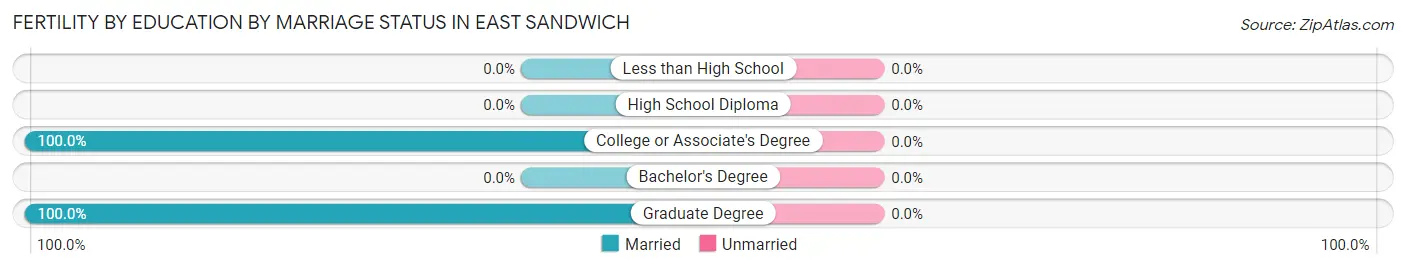
| Educational Attainment | Married | Unmarried |
| Less than High School | 0 (0.0%) | 0 (0.0%) |
| High School Diploma | 0 (0.0%) | 0 (0.0%) |
| College or Associate's Degree | 17 (100.0%) | 0 (0.0%) |
| Bachelor's Degree | 0 (0.0%) | 0 (0.0%) |
| Graduate Degree | 18 (100.0%) | 0 (0.0%) |
| Total | 35 (100.0%) | 0 (0.0%) |
Employment Characteristics in East Sandwich
Employment by Class of Employer in East Sandwich
Among the 1,615 employed individuals in East Sandwich, private company employees (911 | 56.4%), local government employees (250 | 15.5%), and not-for-profit organizations (163 | 10.1%) make up the most common classes of employment.
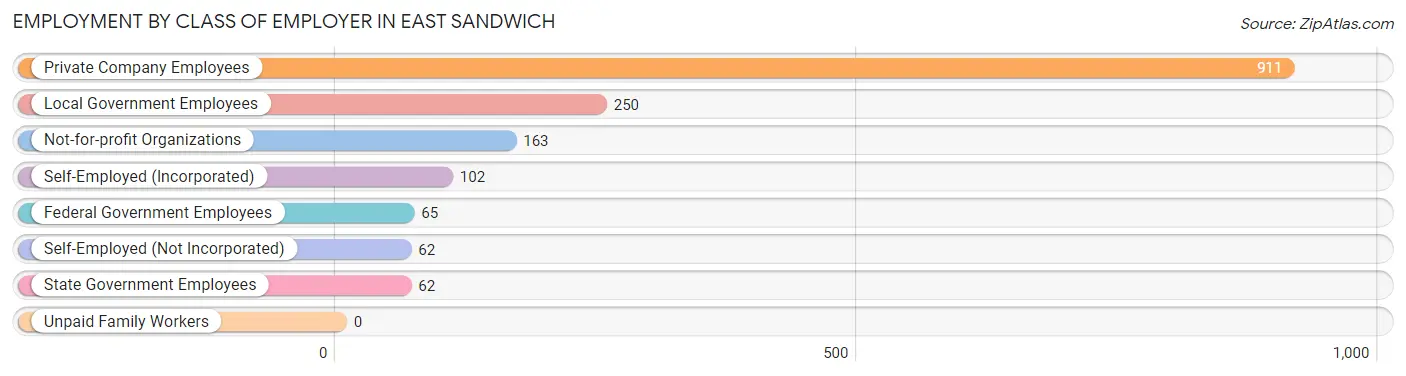
| Employer Class | # Employees | % Employees |
| Private Company Employees | 911 | 56.4% |
| Self-Employed (Incorporated) | 102 | 6.3% |
| Self-Employed (Not Incorporated) | 62 | 3.8% |
| Not-for-profit Organizations | 163 | 10.1% |
| Local Government Employees | 250 | 15.5% |
| State Government Employees | 62 | 3.8% |
| Federal Government Employees | 65 | 4.0% |
| Unpaid Family Workers | 0 | 0.0% |
| Total | 1,615 | 100.0% |
Employment Status by Age in East Sandwich
According to the labor force statistics for East Sandwich, out of the total population over 16 years of age (3,324), 50.6% or 1,682 individuals are in the labor force, with 3.4% or 57 of them unemployed. The age group with the highest labor force participation rate is 30 to 34 years, with 100.0% or 61 individuals in the labor force. Within the labor force, the 60 to 64 years age range has the highest percentage of unemployed individuals, with 16.0% or 31 of them being unemployed.
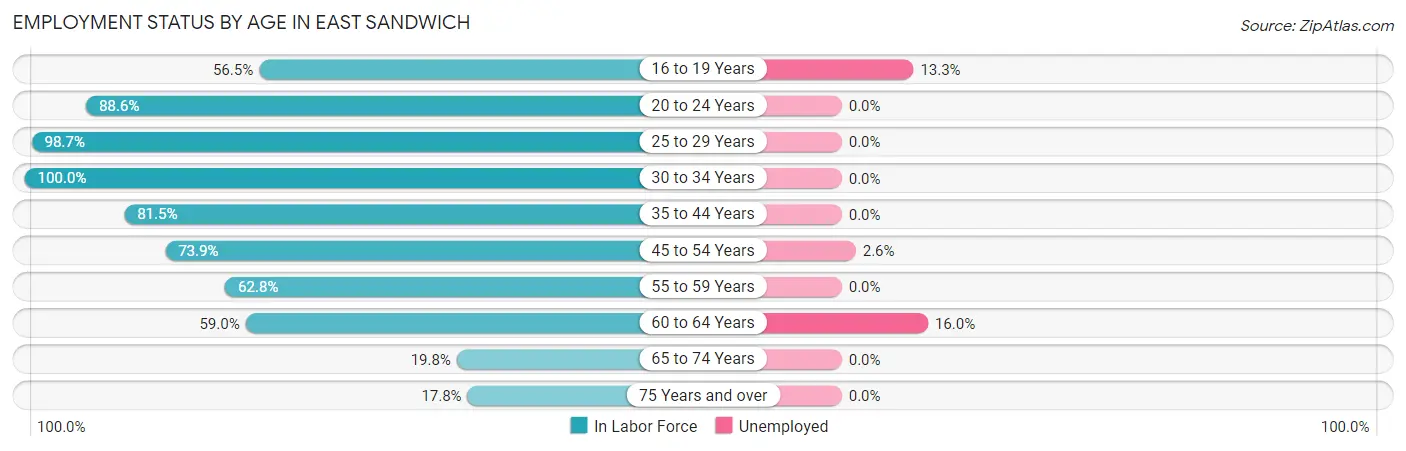
| Age Bracket | In Labor Force | Unemployed |
| 16 to 19 Years | 105 (56.5%) | 14 (13.3%) |
| 20 to 24 Years | 217 (88.6%) | 0 (0.0%) |
| 25 to 29 Years | 75 (98.7%) | 0 (0.0%) |
| 30 to 34 Years | 61 (100.0%) | 0 (0.0%) |
| 35 to 44 Years | 207 (81.5%) | 0 (0.0%) |
| 45 to 54 Years | 440 (73.9%) | 11 (2.6%) |
| 55 to 59 Years | 115 (62.8%) | 0 (0.0%) |
| 60 to 64 Years | 194 (59.0%) | 31 (16.0%) |
| 65 to 74 Years | 194 (19.8%) | 0 (0.0%) |
| 75 Years and over | 74 (17.8%) | 0 (0.0%) |
| Total | 1,682 (50.6%) | 57 (3.4%) |
Employment Status by Educational Attainment in East Sandwich
According to labor force statistics for East Sandwich, 72.9% of individuals (1,092) out of the total population between 25 and 64 years of age (1,498) are in the labor force, with 3.9% or 43 of them being unemployed. The group with the highest labor force participation rate are those with the educational attainment of bachelor's degree or higher, with 78.8% or 765 individuals in the labor force. Within the labor force, individuals with college / associate degree education have the highest percentage of unemployment, with 18.8% or 34 of them being unemployed.
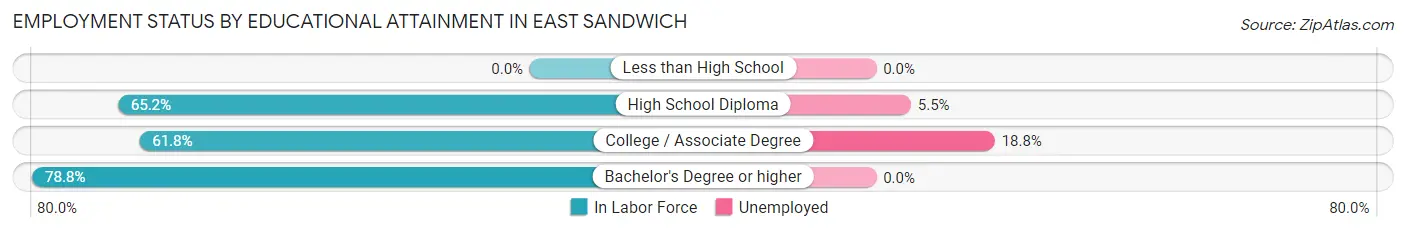
| Educational Attainment | In Labor Force | Unemployed |
| Less than High School | 0 (0.0%) | 0 (0.0%) |
| High School Diploma | 146 (65.2%) | 12 (5.5%) |
| College / Associate Degree | 181 (61.8%) | 55 (18.8%) |
| Bachelor's Degree or higher | 765 (78.8%) | 0 (0.0%) |
| Total | 1,092 (72.9%) | 58 (3.9%) |
Employment Occupations by Sex in East Sandwich
Management, Business, Science and Arts Occupations
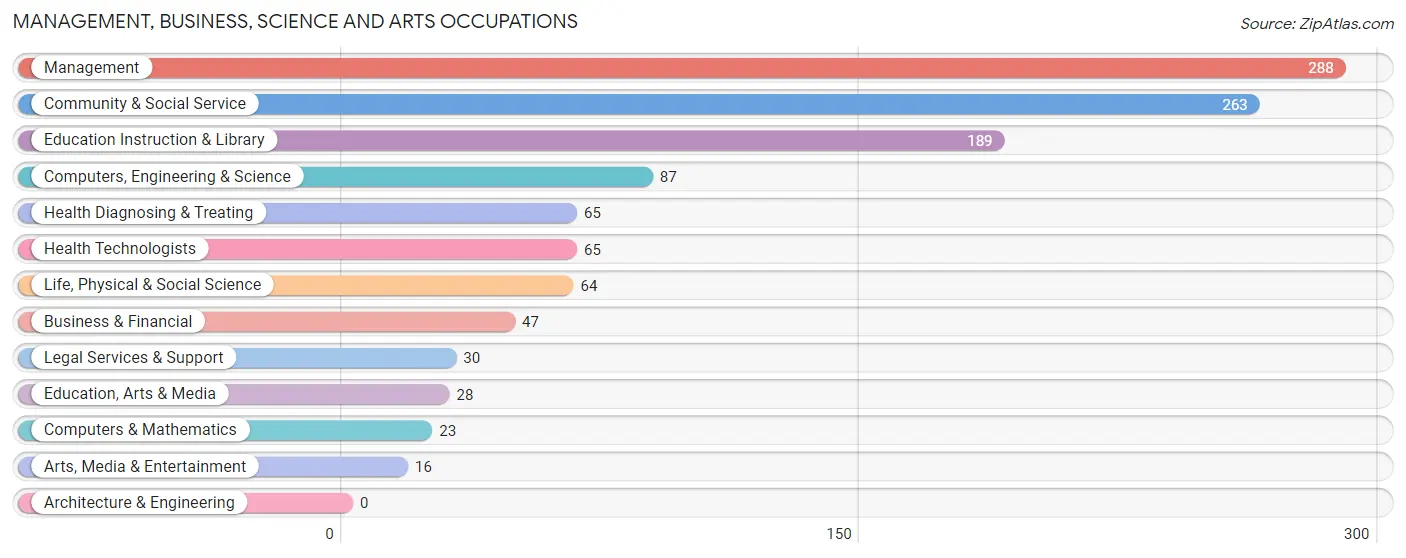
The most common Management, Business, Science and Arts occupations in East Sandwich are Management (288 | 17.9%), Community & Social Service (263 | 16.4%), Education Instruction & Library (189 | 11.7%), Computers, Engineering & Science (87 | 5.4%), and Health Diagnosing & Treating (65 | 4.0%).
Management, Business, Science and Arts Occupations by Sex
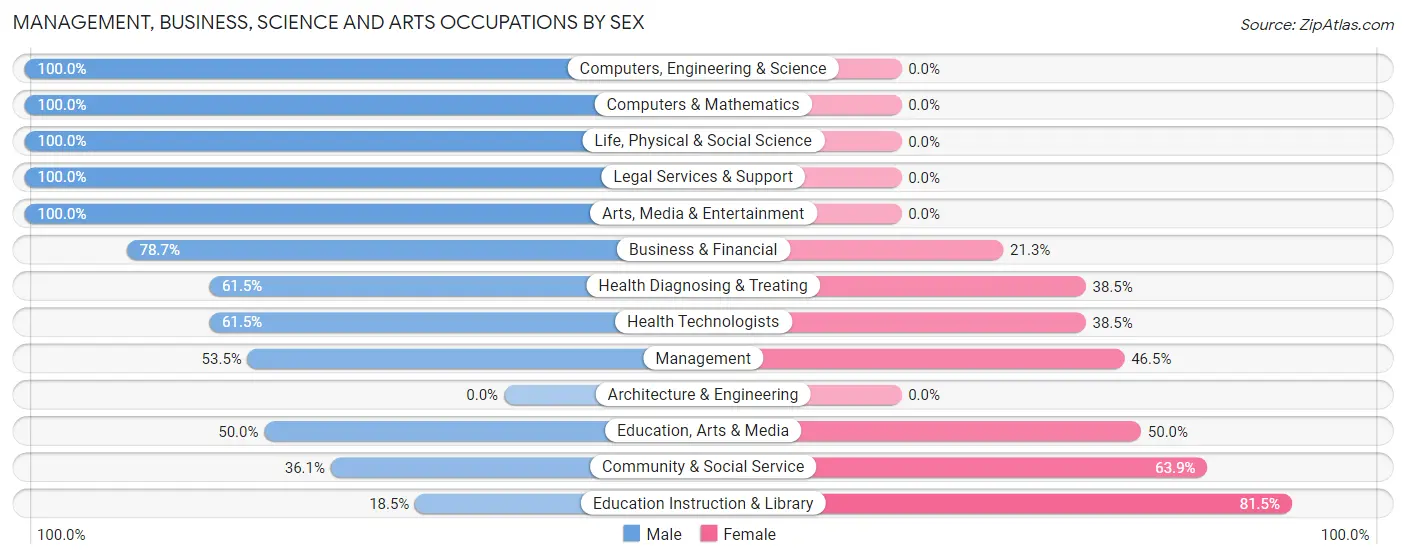
Within the Management, Business, Science and Arts occupations in East Sandwich, the most male-oriented occupations are Computers, Engineering & Science (100.0%), Computers & Mathematics (100.0%), and Life, Physical & Social Science (100.0%), while the most female-oriented occupations are Education Instruction & Library (81.5%), Community & Social Service (63.9%), and Education, Arts & Media (50.0%).
| Occupation | Male | Female |
| Management | 154 (53.5%) | 134 (46.5%) |
| Business & Financial | 37 (78.7%) | 10 (21.3%) |
| Computers, Engineering & Science | 87 (100.0%) | 0 (0.0%) |
| Computers & Mathematics | 23 (100.0%) | 0 (0.0%) |
| Architecture & Engineering | 0 (0.0%) | 0 (0.0%) |
| Life, Physical & Social Science | 64 (100.0%) | 0 (0.0%) |
| Community & Social Service | 95 (36.1%) | 168 (63.9%) |
| Education, Arts & Media | 14 (50.0%) | 14 (50.0%) |
| Legal Services & Support | 30 (100.0%) | 0 (0.0%) |
| Education Instruction & Library | 35 (18.5%) | 154 (81.5%) |
| Arts, Media & Entertainment | 16 (100.0%) | 0 (0.0%) |
| Health Diagnosing & Treating | 40 (61.5%) | 25 (38.5%) |
| Health Technologists | 40 (61.5%) | 25 (38.5%) |
| Total (Category) | 413 (55.1%) | 337 (44.9%) |
| Total (Overall) | 851 (52.9%) | 757 (47.1%) |
Services Occupations
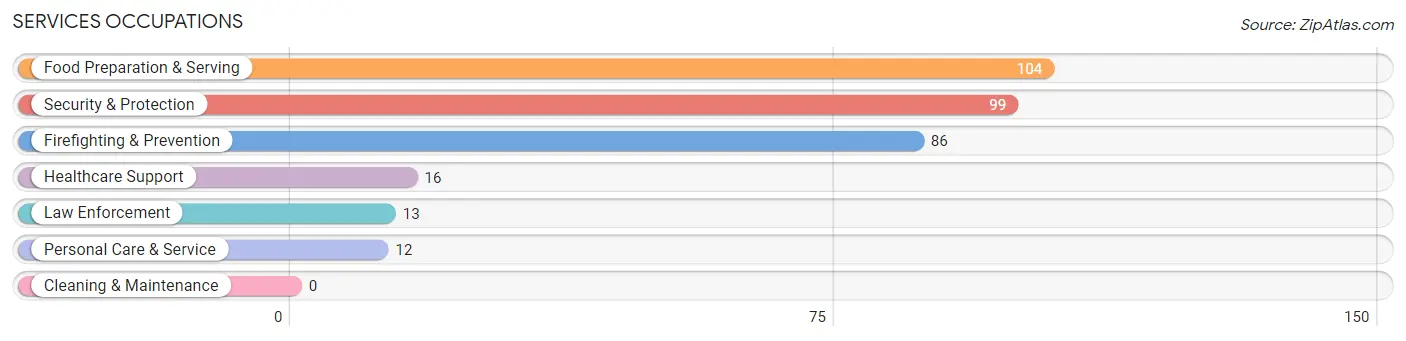
The most common Services occupations in East Sandwich are Food Preparation & Serving (104 | 6.5%), Security & Protection (99 | 6.2%), Firefighting & Prevention (86 | 5.3%), Healthcare Support (16 | 1.0%), and Law Enforcement (13 | 0.8%).
Services Occupations by Sex
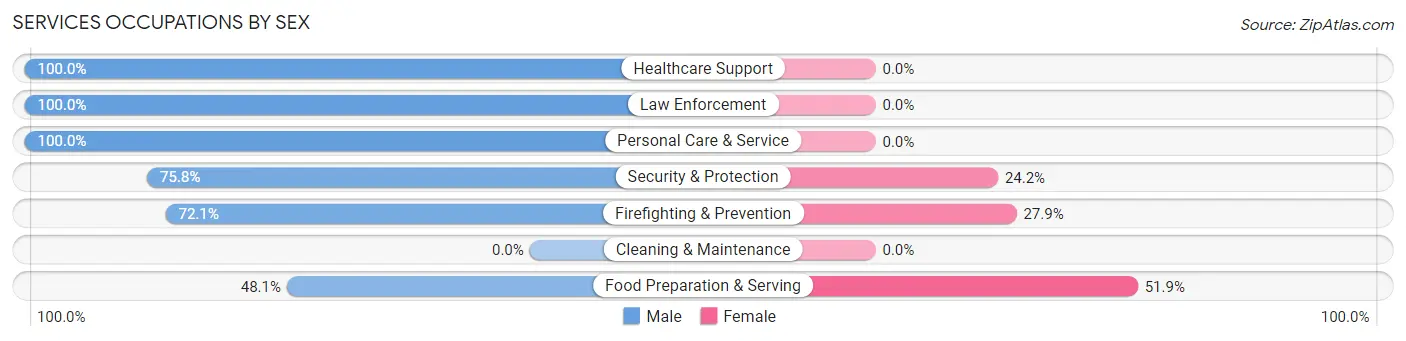
Within the Services occupations in East Sandwich, the most male-oriented occupations are Healthcare Support (100.0%), Law Enforcement (100.0%), and Personal Care & Service (100.0%), while the most female-oriented occupations are Food Preparation & Serving (51.9%), Firefighting & Prevention (27.9%), and Security & Protection (24.2%).
| Occupation | Male | Female |
| Healthcare Support | 16 (100.0%) | 0 (0.0%) |
| Security & Protection | 75 (75.8%) | 24 (24.2%) |
| Firefighting & Prevention | 62 (72.1%) | 24 (27.9%) |
| Law Enforcement | 13 (100.0%) | 0 (0.0%) |
| Food Preparation & Serving | 50 (48.1%) | 54 (51.9%) |
| Cleaning & Maintenance | 0 (0.0%) | 0 (0.0%) |
| Personal Care & Service | 12 (100.0%) | 0 (0.0%) |
| Total (Category) | 153 (66.2%) | 78 (33.8%) |
| Total (Overall) | 851 (52.9%) | 757 (47.1%) |
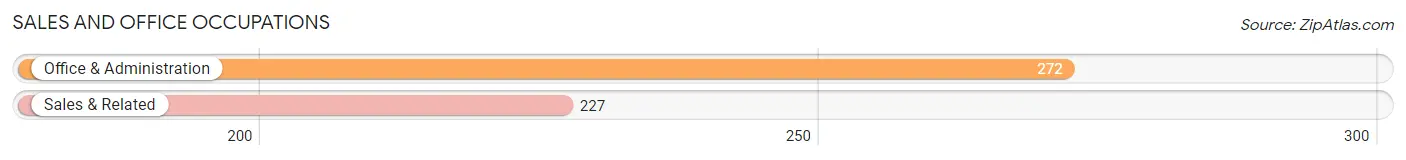
Sales and Office Occupations
The most common Sales and Office occupations in East Sandwich are Office & Administration (272 | 16.9%), and Sales & Related (227 | 14.1%).
Sales and Office Occupations by Sex
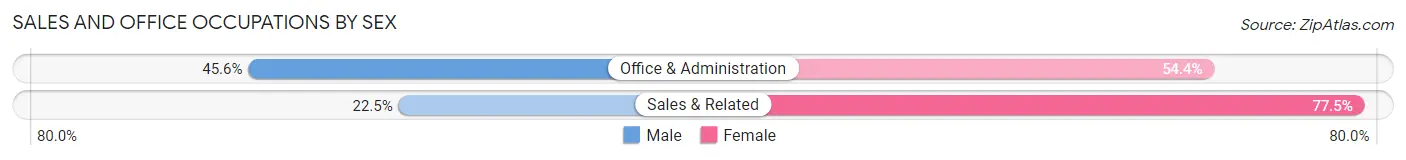
| Occupation | Male | Female |
| Sales & Related | 51 (22.5%) | 176 (77.5%) |
| Office & Administration | 124 (45.6%) | 148 (54.4%) |
| Total (Category) | 175 (35.1%) | 324 (64.9%) |
| Total (Overall) | 851 (52.9%) | 757 (47.1%) |
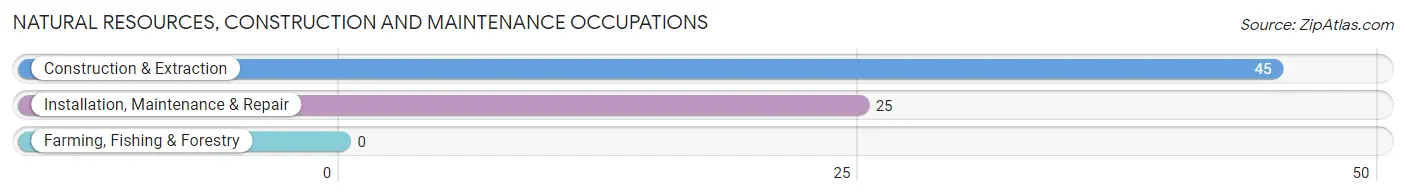
Natural Resources, Construction and Maintenance Occupations
The most common Natural Resources, Construction and Maintenance occupations in East Sandwich are Construction & Extraction (45 | 2.8%), and Installation, Maintenance & Repair (25 | 1.5%).
Natural Resources, Construction and Maintenance Occupations by Sex
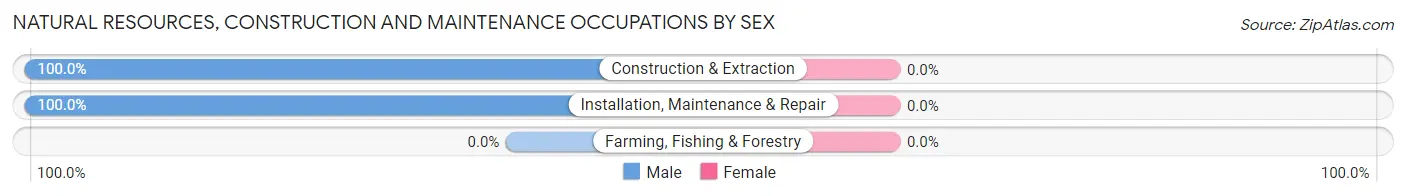
| Occupation | Male | Female |
| Farming, Fishing & Forestry | 0 (0.0%) | 0 (0.0%) |
| Construction & Extraction | 45 (100.0%) | 0 (0.0%) |
| Installation, Maintenance & Repair | 25 (100.0%) | 0 (0.0%) |
| Total (Category) | 70 (100.0%) | 0 (0.0%) |
| Total (Overall) | 851 (52.9%) | 757 (47.1%) |
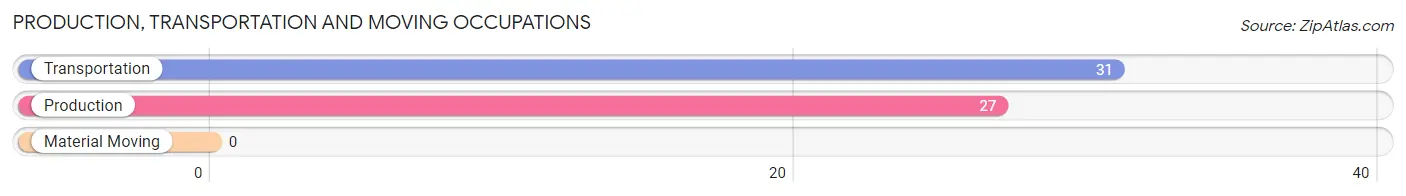
Production, Transportation and Moving Occupations
The most common Production, Transportation and Moving occupations in East Sandwich are Transportation (31 | 1.9%), and Production (27 | 1.7%).
Production, Transportation and Moving Occupations by Sex
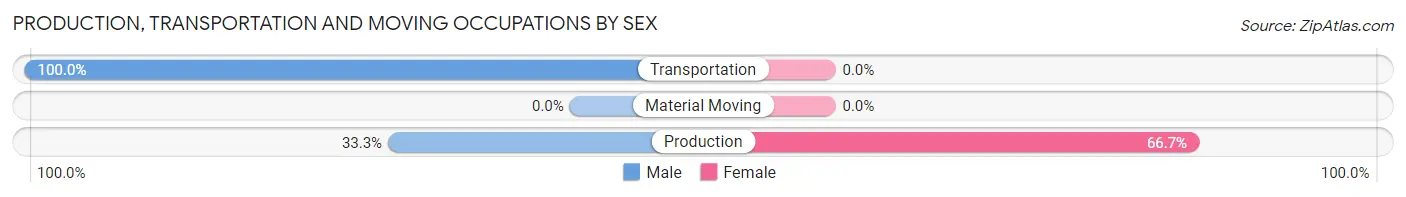
| Occupation | Male | Female |
| Production | 9 (33.3%) | 18 (66.7%) |
| Transportation | 31 (100.0%) | 0 (0.0%) |
| Material Moving | 0 (0.0%) | 0 (0.0%) |
| Total (Category) | 40 (69.0%) | 18 (31.0%) |
| Total (Overall) | 851 (52.9%) | 757 (47.1%) |
Employment Industries by Sex in East Sandwich
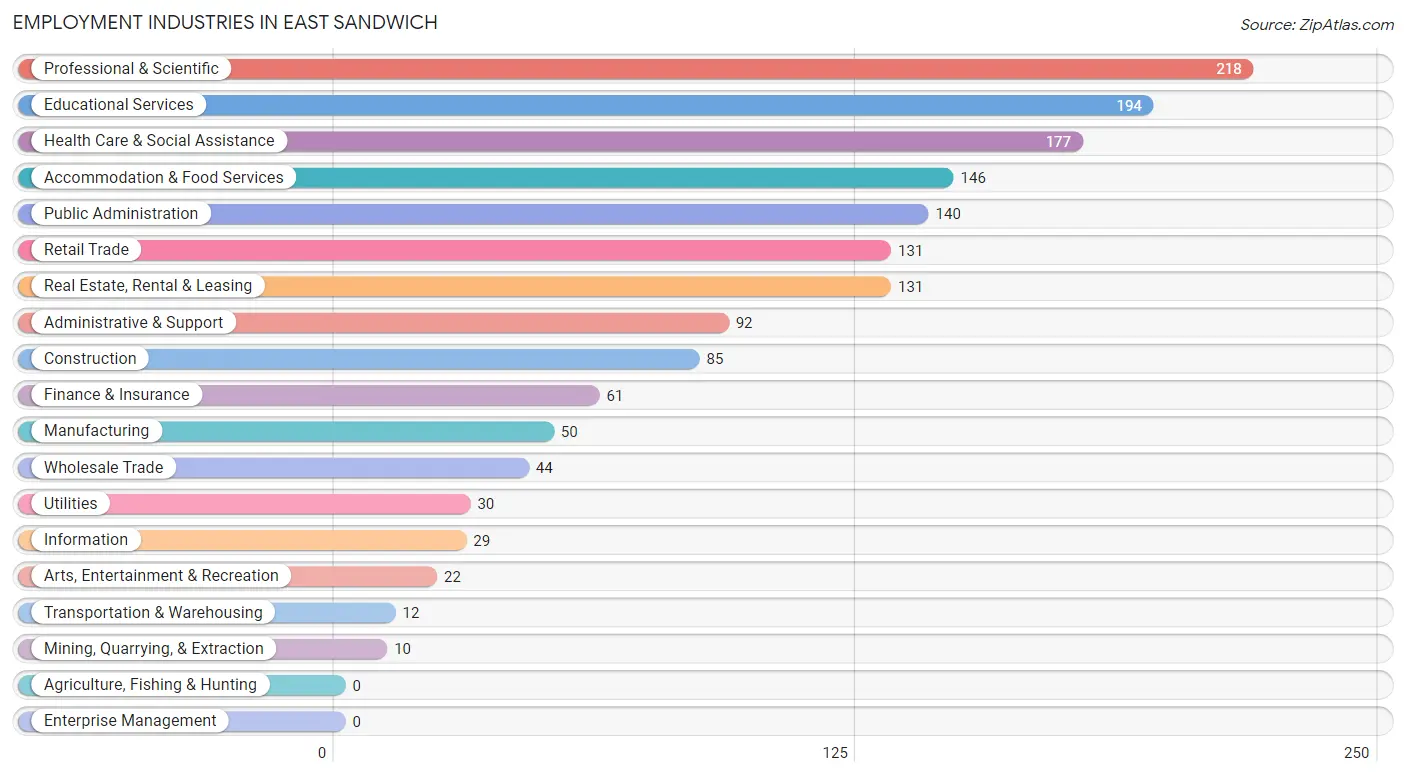
Employment Industries in East Sandwich
The major employment industries in East Sandwich include Professional & Scientific (218 | 13.6%), Educational Services (194 | 12.1%), Health Care & Social Assistance (177 | 11.0%), Accommodation & Food Services (146 | 9.1%), and Public Administration (140 | 8.7%).
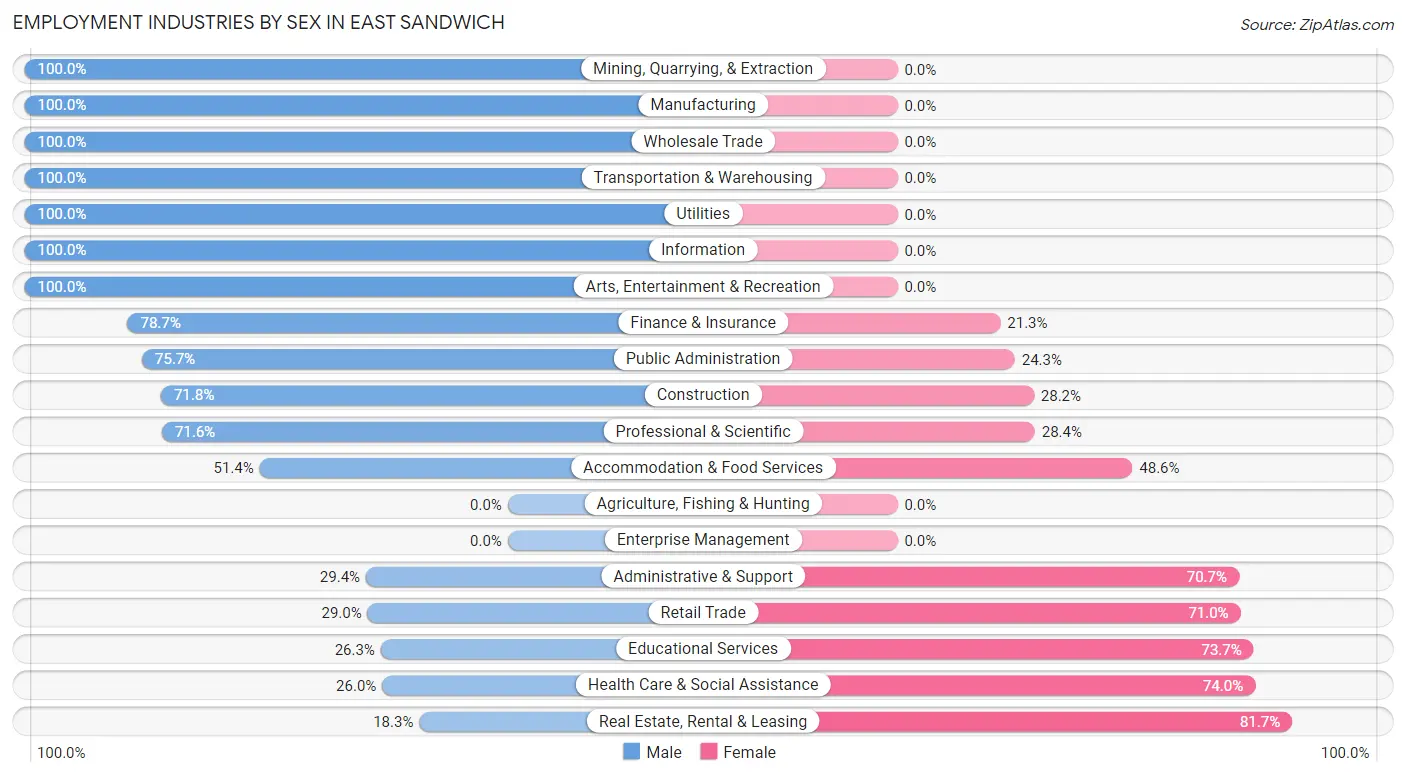
Employment Industries by Sex in East Sandwich
The East Sandwich industries that see more men than women are Mining, Quarrying, & Extraction (100.0%), Manufacturing (100.0%), and Wholesale Trade (100.0%), whereas the industries that tend to have a higher number of women are Real Estate, Rental & Leasing (81.7%), Health Care & Social Assistance (74.0%), and Educational Services (73.7%).
| Industry | Male | Female |
| Agriculture, Fishing & Hunting | 0 (0.0%) | 0 (0.0%) |
| Mining, Quarrying, & Extraction | 10 (100.0%) | 0 (0.0%) |
| Construction | 61 (71.8%) | 24 (28.2%) |
| Manufacturing | 50 (100.0%) | 0 (0.0%) |
| Wholesale Trade | 44 (100.0%) | 0 (0.0%) |
| Retail Trade | 38 (29.0%) | 93 (71.0%) |
| Transportation & Warehousing | 12 (100.0%) | 0 (0.0%) |
| Utilities | 30 (100.0%) | 0 (0.0%) |
| Information | 29 (100.0%) | 0 (0.0%) |
| Finance & Insurance | 48 (78.7%) | 13 (21.3%) |
| Real Estate, Rental & Leasing | 24 (18.3%) | 107 (81.7%) |
| Professional & Scientific | 156 (71.6%) | 62 (28.4%) |
| Enterprise Management | 0 (0.0%) | 0 (0.0%) |
| Administrative & Support | 27 (29.3%) | 65 (70.7%) |
| Educational Services | 51 (26.3%) | 143 (73.7%) |
| Health Care & Social Assistance | 46 (26.0%) | 131 (74.0%) |
| Arts, Entertainment & Recreation | 22 (100.0%) | 0 (0.0%) |
| Accommodation & Food Services | 75 (51.4%) | 71 (48.6%) |
| Public Administration | 106 (75.7%) | 34 (24.3%) |
| Total | 851 (52.9%) | 757 (47.1%) |
Education in East Sandwich
School Enrollment in East Sandwich
The most common levels of schooling among the 754 students in East Sandwich are high school (272 | 36.1%), college / undergraduate (173 | 22.9%), and elementary school (116 | 15.4%).
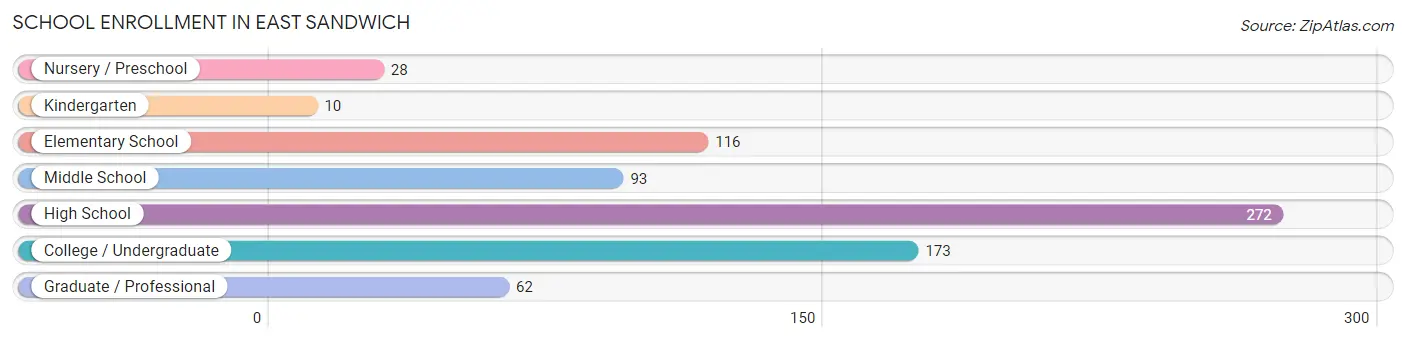
| School Level | # Students | % Students |
| Nursery / Preschool | 28 | 3.7% |
| Kindergarten | 10 | 1.3% |
| Elementary School | 116 | 15.4% |
| Middle School | 93 | 12.3% |
| High School | 272 | 36.1% |
| College / Undergraduate | 173 | 22.9% |
| Graduate / Professional | 62 | 8.2% |
| Total | 754 | 100.0% |
School Enrollment by Age by Funding Source in East Sandwich
Out of a total of 754 students who are enrolled in schools in East Sandwich, 137 (18.2%) attend a private institution, while the remaining 617 (81.8%) are enrolled in public schools. The age group of 20 to 24 year olds has the highest likelihood of being enrolled in private schools, with 80 (72.7% in the age bracket) enrolled. Conversely, the age group of 3 to 4 year olds has the lowest likelihood of being enrolled in a private school, with 28 (100.0% in the age bracket) attending a public institution.
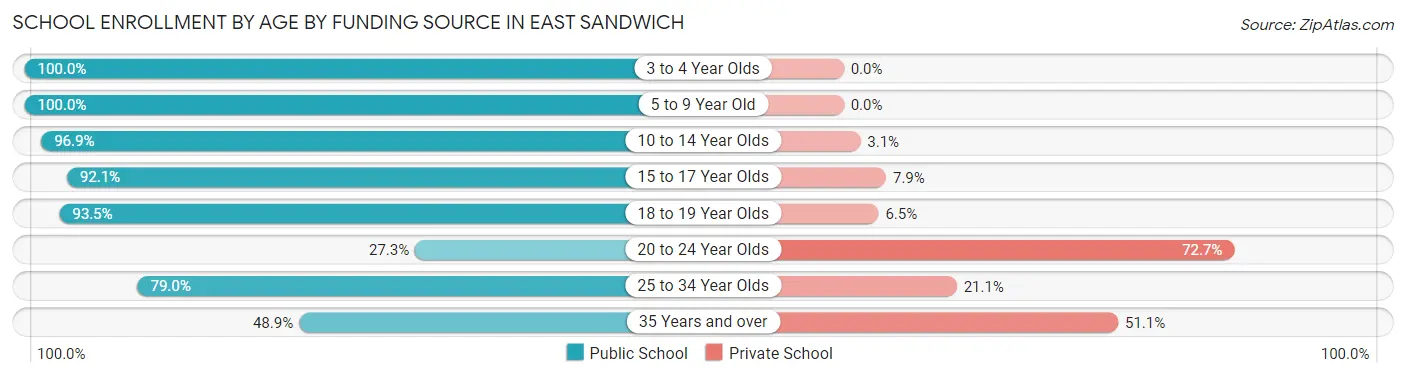
| Age Bracket | Public School | Private School |
| 3 to 4 Year Olds | 28 (100.0%) | 0 (0.0%) |
| 5 to 9 Year Old | 106 (100.0%) | 0 (0.0%) |
| 10 to 14 Year Olds | 125 (96.9%) | 4 (3.1%) |
| 15 to 17 Year Olds | 175 (92.1%) | 15 (7.9%) |
| 18 to 19 Year Olds | 101 (93.5%) | 7 (6.5%) |
| 20 to 24 Year Olds | 30 (27.3%) | 80 (72.7%) |
| 25 to 34 Year Olds | 30 (78.9%) | 8 (21.0%) |
| 35 Years and over | 22 (48.9%) | 23 (51.1%) |
| Total | 617 (81.8%) | 137 (18.2%) |
Educational Attainment by Field of Study in East Sandwich
Business (357 | 20.1%), education (252 | 14.2%), psychology (229 | 12.9%), social sciences (211 | 11.9%), and science & technology (170 | 9.6%) are the most common fields of study among 1,779 individuals in East Sandwich who have obtained a bachelor's degree or higher.
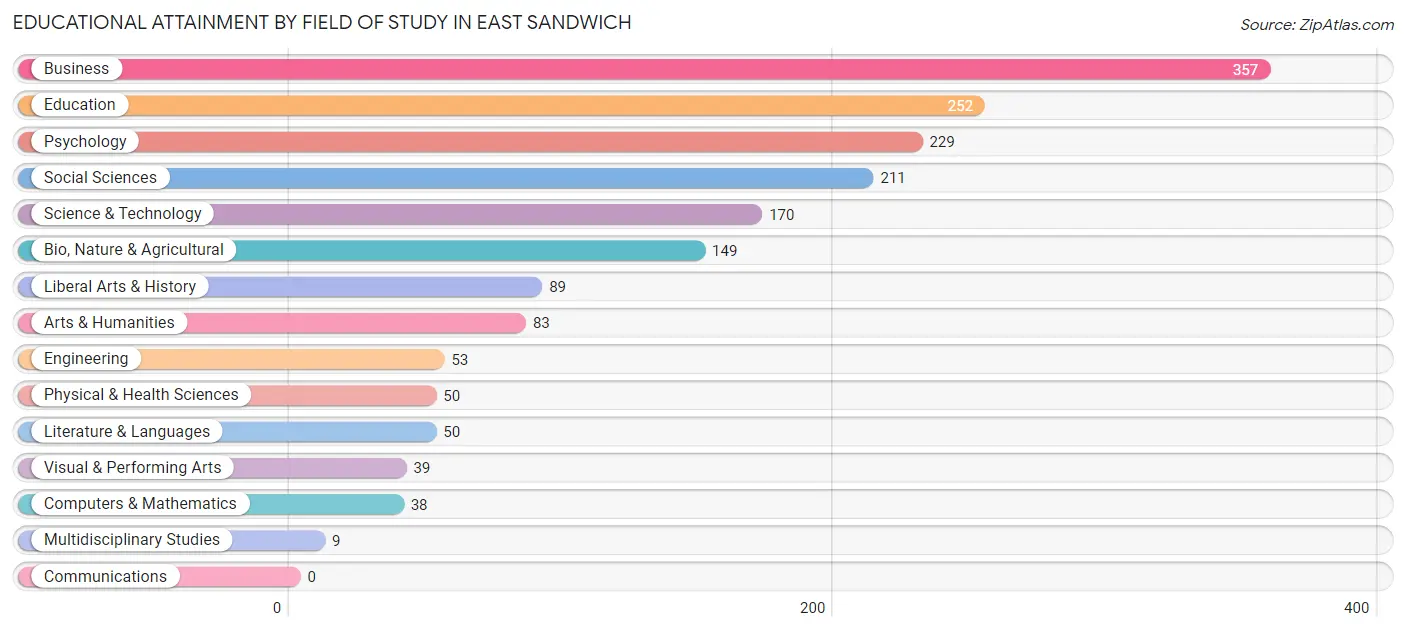
| Field of Study | # Graduates | % Graduates |
| Computers & Mathematics | 38 | 2.1% |
| Bio, Nature & Agricultural | 149 | 8.4% |
| Physical & Health Sciences | 50 | 2.8% |
| Psychology | 229 | 12.9% |
| Social Sciences | 211 | 11.9% |
| Engineering | 53 | 3.0% |
| Multidisciplinary Studies | 9 | 0.5% |
| Science & Technology | 170 | 9.6% |
| Business | 357 | 20.1% |
| Education | 252 | 14.2% |
| Literature & Languages | 50 | 2.8% |
| Liberal Arts & History | 89 | 5.0% |
| Visual & Performing Arts | 39 | 2.2% |
| Communications | 0 | 0.0% |
| Arts & Humanities | 83 | 4.7% |
| Total | 1,779 | 100.0% |
Transportation & Commute in East Sandwich
Vehicle Availability by Sex in East Sandwich
The most prevalent vehicle ownership categories in East Sandwich are males with 3 vehicles (298, accounting for 35.5%) and females with 3 vehicles (339, making up 38.5%).
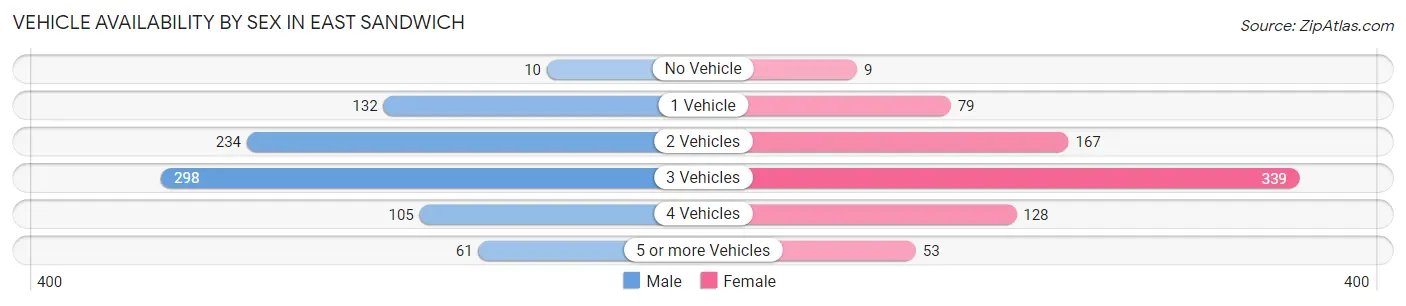
| Vehicles Available | Male | Female |
| No Vehicle | 10 (1.2%) | 9 (1.2%) |
| 1 Vehicle | 132 (15.7%) | 79 (10.2%) |
| 2 Vehicles | 234 (27.9%) | 167 (21.5%) |
| 3 Vehicles | 298 (35.5%) | 339 (43.7%) |
| 4 Vehicles | 105 (12.5%) | 128 (16.5%) |
| 5 or more Vehicles | 61 (7.3%) | 53 (6.8%) |
| Total | 840 (100.0%) | 775 (100.0%) |
Commute Time in East Sandwich
The most frequently occuring commute durations in East Sandwich are 20 to 24 minutes (301 commuters, 21.6%), 5 to 9 minutes (202 commuters, 14.5%), and 10 to 14 minutes (195 commuters, 14.0%).
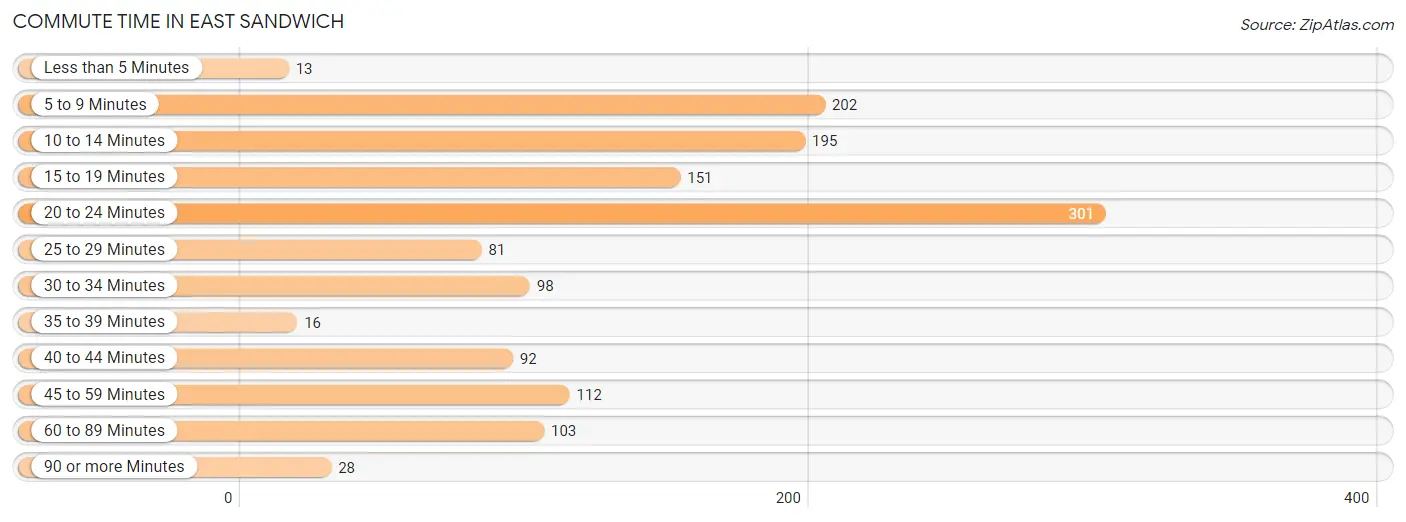
| Commute Time | # Commuters | % Commuters |
| Less than 5 Minutes | 13 | 0.9% |
| 5 to 9 Minutes | 202 | 14.5% |
| 10 to 14 Minutes | 195 | 14.0% |
| 15 to 19 Minutes | 151 | 10.8% |
| 20 to 24 Minutes | 301 | 21.6% |
| 25 to 29 Minutes | 81 | 5.8% |
| 30 to 34 Minutes | 98 | 7.0% |
| 35 to 39 Minutes | 16 | 1.1% |
| 40 to 44 Minutes | 92 | 6.6% |
| 45 to 59 Minutes | 112 | 8.1% |
| 60 to 89 Minutes | 103 | 7.4% |
| 90 or more Minutes | 28 | 2.0% |
Commute Time by Sex in East Sandwich
The most common commute times in East Sandwich are 20 to 24 minutes (163 commuters, 21.9%) for males and 20 to 24 minutes (138 commuters, 21.3%) for females.
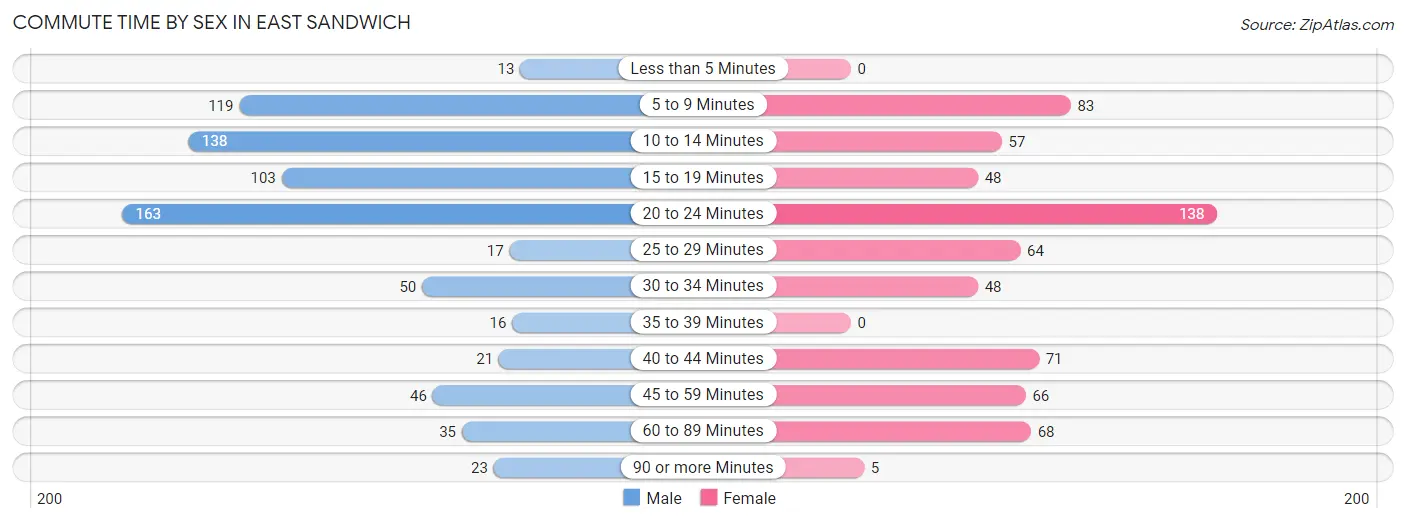
| Commute Time | Male | Female |
| Less than 5 Minutes | 13 (1.8%) | 0 (0.0%) |
| 5 to 9 Minutes | 119 (16.0%) | 83 (12.8%) |
| 10 to 14 Minutes | 138 (18.5%) | 57 (8.8%) |
| 15 to 19 Minutes | 103 (13.8%) | 48 (7.4%) |
| 20 to 24 Minutes | 163 (21.9%) | 138 (21.3%) |
| 25 to 29 Minutes | 17 (2.3%) | 64 (9.9%) |
| 30 to 34 Minutes | 50 (6.7%) | 48 (7.4%) |
| 35 to 39 Minutes | 16 (2.1%) | 0 (0.0%) |
| 40 to 44 Minutes | 21 (2.8%) | 71 (11.0%) |
| 45 to 59 Minutes | 46 (6.2%) | 66 (10.2%) |
| 60 to 89 Minutes | 35 (4.7%) | 68 (10.5%) |
| 90 or more Minutes | 23 (3.1%) | 5 (0.8%) |
Time of Departure to Work by Sex in East Sandwich
The most frequent times of departure to work in East Sandwich are 8:00 AM to 8:29 AM (144, 19.4%) for males and 9:00 AM to 9:59 AM (152, 23.5%) for females.
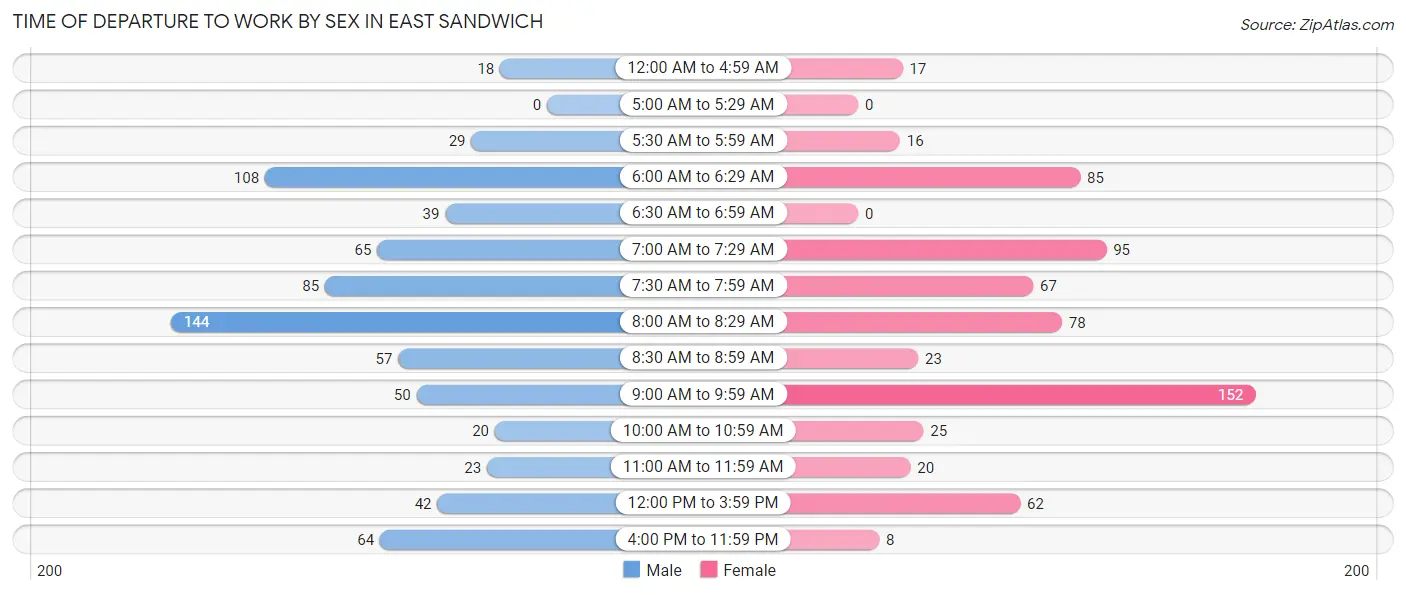
| Time of Departure | Male | Female |
| 12:00 AM to 4:59 AM | 18 (2.4%) | 17 (2.6%) |
| 5:00 AM to 5:29 AM | 0 (0.0%) | 0 (0.0%) |
| 5:30 AM to 5:59 AM | 29 (3.9%) | 16 (2.5%) |
| 6:00 AM to 6:29 AM | 108 (14.5%) | 85 (13.1%) |
| 6:30 AM to 6:59 AM | 39 (5.2%) | 0 (0.0%) |
| 7:00 AM to 7:29 AM | 65 (8.7%) | 95 (14.7%) |
| 7:30 AM to 7:59 AM | 85 (11.4%) | 67 (10.3%) |
| 8:00 AM to 8:29 AM | 144 (19.4%) | 78 (12.0%) |
| 8:30 AM to 8:59 AM | 57 (7.7%) | 23 (3.5%) |
| 9:00 AM to 9:59 AM | 50 (6.7%) | 152 (23.5%) |
| 10:00 AM to 10:59 AM | 20 (2.7%) | 25 (3.9%) |
| 11:00 AM to 11:59 AM | 23 (3.1%) | 20 (3.1%) |
| 12:00 PM to 3:59 PM | 42 (5.7%) | 62 (9.6%) |
| 4:00 PM to 11:59 PM | 64 (8.6%) | 8 (1.2%) |
| Total | 744 (100.0%) | 648 (100.0%) |
Housing Occupancy in East Sandwich
Occupancy by Ownership in East Sandwich
Of the total 1,528 dwellings in East Sandwich, owner-occupied units account for 1,395 (91.3%), while renter-occupied units make up 133 (8.7%).
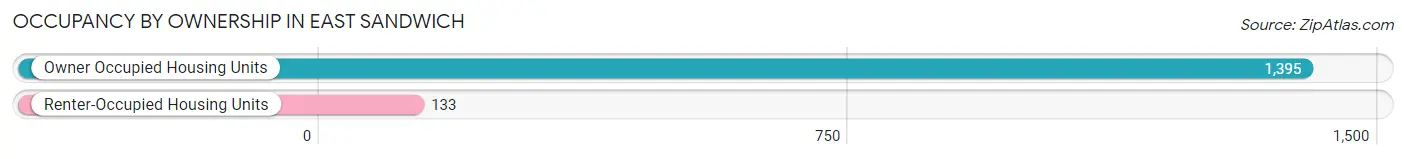
| Occupancy | # Housing Units | % Housing Units |
| Owner Occupied Housing Units | 1,395 | 91.3% |
| Renter-Occupied Housing Units | 133 | 8.7% |
| Total Occupied Housing Units | 1,528 | 100.0% |
Occupancy by Household Size in East Sandwich
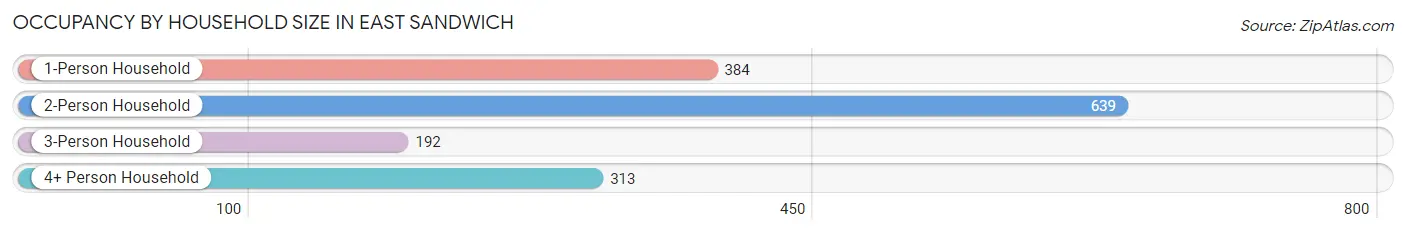
| Household Size | # Housing Units | % Housing Units |
| 1-Person Household | 384 | 25.1% |
| 2-Person Household | 639 | 41.8% |
| 3-Person Household | 192 | 12.6% |
| 4+ Person Household | 313 | 20.5% |
| Total Housing Units | 1,528 | 100.0% |
Occupancy by Ownership by Household Size in East Sandwich
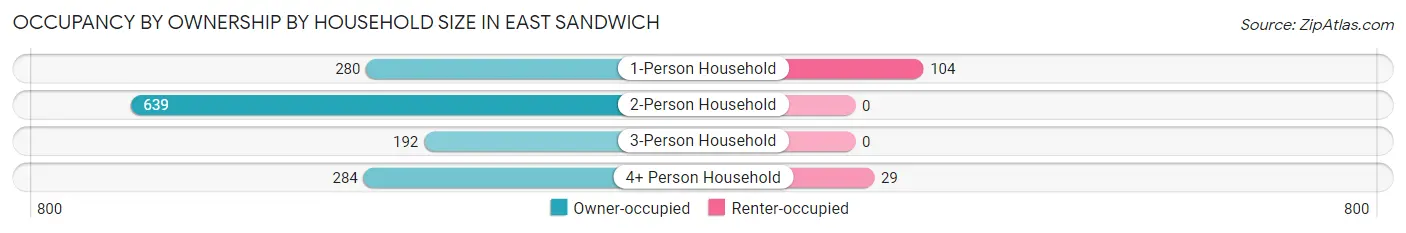
| Household Size | Owner-occupied | Renter-occupied |
| 1-Person Household | 280 (72.9%) | 104 (27.1%) |
| 2-Person Household | 639 (100.0%) | 0 (0.0%) |
| 3-Person Household | 192 (100.0%) | 0 (0.0%) |
| 4+ Person Household | 284 (90.7%) | 29 (9.3%) |
| Total Housing Units | 1,395 (91.3%) | 133 (8.7%) |
Occupancy by Educational Attainment in East Sandwich
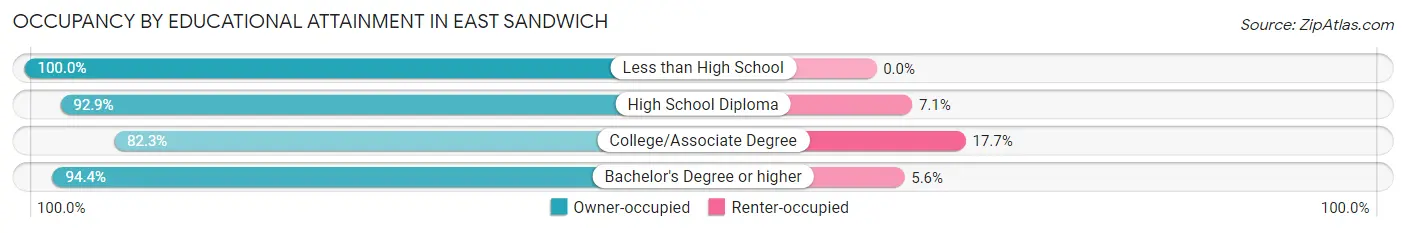
| Household Size | Owner-occupied | Renter-occupied |
| Less than High School | 16 (100.0%) | 0 (0.0%) |
| High School Diploma | 170 (92.9%) | 13 (7.1%) |
| College/Associate Degree | 311 (82.3%) | 67 (17.7%) |
| Bachelor's Degree or higher | 898 (94.4%) | 53 (5.6%) |
Occupancy by Age of Householder in East Sandwich
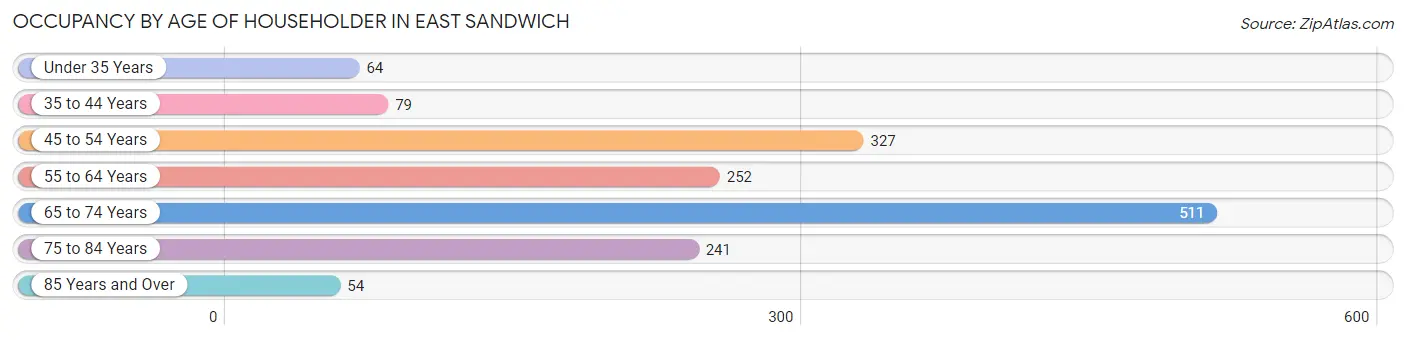
| Age Bracket | # Households | % Households |
| Under 35 Years | 64 | 4.2% |
| 35 to 44 Years | 79 | 5.2% |
| 45 to 54 Years | 327 | 21.4% |
| 55 to 64 Years | 252 | 16.5% |
| 65 to 74 Years | 511 | 33.4% |
| 75 to 84 Years | 241 | 15.8% |
| 85 Years and Over | 54 | 3.5% |
| Total | 1,528 | 100.0% |
Housing Finances in East Sandwich
Median Income by Occupancy in East Sandwich
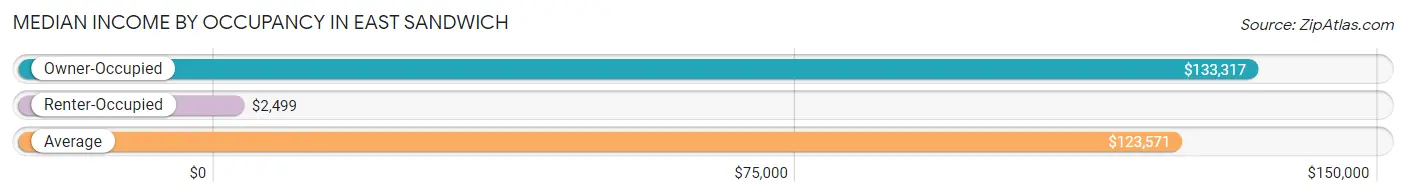
| Occupancy Type | # Households | Median Income |
| Owner-Occupied | 1,395 (91.3%) | $133,317 |
| Renter-Occupied | 133 (8.7%) | $2,499 |
| Average | 1,528 (100.0%) | $123,571 |
Occupancy by Householder Income Bracket in East Sandwich
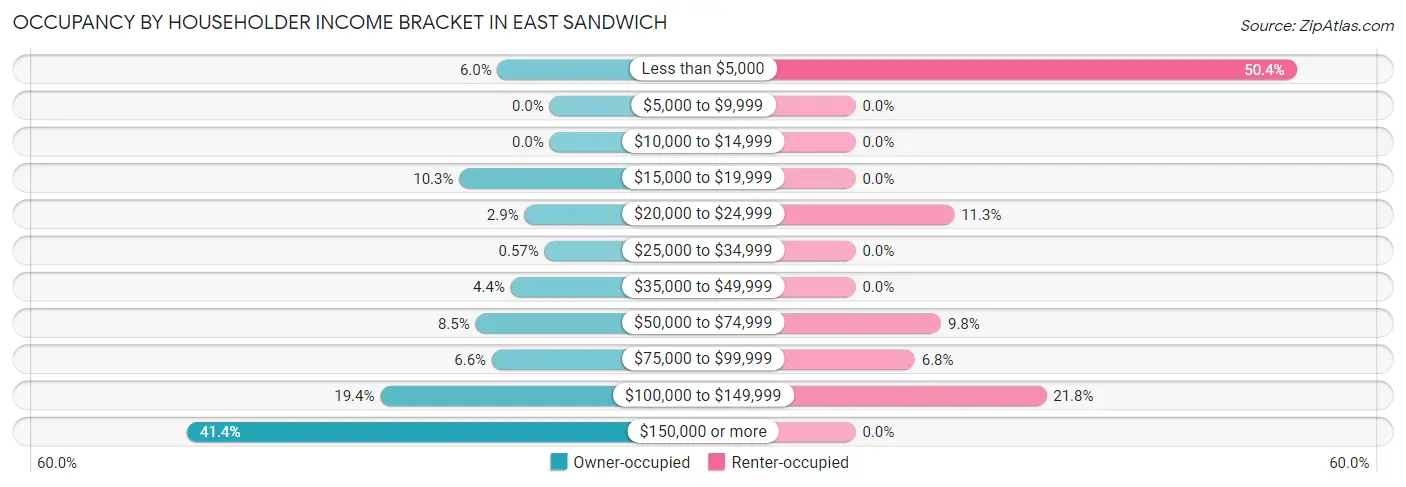
| Income Bracket | Owner-occupied | Renter-occupied |
| Less than $5,000 | 83 (5.9%) | 67 (50.4%) |
| $5,000 to $9,999 | 0 (0.0%) | 0 (0.0%) |
| $10,000 to $14,999 | 0 (0.0%) | 0 (0.0%) |
| $15,000 to $19,999 | 144 (10.3%) | 0 (0.0%) |
| $20,000 to $24,999 | 40 (2.9%) | 15 (11.3%) |
| $25,000 to $34,999 | 8 (0.6%) | 0 (0.0%) |
| $35,000 to $49,999 | 62 (4.4%) | 0 (0.0%) |
| $50,000 to $74,999 | 118 (8.5%) | 13 (9.8%) |
| $75,000 to $99,999 | 92 (6.6%) | 9 (6.8%) |
| $100,000 to $149,999 | 270 (19.4%) | 29 (21.8%) |
| $150,000 or more | 578 (41.4%) | 0 (0.0%) |
| Total | 1,395 (100.0%) | 133 (100.0%) |
Monthly Housing Cost Tiers in East Sandwich
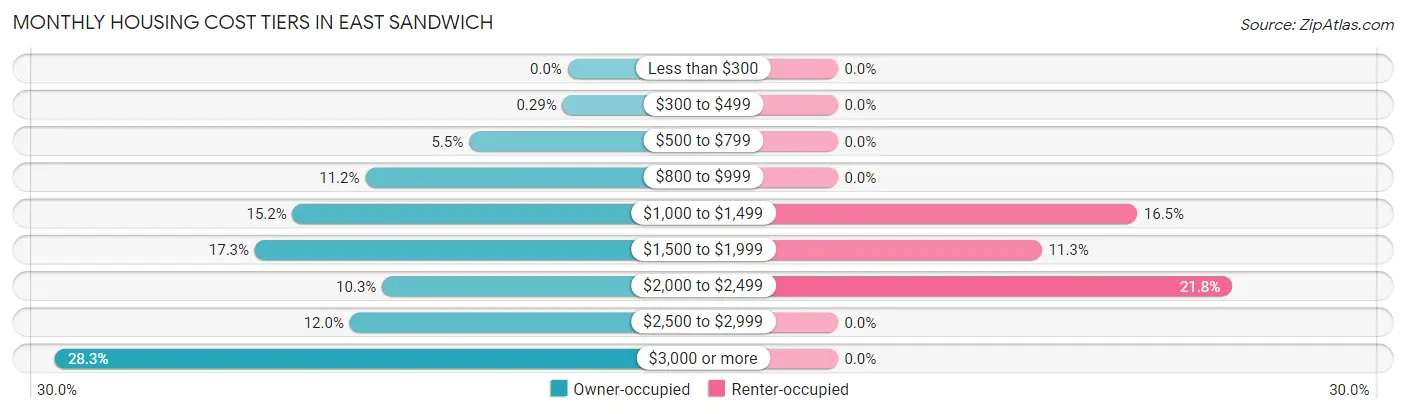
| Monthly Cost | Owner-occupied | Renter-occupied |
| Less than $300 | 0 (0.0%) | 0 (0.0%) |
| $300 to $499 | 4 (0.3%) | 0 (0.0%) |
| $500 to $799 | 76 (5.4%) | 0 (0.0%) |
| $800 to $999 | 156 (11.2%) | 0 (0.0%) |
| $1,000 to $1,499 | 212 (15.2%) | 22 (16.5%) |
| $1,500 to $1,999 | 241 (17.3%) | 15 (11.3%) |
| $2,000 to $2,499 | 143 (10.2%) | 29 (21.8%) |
| $2,500 to $2,999 | 168 (12.0%) | 0 (0.0%) |
| $3,000 or more | 395 (28.3%) | 0 (0.0%) |
| Total | 1,395 (100.0%) | 133 (100.0%) |
Physical Housing Characteristics in East Sandwich
Housing Structures in East Sandwich

| Structure Type | # Housing Units | % Housing Units |
| Single Unit, Detached | 1,453 | 95.1% |
| Single Unit, Attached | 33 | 2.2% |
| 2 Unit Apartments | 25 | 1.6% |
| 3 or 4 Unit Apartments | 8 | 0.5% |
| 5 to 9 Unit Apartments | 0 | 0.0% |
| 10 or more Apartments | 9 | 0.6% |
| Mobile Home / Other | 0 | 0.0% |
| Total | 1,528 | 100.0% |
Housing Structures by Occupancy in East Sandwich
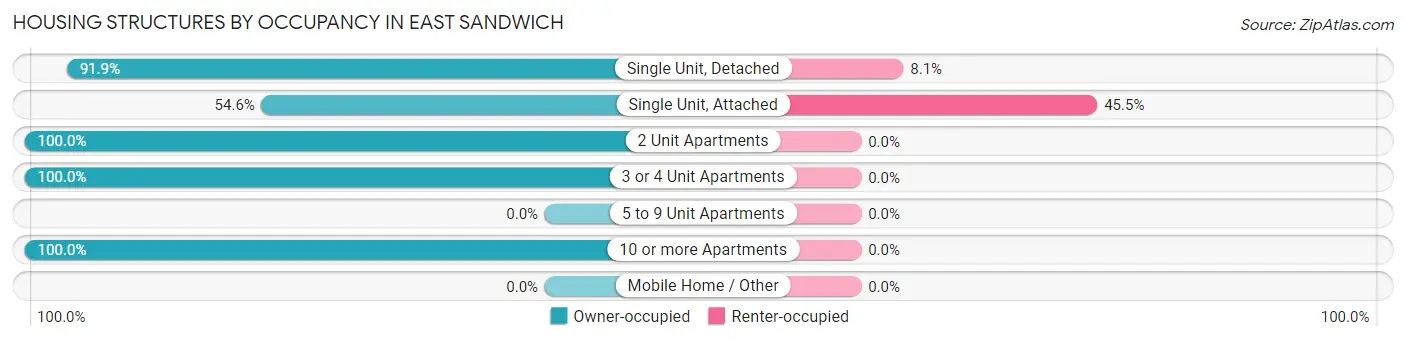
| Structure Type | Owner-occupied | Renter-occupied |
| Single Unit, Detached | 1,335 (91.9%) | 118 (8.1%) |
| Single Unit, Attached | 18 (54.5%) | 15 (45.5%) |
| 2 Unit Apartments | 25 (100.0%) | 0 (0.0%) |
| 3 or 4 Unit Apartments | 8 (100.0%) | 0 (0.0%) |
| 5 to 9 Unit Apartments | 0 (0.0%) | 0 (0.0%) |
| 10 or more Apartments | 9 (100.0%) | 0 (0.0%) |
| Mobile Home / Other | 0 (0.0%) | 0 (0.0%) |
| Total | 1,395 (91.3%) | 133 (8.7%) |
Housing Structures by Number of Rooms in East Sandwich
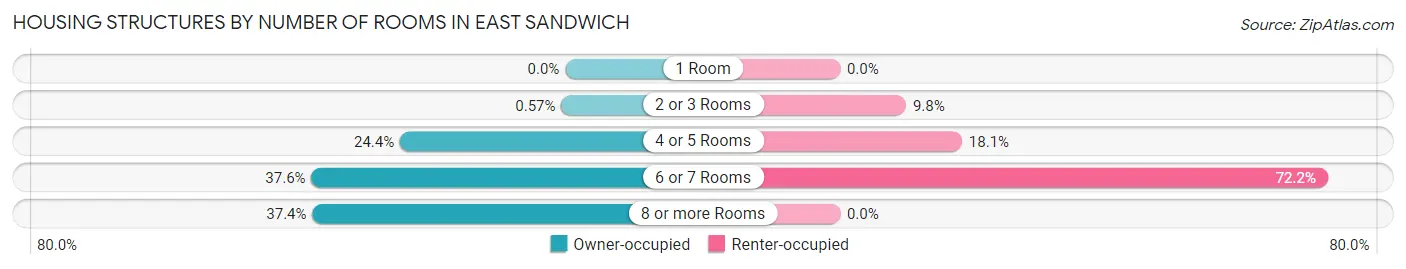
| Number of Rooms | Owner-occupied | Renter-occupied |
| 1 Room | 0 (0.0%) | 0 (0.0%) |
| 2 or 3 Rooms | 8 (0.6%) | 13 (9.8%) |
| 4 or 5 Rooms | 341 (24.4%) | 24 (18.0%) |
| 6 or 7 Rooms | 524 (37.6%) | 96 (72.2%) |
| 8 or more Rooms | 522 (37.4%) | 0 (0.0%) |
| Total | 1,395 (100.0%) | 133 (100.0%) |
Housing Structure by Heating Type in East Sandwich
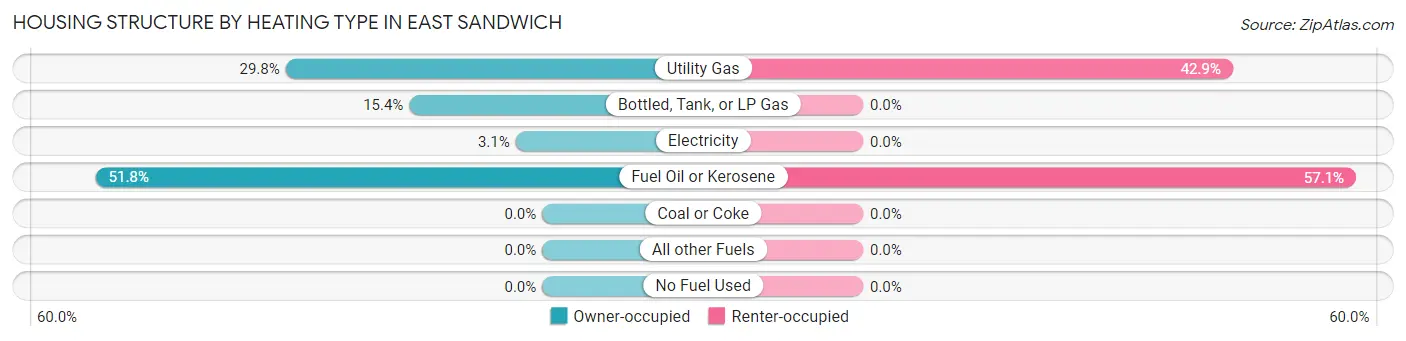
| Heating Type | Owner-occupied | Renter-occupied |
| Utility Gas | 415 (29.7%) | 57 (42.9%) |
| Bottled, Tank, or LP Gas | 215 (15.4%) | 0 (0.0%) |
| Electricity | 43 (3.1%) | 0 (0.0%) |
| Fuel Oil or Kerosene | 722 (51.8%) | 76 (57.1%) |
| Coal or Coke | 0 (0.0%) | 0 (0.0%) |
| All other Fuels | 0 (0.0%) | 0 (0.0%) |
| No Fuel Used | 0 (0.0%) | 0 (0.0%) |
| Total | 1,395 (100.0%) | 133 (100.0%) |
Household Vehicle Usage in East Sandwich
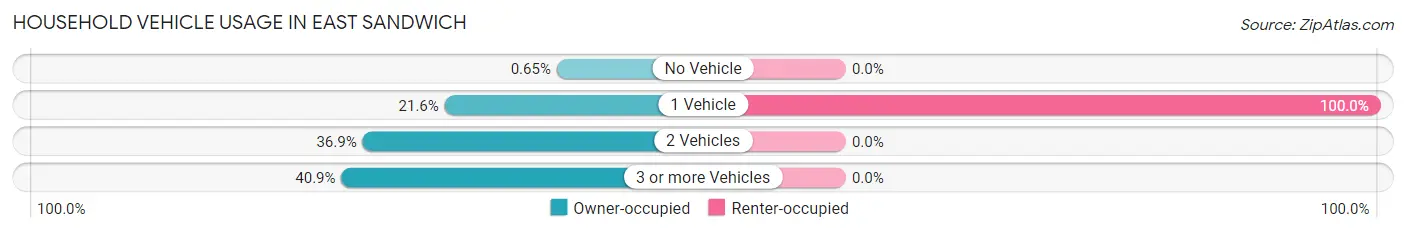
| Vehicles per Household | Owner-occupied | Renter-occupied |
| No Vehicle | 9 (0.6%) | 0 (0.0%) |
| 1 Vehicle | 301 (21.6%) | 133 (100.0%) |
| 2 Vehicles | 515 (36.9%) | 0 (0.0%) |
| 3 or more Vehicles | 570 (40.9%) | 0 (0.0%) |
| Total | 1,395 (100.0%) | 133 (100.0%) |
Real Estate & Mortgages in East Sandwich
Real Estate and Mortgage Overview in East Sandwich
| Characteristic | Without Mortgage | With Mortgage |
| Housing Units | 553 | 842 |
| Median Property Value | $562,000 | $597,400 |
| Median Household Income | $116,328 | $369 |
| Monthly Housing Costs | $1,227 | $386 |
| Real Estate Taxes | $7,224 | $0 |
Property Value by Mortgage Status in East Sandwich
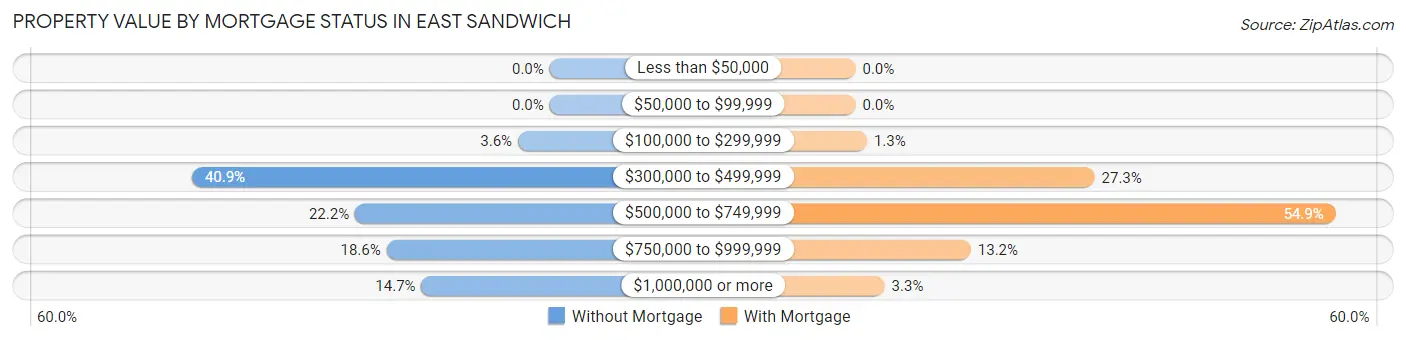
| Property Value | Without Mortgage | With Mortgage |
| Less than $50,000 | 0 (0.0%) | 0 (0.0%) |
| $50,000 to $99,999 | 0 (0.0%) | 0 (0.0%) |
| $100,000 to $299,999 | 20 (3.6%) | 11 (1.3%) |
| $300,000 to $499,999 | 226 (40.9%) | 230 (27.3%) |
| $500,000 to $749,999 | 123 (22.2%) | 462 (54.9%) |
| $750,000 to $999,999 | 103 (18.6%) | 111 (13.2%) |
| $1,000,000 or more | 81 (14.6%) | 28 (3.3%) |
| Total | 553 (100.0%) | 842 (100.0%) |
Household Income by Mortgage Status in East Sandwich
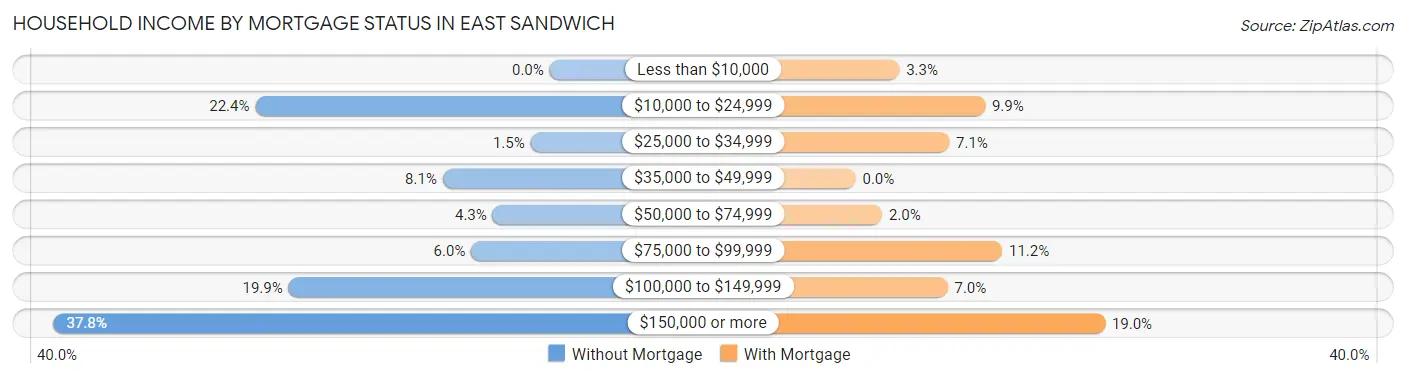
| Household Income | Without Mortgage | With Mortgage |
| Less than $10,000 | 0 (0.0%) | 28 (3.3%) |
| $10,000 to $24,999 | 124 (22.4%) | 83 (9.9%) |
| $25,000 to $34,999 | 8 (1.5%) | 60 (7.1%) |
| $35,000 to $49,999 | 45 (8.1%) | 0 (0.0%) |
| $50,000 to $74,999 | 24 (4.3%) | 17 (2.0%) |
| $75,000 to $99,999 | 33 (6.0%) | 94 (11.2%) |
| $100,000 to $149,999 | 110 (19.9%) | 59 (7.0%) |
| $150,000 or more | 209 (37.8%) | 160 (19.0%) |
| Total | 553 (100.0%) | 842 (100.0%) |
Property Value to Household Income Ratio in East Sandwich
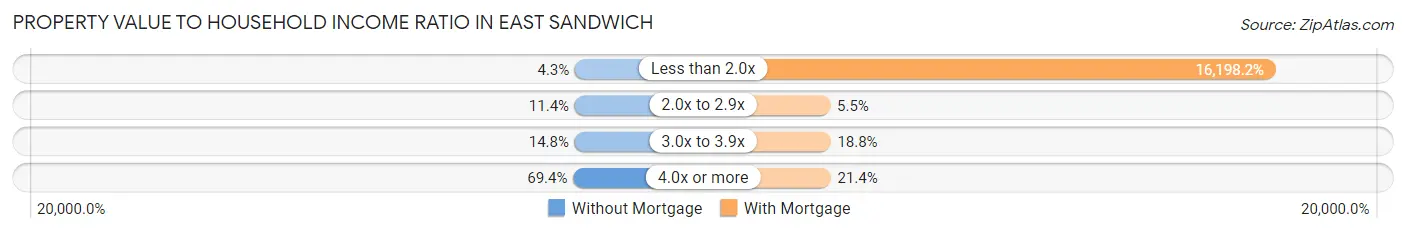
| Value-to-Income Ratio | Without Mortgage | With Mortgage |
| Less than 2.0x | 24 (4.3%) | 136,389 (16,198.2%) |
| 2.0x to 2.9x | 63 (11.4%) | 46 (5.5%) |
| 3.0x to 3.9x | 82 (14.8%) | 158 (18.8%) |
| 4.0x or more | 384 (69.4%) | 180 (21.4%) |
| Total | 553 (100.0%) | 842 (100.0%) |
Real Estate Taxes by Mortgage Status in East Sandwich
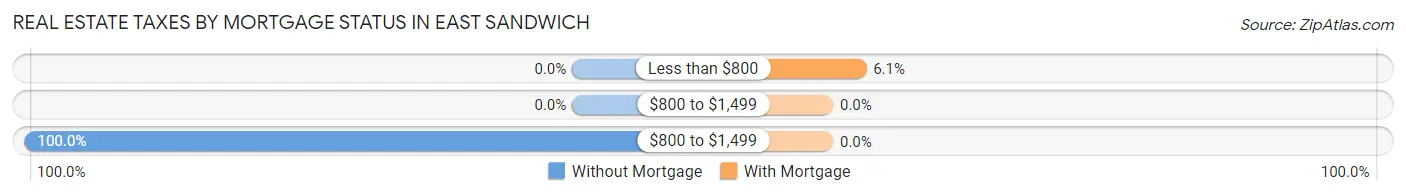
| Property Taxes | Without Mortgage | With Mortgage |
| Less than $800 | 0 (0.0%) | 51 (6.1%) |
| $800 to $1,499 | 0 (0.0%) | 0 (0.0%) |
| $800 to $1,499 | 553 (100.0%) | 0 (0.0%) |
| Total | 553 (100.0%) | 842 (100.0%) |
Health & Disability in East Sandwich
Health Insurance Coverage by Age in East Sandwich
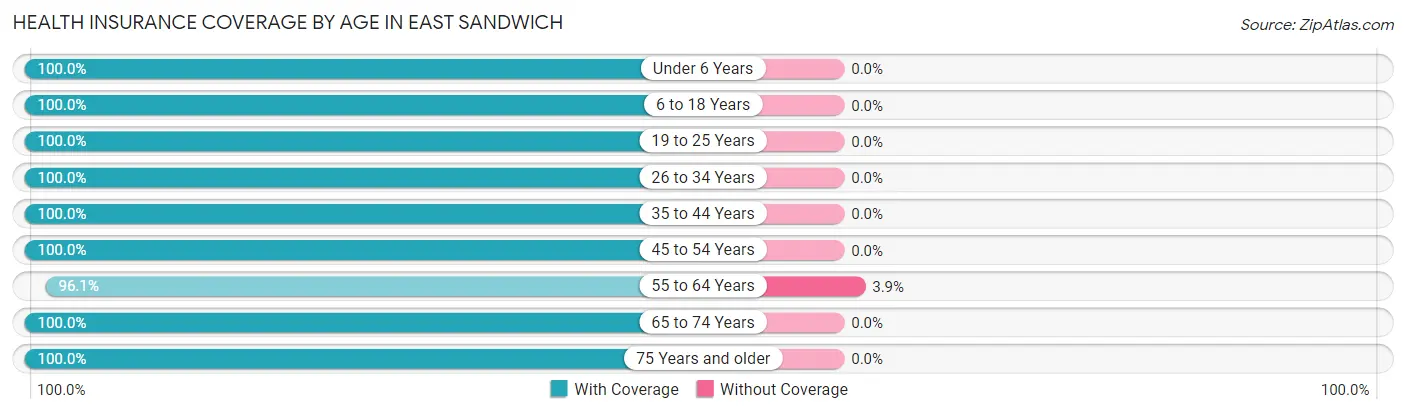
| Age Bracket | With Coverage | Without Coverage |
| Under 6 Years | 102 (100.0%) | 0 (0.0%) |
| 6 to 18 Years | 525 (100.0%) | 0 (0.0%) |
| 19 to 25 Years | 250 (100.0%) | 0 (0.0%) |
| 26 to 34 Years | 136 (100.0%) | 0 (0.0%) |
| 35 to 44 Years | 254 (100.0%) | 0 (0.0%) |
| 45 to 54 Years | 577 (100.0%) | 0 (0.0%) |
| 55 to 64 Years | 492 (96.1%) | 20 (3.9%) |
| 65 to 74 Years | 980 (100.0%) | 0 (0.0%) |
| 75 Years and older | 415 (100.0%) | 0 (0.0%) |
| Total | 3,731 (99.5%) | 20 (0.5%) |
Health Insurance Coverage by Citizenship Status in East Sandwich

| Citizenship Status | With Coverage | Without Coverage |
| Native Born | 102 (100.0%) | 0 (0.0%) |
| Foreign Born, Citizen | 525 (100.0%) | 0 (0.0%) |
| Foreign Born, not a Citizen | 250 (100.0%) | 0 (0.0%) |
Health Insurance Coverage by Household Income in East Sandwich
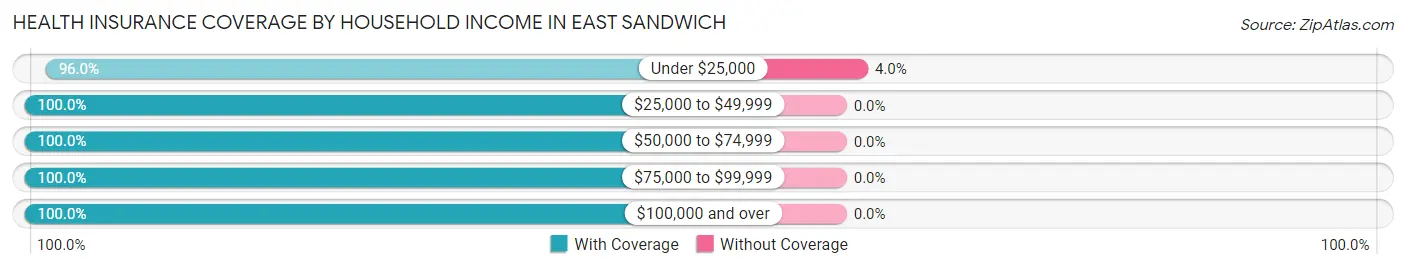
| Household Income | With Coverage | Without Coverage |
| Under $25,000 | 485 (96.0%) | 20 (4.0%) |
| $25,000 to $49,999 | 118 (100.0%) | 0 (0.0%) |
| $50,000 to $74,999 | 210 (100.0%) | 0 (0.0%) |
| $75,000 to $99,999 | 269 (100.0%) | 0 (0.0%) |
| $100,000 and over | 2,649 (100.0%) | 0 (0.0%) |
Public vs Private Health Insurance Coverage by Age in East Sandwich
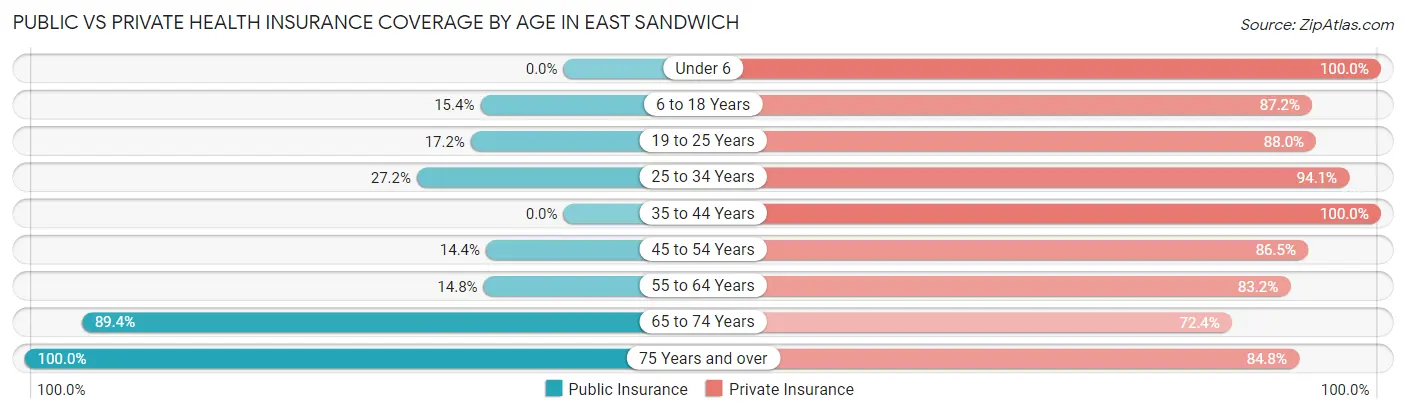
| Age Bracket | Public Insurance | Private Insurance |
| Under 6 | 0 (0.0%) | 102 (100.0%) |
| 6 to 18 Years | 81 (15.4%) | 458 (87.2%) |
| 19 to 25 Years | 43 (17.2%) | 220 (88.0%) |
| 25 to 34 Years | 37 (27.2%) | 128 (94.1%) |
| 35 to 44 Years | 0 (0.0%) | 254 (100.0%) |
| 45 to 54 Years | 83 (14.4%) | 499 (86.5%) |
| 55 to 64 Years | 76 (14.8%) | 426 (83.2%) |
| 65 to 74 Years | 876 (89.4%) | 709 (72.4%) |
| 75 Years and over | 415 (100.0%) | 352 (84.8%) |
| Total | 1,611 (42.9%) | 3,148 (83.9%) |
Disability Status by Sex by Age in East Sandwich
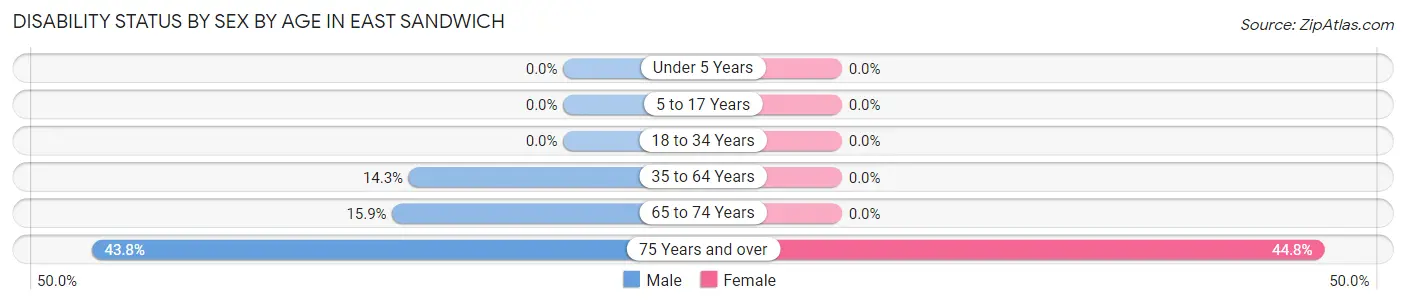
| Age Bracket | Male | Female |
| Under 5 Years | 0 (0.0%) | 0 (0.0%) |
| 5 to 17 Years | 0 (0.0%) | 0 (0.0%) |
| 18 to 34 Years | 0 (0.0%) | 0 (0.0%) |
| 35 to 64 Years | 98 (14.3%) | 0 (0.0%) |
| 65 to 74 Years | 72 (15.9%) | 0 (0.0%) |
| 75 Years and over | 81 (43.8%) | 103 (44.8%) |
Disability Class by Sex by Age in East Sandwich
Disability Class: Hearing Difficulty
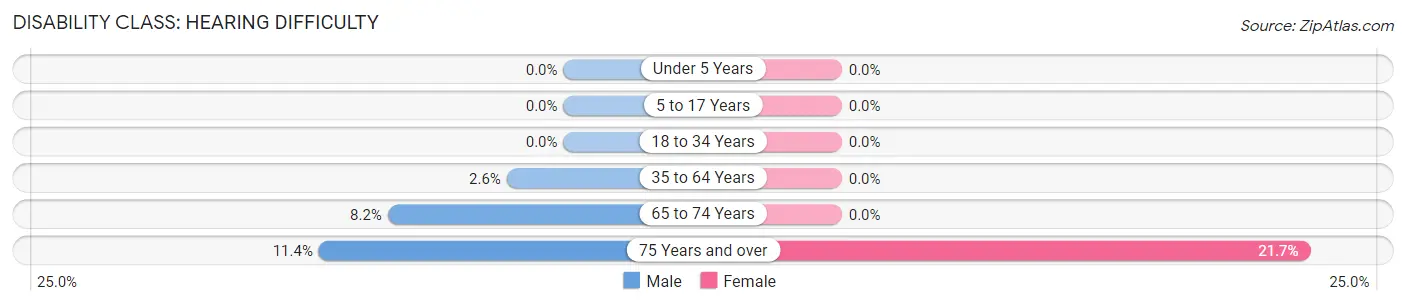
| Age Bracket | Male | Female |
| Under 5 Years | 0 (0.0%) | 0 (0.0%) |
| 5 to 17 Years | 0 (0.0%) | 0 (0.0%) |
| 18 to 34 Years | 0 (0.0%) | 0 (0.0%) |
| 35 to 64 Years | 18 (2.6%) | 0 (0.0%) |
| 65 to 74 Years | 37 (8.2%) | 0 (0.0%) |
| 75 Years and over | 21 (11.4%) | 50 (21.7%) |
Disability Class: Vision Difficulty
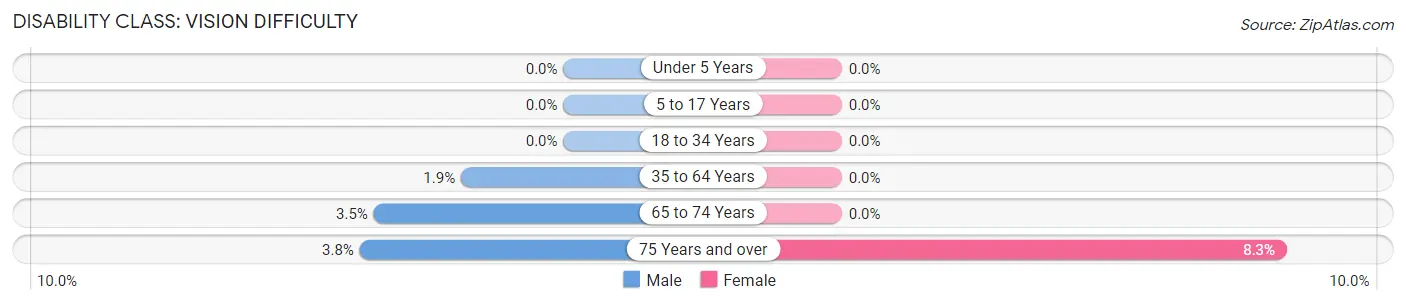
| Age Bracket | Male | Female |
| Under 5 Years | 0 (0.0%) | 0 (0.0%) |
| 5 to 17 Years | 0 (0.0%) | 0 (0.0%) |
| 18 to 34 Years | 0 (0.0%) | 0 (0.0%) |
| 35 to 64 Years | 13 (1.9%) | 0 (0.0%) |
| 65 to 74 Years | 16 (3.5%) | 0 (0.0%) |
| 75 Years and over | 7 (3.8%) | 19 (8.3%) |
Disability Class: Cognitive Difficulty
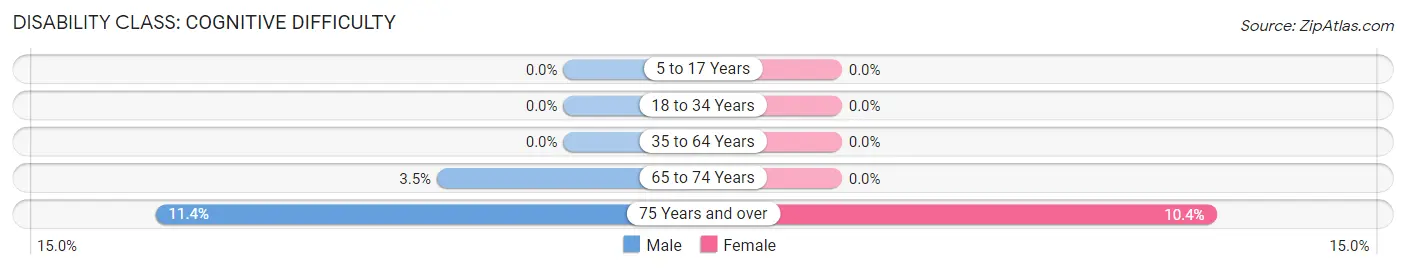
| Age Bracket | Male | Female |
| 5 to 17 Years | 0 (0.0%) | 0 (0.0%) |
| 18 to 34 Years | 0 (0.0%) | 0 (0.0%) |
| 35 to 64 Years | 0 (0.0%) | 0 (0.0%) |
| 65 to 74 Years | 16 (3.5%) | 0 (0.0%) |
| 75 Years and over | 21 (11.4%) | 24 (10.4%) |
Disability Class: Ambulatory Difficulty
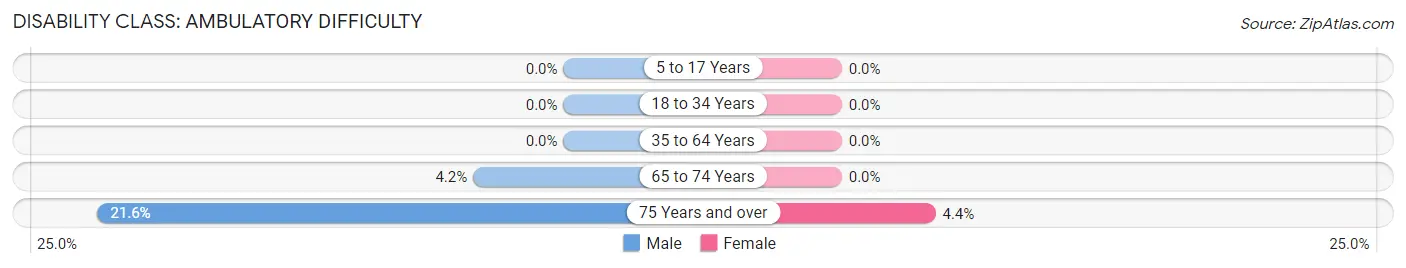
| Age Bracket | Male | Female |
| 5 to 17 Years | 0 (0.0%) | 0 (0.0%) |
| 18 to 34 Years | 0 (0.0%) | 0 (0.0%) |
| 35 to 64 Years | 0 (0.0%) | 0 (0.0%) |
| 65 to 74 Years | 19 (4.2%) | 0 (0.0%) |
| 75 Years and over | 40 (21.6%) | 10 (4.3%) |
Disability Class: Self-Care Difficulty
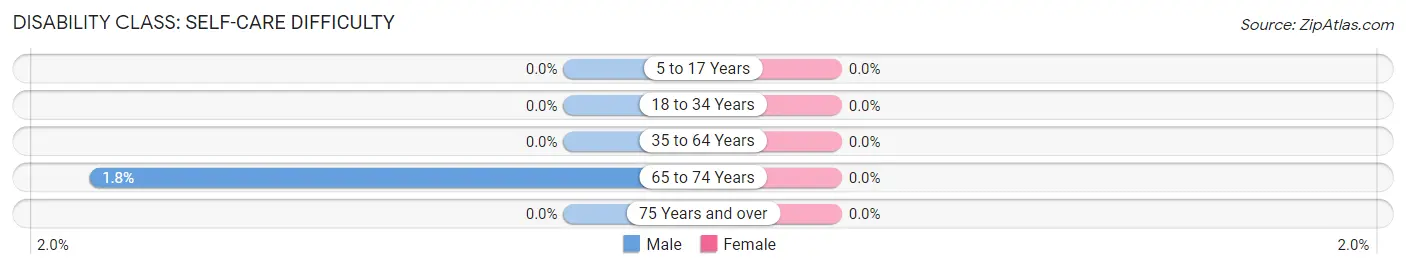
| Age Bracket | Male | Female |
| 5 to 17 Years | 0 (0.0%) | 0 (0.0%) |
| 18 to 34 Years | 0 (0.0%) | 0 (0.0%) |
| 35 to 64 Years | 0 (0.0%) | 0 (0.0%) |
| 65 to 74 Years | 8 (1.8%) | 0 (0.0%) |
| 75 Years and over | 0 (0.0%) | 0 (0.0%) |
Technology Access in East Sandwich
Computing Device Access in East Sandwich
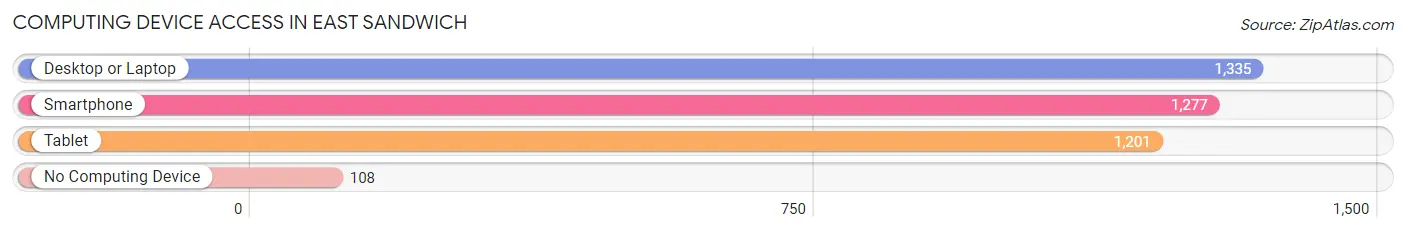
| Device Type | # Households | % Households |
| Desktop or Laptop | 1,335 | 87.4% |
| Smartphone | 1,277 | 83.6% |
| Tablet | 1,201 | 78.6% |
| No Computing Device | 108 | 7.1% |
| Total | 1,528 | 100.0% |
Internet Access in East Sandwich
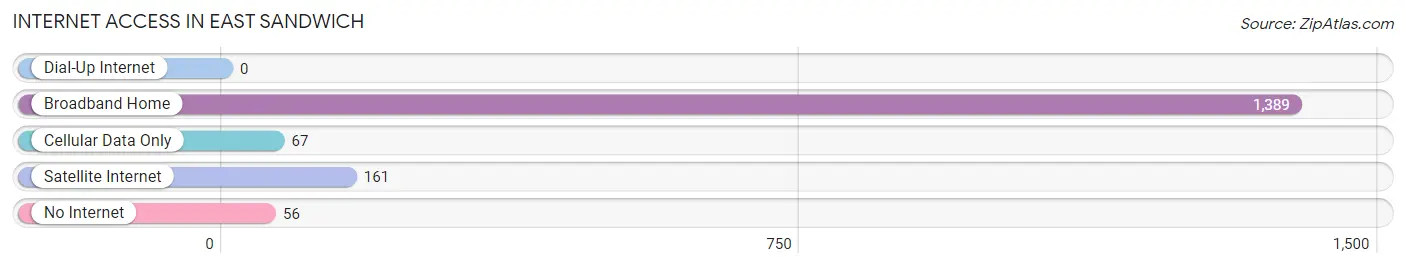
| Internet Type | # Households | % Households |
| Dial-Up Internet | 0 | 0.0% |
| Broadband Home | 1,389 | 90.9% |
| Cellular Data Only | 67 | 4.4% |
| Satellite Internet | 161 | 10.5% |
| No Internet | 56 | 3.7% |
| Total | 1,528 | 100.0% |
East Sandwich Summary
Sandwich is a town located in Barnstable County, Massachusetts, United States. It is the oldest town on Cape Cod and was first settled in 1637. The town is located on the eastern side of the Cape, and is bordered by Mashpee to the west, Barnstable to the north, and Bourne to the south. The town has a total area of 33.3 square miles, of which 28.2 square miles is land and 5.1 square miles is water. The town is home to several beaches, including East Sandwich Beach, Sandy Neck Beach, and Town Neck Beach.
History
Sandwich was first settled in 1637 by a group of English settlers led by Edmund Freeman. The town was named after the Earl of Sandwich, who was a patron of the settlers. The town was officially incorporated in 1639, making it the oldest town on Cape Cod.
In the early days of the town, the main industry was fishing and farming. The town was also known for its shipbuilding industry, which began in the late 1700s. The town was also home to several whaling ships, which sailed out of the harbor in search of whales.
In the late 1800s, the town began to develop as a summer resort destination. The town was home to several large hotels, including the East Sandwich Hotel, which was built in 1875. The town also had several amusement parks, including the East Sandwich Amusement Park, which opened in 1895.
Geography
Sandwich is located on the eastern side of Cape Cod, and is bordered by Mashpee to the west, Barnstable to the north, and Bourne to the south. The town has a total area of 33.3 square miles, of which 28.2 square miles is land and 5.1 square miles is water. The town is home to several beaches, including East Sandwich Beach, Sandy Neck Beach, and Town Neck Beach.
The town is located on the Cape Cod Canal, which connects Buzzards Bay to Cape Cod Bay. The canal is used for both recreational and commercial purposes.
Economy
The economy of Sandwich is largely based on tourism. The town is home to several hotels and resorts, as well as several restaurants and shops. The town is also home to several marinas, which provide services to boaters.
The town is also home to several manufacturing companies, including the East Sandwich Manufacturing Company, which produces plastic products. The town is also home to several technology companies, including the East Sandwich Technology Center, which provides services to businesses in the area.
Demographics
As of the 2010 census, the town had a population of 20,675. The median age of the population was 47.7 years, and the median household income was $68,945. The town is predominantly white, with 91.3% of the population identifying as white. The town is also home to a large number of retirees, with 25.3% of the population over the age of 65.
The town is home to several religious institutions, including the East Sandwich Congregational Church, which was founded in 1639. The town is also home to several schools, including the Sandwich Public Schools, which serves students in grades K-12.
Common Questions
What is Per Capita Income in East Sandwich?
Per Capita income in East Sandwich is $53,024.
What is the Median Family Income in East Sandwich?
Median Family Income in East Sandwich is $145,417.
What is the Median Household income in East Sandwich?
Median Household Income in East Sandwich is $123,571.
What is Income or Wage Gap in East Sandwich?
Income or Wage Gap in East Sandwich is 1.6%.
Women in East Sandwich earn 98.4 cents for every dollar earned by a man.
What is Family Income Deficit in East Sandwich?
Family Income Deficit in East Sandwich is $823.
Families that are below poverty line in East Sandwich earn $823 less on average than the poverty threshold level.
What is Inequality or Gini Index in East Sandwich?
Inequality or Gini Index in East Sandwich is 0.43.
What is the Total Population of East Sandwich?
Total Population of East Sandwich is 3,787.
What is the Total Male Population of East Sandwich?
Total Male Population of East Sandwich is 1,853.
What is the Total Female Population of East Sandwich?
Total Female Population of East Sandwich is 1,934.
What is the Ratio of Males per 100 Females in East Sandwich?
There are 95.81 Males per 100 Females in East Sandwich.
What is the Ratio of Females per 100 Males in East Sandwich?
There are 104.37 Females per 100 Males in East Sandwich.
What is the Median Population Age in East Sandwich?
Median Population Age in East Sandwich is 55.6 Years.
What is the Average Family Size in East Sandwich
Average Family Size in East Sandwich is 3.0 People.
What is the Average Household Size in East Sandwich
Average Household Size in East Sandwich is 2.5 People.
How Large is the Labor Force in East Sandwich?
There are 1,682 People in the Labor Forcein in East Sandwich.
What is the Percentage of People in the Labor Force in East Sandwich?
50.6% of People are in the Labor Force in East Sandwich.
What is the Unemployment Rate in East Sandwich?
Unemployment Rate in East Sandwich is 3.4%.